Article

Potential Factors That Trigger the Suspension of Calcium Carbonate Sediments and Whiting in a Semi-Enclosed Gulf

by
Abdallah Shanableh
1,2,
Rami Al-Ruzouq
1,2,
Mohamed Barakat A. Gibril
2,3,*,
Mohamad Ali Khalil
2,
Saeed AL-Mansoori
4,
Abdullah Gokhan Yilmaz
5,
Monzur Alam Imteaz
6 and
Cristina Flesia
7
1
Civil and Environmental Engineering Department, University of Sharjah, Sharjah P.O. Box 27272, United Arab Emirates
2
GIS & Remote Sensing Center, Research Institute of Sciences and Engineering, University of Sharjah, Sharjah P.O. Box 27272, United Arab Emirates
3
Geospatial Information Science Research Centre (GISRC), Department of Civil Engineering, Faculty of Engineering, Universiti Putra Malaysia (UPM), Serdang 43400, Malaysia
4
Applications Development and Analysis Section (ADAS), Mohammed Bin Rashid Space Centre (MBRSC), Dubai P.O. Box 211833, United Arab Emirates
5
Department of Engineering, School of Engineering and Mathematical Sciences, La Trobe University, Melbourne 3086, Australia
6
Department of Civil and Construction Engineering, Swinburne University of Technology, Melbourne 3000, Australia
7
Department of Earth and Environmental Sciences, University of Milano Bicocca, Piazza Della Scienza 4, 20126 Milano, Italy
*
Author to whom correspondence should be addressed.
Remote Sens. 2021, 13(23), 4795; https://doi.org/10.3390/rs13234795
Submission received: 26 August 2021 / Revised: 17 November 2021 / Accepted: 24 November 2021 / Published: 26 November 2021

Abstract

:
Whitings, the manifestation of high levels of suspended fine-grained calcium carbonate particles in the water, have been reported and studied worldwide. However, the triggering mechanism of whiting occurrences remains uncertain. The current study attempted to analyze potential factors that might account for whiting occurrences in a semi-enclosed gulf (namely the Arabian/Persian Gulf, hereinafter called the Gulf). First, spatial and temporal variability of whiting events and different potential driving factors (i.e., whiting seasonality, wind-induced mixing, sea surface temperature, and bathymetry) were explored and examined for five years (2015–2020). Second, as a general indicator of whiting occurrences in the Gulf, a whiting index (WI) was developed using time-series analysis and decision tree (DT) classification algorithm. Third, the correlation between the proposed WI and the spatial coverage of various whiting events was examined. Time-series analysis showed that whiting events during the winter season are associated with high winds that lasted for several days. Nevertheless, whiting events were rarely observed despite high wind speed and increased potential for CaCO3 precipitation in summer. This finding suggests that wind-driven forces might be potential sources for mixing water columns, resuspension of CaCO3 particles, and the appearance of whiting in the Gulf. The DT classification algorithm demonstrated that a minimum WI value of 1.1 can explain the initiation of most summer and winter whiting events. Furthermore, a Pearson correlation coefficient of 0.73 was measured between WI and the extent of whiting along the UAE and Qatar coastlines in the Gulf. The proposed WI shows a simple yet effective method for identifying and estimating the extent of whiting in the Gulf.

Graphical Abstract

1. Introduction

Whiting could be defined as clouds of fine-grained calcium carbonate (CaCO3) minerals that are suspended per water column in any water body [1]. Whiting is generally hypothesized to start from a point source and expand spatially with time (with tides and currents) to cover an irregular area. Whiting events occur in lakes and oceans. Such events have been reported in various fresh and marine bodies of water, including the Bahama Banks [2,3,4,5,6,7], Florida coastal waters [8,9,10], Adriatic Sea [11], Fayetteville Green Lake [12,13], North America’s Great Lakes [14], Owasco Lake [15], Lake Ontario [16,17,18,19], and the Arabian Gulf (also referred to the Persian Gulf) [20,21,22,23]. Whiting events appear in satellite images as prolonged milky white patches covering an area that ranges from a few meters to hundreds of square kilometers [10,22].
Whiting events have been studied for decades, and various assumptions have been presented to explain their triggering mechanisms. For example, whiting events in the Bahamas have been attributed to multiple causes: (a) resuspension of fine-grained bottom sediments due to bottom-feeding fish or turbulent tidal flow, (b) large-scale CaCO3 precipitation events, and (c) large-scale carbonate precipitation associated with planktonic algal blooms [24,25,26]. In addition, several studies highlighted the potential role of cyanobacteria in the formation of whitings in the Bahamas [27,28,29,30]. Moreover, Boss and Neumann [31] scrutinized existing data on Bahamian whitings and proposed that whitings are the striking feature of the “bursting” cycle of turbulent tidal flow considering that the observed and expected spatial and physical characteristics of whiting occurrences are consistent with those of events predicted using turbulent flow systems. Dierssen et al. [32] suggested that the wind-driven cells of Langmuir reach the entire depth of the water column, and this phenomenon may serve as a possible mechanism for sediment resuspension and eventually whiting formation. However, some of these explanations were refuted by different studies. For instance, Shinn et al. [4] disproved the resuspension of sediments by bottom-feeding fish by reporting the limited existence of fish in the surroundings of Bahamian whiting events. Robbins et al. [33] noted that resuspension processes involving tidal forcing are inconsistent with the observed seasonality of whiting in the Great Bahama Banks. Morse et al. [34] discounted the hypothesis of biologically induced whiting in the Bahamas by questioning the rarity of whiting and its minimal occurrence in productive and supersaturated waters. Shinn et al. [26] reported the inadequacy of moderate winds or currents generated by lunar tides in re-suspending bottom sediments and originating whitings, considering the high settling rate of Bahamian sediment material (34 g/m2/h). To date, a clear consensus on the formation of whiting in the Bahamas remains nonexistent.
The occurrences of whiting in freshwater and saline lakes were elucidated by two models, including inorganic/chemical precipitation [35,36] and biologically-induced precipitation (photosynthetically-induced precipitation around picoplanktonic cyanobacteria cells) [37,38,39,40,41,42,43]. In freshwater lakes located in regions with cold climates, whiting events occur during the warm and productive season in various lakes due to favorable conditions for the precipitation of CaCO3 [40,44,45,46]. A set of interrelated physical and biological factors, including temperature, primary productivity, and the quantity of pica-cyanobacteria, may control calcite accumulation and its isotopic composition during the stratification period [17]. For example, the precipitation of CaCO3 in Lake Ontario occurs during late summer and early fall because the warm temperature of the water decreases CaCO3 solubility and biological productivity increases the pH of epilimnetic waters, thus raising CO   3 2   activities [36,47]. Similarly, in phytoplankton bloom season-related whiting events, the highest carbonate precipitation was observed in Lake Geneva, Switzerland, during early spring and late summer [48,49].
Wells and Illing [20] first reported whiting events in the Arabian Gulf (also known as the Persian Gulf and referred to henceforward simply as the Gulf) in 1962. They indicated that whiting events occurred recurrently throughout the year and mainly appeared in the shallow southern and southwestern part of the Gulf. Owing to the large extent of whiting in the Gulf and its formation in the top surface, wherein clear water was observed between whiting and the sea bottom, Wells and Illing [20] refuted the resuspension of sediments by bottom-feeding fish as a potential mechanism of whiting origination in the Gulf. Moreover, the crystal formation mechanism of whiting was observed to be different from that formed from the seabed. Wells and Illing [20] also associated whiting occurrences in the Gulf with the observed increase (five-fold to ten-fold) in the siliceous diatom population. The photosynthesis of phytoplankton was reported to lead to a considerable drop in the P CO 2 of the water column, resulting in whiting material precipitation from an originally supersaturated water body. The variation in temperature and salinity of seawater can lead to favorable conditions for the nucleation of CaCO3. Thus, another study by Morse and Shiliang [23] argued that whiting in the Gulf is probably produced by the direct precipitation of CaCO3 associated with phytoplankton blooms. Consistent with the findings of Morse and Shiliang [23], Shanableh et al. [50] used a chemical–mathematical model to demonstrate the association between the high salinity and elevated temperatures of Gulf areas that exhibit whiting events and the excessively higher calcite and aragonite saturation indexes compared with other parts of the Gulf and the open sea. However, such studies [20,23] explain the high potential of CaCO3 precipitation in the Gulf but do not elucidate the occurrence of whiting events, which typically transpire during winter. Kendall et al. [29] observed that whiting events in the Gulf might be associated with winds above 25 mi/h (40 km/h). However, no evidence was presented to confirm such an observation. Other studies [51,52,53,54,55] have presented possible explanations for the high potential of CaCO3 precipitation in parts of the Gulf that exhibit whiting. Nevertheless, such studies have not confirmed whether whiting occurs due to the direct precipitation or resuspension of CaCO3.
The advancement of technologies in satellite-based remote sensing offers an enormous opportunity for tracking, monitoring, and analyzing whiting events and other geographical phenomena. Various studies have utilized remotely sensed data to monitor and investigate whiting events in the Bahamas [32], Florida [8,9], Great Lakes [14], and Arabian Gulf [22]. Multitemporal reflectance data, sea surface temperature (SST), chlorophyll-a, salinity, bathymetry, wind speed, and other in situ data can provide meaningful information to develop reasonable explanations for the occurrences of whiting. A recent study by Long et al. [9] analyzed 13 years (2003–2015) of whiting events in southwest Florida by using Moderate Resolution Imaging Spectroradiometer (MODIS) images. Although the annual mean whiting coverage peaked in 2011 and 2012, the highest daily coverage was in 2008 (i.e., 26 km2). The authors observed variations in whiting events on the basis of the season and distance from the shoreline. They conducted statistical regression modeling to explain whiting coverage with several environmental variables, including wind speed, SST, precipitation, and nearby river discharge. The SST and river discharge were found to be statistically significant factors.
The current study aims to scrutinize different whiting events in the Arabian Gulf and explore possible explanations behind the occurrences of this phenomena in the Gulf. Specifically, this study attempts to analyze various potential factors that may contribute to the manifestation of whiting events in the Gulf including wind-induced mixing, the seasonality of SST, and bathymetry. Moreover, a simple, yet powerful, whiting index (WI) is proposed as a general indicator of whiting occurrences in the Gulf. Ultimately, the Pearson correlation coefficient was measured between the developed WI and the spatial extent of whiting in the Gulf.

2. Study Area and Materials

The Arabian Gulf, as shown in Figure 1, is a semi-closed crescent-shaped basin located in the Middle East between the northeastern Arabian Peninsula and the Iranian Plateau. It is a shallow marginal sea positioned in a subtropical hyperarid region between the longitudes of 48°–57°E and latitudes of 24°–30°N. The Gulf is 56–370 km wide and almost 1000 km long, and it covers a surface area of 239,000 km2. The depth of the Gulf is relatively shallow, i.e., less than 20 m along the coasts of the United Arab Emirates (UAE), Qatar, Bahrain, and Kuwait (Figure 1). The deepest areas of the Gulf are near the Iranian coast and continue into the Strait of Hormuz, with a depth exceeding 40 m. The following subsections describe data sources and the characteristics of the investigated potential factors that may trigger the suspension of CaCO3 and Whiting in the Gulf, including SST, SSS, and wind speed.

2.1. Satellite Images for Whiting Exploration

Whiting events in the Gulf exhibit an ephemeral nature and a large extent. Remotely sensed data acquired using MODIS, with an image tile size of approximately 1200 km by 1200 km, provide an invaluable means for continuously mapping and monitoring the occurrence of whiting events in the Gulf. In the current investigation, daily Terra/Aqua MODIS surface reflectance products (MOD09GA and MYD09GA) with seven spectral bands (visible, near-infrared, and short-wave infrared regions of the spectra) at 500 m resolution were used. Multitemporal MODIS products from 2015 to 2020 were downloaded from NASA’s Earthdata website (https://search.earthdata.nasa.gov/search, accessed on 16 August 2021). Aerosols, thin cirrus clouds, and gases in MODIS products were corrected by the MODIS Land Science Team. Figure 2 depicts different whiting events in the Arabian Gulf recorded using MODIS Terra/Aqua sensors.

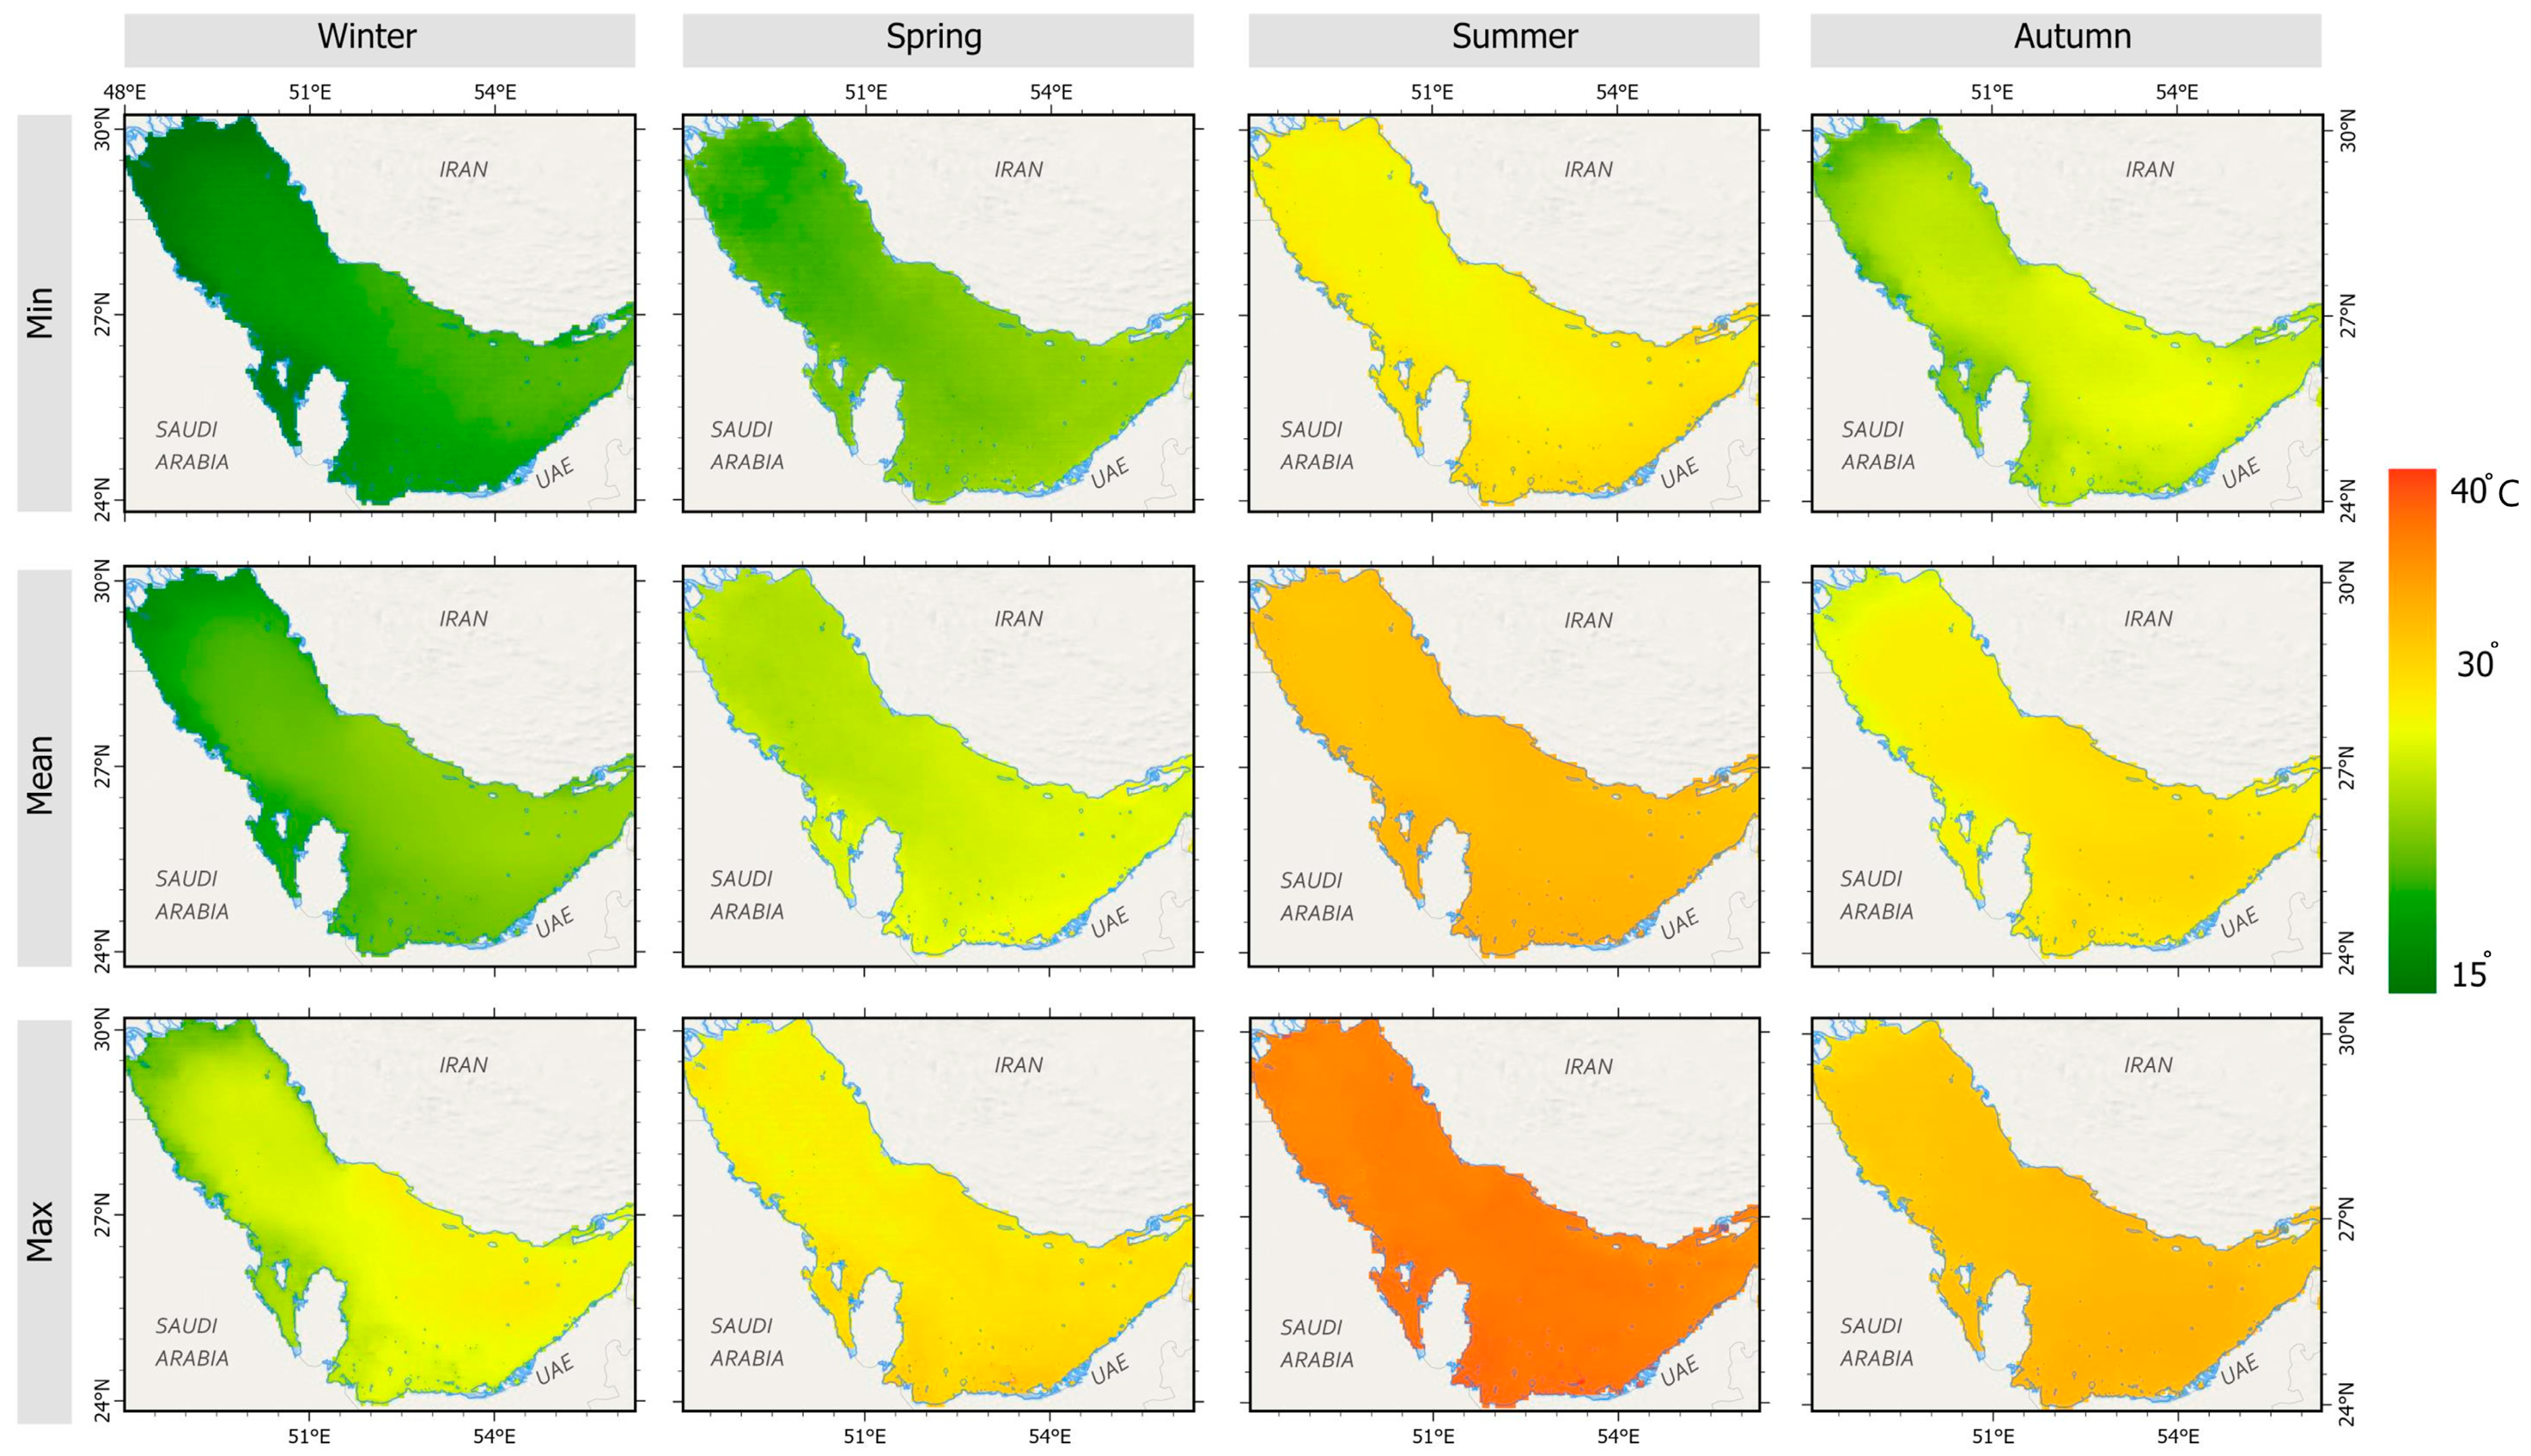
2.2. Sea Surface Temperature (SST)

SST affects the equilibrium of the carbonate system in marine environments, including the state of saturation and precipitation of CaCO3. CO2 exchange between air and water is dependent on SST, with hot water having less capacity to absorb CO2, consequently favoring a decrease in the pH and precipitation of CaCO3. The SST of the Gulf exhibits spatiotemporal variability [56]; it is affected by factors, such as air temperature and movement, mixing and turbulence, water exchanges, and surrounding landmass. The Gulf, which is semi-enclosed and surrounded by the hot desert region of the Arabian Peninsula, has higher SST compared with other seas [57].
In consideration of the capabilities of cloud computing platforms in handling and analyzing a massive amount of geospatial data, the open source Google Earth Engine was utilized to investigate the temporal variations of SST in the Gulf. Daily SST products retrieved from Level 3 Standard Mapped Image MODIS Terra Data [58] were used to analyze the seasonal variations of SST in the Gulf. The data were categorized into four seasons: winter (December to March), spring (April to May), summer (June to September), and fall (October to November). The general trend of SST changes in the Gulf is depicted in Figure 3. The analysis of daily SST in the Gulf showed thermal variations in the Gulf during different seasons. The maximum SST values of the Gulf during winter ranged from 22 °C to 26 °C, while the maximum SST values during summer ranged from 32 °C to 38 °C.

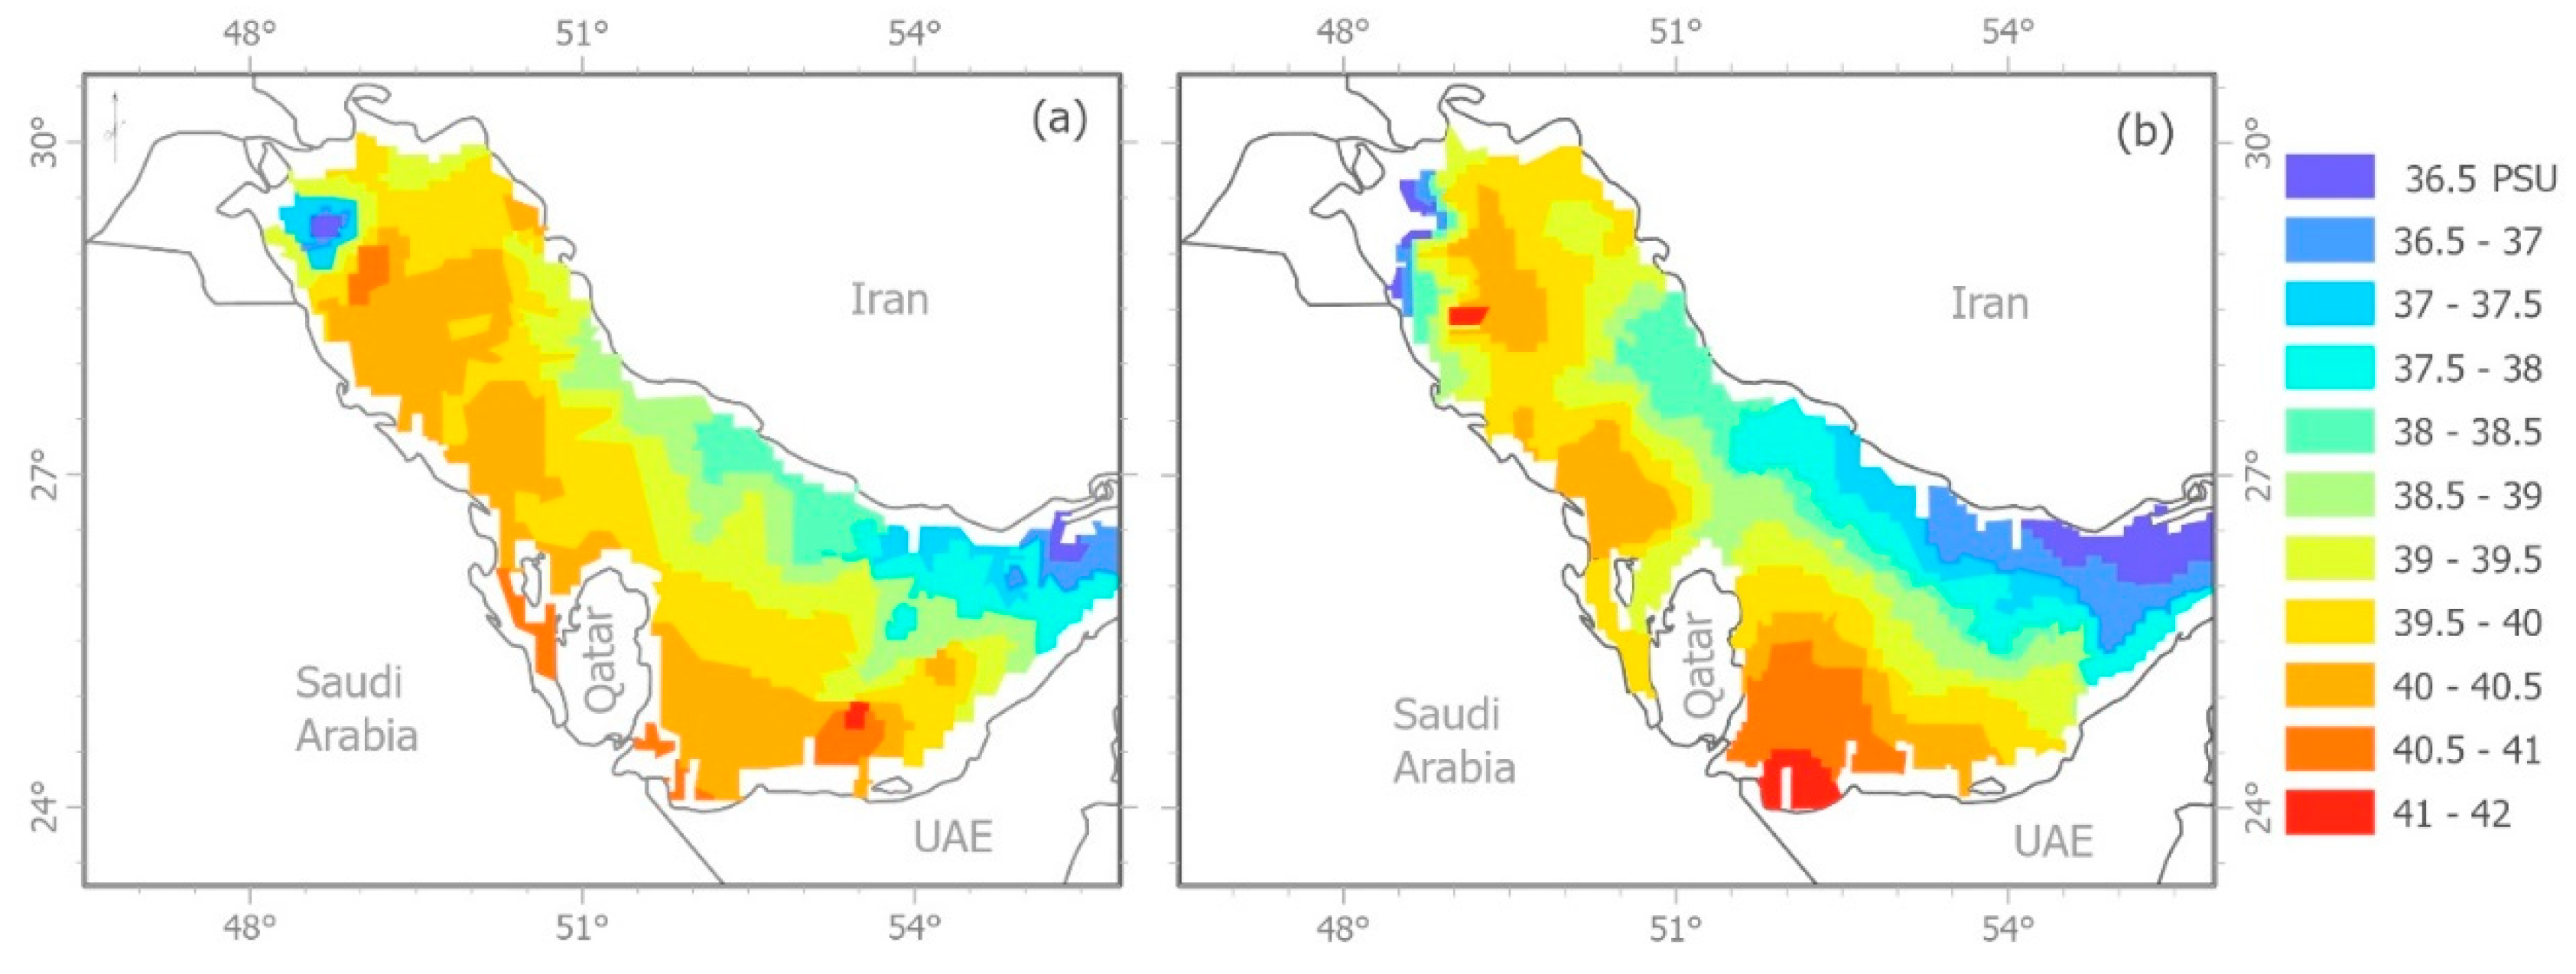
2.3. Sea Surface Salinity (SSS)

In addition to SST, SSS reflects the state of equilibrium of a carbonate system in marine environments, and the saturation levels of CaCO3. The relatively high salinity in the Gulf [59,60] may be related to evaporation induced by the hot climate and poor circulation in certain parts of the Gulf. High marine water salinity generally reflects the concentration of salt ions in water, increasing water saturation with CaCO3 and favoring CaCO3 precipitation.
The water salinity of the Gulf varies on the basis of location and season, typically exceeding 39 practical salinity units (psu). In contrast with typical seawater salinity (approximately 35 psu), SSS can exceed 45 psu in the Gulf, particularly in shallow regions where whiting mostly occurs (i.e., around the coasts of UAE, Qatar, and the island of Bahrain) [61,62,63]. Moreover, salinity may reach 70 psu in shallow areas during summer [64]. Given the limited number of direct oceanographic observations in the Gulf, the analysis of the observed data shows that the geographical distribution of salinity in the Gulf varies significantly over time and space [65]. Figure 4 depicts the surface salinity observed during winter and summer at depths of 0–3 m published by Swift and Bower in 2003 [66]. These data were used in the current study to assess the state of aragonite (a form of CaCO3) supersaturation in the Gulf.

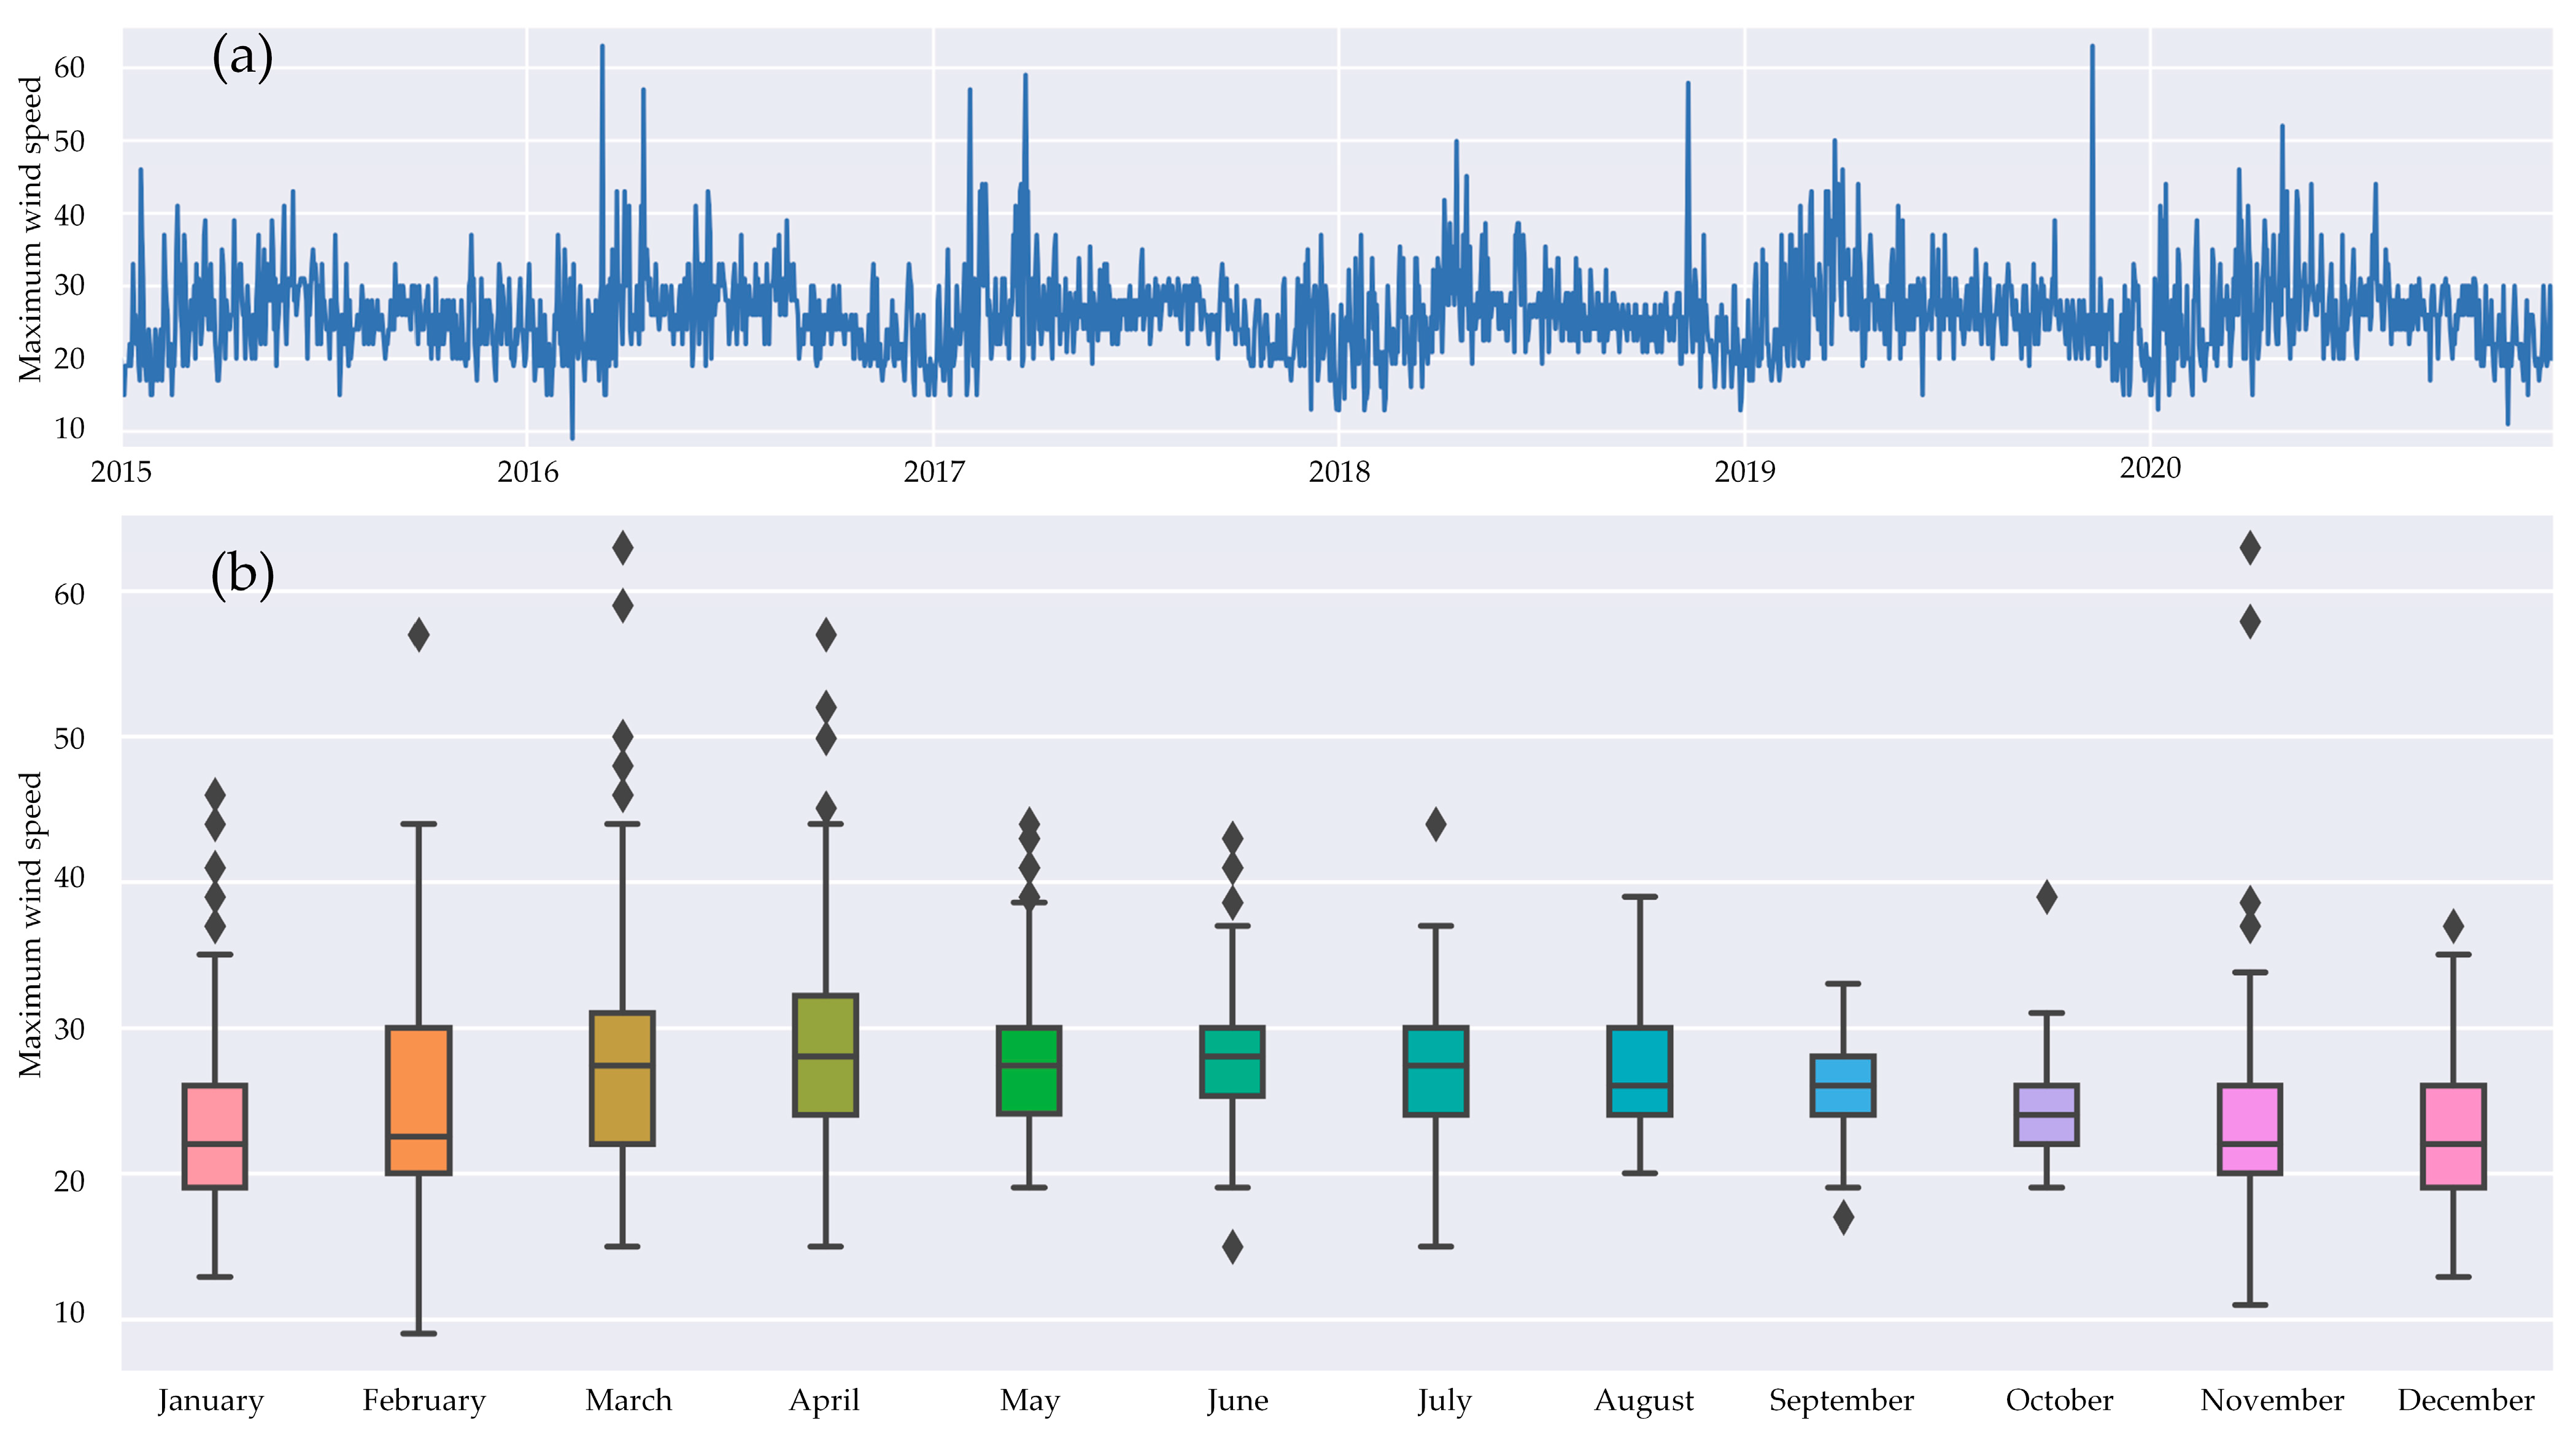
2.4. Wind Speed Data
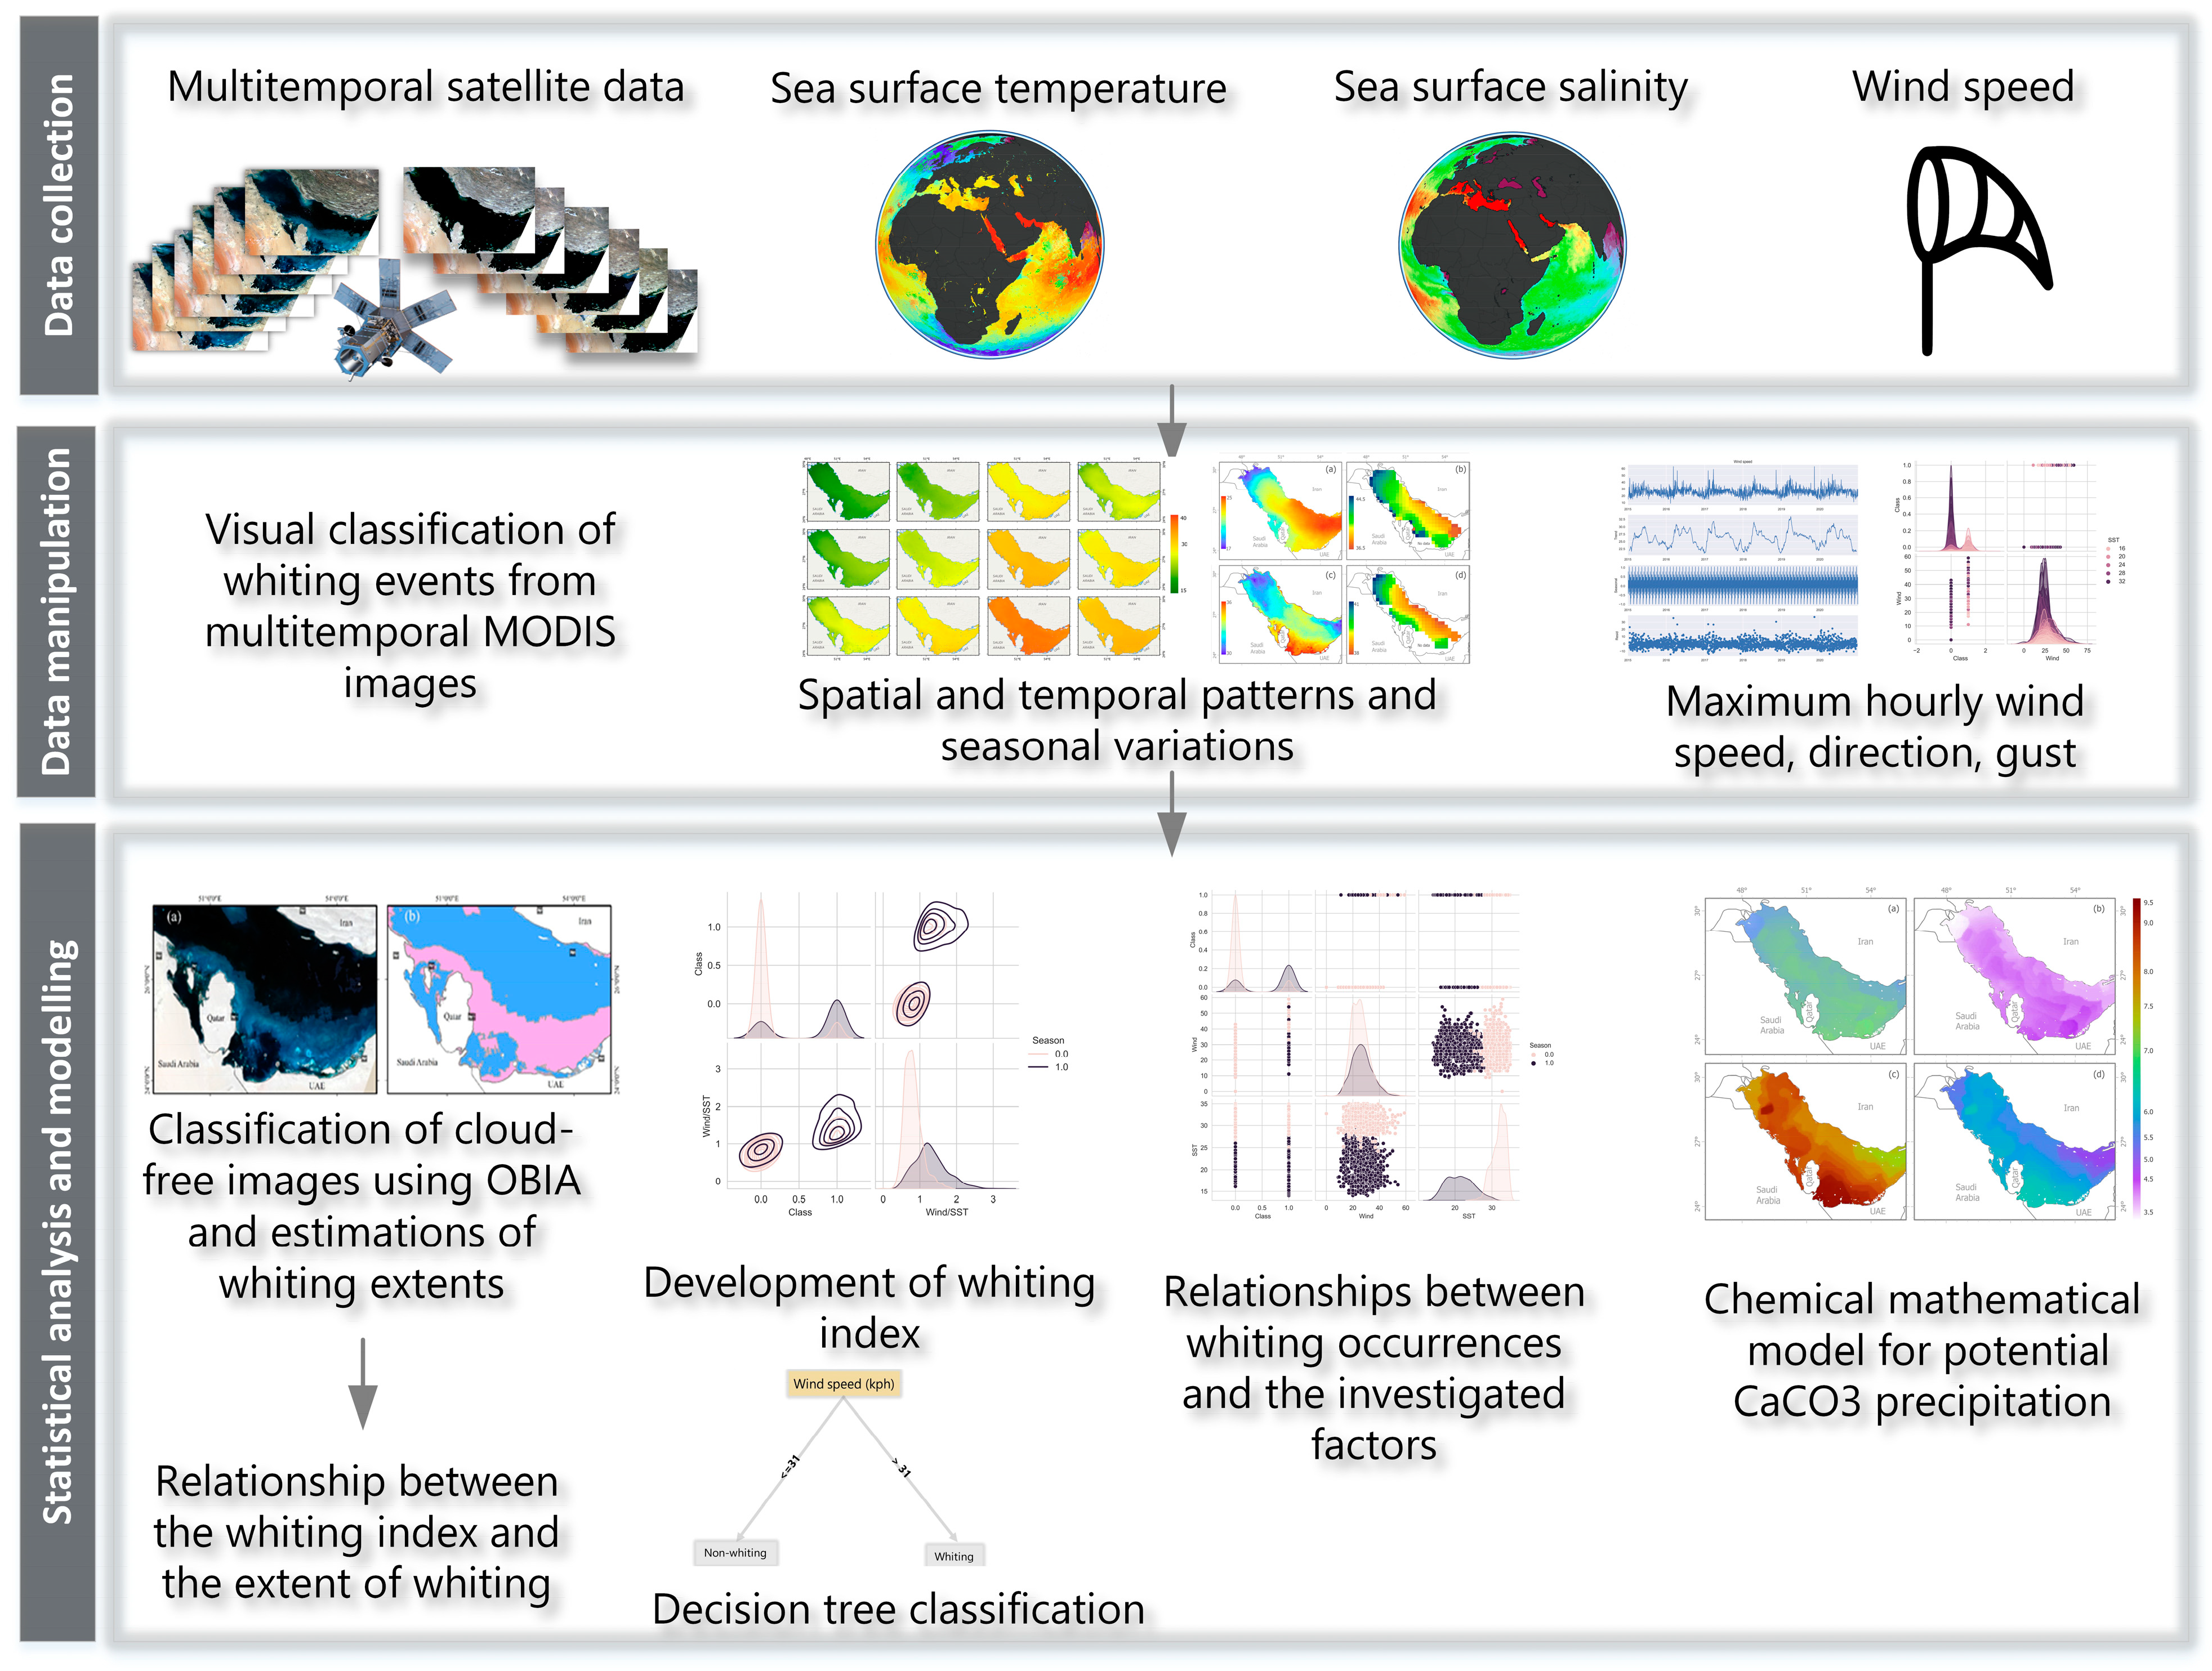
The Gulf is generally prone to strong northerly or northwesterly winds, which are known as Shamal (this Arabic word refers to the north). Shamal winds occur during most of the year and intensifies from summer to winter [67]. Meanwhile, the dry and cold winter Shamal blows primarily from November to March, and the summer Shamal blows from early June to July [68]. Shamal winds affect air and water movements in the Gulf [69] and significantly influence sediment transport and accumulation [69,70].
In the current study, the maximum hourly wind data collected from different ground stations around the Gulf coastline were investigated as one of the driving forces that may contribute to triggering whiting events in the Gulf. Wind speed generally reaches its maximum value during winter (between December and April), and it can occasionally reach as high as 60 km/h or as low as 10 km/h, particularly during summer. Meteorological data in the form of hourly wind speed and gust were retrieved for four major ground stations from https://www.wunderground.com/ (accessed on 1 March 2021). These ground stations are located in four airports: the Abu Dhabi International Airport in the UAE, the Hamad International Airport in Qatar, and the King Fahd International Airport in Saudi Arabia (Figure 1). Figure 5 shows the time series of the maximum daily and the plotbox of wind speed retrieved from the Abu Dhabi International Airport between 2015 and 2020.

3. Methodology

The framework of this study, as shown in Figure 6, comprised three stages. First, multitemporal remotely sensed data (more than 2300 multitemporal daily satellite images) were visually surveyed to confirm the presence or absence of whiting in the Gulf. When a whiting event was observed in MODIS images, daily satellite data, SST, hourly wind data, and other meteorological data were gathered. Second, raw data were prepared and processed to pave the way for our investigation. Then, the acquired multitemporal data (i.e., the presence of whiting and the corresponding wind data, SST, and whiting index) were compiled, and the outputs of the supervised decision tree classification algorithm was utilized to investigate the relationship between the potential factors under consideration. A set of cloud-free MODIS images that contained whiting were classified using rule-based object-based image analysis (Section 3.4), and whiting extents were computed and used to study the relationship between the proposed whiting index and the extent of whiting in the Gulf.

3.1. Carbonate System Equilibrium Model

The Gulf is an active sedimentary basin for carbonate and evaporate deposition, which may occur due to the biological production of skeletal materials and chemical precipitation [71]; these carbonaceous sediments are generally predominant along the coasts of the UAE, Qatar, Bahrain, and Saudi Arabia [51]. The extensive occurrence of carbonates and evaporates in these shallow areas can be attributed to excessive evaporation and elevated salinity resulting from the high temperature along with the aridity of the Trucial Coast of the Gulf [52,53]. An earlier chemical equilibrium model [50,72], which is based on the equilibrium between CO2 in the atmosphere and seawater, was used in the current study to estimate the state of CaCO3 supersaturation in the Gulf. In particular, the model was used to generate the seasonal and spatial distributions of the aragonite saturation index ( Ω Aragonite ) of the surface waters of the Gulf and then assess whether the indices correspond to the distribution of whiting events in the Gulf. Notably, seawater is typically supersaturated with respect to CaCO3 (i.e., Ω Aragonite > 1) and a higher supersaturation index is indicative of increased potential for CaCO3 precipitation.
The spatial and temporal distributions of SST and SSS of the Gulf were used as inputs of the adopted equilibrium model. In this study, a fishnet of 5 × 5 km was created over the Gulf to obtain SST and SSS values in the summer and winter seasons. Through an iterative chemical–mathematical procedure, the concentration of aragonite was estimated, and the aragonite saturation surface was created through the inverse distance weighting interpolation method. More details of the model and its parameters are described in [50,72,73,74,75].

3.2. Whiting Occurrences in the Gulf

To identify whiting occurrences in the Arabian Gulf, we retrieved daily satellite images for the last five years and inspected each one visually. Visual inspection of whitings in the Gulf was carried out by scrutinizing the presence or absence of whitings near the coast of Abu Dhabi, Qatar, and Saudi Arabia, in daily MODIS images. Given the presence of clouds in MODIS images, especially in the winter, daily tracking of whiting events is challenging (see Section 4.2.1). Since whiting could last for a few days, we differentiated between a whiting day and an event. The whiting event consisted of multiple consecutive days of whiting. In case of any unclear/cloudy satellite image that happens between two whiting “days”, the unclear satellite image would be classified as a whiting day to complete the consecutive of the whiting event.

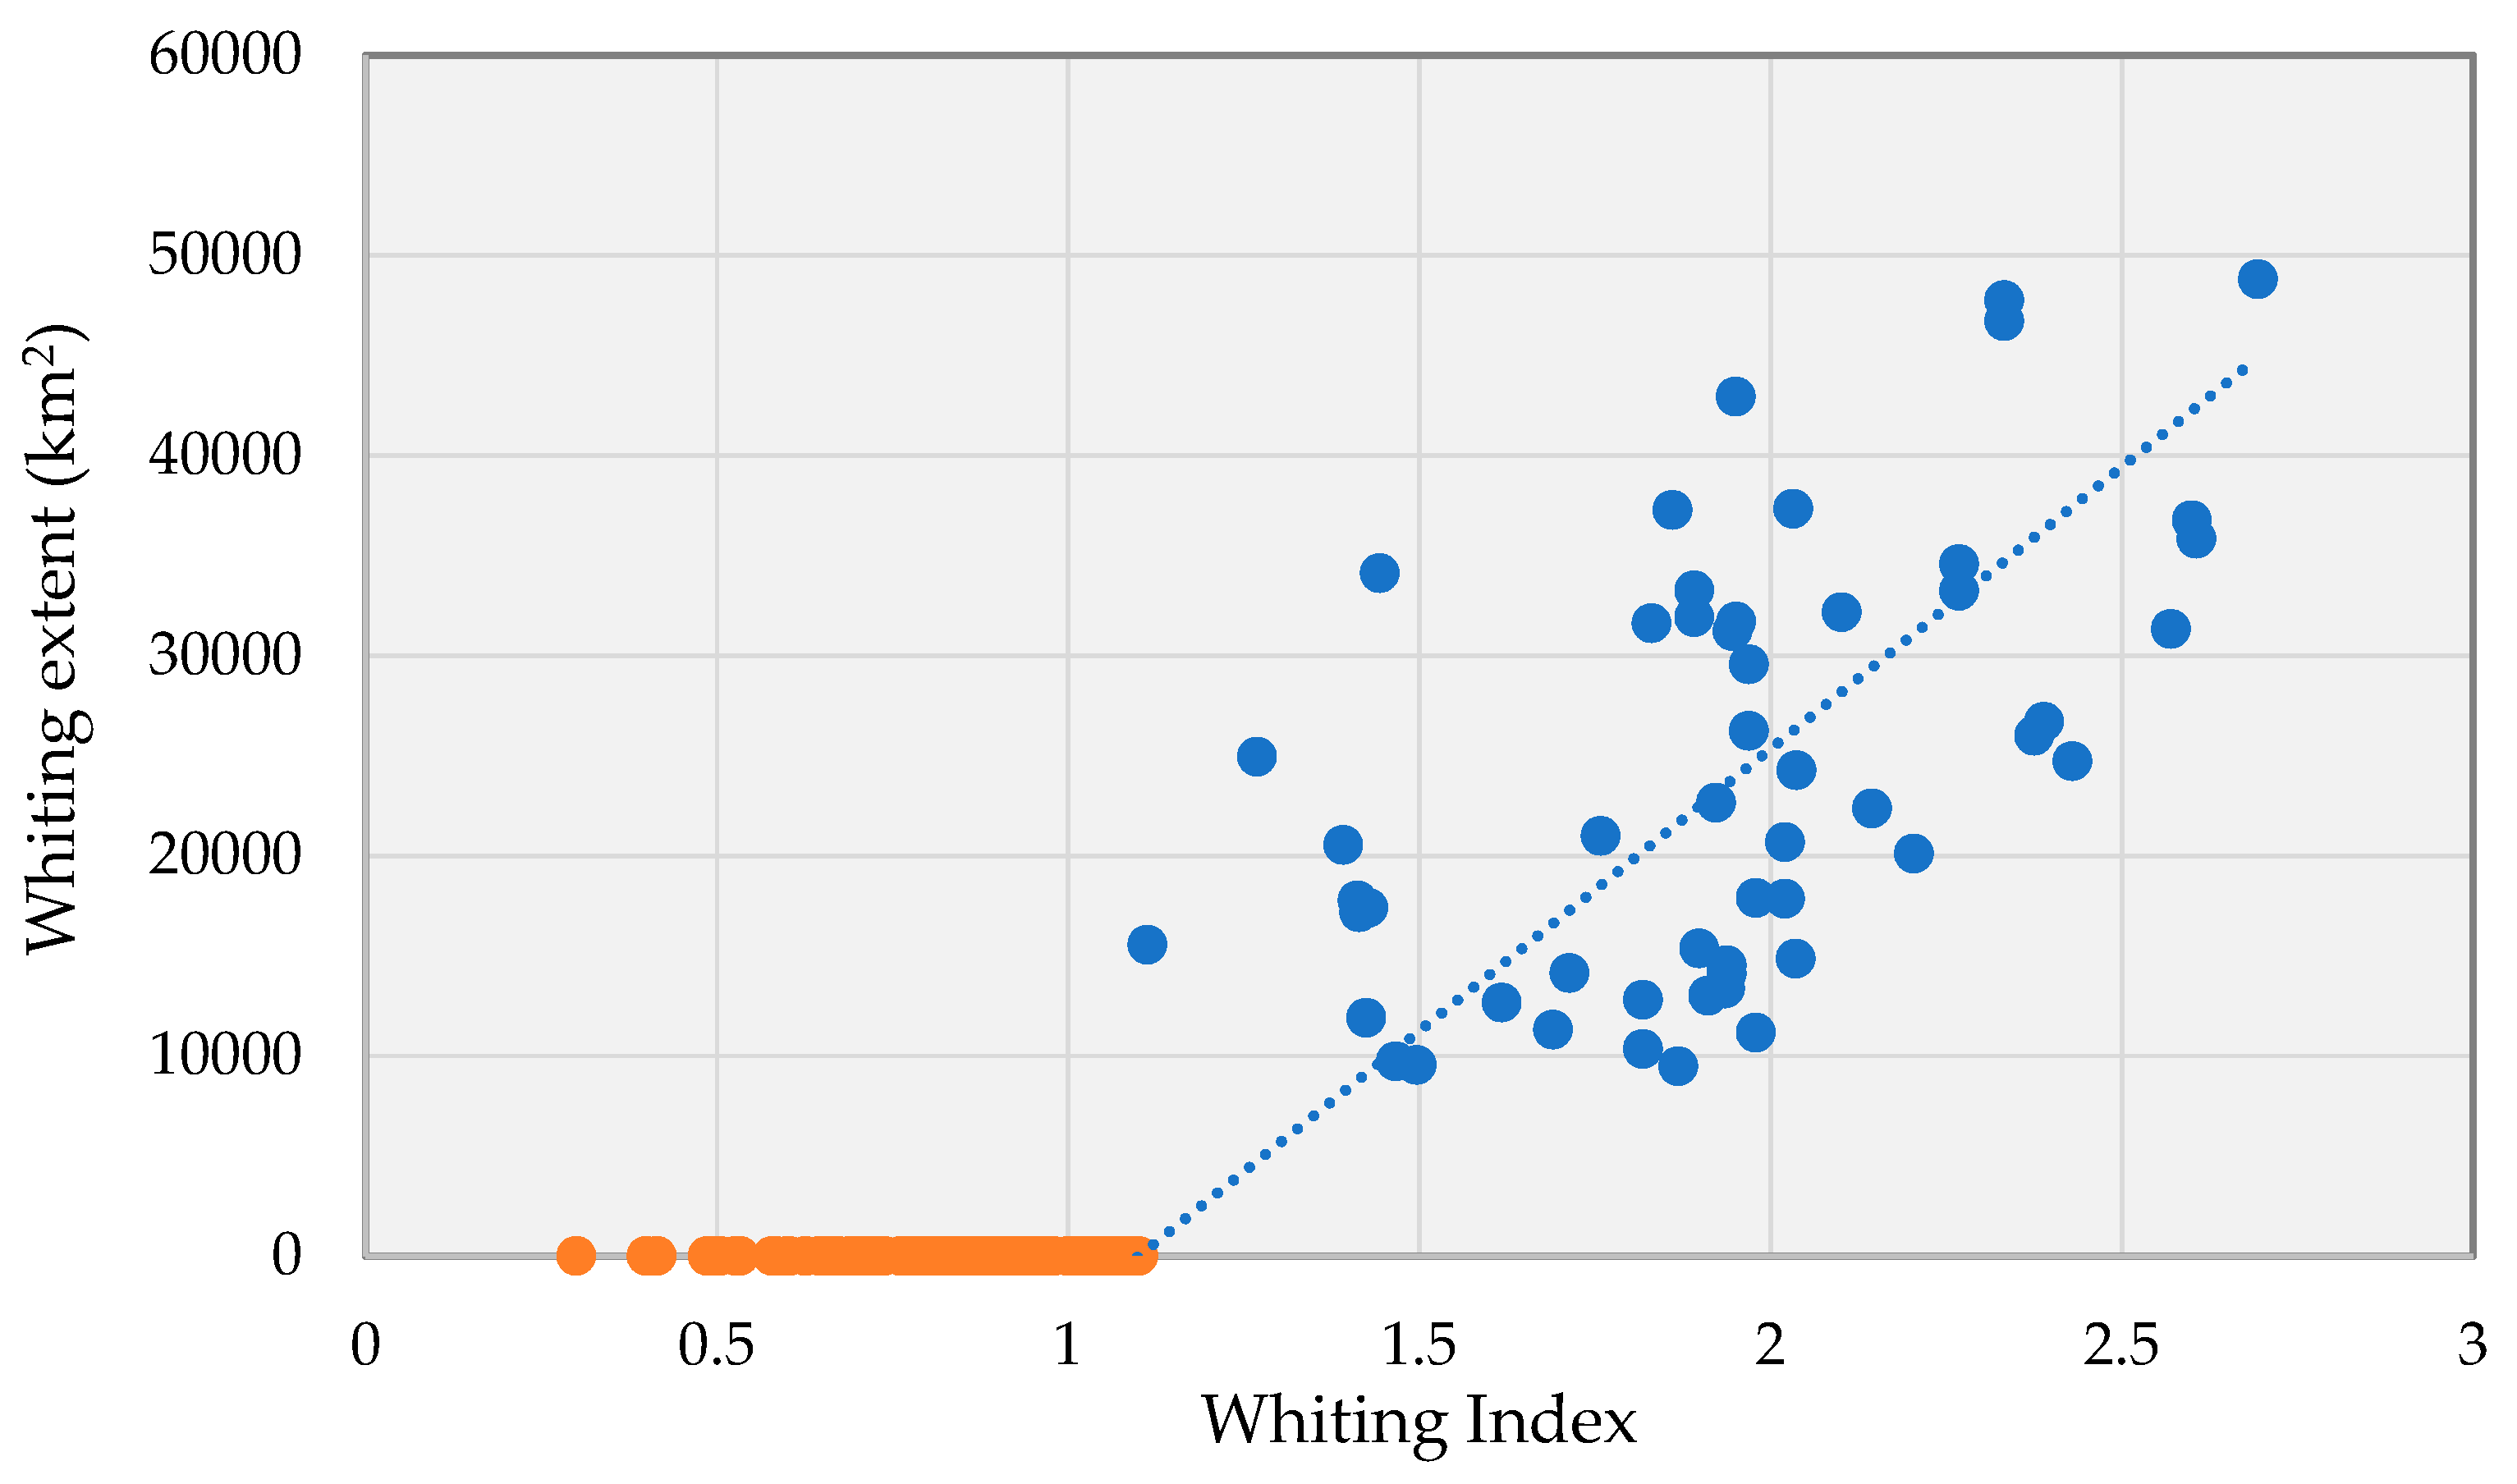
3.3. Development of the Whiting Index

Time-series analysis of wind data for different whiting events (see Section 4.2) point out that high wind speeds might appear to be a potential factor associated with whiting occurrences in the Gulf. Winds with adequate speed cause sufficient turbulence during winter to mix the entire water column and suspend the sediments near the shallow southern and southwestern coastlines of the Gulf. However, higher wind speeds may be necessary to trigger such events during summer
With hot weather, the surface layer of the Gulf heats up and the water column becomes thermally stratified during summer [76,77,78]. The stratification of the water column resists the mixing of the water column by the wind and provides a possible explanation for the relatively infrequent whiting events in the Gulf during summer despite the presence of high-speed winds. During winter, thermal stratification disappears, and the mixing of the water column requires less wind energy. The characterization of stratification requires extensive modeling and field studies, which are beyond the scope of the current study. However, available studies have confirmed the stratification of the Gulf’s water during summer and the heating of the surface water layer [68,78,79,80]. Meanwhile, SST data reflect the heating and cooling of the Gulf’s surface waters during summer and winter.
In the current study, SST was used to indicate potential thermal stratification associated with the heating of surface waters in the shallow areas of the Gulf that exhibit whiting. Therefore, the mixing of the water column in the Gulf is considered in the current study to be proportional to high wind speed, which is the driving mixing force, and inversely proportional to SST, which represents resistance to mixing. We propose a Whiting Index (WI) based on Equation (1) to classify whiting on the basis of the combined effects of high wind speed and SST:
WI = Wind   speed SST

3.4. Decision Tree (DT) Classification

To understand the potential driving factor that may contribute to the initiation of whiting in the Gulf, a DT classification algorithm, which is a supervised and nonparametric machine learning technique, was considered in the current study to analyze and classify the collected samples by using various combinations of potential factors (wind speed, season, SST, and wind speed/SST or whiting index). A total of 2300 daily MODIS images (2015–2020) were firstly surveyed, and the presence or absence of whiting was identified. Considering that whiting events in the Gulf mainly occur in the winter period, an event may last only for few days, and a large number of MODIS satellite images in the Gulf are covered by clouds, a limited number of MODIS images with whiting occurrences can be obtained. Thus, representative samples of whiting and non-whiting occurrences were collected based on visual classification of the daily MODIS images. A total of 2887 samples of whiting and non-whiting occurrences observed at three different locations (near the coasts of Abu Dhabi, Qatar, and Saudi Arabia) at different seasons (1643 and 1244 samples collected in summer and winter, respectively) were prepared and used in DT classification and the development of WI. Classification that uses DT does not require prior knowledge about data distribution, and it is capable of modeling complex datasets and providing a simple approach for interpreting the relationships between variables [81,82,83]. In this study, 10-fold cross-validation was used to evaluate the performance of the DT classifier.

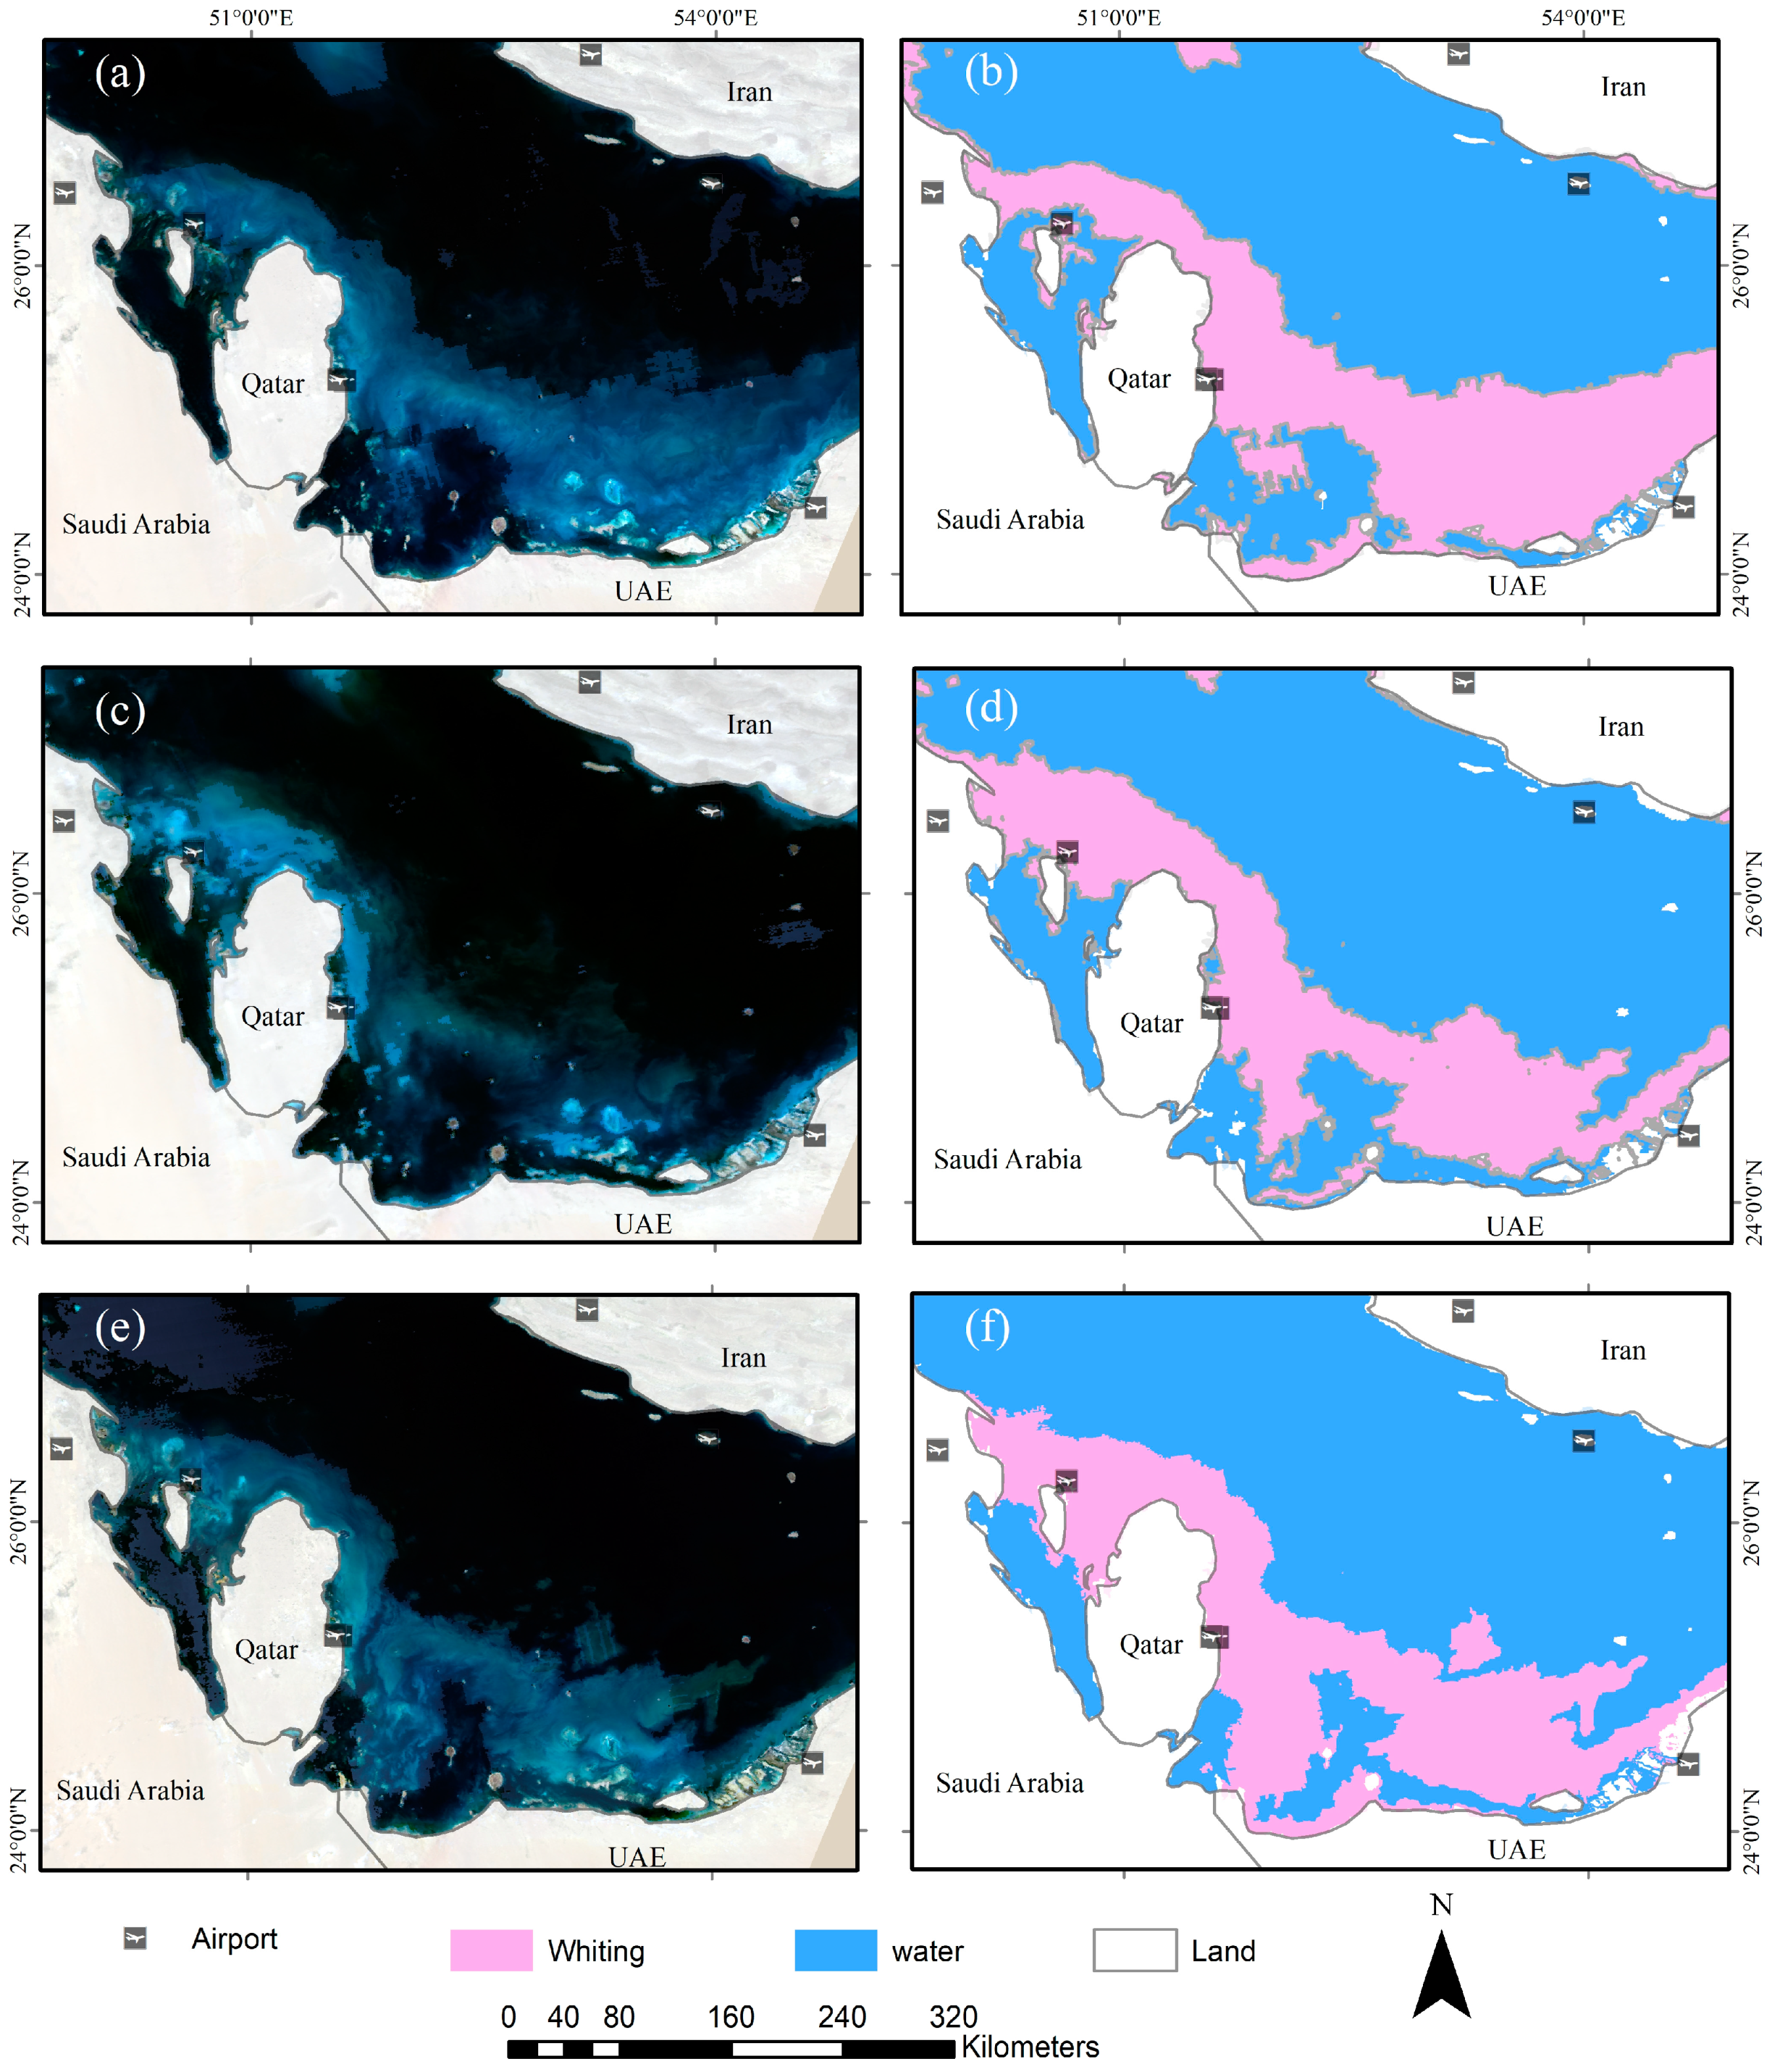
3.5. Whiting Extraction from Cloud-Free MODIS Images

Geographic object-based image analysis (GEOBIA) was used in the current study to classify cloud-free MODIS images and determine the extent of various whiting events in the Gulf. Considering that GEOBIA is not a spatial-resolution-dependent approach, it could be utilized to extract information from remotely sensed data with different image resolutions as long as the sizes of the targeted objects are compatible with the spatial resolution of the images [84,85]. Image segmentation, feature selection, and image object/segment classification are the major steps in the GEOBIA classification scheme. First, a multiresolution image segmentation algorithm [71] was applied to a cloud-free time-series MODIS dataset. Multiresolution image segmentation parameters, including scale, shape, and compactness, were set as 40, 0.5, and 0.1, respectively. Second, MODIS green (band 4) and blue (band3) spectral bands were used to compute the normalized difference between green and blue (NDGB) using Equation (2). The selection of NDGB was based on a comprehensive spectral and feature selection analysis of a set of attributes (mean spectral reflectance, standard deviation, and spectral indices). NDGB was observed to provide accurate mapping whiting in the Gulf from MODIS images [22]. The generated multitemporal image objects were eventually classified using adaptive boosting [86] and rule-based classification [22]. Ultimately, the extent of various whiting events was computed to investigate its correlation with WI.
NDGB = Ref .   Green   Ref .   Blue Ref .   Green + Ref .   Blue

4. Results and Discussions

Whiting in lakes and oceans is caused by suspended CaCO3 particles. As stated in Section 1, various hypotheses have been proposed to explain the occurrence of whiting in surface waters. The subsequent subsections present the results of analyzing potential causes of whiting events in the Gulf, including resuspension of sediments due to wind-generated turbulence, and a proposed whiting index (i.e., wind speed/SST). Furthermore, the extent of whiting is linked to the geographic extent of whiting.

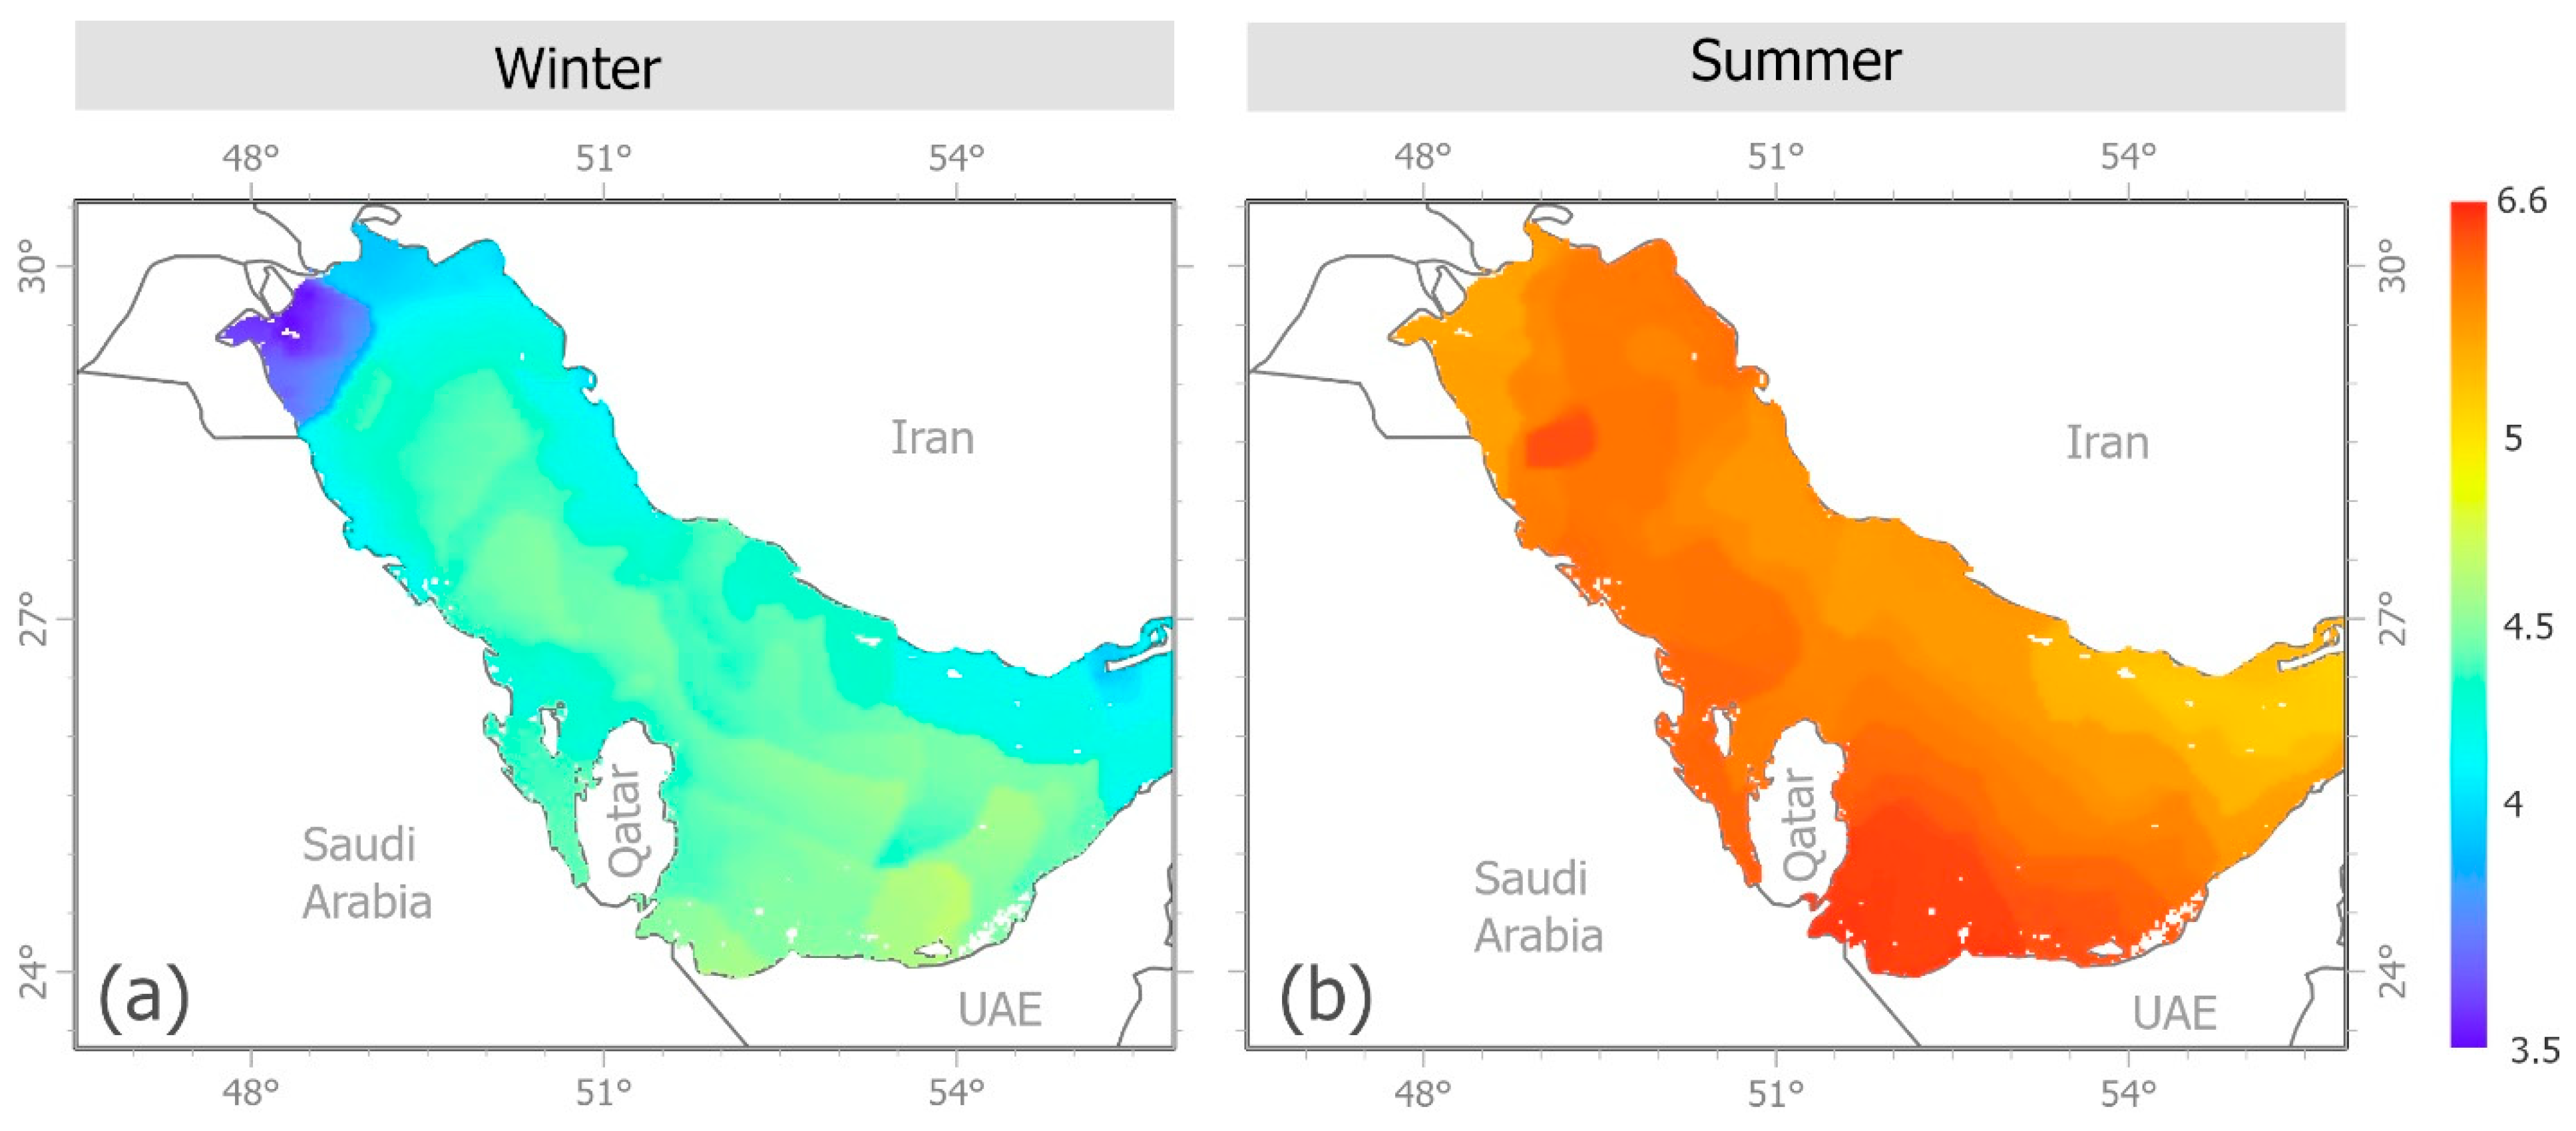
4.1. CaCO3 Supersaturation and Whiting

The Gulf is a hotspot for carbonate production due to its hypersaline and warm waters, leading to high levels of supersaturation with respect to CaCO3 [87]. Whiting occurs in the areas along the southern and southwestern coastlines of the Gulf, which are relatively shallow (Figure 1), warm, and highly saline (>40 psu). High salinity and temperature favor the precipitation of CaCO3; thus, the potential for the direct precipitation of CaCO3 increases during summer and relatively declines during winter. Figure 7 presents the distribution of the aragonite saturation index ( Ω   Aragonite ) in summer and winter seasons. The highest estimated aragonite supersaturation levels were during the summer in the shallow, hot, and highly saline parts of the Gulf that exhibit frequent whiting. However, whiting in the Gulf predominantly occurs in the winter months than in the summer. Considering the lack of in situ observations in the Gulf, this study did not assess direct CaCO3 precipitation as a potential mechanism of whiting occurrences in the Gulf. Alternatively, this study considered wind-driven and surface thermohaline forcing as potential causes of the resuspension of CaCO3 sediments and the initiation of whiting, as explored in the subsequent sections.

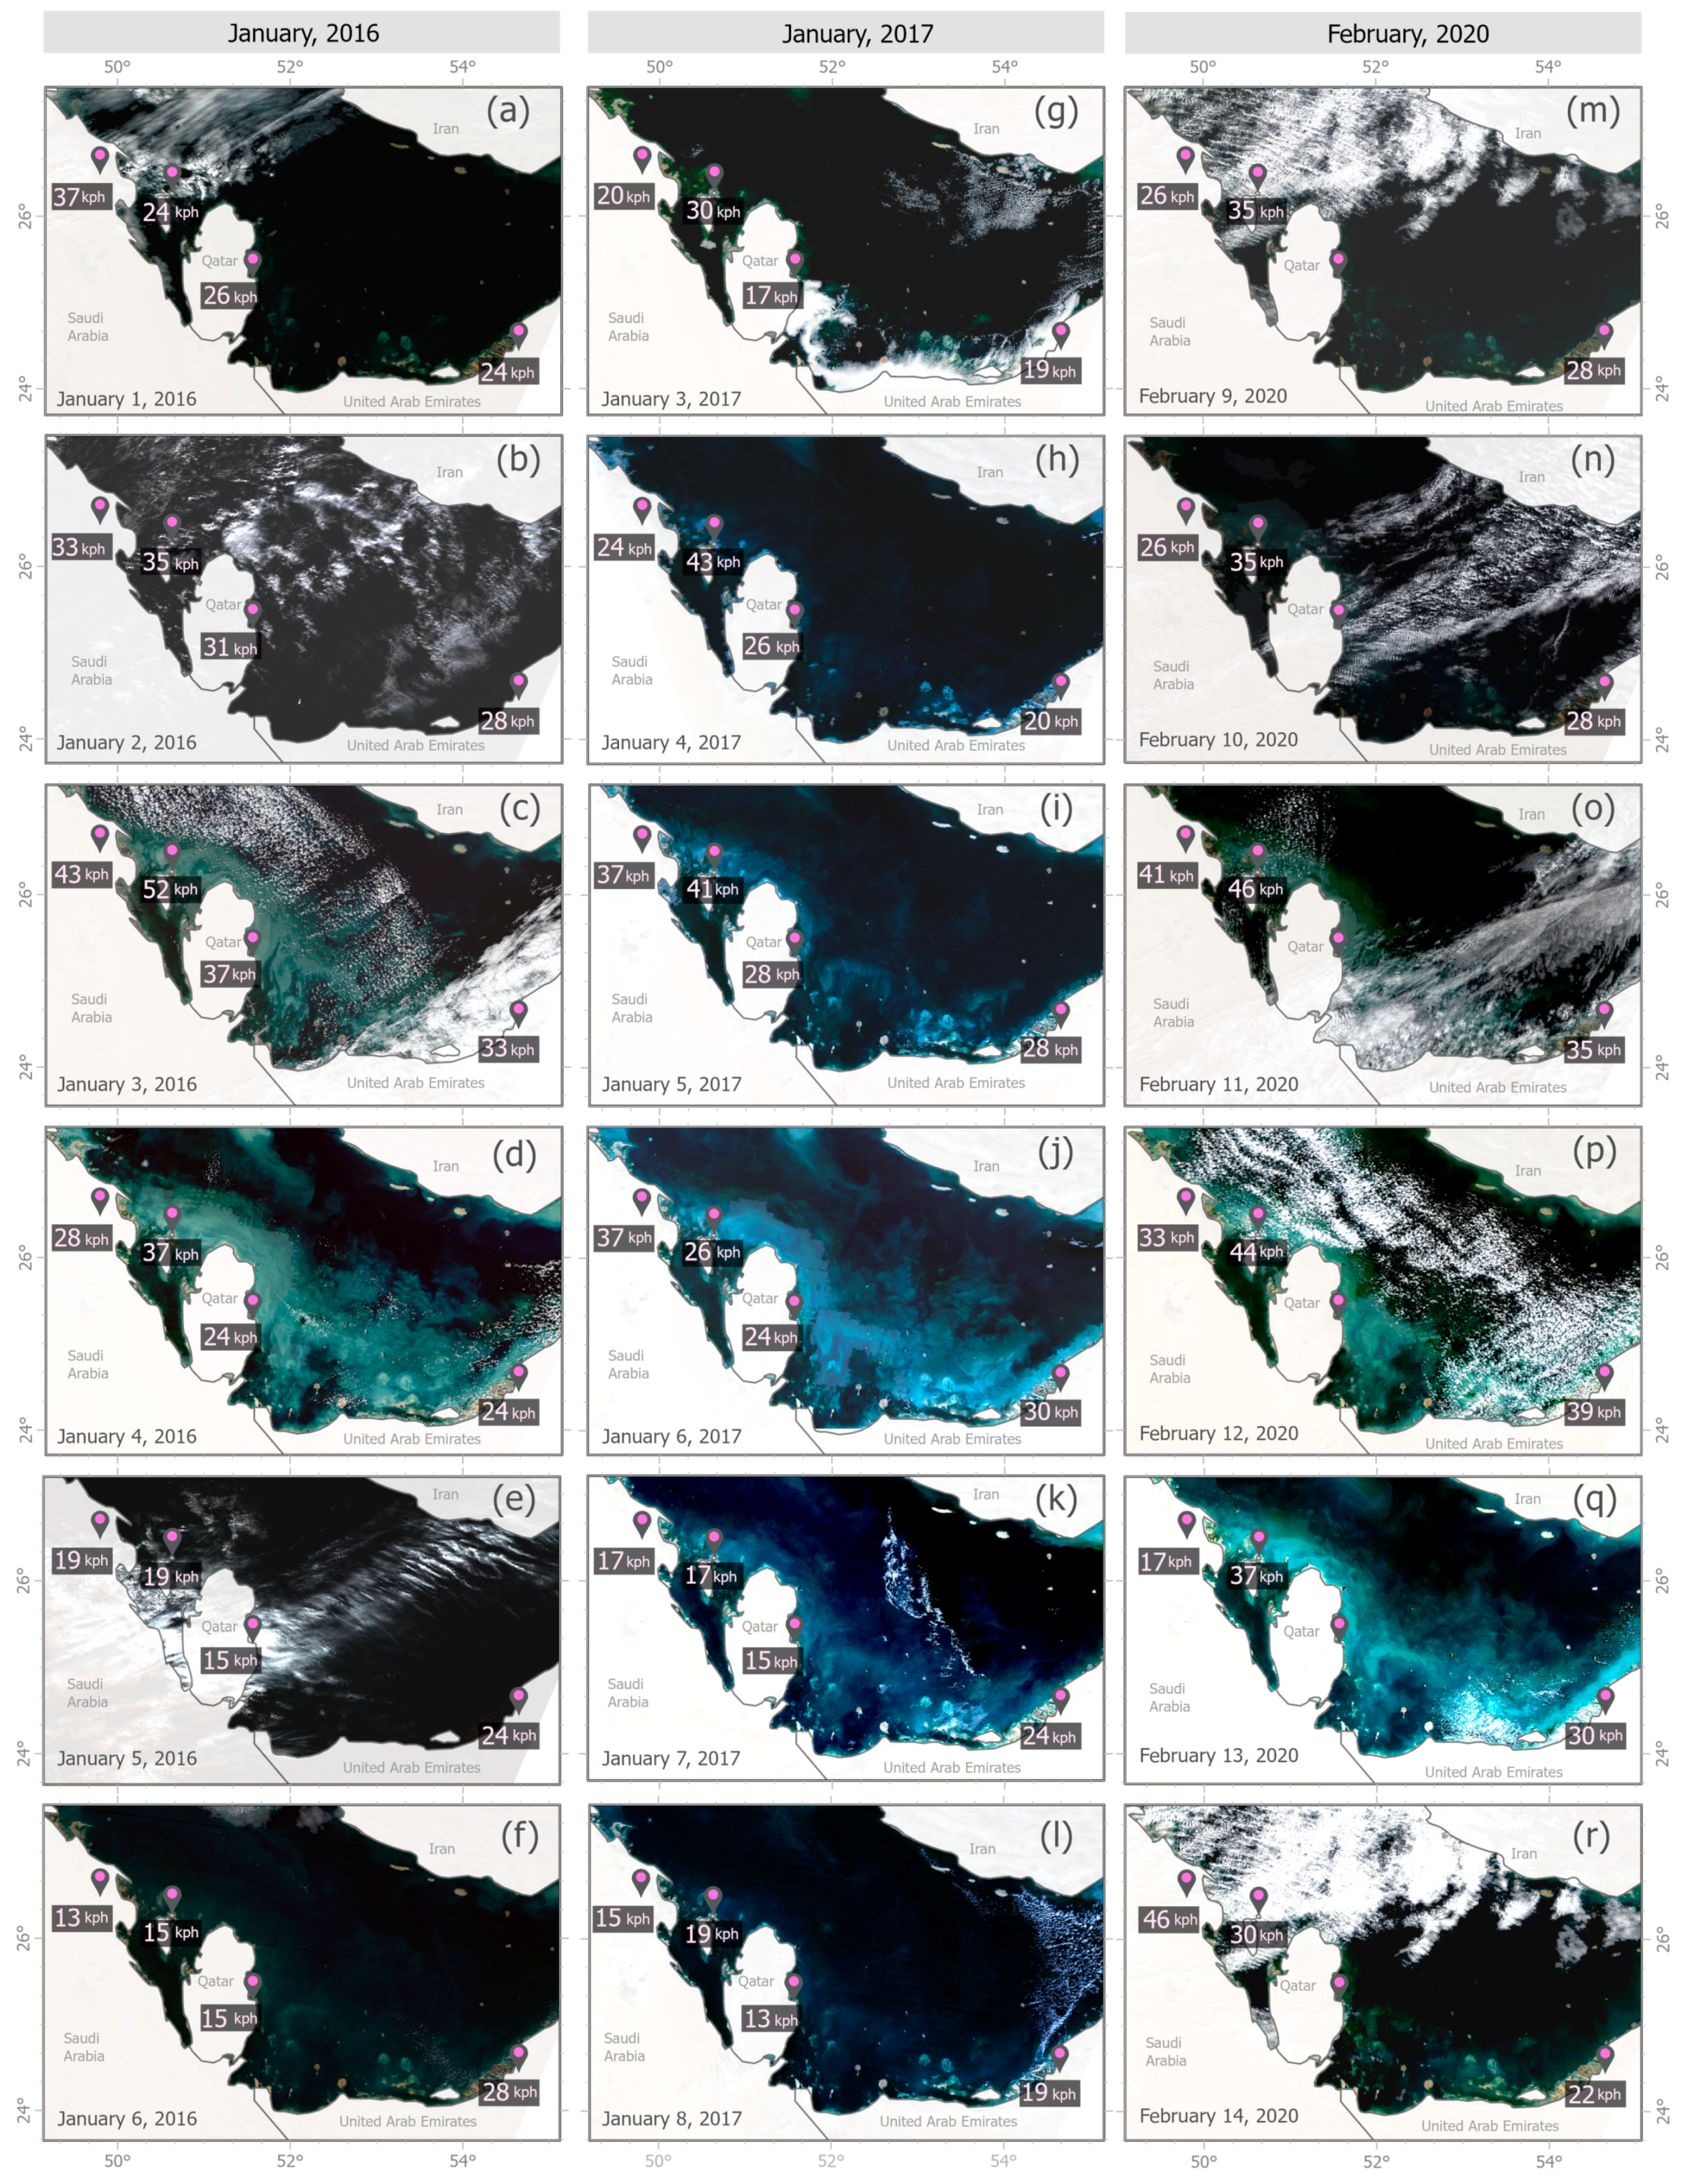
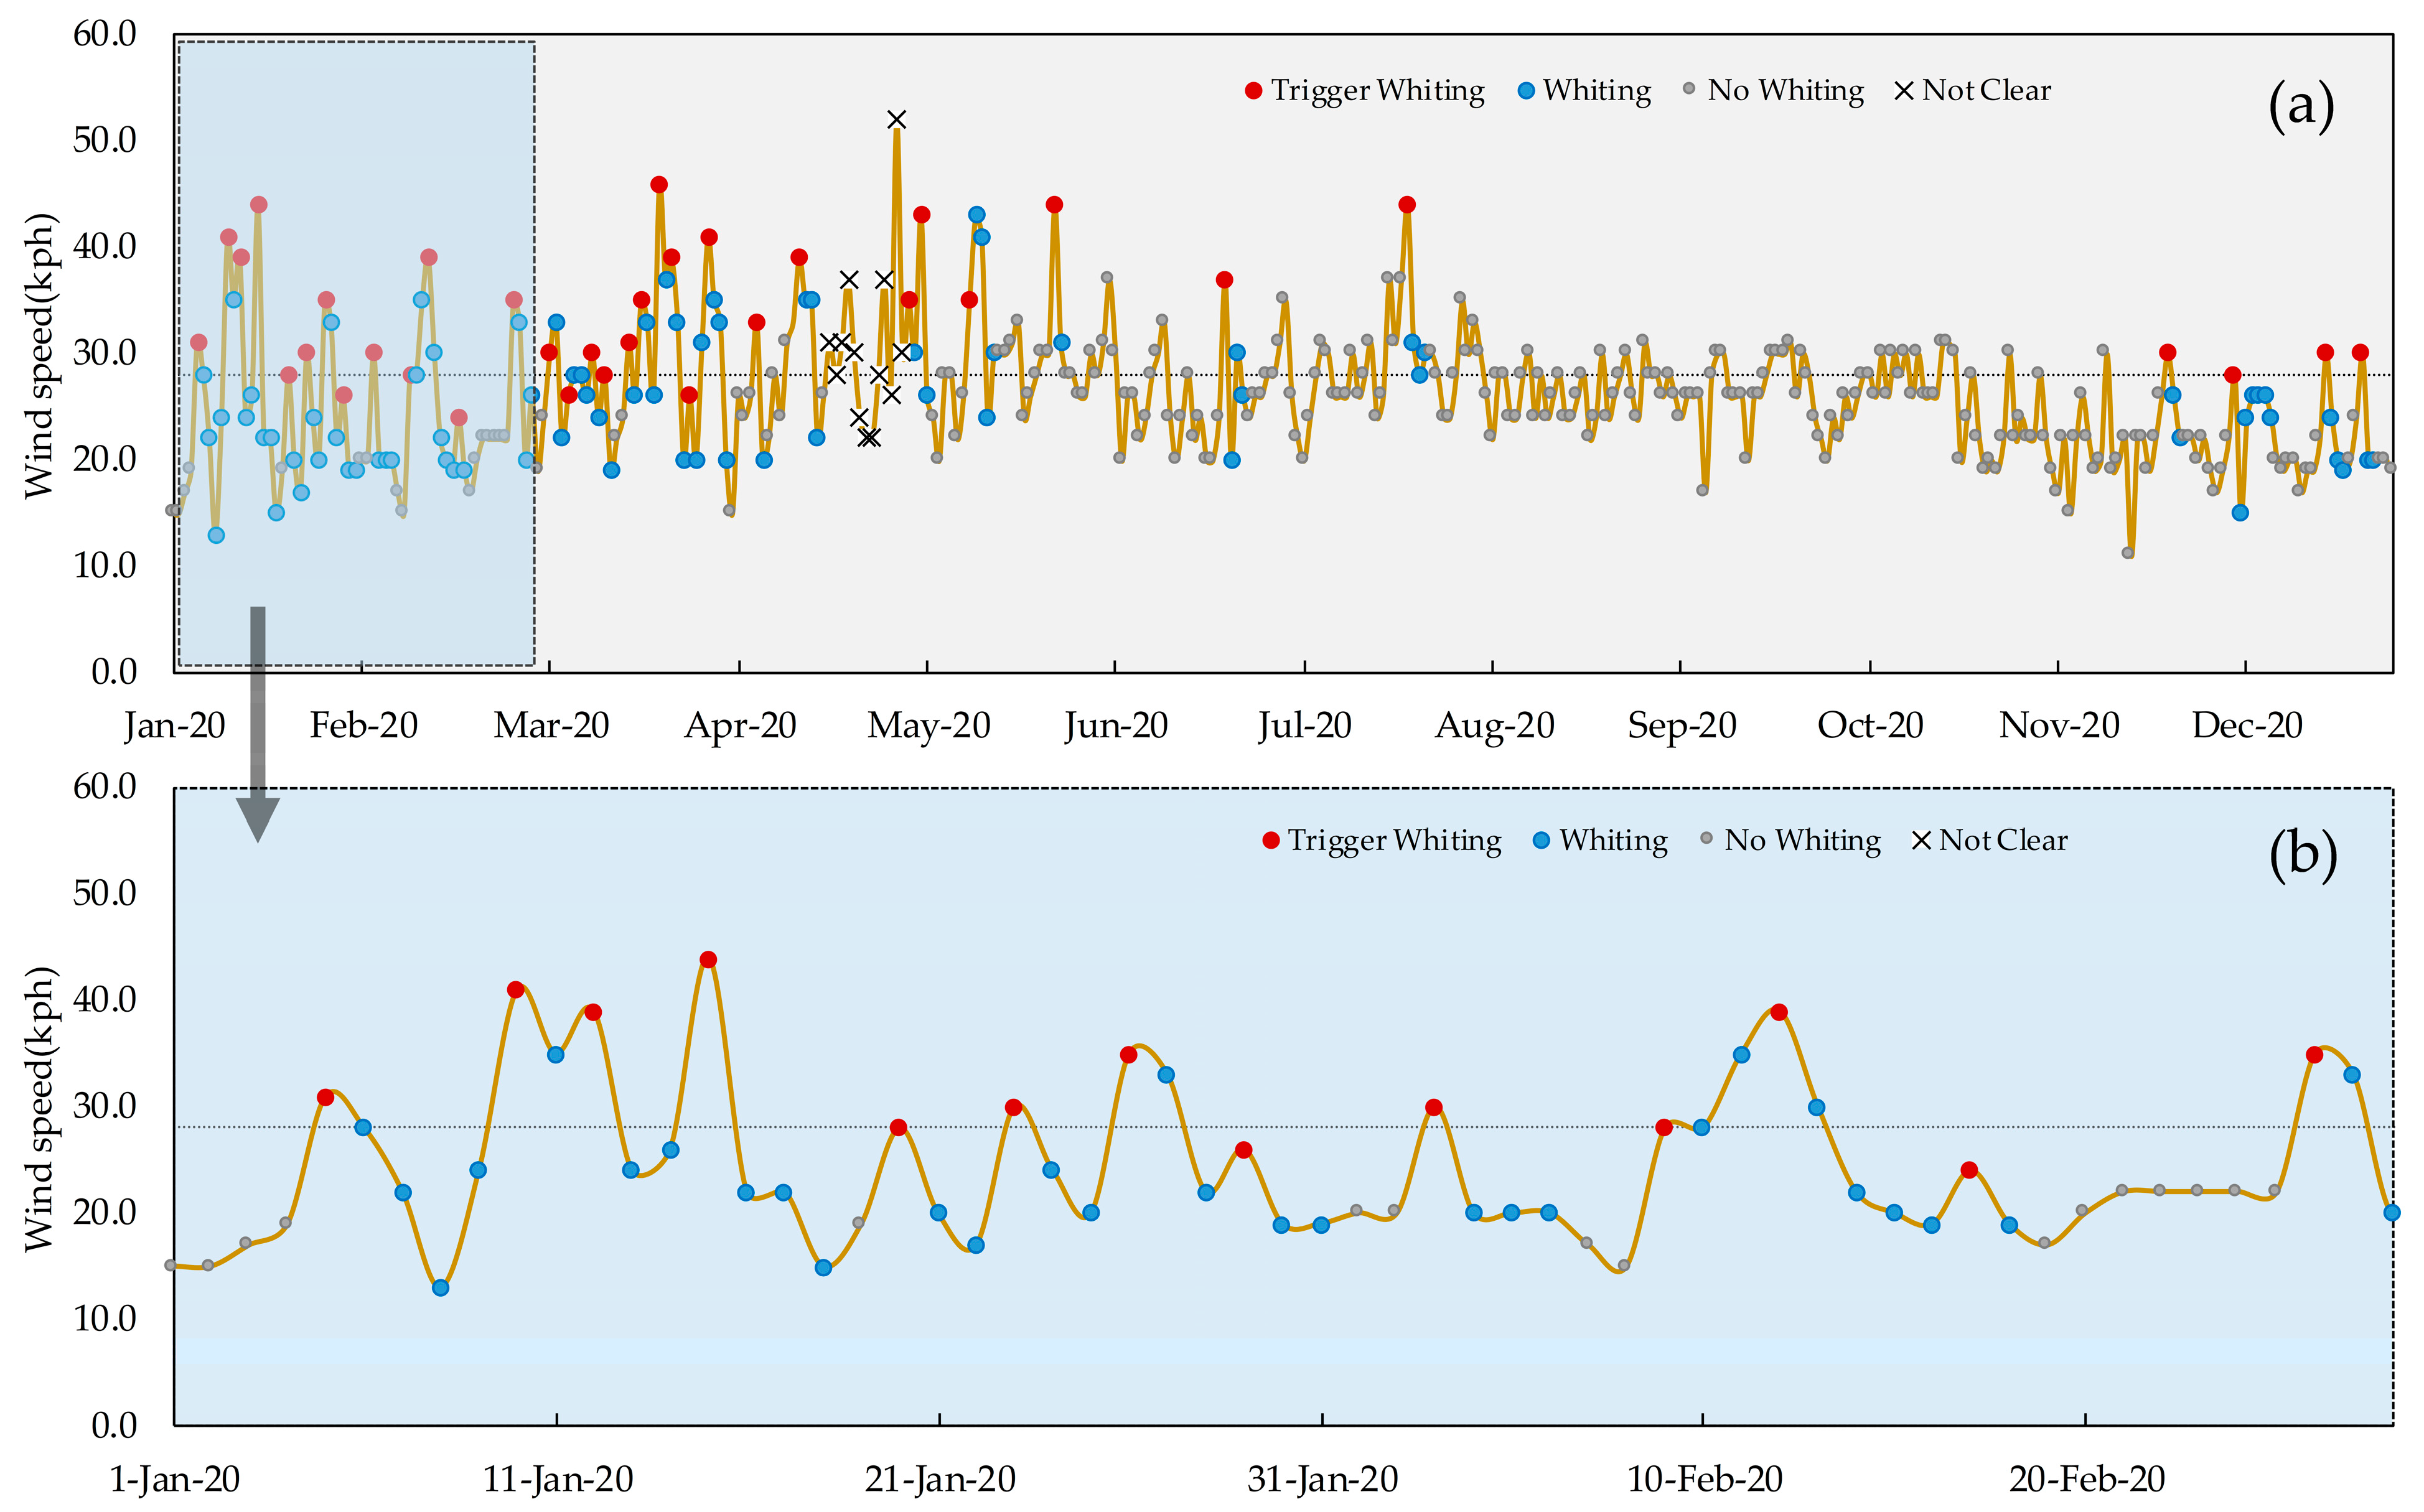
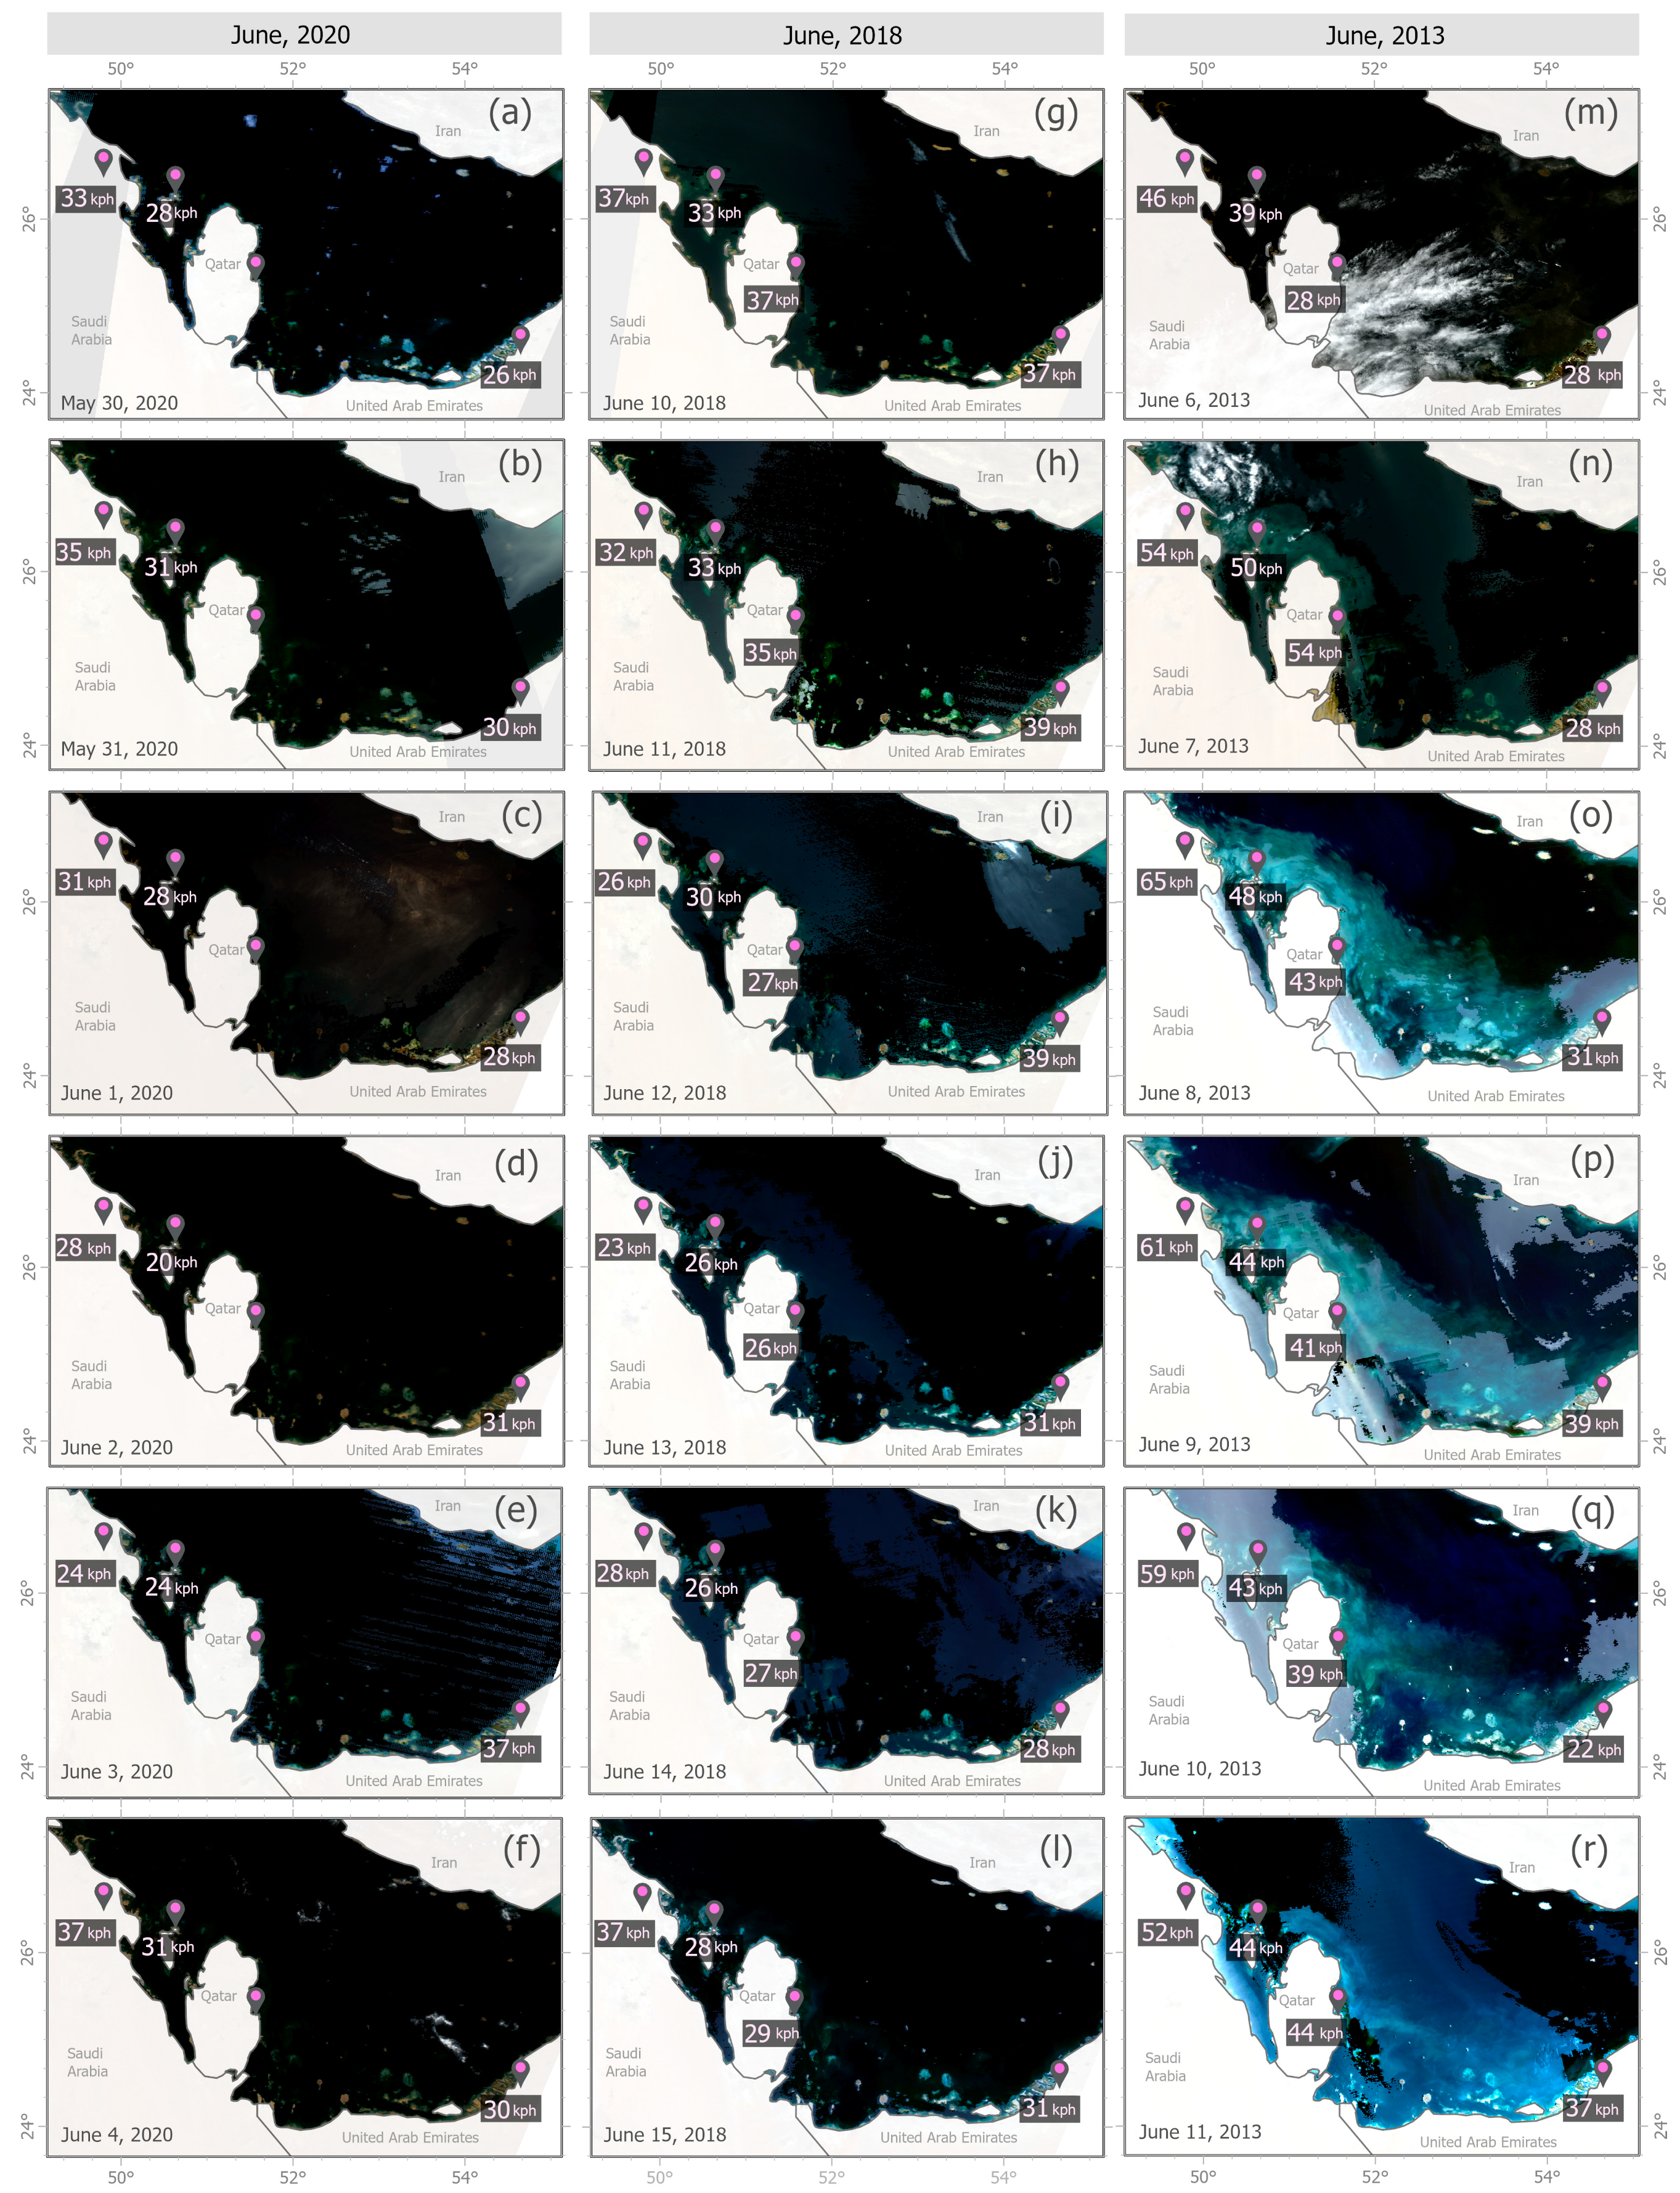
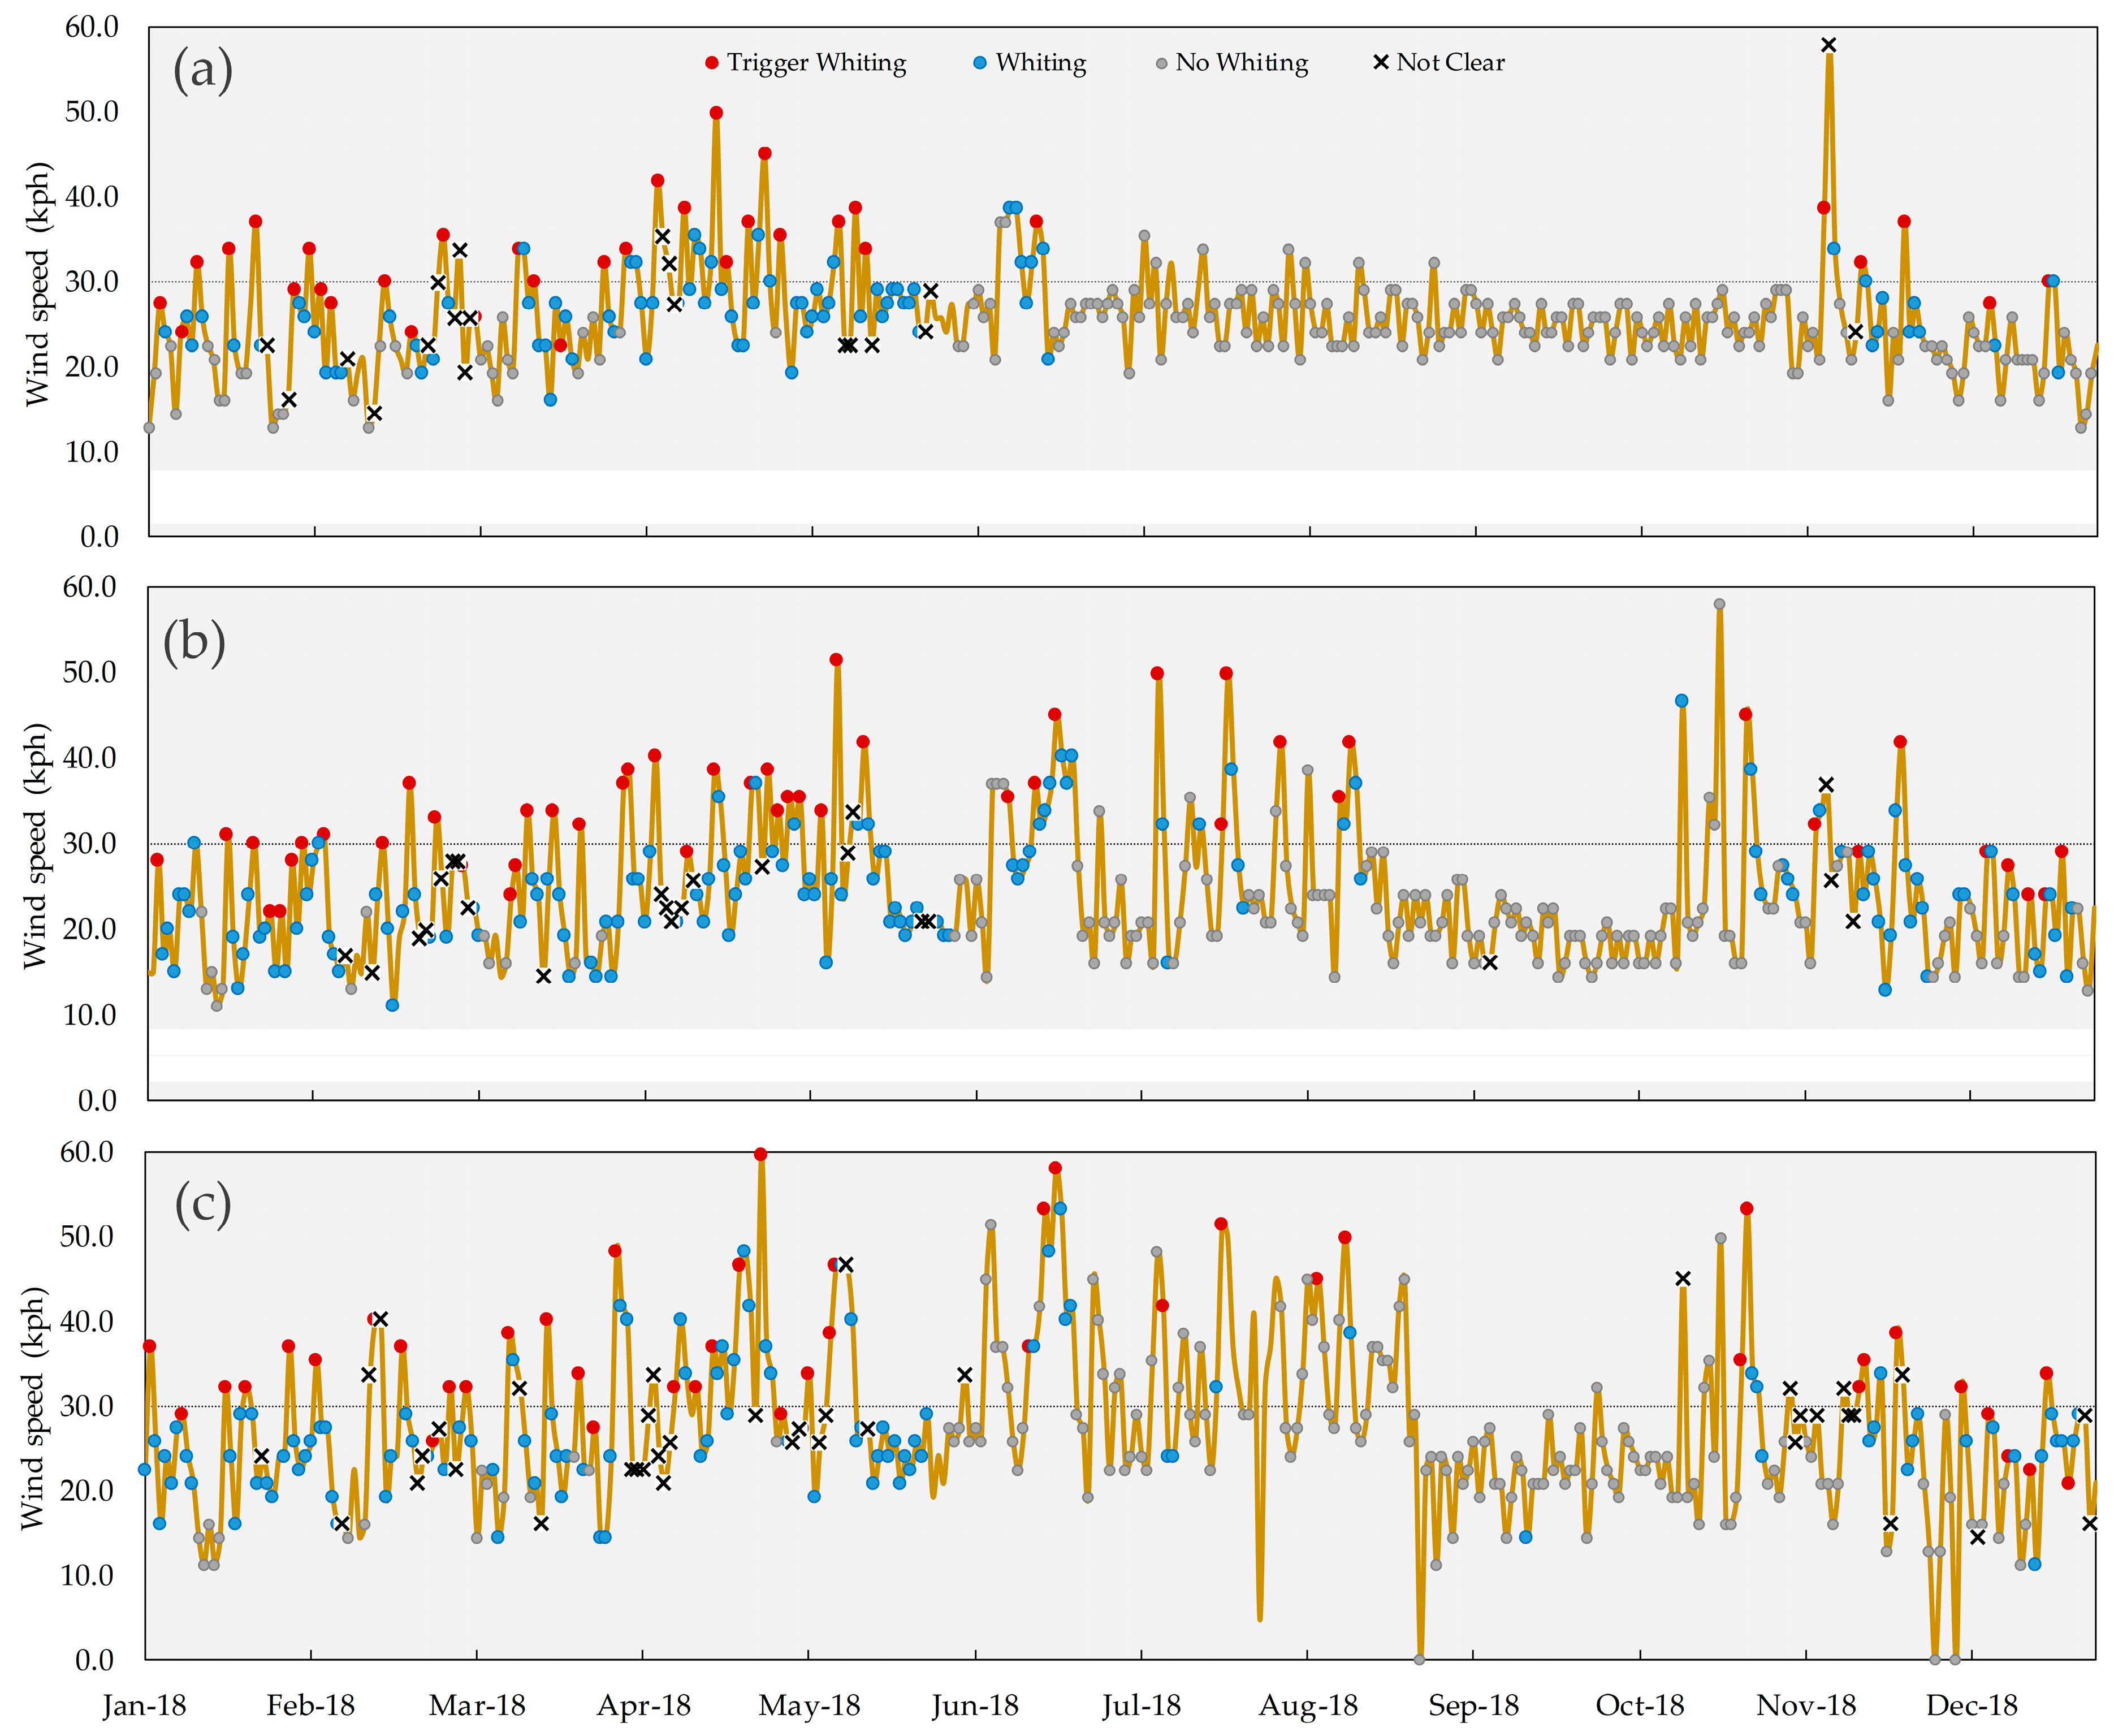
4.2. Wind Speed and Initiation of Whiting Events

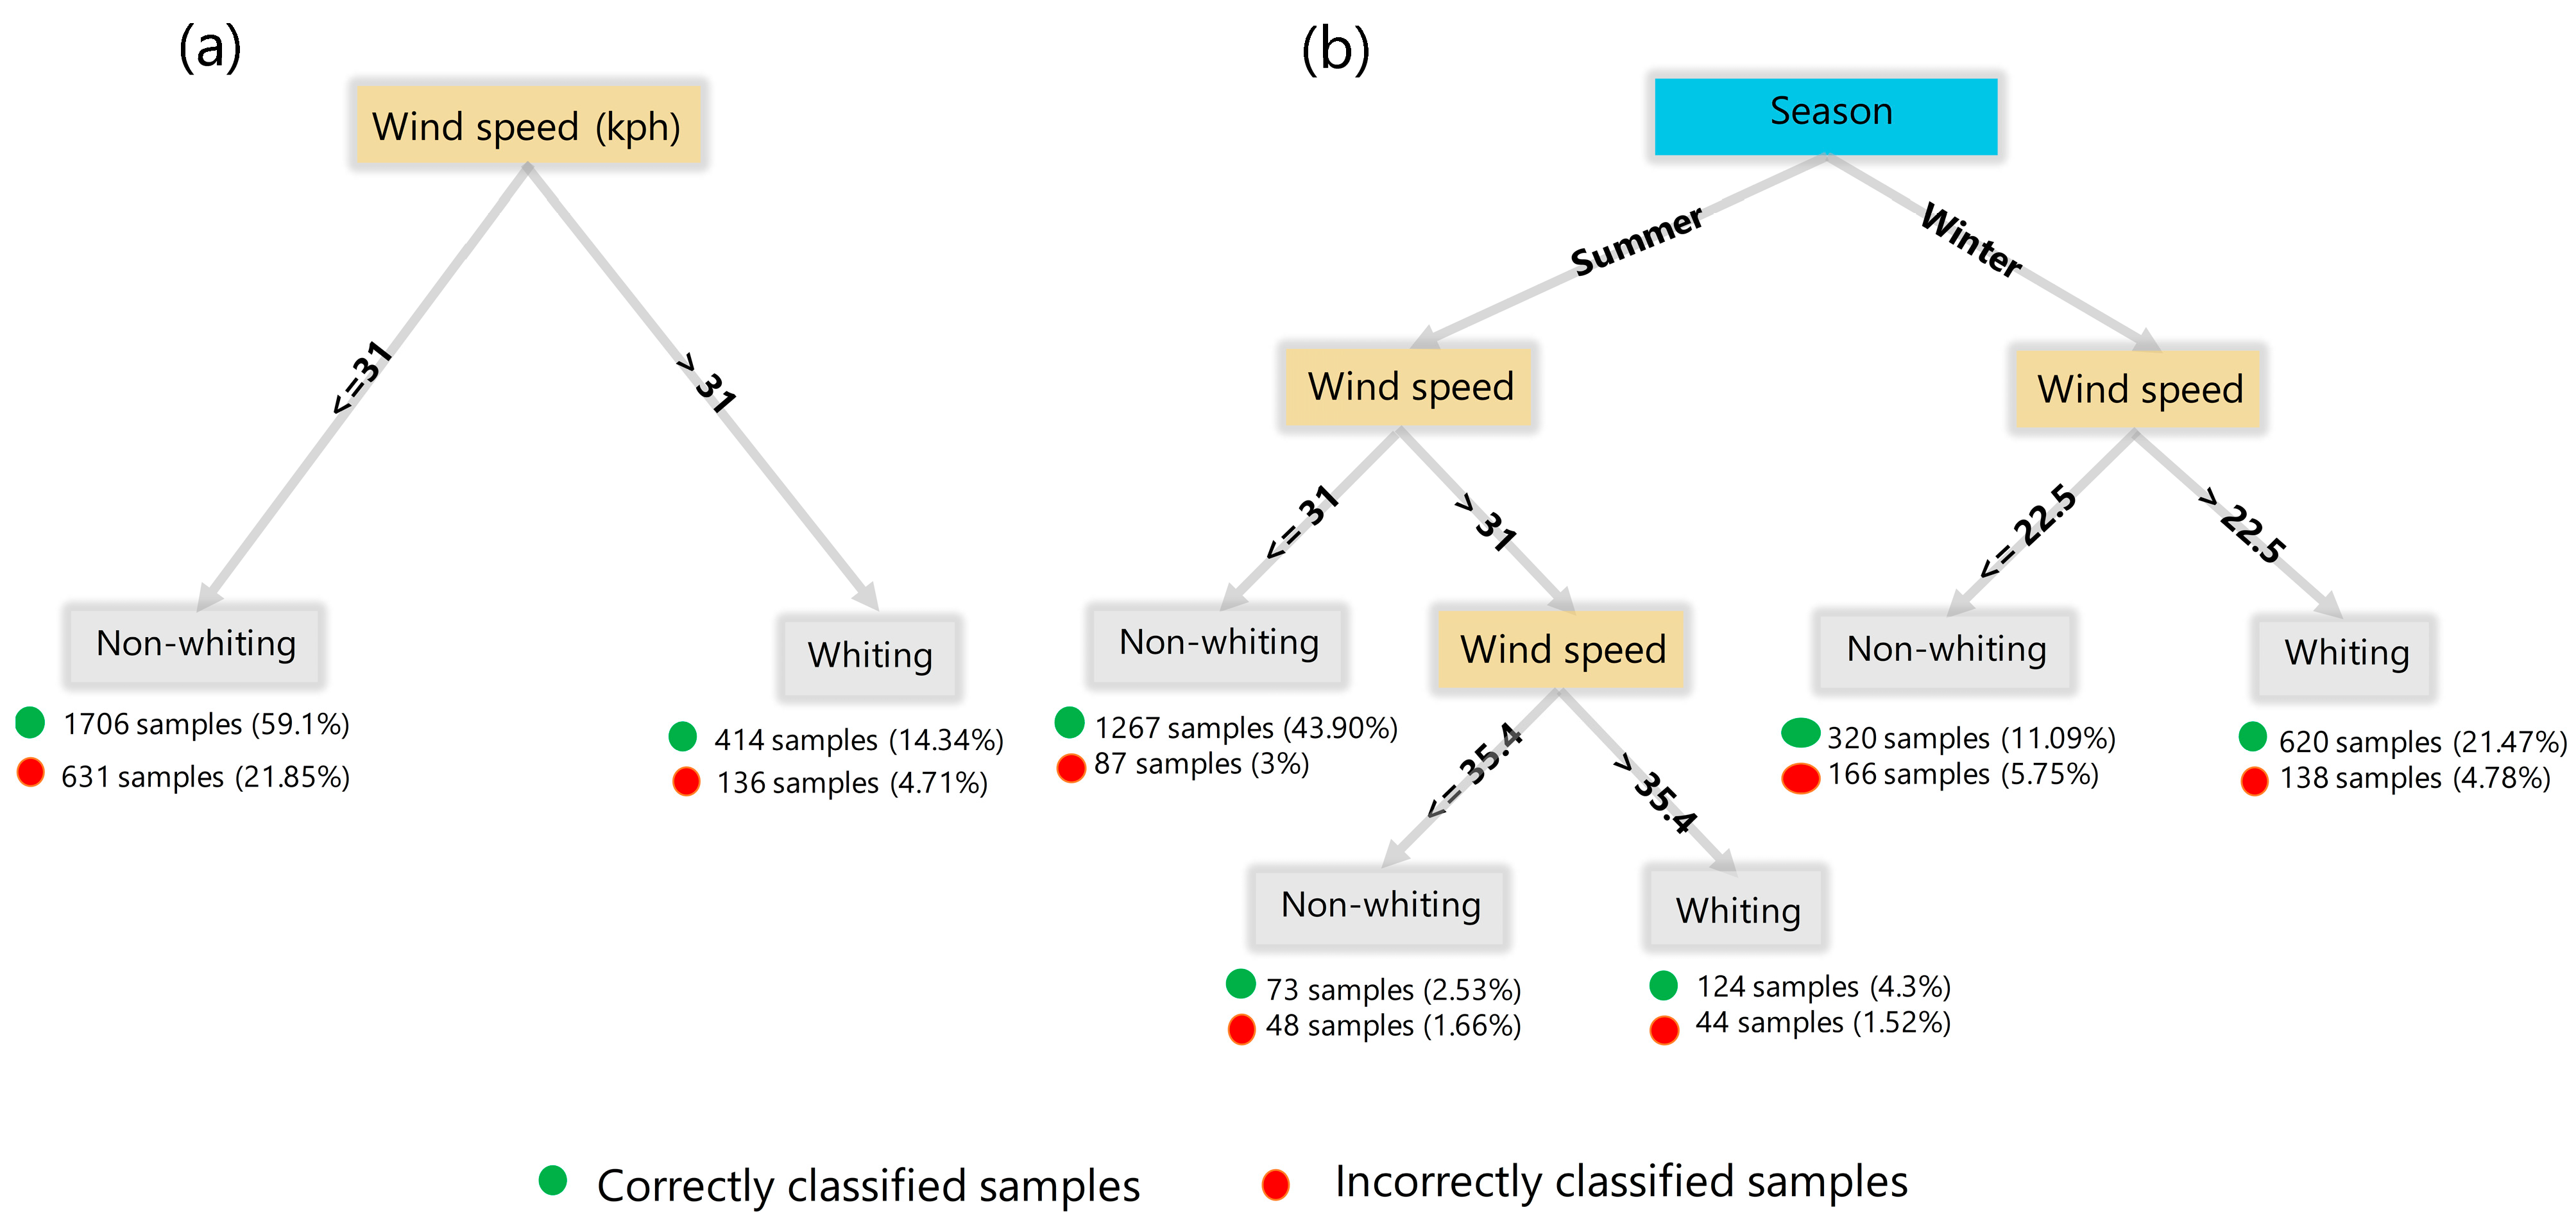
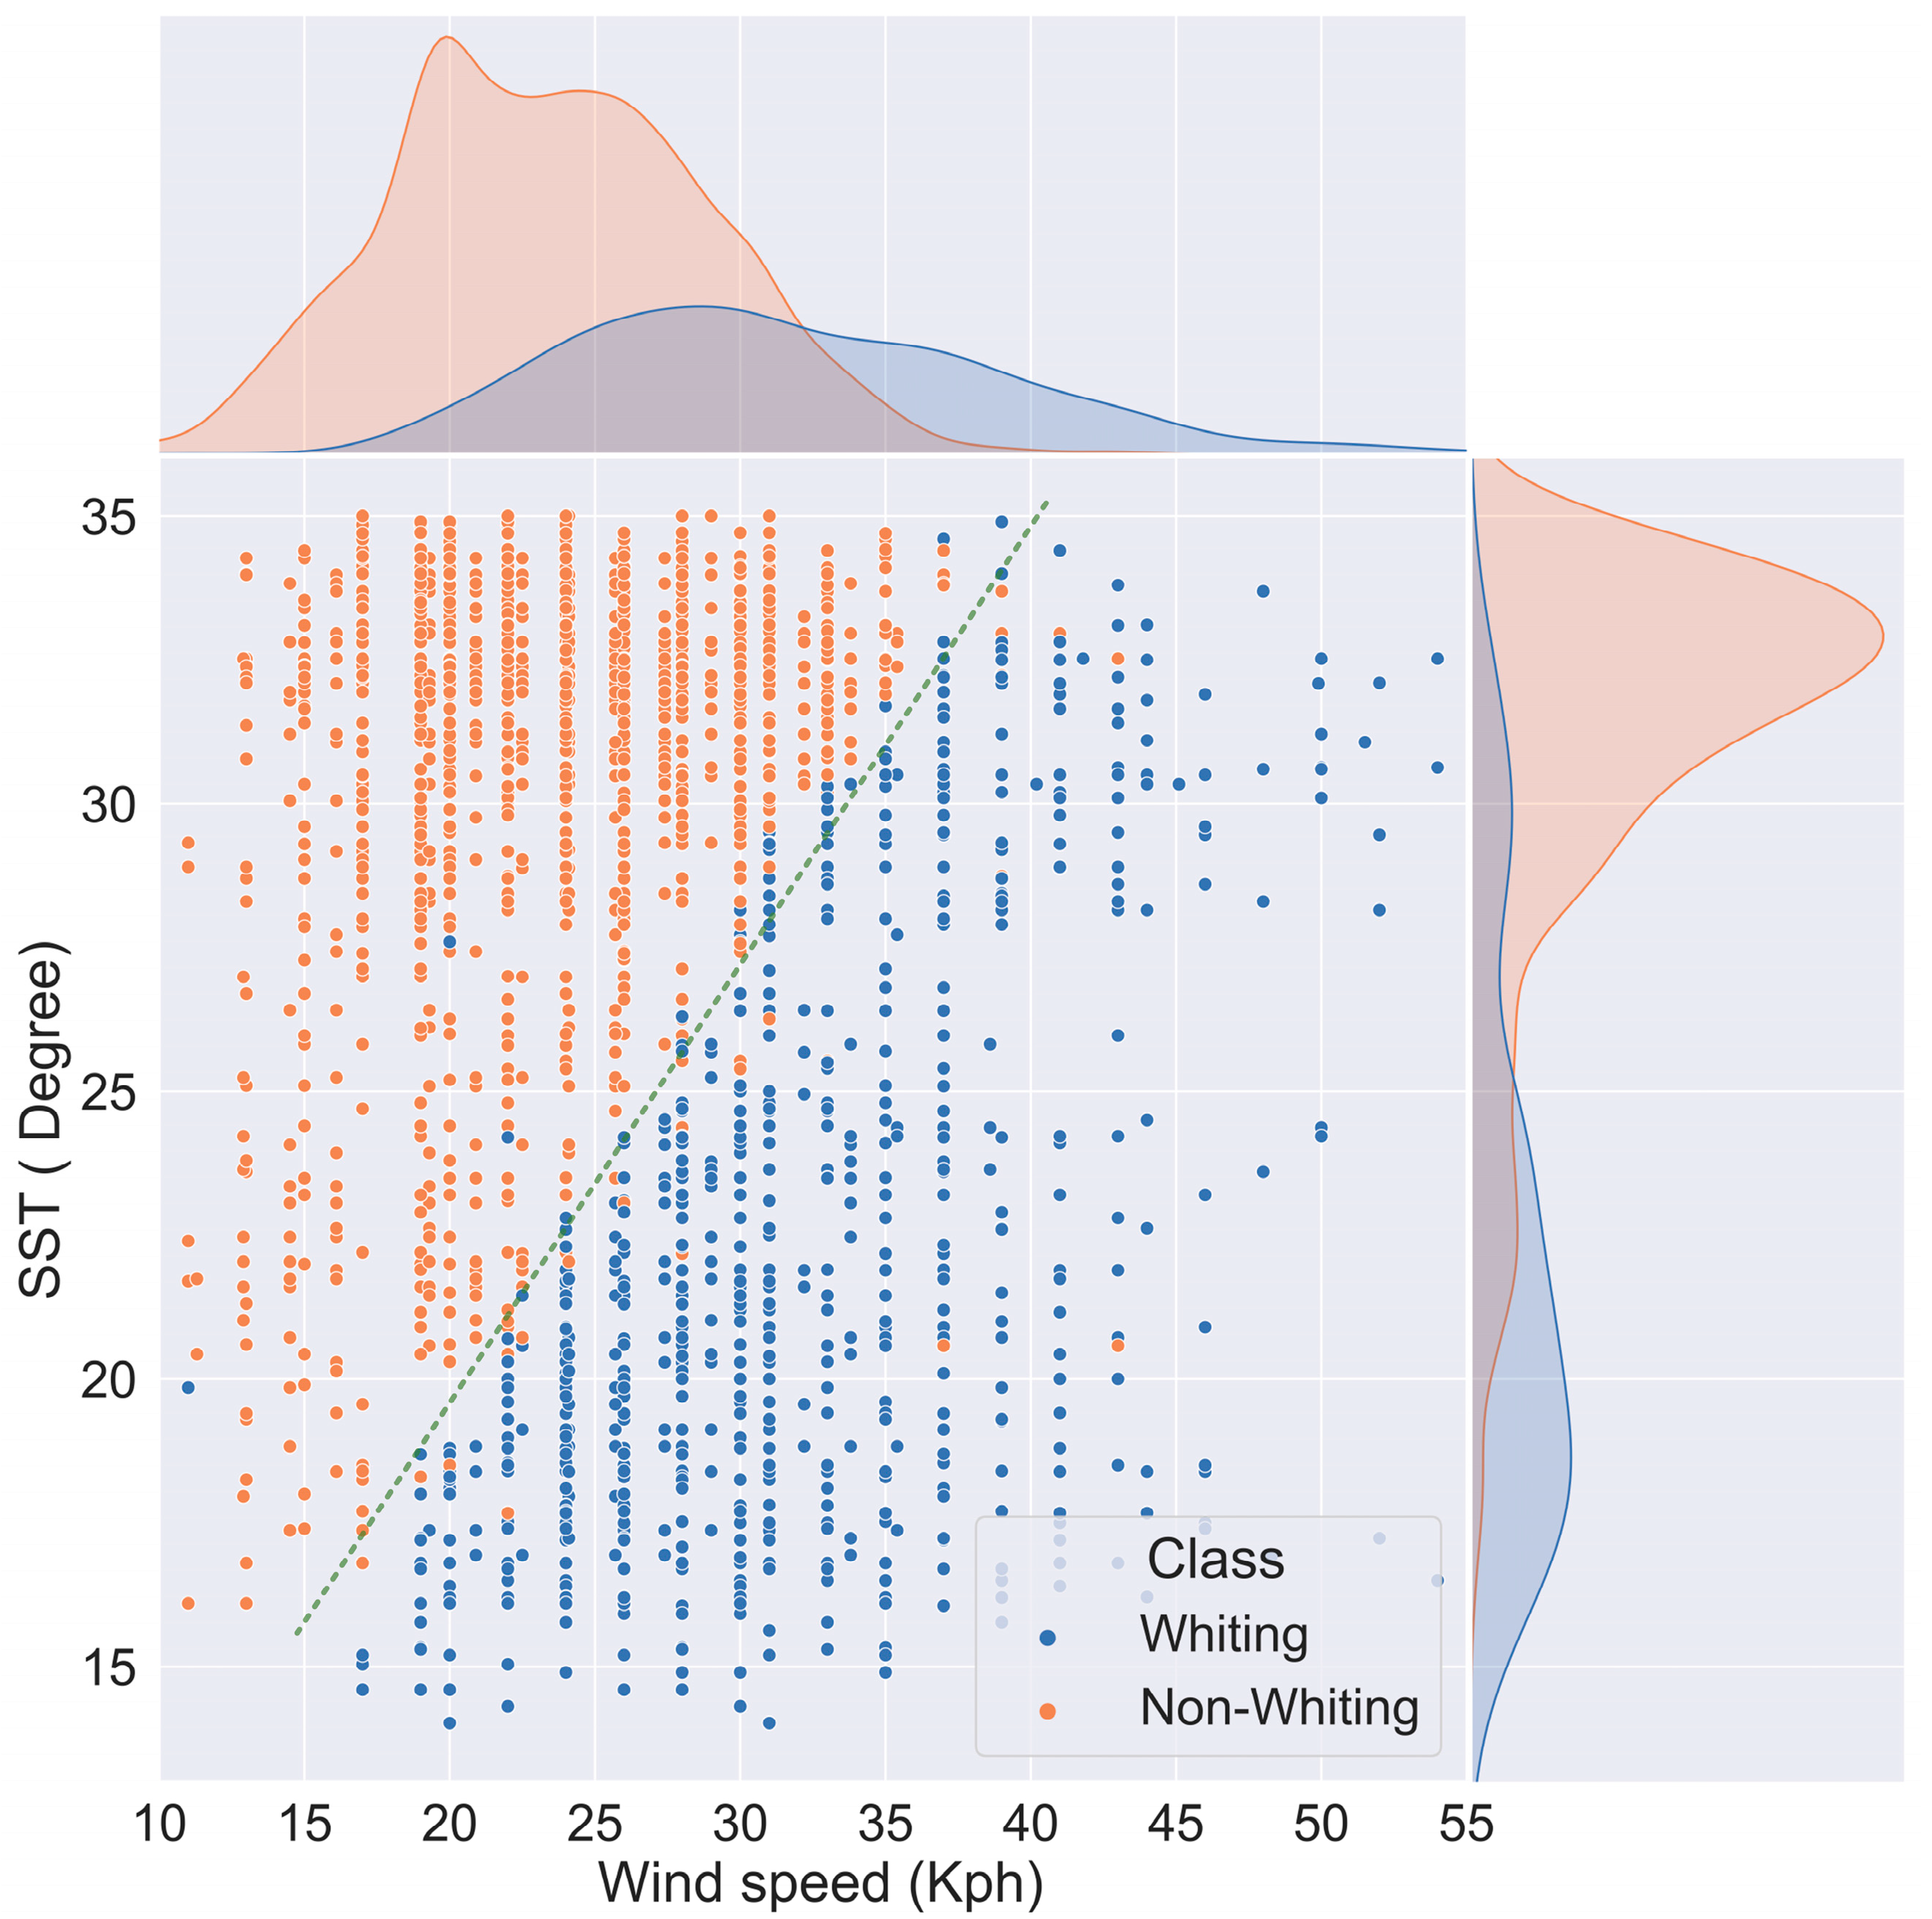
4.2.1. Wind Speed and Whiting

The occurrence of whiting events was confirmed by acquiring and visually categorizing daily Aqua/Terra MODIS images during the study period (2015–2020). Wind conditions prior to and during the observed whiting events were assessed using data from weather stations located near the coasts of the UAE, Qatar, Saudi Arabia, and Kuwait. The acquired wind speed records from various weather stations were used to assess whether whiting in the Gulf occurs as a result of resuspension of CaCO3 sediments by strong winds. Figure 8 shows three whiting events along with the corresponding maximum recorded hourly wind speeds before, during, and after the whiting events. For example, Figure 8a–f depict the intensification of whiting (Figure 8d) as the maximum wind speed (recorded around the coast of Bahrain) increased from 24 km/h (kph) on 01 January 2016 to 52 kph on 03 January 2016.
The appearance and disappearance of a whiting event that lasted for 3–4 days are depicted in Figure 8g–l. Generally, initial high wind (under favorable SST) would trigger a whiting event that could last for few days. Based on our observations, sustaining the whiting events for one or two more days did not require persistent high wind during all days. However, the observed whiting events that lasted for long (i.e., more than four days) might have needed a high wind to contribute to elongating the event. Here, small patches of whiting began to appear (Figure 8h) when wind speed reached 43 km/h. The extent of this whiting remarkably increased 1 day later, as shown in Figure 8j, but began to fade over the next 2 days as the wind subsided. Similarly, a whiting event with massive spatial coverage is shown in Figure 8m–r. A whiting event was triggered as wind speed reached 46 km/h on 11 February 2020 (Figure 8o). This event was extended because wind speed was sustained the next day, resulting in a massive whiting in the following days (Figure 8q).
The analysis of maximum wind speeds related to whiting events in the Gulf indicated that whiting events are typically initiated by high wind speeds. Furthermore, the duration of a whiting event may extend over several days if wind speed is sustained following its initiation. The data in Figure 9 show that whiting events during the winter of 2020 were always triggered and sustained by high wind speeds, as demonstrated by the expanded data for January and February 2020 (Figure 9b).
Although the Gulf is subject to strong winds during summer and winter, whiting events are rare during summer [20]. However, the available data suggest that stronger winds are necessary to initiate whiting events during summer. For example, Figure 10a–l show the MODIS images acquired during summer with no whiting despite the observed high wind speeds that typically initiate whiting during winter. In Figure 10m–r, a whiting event that lasted for nearly 6 days was triggered by wind speeds that reached 50 kph. Other observed summer whiting events were also triggered by high wind speeds exceeding 40 kph, as shown in Figure A1 (Appendix A).

4.2.2. Association of Wind Speed with Whiting Events

To determine whether wind speed is a potential and relevant factor for predicting the occurrence of whiting in the Gulf, a DT classification algorithm was used to classify 2887 samples (consisting of 1045 whiting samples and 1842 non-whiting samples) on the basis of the wind state recorded at different stations around the coast of Abu Dhabi, Qatar, and Saudi Arabia. Figure 11a depicts a DT classification of whiting events based on hourly high-speed winds. The DT algorithm sets a high wind speed value greater than 31 kph as the threshold for categorizing whiting, with 414 samples classified as whiting, 1706 samples classified as non-whiting, and 767 misclassified samples. The high percentage of misclassified samples suggests that wind speed alone cannot be used as a basis for differentiating between whiting and non-whiting events. For example, whiting events mostly occur during winter and are associated with high wind speed. However, high wind speed can also be recorded during summer with no trace of whiting. Moreover, whiting events can last for a few days even while winds are relatively low following their initiation by a high-wind speed event.
The seasonality of whiting events suggests that in addition to wind, the season during which whiting events most frequently occur may be an important factor in classification. Therefore, a new classification method based on high wind speed and season was developed as shown in Figure 11b. The inclusion of season significantly improved overall classification accuracy from 73% to 83% by reducing the number of misclassified samples to 489. From Figure 11b, most whiting events occur during winter (786 days of whiting) compared with 259 events of whiting during summer.
During winter (Figure 11b), high wind speeds above 22.5 kph were associated with nearly 70% of whiting samples compared with 30% of whiting samples for wind speeds below 22.5 kph (these samples can be a continuation of existing whiting events). During summer, whiting occurred in 69% of the samples with wind speeds above 31 kph. However, various samples (approximately 170 samples) demonstrated that wind speeds above 31 kph could not trigger whiting in the Gulf during summer. The classification results clearly indicated that the wind energy that is required to be mixed with the water column during summer to potentially initiate and sustain whiting is higher than the energy needed during winter. The requirement for additional wind energy during summer suggests the possibility of stronger resistance to mixing during this season. Such seasonal resistance to mixing may be related to the stratification of the water column, a summer phenomenon that is well documented in the Gulf [76,77,78]. The heating of the surface layer of the water during summer contributes to the stratification of the water column, which impedes the mixing of the water column and requires stronger wind forces to resuspend sediments and trigger whiting. Consequently, whiting events may be less common during summer in the Gulf [20]. To explore the effect of stratification by using data from satellite images, SST is investigated as an indicator of stratification and resistance to wind-driven mixing in the succeeding section.

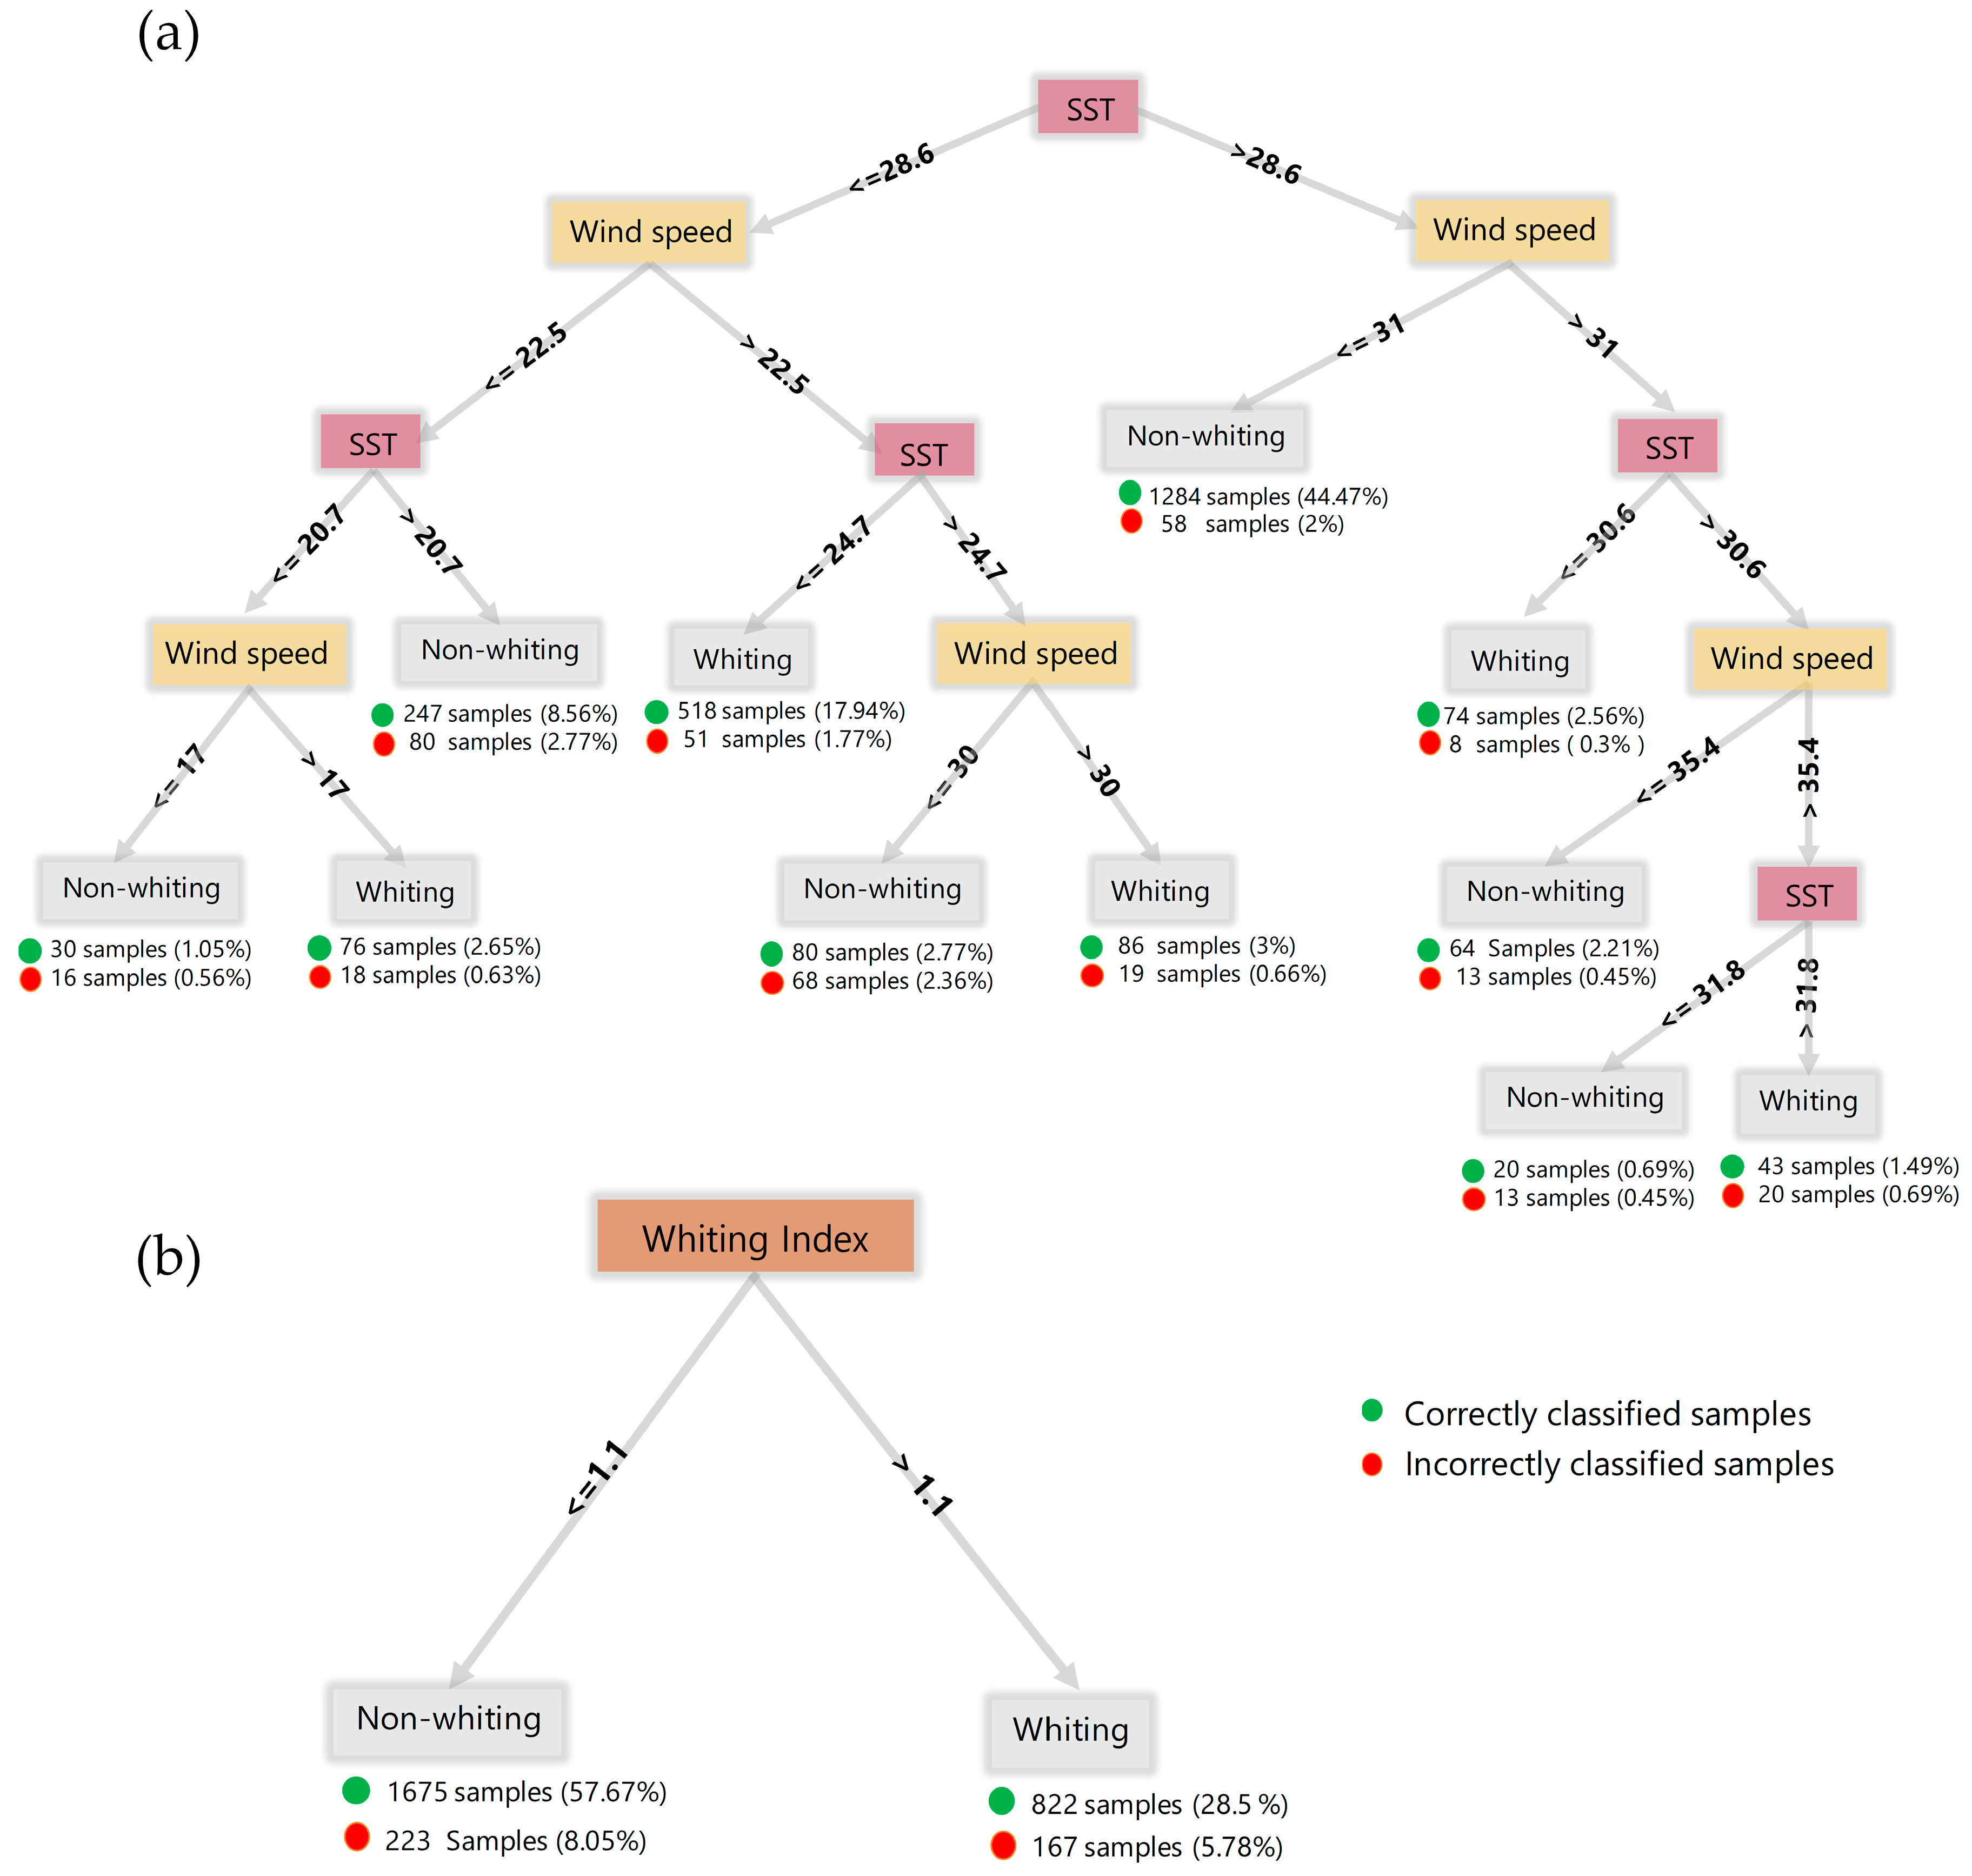
4.3. Classification Results Based on WI

The whiting occurrences corresponding to SST and wind speed (WS) values are depicted in Figure 12. Each point in Figure 12 indicates the presence (blue color) and the absence of whiting (orange color) in the Gulf. Results show that most of the whiting occur during winter (low SST values), while whiting manifestation during summer (high SST values) are less frequent. In addition, the figure shows that relatively low and high wind speeds are, respectively, necessary to initiate whiting during winter (low SST) and summer. Figure 12 shows a clear separation between whiting and non-whiting occurrences as indicated by the separation line. The slope of the line that represents the whiting index (WI) can be used to differentiate between whiting and non-whiting.
To find the threshold value that that differentiate between whiting and non-whiting, the DT classification algorithm was used to classify the generated whiting dataset based on wind speed and SST and using WI. The algorithm in Figure 13a differentiates between summer and winter on the basis of an SST of 28.6 °C, with summer whiting requiring high wind speeds above 31 km/h to occur. By contrast, the classification in Figure 13b indicates that most whiting occur during winter at lower wind speeds compared with that during summer. Reclassifying the data in Figure 13a on the basis of WI (Figure 13b) considerably simplifies the results and groups the data into two categories in accordance with WI. The classification of the selected representative samples (2887 samples) using the WI, presented in Figure 13b, suggests a cutoff WI value of 1.1 for indicating the presence or absence of whiting in the Gulf, with an overall accuracy of approximately 87%.
Moreover, Figure 14 and Figure A2 (Appendix A) illustrates the suitability of WI in pinpointing the beginning of whiting events, and their consecutive days whenever a high wind speed is sustained. Although WI does not represent all the factors that affect mixing in the Gulf, the data indicate that WI provides a simple, efficient, and general indicator of whiting initiation in the Gulf that is based on readily available data.

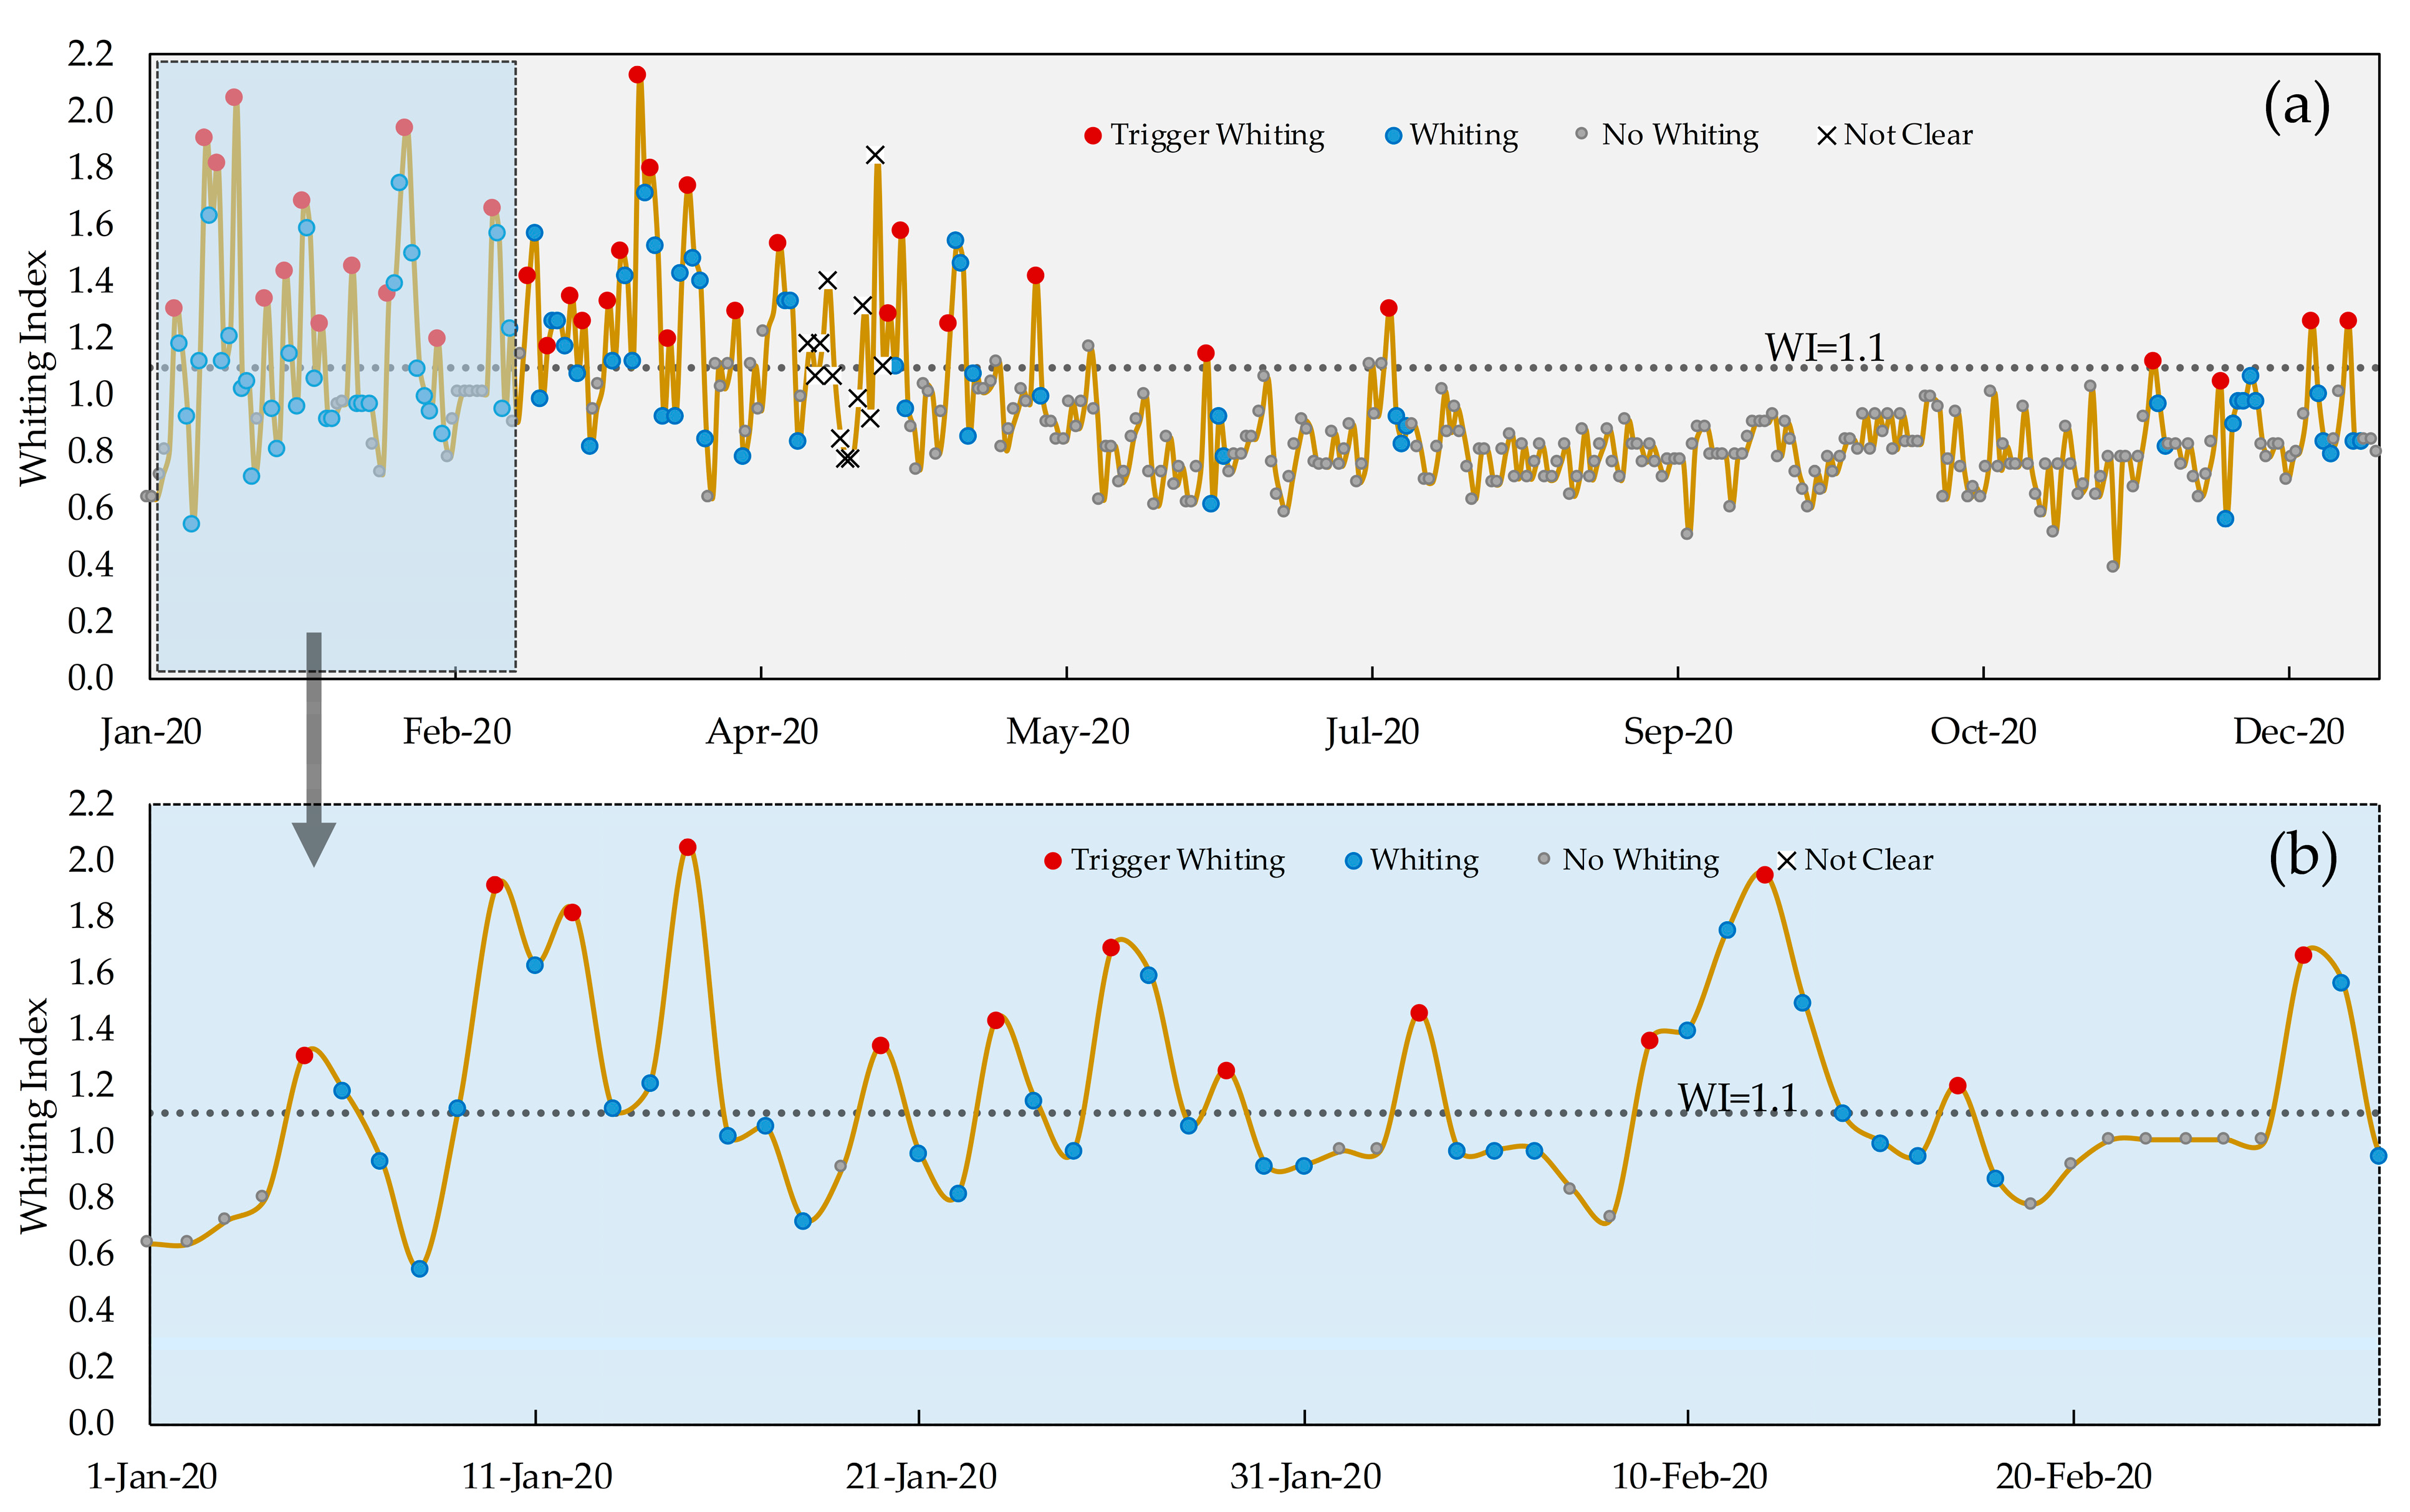
4.4. WI and Extent of Whiting

The analysis of the data in Section 4.3 demonstrated that the WI cutoff value of 1.1 successfully differentiated between whiting and non-whiting events with an overall accuracy of 87%. With wind representing the mixing force and SST representing resistance to mixing associated with thermal stratification, expecting the geographic extent or spread (area) of whiting in the Gulf to increase as WI increases above 1.1 is reasonable. To assess the relationship between the extent of whiting and WI, the former was estimated for several whiting events observed near the shorelines of the UAE and Qatar. As described in Section 3.5, the GEOBIA approach was used to classify cloud-free MODIS images and compute the extent of whiting events. Image segmentation and discriminative feature selection were initially performed. Thereafter, the generated multitemporal image objects were classified using an adaptive boosting ensemble ML algorithm.
Figure 15 depicts the sample classification results of three whiting events. The correlation between the WI and the extent of whiting was assessed, and the results are presented in Figure 16. Evidently, no whiting was observed below a WI of 1.1, and the extent of whiting was considered zero. Above a WI of 1.1, the extent of whiting generally increased with increasing WI. A Pearson correlation coefficient of 0.73 was measured between WI and the extent of whiting along the UAE and Qatar coastlines in the Gulf. Moreover, the p-value of the regression correlation was less than 0.001, which indicates a statistically significant correlation at a confidence level of 99%.
Previous studies on whiting in the Gulf are limited Wells and Illing [20] suggested that the substantial increase in phytoplankton populations may trigger whitings (carbonate precipitation) through the expulsion of carbon dioxide by phytoplanktonic organisms. The water in the Gulf is substantially richer in nutrients and has higher temperature and salinity compared with the great Bahamas water. Thus, Morse and He [28] argued that the presence of whitings in the Gulf is most likely due to the direct nucleation of calcium carbonate in waters with reduced P co 2   linked with phytoplankton blooms considering the possible occurrence of calcium carbonate could nucleation in the Great Bahama Bank. Kendall et al. [29] associated whiting events in the Gulf with winds above 25 mi/h (40 km/h). The current study highlighted that major whiting events generally occur in the winter season and are accompanied by high-speed wind and proposed a WI for detecting and estimating the extent of whiting in the Gulf. The data and analyses presented in this study may suggest that high-speed winds possibly contribute to triggering whiting through the suspension of previously deposited CaCO3 sediments. Moreover, summer thermal stratification, which is associated with the heating up of the surface water layer, resists mixing in the shallow coastal southern and southwestern areas of the Gulf. Furthermore, the analysis presented in this study may suggest that direct precipitation of CaCO3 may not be the leading cause of whiting due to the infrequent occurrence of whiting events during summer despite favorable conditions for CaCO3 precipitation. However, whiting formations may result from multiple driving forces, which would explain different findings presented in previous whiting studies. The lack of field data hinders a definite conclusion regarding the direct precipitation mechanism and initiation of whiting in the Gulf.

5. Conclusions

The current study investigated potential triggering mechanisms that might account for whiting occurrences in the Gulf. Spatiotemporal analyses of potential factors (i.e., wind speed, SST, seasonality, SSS, and estimated aragonite saturation index) that lead to the initiation of whiting in the Gulf were conducted using data collected during the period of 2015–2020. The results showed that the areas of the Gulf that are prone to whiting exhibited the highest estimated CaCO3 saturation indices. High winter wind speeds were found to be associated with whiting events in the Gulf, while similar summer wind speeds were inconsistently linked to infrequent summer whiting events. Consequently, resistance to wind mixing due to the stratification of the water column during summer was proposed to potentially explain the requirement for higher speed summer winds to trigger whiting. A whiting index (WI) based on the ratio of the maximum wind speed to SST (wind/SST) was used as a generic indicator that represents the driving mixing force and resistance to the mixing of the water column in shallow areas prone to whiting in the Gulf. In the WI, SST represents the heating and cooling of the surface waters of the Gulf, which are associated with stratification during summer and the disappearance of stratification during winter. WI was proven to be a simple yet effective approach for identifying wind and SST conditions that were associated with the initiation of whiting events (i.e., WI > 1.1) and for representing the extent of whiting in the Gulf. The occurrences of whiting in the Gulf require further investigation. The contribution of this study help in explaining the potential cause of extensive whiting occurrences in the Gulf. If verified, the proposed whiting triggering mechanism may have implications in terms of understanding the recirculation of nutrients and sediments that play an essential role in shaping the ecosystem of the shallow regions of the Gulf.

Author Contributions

Conceptualization, A.S., R.A.-R., M.B.A.G., and M.A.K.; methodology, A.S., R.A.-R., M.B.A.G., M.A.K., A.G.Y., M.A.I., and C.F.; formal analysis, A.S., R.A.-R., M.B.A.G., M.A.K., S.A.-M., A.G.Y., M.A.I., and C.F.; data curation, A.S., R.A.-R., M.B.A.G., and M.A.K.; writing—original draft preparation, A.S., R.A.-R., M.B.A.G., and M.A.K.; writing—review and editing, A.S., R.A.-R., M.B.A.G., M.A.K., S.A.-M., A.G.Y., M.A.I., and C.F.; visualization, A.S., R.A.-R., M.B.A.G., and M.A.K. All authors have read and agreed to the published version of the manuscript.

Funding

This research received no external funding.

Conflicts of Interest

The authors declare no conflict of interest.

Appendix A

Figure A1. Whiting initiation and maximum daily wind speed recorded at different stations around the coast of (a) Abu Dhabi, (b) Qatar, and (c) Saudi Arabia.
Remotesensing 13 04795 g0a1
Figure A2. WI overlaid with whiting records over the Arabian Gulf in 2018 at different locations around the coast of (a) Abu Dhabi, (b) Qatar, and (c) Saudi Arabia.
Remotesensing 13 04795 g0a2

References

  1. Larson, E.B.; Mylroie, J.E. A review of whiting formation in the Bahamas and new models. Carbonates Evaporites 2014, 29, 337–347. [Google Scholar] [CrossRef]
  2. Cloud, P.E., Jr.; Blackmon, P.D.; Sisler, F.D.; Kramer, H.; Carpenter, J.H.; Robertson, E.C.; Sykes, L.R.; Newell, M. Environment of Calcium Carbonate Deposition West of Andros Island, Bahamas; U.S. Geological Survey Professional Papers. 1962. Available online: https://bit.ly/3DSOSNi (accessed on 16 August 2021).
  3. Bustos-Serrano, H.; Morse, J.W.; Millero, F.J. The formation of whitings on the Little Bahama Bank. Mar. Chem. 2009, 113, 1–8. [Google Scholar] [CrossRef]
  4. Shinn, E.A.; Steinen, R.P.; Lidz, B.H.; Halley, R.B. Bahamian Whitings—No Fish Story. Am. Assoc. Pet. Geol. Bull. 1985, 69, 307. [Google Scholar]
  5. Purkis, S.; Cavalcante, G.; Rohtla, L.; Oehlert, A.M.; Harris, P.; Swart, P.K. Hydrodynamic control of whitings on Great Bahama Bank. Geology 2017, 45, 939–942. [Google Scholar] [CrossRef]
  6. Acker, J.G.; Brown, C.W.; Hine, A.C.; Armstrong, E.; Kuring, N. Satellite remote sensing observations and aerial photography of storm-induced neritic carbonate transport from shallow carbonate platforms. Int. J. Remote Sens. 2002, 23, 2853–2868. [Google Scholar] [CrossRef]
  7. Turpin, M.; Emmanuel, L.; Reijmer, J.J.G.; Renard, M. Whiting-related sediment export along the Middle Miocene carbonate ramp of Great Bahama Bank. Int. J. Earth Sci. 2011, 100, 1875–1893. [Google Scholar] [CrossRef] [Green Version]
  8. Long, J.; Hu, C.; Robbins, L. Whiting events in SW Florida coastal waters: A case study using MODIS medium-resolution data. Remote Sens. Lett. 2014, 5, 539–547. [Google Scholar] [CrossRef]
  9. Long, J.S.; Hu, C.; Wang, M. Long-term spatiotemporal variability of southwest Florida whiting events from MODIS observations. Int. J. Remote Sens. 2018, 39, 906–923. [Google Scholar] [CrossRef]
  10. Long, J.S.; Hu, C.; Robbins, L.L.; Byrne, R.H.; Paul, J.H.; Wolny, J.L. Optical and biochemical properties of a southwest Florida whiting event. Estuar. Coast. Shelf Sci. 2017, 196, 258–268. [Google Scholar] [CrossRef]
  11. Sondi, I.; Juračić, M. Whiting events and the formation of aragonite in Mediterranean karstic marine lakes: New evidence on its biologically induced inorganic origin. Sedimentology 2010, 57, 85–95. [Google Scholar] [CrossRef]
  12. Thompson, J.B. Microbial Whitings. In Microbial Sediments; Riding, R., Awramik, S.M., Eds.; Springer: Berlin/Heidelberg, Germany, 2000; pp. 250–260. [Google Scholar]
  13. Brunskill, G.J.; Ludlam, S.D. Fayetteville Green Lake, New York. I. Physical and Chemical Limnology. Limnol. Oceanogr. 1969, 14, 817–829. [Google Scholar] [CrossRef]
  14. Binding, C.E.; Greenberg, T.A.; Watson, S.B.; Rastin, S.; Gould, J. Long term water clarity changes in North America’s Great Lakes from multi-sensor satellite observations. Limnol. Oceanogr. 2015, 60, 1976–1995. [Google Scholar] [CrossRef]
  15. Effler, S.W.; Perkins, M.G.; Greer, H.; Johnson, D.L. Effect of “Whiting” on Optical Properties and Turbidity in Owasco Lake, New York. JAWRA J. Am. Water Resour. Assoc. 1987, 23, 189–196. [Google Scholar] [CrossRef]
  16. Barbiero, R.P.; Tuchman, M.L.; Millard, E.S. Post-dreissenid increases in transparency during summer stratification in the offshore waters of Lake Ontario: Is a reduction in whiting events the cause? J. Great Lakes Res. 2006, 32, 131–141. [Google Scholar] [CrossRef]
  17. Hodell, D.A.; Schelske, C.L.; Fahnenstiel, G.L.; Robbins, L.L. Biologically induced calcite and its isotopic composition in Lake Ontario. Limnol. Oceanogr. 1998, 43, 187–199. [Google Scholar] [CrossRef]
  18. Peng, F.; Effler, S.W. Characterizations of the light-scattering attributes of mineral particles in Lake Ontario and the effects of Whiting. J. Great Lakes Res. 2011, 37, 672–682. [Google Scholar] [CrossRef]
  19. Effler, S.W. Importance of Whiting As a Component of Raw Water Turbidity. J. Am. Water Work. Assoc. 1987, 79, 80–82. [Google Scholar] [CrossRef]
  20. Wells, A.J.; Illing, L.V. Present-day precipitation of calcium carbonate in the persian gulf. In Developments in Sedimentology; Elsevier: Amsterdam, The Netherlands, 1964; Available online: https://www.jstor.org/stable/73293 (accessed on 16 August 2021).
  21. Shanableh, A.; Al-Ruzouq, R.; Al-Khayyat, G. Assessing the spatial and temporal capacity of a semi-enclosed gulf to absorb and release CO2 Using GIS and Remote Sensing. In Proceedings of the Global Civil Engineering Conference, Kuala Lumpur, Malaysia, 25–28 July 2017; pp. 1161–1173. [Google Scholar]
  22. Shanableh, A.; Al-Ruzouq, R.; Gibril, M.B.A.; Flesia, C.; AL-Mansoori, S. Spatiotemporal mapping and monitoring of whiting in the semi-enclosed Gulf using Moderate Resolution Imaging Spectroradiometer (MODIS) time series images and a generic ensemble tree-based model. Remote Sens. 2019, 11, 1193. [Google Scholar] [CrossRef] [Green Version]
  23. Morse, J.W.; He, S. Influence of T, S and PCO2 on the homogeneous nucleation of calcium carbonate from seawater. Implications for whiting formation. Mar. Chem. 1993, 41, 291–298. [Google Scholar] [CrossRef]
  24. Black, M. The Precipitation of Calcium Carbonate on the Great Bahama Bank. Geol. Mag. 1933, 70, 455–466. [Google Scholar] [CrossRef]
  25. Friedman, G.M. Biochemical and ultrastructural evidence for the origin of whitings: A biologically induced calcium carbonate precipitation mechanism: Comment and reply. Geology 1993, 21, 287–288. [Google Scholar] [CrossRef]
  26. Shinn, E.A.; Steinen, R.P.; Lidz, B.H.; Swart, P.K. Whitings, a Sedimentologic Dilemma. J. Sediment. Petrol. 1989, 59, 147–161. [Google Scholar] [CrossRef]
  27. Robbins, L.L.; Blackwelder, P.L. Biochemical and ultrastructural evidence for the origin of whiting: A biologically induced calcium carbonate precipitation mechanism. Geology 1992, 20, 464–468. [Google Scholar] [CrossRef]
  28. Robbins, L.L.; Yates, K.K.; Shinn, G.; Blackwelder, P. Whiting on the great Bahama bank: A microscopic solution to a macroscopic mystery. Bahamas J. Sci. 1996, 4, 2–6. [Google Scholar]
  29. Kendall, C.G.S.C.; Shinn, G.; Janson, X. Holocene Cyanobacterial Mats and Lime Muds: Links to Middle East Carbonate Source Rock Potential. In Proceedings of the AAPG/SEPM Annual Meeting, Long Beach, CA, USA, 1–4 April 2007. [Google Scholar]
  30. Yates, K.K.; Robbins, L.L. Production of carbonate sediments by a unicellular green alga. Am. Mineral. 1998, 83, 1503–1509. [Google Scholar] [CrossRef]
  31. Boss, S.K.; Neumann, A.C. Physical versus chemical processes of “whiting” formation in the Bahamas. Carbonates Evaporites 1993, 8, 135–148. [Google Scholar] [CrossRef]
  32. Dierssen, H.M.; Zimmerman, R.C.; Burdige, D.J. Optics and remote sensing of Bahamian carbonate sediment whitings and potential relationship to wind-driven Langmuir circulation. Biogeosciences 2009, 6, 487–500. [Google Scholar] [CrossRef] [Green Version]
  33. Robbins, L.L.; Tao, Y.; Evans, C.A. Temporal and spatial distribution of whitings on Great Bahama Bank and a new lime mud budget. Geology 1997, 25, 947–950. [Google Scholar] [CrossRef]
  34. Morse, J.W.; Gledhill, D.K.; Millero, F.J. Caco3 precipitation kinetics in waters from the great Bahama bank: Implications for the relationship between bank hydrochemistry and whitings. Geochim. Cosmochim. Acta 2003, 67, 2819–2826. [Google Scholar] [CrossRef]
  35. Rossmann, R. Inorganic Chemistry of Particulate Matter from the Nearshore Zone of Lake Michigan. J. Great Lakes Res. 1980, 6, 348–352. [Google Scholar] [CrossRef]
  36. Strong, A.E.; Eadie, B.J. Satellite observations of calcium carbonate precipitation in the Great Lakes. Limnol. Ocean. 1978, 23, 877–887. [Google Scholar] [CrossRef]
  37. Thompson, J.B.; Schultze-Lam, S.; Beveridge, T.J.; Des Marais, D.J. Whiting events: Biogenic origin due to the photosynthetic activity of cyanobacterial picoplankton. Limnol. Oceanogr. 1997, 42, 133–141. [Google Scholar] [CrossRef]
  38. Thompson, J.B.; Ferris, F.G. Cyanobacterial precipitation of gypsum, calcite, and magnesite from natural alkaline lake water. Geology 1990, 18, 995–998. [Google Scholar] [CrossRef]
  39. Thompson, J.B.; Ferris, F.G.; Smith, D.A. Geomicrobiology and sedimentology of the mixolimnion and chemocline in Fayetteville Green Lake, New York. Palaios 1990, 5, 52–75. [Google Scholar] [CrossRef]
  40. Weidemann, A.D.; Bannister, T.T.; Effler, S.W.; Johnson, D.L. Particulate and optical properties during CaCO3 precipitation in Otisco Lake. Limnol. Oceanogr. 1985, 30, 1078–1083. [Google Scholar] [CrossRef]
  41. Hodell, D.A.; Schelske, C.L. Production, sedimentation, and isotopic composition of organic matter in Lake Ontario. Limnol. Oceanogr. 1998, 43, 200–214. [Google Scholar] [CrossRef]
  42. Effler, S.W.; Field, S.D.; Quirk, M. The seasonal cycle of inorganic carbon species in Cazenovia Lake, New York, 1977. Freshw. Biol. 1982, 12, 139–147. [Google Scholar] [CrossRef]
  43. Effler, S.W. Carbonate Equilibria and the Distribution of Inorganic Carbon in Saginaw Bay. J. Great Lakes Res. 1984, 10, 3–14. [Google Scholar] [CrossRef]
  44. Brunskill, G.J. Fayetteville Green Lake, New York. II. Precipitation and Sedimentation of Calcite in a Meromictic Lake with Laminated Sediments. Limnol. Oceanogr. 1969, 14, 830–847. [Google Scholar] [CrossRef]
  45. Effler, S.W.; Johnson, D.L. Calcium Carbonate Precipitation and Turbidity Measurements in Otisco Lake, New York. J. Am. Water Resour. Assoc. 1987, 23, 73–79. [Google Scholar] [CrossRef]
  46. Cristini, P.A.; Tietze, E.; De Francesco, C.G.; Martínez, D.E. Water geochemistry of shallow lakes from the southeastern Pampa plain, Argentina and their implications on mollusk shells preservation. Sci. Total Environ. 2017, 603–604, 155–166. [Google Scholar] [CrossRef] [PubMed]
  47. Schelske, C.L. Historical nutrient enrichment of Lake Ontario: Paleolimnological evidence. Can. J. Fish. Aquat. Sci. 1991, 48, 1529–1538. [Google Scholar] [CrossRef]
  48. Plée, K.; Pacton, M.; Ariztegui, D. Discriminating the role of photosynthetic and heterotrophic microbes triggering low-Mg calcite precipitation in freshwater biofilms (Lake Geneva, Switzerland). Geomicrobiol. J. 2010, 27, 391–399. [Google Scholar] [CrossRef]
  49. Nouchi, V.; Kutser, T.; Wüest, A.; Müller, B.; Odermatt, D.; Baracchini, T.; Bouffard, D. Resolving biogeochemical processes in lakes using remote sensing. Aquat. Sci. 2019, 81, 27. [Google Scholar] [CrossRef] [Green Version]
  50. Shanableh, A.; Imteaz, M.; Hamad, K.; Omar, M.; Merabtene, T.; Siddique, M. Potential impact of global warming on whiting in a semi-enclosed gulf. Int. J. Glob. Warm. 2017, 13, 411–425. [Google Scholar] [CrossRef]
  51. Curl, H.; Hill, M.N. The Sea: Ideas and Observations on Progress in the Study of the Seas. Ecology 1964, 45, 664. [Google Scholar] [CrossRef]
  52. Alsharhan, A.S.; Kendall, C.G.S.C. Holocene coastal carbonates and evaporites of the southern Arabian Gulf and their ancient analogues. Earth-Sci. Rev. 2003, 61, 191–243. [Google Scholar] [CrossRef]
  53. Kendall, C. Geomorphology of a recent shallow-water carbonate province: Khor Al Bazam, Trucial Coast, southwest Persian Gulf. Geol. Soc. Am. Bull. 1969, 80, 865–892. [Google Scholar] [CrossRef]
  54. Evans, G. The Arabian Gulf: A Modern Carbonate-evaporite factory; a review. J. Iber. Geol. An Int. Publ. Earth Sci. 1995, 19, 61–96. [Google Scholar]
  55. Kinsman, D.J.J. The Persian Gulf (Holocene carbonate sedimentation and diagenesis in a shallow epicontinental sea). Sediment. Geol. 1975, 13, 234–235. [Google Scholar] [CrossRef]
  56. Noori, R.; Tian, F.; Berndtsson, R.; Abbasi, M.R.; Naseh, M.V.; Modabberi, A.; Soltani, A.; Kløve, B. Recent and future trends in sea surface temperature across the persian gulf and gulf of Oman. PLoS ONE 2019, 14, e0212790. [Google Scholar] [CrossRef]
  57. Alosairi, Y.; Alsulaiman, N.; Rashed, A.; Al-Houti, D. World record extreme sea surface temperatures in the northwestern Arabian/Persian Gulf verified by in situ measurements. Mar. Pollut. Bull. 2020, 161, 111766. [Google Scholar] [CrossRef]
  58. NASA Goddard Space Flight Center, Ocean Ecology Laboratory, Ocean Biology Processing Group. Moderate-resolution Imaging Spectroradiometer (MODIS) Aqua Photosynthetically Available Radiation Data; 2018 Reprocessing. Available online: https://go.nasa.gov/3DTw1kV (accessed on 16 August 2021).
  59. Sheppard, C.; Loughland, R. Coral mortality and recovery in response to increasing temperature in the southern Arabian Gulf. Aquat. Ecosyst. Health Manag. 2002, 5, 395–402. [Google Scholar] [CrossRef]
  60. Sheppard, C.; Al-Husiani, M.; Al-Jamali, F.; Al-Yamani, F.; Baldwin, R.; Bishop, J.; Benzoni, F.; Dutrieux, E.; Dulvy, N.K.; Durvasula, S.R.V.; et al. The Gulf: A young sea in decline. Mar. Pollut. Bull. 2010, 60, 13–38. [Google Scholar] [CrossRef]
  61. Buchanan, J.R.; Krupp, F.; Burt, J.A.; Feary, D.A.; Ralph, G.M.; Carpenter, K.E. Living on the edge: Vulnerability of coral-dependent fishes in the Gulf. Mar. Pollut. Bull. 2016, 105, 480–488. [Google Scholar] [CrossRef]
  62. Hereher, M.E. Assessment of climate change impacts on sea surface temperatures and sea level rise—The Arabian Gulf. Climate 2020, 8, 50. [Google Scholar] [CrossRef] [Green Version]
  63. Johns, W.E.; Jacobs, G.A.; Kindle, J.C.; Murray, S.P.; Carron, M. Arabian Marginal Seas and Gulfs; University of Miami RSMAS Technical Report. 1999. Available online: https://bit.ly/3DVZNWj (accessed on 16 August 2021).
  64. Naser, H. Marine Ecosystem Diversity in the Arabian Gulf: Threats and Conservation. In Biodiversity—The Dynamic Balance of the Planet; Grillo, O., Ed.; InTech Publishing: Rijeka, Croatia, 2014; pp. 297–328. [Google Scholar]
  65. Hassanzadeh, S.; Hosseinibalam, F.; Rezaei-Latifi, A. Numerical modelling of salinity variations due to wind and thermohaline forcing in the Persian Gulf. Appl. Math. Model. 2011, 35, 1512–1537. [Google Scholar] [CrossRef]
  66. Swift, S.A.; Bower, A.S. Formation and circulation of dense water in the Persian/Arabian Gulf. J. Geophys. Res. Ocean. 2003, 108, 3004. [Google Scholar] [CrossRef]
  67. Perrone, T.J. Winter Shamal in the Persian Gulf; Technical Report 79-06; Naval Environmental Prediction Research Facility: Monterey, CA, USA, 1979; p. 180. [Google Scholar]
  68. Thoppil, P.G.; Hogan, P.J. Persian Gulf response to a wintertime shamal wind event. Deep. Res. Part I Oceanogr. Res. Pap. 2010, 57, 946–955. [Google Scholar] [CrossRef] [Green Version]
  69. Taylor, J.C.M.; Illing, L.V. Holocene Intertidal Calcium Carbonate Cementation, Qatar, Persian Gulf. Carbonate Diagenes. 2009, 12, 52–53. [Google Scholar] [CrossRef]
  70. Purser, B.H.; Seibold, E. The principal environmental factors influencing Holocene sedimentation and diagenesis in the Persian Gulf. In The Persian Gulf; Springer: Berlin/Heidelberg, Germany, 1973; pp. 1–9. [Google Scholar]
  71. Westphal, H.; Riegl, B.; Eberli, G.P. Carbonate Depositional Systems: Assessing Dimensions and Controlling Parameters: The Bahamas, Belize and the Persian/Arabian Gulf; Springer: Dordrecht, The Netherlands; Heidelberg, Germany; London, UK, 2010. [Google Scholar]
  72. Shanableh, A.; Merabtene, T.; Omar, M.; Imteaz, M. Impact of surface ocean acidification on the CO2 absorption rate. Int. J. Glob. Warm. 2011, 3, 163–172. [Google Scholar] [CrossRef]
  73. Lueker, T.J.; Dickson, A.G.; Keeling, C.D. Ocean pCO2 calculated from dissolved inorganic carbon, alkalinity, and equations for K1 and K2: Validation based on laboratory measurements of CO2 in gas and seawater at equilibrium. Mar. Chem. 2000, 70, 105–119. [Google Scholar] [CrossRef]
  74. Millero, F.J. Thermodynamics of the carbon dioxide system in the oceans. Geochim. Cosmochim. Acta 1995, 59, 661–677. [Google Scholar] [CrossRef]
  75. Mucci, A. The solubility of calcite and aragonite in seawater at various salinities, temperatures, and one atmosphere total pressure. Am. J. Sci. 1983, 283, 780–799. [Google Scholar] [CrossRef]
  76. Lawson, R.; Anderson, M.A. Stratification and mixing in Lake Elsinore, California: An assessment of axial flow pumps for improving water quality in a shallow eutrophic lake. Water Res. 2007, 41, 4457–4467. [Google Scholar] [CrossRef]
  77. Alosairi, Y.; Imberger, J.; Falconer, R.A. Mixing and flushing in the Persian Gulf (Arabian Gulf). J. Geophys. Res. Ocean. 2011, 116, C03029. [Google Scholar] [CrossRef]
  78. Rakib, F.; Al-Ansari, E.M.A.S.; Husrevoglu, Y.S.; Yigiterhan, O.; Al-Maslamani, I.; Aboobacker, V.M.; Vethamony, P. Observed variability in physical and biogeochemical parameters in the central Arabian Gulf. Oceanologia 2021, 63, 227–237. [Google Scholar] [CrossRef]
  79. Al-Ansari, E.M.A.S.; Rowe, G.; Abdel-Moati, M.A.R.; Yigiterhan, O.; Al-Maslamani, I.; Al-Yafei, M.A.; Al-Shaikh, I.; Upstill-Goddard, R. Hypoxia in the central Arabian Gulf Exclusive Economic Zone (EEZ) of Qatar during summer season. Estuar. Coast. Shelf Sci. 2015, 159, 60–68. [Google Scholar] [CrossRef]
  80. Kämpf, J.; Sadrinasab, M. The circulation of the Persian Gulf: A numerical study. Ocean Sci. 2006, 2, 27–41. [Google Scholar] [CrossRef] [Green Version]
  81. Pal, M.; Mather, P.M. An assessment of the effectiveness of decision tree methods for land cover classification. Remote Sens. Environ. 2003, 86, 554–565. [Google Scholar] [CrossRef]
  82. Berhane, T.M.; Lane, C.R.; Wu, Q.; Autrey, B.C.; Anenkhonov, O.A.; Chepinoga, V.V.; Liu, H. Decision-tree, rule-based, and random forest classification of high-resolution multispectral imagery for wetland mapping and inventory. Remote Sens. 2018, 10, 580. [Google Scholar] [CrossRef] [PubMed] [Green Version]
  83. Pradhan, B.; Seeni, M.I.; Kalantar, B. Performance Evaluation and Sensitivity Analysis of Expert-Based, Statistical, Machine Learning, and Hybrid Models for Producing Landslide Susceptibility Maps. In Laser Scanning Applications in Landslide Assessment; Springer International Publishing: Cham, Switzerland, 2017; pp. 193–232. [Google Scholar]
  84. da Silva Junior, C.A.; Nanni, M.R.; de Oliveira-Júnior, J.F.; Cezar, E.; Teodoro, P.E.; Delgado, R.C.; Shiratsuchi, L.S.; Shakir, M.; Chicati, M.L. Object-based image analysis supported by data mining to discriminate large areas of soybean. Int. J. Digit. Earth 2019, 12, 270–292. [Google Scholar] [CrossRef]
  85. Bisquert, M.; Bégué, A.; Deshayes, M. Object-based delineation of homogeneous landscape units at regional scale based on modis time series. Int. J. Appl. Earth Obs. Geoinf. 2015, 37, 72–82. [Google Scholar] [CrossRef]
  86. Freund, Y.; Schapire, R.E. A Decision-Theoretic Generalization of On-Line Learning and an Application to Boosting. J. Comput. Syst. Sci. 1997, 55, 119–139. [Google Scholar] [CrossRef] [Green Version]
  87. Anderson, L.; Dyrssen, D. Alkalinity and total carbonate in the Arabian Sea. Carbonate depletion in the Red Sea and Persian Gulf. Mar. Chem. 1994, 47, 195–202. [Google Scholar] [CrossRef]
Figure 1. Location map and the bathymetry of the Arabian Gulf.
Remotesensing 13 04795 g001
Figure 2. (af) Different whiting events in the Arabian Gulf acquired using MODIS images.
Remotesensing 13 04795 g002
Figure 3. Daily averaged minimum, mean, and maximum SSTs in the Gulf during different seasons.
Remotesensing 13 04795 g003
Figure 4. Seasonal variation of SSS reproduced from Swift and Bower, 2003 [66]: (a) observed SSS in January–February (winter), (b) observed SSS in May–June (summer).
Remotesensing 13 04795 g004
Figure 5. Maximum wind speed at the Abu Dhabi International Airport station: (a) daily observed wind speed and (b) boxplot of wind speed.
Remotesensing 13 04795 g005
Figure 6. Framework of the methodology.
Remotesensing 13 04795 g006
Figure 7. Potential seasonal variation of aragonite based on the saturation index: (a) winter Ω Aragonite and (b) summer Ω Aragonite .
Remotesensing 13 04795 g007
Figure 8. Maximum wind speeds during different whiting events in winter: (af) January 2016, (g–l) January 2017, and (m–r) February 2020.
Remotesensing 13 04795 g008
Figure 9. Maximum Daily Wind Speed, recorded around the coast of Abu Dhabi, overlaid with whiting records over the Arabian Gulf in: (a) January–December, 2020, (b) January–March, 2020. High winds trigger whiting, which is sustained for a few days afterwards depending on high winds.
Remotesensing 13 04795 g009
Figure 10. Maximum wind speeds during summer, including the absence and presence of whiting: (a–f) June 2020, (g–l) June 2018, and (m–r) June 2013.
Remotesensing 13 04795 g010
Figure 11. DT classification of whiting events based on (a) wind speed and (b) wind speed and season.
Remotesensing 13 04795 g011
Figure 12. Wind vs. SST with respect to the occurrence of whiting in the Arabian Gulf.
Remotesensing 13 04795 g012
Figure 13. DT classification of whiting events based on (a) wind speed and SST, (b) WI.
Remotesensing 13 04795 g013
Figure 14. Efficiency of WI in predicting the occurrence of whiting in the Gulf in: (a) January–December, 2020, (b) January–March, 2020. The red circles represent the initiation (triggering of whiting) and blue circles represent the continuation of whiting events following their initiation.
Remotesensing 13 04795 g014
Figure 15. MODIS satellite images and their classification outcomes: (a,b) 15 March 2003, (c,d) 25 February 2004, and (e,f) 4 April 2017.
Remotesensing 13 04795 g015
Figure 16. Relationship between WI and the extent of the whiting area.
Remotesensing 13 04795 g016
Publisher’s Note: MDPI stays neutral with regard to jurisdictional claims in published maps and institutional affiliations.

