1. Introduction
Underground mining usually induces severe ground subsidence [
1,
2,
3,
4]. In China, under the condition of longwall mining, simultaneous ground subsidence can reach several meters in a few days [
5,
6]. Large ground subsidence can cause damages to buildings, railways, roads, and other infrastructure, and at its worst transforms into ground collapse and leads to casualties [
7]. Accurate information on mining subsidence is crucial for studying the deformation characteristics of the overlying strata, for maintaining the safety of underground excavation, and for assessing the impacts on the local ecological environment imposed by mining activities.
Interferometric Synthetic Aperture Radar (InSAR) has broad applications in mining deformation monitoring, but may face one problem: the inability to retrieve large-scale deformations in mining areas, owing to temporal and spatial decorrelation [
8]. The offset-tracking method (OTM) obtains pixel offsets using cross-correlation optimization between the extended match patches from two SAR intensity images [
9].
Figure 1 is the schematic diagram of the OTM. The master and slave images with sizes of
n ×
m pixels in
Figure 1a have been registered, and the patch
A with size of
n ×
m pixels in the master image and the patch
B with size of
n ×
m pixels at the same position in the slave image are patches to be matched. Fast Fourier Transform is performed on intensity matrices of match patches
A and
B, respectively, to obtain matrices
A’ and
B’, then the matrix
C can be obtained by multiplying matrix
A’ and the complex conjugate matrix of
B’. Finally, the cross-correlation coefficient (CC) matrix of match patches
A and
B can be obtained by performing Inverse Fourier Transform on matrix
C.
Figure 1b is the CC matrix of match patches
A and
B. The position of the CC peak can be found from the CC matrix. The distance
u in the range direction (RD) and the distance
v in the azimuth direction (AD) between the CC peak position and the central position of the CC matrix are offsets of match patches
A and
B in the range and azimuth directions, respectively. Firstly, patches with the same size at the same position on the master and slave images are selected in a certain step size, and then match patches with CC greater than the specified threshold are screened out. According to the above method, cross-correlation matching is performed on the selected match patches to obtain offsets of the master and slave images. The size of match patches used for cross-correlation matching are the cross-correlation window (CCW) size.
The OTM without influences of cloud occlusion and phase noise has been successfully used to monitor large-scale and large-gradient deformations, including glacier drift [
10,
11], landslides [
12,
13], mining areas [
14,
15], earthquakes [
9,
16], and nuclear tests [
17]. The OTM can detect large deformations, which makes up for the inability of InSAR technology in large mining deformation monitoring [
18,
19]. One disadvantage of OTM is that its monitoring accuracy is usually at the decimeter level [
20]. To improve its monitoring accuracy, some scholars have made a series of improvements to the method. Casu, F., A. Manconi [
21] used the Small Baseline Subset (SBAS) rationale to select image pairs, and then carried out offset-tracking on selected image pairs to estimate time-series (TS) deformations. Singleton, Li et al. [
12] proposed an offset-tracking TS analysis method based on corner reflectors, and applied it to landslide monitoring. Hu, X., T. Wang [
9] proposed a method that only implemented offset-tracking on point-like targets (PTs), and then Wang, T. and S. Jónsson [
16] improved the method of selecting PTs, and then Li, M., L. Zhang [
22] combined this method with SBAS to estimate TS deformations of Guobu landslide.
Some scholars believe that the monitoring accuracy of OTM is related to CCW size, so they have done some research on the selection of CCW of OTM. Huang, J., K. Deng [
23] used the offset of stable area points to perform least-squares fitting, which can remove influences of orbit error, satellite attitude, and topography, and then proposed the OTM of adaptive CCWs according to the maximum redefined signal-to-noise ratio [
24]. Cai, J., C. Wang [
25] proposed an OTM with irregular CCWs, which improves the monitoring accuracy of landslide boundary areas. Jia, H., Y. Wang [
26] optimized the OTM workflow, and proposed an adaptive incoherence speckle OTM, which improved efficiency, while ensuring deformation accuracy.
For the convenience of description, except
Section 2.1, the magnitude of deformation gradient in other sections of this paper is its absolute value. Deformations caused by underground coal mining are different from earthquakes and landslides, and deformation gradients in mining areas with certain characteristics are large. The surface of mining areas beneath farmland is covered with large amounts of vegetation, and the influence of noise caused by vegetation on offset-tracking results cannot be ignored. How to select reasonable CCW sizes in accordance with mining deformation gradients and noise levels is a problem worth studying. However, influences of deformation gradients and image noises on monitoring accuracy have not been studied systematically in the above methods. To research effects of CCW sizes, deformation gradients, and image noises on OTM results, we conducted a series of simulation experiments. Through simulation experiments, we found that using small CCWs can ensure deformation accuracy, but it is difficult to suppress image noises; using large CCWs can better suppress image noises, but using large CCWs in larger deformation gradient areas will result in deformation compression and accurate deformations cannot be obtained. The monitoring accuracy of OTM is directly related to deformation gradients and noise levels in the CCW. According to the conclusion of simulation experiments, this paper proposes an adaptive CCW selection method based on deformation gradients and image noises to improve the accuracy of OTM, and applies this method to the simulation experiment and the real experiment. The experimental results demonstrate that this method can improve the accuracy of OTM effectively.
2. Methods
2.1. Deformation Characteristics of Mining Areas
The tangent value of the main influence angle (tan
β) is an important parameter in mining areas, which is mainly related to the overlying strata property, and decreases with the increase of the overlying strata hardness. The smaller the value of tan
β, the flatter the surface subsidence curve and the smaller the deformation gradient. The larger the value of tan
β, the steeper the surface subsidence curve and the larger the deformation gradient [
27].
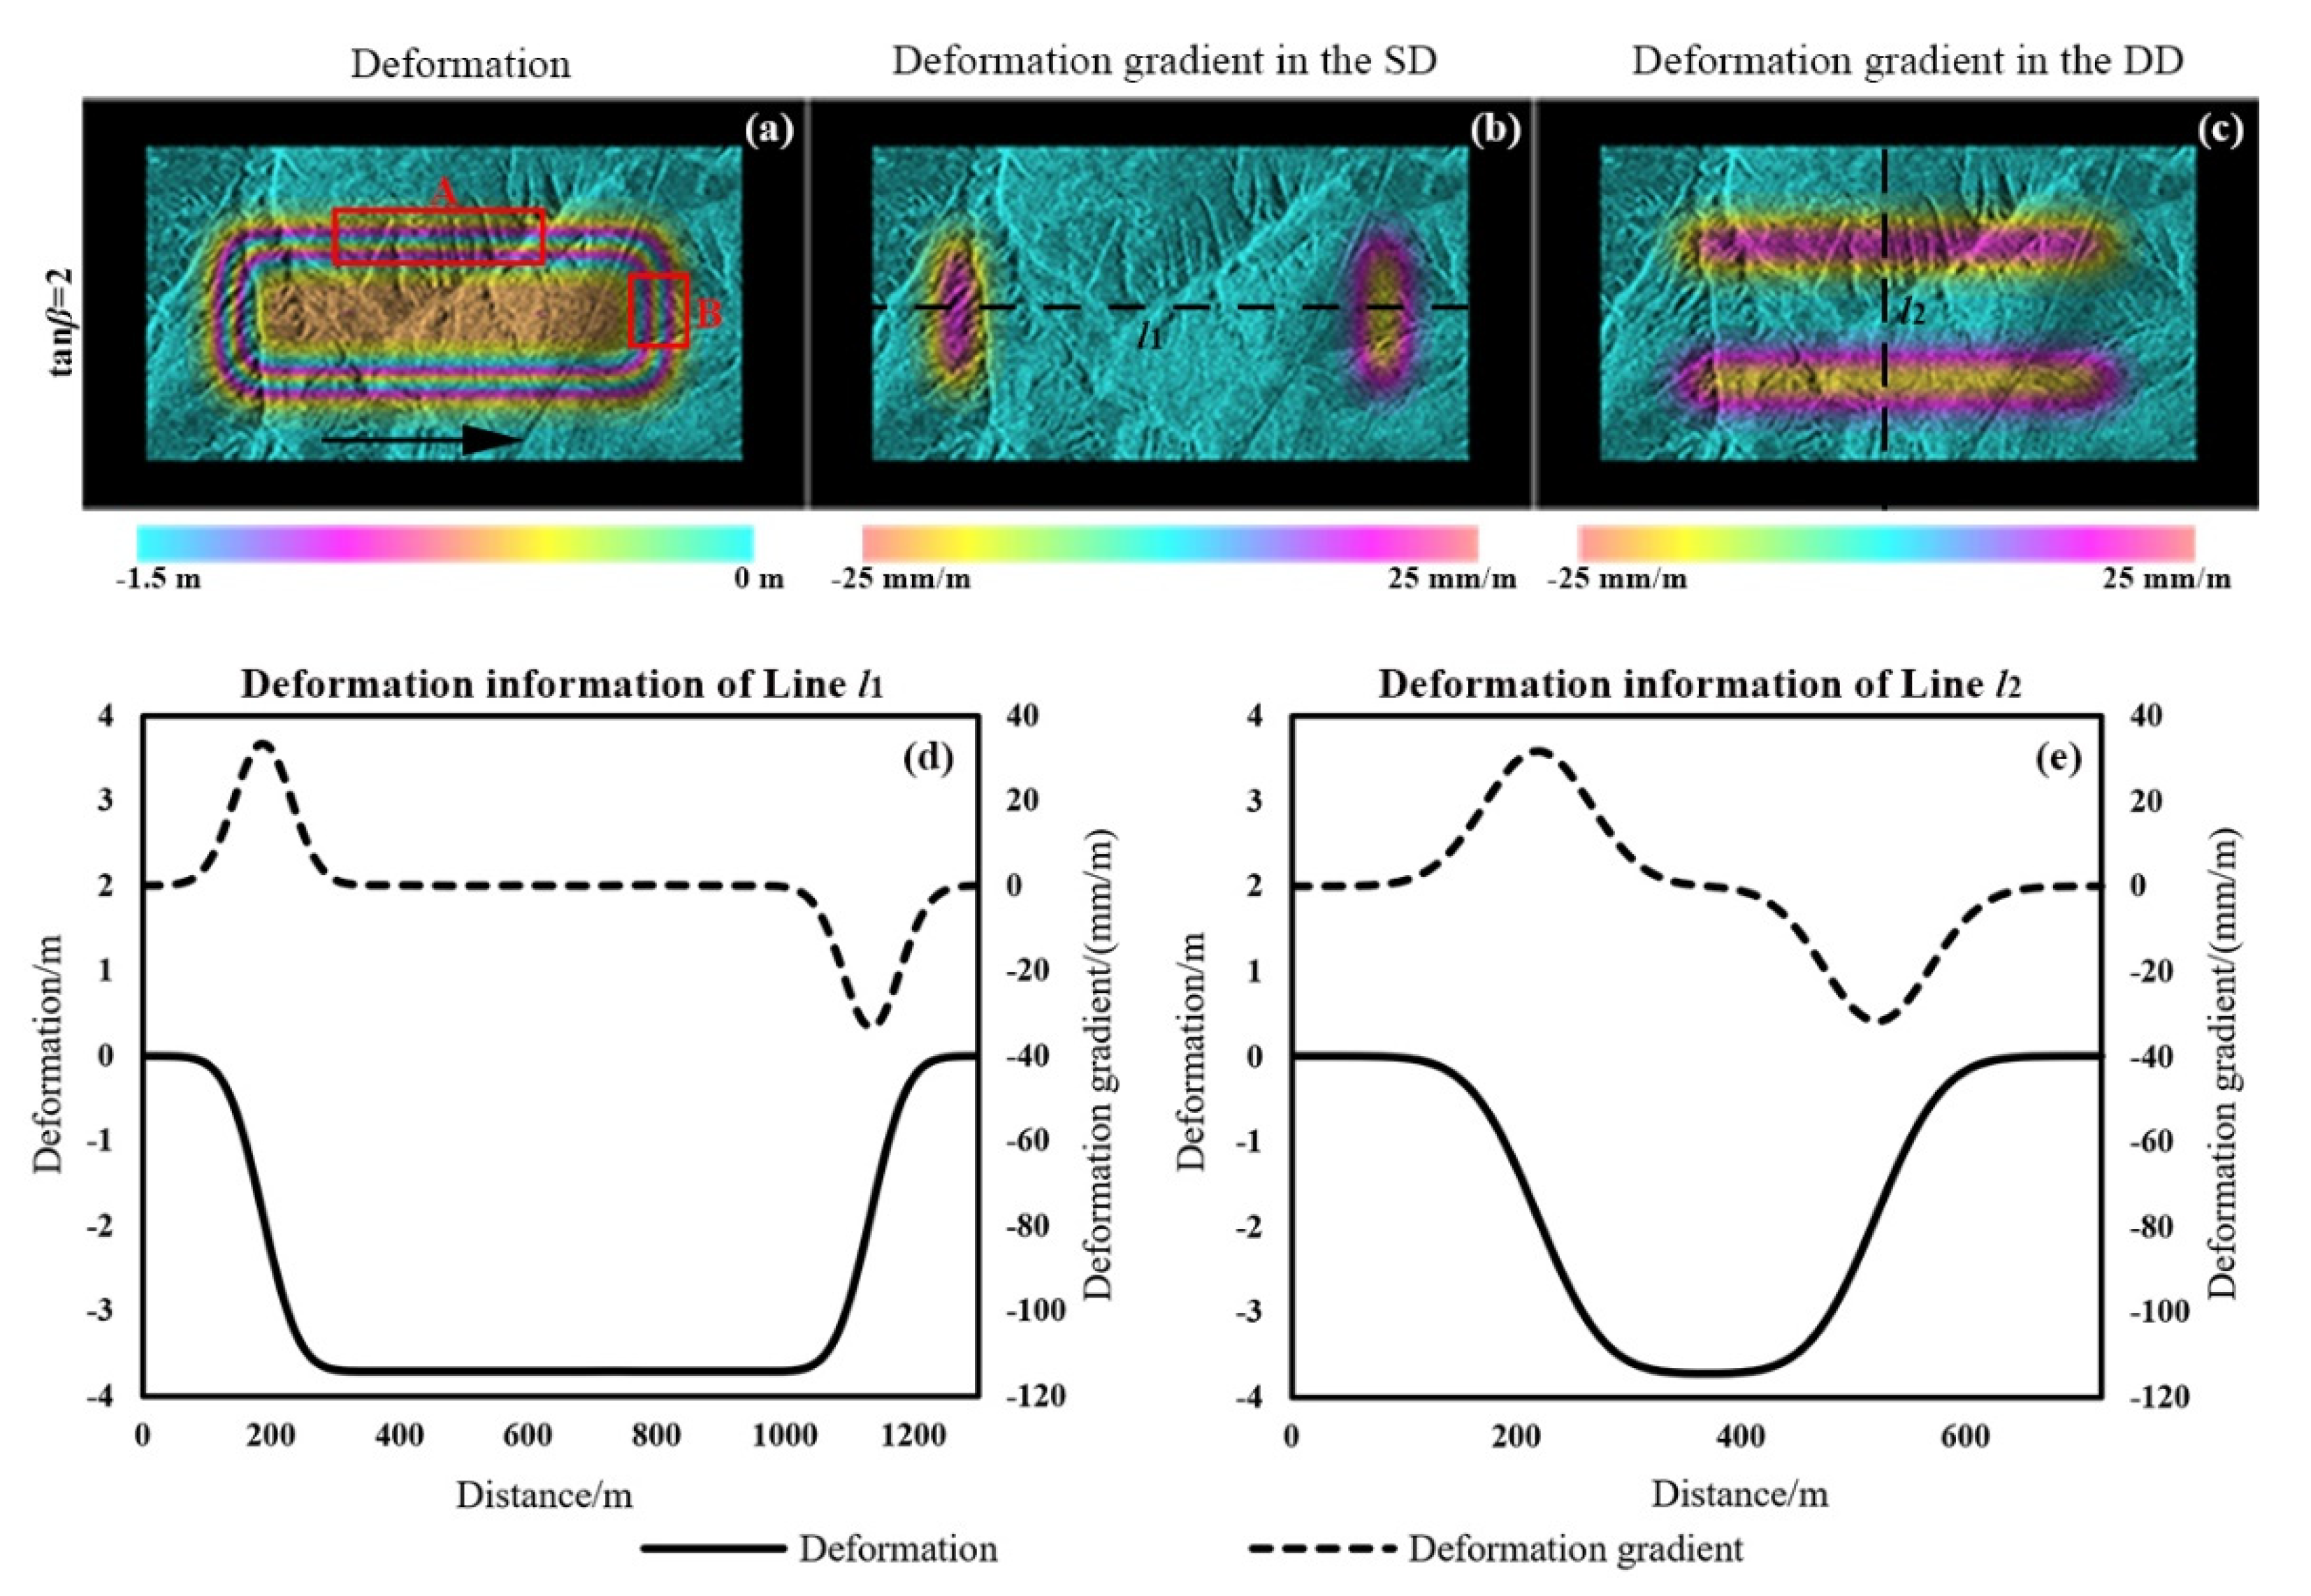
Figure 2 is the surface deformation information (tan
β = 2) in the SAR line-of-sight (LOS) direction of a horizontal working face. The deformation in
Figure 2a caused by horizontal coal seam mining is symmetrical, and the black arrow in this subfigure is the mining direction or strike direction (SD) of the working face, and the dip direction (DD) of the working face is perpendicular to the SD. According to Equation (1), deformation gradients in the SD and DD of the deformation in
Figure 2a are calculated, and the results are shown in
Figure 2b,c. Equation (1) is a self-defined deformation gradient equation in this article.
where
G(
p) is the deformation gradient of any point
p,
D(
p) and
D(
p + 1) are the deformation of point
p and point
p + 1, respectively, and
lp~p+1 is the distance between point
p and point
p + 1.
It can be seen from
Figure 2b,c that larger deformation gradients in the SD of
Figure 2b are mainly concentrated on the left and right sides of the subfigure, and deformation gradients in the middle area of the subfigure are almost zero; larger deformation gradients in the DD of
Figure 2c are mainly concentrated on the upper and lower sides of the subfigure, and deformation gradients in the middle area of the subfigure are also almost zero. Line
l1 crosses the middle of the deformation field horizontally, and Line
l2 crosses the middle of the deformation field vertically.
Figure 2d shows the deformations and deformation gradients in the SD on Line
l1. Since deformation gradients in the DD on Line
l1 are almost zero, they are not shown in
Figure 2d. As can be seen in
Figure 2d, the deformation curve is symmetric from left to right, while the deformation gradient curve is anti-symmetric from left to right. At the left edge of
Figure 2d, the deformation first increases slowly, then increases rapidly, and then increases slowly, until it reaches the maximum and no longer increases; the deformation gradient at the corresponding position first increases and then decreases to zero. The deformation at the intermediate position of
Figure 2d is completely equal and the deformation gradient at the corresponding position is zero. The deformation at the right edge of
Figure 2d first decreases slowly, then decreases rapidly, and then decreases slowly to zero; the deformation gradient at the corresponding position first decreases and then increases to zero.
Figure 2e shows the deformations and deformation gradients in the DD on Line
l2. Since deformation gradients in the SD on Line
l2 are almost zero, they are not shown in
Figure 2e. As can be seen from
Figure 2e, the deformation curve is still symmetric from left to right, while the deformation gradient curve is anti-symmetric from left to right. The laws of deformations and deformation gradients in
Figure 2e are similar to those in
Figure 2d.
For area
A in
Figure 2a, deformation gradients in the SD are smaller (near zero), while deformation gradients in the DD are larger. For area
B in
Figure 2a, deformation gradients in the SD are larger, and deformation gradients in the DD are smaller (near zero). In this paper, we call these two types of areas as special areas.
2.2. CCW Effects on Offset-Tracking Results
To research effects of CCW sizes, deformation gradients and image noises on OTM results, we conducted a series of simulation experiments.
Considering the actual mining situation, 1.5, 2, 2.5, and 3 are selected as the tan β values in the simulation experiment. Because the mining-induced deformation law basically conforms to the probability integral model (PIM), the experiment uses PIM to estimate four mining-induced subsidence of the maximum subsidence of 5 m under the same geological mining condition, the same horizontal working face size, the same mining depth, and different overlying strata properties. Three SAR images with size of 1600 × 900 pixels are used to form three image pairs with temporal spans of 0 day, 11 days, and 22 days, respectively. A temporal span of 0 day indicates that there are no image noises, and the longer the temporal span, the larger the image noise. The four simulated subsidence described above are converted into offsets in the SAR LOS direction (LD). Then these four simulated offsets are added to the slave images of these three image pairs by cubic convolution interpolation method, and five CCWs of 32 × 32, 64 × 64, 96 × 96, 128 × 128, and 160 × 160 pixels are selected to perform offset-tracking processing on image pairs containing the simulation deformation information. Finally, deformations extracted by OTM are compared and analyzed with deformations simulated by PIM.
The authors conducted a total of 60 simulation experiments and selected 10 groups of results with tan
β = 3 as examples (as show in
Figure 3 and
Figure 4).
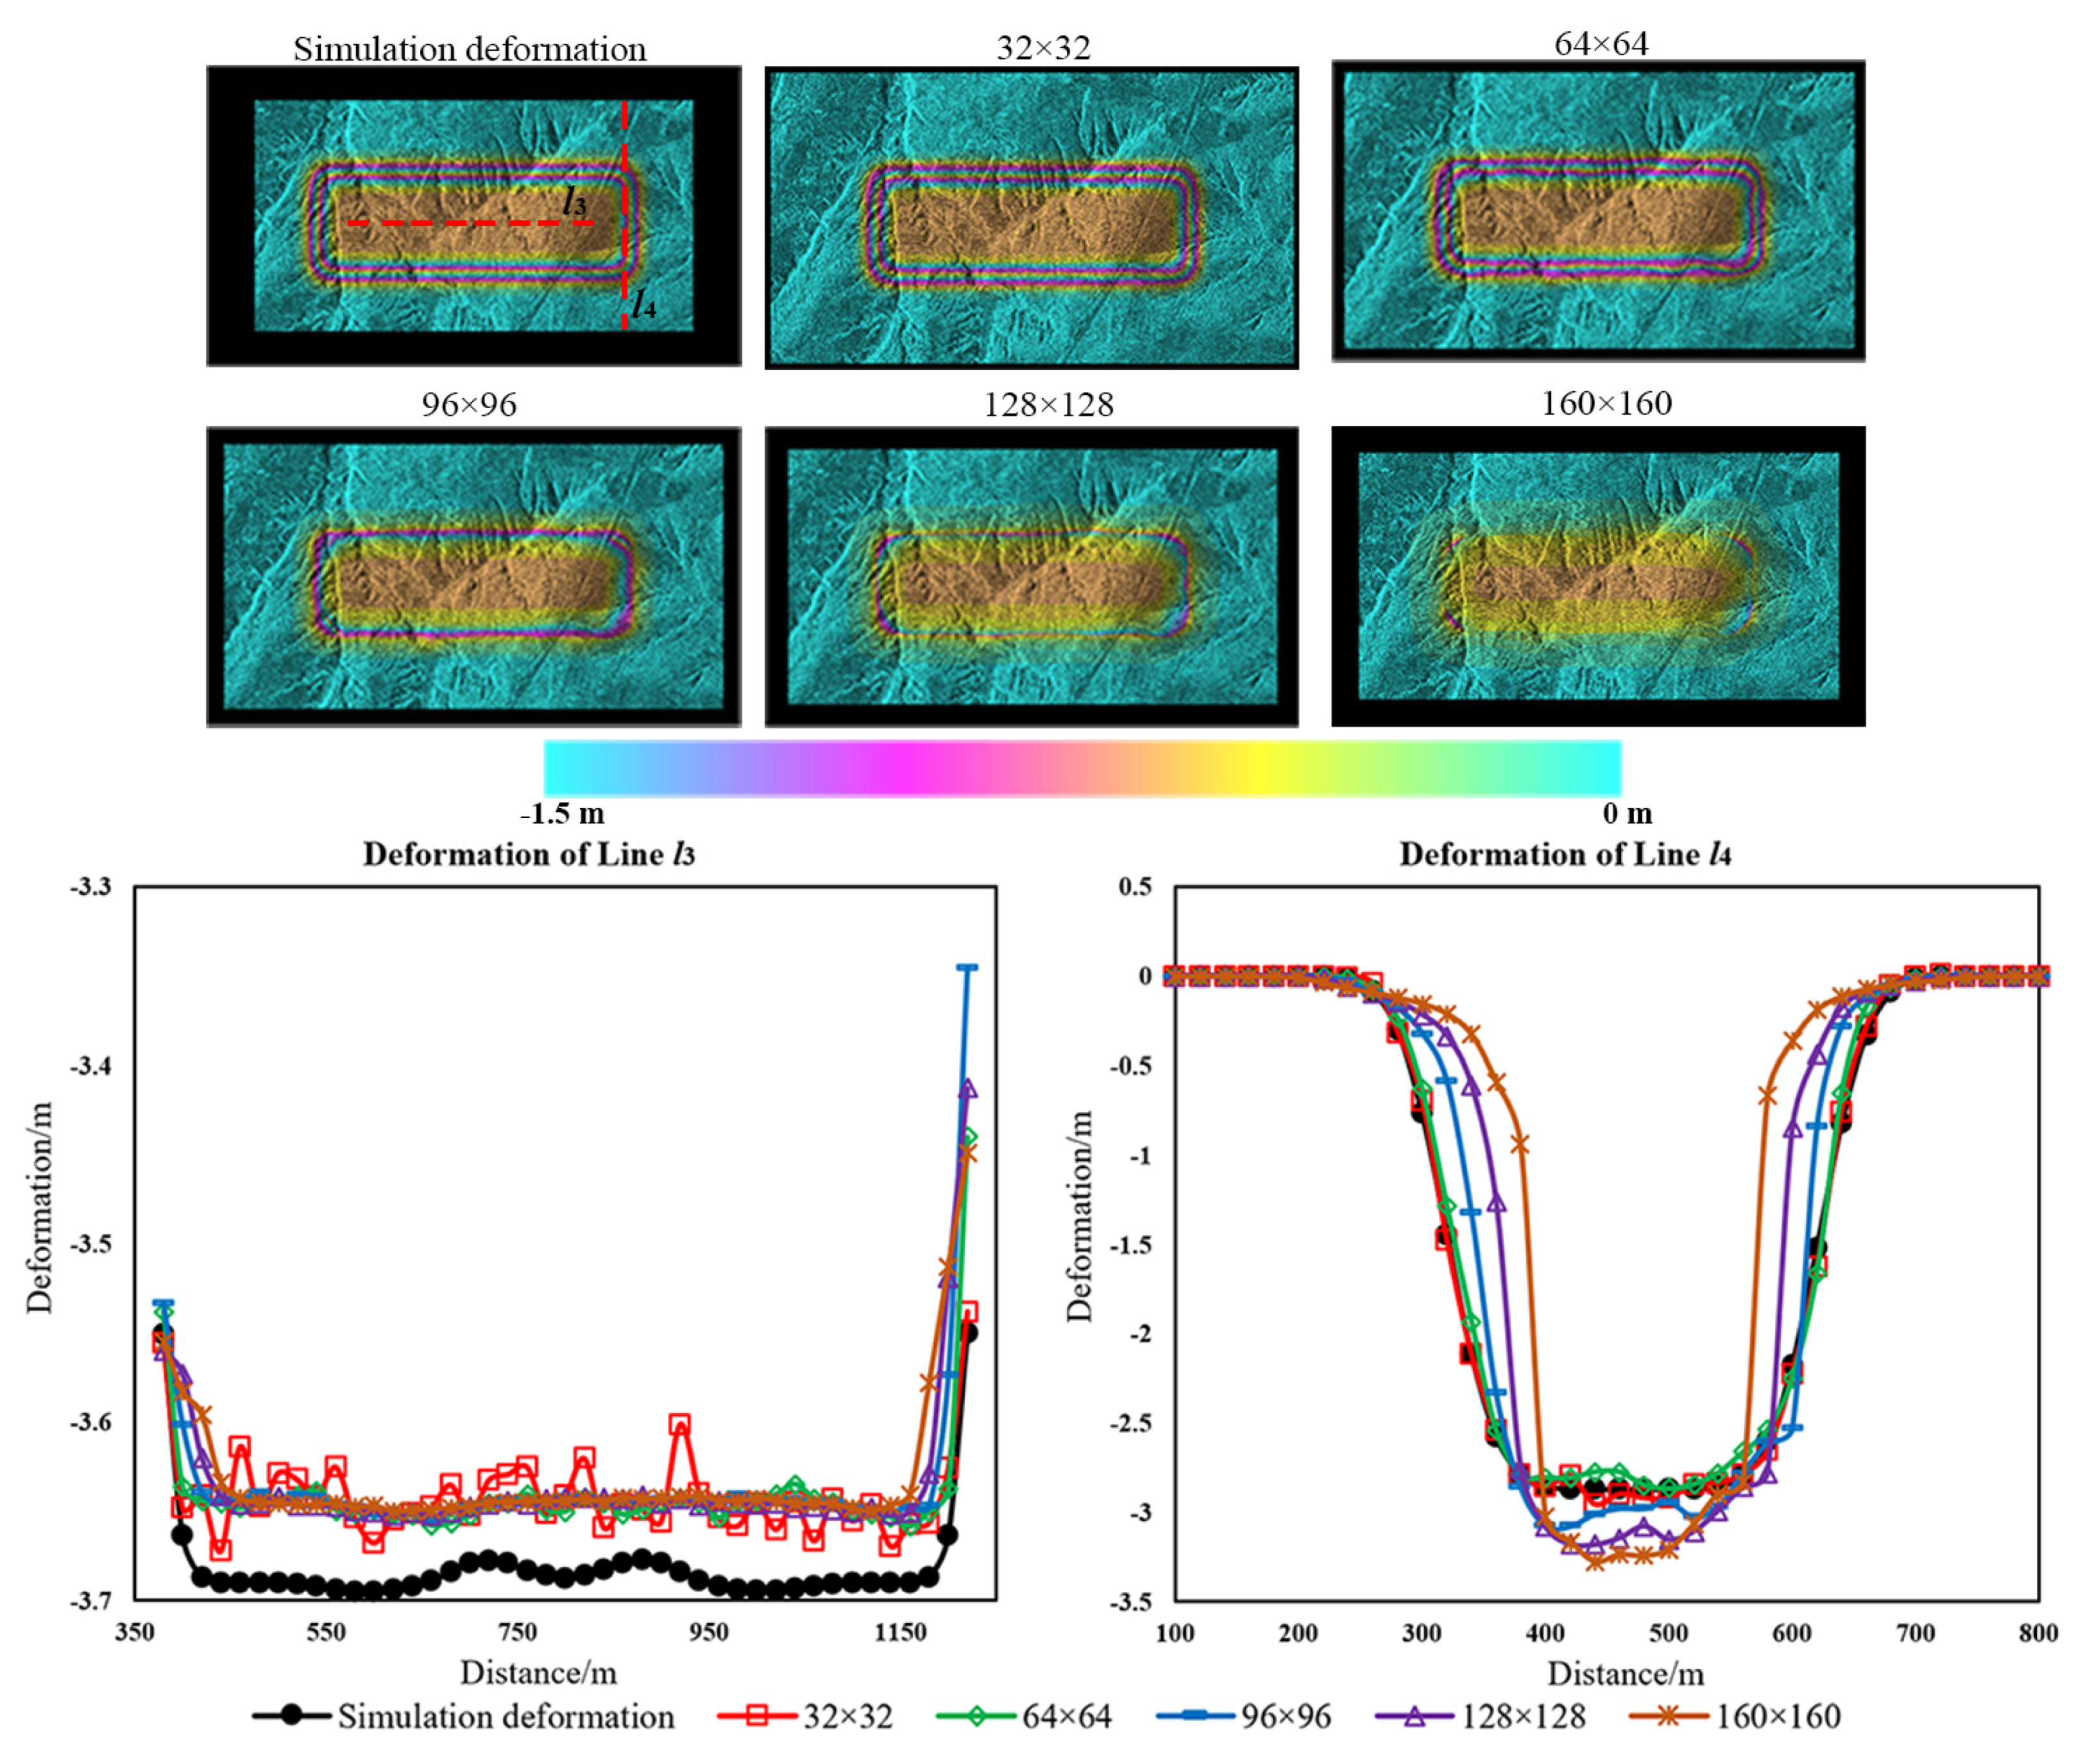
Figure 3 shows deformation maps with five CCWs in the LD with temporal span of 0 day. As can be seen from
Figure 3, for areas with small deformation gradients, differences between offset-tracking results and the simulated deformation are small. Deformation results on Line
l3 of five CCWs with small deformation gradients are basically the same, but there is a small jump phenomenon in the deformation result with CCW of 32 × 32 pixels. For areas with large deformation gradients, offset-tracking results with CCWs of 32 × 32 and 64 × 64 pixels are closest to the simulated deformation, and with the increase of CCWs, differences between offset-tracking results and the simulated deformation become larger and larger. Especially in areas with large deformation gradients, differences between offset-tracking results and the simulation deformation increase sharply, and the phenomenon of deformation compression becomes more and more severe. Deformation results on Line
l4 of five CCWs with large deformation gradients are quite different. As the CCW increases, deformation curves become steeper and steeper.
Thus, when there are no image noises, smaller CCWs (such as 32 × 32 and 64 × 64 pixels) should be selected to perform offset-tracking and larger CCWs (such as 128 × 128 and 160 × 160 pixels) cannot be used for areas with large deformation gradients.
Figure 4 shows deformation maps with five CCWs in the LD with temporal span of 22 days. Due to the existence of image noises, there are lots of noises in the deformation result with CCW of 32 × 32 pixels. Moreover, small CCWs will result in CCs of many match patches lower than the CC threshold, which will result in an inability to obtain accurate offsets of those match patches. Therefore, in this case, the CCW of 32 × 32 pixels is too small to be used for offset-tracking. Although the image noise suppression effect becomes better as the CCW increases, differences in areas with larger deformation gradients between deformation results and the simulated deformation become larger and larger. Thus, larger CCWs still cannot be used for areas with large deformation gradients.
In mining areas, influences of noises caused by vegetation and large deformation gradients on offset-tracking results cannot be ignored, so CCWs of 32 × 32 and 160 × 160 pixels are not suitable for offset-tracking. In the following paper, authors abandon CCWs of 32 × 32 and 160 × 160 pixels, and only use CCWs of 64 × 64, 96 × 96, and 128 × 128 pixels for offset-tracking experiments and accuracy analysis.
Figure 5 shows the root mean square errors (RMSEs) between deformations extracted by OTM using three CCWs and simulated deformations. As can be seen from
Figure 5a, when there are no image noises: when using the same CCW size, RMSEs increase with increases of deformation gradients; when deformation gradients are the same, RMSEs increase with increases of CCW sizes. This is because the larger the deformation gradient and the larger the CCW size, the more severe the deformation compression.
With the further increase of the temporal span of image pairs, image noises become larger and larger. In deformation areas (the temporal span is 22 days,
Figure 5c), RMSEs do not increase with increase of CCW sizes when deformation gradients are the same, and the RMSE is the minimum when the CCW size is 96 × 96 pixels. This indicates that as image noises increase, deformations are more severely affected by image noises. At this time, noises and deformation gradients of image pairs should be considered comprehensively to select appropriate CCW sizes. As can be seen from
Figure 5d, in stable areas, RMSEs decrease with increase in CCW sizes. Thus further indicates that when there are image noises, larger CCW sizes should be selected to remove noises. With increase in temporal span of image pairs, deformation RMSEs increase rapidly, which indicates that deformations in stable areas are also influenced by image noises.
In summary, using small CCWs can ensure deformation accuracy, but it is difficult to suppress image noises; using large CCWs can better suppress image noises, but using large CCWs in larger deformation gradient areas will result in deformation compression and cannot obtain accurate deformations.
2.3. Adaptive CCW Selection Method Based on Deformation Gradients and Image Noises
According to conclusions in
Section 2.2 of this paper, the accuracy of OTM is related to deformation gradients and image noises, so CCW sizes should be reasonably selected according to deformation gradients and image noises. For image pairs without noises, only influence of deformation gradients on the monitoring accuracy is considered. When deformation gradients are small, larger CCWs can be used; for larger deformation gradient areas, CCW sizes can be appropriately reduced, but CCWs cannot be too small to avoid mismatching caused by too little intensity feature information in CCWs. For image pairs with noises, large CCWs should be selected for stable and small deformation gradient areas to suppress noise. For larger deformation gradient areas, smaller CCWs should be selected to guarantee deformation accuracy; if noises are large, CCW sizes can be appropriately increased to suppress noises.
Firstly, three deformation gradient thresholds
a,
b, and
c are selected, and assuming that
a <
b <
c.
Table 1 shows the adaptive CCW selection method based on deformation gradients and image noises. For deformation areas: when deformation gradients in both range and azimuth directions are smaller (less than
a), larger CCWs (such as 128 × 128 pixels) should be selected; when deformation gradients in the RD are more than
a and less than
b, or deformation gradients in the AD are more than
a and less than
b, moderate CCWs (such as 96 × 96 pixels) should be selected; when deformation gradients are more than
b in the RD or are more than
b in the AD, smaller CCWs (such as 64 × 64 pixels) should be selected. For an explanation, CCW sizes of 128 × 128, 96 × 96, and 64 × 64 pixels are selected by authors based on simulation experiments.
For special areas with greatly influenced by noises, CCW sizes should be selected according to the magnitude of deformation gradients in both range and azimuth directions and image noises. If deformation gradients are less than
a in the RD and more than
c in the AD (such as area
A in
Figure 2a): because of smaller deformation gradients in the RD with little influences on deformation results, larger CCWs can be used to suppress noise; on the contrary, smaller CCWs in the AD should be used to obtain accurate deformations; for the purpose of suppressing noises and obtaining accurate deformations, CCW sizes in the RD and AD are set as 96 and 32 pixels, respectively. CCWs of 96 × 32 pixels are used for offset-tracking to extract deformations of these special areas. If deformation gradients are more than
c in the RD and are less than
a in the AD (such as area
B in
Figure 2a): for the same reason, smaller CCWs in the RD should be used to ensure the deformation accuracy and larger CCWs in the AD should be used to suppress noise; CCWs of 32 × 96 pixels are used for offset-tracking to extract deformations of these special areas.
2.4. The Data Processing Flow of the Proposed Method
Figure 6 is the flowchart of the proposed OTM with adaptive CCWs based on deformation gradients and image noises. Firstly, the master and slave images are accurately registered, and then the interferogram is generated. According to the interferogram, the positions and sizes of the deformation and stable areas in the entire image can be determined. For stable areas, deformation gradients are theoretically zero, so larger CCWs (such as 128 × 128 pixels) should be selected to implement offset-tracking to remove noises effectively. For deformation areas, smaller CCWs (such as 64 × 64 pixels) are first used to extract deformations. If mathematical models, physical models, or empirical models can estimate more accurate deformations in deformation areas, these models can also be used to estimate deformations. Next, deformation gradients in both range and azimuth directions of deformation areas are calculated according to Equation (1). Then, according to
Section 2.3 to select appropriate CCW sizes, deformations in deformation areas can be obtained by offset-tracking with adaptive CCWs. Finally, deformations of the entire study area can be obtained by superposing deformations in the deformation and stable areas.
3. Simulation Experiment
The simulation experiment uses the results with temporal span of 22 days as an example.
Table 2 shows magnitudes of deformation gradients in both range and azimuth directions used in the simulation experiment. Based on experience and the basic situation of deformation gradients in the mining area, 1 mm/m and 20 mm/m are used as deformation gradient thresholds in this experiment. For stable areas, CCWs of 128 × 128 pixels are selected, and CCWs of 64 × 64 and 96 × 96 pixels can be used for the black area around the image. For deformation areas with image noises: when deformation gradients in the RD or AD are more than 20 mm/m, CCWs of 64 × 64 pixels are selected to guarantee the deformation accuracy; when deformation gradients in the RD are more than 1 mm/m and less than 20 mm/m, or deformation gradients in the AD are more than 1 mm/m and less than 20 mm/m, CCWs of 96 × 96 pixels are selected to suppress noises; when deformation gradients in both range and azimuth directions are less than 1 mm/m, CCWs of 128 × 128 pixels are selected to further suppress noises.
Table 3 shows the adaptive CCW selection method based on deformation gradients and image noises.
Figure 7 shows deformation maps in the LD using different CCW sizes and adaptive CCW sizes with temporal span of 22 days. Because deformation gradients in the entire study area are relatively small when tan
β = 1.5, offset-tracking results are less affected by deformation gradients. The area with deformation gradients more than 20 mm/m in the RD and AD is small, so CCWs of 96 × 96 pixels are still used for these areas to minimize noises.
In deformation areas, areas with CCWs of 64 × 64 pixels in
Figure 7 are all located in areas with deformation gradients more than 20 mm/m in the RD or AD. Areas with CCWs of 96 × 96 pixels are all located in small deformation gradient areas, and areas with CCWs of 128 × 128 pixels are all located in areas with deformation gradients less than 1 mm/m. Comparing deformation maps using adaptive CCWs with deformation maps using CCWs of 64 × 64 pixels, it can be found that noises in stable areas of four deformation maps using adaptive CCWs are better suppressed, and differences between four maps and simulation deformation maps are smaller, and deformations in larger deformation gradient areas can also be completely retained; in deformation areas, noises in areas with small deformation gradients are also significantly suppressed, and some black holes are filled at the same time; for areas with large deformation gradients and large noises, the OTM with adaptive CCWs also cannot obtain better deformation results.
Table 4 exhibits deformation RMSEs extracted by the proposed OTM for the entire image with temporal span of 22 days. In stable areas, using adaptive CCWs relative to CCWs of 64 × 64 pixels, the accuracy of OTM has improved by 52.7 mm, which is equivalent to an increase of 55.3%. This shows that the proposed OTM should be used to suppress noises in stable areas with large image noises. In deformation areas, using adaptive CCWs relative to CCWs of 96 × 96 pixels, the accuracy is improved by 3.3 mm (tan
β = 1.5), 17.4 mm (tan
β = 2), 24.8 mm (tan
β = 2.5), 19.6 mm (tan
β = 3), equivalent to increases of 1.9% (tan
β = 1.5), 9.1% (tan
β = 2), 11.6% (tan
β = 2.5), and 8.5% (tan
β = 3), respectively. This indicates that the proposed OTM can effectively suppress image noises.
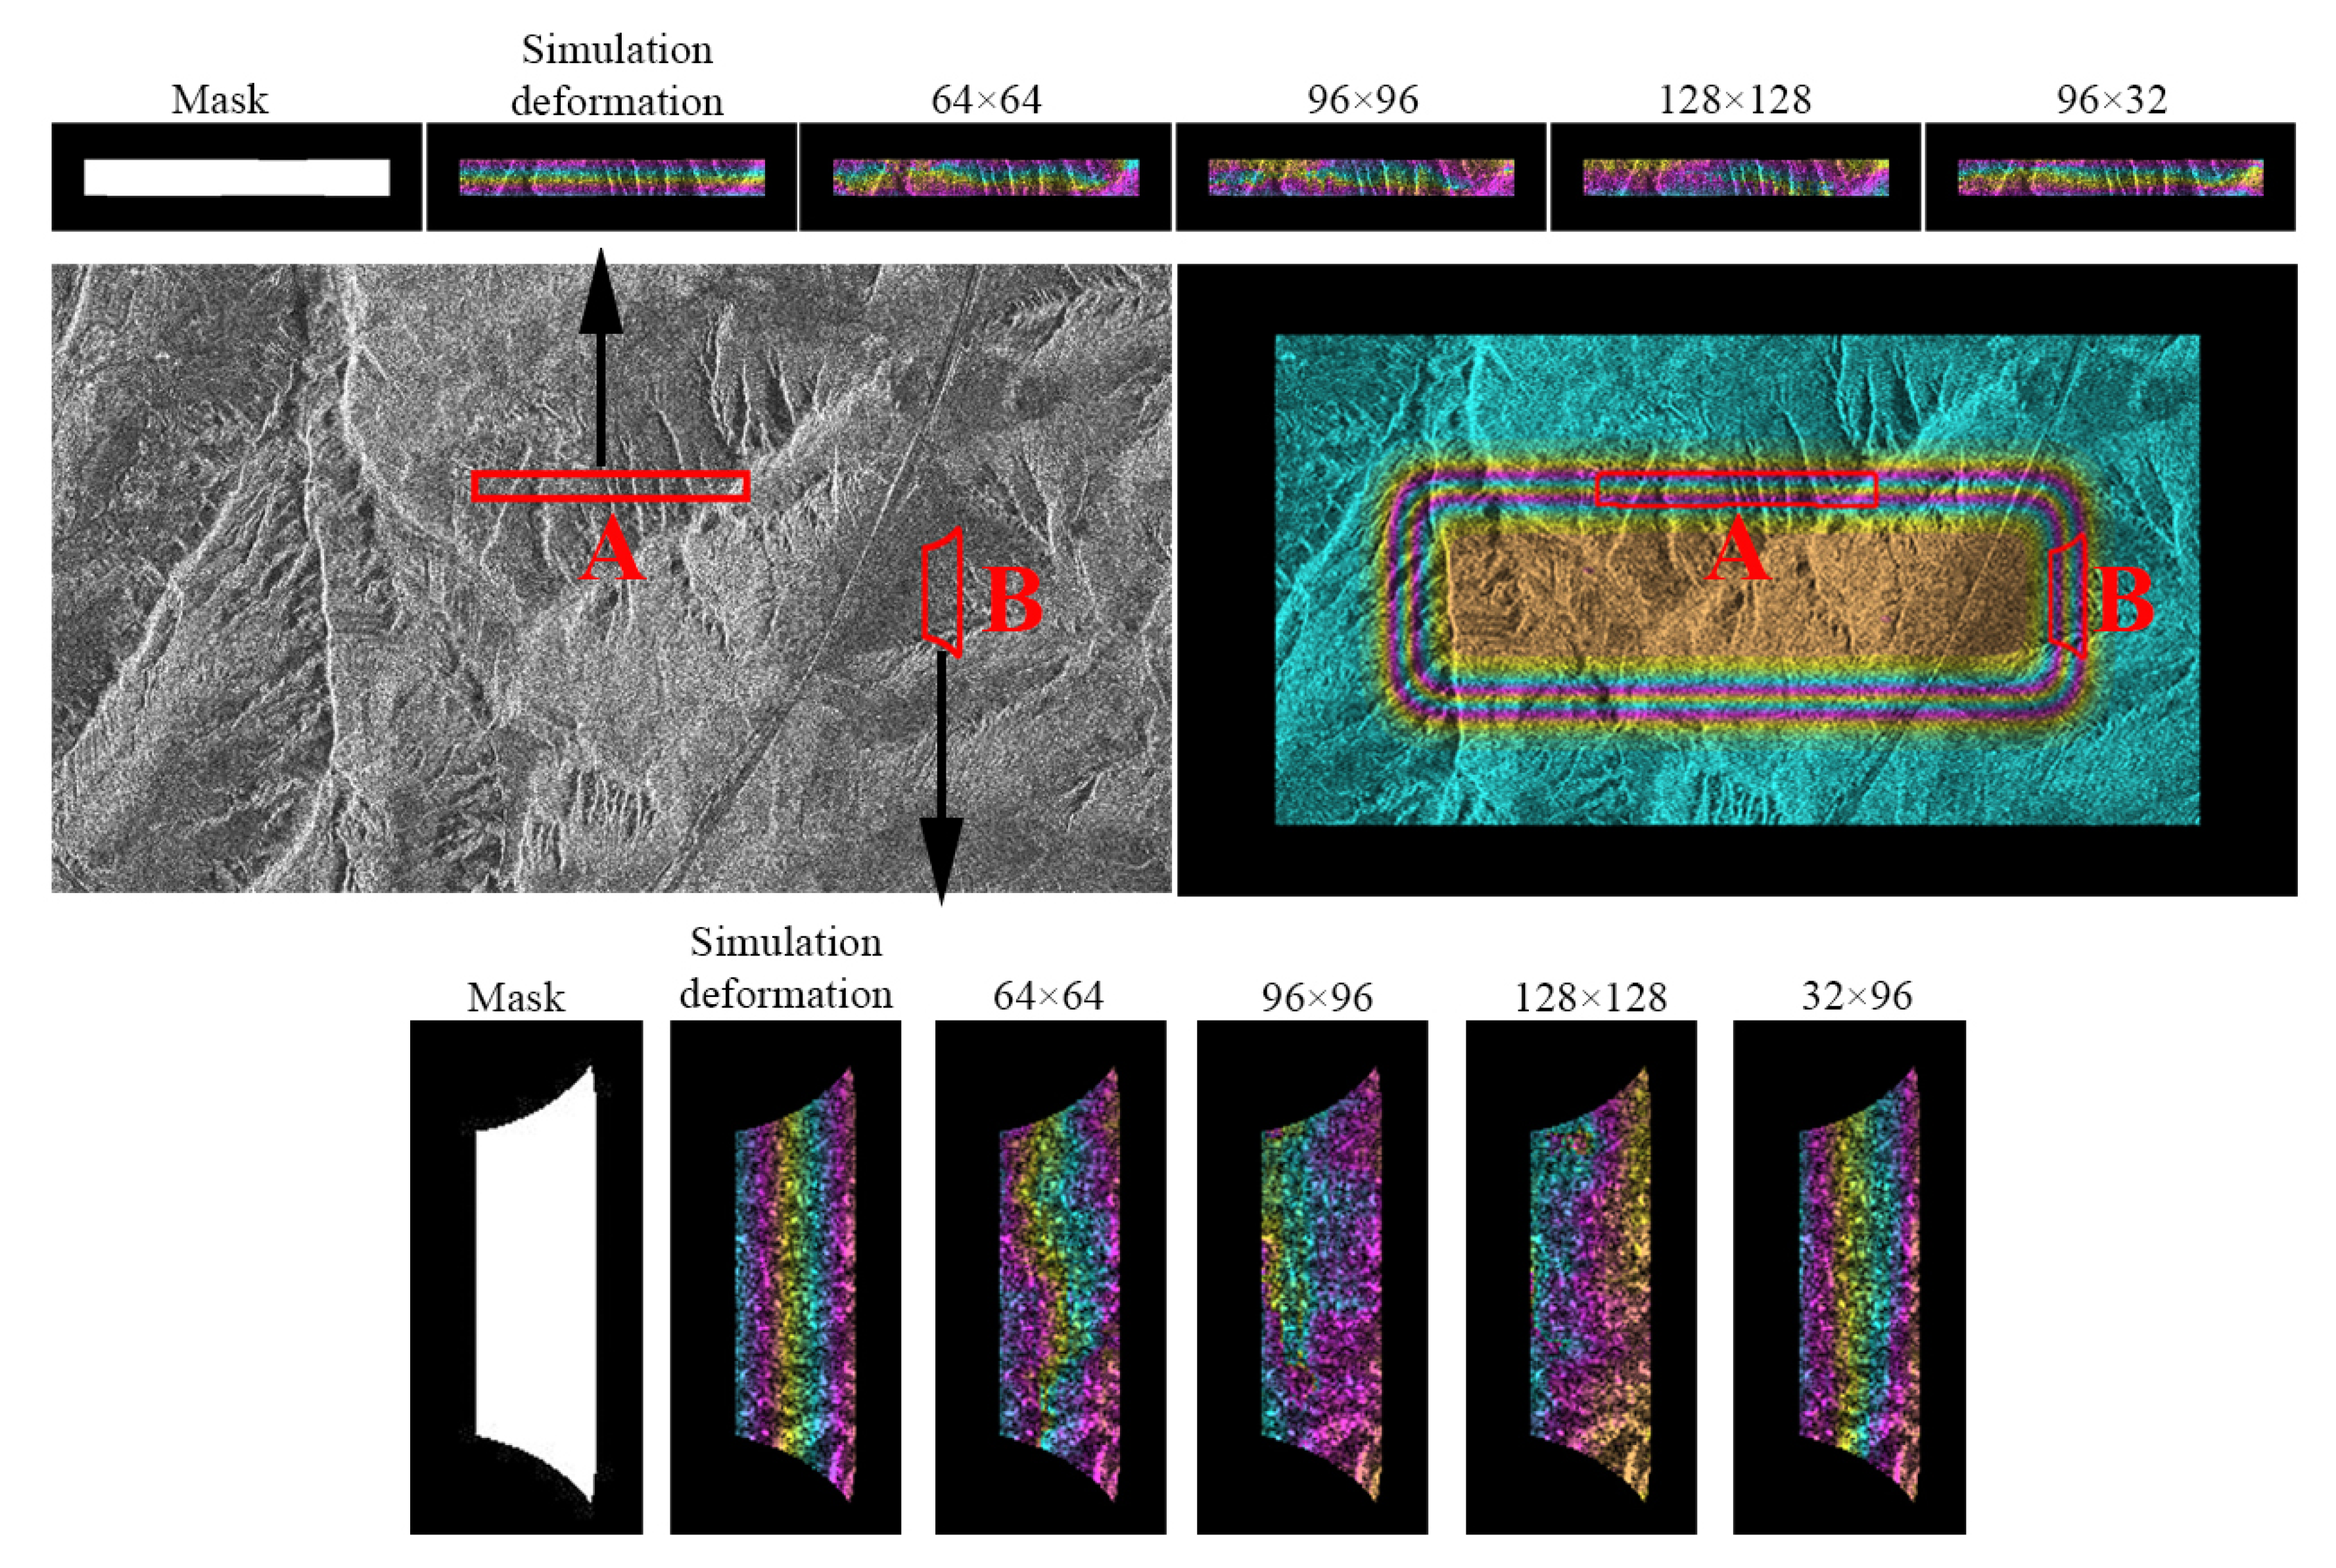
For special areas with large noises, as shown in the red box in
Figure 8 (taking tan
β = 3 and temporal span of 22 days as an example): In the special area
A, deformation gradients are less than 1 mm/m in the RD and are more than 30 mm/m in the AD, CCWs of 96 × 32 pixels are used for offset-tracking to suppress noises and obtain accurate deformations. For special area
B in
Figure 8, deformation gradients are more than 30 mm/m in the RD and are less than 1 mm/m in the AD, and CCWs of 32 × 96 pixels are used for offset-tracking to extract accurate deformations. The deformation results in
Figure 8 with CCWs of 96 × 32, 32 × 96 pixels are most similar to the simulated deformations, which indicates that the proposed OTM in special areas is reliable and effective.
Table 5 shows deformation RMSEs extracted by OTM with different CCWs in special areas
A and
B with temporal span of 22 days. In special areas A and B, accuracies of OTM with CCWs of 96 × 32 and 32 × 96 pixels are the highest, and that with CCWs of 128 × 128 pixels are the lowest. Using CCWs of 96 × 32 and 32 × 96 pixels relative to CCWs 64 × 64 pixels, measuring accuracies are improved by 122.5 mm and 92.9 mm, respectively, which are equivalent to increases of 41.3% and 41.8%, respectively. This indicates that the proposed OTM in special areas can not only effectively suppress noises, but also obtain more accurate deformations.
In summary, the proposed OTM with adaptive CCW based on deformation gradients and image noises is effective and reliable. This method selects CCW sizes reasonably according to deformation gradients and image noises, which can not only effectively suppress noises, but also greatly improve the accuracy of OTM.
4. Real Experiment
The study mining area as shown in
Figure 9a is the largest underground coal mining field in China, located in the north side of Shaanxi province. The mining area is located in the typical Loess Plateau gully area characterized by high elevation fluctuation, surface fragmentation, thick loess seam, and high trench density, among others. The experiment selects the surface deformation of working face 52,304 in the Daliuta mine field as the research object, as shown in
Figure 9b (the background is a Google Earth image). The red line is the boundary of the working face 52,304, and the black arrow is the SD of the working face. Mining length, width, depth, and thickness of the working face are 4547.6 m, 301 m, 250 m and 6.45 m, respectively. The elevation fluctuation in the study area is about 100 m. The mining period is from 1 November 2011 to 25 March 2013 [
28].
To measure the ground mining-induced subsidence above the working face, 45 Global Positioning System (GPS) observation points numbered z6–z50 with 20 m interval along the main section in the SD are set up, and 26 GPS observation points numbered Q1–Q26 with 25-m interval along the main section in the DD are set up (
Figure 9b). The black dots and black circles are positions of these observation points, and black strings next to observation points are numbers of these observation points. A GPS receiver with horizontal accuracy of 10 mm and vertical accuracy of 20 mm is used to implement real-time kinematic monitoring of the deformation of these observation points. According to the GPS measured data, the maximum cumulative subsidence of the working face reaches more than 4 m, and the fastest subsidence velocity is more than 200 mm/day. The GPS measurements within the period from 2 December 2012 to 10 April 2013 are used to validate offset-tracking results.
Two TSX-1 images of strip map mode with temporal span of 143 days are used in this experiment. Parameters such as pixel sizes in RD and AD, image acquisition time, and perpendicular baseline are exhibited in
Table 6.
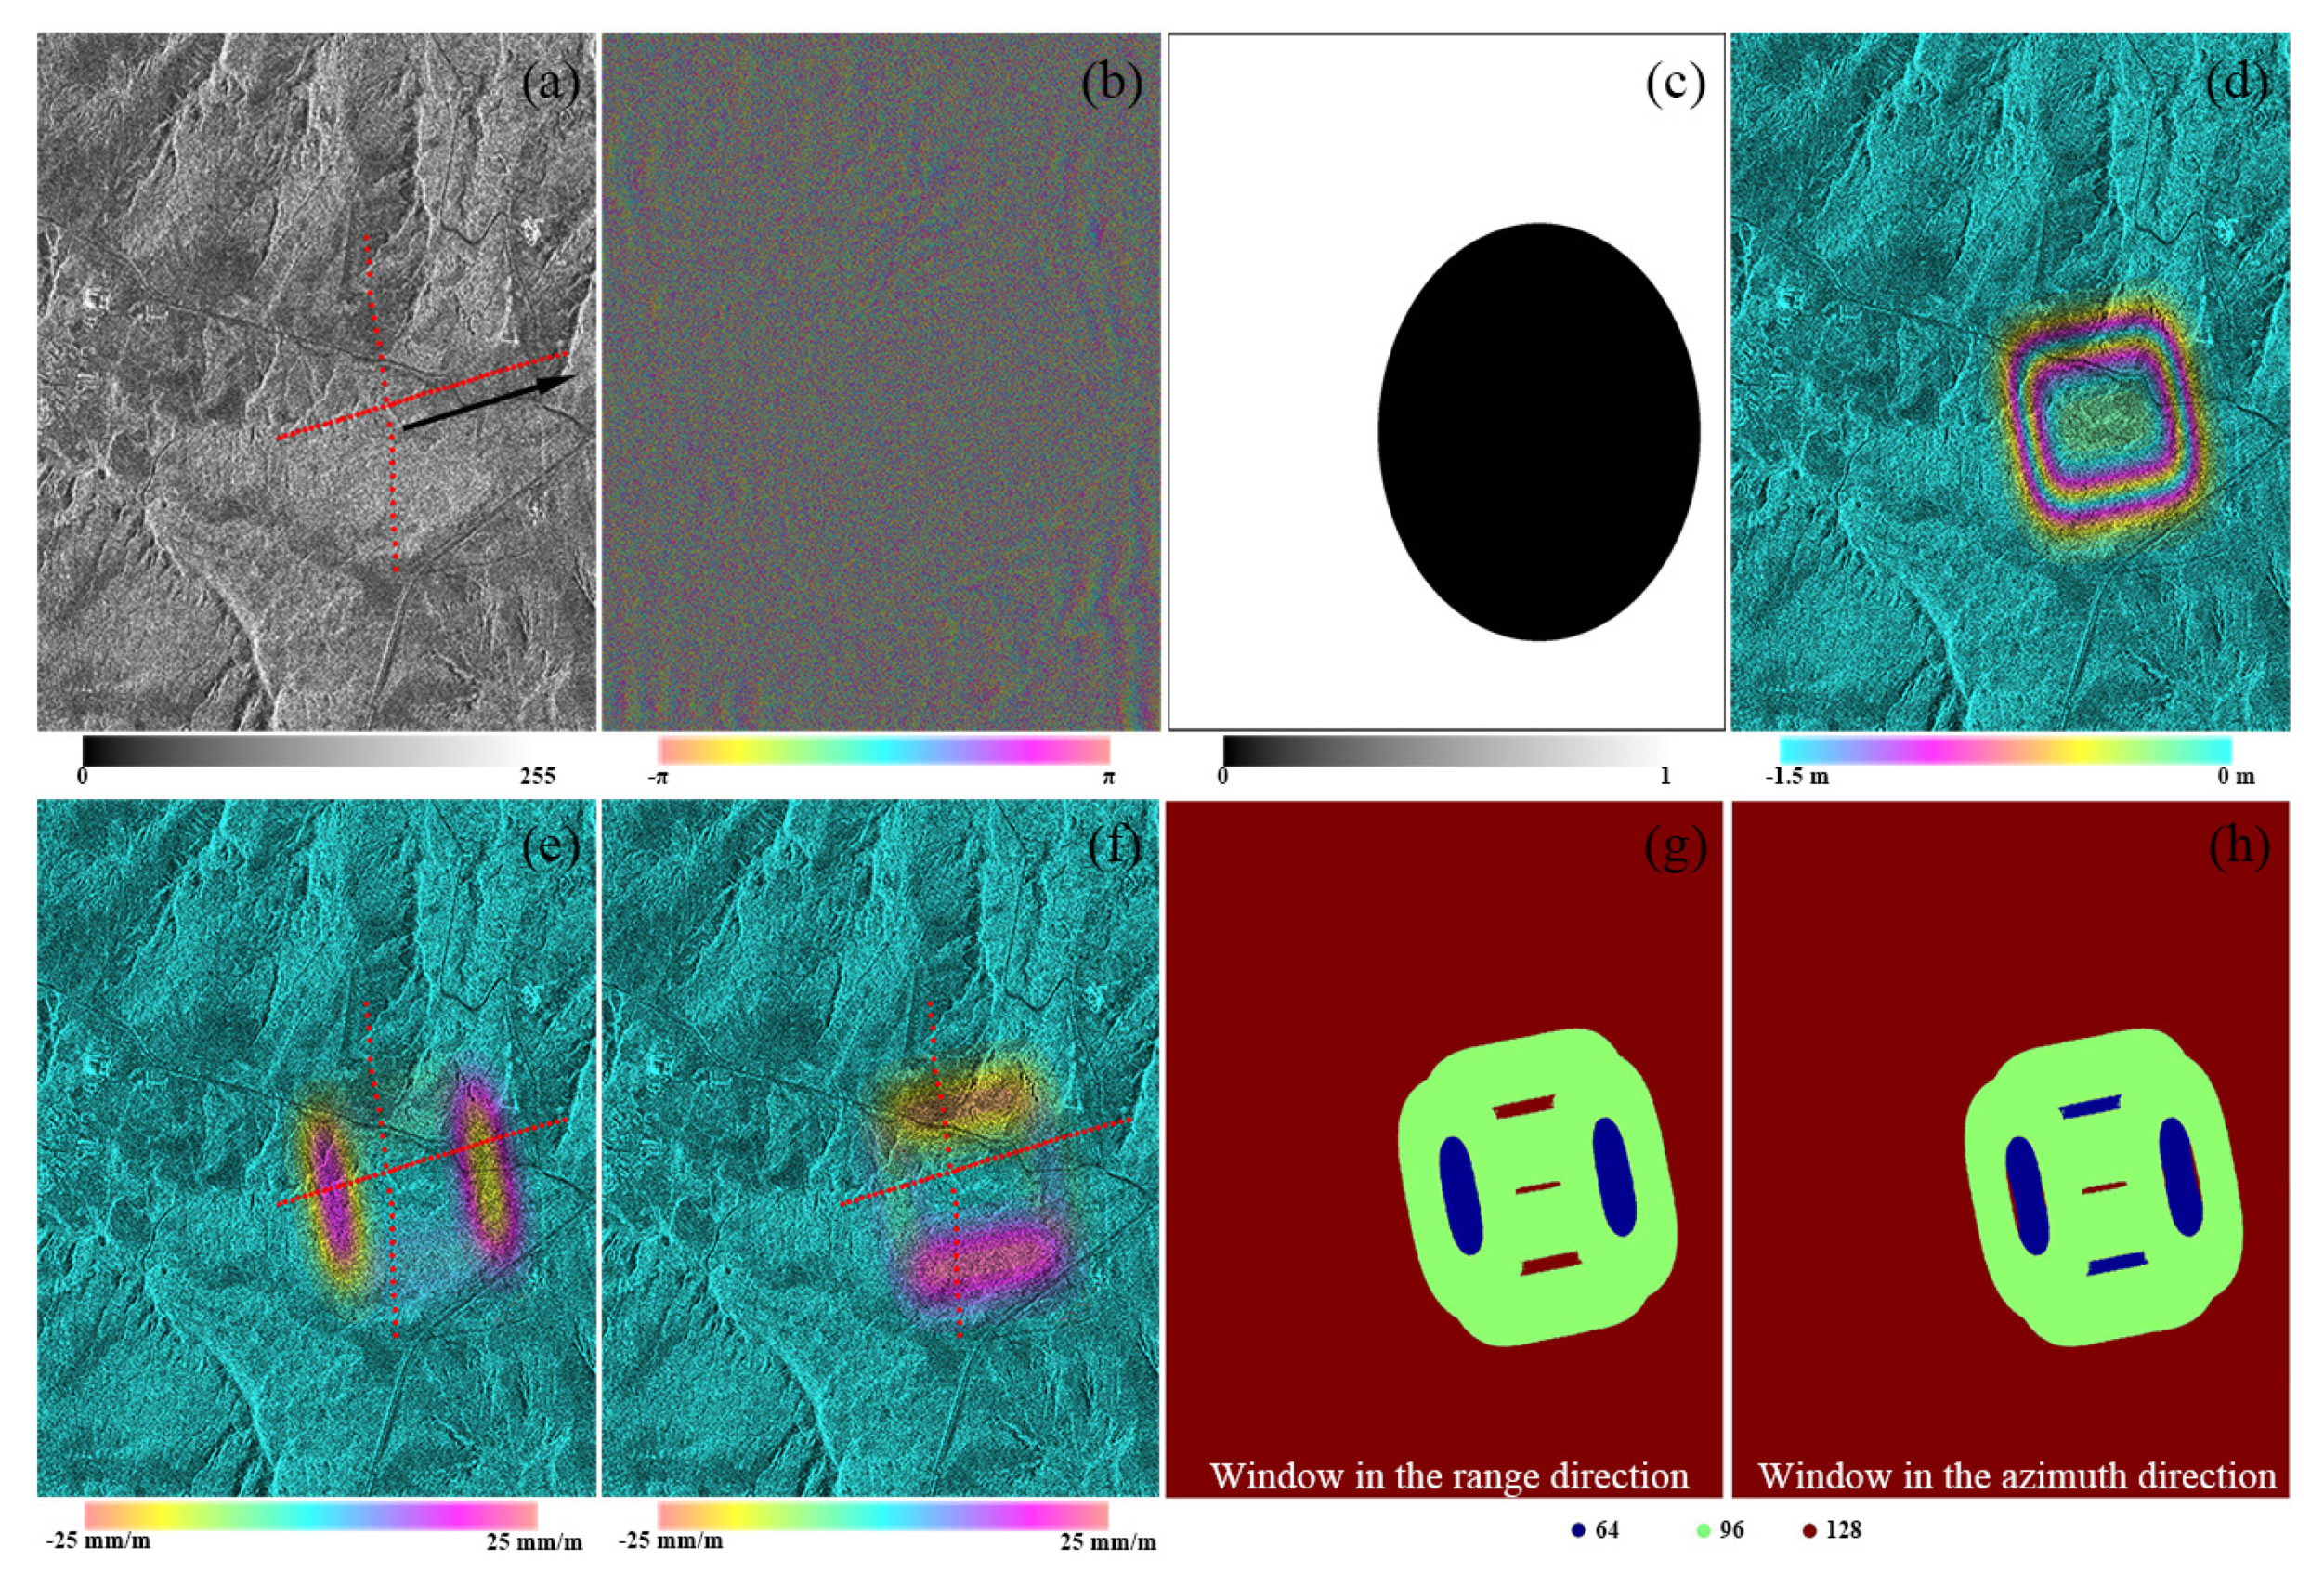
Figure 10a is the intensity map of the master image. Red points in
Figure 10a,e,f indicate positions of GPS observation points, and black arrows in
Figure 10a represent the SD of the working face.
Figure 10b is the interferogram generated by the master and slave images. The long temporal span and large-scale deformations have results in serious interferometric decorrelation, and InSAR cannot effectively obtain correct deformations.
Figure 10c is a mask file generated according to
Figure 10b, where the white area represents the stable area and the black area represents the deformation area.
Figure 10d exhibits the surface deformation of the working face with the maximum deformation of −3.2086 m in the LD simulated by using PIM parameters of the mining area and working face parameters.
Figure 10e,f is deformation gradients in the RD and AD directly calculated according to Equation (1) and
Figure 10d. The ranges of deformation gradients in the RD and AD are [−36.7, 37.5] and [−36.4, 37.1] mm/m. It can be seen from the figure that more observation points in the SD are located where deformation gradients are larger in the RD and are smaller in the AD, and more observation points in the DD are located where deformation gradients are smaller in the RD and are larger in the AD.
The temporal span is 143 days, and some surface features have undergone drastic changes, and orbit, atmosphere, and topography fluctuation will cause some noises. Therefore, this experiment should use large CCWs to suppress noise influences on offset-tracking results. For stable areas, CCWs of 128 × 128 pixels are selected. This experiment only uses 1 mm/m and 20 mm/m as deformation gradient thresholds. The selection method of adaptive CCWs used in this experiment is shown in
Table 7, and CCW sizes used in this experiment are shown in
Figure 10g,h.
This oversampling factor selected in this experiment is 4, the interpolation factor of CC matrix is 8, CC threshold is 0.1, step size is 1 pixel, the size of the SAR images used is 1200 × 1500 pixels, and the software for offset-tracking is GAMMA software. The adaptive CCWs as shown in
Figure 10g,h is used for offset-tracking, and the result in the LD is shown in
Figure 11. To evaluate the reliability and effectiveness of the proposed OTM, CCWs of 64 × 64, 96 × 96, 128 × 128, 64 × 128, and 128 × 64 pixels are also used for offset-tracking, and offset-tracking results in the LD are shown in
Figure 11. There are obvious noises in the deformation map with CCWs of 64 × 64 pixels, which indicates that smaller CCWs cannot suppress noise well. Deformation noises with CCWs of 96 × 96, 128 × 128, 64 × 128, and 128 × 64 pixels are better suppressed, but part of deformations in larger deformation gradient areas are compressed.
Because CCWs of 64 × 128 pixels in the RD are small, deformations in larger deformation gradient areas in the RD can be better retained. However, due to large CCWs of 64 × 128 pixels in the AD, deformations in larger deformation gradient areas in the AD are seriously compressed. Deformations with large CCWs of 128 × 64 pixels in larger deformation gradient areas in the RD are seriously compressed, while deformations with small CCWs of 128 × 64 pixels in large deformation gradient areas in the AD can be better retained. When the proposed OTM is used, deformation noises can be well suppressed in stable areas, and deformations in larger deformation gradient areas can be well retained.
5. Discussion
GPS measurement provides ground deformations in east, north, and vertical directions. To compare GPS measured deformation with the proposed OTM derived deformation in the LD, Equation (2) is used to convert the GPS three-dimensional deformation into the LD:
where
θ is the SAR viewing angle of radar wave,
δ is the satellite heading angle,
Dlos,
Dv,
De and
Dn represent the deformation in SAR LOS, vertical, east, and north directions respectively.
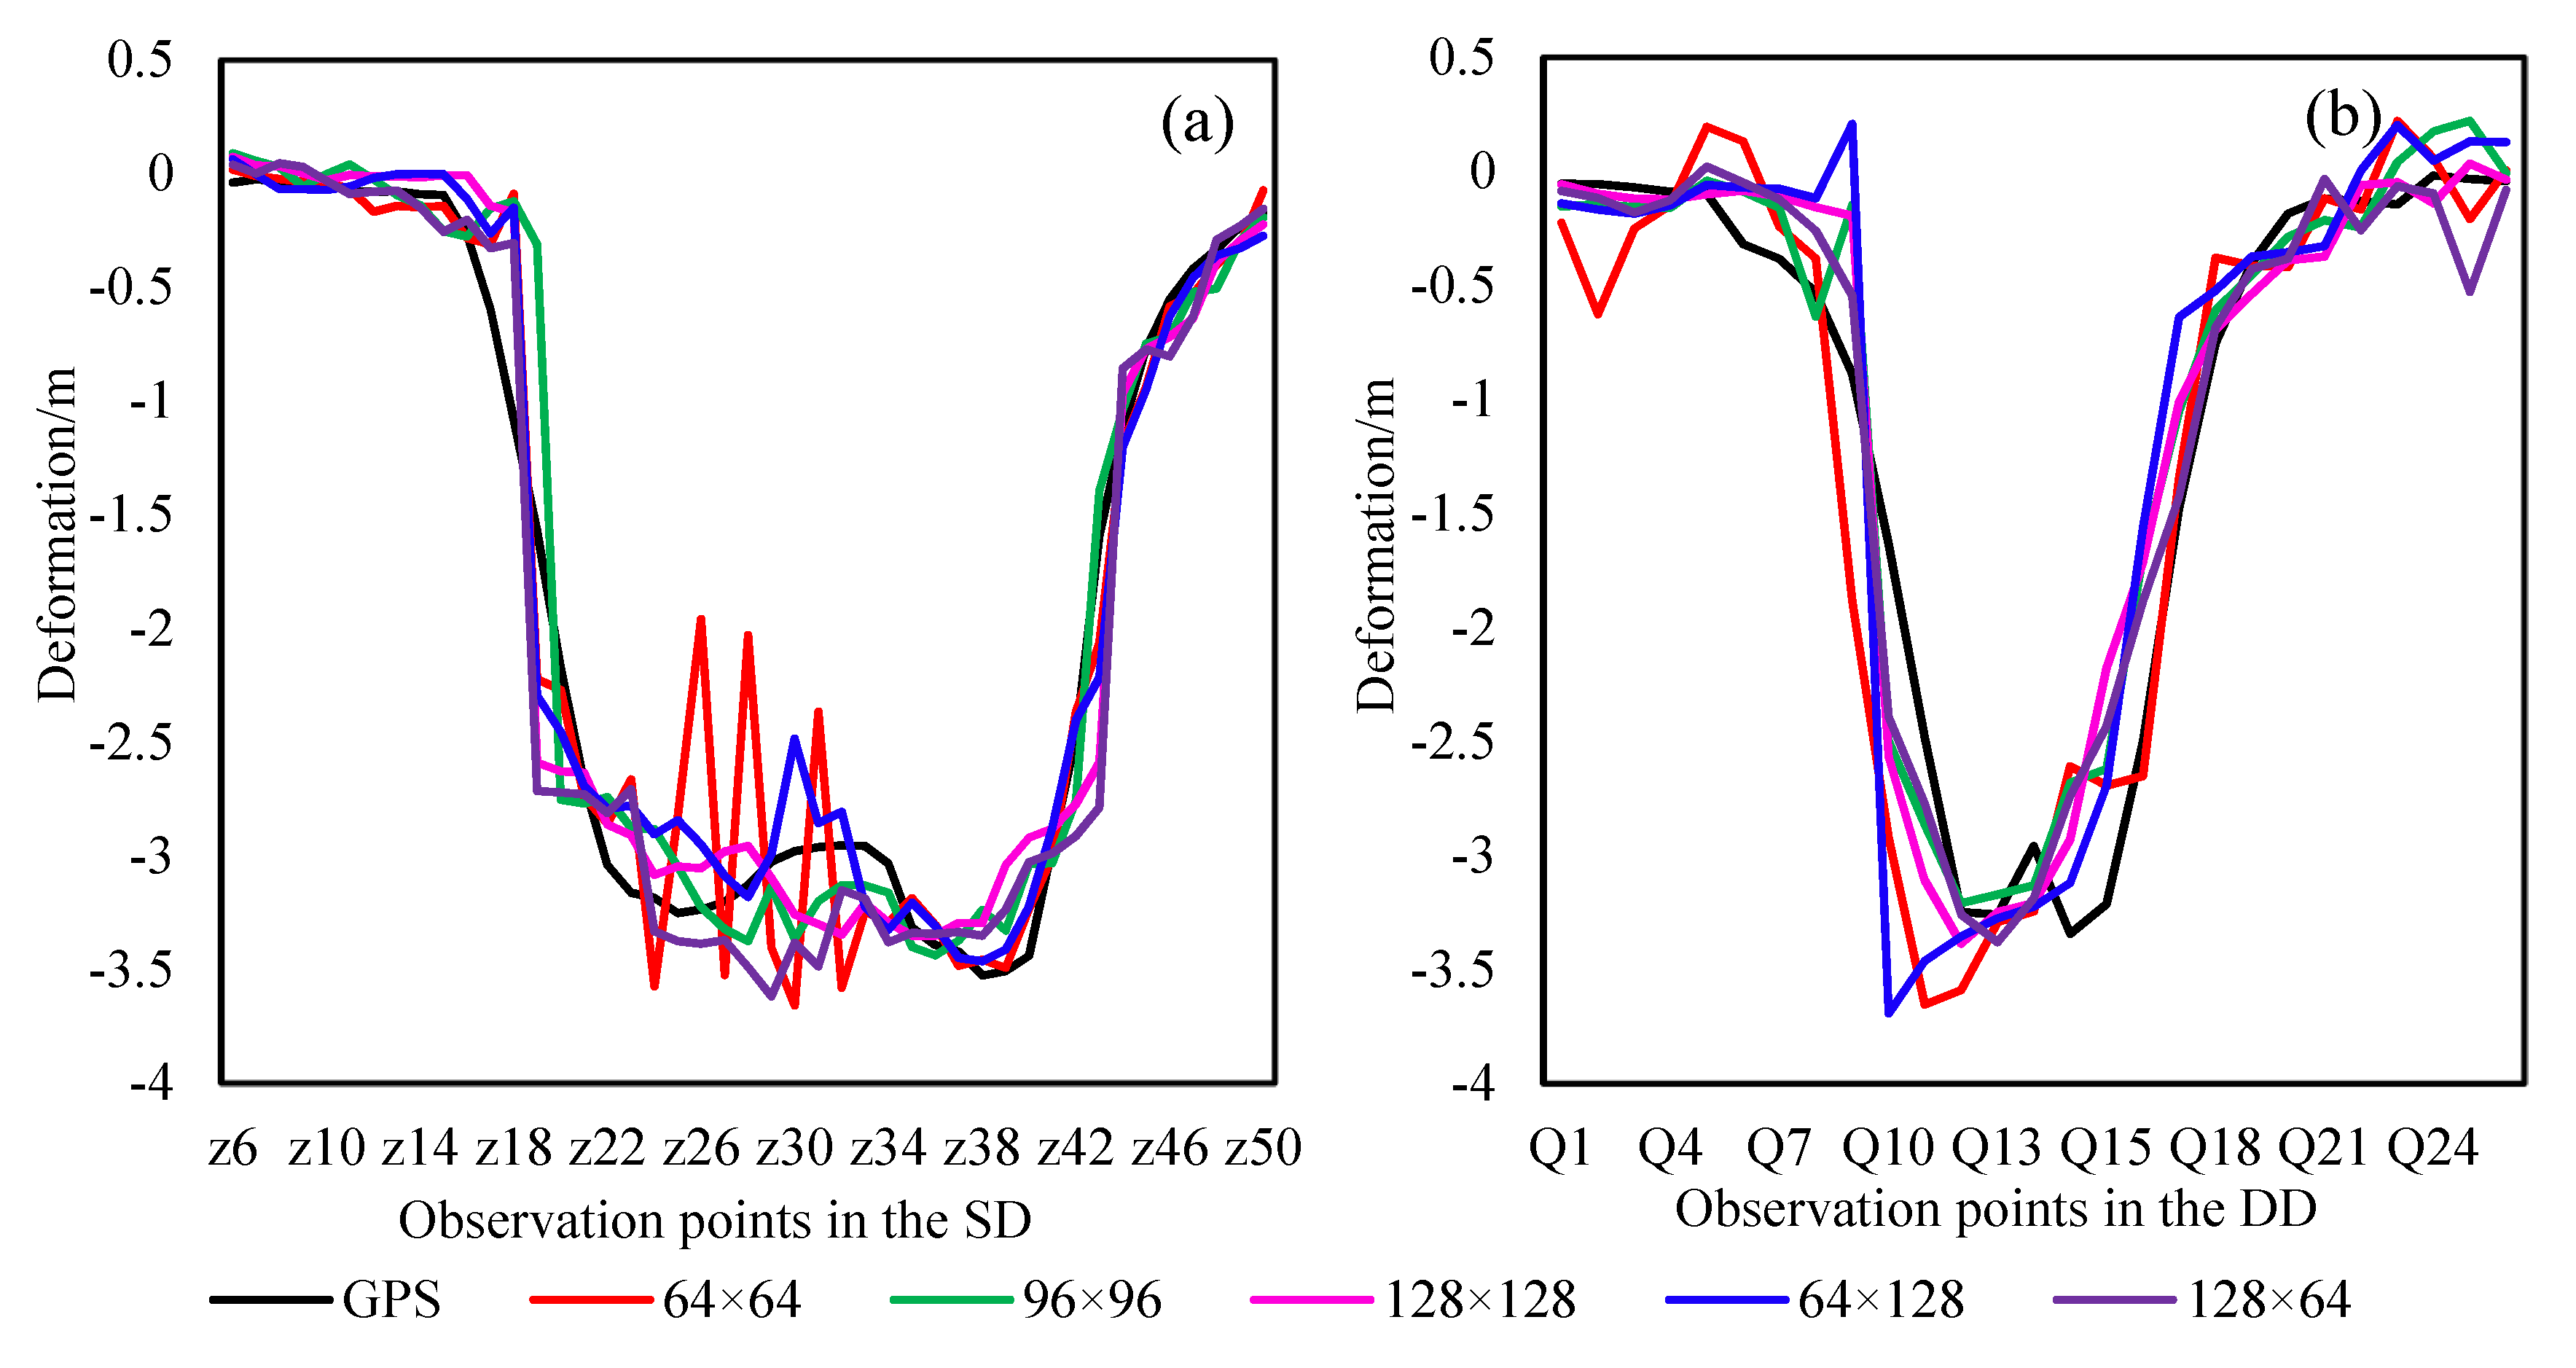
Figure 12a,b exhibit deformations in the LD derived from OTM with CCWs of 64 × 64, 96 × 96, 128 × 128, 64 × 128, and 128 × 64 pixels and GPS measurement over the z6–z50 observation points in the SD and the Q1-z33-Q26 observation points in the DD. In larger deformation gradient areas, especially near the observation points z18, z43, and Q10, all deformation results show a sharp decline. This is because the surface intensity information of the image pair has undergone drastically changes (as shown in the red ellipse in
Figure 13), which greatly reduces the accuracy of OTM. In addition, the study area is characterized by thick loose seam, high soil silt content, low water content, and low toughness. According to the geomorphological characteristics of this area, when the tensile deformation gradient exceeds 0.16 mm/m, tensile fissures begin to develop, and the larger the tensile deformation gradient, the larger the fissures width. When the compression deformation gradient exceeds 5 mm/m, extrusion fissures begin to develop, and as the compression deformation gradient value increases, the fissures height increases gradually [
29]. In accordance with the geological characteristics of this area, the ground with large deformation gradients is prone to ground fissures and steps (
Figure 14). In this study area, the width of the widest ground fissure can reach 0.5 m, and the highest step can reach 1.2 m. When large fissures form on the ground, dramatic intensity changes will cause image mismatch and meanwhile result in significant decreases in the accuracy of OTM. In small deformation gradient areas, deformation results with CCWs of 64 × 64 pixels appear as an obvious jumping feature, which indicates that the noise suppression effect with small CCWs is poor.
Figure 15a,b exhibit deformations in the LD derived from the proposed OTM and GPS measurement over observation points in the SD and DD, together with differences between the two methods. The deformation with adaptive CCWs is similar to the GPS measured data, indicating that this method has high reliability. However, for larger deformation gradient areas, deformation results are different from the GPS measured data due to drastic intensity changes of the image pair.
Table 8 shows RMSEs and maximum differences between deformations in the LD extracted by OTM using various CCWs and GPS measurement over observation points in the SD and DD. As can be seen from
Table 8, deformation RMSEs extracted by OTM using adaptive CCWs are the smallest. Deformation RMSEs with CCWs of 64 × 128 pixels in the SD and with CCWs of 128 × 64 pixels in the DD are the second-smallest. Because more observation points in the SD are located where deformation gradients are larger in the RD and are smaller in the AD, CCWs with smaller sizes in the RD and larger sizes in the AD should be selected for deformation extraction. Because more observation points in the DD are located where deformation gradients are smaller in the RD and are larger in the AD, CCWs with larger sizes in the RD and smaller sizes in the AD should be selected for deformation extraction. Therefore, deformation monitoring accuracies with CCWs of 64 × 128 pixels in the SD and with CCWs of 128 × 64 pixels in the DD are higher than those with CCWs of the other fixed pixels.
Comparing CCWs of 64 × 64, 96 × 96, 128 × 128, 64 × 128, and 128 × 64 pixels: the accuracy of the proposed OTM in the SD is improved 148.3 mm, 60 mm, 84.8 mm, 15.7 mm and 106 mm, respectively, which is equivalent to increases of 37.4%, 19.4%, 25.4%, 5.9%, and 29.9%, respectively; in the DD, it is improved—175.0 mm, 49.5 mm, 99.1 mm, 284.2 mm, and 21.4 mm, respectively, which is equivalent to increases of 36.6%, 14.0%, 24.6%, 48.4%, and 6.6%, respectively. This demonstrates that the proposed OTM is effective.
Maximum differences between deformation results extracted by OTM using various CCWs and GPS measurement data are about 1 m, and most of them are located in areas with large deformation gradients and drastic intensity changes. For this area, the accuracy of the proposed OTM is also low. When the surface intensity changes dramatically, the similarity of intensities of the master and slave images is low, which will cause significant reduction in the CC. Further, the matching accuracy will be reduced, and simultaneous offset is inaccurate. Therefore, when deformation gradients are large, to avoid the low accuracy of the OTM caused by drastic intensity changes, the temporal span of image pairs should be reduced to avoid drastic intensity changes.
In conclusion, the proposed OTM is effective and reliable in extracting large mining-induced deformations. The proposed method can not only ensure the accuracy of deformation, but also effectively suppress noise and greatly improve the monitoring accuracy.


 ,
, 


