Spatial Relationship between Irrigation Water Salinity, Waterlogging, and Cropland Degradation in the Arid and Semi-Arid Environments


Department of Earth and Space Sciences, Lamar University, Beaumont, TX 77710, USA
Remote Sens. 2021, 13(6), 1047; https://doi.org/10.3390/rs13061047
Submission received: 1 February 2021
/
Revised: 6 March 2021
/
Accepted: 8 March 2021
/
Published: 10 March 2021
(This article belongs to the Section Remote Sensing in Agriculture and Vegetation)
Abstract
:Water scarcity in arid and semiarid regions has resulted in using of low-quality waters for crop irrigation. This study aims to investigate the spatial relationship of low-quality irrigation water and waterlogging in arid and semiarid environments. The multi-decadal (1990–2020) time series Landsat images and hadrochemical water analysis were employed within geographical information system mapping (GIS) to understand the relationship between irrigation water, soil salinity, and waterlogging in the western Nile Delta, Egypt. The normalized difference water index (NDWI) and the normalized difference vegetation index (NDVI) from the Landsat images were combined to quantify the Spatiotemporal changes in the croplands and waterlogging from 1990 to 2020. ArcGIS inverse distance weighted (IDW) interpolation was used to create spatial layers of irrigation water salinity from electrical conductivity (EC), sodium adsorption ratio (SAR), and soluble sodium percentage (Na%). The results demonstrated a significant spatial relationship between waterlogging and EC, SAR, and Na% in irrigation groundwater. Long-term irrigation with high salinity groundwater led to increased soil salinity, low soil permeability, and waterlogging. This study offers a time- and cost-efficient geospatial method for regional monitoring of surface waterlogging and mitigation strategies for cropland degradation and agricultural drainage water recycling that would benefit stakeholders and decision-makers.
1. Introduction
Due to an ever-growing population with its increasing demand for food supplies, the world faces a global food crisis [1]. Population growth and the impending global water crisis present the two most significant dangers to the agriculture sector and economic development. The increase in water consumption, in conjunction with global climate change, has resulted in severe water shortages throughout the world. Water scarcity in arid and semiarid regions has resulted in using of low-quality waters for crop irrigation [2]. The use of low-quality water in irrigation systems and poorly drained soil causes a breakdown in soil structure and results in soil hardpan, making it difficult for water to infiltrate, leading to a rising water table that induces salinity and waterlogging problems and cropland degradation [1]. The concentration and composition of soluble salts in water determine their quality for irrigation. Generally, the basic criteria for evaluating water quality for irrigation, including water salinity (total dissolved solids—TDS), sodium hazard (sodium adsorption ratio—SAR), residual sodium carbonates (RSC), and ion toxicity [3]. However, even water with considerably high TDS concentration can be used for irrigation without endangering soil productivity, provided selected irrigation management to maintain existing salt balance in the plant root zone [4,5]. A high TDS in irrigation water increases the sodium hazard; the soil then becomes hard and compact when dry and increasingly impervious on the infiltration of irrigation water, increasing soil salinity and waterlogging [3]. Cropland waterlogging in the arid and semiarid regions most probably related to using low-quality water, unsuitable irrigation practices, and poorly drained soil [5]. High TDS and sodium hazard result in the formation of a shallow impermeable crust (hardpan) that induces waterlogging problems and leading to cropland degradation. The relationship between waterlogging and salinization has been reported in several studies [6,7,8,9]. They concluded that salinization and waterlogging have adverse effects on plant growth and crop yield by reducing soil aeration around the root zone and increasing the osmotic potential of the soil solution. Moreover, high concentrations of sodium in irrigation water can induce calcium and potassium deficiency in soils, and waterlogging may result due to the degradation of well-structured soils.
Soil salinity negatively affects crop growth and productivity, leading to land degradation, especially in arid and semiarid areas [10]. Soil salinity either occurs naturally from the weathering of rocks and primary minerals or is human-induced by using high salinity irrigation water [11]. Remote sensing techniques have been used for assessing and monitoring soil salinity. Soil salinity can be detected directly by the spectral signature of white salt crusts at the bare soil surface or indirectly from indicators such as halophytic plant and the crop yield of salt-tolerant crops such as alfalfa, rice and cotton [12,13,14,15,16,17]. Remote sensing indices, such as the salinity index (SI), brightness index (BI), normalized difference salinity index (NDSI) and normalized difference vegetation index (NDVI), have been used to assess the salinity of bare soil and monitor vegetation behavior in saline environments [16,18]. Different studies found that a high correlation between the in situ electrical conductivity (EC) measurements and spectral indices derived from satellite images [17,19,20,21]. Numerous studies investigated the relationship between soil salinization, waterlogging, and plant yields. Waterlogging is often accompanied by soil salinization as waterlogged soils prevent leaching of the salts imported by the irrigation water [22,23,24]. Refs. [5,25,26] presented a review on the impacts and management strategies for crop production in saline and waterlogged soils. The study revealed that crop losses due to soil waterlogging are predicted to increase owing to changing temperature and precipitation patterns associated with climate change. The recommended management practices need to be used to mitigate soil waterlogging stress, such as the use of flood-tolerant varieties, improving drainage, and practicing adaptive nutrient management strategies.
Several studies presented conventional techniques such as ground surveying and groundwater flow modeling for the waterlogged areas [27,28,29]. Conventional methods are usually time and cost-consuming. Remote sensing and geographical information systems (GIS) techniques have been used as time and cost-effective tools for monitoring and assessment of waterlogged croplands [30,31,32]. The normalized difference vegetation index (NDVI) was used for the assessment of crop yield reduction due to waterlogging [33]. Time-series analysis of moderate resolution imaging spectroradiometer (MODIS) imagery was used for monitoring waterlogged croplands in Jianghan Plains, China [34]. Reference [35] used high spatial resolution optical satellite images and field observations for mapping waterlogging damage on winter wheat in southeast China. The NDVI and vegetation indices (VIs) were utilized as independent variables for leaf area index (LAI), biomass, and yield estimation. The results indicated that the estimation and dynamic mapping of LAI and biomass had provided the possibility of monitoring the impact of waterlogging on winter wheat growth. Reference [36] used Landsat thematic mapper (TM), enhanced thematic mapper (ETM) satellite images, and the digital elevation model (DEM) to examine the spatial relationship of the drainage networks and waterlogging in the Farafra Oasis, Western Desert of Egypt. The results indicated that the geomorphology of closed drainage basins must be considered when planning for new cultivation in dryland catchments to better control waterlogging hazards [36]. Reference [37] presented a review on the application of GIS and remote sensing techniques for managing the salinization and drainage problems of irrigated areas. The study also revealed that the geospatial techniques are more efficient and are proficient in offering information on the area under irrigation, type of crops, the water requirement of crops, land cover and land use, and the degree of land salinization. Reference [38] designed a comprehensive model of agricultural drought and waterlogging that considers the continuum system of atmosphere, crops, and soil moisture impacts on droughts and waterlogging events and to analyze the temporal and spatial distribution of such events in the development of maize. The index combined the actual evapotranspiration, potential evapotranspiration, Palmer drought severity index (PDSI), and soil moisture datasets from the TerraClimate dataset, and the GIMMS 3 g NDVI from the NASA Earth Exchange. The results showed the drought and waterlogging events from 1982 to 2015 in the Heilongjiang Province, China. Reference [39] used the vegetation indices (VIs) derived from multiple high spatial resolution remote sensing data, i.e., Pleiades-1A, Worldview-2, Worldview-3, and SPOT-6, to estimate the dry above-ground biomass of oilseed rape and track the seasonal growth dynamics under waterlogging condition. Their results demonstrated that high spatial resolution satellite data makes parcel-scale monitoring possible, and the multi-source high spatial resolution satellite data can be used to map the time series oilseed rape growth condition under waterlogging conditions. Reference [40] used the normalized difference water index (NDWI) and the normalized difference vegetation index (NDVI) from the Landsat images for mapping the cultivated lands and surface waterlogging in the Nubariya area. Their results indicated that the geospatial method provides an effective tool for mapping waterlogged areas. They concluded that the lack of a drainage system and low topography are the main causes of waterlogging. They recommended hydrochemical analysis for irrigation water samples to investigate the salinity and soil infiltration.
The lack of systematic monitoring of irrigation water quality and management procedures of waterlogging is ultimately leading to crop yield reduction and degradation of cropland. Therefore, practical tools for assessing waterlogging are required to assist decision-making in monitoring waterlogging and degradation of croplands. The objective of this study was to employ remote sensing techniques and hydrochemical water analysis within GIS for mapping the waterlogging in croplands and to investigate the spatial relationship of irrigation water salinity and waterlogging in the arid and semiarid environments.
2. Study Area
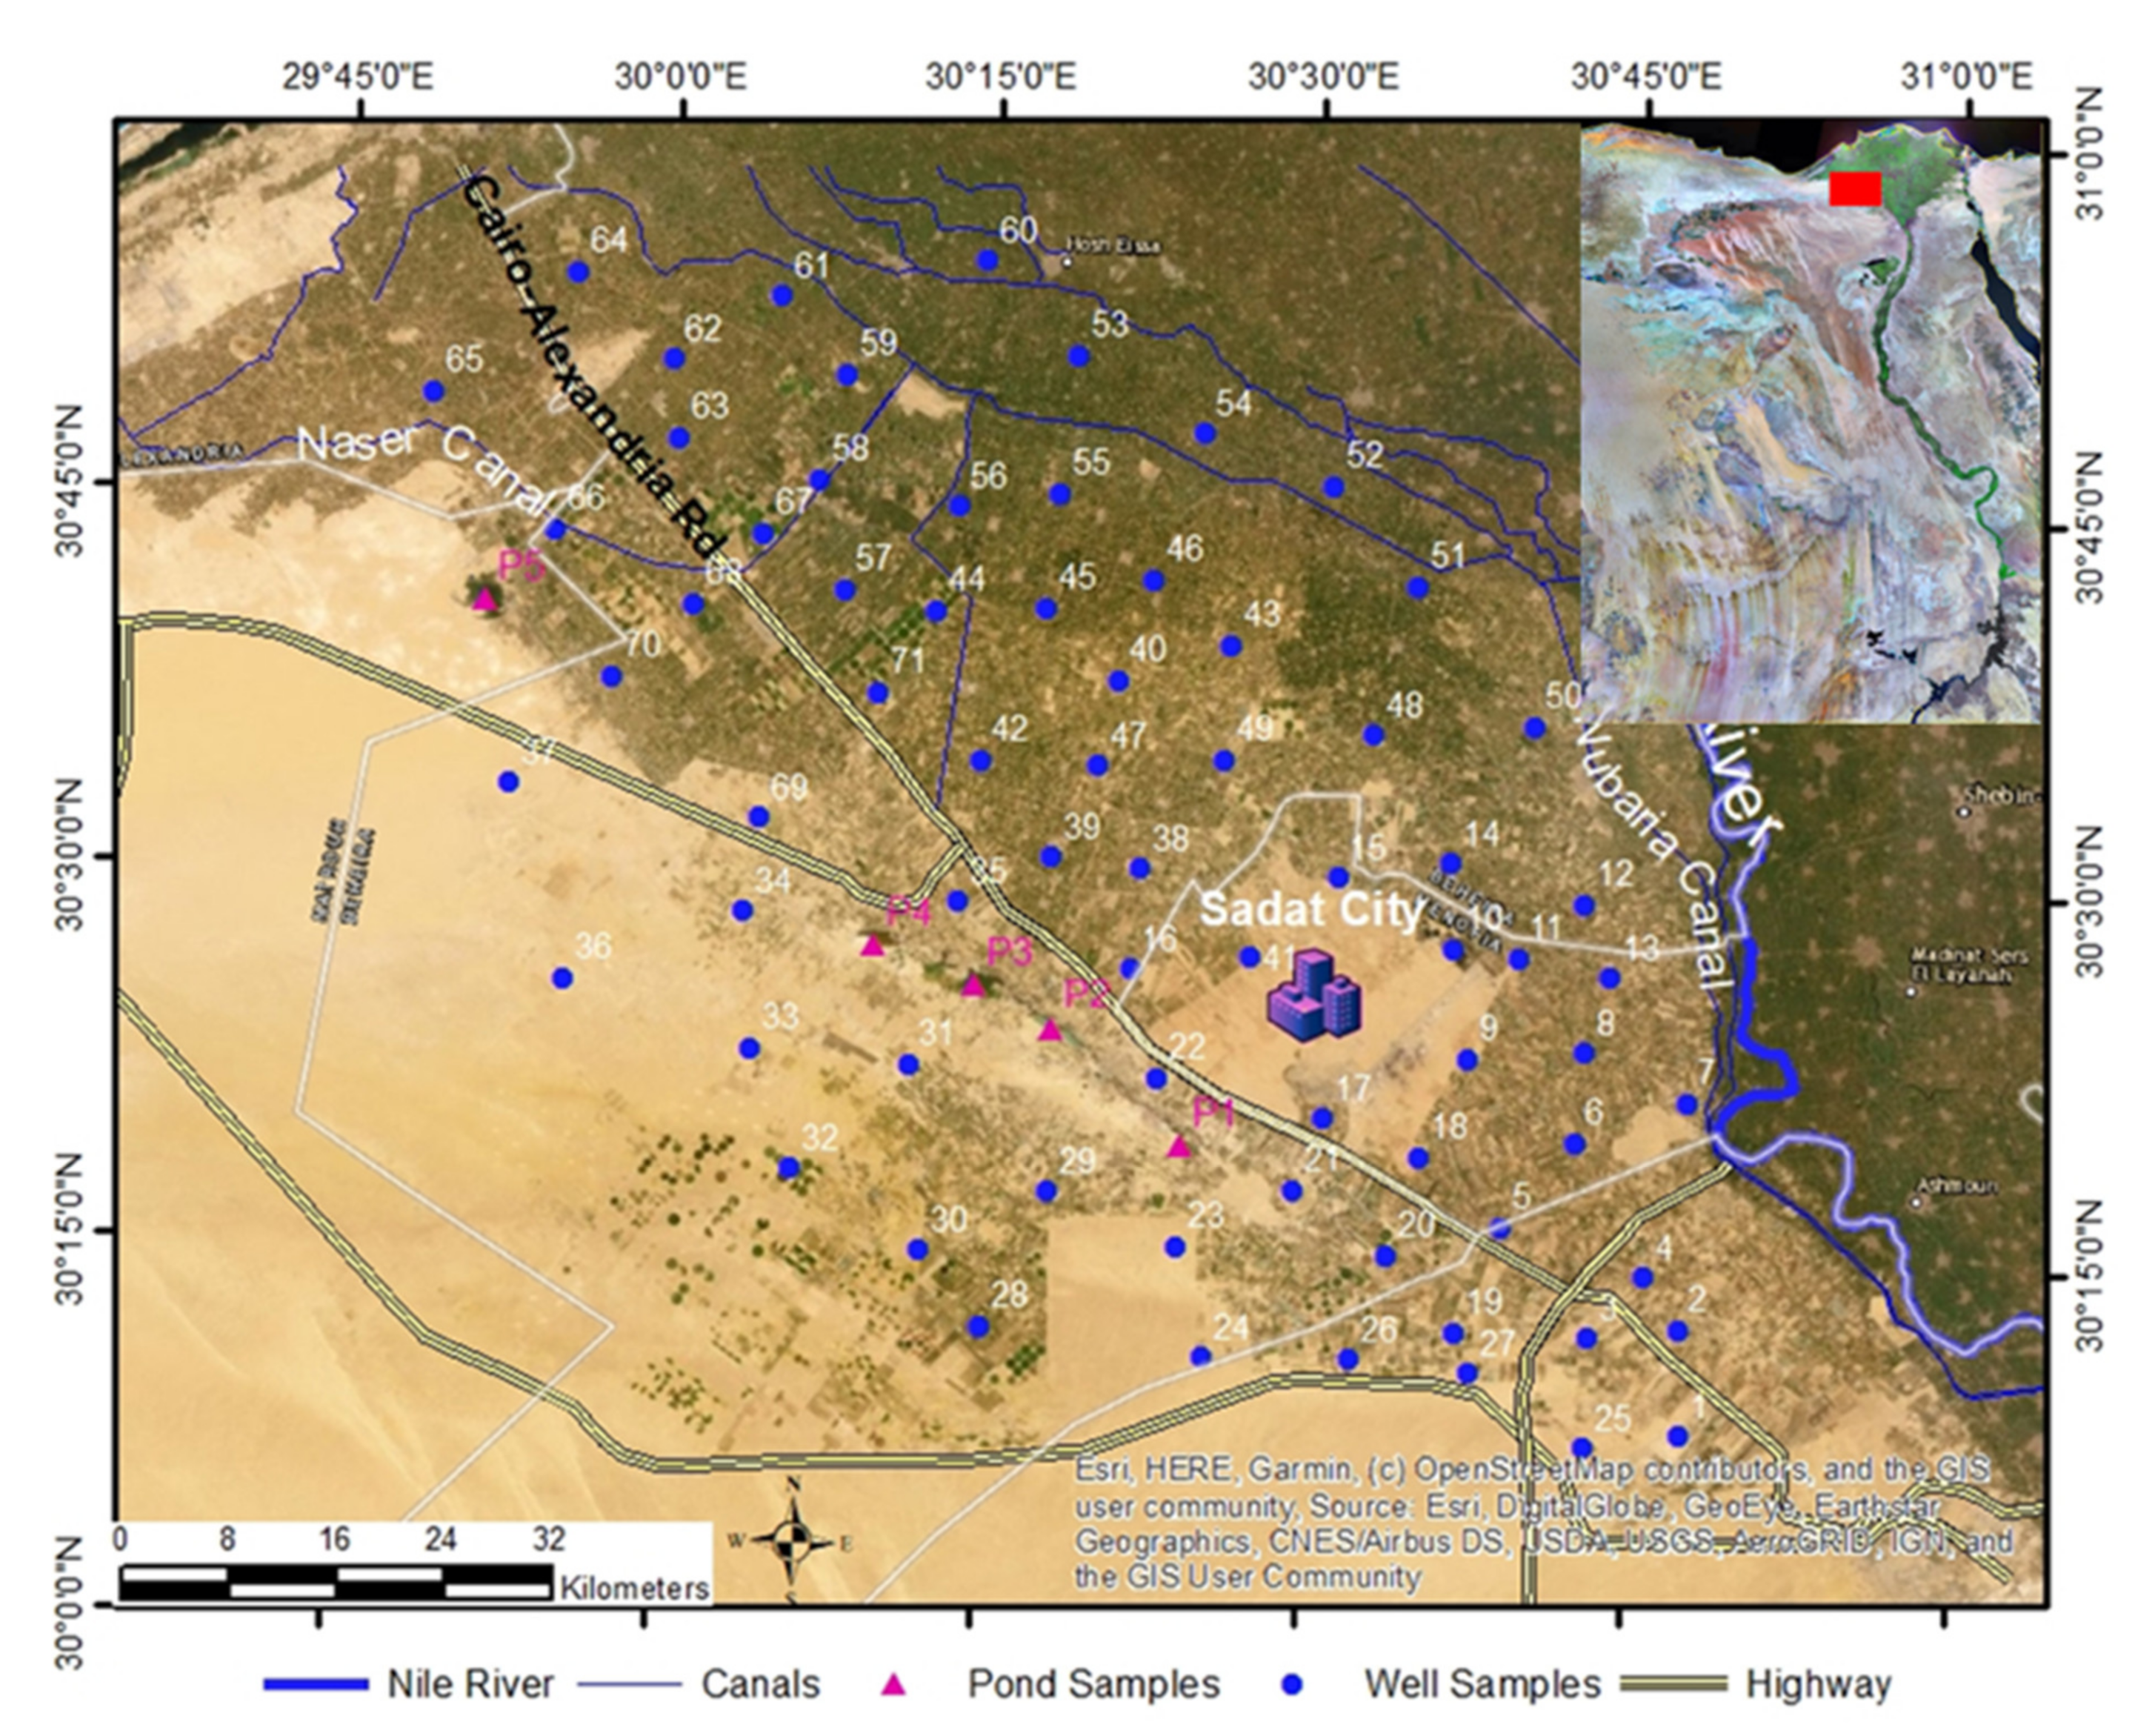
Egypt is a developing country that has the largest population in the Middle East and a population growth rate of over 2.5 percent a year. Owing to the combination of a rapidly expanding population and arid climate, Egypt faces rising food insecurity and is struggling to meet its basic food and water needs [1]. The cultivated lands in Egypt are confined to the course of the River Nile within its valley and delta. There are scattered minor patches of cultivated lands that occur in the oases of the Western Desert and the Nile Delta margins (e.g., Nubariya and Wadi Al Natroun), all of which mostly depend on groundwater resources. The present study was conducted in the western Nile Delta region, which is located in the northwestern Desert of Egypt and includes Nubariya, Badr, and Wadi Al Natrun (Figure 1). It is characterized by typical Mediterranean arid weather that receives less than 30 mm of rain annually [41]. The main cultivated crops are corn, wheat, potatoes, citrus, olive, and grapes. Nubariya Canal and its branches provide water for drinking and partially for irrigation in the eastern part of the study area, but groundwater is the main source for irrigation in the western Nile Delta region. Sprinkler and drip irrigation is the dominant systems in the region. Croplands in the western part of the study area are witnessing yield reduction, soil salinity, and waterlogging. The area is covered by the calcareous soils that dominate the northern and western parts, consisting of calcareous sandy loam. The southern part of the study area is covered by sandy soils.
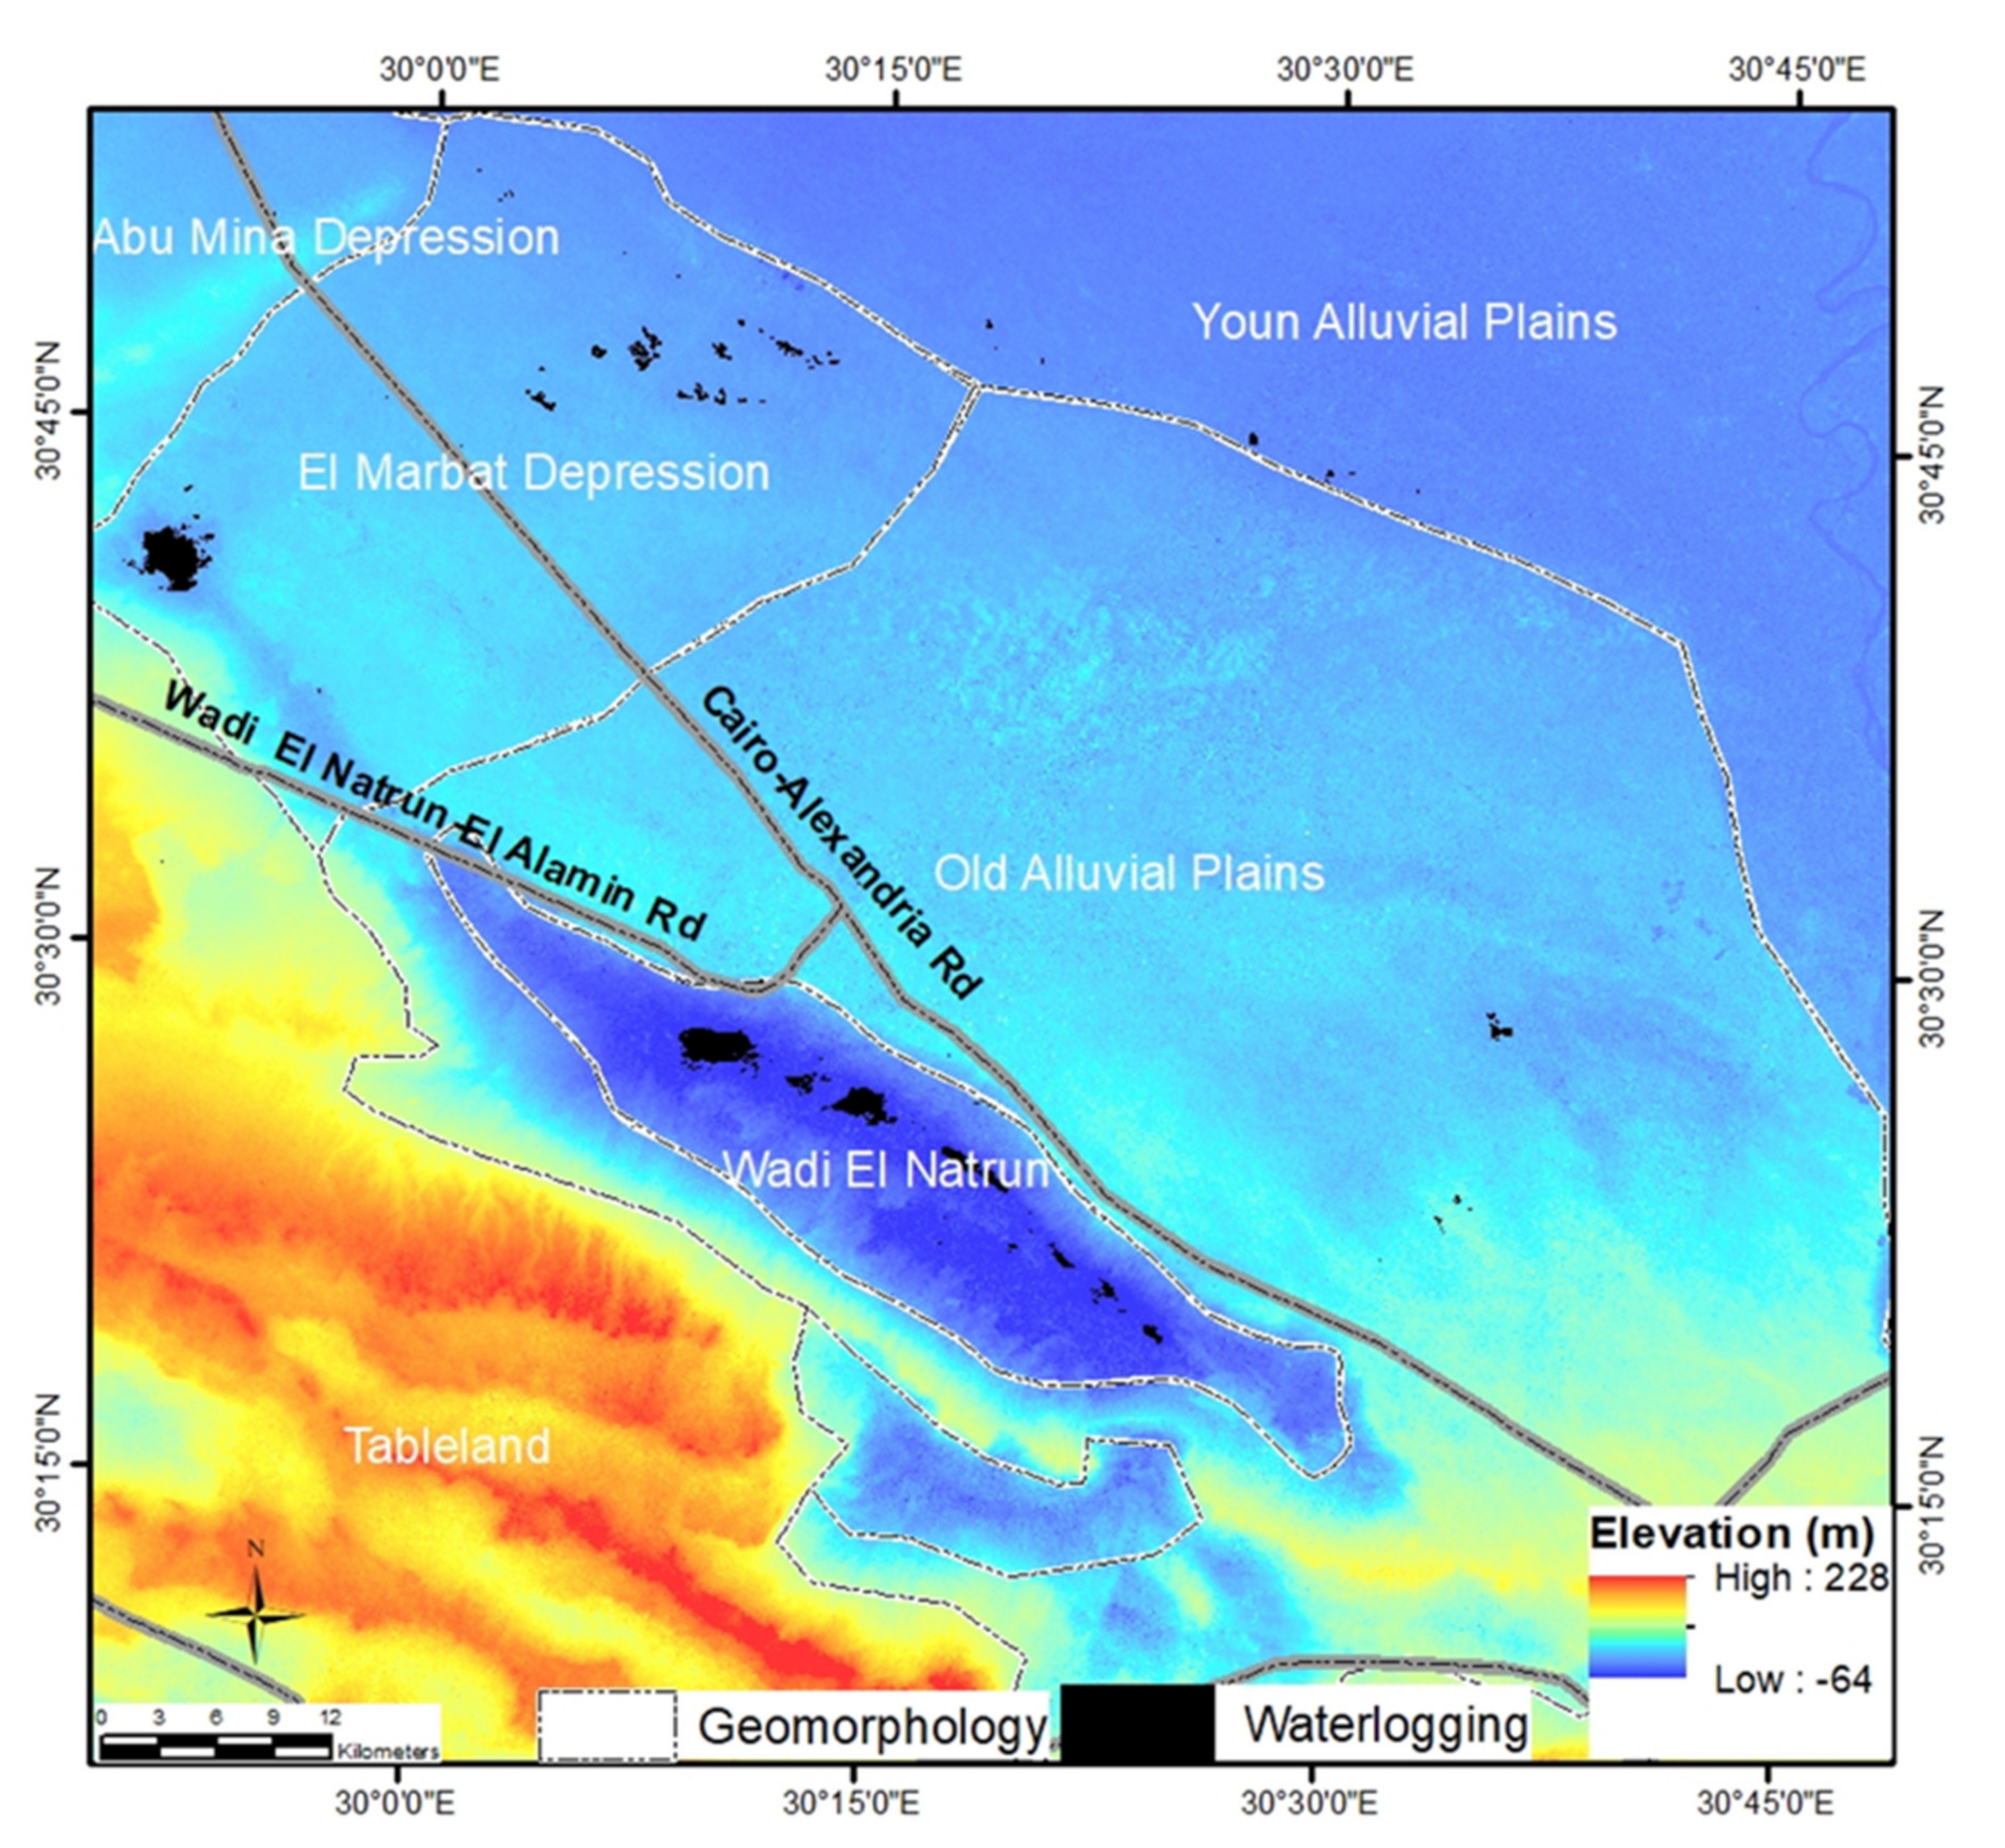
Geologically, the western Nile Delta region consists of Pliocene and Quaternary alluvial and deltaic deposits, Quaternary dune deposits, and sabkha deposits in Wadi El Natrun [42]. Geomorphologically, the area has been subdivided into tablelands and alluvial plains. Tablelands include ridges and depressions that occupy the western and southern parts of the study area [42]. The alluvial plains were classified into the old and young alluvial plains. The young alluvial plain lies between the Abu Mina Depression and Rosette Branch of the Nile. The old alluvial plain is located to the south of the young alluvial plain and occupies the northern and eastern areas of Wadi El Natrun. The slope of the old alluvial plain is directed to the north and northeast, and it varies in elevation between 15 m and 60 m (Figure 2). Wadi El Natrun is about 430 km2 and extends 50 km in the NW-SE direction with an average width of about 4 km. The lowest elevation is in the northern part, about −30 m below sea level and increases gradually southward to −10 m below sea-level (Figure 2). El Marbat depression is about 1000 km2 and located to the northeast of Wadi El Natrun between the old alluvial plains and Abu Mina depression. The floor elevation ranges from 5 m in the northwestern part to 30 m above sea level in the southwestern part (Figure 2).
Hydrogeology
Groundwater is the main source for irrigation in the western Nile Delta region (Figure 1). Groundwater is extracted from four main aquifer systems that comprise the Quaternary Delta aquifer, the Pliocene Wadi El Natrun aquifer, the Miocene El Moghra aquifer, and the Oligocene aquifer (Figure 3) [43]. The Oligocene aquifer is confined between thin limestone bands at the bottom and a thick basaltic sheet (~30 m) at the top. It consists of sand and gravel interbedded with clay. The Oligocene sediments fill the main channel of Wadi El Natrun; the total thickness is 400 m [44]. The isotopic analysis indicated that the Oligocene aquifer is paleowater [45]. The Moghra aquifer is located in the southern part of the study area (Figure 3). It is composed of sand and gravel of Moghra formation [46]. The aquifer thickness varies from a few tens of meters on the eastern side to 150 m in the Wadi El Farigh area and 250 m in the Wadi El Natrun area. It gradually increases in the northwest direction to attain a maximum thickness of about 1000 m in the vicinity of the Qattara Depression and Sidi Barrani [46]. The water table in the Moghra aquifer varies from 49 m in the area close to El Rayah El Naseri and increases westward to 138 m. Groundwater flow in the Moghra aquifer is westward to the Qattara Depression [46]. Wadi El Natrun aquifer is a local aquifer in the Pliocene beds that overlies the Moghra aquifer. Its thickness is about 140 m and decreases westward and southward of Wadi El Natrun. The Pliocene aquifer is mainly fed by lateral seepage from the Delta and Moghra aquifers [44]. The Quaternary aquifer occupies the northern and northeastern portions of the study area (Figure 3). It consists of successive layers of sand and gravel with some clay lenses of fluviatile origin. The thickness of the Quaternary aquifer is about 300 m which decreases eastward to 80 m nearby the Cairo–Alexandria highway [43]. The water table varies from a few meters close to the Nile Rosetta Branch to about 60 m nearby the Cairo–Alexandria highway. The main rechargeable source is the Nile River and seepages from adjacent canals, and infiltration from irrigation water return [43].
3. Materials
Data files of Landsat 4–5 thematic mapper (TM) and Landsat-8 operational land imager (OLI) from 1990 to 2020 were downloaded from the USGS Earth Explorer [47]. Decadal Landsat images were selected in the month of July because it is the driest season in Egypt to avoid any precipitation events and to minimize the influence of seasonal sun-angle and plant phenological differences that could negatively impact the change detection analysis (Table 1). The shuttle radar topography mission (SRTM) 1-arc seconds (30 m) digital elevation model (DEM) of the study was obtained from the USGS Earth Explorer [47].
Water samples were collected from seventy-one groundwater wells and five samples from the waterlogged induced water ponds in Wadi El Natrun (Figure 1). Water samples from water ponds were collected directly from the surface. Groundwater samples were collected from the farms running water wells during the irrigation process. Sample containers 1 L, double capped, polyethylene bottles were filled and clearly labeled with all details (i.e., Lat/Long; date, time) and tightly capped to avoid evaporation. Water samples were sent to the lab to measure the pH, electrical conductivity, and major ions.
4. Methods
4.1. Landsat Image Processing
The multi-decadal time series Landsat images were radiometrically calibrated to the top-of-atmosphere reflectance using the image’s gains, offsets, solar irradiance, sun elevation, and acquisition time defined in the metadata using ENVI 5.6 software. The normalized difference vegetation index (NDVI) was calculated to identify the spatial distribution and multi-decadal changes in the cropland areas from 1990 to 2020. The NDVI is one of the most widely used indices for vegetation delineation [48,49]. The NDVI was calculated from the red and the near-infrared bands that correspond to bands 3 and 4 in Landsat 4–5 and Landsat-7 and correspond to bands 4 and 5 in Landsat-8 (Equation (1)):
where NIR is the Landsat near-infrared band 4 and “Red” is band 3 in Landsat 4–5 and Landsat-7, and bands 2 and 5 are the equivalent bands in Landsat-8.
NDVI values are represented as a ratio ranging from +1.0 to −1.0. There are no constant NDVI threshold values because it varies from sensor-to-sensor, and within the same sensor (e.g., Landsat), it varies based on atmospheric conditions, sun angle, and phenological conditions. Herein, the NDVI threshold was set where areas of barren soil usually show low NDVI values (<0.25); sparse vegetation may result in moderate NDVI values (approximately 0.25 to 0.5) and high NDVI values (>0.5) correspond to dense vegetation.
The normalized water index (NDWI) was developed for the Landsat images to identify the waterlogging sites within croplands. The NDWI is a numerical indicator derived from visible and near-infrared or shortwave-infrared spectral bands [50,51]. Herein, we used the newly developed NDWI calculated as the normalized difference between the blue band and the SWIR band [40,52], Equation (2):
Where SWIR is the shorter wavelength region (1.55–1.75 µm), bands 1 and 5 are the equivalent bands in Landsat 4–5 and Landsat-7, and bands 2 and 6 are the equivalent bands in Landsat-8. NDWI values are represented as a ratio ranging from +1.0 to −1.0, where the positive values correspond to water areas, and the negative values correspond to non-water areas.
4.2. GIS Analysis
Geographic information system mapping (GIS) was used to organize, classify, extract, and analyze the results of Landsat images and water quality data using ArcGIS 10.7 software. The identified threshold was set for NDVI and NDWI images and reclassified using the ArcGIS reclassify spatial analyst method. Quantification of the multi-decadal croplands and waterlogging changes from 1990 to 2020 was performed by the image subtraction method [53,54,55]. An earlier date classified image was used as the initial state and subtracted from the later date classified image. Image subtraction via a pixel-by-pixel process facilitated the determination of the number of conversions from a land cover class to other categories and their corresponding area over the period evaluated. A new thematic layer containing different combinations of change classes was also produced.
To investigate the spatial distribution of salinity and sodium hazards in irrigation water, we used the geostatistical wizard and methods in ArcGIS (i.e., kriging/cokriging, empirical Bayesian kriging, and inverse distance weighting) to evaluate the dataset. The inverse distance weighted (IDW) method was suitable for our dataset, producing relatively smooth interpolation maps. Several studies have described the IDW method in ArcGIS has an advanced deterministic interpolator for multivariate data [56,57]. The IDW interpolates the concentration between known sample point locations in the study area using a weighted average of the neighboring data points within a defined radius [58]. ArcGIS overly capabilities were used to determine the spatial relationship between water analytical parameters and identified waterlogged areas.
4.3. Post-Classification Assessment
Accuracy assessment of Landsat NDVI and NDWI classified-based images was conducted using the ground truth region of interest (ROI) in a confusion matrix. A confusion matrix is a tool for comparing the classification results with truth data. In an ENVI confusion matrix, columns represent ground truth classes, while rows represent the classifier’s predictions. Ground truth was collected from the original Landsat images using regions of interest (ROIs). The ENVI confusion matrix paired ROIs with the classes of a classification image to show what percentage of the ROI pixels were or were not contained in a resulting class. The overall accuracy was calculated by summing the number of correctly classified values and dividing by the total number of values. The kappa coefficient measured the agreement between classification and truth values. A kappa value of 1 represents a perfect agreement, while a value of 0 represents no agreement. The kappa coefficient was computed as follows:
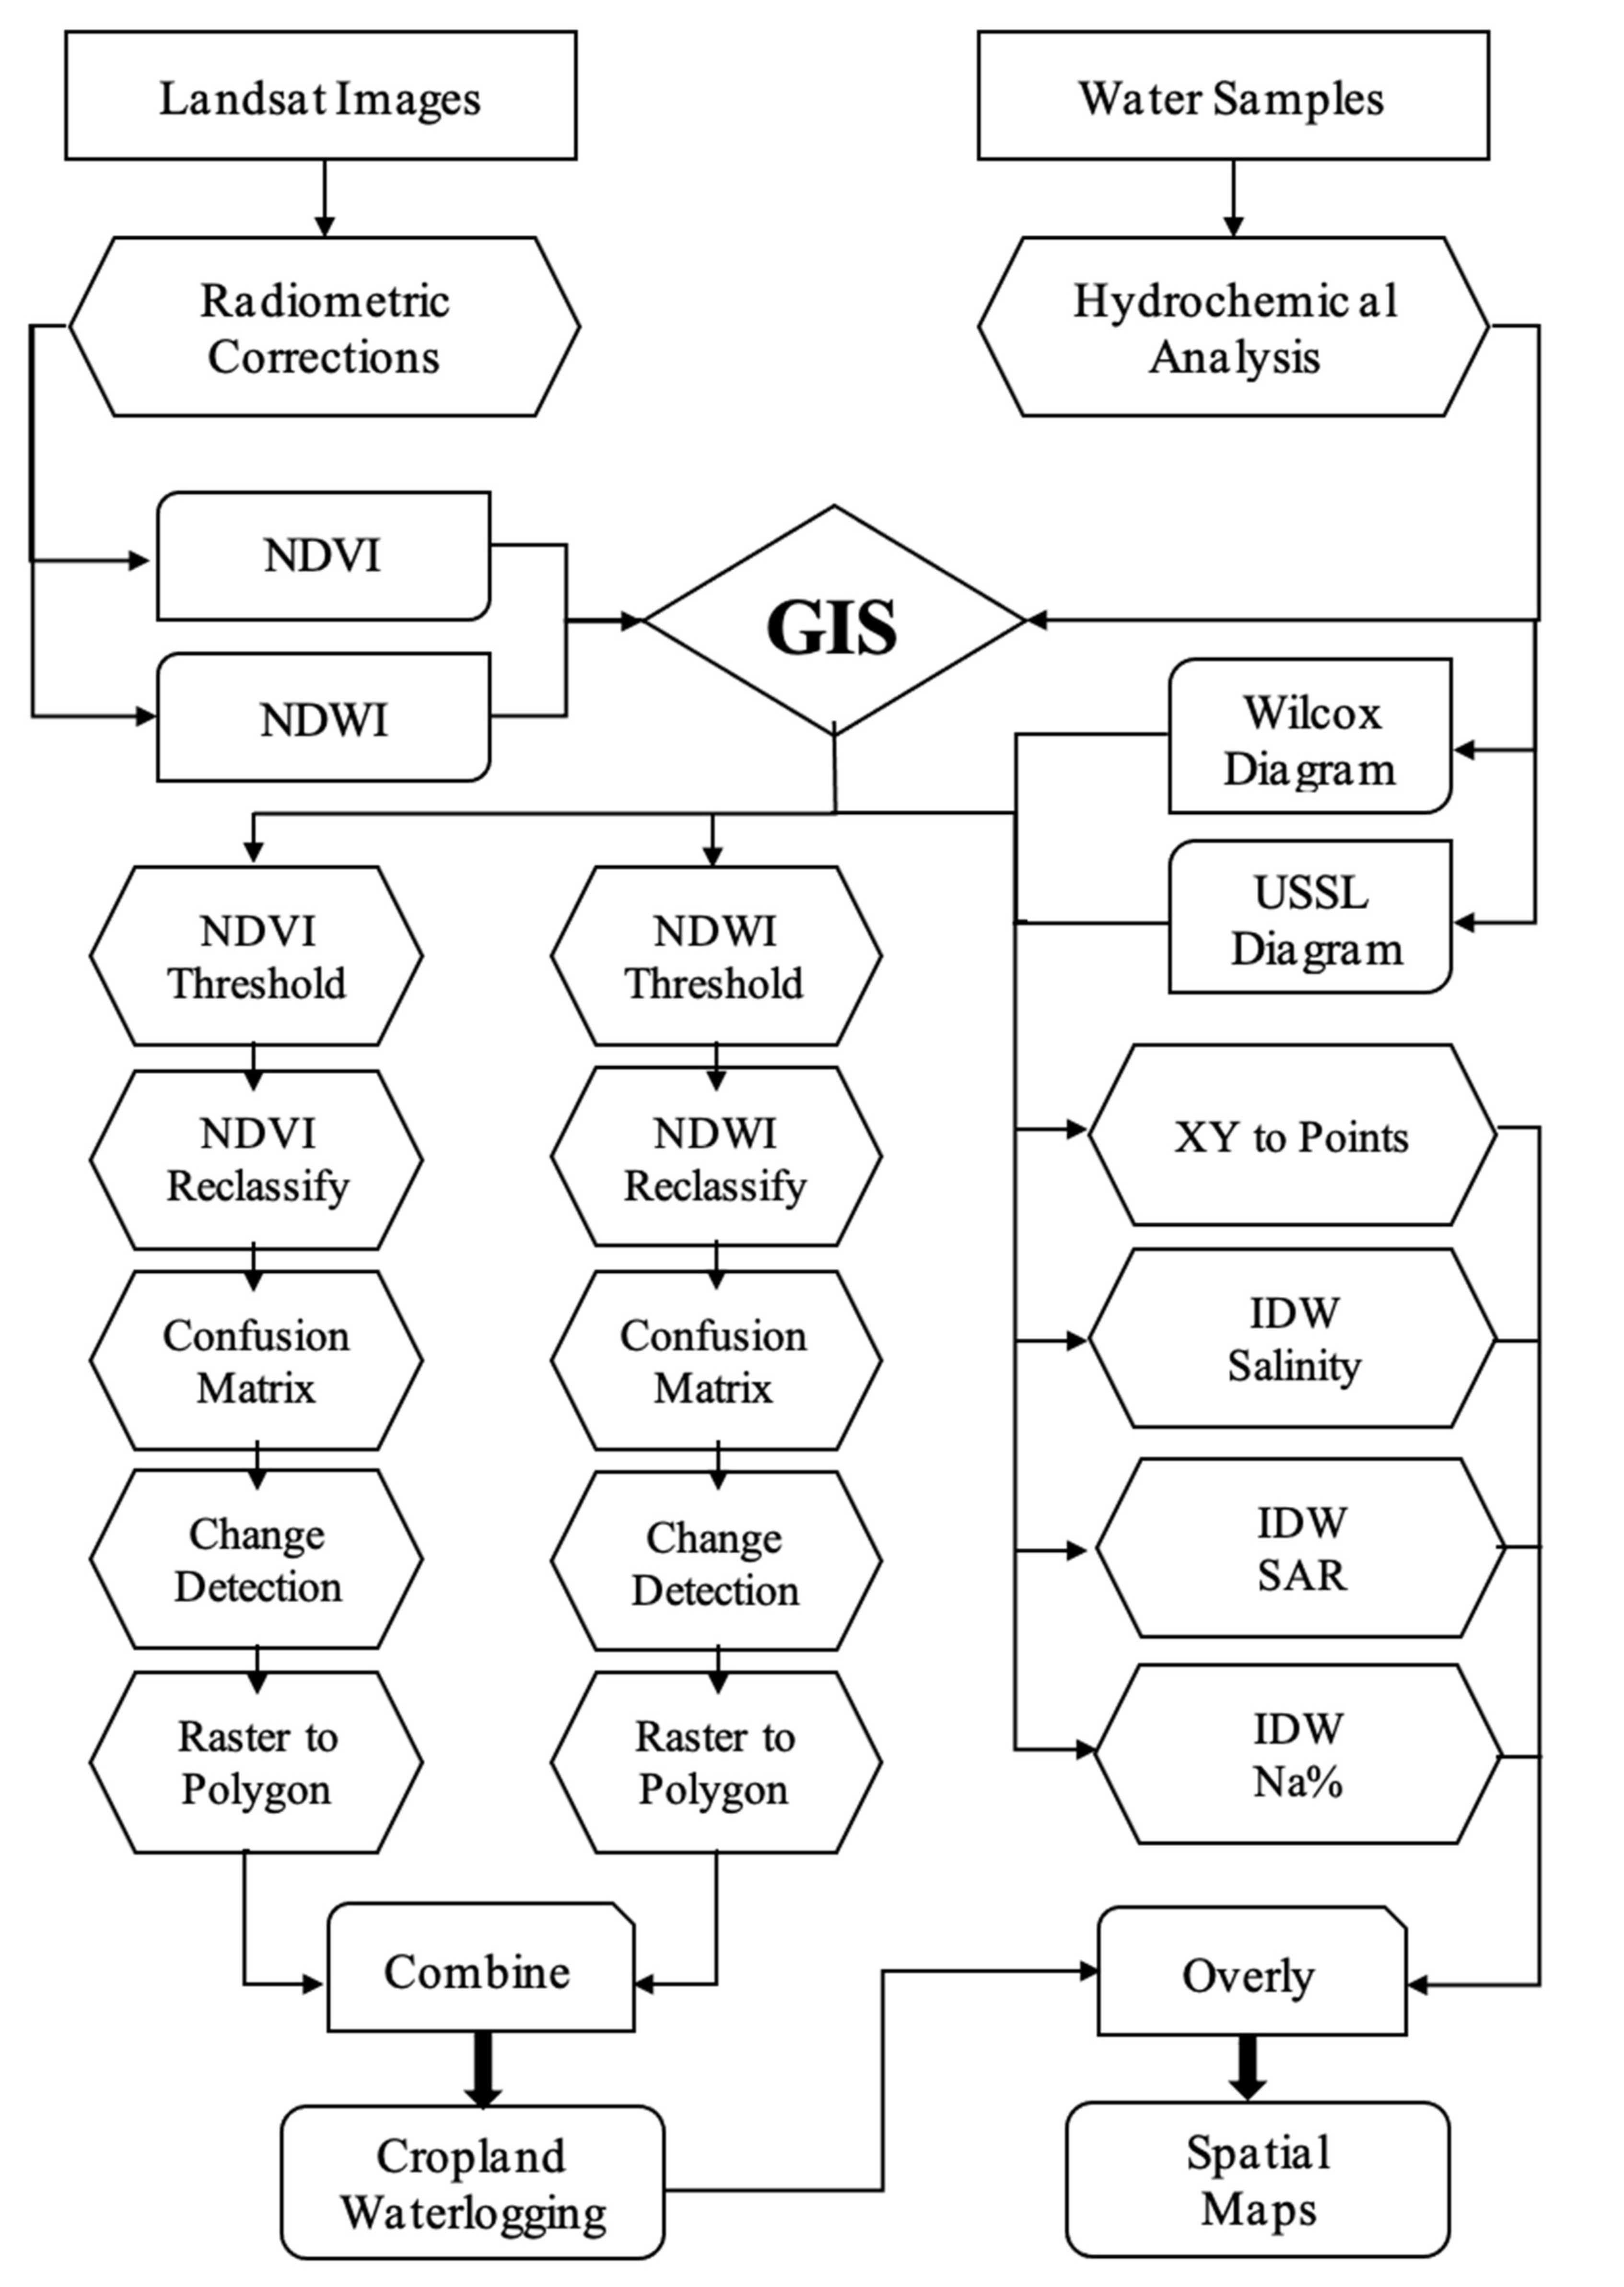
where (i) is the class number; (n) is the total number of classified values compared to truth values; (mi,i) is the number of values belonging to the truth class “i” that have also been classified as class “i”; (Ci) is the total number of predicted values belonging to the class “i”; (Gi) is the total number of truth values belonging to the class “i” [59]. A complete flowchart routine of the proposed methodology is illustrated in Figure 4.
4.4. Water Analytical Parameters
Water samples were analyzed for pH, electrical conductivity, and major ions Na+, K, Mg2+, Ca2+, SO42−, Cl−, CO3, and HCO−3. The United States Salinity Laboratory diagrams were used to evaluate the water quality for irrigation uses. The Wilcox diagram is a simple scatter plot of sodium adsorption ratio (SAR) on the Y-axis vs. salinity hazard (electrical conductivity) on the X-axis. The SAR evaluates the sodium hazard to calcium and magnesium concentrations and can be calculated by the formula [60,61]:
where “Na” is the sodium concentration, “Ca” is the calcium concentration, and “Mg” is the magnesium concentration in milliequivalents per liter (meq/L).
The US Salinity Laboratory (USSL) was further used to plot the soluble sodium percentage (Na%) on the Y-axis vs. salinity hazard (electrical conductivity) on the X-axis to determine the suitability of water for agricultural uses. The soluble sodium percentage (Na%) can be calculated by the formula:
where “Na” is the sodium concentration, “K” is the potassium concentration, “Ca” is the calcium concentration, and “Mg” is the magnesium concentration in milliequivalents per liter (meq/L).
Figure 4 shows a flowchart of the methodological framework used in this study.
5. Results
5.1. Croplands Expansion
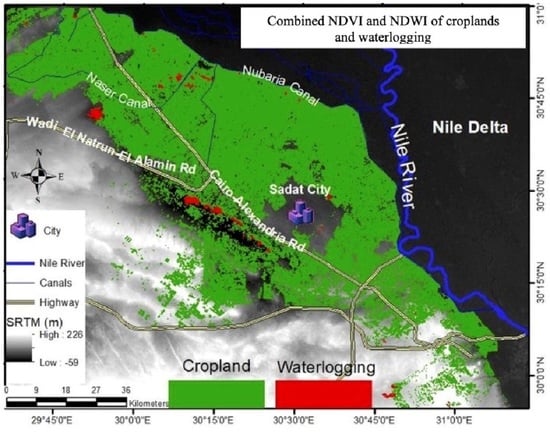
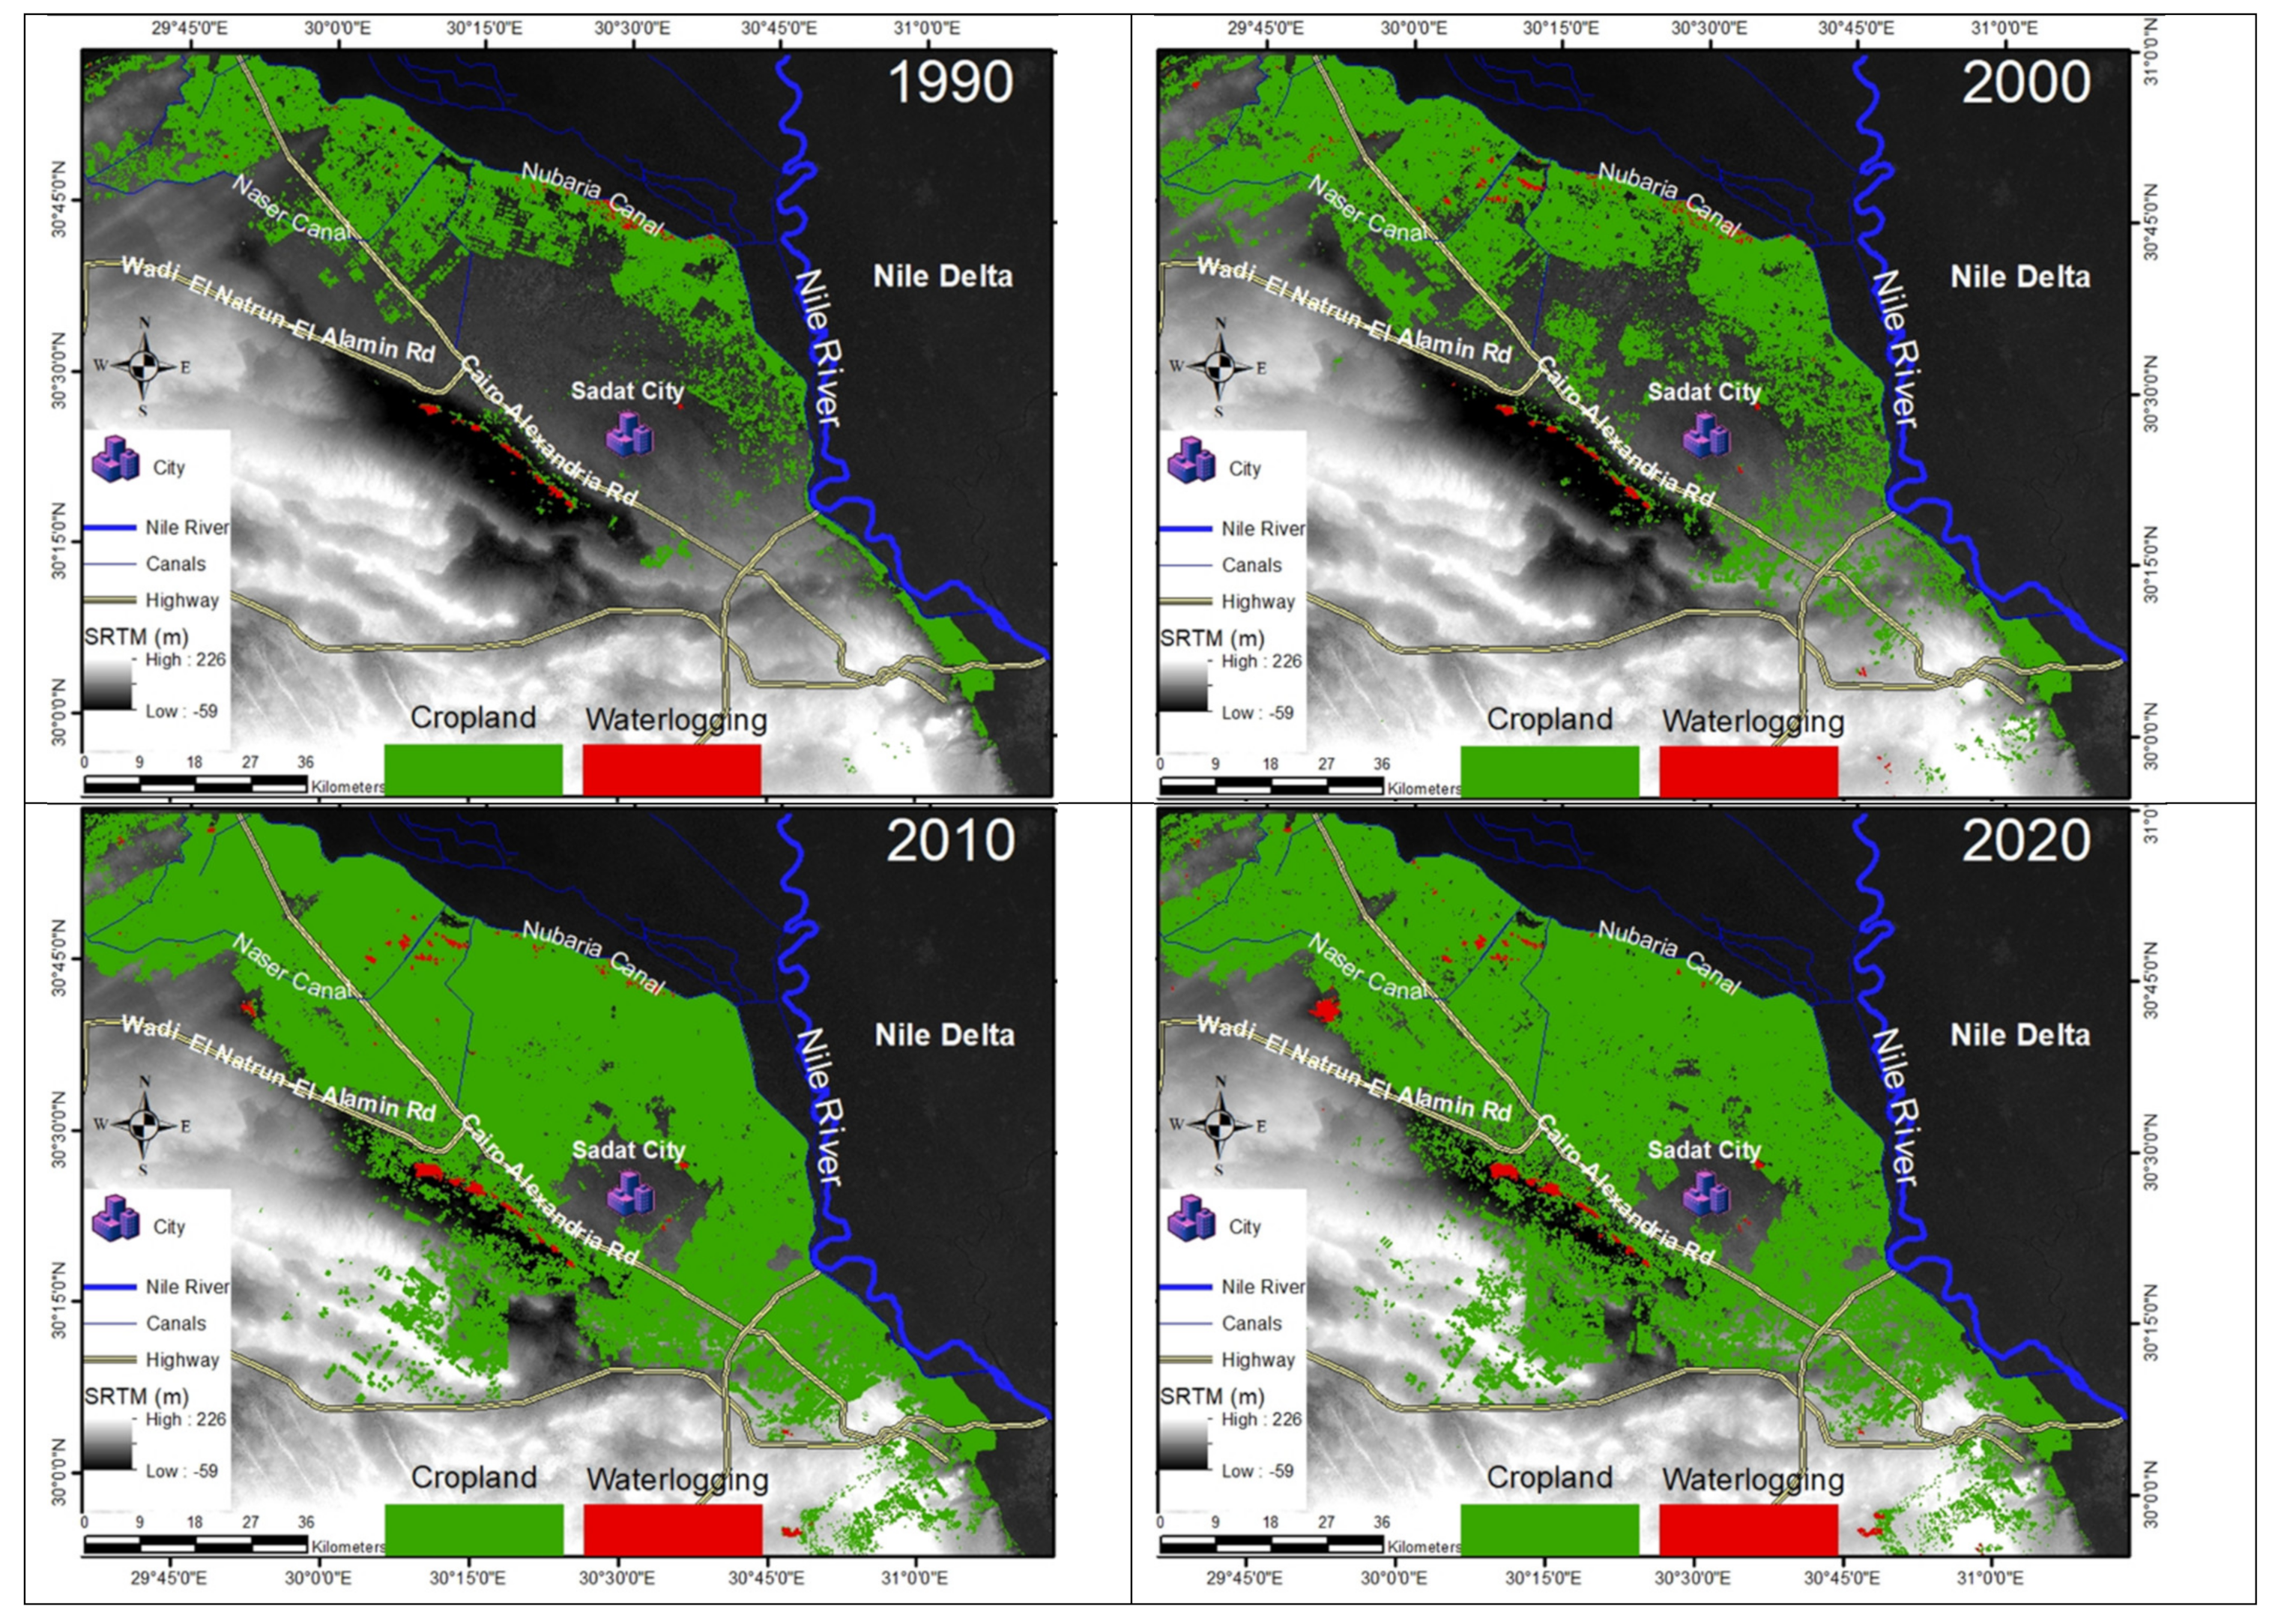
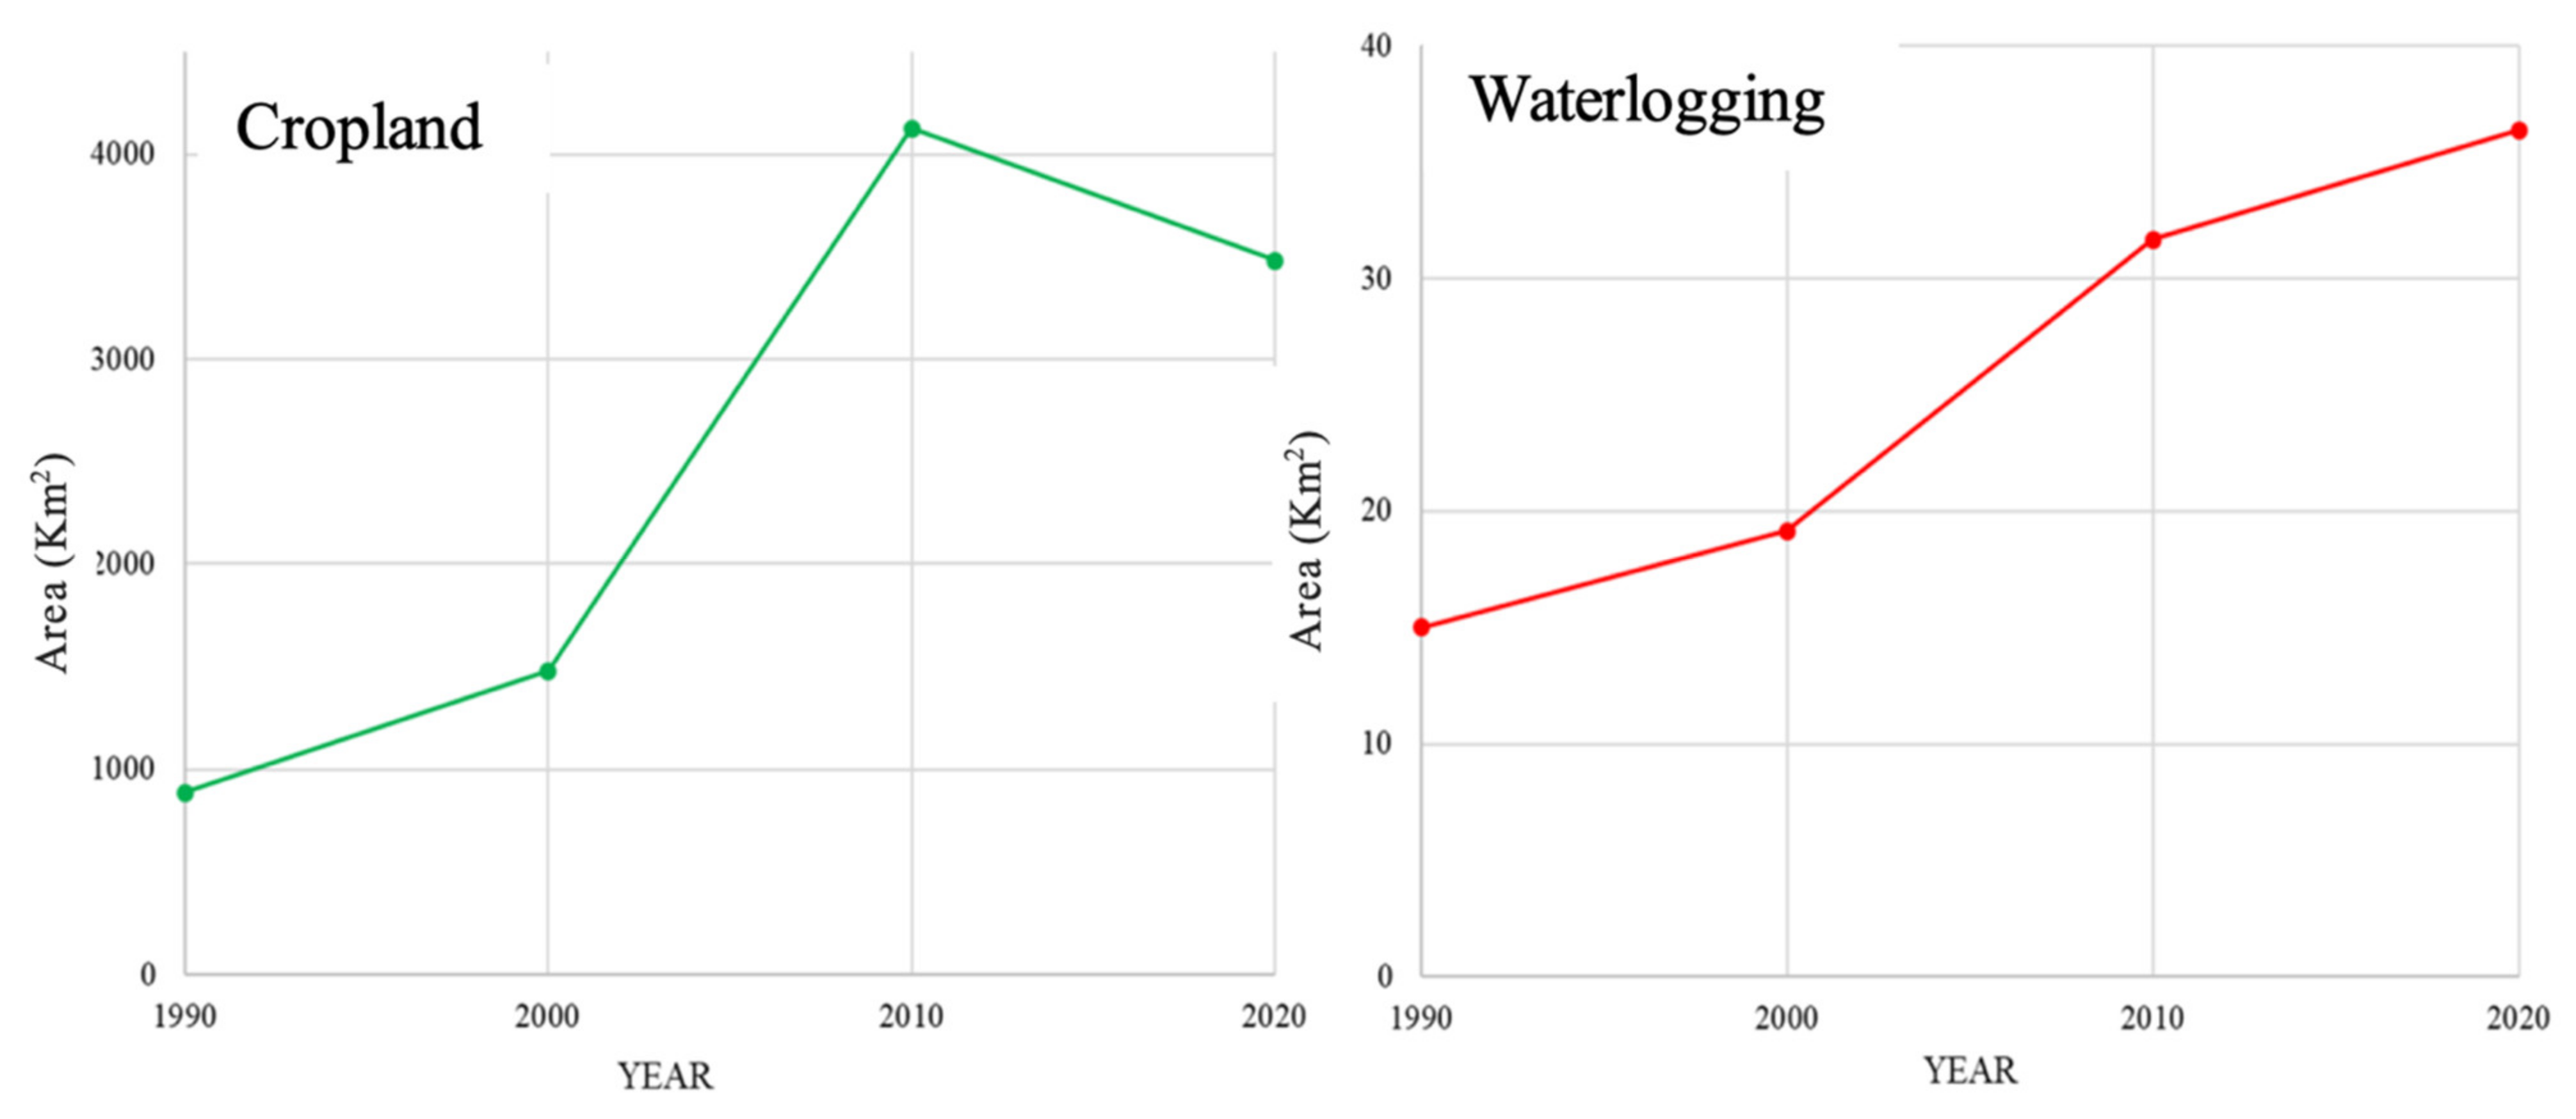
Croplands in the western Nile Delta are dominated by large continuous fields, resulting in a land cover mosaic of large, uniform objects that are frequently discernible in Landsat NDVI images (Figure 5). The NDVI values are ranging from +1.0 to −1.0, the global threshold is 0, where areas of barren soil usually show low NDVI values, sparse vegetation may result in moderate NDVI values, and high NDVI values correspond to dense vegetation. The NDVI local threshold (0.25) was used to classify the NDVI images into vegetation/non-vegetation, where vegetated areas have NDVI values (>0.25) and non-vegetated areas have values (<0.25). The threshold is not constant; it may vary from place-to-place, and from season-to-season. The NDVI images were classified into two land cover classes where croplands were identified as green color pixels and waterlogged areas as red color pixels (Figure 5). Spatial analysis of the NDVIs manifested expansion of croplands westward from the Nile Delta margin. In the 1990s, croplands were mainly occupying the northern part of the study area, which included the young alluvial plains, Abu Mina depression, and El Marbat depression. In the 2000s and later, the croplands expanded southwards to include the old alluvial plains and the Wadi El Natrun area (Figure 5). In the past three decades (1990–2020), the expansion of croplands in the western Nile Delta reached up to ~4124.2 km2 (Table 2). Statistical analysis of the calculated NDVIs revealed that the area of croplands in the study area in 1990 was 888.35 km2, 1479.54 km2 in 2000, 4124.21 in 2010, and 3482.25 km2 in 2020, respectively. The highest expansion in croplands was between 2000 and 2010, as the area of croplands added to the West Delta region was about 2645 km2 (Figure 6).
5.2. Waterlogging
The calculated NDWI values range from +1.0 to −1.0. The positive values correspond to water areas, and the negative values correspond to non-water areas. The NDWI threshold 0 was used to classify the NDWI images into two classes where the non-water areas have values (<0), and water areas have NDWI values (>0). The red color was used to identify waterlogging pixels (Figure 5). The classified NDWIs and NDVIs were converted from raster to vector polygon shapes to merge the two classes together and to quantify the total area for each class. The GIS spatial analysis was used to combine the NDWIs and the NDVIs to draw out the waterlogging patches. The NDWI images disclosed that most of the waterlogging patches in 1990 and 2000 were in Wadi El Natrun and around the Nubariya canal. In 2010 and 2020, the waterlogging patches were declined around the Nubariya canal, while they were expanded in El Marbat Depression and Wadi El Natrun (Figure 5). The area of the waterlogging patches was about 15 km2 in 1990, 19.14 km2 in 2000, 31.67 km2 in 2010, and enlarged to 36.36 km2 in 2020 (Figure 6). Waterlogging led to the loss of about 641 km2 of croplands between 2000 and 2020 (Figure 6).
5.3. Accuracy Assessment
The classified NDVI and NDWI images were evaluated using the ENVI confusion matrix. Ground truth sites were collected from each image using the region of interest (ROI) ENVI tool. The ground truth data were compared to the classified images in a confusion matrix to calculate what percentage of the ROI pixels were or were not contained in a resulting class and which pixels were incorrectly classified (Table 3). The matrix is square, where columns represent true classes, while rows represent the classifier’s predictions. Table 3 includes four confusion matrices for the classifications of Landsat 1990, 2000, 2010, and 2020, respectively. In the matrix of the classification of Landsat 1990, reading down the soil column, 133,894 soil pixels were correctly classified as soil, 17 soil pixels were classified as water, and 452 soil pixels were classified as vegetation. Reading down the water column, there are 0 water pixels classified as soil, 382 water pixels were classified as water, and five water pixels were classified as vegetation. Reading down the vegetation column, there are 79 vegetation pixels classified as soil, 378 vegetation pixels classified as water, and 31,208 vegetation pixels classified as vegetation. The fraction of pixels that belong to a class but were predicted to be in a different class represents omission errors. The correct classifications occur along the diagonal cells of the matrix from the upper-left to the lower-right. In the table, 133,894 soil pixels were correctly classified as soil, 382 water pixels were classified as water, and 31,208 vegetation pixels were classified as vegetation. The classification’s overall accuracy was calculated by dividing the sum of the correctly classified pixels (133,894 + 382 + 31,208 = 165,484) by the total number of pixels (166,415). We obtained 0.994, which is 99.4%. Another accuracy indicator is the kappa coefficient, which takes values from 0 to 1. If the kappa coefficient equals 0, there is no agreement between the classified image and the ground truth or ROIs. If the kappa coefficient equals 1, then the classified image and the ground truth image are totally identical. The kappa Coefficient of the classification of Landsat TM 1990 is 0.99.
The overall accuracies of all classified maps were above a 99% confidence level, and kappa statistics were well above 0.9. The classification accuracy reflected how well the vegetation and water classes were identified from the NDVI and NDWI.
5.4. Water Salinity
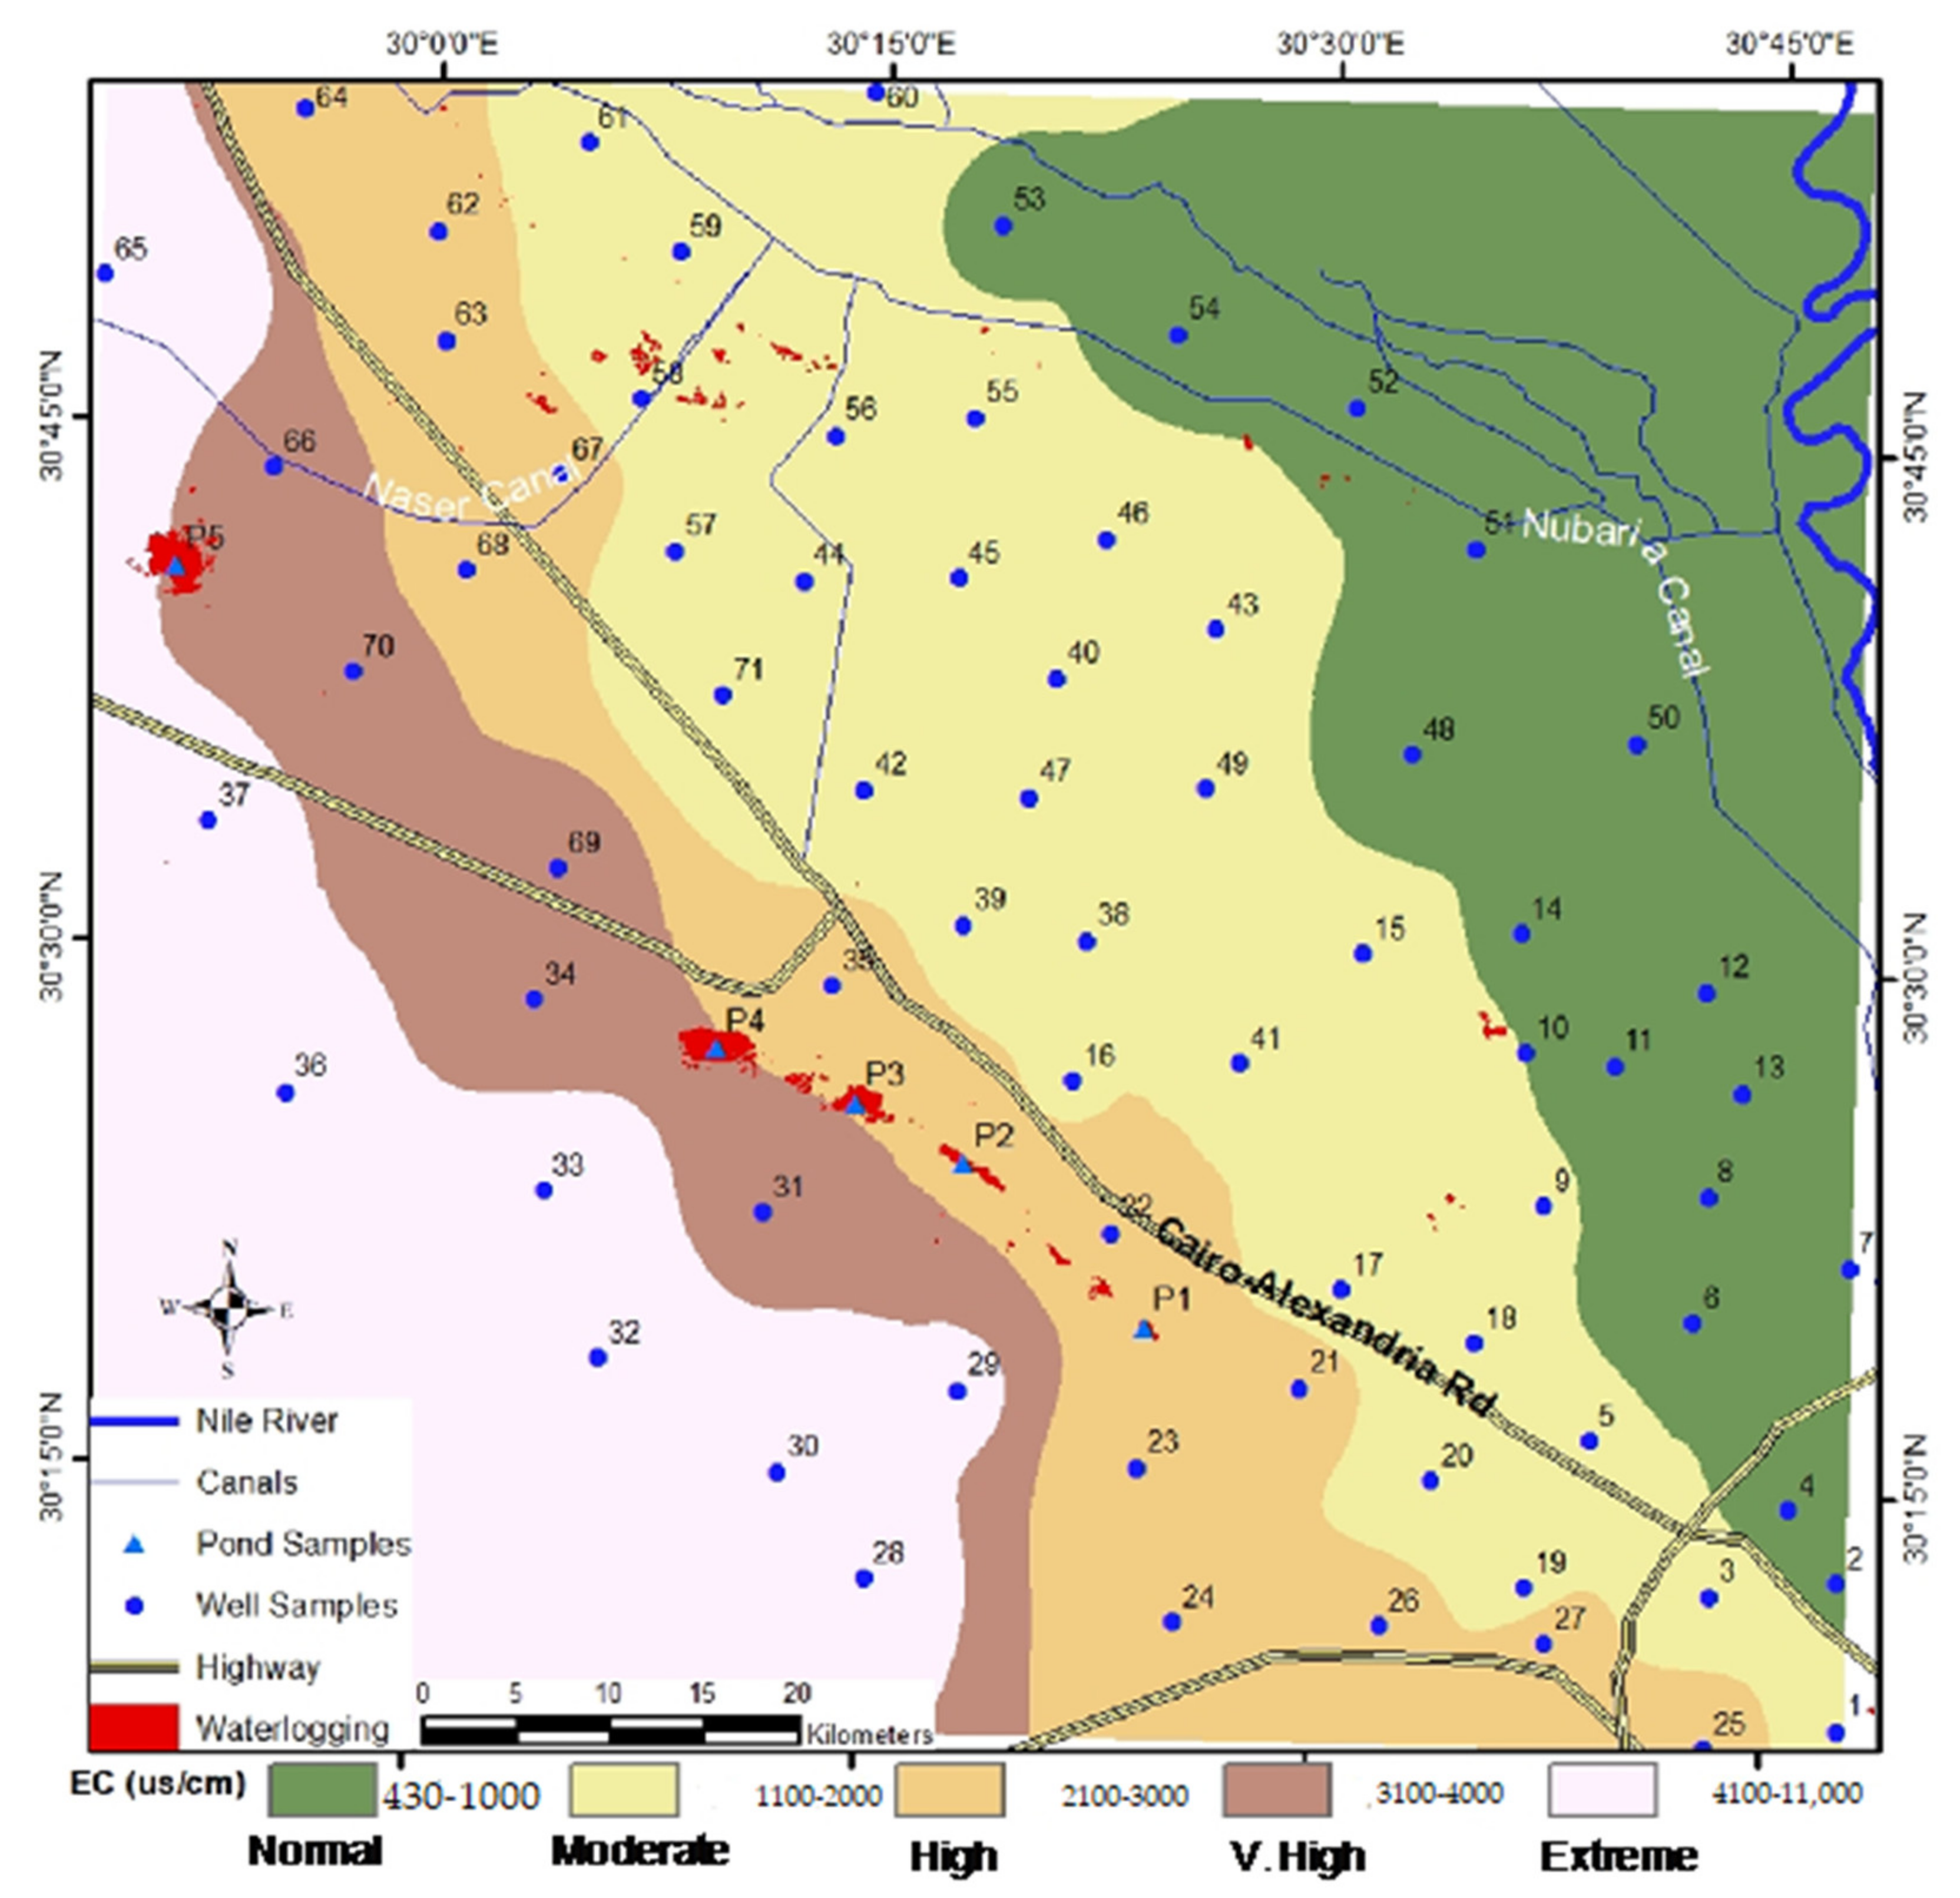
The results of water hydrochemical analysis are given in Supplementary Table S1. The measured total dissolved solids (TDS) content in the pond water was very high, ~18,000 mg/L, as well as the measured ions, were higher than the international standards for irrigation water. The electrical conductivity (EC) of the water samples taken from the ponds was very high >22,000 µS/cm (Supplementary Table S1). The spatial analysis of groundwater salinity (EC) revealed that the study area could be classified into five classes: normal (<1000 µS/cm) exhibited in green color, moderate (1100–2000 µS/cm) in yellow color, high (2100–3000 µS/cm) in light orange color, very high (3100–4000 µS/cm) in brown color, and extreme (>4000 µS/cm) in light pink color (Figure 7). Classes 1 and 2 occupy the eastern part of the study area eastward of the Cairo–Alexandria highway, whereas classes 3, 4, and 5 occur westward of the Cairo–Alexandria highway. The wells in class 1 are located nearby the western edge of the Nile Delta with EC < 1000 µS/cm. The EC of the groundwater gradually increases westward; it reached up to 2000 µS/cm around the Cairo–Alexandria highway. These wells draw water mostly from the Quaternary unconfined aquifer that is recharged from the Nile River and canals. The EC of the water wells west of the Cairo–Alexandria highway increases westward; it reached up to 11,000 µS/cm in the west end of the study area (Figure 7). These wells draw water from the Moghra, Wadi El Natrun, and Oligocene confined aquifers.
5.5. Water Quality for Irrigation
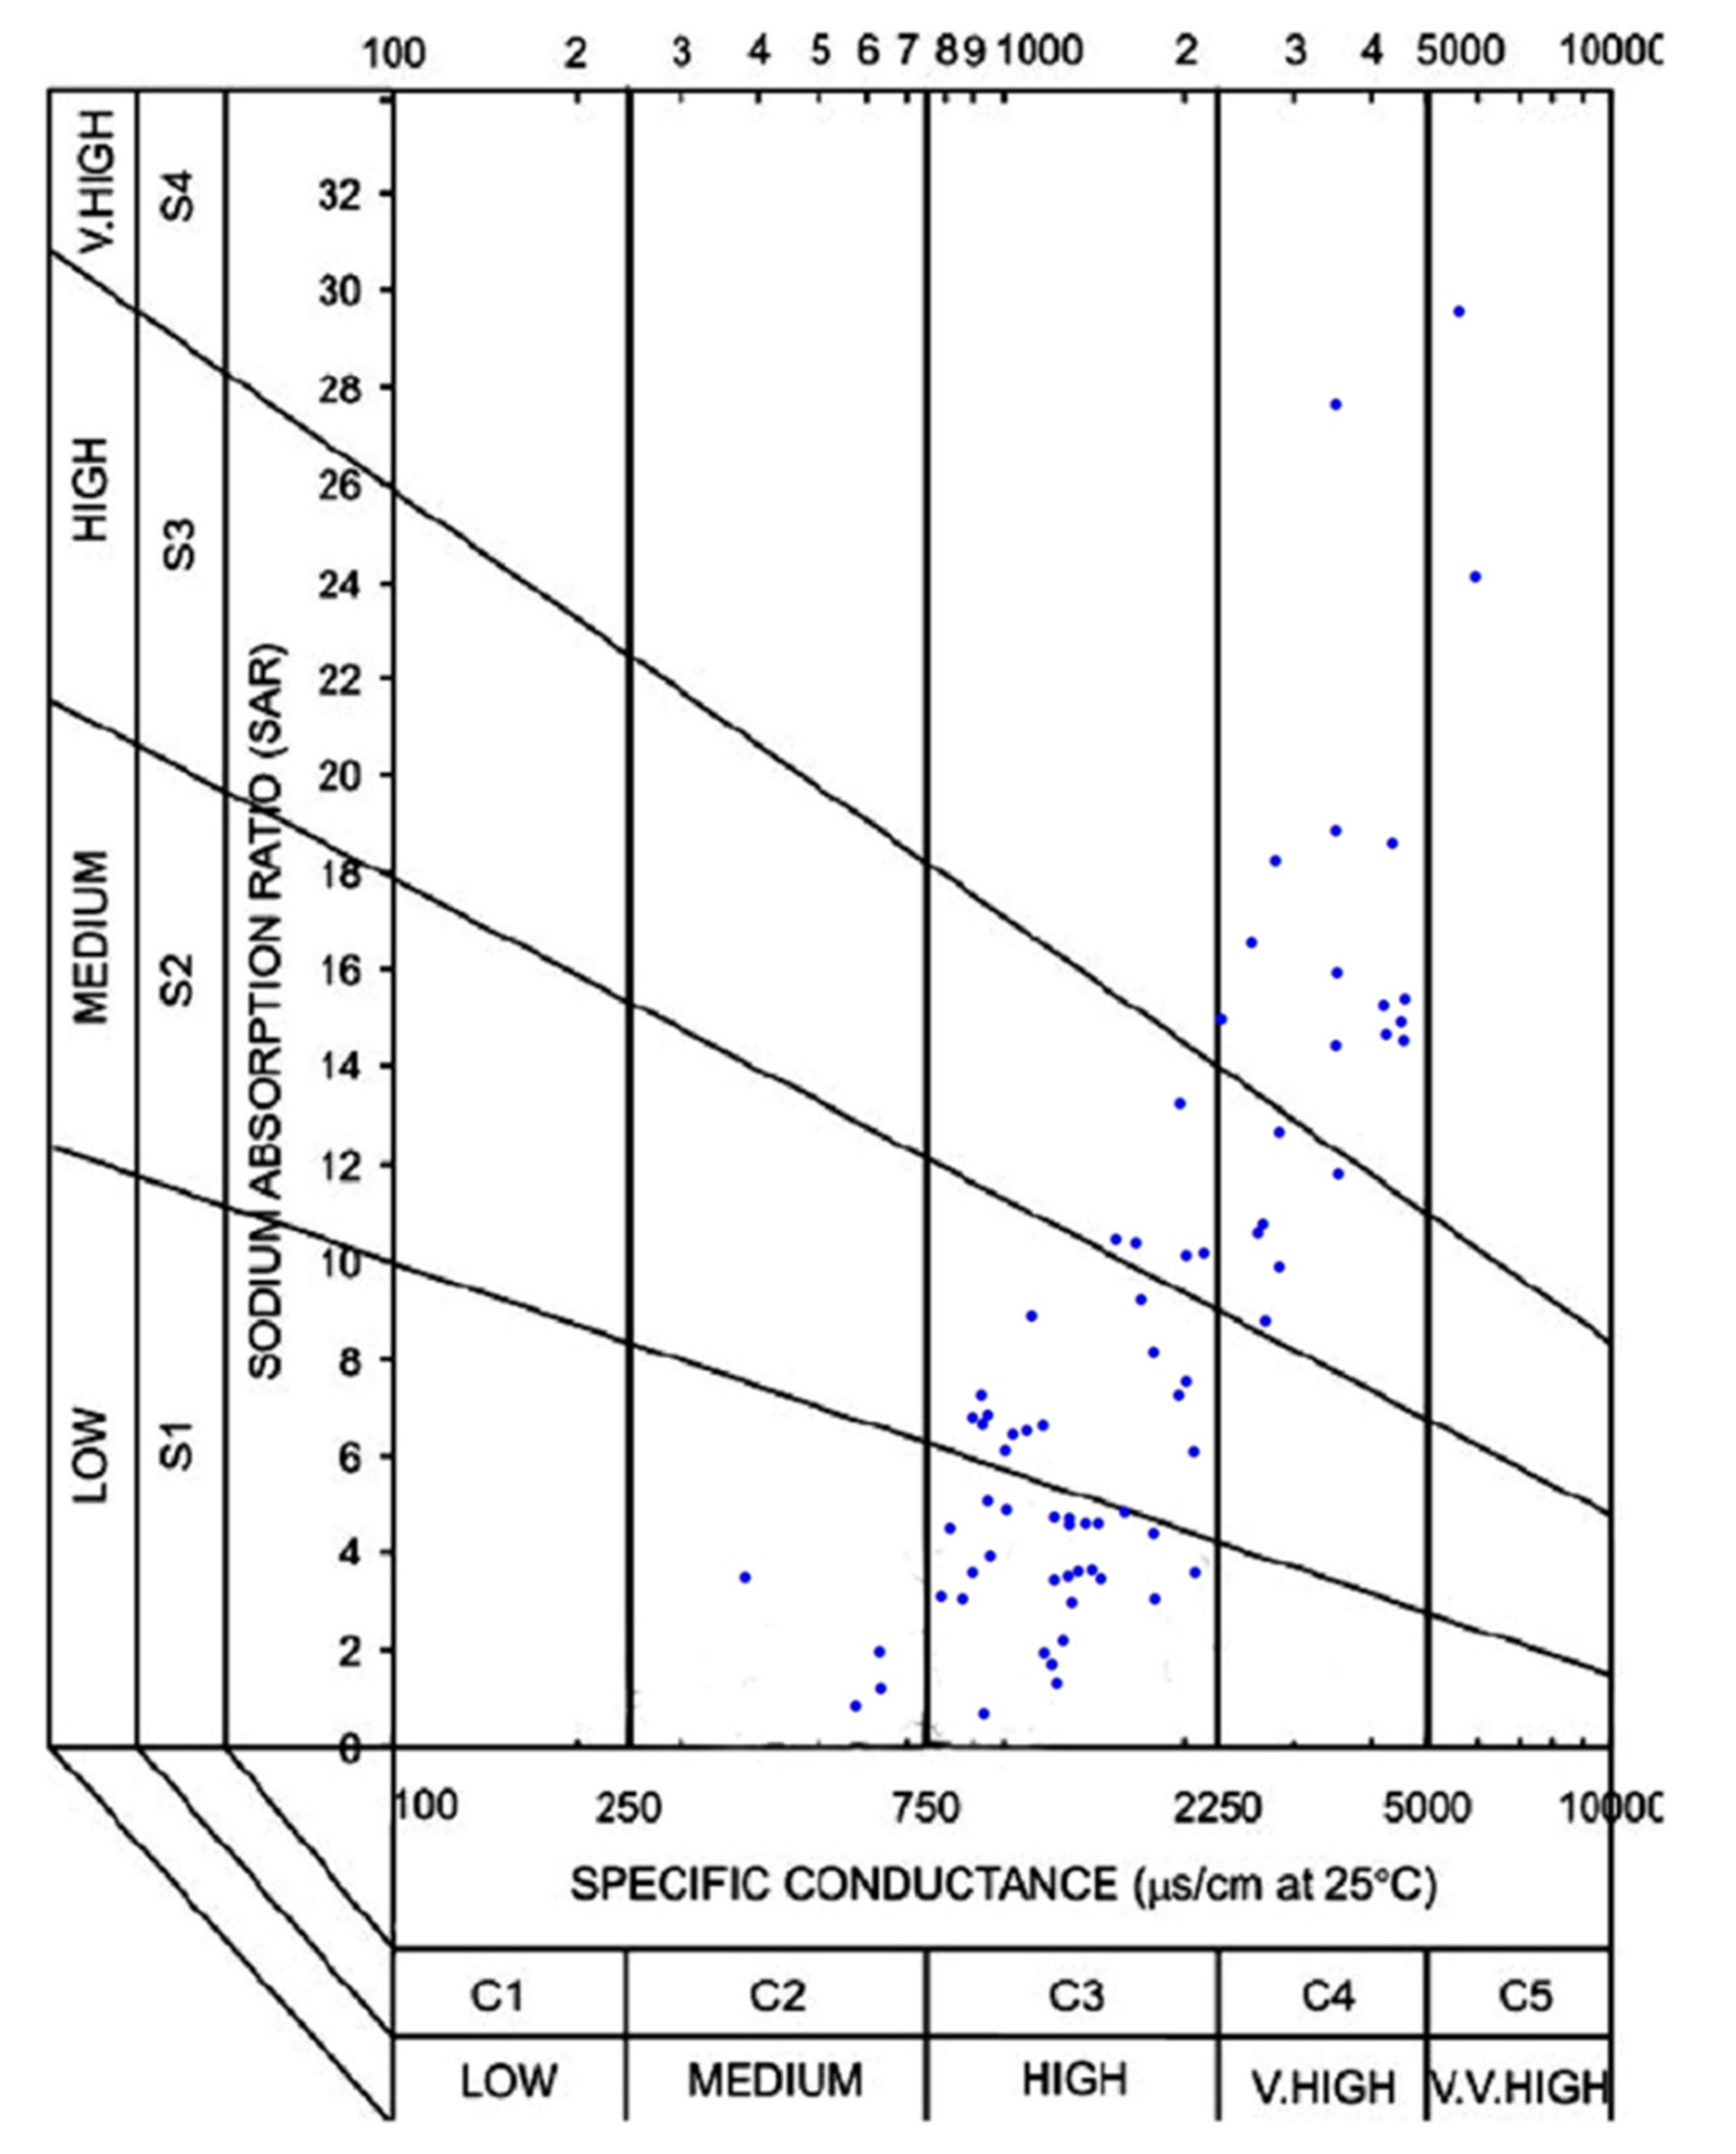
The Wilcox diagram [61] proposed irrigation specifications for evaluating the suitability of water for irrigation purposes (Figure 8). Salinity and sodium concentration have adverse effects on plant growth and crop yield. Groundwater samples were evaluated for salinity and sodium hazards. The Wilcox diagram relates SAR (representing the sodium hazard) to EC (representing the salinity hazard) to evaluate the groundwater quality for irrigation (Figure 8). The EC of irrigation water is classified into low (C1—excellent), medium (C2—good), high (C3—permissible), very high (C4—doubtful), and very-very high (C5—unsuitable) conductivity zones. The sodium hazard (SAR) is classified as low (S1, <10, excellent), medium (S2, 10–18, good), high (S3, 18–26, doubtful), and very high (S4, >26, unsuitable).
The results of the Wilcox diagram indicated that there are 4 wells belong to C2-S1 (good-excellent), 27 wells belong to C3-S1 (permissible-excellent), 14 wells belong to C3-S2 (permissible-good), 5 wells belong to C3-S3 (permissible-doubtful), 6 wells belong to C4-S3 (doubtful-doubtful), 12 wells belong to C4-S4 (doubtful-unsuitable), 2 wells belong C5-S4 (unsuitable), and 1 well (# 65) not plotted because it has EC 11,000 µS/cm and “unsuitable” (Figure 8).
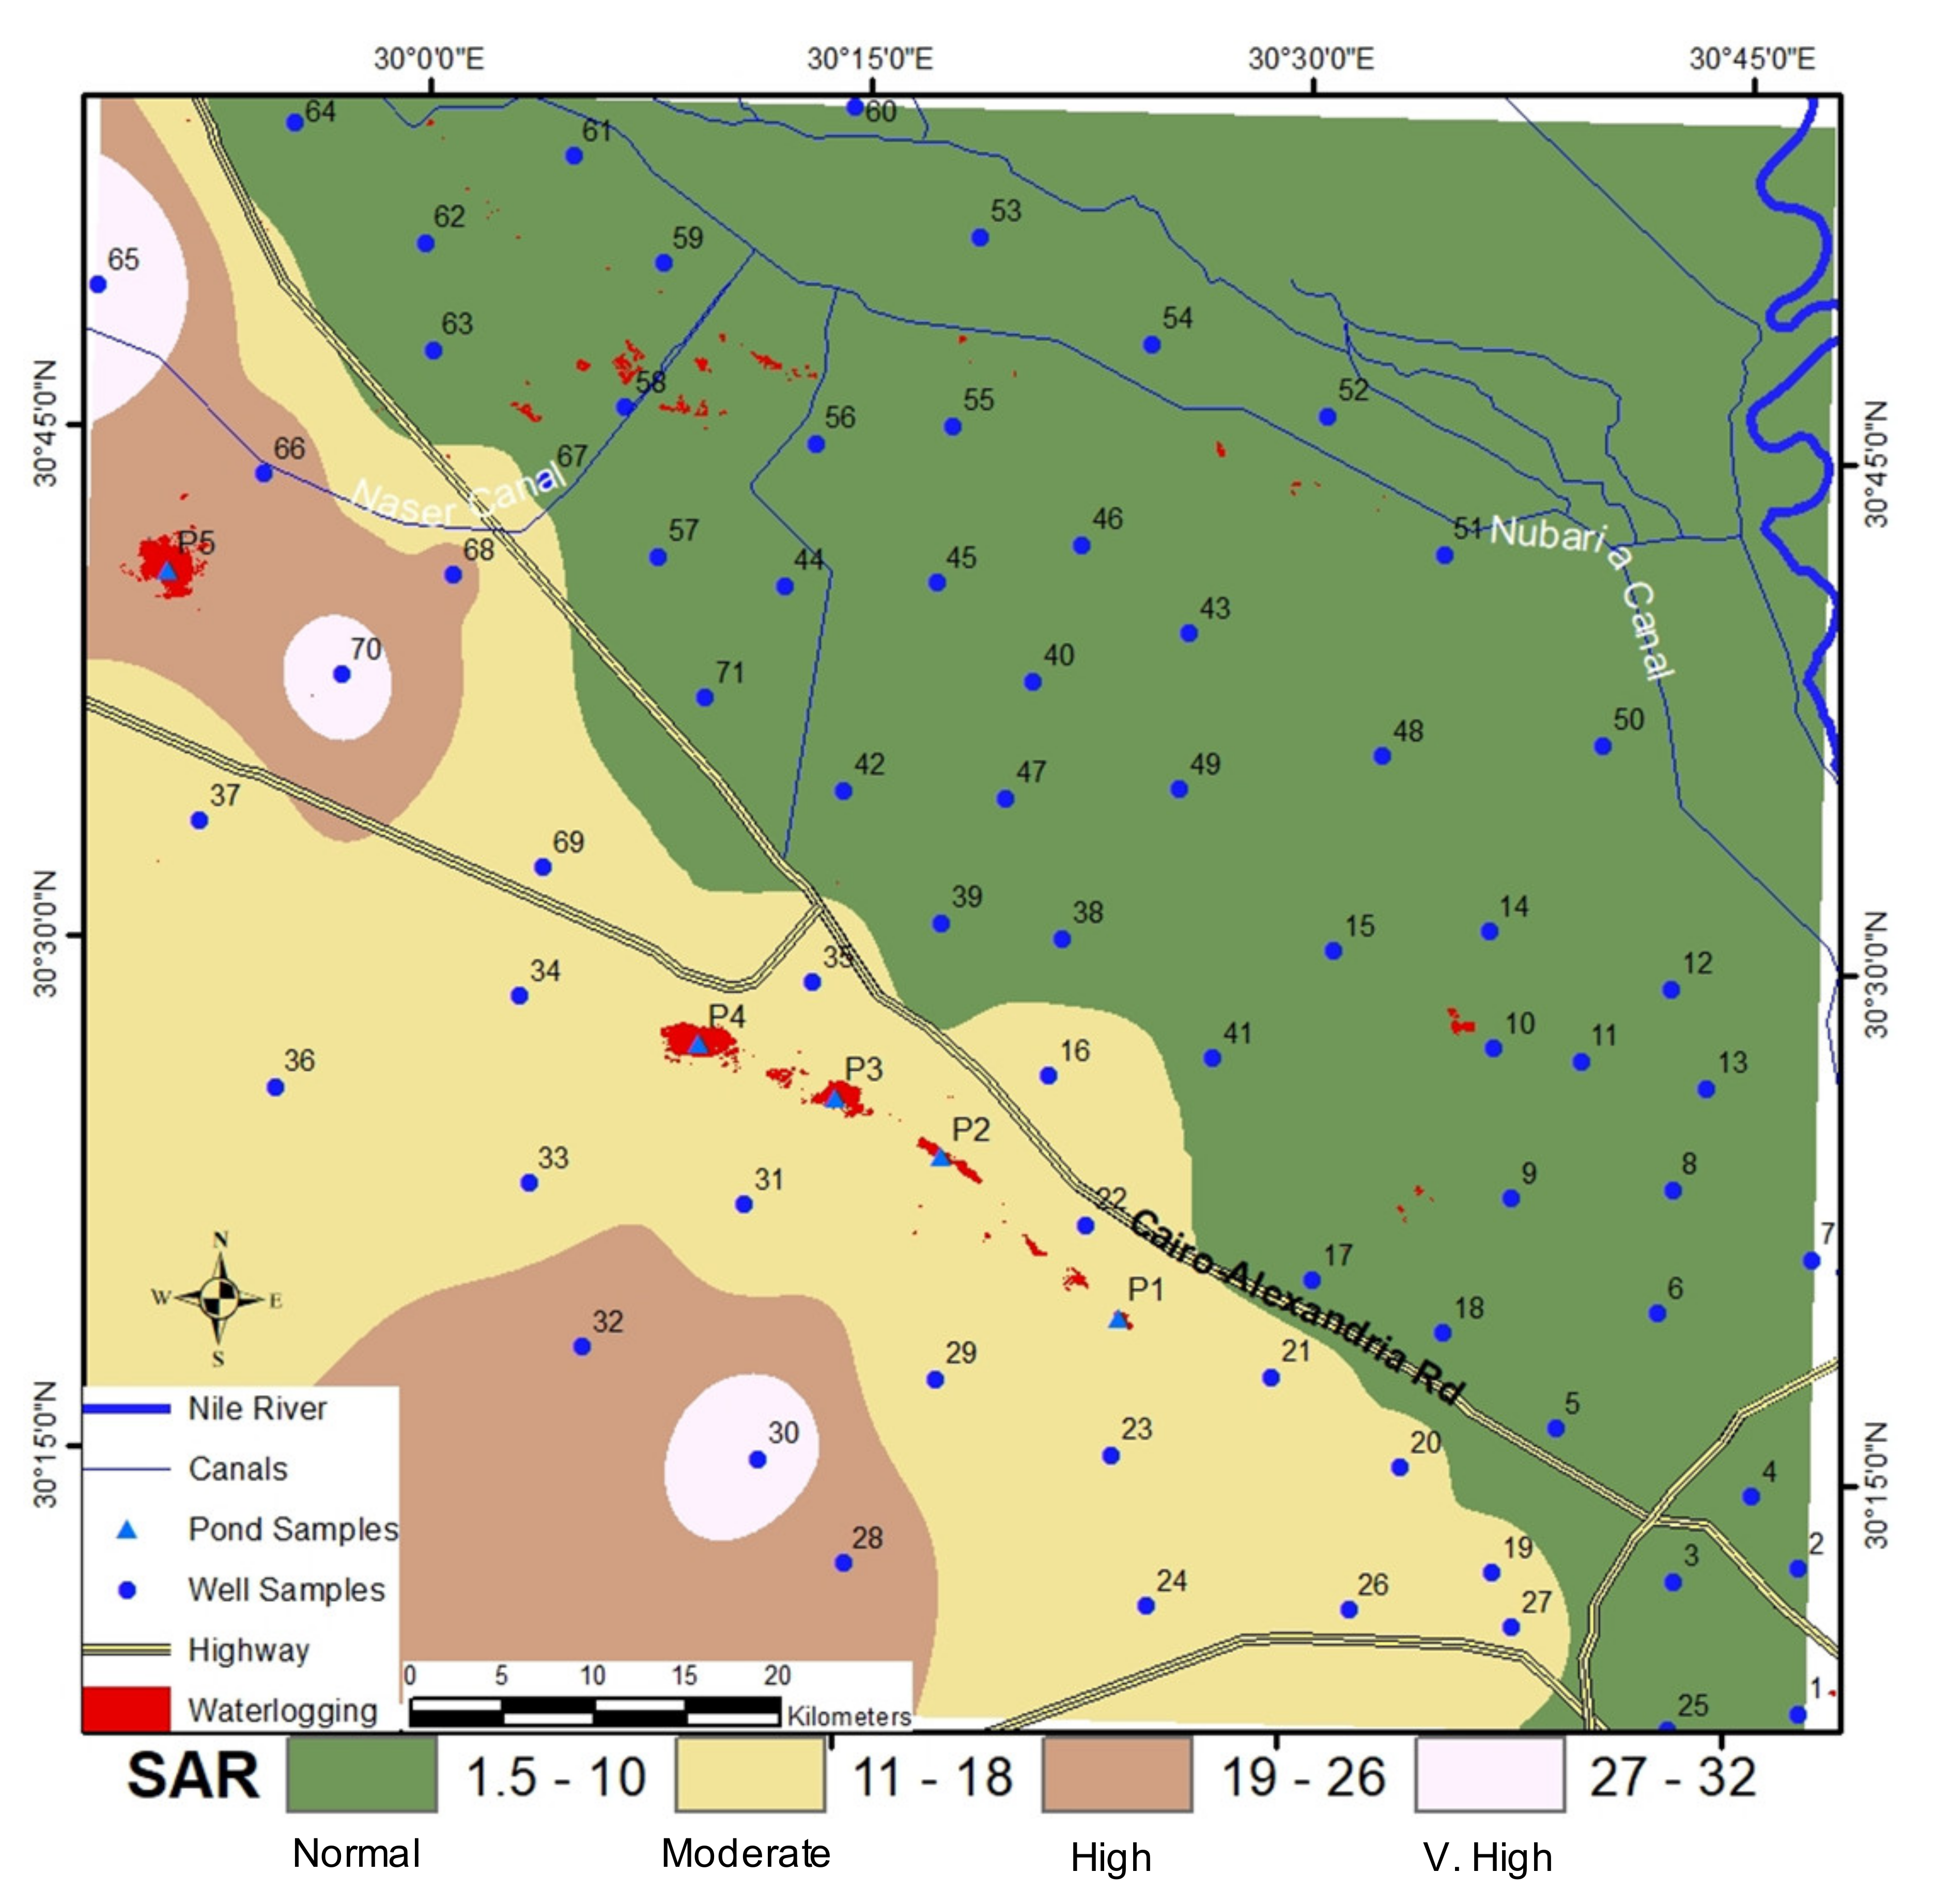
ArcGIS IDW was used to create a surface map of SAR values (Figure 9). Wilcox threshold was used to classify the SAR map into four classes: normal (1.5–10) green color, moderate (11–18) yellow color, high (19–26) brown, and very-high (27–32) light pink color (Figure 9). Spatial analysis of SAR surface map indicated that most of the water wells eastern of the Cairo–Alexandria highway are in the normal class with SAR < 10. The water wells westward of the Cairo–Alexandria highway are included in the medium, high and very-high classes (Figure 9).
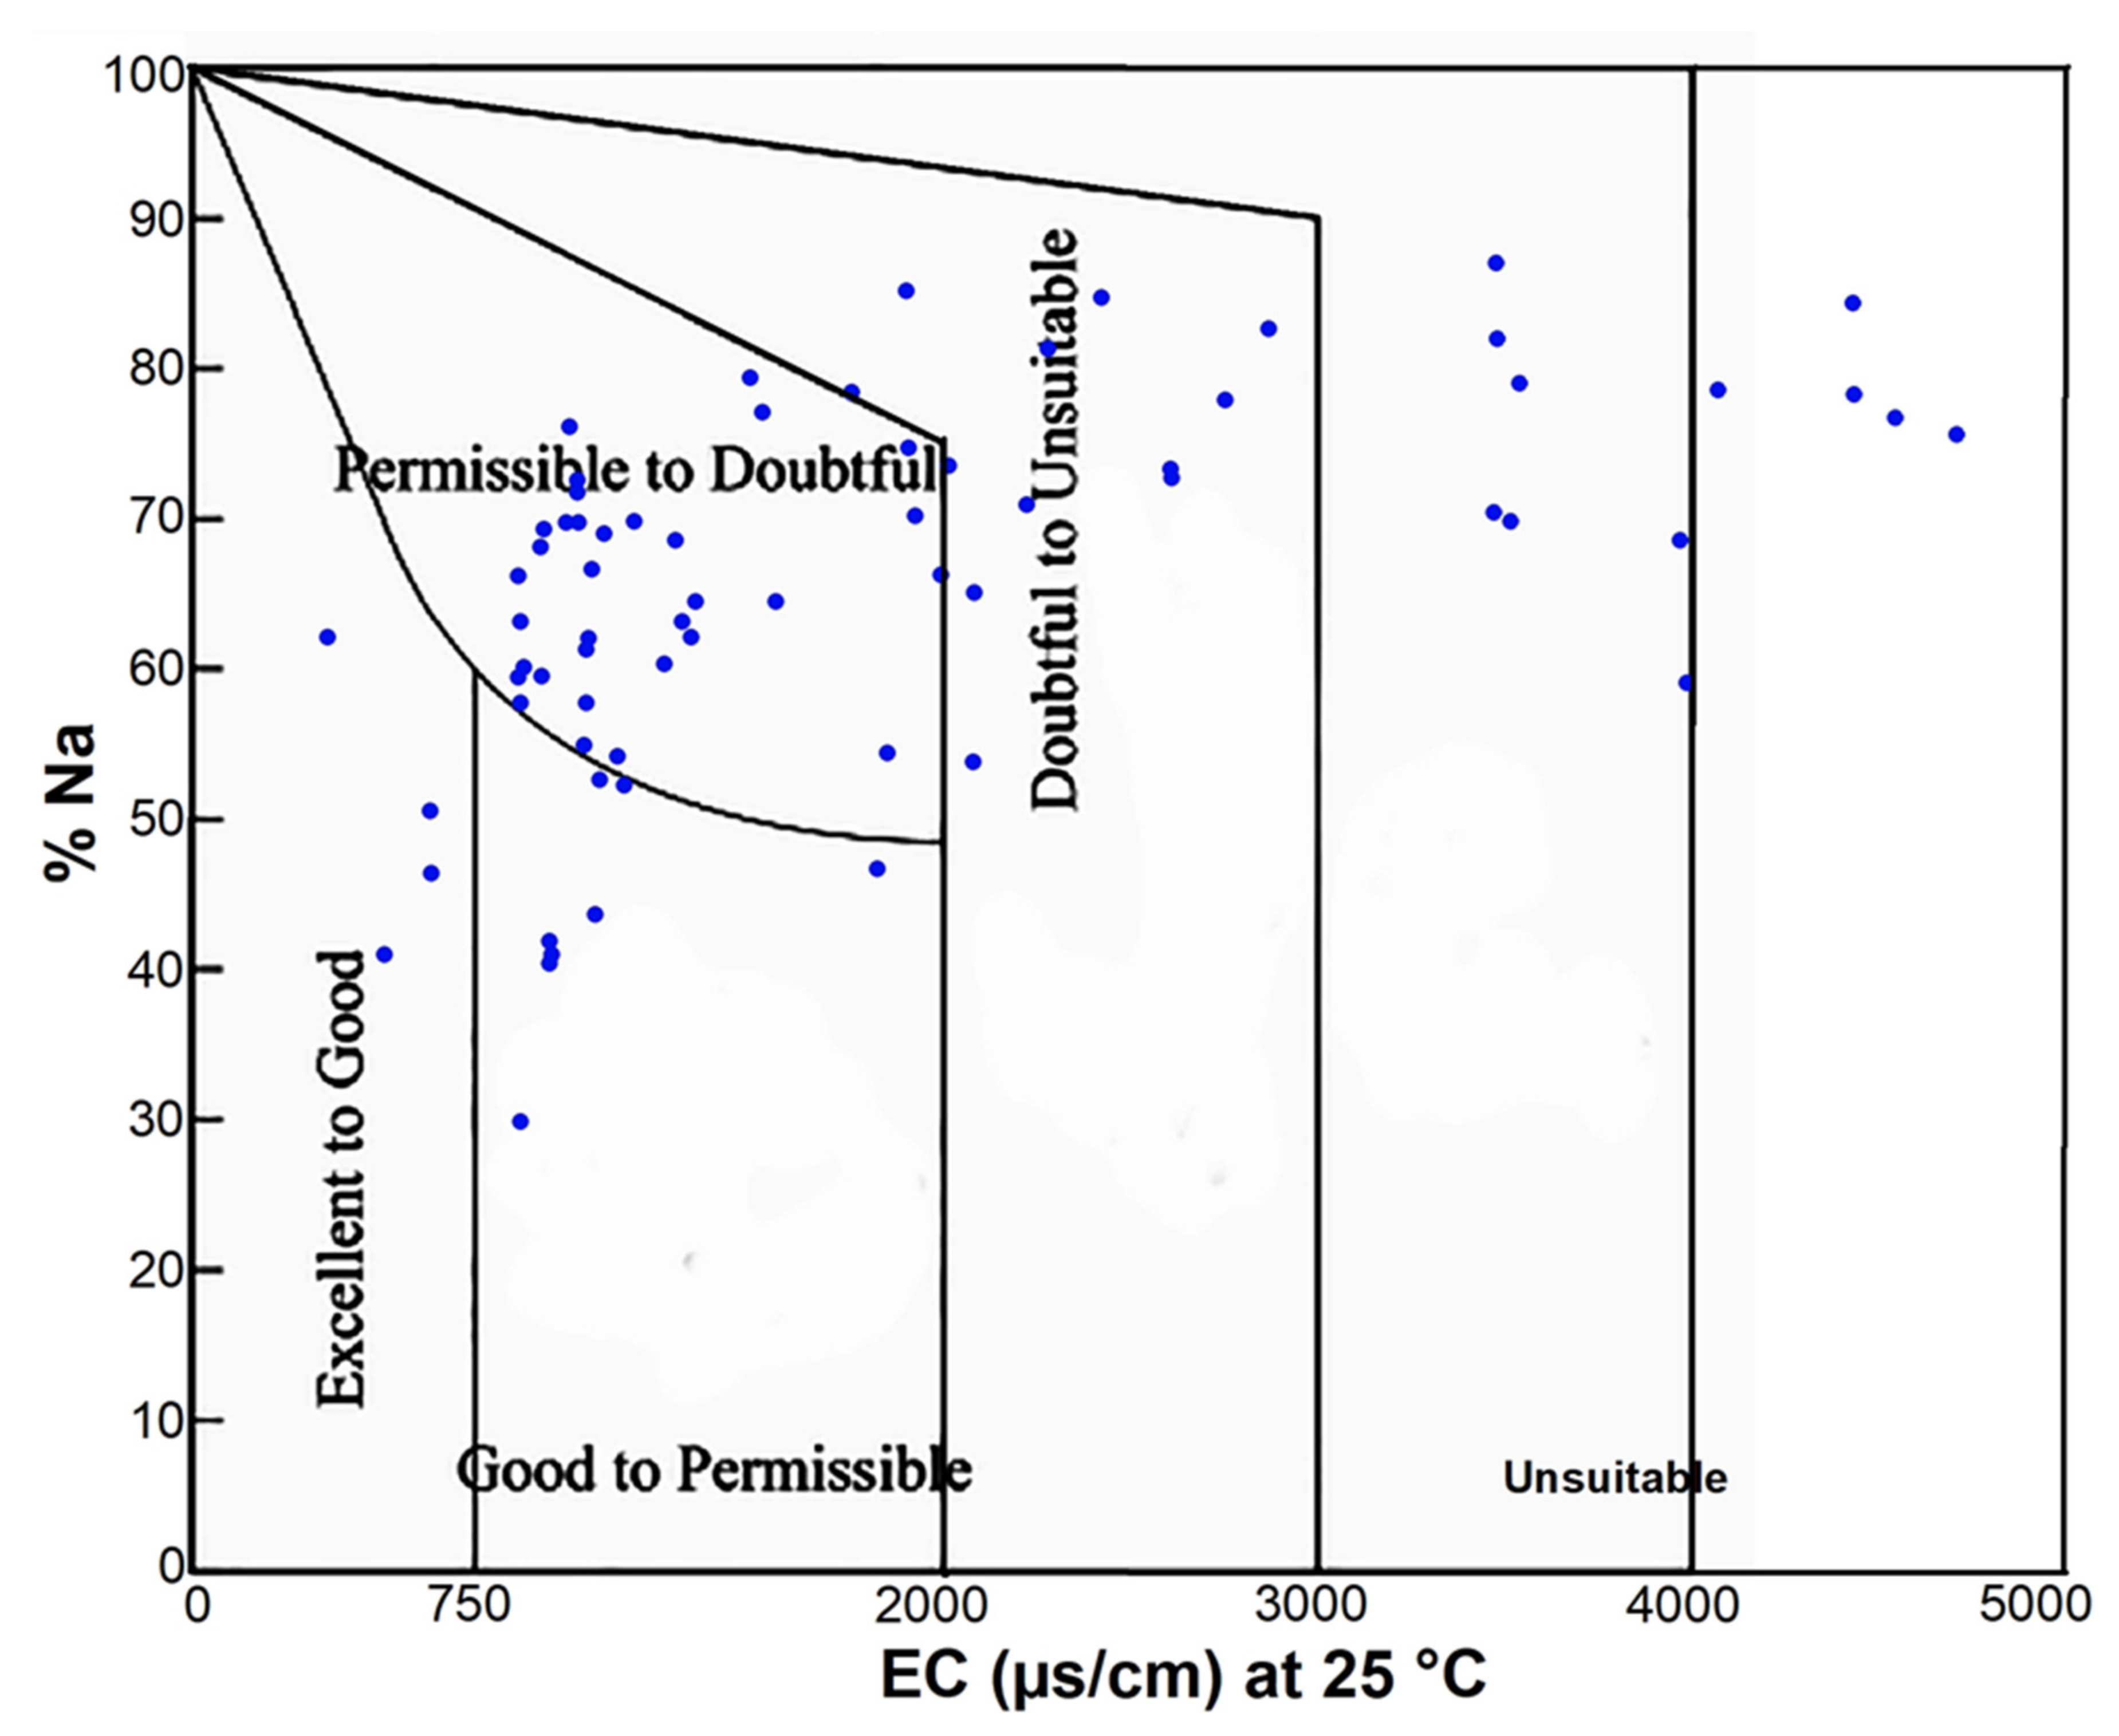
The US Salinity Laboratory (USSL) diagram [60] was also used to evaluate the sodium hazard and water salinity for irrigation. Water is often classified as unsuitable for irrigation when the EC reaches or exceeds 3000 µS/cm. Water with a soluble sodium percent (Na%) exceeds 60% may result in sodium accumulations that will cause a breakdown in the soil’s physical properties and result in the formation of a shallow hardpan that causes waterlogging problems. The results revealed that 4 wells have EC less than 750 µS/cm belong to “excellent to good”; 8 wells have EC between (750–2000 µS/cm) and Na% less than 60% belong to the “good to permissible” class; 33 wells have EC between (750−2000 µS/cm), and Na% exceeds 60% belong “permissible to doubtful”; 13 wells have (2000–3000 µS/cm), and Na% exceeds 60% belong to “doubtful to unsuitable”; and 13 wells have EC exceeds 3000 µS/cm and Na% exceeds 60% belong to the “unsuitable” class (Figure 10).
The Na% values ranged between 30% and 92%. The IDW interpolation surface map of Na% in the study area was classified using the USSL thresholds: normal (<60) green color, moderate (61–70) yellow color, high (71–80) brown color, and very high (>80) light pink color. The spatial map exhibited that the Na% normal class occurs in the northeastern part of the study area (Figure 11). The Na% moderate class occupies a narrow zone east of the Cairo–Alexandria highway. The Na% high covers the central part west of Cairo–Alexandria highway and a narrow strip along the highway. There is a spike of the Na% high class in the central northern part around wells 44, 55, 56, and 58. Another spike of Na% high class extends east of the Cairo–Alexandria highway around wells 14, 15, and 41. The Na% very high class covers the northwestern and southwestern parts west of the Cairo–Alexandria highway. There are 3 spikes around wells 16, 19, and 20 (Figure 11).
6. Discussion
6.1. Food Security and Water Scarcity
Owing to the combination of a rapidly expanding population and arid climate, Egypt faces rising food insecurity and is struggling to meet its basic food and water needs. The cultivated lands in Egypt are confined to the course of the River Nile within its valley and delta. The growing population and increasing demand for food supplies have led to the expanded cultivated lands in the Western desert. Most of the reclaimed lands in the Western desert are irrigated with groundwater. In the past three decades (1990–2020), the cropland expansion in the western Nile Delta reached up to ~4124.2 km2 (Figure 4 and Figure 5).
The westward expansion in the reclaimed lands led to the use of poor-quality water for irrigation purposes, while the continuous usage of low-quality water could cause a decline in crop productivity. The current study shows that the groundwater salinity of the western Nile Delta region was classified into 5 classes: normal, moderate, high, very high, and extreme (Figure 6). The normal and moderate classes occur eastward of the Cairo–Alexandria highway, whereas the high, very high, and extreme classes occur westward of the highway. The wells within normal and moderate classes draw water mostly from the unconfined Quaternary aquifer that is recharged from the Nile River and canals that keeps water salinity within normal ranges. The wells within high, very high, and extreme classes draw water from the Moghra, Wadi El Natrun, and Oligocene confined aquifers (Figure 3). The long-term extraction of groundwater from the confined aquifers over the past three decades resulted in leaching of aquifer’s marine sediments and dissolution of Na, Mg, Ca, and increased TDS in groundwater. Long-term irrigation with high salinity water can potentially increase the soluble sodium percentage (SSP—Na%), the sodium adsorption ratio (SAR) in the soil. High levels of Na% and SAR in irrigation water lead to an increase in adsorbed exchangeable sodium, which may cause dispersion in soil aggregates, blocking pores and reducing the water infiltration [60,61]. Good quality water with EC < 1000 µS/cm, Na% < 60%, and SAR < 10 for irrigation is important to maintain good soil structure and crop yield. Our results show that the water wells eastern of the Cairo–Alexandria highway have SAR < 10, whereas water wells west of the highway have higher SAR > 10 (Figure 7 and Figure 8). The Na% spatial distribution shows that the normal and moderate Na% classes are located eastward of the Cairo–Alexandria highway except for two spikes that have high Na% (Figure 10). The high and very high Na% classes are located westward of the highway. The long-term use of high salinity groundwater resulted in higher values of SAR and Na% in the area west of the Cairo–Alexandria highway. The spatial distribution of EC, SAR, and Na% showed that they are highly correlated, having NW–SE direction and increase gradually from east to west (Figure 6, Figure 8 and Figure 10).
6.2. Low Water Quality and Waterlogging
Long-term irrigation with high salinity groundwater increases soil salinity and sodium concentration and leads to soil permeability problems. Low soil permeability and poor drainage result in low infiltration rates, waterlogging, and a decline in crop productivity. The spatial distribution of waterlogging in 1990, 2000, and 2010 shows waterlogging patches around the Nubaria canal. These patches occur in normal EC, SAR, and Na% classes which indicate that they were formed by seepages from the Nubariya canal and the absence or insufficient maintenance of the subsurface drainage system. The waterlogging patches around the Nubariya canal were diminished since 2010 due to the installation of a subsurface drainage line between the Mahmoudia canal and the Nubariya canal that drains into the Mediterranean Sea. Waterlogging patches also exist in the El Marbat depression that was developed in 2000 between the Naser canal and the Gharb Al Nubariya canal (Figure 2 and Figure 4). These patches occur in moderate salinity (1100–2000 µS/cm), normal SAR (<10), and high Na% (71–80%) classes (Figure 6, Figure 8 and Figure 10). The low topography of the El Marbat depression and the long-term irrigation with high salinity groundwater resulted in low soil permeability and waterlogging (Figure 2). A strip of waterlogging patches occurs in Wadi El Natrun’s depression (Figure 2). These patches have gradually enlarged since 1990 to cover larger areas. The waterlogging patches in Wadi El Natrun occur in high and very high EC classes (Figure 6). They also exist in moderate SAR, high and very high Na% classes (Figure 8 and Figure 10). The higher Na concentration in irrigation groundwater and absence of a drainage system resulted in low soil permeability, low infiltration rates, and waterlogging. The low topography of Wadi El Natrun (10 m below sea level) helped in interconnecting the waterlogging patches to form water ponds (Figure 2).
6.3. Management Strategies to Reduce Waterlogging and Increase Crop Yield
Waterlogging and salinization have adverse effects on plant growth and crop yield. The spatial distribution of waterlogging, EC, SAR, and Na% shows that the study area can be divided into two regions, eastern and western of the Cairo–Alexandria highway. The region east of the highway was classified as normal and moderate salinity and sodium hazard; this type of water has low limitations and is suitable for most agriculture crops. Moderately salt-tolerant plants can be grown in most cases without special management. The waterlogging can be managed by periodic maintenance of the existing subsurface drainage system.
The region west of the Cairo–Alexandria highway was classified as high and very high salinity and sodium hazard, which requires special management for crop production. Sprinkler and drip irrigation is the dominant systems in the region. Management of low-quality water for irrigation involves the application of excess water to maintain root-zone salinity at a lower level that avoids yield reduction [62]. Drip irrigation is more effective in using low-quality water for irrigation because the low salinity zone around and below drippers promotes high yields [63,64]. It is reported that daily irrigation with brackish and saline water lowered average salinity in the soil profile and minimized salinity in the immediate area of the plant roots [62,65]. Reference [66] found that high-frequency drip irrigation reduced salt load in drainage as salts are stored in the upper root zone but beyond the plant’s zone of active uptake. Therefore, this study recommends high-frequency drip irrigation for the area west of the Cairo–Alexandria highway.
The installation of a drainage system is necessary to control the waterlogging and salinization problems as it maintains a net flux of salt away from the root zone and lowers the water table to a safe depth to facilitate agricultural activities [5,67]. Our second recommendation is installing drainage systems to drain into the water ponds in Wadi El Natrun. Sustainable management can be utilized by building a solar-powered desalination plant in Wadi El Natrun for desalinization and purification of the drainage water to avoid environmental degradation. The purified water could be used for fish farming.
6.4. Advantages and Limitations of Applied Method
Remotely sensed spectral indices such as salinity index (SI), brightness index (BI), and normalized difference salinity index (NDSI) [16,18] could work well with bare soil, but they are not accurate for monitoring cropland soil salinity due to insufficient spectral separation between saline soil and crops. Remotely sensed spectral vegetation indices such as normalized difference vegetation index (NDVI) of crops had been used as indirect indicators to map soil salinity through monitoring the vegetation condition [19,20,21]. However, there is still a challenge concerning how to quantitatively correlate the vegetation indices with the salinity of soil layers because these indices assume that soil salinity is the only stressor of the crop condition, whereas other factors such as soil drainage and irrigation water quality are neglected. Moreover, different crops have different levels of salinity tolerance, so that the vegetation indices are not accurate for assessing and monitoring soil salinity within croplands. Owing to the direct correlation between soil salinity and waterlogging, our applied method for monitoring surface waterlogging within croplands is promising proxies for indicating soil salinity.
The proposed method by [36] for detection and assessment of the waterlogging in the dryland by visual interpretation of the Landsat images and the shuttle radar topography mission (SRTM) digital elevation model (DEM) had some limitations. The limited spectral resolution of Landsat is insufficient to allow spectral separation for visual discrimination between waterlogging and saline soil which will lead to inaccurate quantification of the waterlogged areas. Hence, to overcome this issue, we combined the derived vegetation indices (NDVI) and water indices (NDWI), which resulted in unmixing the spectral signature of crops and waterlogging and lead to minimizing the classification errors and accurate quantification of waterlogged areas. The limitation of our method is that it works only with surface waterlogging, but it has limitations on monitoring subsurface waterlogging.
7. Conclusions
Owing overpopulation and increasing demand for food supplies in Egypt have led to the expanded cultivated lands in the Western desert. Due to water scarcity, most of the reclaimed lands in the Western Desert are irrigated with high salinity groundwater. Geospatial techniques provided time and cost-effective approaches for identifying and quantifying the spatial relationship between water quality and waterlogging. The spatial distribution and temporal variation have identified a significant spatial relationship between waterlogging and EC, SAR, and Na% in irrigation water. Long-term use of low-quality water in irrigation and lack of a drainage system resulted in low soil permeability, low infiltration rates, and waterlogging in El Marbat depression and Wadi El Natrun. Owing to the combination of low topography and low-quality irrigation water led to the growth and expansion of water ponds in the Wadi El Natrun depression. The applied method for monitoring surface waterlogging within croplands is promising proxies for indicating soil salinity. This study recommends salt-tolerant plants and high-frequency drip irrigation in the region west of the Cairo–Alexandria highway because the low salinity zone around and below drippers promotes high yields. A shift in water management practices towards a greater reliance on the less expensive desalinization of regional groundwater, and the cost-savings that would be derived from this shift, will require installing drainage systems to drain into the water ponds in Wadi El Natrun; and building a solar-powered desalination plant for desalinization and purification of the drainage water could be used for fish farming or agricultural activities.
Supplementary Materials
The following are available online at https://www.mdpi.com/2072-4292/13/6/1047/s1, Table S1: Groundwater hydrochemical analysis.
Funding
This research received no external funding.
Data Availability Statement
The Landsat and DEM data that support the findings of this study are openly available on the USGS Earth Explorer (www.earthexplorer.usgs.gov (accessed on 1 February 2021)). The irrigation water hydrochemical analysis is provided in the supplementary table.
Acknowledgments
The author would like to thank the United States Geological Survey (USGS) for providing Landsat images. The author would also like to thank the Nubariya Agricultural Research Station for assisting with the fieldwork.
Conflicts of Interest
The author declares that he has no known competing financial interests or personal relationships that could have appeared to influence the work reported in this paper.
References
- The Food and Agriculture Organization (FAO). Available online: http://www.fao.org (accessed on 1 February 2021).
- Assouline, S.; Russo, D.; Silber, A.; Or, D. Balancing water scarcity and quality for sustainable irrigated agriculture. Water Resour. Res. 2015, 51, 3419–3436. [Google Scholar] [CrossRef]
- Shahid, S.A.; Zaman, M.; Heng, L. Irrigation Water Quality. In Guideline for Salinity Assessment, Mitigation and Adaptation Using Nuclear and Related Techniques; Springer: Cham, Switzerland, 2018. [Google Scholar]
- El Ayni, F.; Manoli, E.; Cherif, S.; Jrad, A.; Assimacopoulos, D.; Ayadi, M. Deterioration of a Tunisian coastal aquifer due to agricultural activities and possible approaches for better water management. Water Environ. J. 2012, 27, 348–361. [Google Scholar] [CrossRef]
- Yasuor, H.; Yermiyahu, U.; Ben-Gal, A. Consequences of irrigation and fertigation of vegetable crops with variable quality water: Israel as a case study. Agric. Water Manag. 2020, 242, 106362. [Google Scholar] [CrossRef]
- Aslam, M.; Prathapar, S.A. Strategies to Mitigate Secondary Salinization in the Indus Basin of Pakistan: A Selective Review. Research Report 97; International Water Management Institute (IWMI): Colombo, Sri Lanka, 2006; p. 33. ISBN 92-9090-616-2. [Google Scholar]
- Singh, A. Development and application of a water table model for the assessment of waterlogging in irrigated semi-arid regions. Water Resour. Manag. 2012, 26, 4435–4448. [Google Scholar] [CrossRef]
- Singh, A. Soil salinization and waterlogging: A threat to environment and agricultural sustainability. Ecol. Indic. 2015, 57, 128–130. [Google Scholar] [CrossRef]
- Mercau, J.L.; Nosetto, M.D.; Bert, F.; Giménez, R.; Jobbágy, E.G. Shallow groundwater dynamics in the Pampas: Climate, landscape and crop choice effects. Agric. Water Manag. 2016, 163, 159–168. [Google Scholar] [CrossRef]
- Brusseau, M.L.; Pepper, I.L.; Gerba, C.P. Environmental and Pollution Science; Academic Press: London, UK, 2019. [Google Scholar]
- Shahid, S.A.; Zaman, M.; Heng, L. Introduction to Soil Salinity, Sodicity and Diagnostics Techniques. In Guideline for Salinity Assessment, Mitigation and Adaptation Using Nuclear and Related Techniques; Springer: Cham, Switzerland, 2018. [Google Scholar]
- Metternicht, G.I.; Zinck, J.A. Remote sensing of soil salinity: Potentials and constraints. Remote Sens. Environ. 2003, 85, 1–20. [Google Scholar] [CrossRef]
- Nicolas, H.; Walter, C. Detecting salinity hazards within a semiarid contextby means of combining soil and remote-sensing data. Geoderma 2006, 134, 217–230. [Google Scholar]
- Scudiero, E.; Skaggs, T.H.; Corwin, D.L. Regional scale soil salinity evaluation using Landsat 7, western San Joaquin Valley, California, USA. Geoderma Reg. 2014, 2–3, 82–90. [Google Scholar] [CrossRef]
- Scudiero, E.; Skaggs, T.H.; Corwin, D.L. Comparative regional-scale soil salinity assessment with near-ground apparent electrical conductivity and remote sensing canopy reflectance. Ecol. Indic. 2016, 70, 276–284. [Google Scholar] [CrossRef] [Green Version]
- Moussa, I.; Walter, C.; Michot, D.; Boukary, I.; Nicolas, H.; Pichelin, P.; Guero, Y. Soil Salinity Assessment in Irrigated Paddy Fields of the Niger Valley Using a Four-Year Time Series of Sentinel-2 Satellite Images. Remote Sens. 2020, 12, 3399. [Google Scholar] [CrossRef]
- Bannari, A.; Al-Ali, Z. Assessing Climate Change Impact on Soil Salinity Dynamics between 1987–2017 in Arid Landscape Using Landsat TM, ETM+ and OLI Data. Remote Sens. 2020, 12, 2794. [Google Scholar] [CrossRef]
- Wang, J.; Ding, J.; Yu, D.; Ma, X.; Zhang, Z.; Ge, X.; Teng, D.; Li, X.; Liang, J.; Lizaga, I.; et al. Capability of Sentinel-2 MSI data for monitoring and mapping of soil salinity in dry and wet seasons in the Ebinur Lake region, Xinjiang, China. Geoderma 2019, 353, 172–187. [Google Scholar] [CrossRef]
- Khan, N.M.; Rastoskuev, V.V.; Sato, Y.; Shiozawa, S. Assessment of hydrosaline land degradation by using a simple approach of remote sensing indicators. Agric. Water Manag. 2005, 77, 96–109. [Google Scholar] [CrossRef]
- Fernandez-Buces, N.; Siebe, C.; Cram, S.; Palacio, J.L. Mapping Soil Salinity Using a Combined Spectral Res- ponse Index for Bare Soil and Vegetation: A Case Study in the Former Lake Texcoco, Mexico. J. Arid Environ. 2006, 65, 644–667. [Google Scholar] [CrossRef]
- Gorji, T.; Sertel, E.; Tanik, A. Monitoring soil salinity via remote sensing technology under data scarce conditions: A case study from Turkey. Ecol. Indic. 2017, 74, 384–391. [Google Scholar] [CrossRef]
- Grieve, C.; Grattan, S.; Maas, E. Plant salt tolerance. In Agricultural Salinity Assessment and Management, 2nd ed.; Wallender, W.W., Tanji, K.K., Eds.; ASCE Manuals and Reports on Engineering Practice No 71; ASCE: New York, NY, USA, 2012; pp. 405–459. [Google Scholar]
- Singh, A. Hydrological problems of water resources in irrigated agriculture: A management perspective. J. Hydrol. 2016, 541, 1430–1440. [Google Scholar] [CrossRef]
- Singh, A. Waterlogging and salinity management for sustainable irrigated agriculture. I: Overview, implication and plant response. J. Irrig. Drain. Eng. 2017, 143. [Google Scholar] [CrossRef]
- Singh, A. Soil salinization management for sustainable development: A review. J. Environ. Manag. 2021, 277, 111383. [Google Scholar] [CrossRef]
- Kaur, G.; Singh, G.; Motavalli, P.P.; Nelson, K.A.; Orlowski, J.M.; Golden, B.R. Impacts and management strategies for crop production in waterlogged or flooded soils: A review. Agron. J. 2020, 112, 1475–1501. [Google Scholar] [CrossRef] [Green Version]
- Ramana, D.V.; Rai, S.N.; Singh, R.N. Water table fluctuations due to transient recharge in a 2D aquifer system with inclined base. Water Resour. Manag. 1995, 9, 127–138. [Google Scholar] [CrossRef]
- Gates, T.K.; Burkhalter, J.P.; Labadie, J.W.; Valliant, J.C.; Broner, I. Monitoring and modeling flow and salt transport in a salinity-threatened irrigated valley. J. Irrig. Drain. Eng. 2002, 128, 87–99. [Google Scholar] [CrossRef]
- Dawoud, M.A.; Allam, A.R. Effect of new Nag Hammadi Barrage on groundwater and drainage conditions and suggestion of mitigation measures. Water Resour. Manag. 2004, 18, 321–337. [Google Scholar] [CrossRef]
- Lohani, A.K.; Jaiswal, R.K.; Jha, R. Waterlogged area mapping of Mokama group of Tals using remote sensing and GIS. J. Inst. Eng. 1999, 80, 133–137. [Google Scholar]
- Dwivedi, R.S.; Ramana, K.V.; Thammappa, S.S.; Singh, A.N. The utility of IRS-1C and LISS-III and PAN-Merged data for mapping salt-affected soils. Photogramm. Eng. Remote Sens. 2001, 67, 1167–1175. [Google Scholar]
- Chowdary, V.M.; Chandran, R.V.; Neeti, N.; Bothale, R.V.; Srivastava, Y.K.; Ingle, P.; Ramakrishnan, D.; Dutta, D.; Jeyaram, A.; Sharma, J.R.; et al. Assessment of surface and sub-surface waterlogged areas in irrigation command areas of Bihar state using remote sensing and GIS. Agric. Water Manag. 2008, 95, 754–766. [Google Scholar] [CrossRef]
- Dwivedi, R.S.; Ramana, K.V.; Sreenivas, K. Temporal behavior of surface waterlogged areas using spaceborne multispectral multitemporal measurements. J. Indian Soc. Remote Sens. 2007, 35, 173–184. [Google Scholar] [CrossRef]
- Fei, X.; Zheng, L.; Yun, D.; Feng, L.; Yi, Y.; Qi, F.; Xuan, B. Monitoring Perennial Sub-Surface Waterlogged Croplands Based on MODIS in Jianghan Plain, Middle Reaches of the Yangtze River. J. Integr. Agric. 2014, 13, 1791–1801. [Google Scholar]
- Liu, W.; Huang, J.; Wei, C.; Wang, X.; Mansaray, L.; Han, J.; Zhang, D.; Chen, Y. Mapping water-logging damage on winter wheat at parcel level using high T spatial resolution satellite data. ISPRS J. Photogramm. Remote Sens. 2018, 142, 243–256. [Google Scholar] [CrossRef]
- El Bastawesy, M.; Ali, R.; Deocampo, D.; Al Baroudi, M. Detection and assessment of the Waterlogging in the dryland drainage basins using remote sensing and GIS techniques. J. Sel. Top. Appl. Earth Obs. Remote Sens. 2012, 5, 1564–1571. [Google Scholar] [CrossRef]
- Singh, A. Managing the salinization and drainage problems of irrigated areas through remote sensing and GIS techniques. Ecol. Indic. 2018, 89, 584–589. [Google Scholar] [CrossRef]
- Wang, R.; Zhang, J.; Wang, C.; Guo, E. Characteristic Analysis of Droughts and Waterlogging Events for Maize Based on a New Comprehensive Index through Coupling of Multisource Data in Midwestern Jilin Province, China. Remote Sens. 2020, 12, 60. [Google Scholar] [CrossRef] [Green Version]
- Han, J.; Wei, C.; Chen, Y.; Liu, W.; Song, P.; Zhang, D.; Wang, A.; Song, X.; Wang, X.; Huang, J. Mapping Above-Ground Biomass of Winter Oilseed Rape Using High Spatial Resolution Satellite Data at Parcel Scale under Waterlogging Conditions. Remote Sens. 2017, 9, 238. [Google Scholar] [CrossRef] [Green Version]
- Amer, R.; Moghanm, F. Remote Sensing for Detection and Monitoring of the Cropland Waterlogging in Arid and Semi-Arid Regions. In Proceedings of the Twentieth International Water Technology Conference, IWTC20, Hurghada, Egypt, 18–20 May 2017. [Google Scholar]
- Massoud, U.; Kenawy, A.; Ragab, E.; Abbas, A.; El-Kosery, H. Characterization of the groundwater aquifers at El Sadat City by joint inversion of VES and TEM data. NRIAG J. Astron. Geophys. 2014, 3, 137–149. [Google Scholar] [CrossRef] [Green Version]
- Khalil, A.; Mansour, K.; Rabeh, T.; Basheer, A.; Abdel Zaher, M.; Ali, K. Geophysical Evaluation for Evidence of Recharging the Pleistocene Aquifer at El-Nubariya Area, West Nile Delta, Egypt. Int. J. Geosci. 2014, 5, 324–340. [Google Scholar] [CrossRef]
- RIGW; IWACO. Vulnerability of Groundwater to Pollution in the Nile Valley and Delta; Springer: Cham, Switzerland, 1990. [Google Scholar]
- Abdel Baki, A.A. Hydrogeological and Hydrogeochemical Studies on the Area West of Rosetta Branch and South El Nasr Canal. Ph.D. Thesis, Ain Shams University, Cairo, Egypt, 1983; p. 156. [Google Scholar]
- El Abd, E.A. The geological impact on the water-bearing formations in the area southwest Nile Delta, Egypt. Ph.D. Thesis, Menufiya University, Shibin el Kom, Egypt, 2005; p. 319. [Google Scholar]
- Dawoud, M.A.; Darwish, M.M.; EL-Kady, M.M. GIS-Based Groundwater Management Model for Western Nile Delta. Water Resour. Manag. 2005, 19, 585–604. [Google Scholar] [CrossRef]
- USGS Earth Explorer. Available online: www.earthexplorer.usgs.gov (accessed on 1 February 2021).
- Rouse, J.W.; Haas, R.H.; Schell, J.A.; Deering, D.W. Monitoring Vegetation Systems in the Great Plains with ERTS. In Proceedings of the Third ERTS Symposium, Washington, DC, USA, 10–14 December 1973; NASA SP-351. pp. 309–317. [Google Scholar]
- Holme, A.; Burnside, D.G.; Mitchell, A.A. The development of a system for monitoring trends in range conditions in the arid shrublands of Western Australia. Aust. Rangel. J. 1987, 9, 14–20. [Google Scholar] [CrossRef]
- McFeeters, S.K. The use of Normalized Difference Water Index (NDWI) in the delineation of open water features. Int. J. Remote Sens. 1996, 17, 1425–1432. [Google Scholar] [CrossRef]
- Ji, L.; Zhang, L.; Wylie, B. Analysis of dynamic threshold for the Normalized Difference Water Index. Photogramm. Eng. Remote Sens. 2009, 75, 1307–1317. [Google Scholar] [CrossRef]
- Amer, R.; Kolker, A.; Muscuetta, A. Propensity for erosion and deposition in a deltaic wetland complex: Implications for river management and coastal restoration. Remote Sens. Environ. 2017, 199, 39–50. [Google Scholar] [CrossRef]
- Jensen, J.R. Introductory Digital Image Processing: A Remote Sensing Perspective, 2nd ed.; Prentice-Hall: Upper Saddle River, NJ, USA, 1996. [Google Scholar]
- Coppin, P.; Jonckheere, I.; Nackaerts, K.; Muys, B. Digital change detection methods in ecosystem monitoring: A review. Int. J. Remote Sens. 2004, 25, 1565–1596. [Google Scholar] [CrossRef]
- Klemas, V. Remote sensing of wetlands: Case studies comparing practical techniques. J. Coast. Res. 2011, 27, 418–427. [Google Scholar]
- George, Y.; David, W. An adaptive inverse-distance weighting spatial interpolation technique. Comput. Geosci. 2008, 34, 1044–1055. [Google Scholar]
- Anku, Y.S.; Banoeng, B.; Asiedu, D.K.; Yidana, S.M. Water quality analysis of groundwater in crystalline basement rocks Northern Ghana. Environ. Geol. 2009, 58, 989–997. [Google Scholar] [CrossRef]
- ArcGIS Help. Available online: www.ESRI.com (accessed on 1 February 2021).
- ENVI Help. Available online: www.harrisgeospatial.com (accessed on 1 February 2021).
- The US Salinity Laboratory (USSL). Diagnosis and Improvement of Saline and Alkaline Soils; Handbook No 60; US Department of Agriculture: Washington, DC, USA, 1954; p. 160.
- Wilcox, L.V. Classification and Use of Irrigation Waters; Circular No. 969; US Department of Agriculture: Washington, DC, USA, 1955; p. 969.
- Ayers, R.S.; Westcot, D.W. Water Quality for Agriculture; Irrigation and Drainage Paper 29; FAO: Rome, Italy, 1985; p. 174. ISBN 92-5-102263-1. [Google Scholar]
- Assouline, S.; Muller, M.; Cohen, S.; Ben-Hur, M.; Grava, A.; Narkis, K.; Silber, A. Soil-plant system response to pulsed drip irrigation and salinity: Bell pepper case study. Soil Sci. Soc. Am. J. 2006, 70, 1556–1568. [Google Scholar] [CrossRef]
- Phogat, A.; Mallants, D.; Cox, J.W.; Šimůnek, J.; Oliver, D.P.; Awad, J. Management of soil salinity associated with irrigation of protected crops. Agric. Water Manag. 2020, 227, 105845. [Google Scholar] [CrossRef]
- Dehghanisanij, H.; Agassi, M.; Anyoji, H.; Yamamoto, T.; Inoue, M.; Eneji, A. Improvement of saline water use under drip irrigation system. Agric. Water Manag. 2006, 85, 233–242. [Google Scholar] [CrossRef]
- Dudley, L.M.; Ben-Gal, A.; Lazarovitch, N. Drainage water reuse: Biological, physical, and technological considerations for system management. J. Environ. Qual. 2008, 37, S25–S35. [Google Scholar] [CrossRef] [PubMed]
- Cuevas, J.; Daliakopoulos, I.; del Moral, F.; Hueso, J.; Tsanis, I. A Review of Soil-Improving Cropping Systems for Soil Salinization. Agronomy 2019, 9, 295. [Google Scholar] [CrossRef] [Green Version]
Figure 1.
Location of the study area on the Environmental Systems Research Institute (ESRI) ArcGIS basemap. The image in the upper right corner is a false-color composite Landsat enhanced thematic mapper (ETM+) mosaic of Egypt. The red rectangle is the location of the study area.
Figure 1.
Location of the study area on the Environmental Systems Research Institute (ESRI) ArcGIS basemap. The image in the upper right corner is a false-color composite Landsat enhanced thematic mapper (ETM+) mosaic of Egypt. The red rectangle is the location of the study area.

Figure 2.
Geomorphological subdivision displayed on the shuttle radar topography mission (SRTM) digital elevation model. Waterlogging patches are shown in black color.
Figure 2.
Geomorphological subdivision displayed on the shuttle radar topography mission (SRTM) digital elevation model. Waterlogging patches are shown in black color.

Figure 3.
Groundwater aquifers in the western Nile Delta (after RIGWA, 1991).

Figure 4.
Schematic diagram of the research method.

Figure 5.
GIS combined Landsat-derived normalized difference vegetation index (NDVI) and normalized difference water index (NDWI), quantifying the multi-decadal time-series change of croplands and waterlogged areas from 1990 to 2020.
Figure 5.
GIS combined Landsat-derived normalized difference vegetation index (NDVI) and normalized difference water index (NDWI), quantifying the multi-decadal time-series change of croplands and waterlogged areas from 1990 to 2020.

Figure 6.
Charts showing the growth of croplands and waterlogging from 1990 to 2020.

Figure 7.
Geographical information system mapping (GIS) inverse distance weighted (IDW) interpolation of the groundwater salinity based on the electrical conductivity (EC) µS/cm.
Figure 7.
Geographical information system mapping (GIS) inverse distance weighted (IDW) interpolation of the groundwater salinity based on the electrical conductivity (EC) µS/cm.

Figure 8.
Wilcox (1955) classification of groundwater for irrigation. Blue dots are the groundwater samples.
Figure 8.
Wilcox (1955) classification of groundwater for irrigation. Blue dots are the groundwater samples.

Figure 9.
GIS IDW interpolation of sodium hazard based on the Wilcox classification of the sodium adsorption ratio (SAR).
Figure 9.
GIS IDW interpolation of sodium hazard based on the Wilcox classification of the sodium adsorption ratio (SAR).

Figure 10.
US Salinity Lab (USSL 1954) classification of groundwater for irrigation.

Figure 11.
GIS IDW interpolation of sodium hazard based on the USSL classification of the soluble sodium percent (Na%).
Figure 11.
GIS IDW interpolation of sodium hazard based on the USSL classification of the soluble sodium percent (Na%).


Table 1.
Landsat data acquisition, spatial and spectral characteristics.
| Satellite | Landsat 4–5 TM | Landsat-8 OLI | ||
|---|---|---|---|---|
| Acquisition date | 1990-07-26 | 2000-07-21 | 2010-07-17 | 2020-07-28 |
| Acquisition time | 07:50 | 08:07 | 08:20 | 08:29 |
| Sun elevation | 57.6 | 61.6 | 64.9 | 67.0 |
| Sun azimuth | 101.5 | 103.5 | 105.1 | 106.7 |
| Spatial reference | WGS 1984 UTM Zone 16 N | WGS 1984 UTM Zone 16 N | ||
| Pixel size | 30 m | 30 m | ||
| Spectral bands Wavelength is in µm | Band 1—blue: 0.45–0.52 | Band 2—blue: 0.45–0.51 | ||
| Band 2—green: 0.52–0.60 | Band 3—green: 0.53–0.59 | |||
| Band 3—red: 0.63–0.69 | Band 4—red: 0.64–0.67 | |||
| Band 4—Near-infrared (NIR): 0.77–0.90 | Band 5—near-infrared (NIR): 0.85–0.88 | |||
| Band 5—short-wave infrared (SWIR) 1:1.55–1.75 | Band 6—short-wave infrared (SWIR) 1:1.57–1.65 | |||
| Band 7—short-wave infrared (SWIR) 2:2.09–2.35 | Band 7—short-wave infrared (SWIR) 2:2.11–2.29 | |||
Table 2.
Decadal cropland and waterlogged land areas from 1985 to 2015.
| Year | NDVI (km2) | Cropland Change (%) | NDWI (km2) | Waterlogging Change (%) |
|---|---|---|---|---|
| 2020 | 3482.25 | −17 | 36.36 | 13.5 |
| 2010 | 4124.21 | 83.6 | 31.67 | 9.1 |
| 2000 | 1479.54 | 3 | 19.14 | −18.4 |
| 1990 | 888.35 | 52 | 15.01 | 2.1 |
Table 3.
Summary of accuracy (%) and kappa statistics of Landsat NDVI and NDWI classification.
| Landsat TM 1990 | ||||
|---|---|---|---|---|
| Overall Accuracy = 99.4% | ||||
| Kappa Coefficient = 0.99 | ||||
| Ground Truth (Pixels) | ||||
| Class | Class 1: Soil | Class 2: Water | Class 3: Vegetation | Total |
| Class 1: Soil | 133,894 | 0 | 79 | 133,973 |
| Class 2: Water | 17 | 382 | 378 | 777 |
| Class 3: Vegetation | 452 | 5 | 31,208 | 31,665 |
| Total | 134,363 | 387 | 31,665 | 166,415 |
| Landsat TM 2000 | ||||
| Overall Accuracy = 99.1% | ||||
| Kappa Coefficient = 0.97 | ||||
| Ground Truth (Pixels) | ||||
| Class | Class 1: Soil | Class 2: Water | Class 3: Vegetation | Total |
| Class 1: Soil | 116,233 | 1 | 3 | 116,237 |
| Class 2: Water | 598 | 604 | 335 | 1537 |
| Class 3: Vegetation | 324 | 3 | 25,690 | 26,017 |
| Total | 117,155 | 608 | 26,028 | 143,791 |
| Landsat TM 2010 | ||||
| Overall Accuracy = 98.5% | ||||
| Kappa Coefficient = 0.96 | ||||
| Class | Class 1: Soil | Class 2: Water | Class 3: Vegetation | Total |
| Class 1: Soil | 104,282 | 1 | 426 | 104,709 |
| Class 2: Water | 63 | 3511 | 920 | 4494 |
| Class 3: Vegetation | 974 | 61 | 56,939 | 57,974 |
| Total | 105,319 | 3573 | 58,285 | 167,177 |
| Landsat OLI 2020 | ||||
| Overall Accuracy = 99.3% | ||||
| Kappa Coefficient = 0.98 | ||||
| Class | Class 1: Soil | Class 2: Water | Class 3: Vegetation | Total |
| Class 1: Soil | 88,514 | 0 | 313 | 88,827 |
| Class 2: Water | 0 | 6964 | 149 | 7113 |
| Class 3: Vegetation | 512 | 133 | 63,647 | 64,292 |
| Total | 89,026 | 7097 | 64,109 | 160,232 |
Publisher’s Note: MDPI stays neutral with regard to jurisdictional claims in published maps and institutional affiliations. |
© 2021 by the author. Licensee MDPI, Basel, Switzerland. This article is an open access article distributed under the terms and conditions of the Creative Commons Attribution (CC BY) license (http://creativecommons.org/licenses/by/4.0/).
Share and Cite
MDPI and ACS Style
Amer, R. Spatial Relationship between Irrigation Water Salinity, Waterlogging, and Cropland Degradation in the Arid and Semi-Arid Environments. Remote Sens. 2021, 13, 1047. https://doi.org/10.3390/rs13061047
AMA Style
Amer R. Spatial Relationship between Irrigation Water Salinity, Waterlogging, and Cropland Degradation in the Arid and Semi-Arid Environments. Remote Sensing. 2021; 13(6):1047. https://doi.org/10.3390/rs13061047
Chicago/Turabian StyleAmer, Reda. 2021. "Spatial Relationship between Irrigation Water Salinity, Waterlogging, and Cropland Degradation in the Arid and Semi-Arid Environments" Remote Sensing 13, no. 6: 1047. https://doi.org/10.3390/rs13061047
Note that from the first issue of 2016, this journal uses article numbers instead of page numbers. See further details here.