Article

The Potential Impact of Assimilating Synthetic Microwave Radiances Onboard a Future Geostationary Satellite on the Prediction of Typhoon Lekima Using the WRF Model

1
Key Laboratory of Meteorological Disaster of Ministry of Education (KLME)/Joint International Research Laboratory of Climate and Environment Change (ILCEC)/Collaborative Innovation Center on Forecast and Evaluation of Meteorological Disasters, Nanjing University of Information Science & Technology, Nanjing 210044, China
2
Key Laboratory of Microwave Remote Sensing, National Space Science Center, Chinese Academy of Sciences, Beijing 100190, China
*
Author to whom correspondence should be addressed.
Remote Sens. 2021, 13(5), 886; https://doi.org/10.3390/rs13050886
Submission received: 12 January 2021 / Revised: 9 February 2021 / Accepted: 22 February 2021 / Published: 26 February 2021
(This article belongs to the Section Atmospheric Remote Sensing)

Abstract

:
Geostationary meteorological satellites can provide continuous observations of high-impact weather events with a high temporal and spatial resolution. Sounding the atmosphere using a microwave instrument onboard a geostationary satellite has aroused great study interests for years, as it would increase the observational efficiency as well as provide a new perspective in the microwave spectrum to the measuring capability for the current observational system. In this study, the capability of assimilating future geostationary microwave sounder (GEOMS) radiances was developed in the Weather Research and Forecasting (WRF) model’s data assimilation (WRFDA) system. To investigate if these frequently updated and widely distributed microwave radiances would be beneficial for typhoon prediction, observational system simulation experiments (OSSEs) using synthetic microwave radiances were conducted using the mesoscale numerical model WRF and the advanced hybrid ensemble–variational data assimilation method for the Lekima typhoon that occurred in early August 2019. The results show that general positive forecast impacts were achieved in the OSSEs due to the assimilation of GEOMS radiances: errors of analyses and forecasts in terms of wind, humidity, and temperature were both reduced after assimilating GEOMS radiances when verified against ERA-5 data. The track and intensity predictions of Lekima were also improved before 68 h compared to the best track data in this study. In addition, rainfall forecast improvements were also found due to the assimilation impact of GEOMS radiances. In general, microwave observations from geostationary satellites provide the possibility of frequently assimilating wide-ranging microwave information into a regional model in a finer resolution, which can potentially help improve numerical weather prediction (NWP).

1. Introduction

A large number of satellite radiance observations from different sensors have been assimilated directly into the operational or research numerical weather prediction (NWP) models since the fast development of radiative transfer models and their linearized versions, such as Community Radiative Transfer Model (CRTM) or Radiative Transfer for Tiros Operational Vertical Sounder (RTTOV) [1,2,3,4,5,6,7,8]. Those satellite radiance data account for more than 90% of the actively assimilated observations in global NWP models, thus significantly contributing to improving model forecasting [9]. It is reported that the contributions from assimilating radiances to analysis and prediction accuracy for atmospheric states have exceeded those from assimilating in situ and conventional data in the global NWP model [10].
Radiance observations are mostly produced by infrared sensors onboard geostationary satellites or by infrared and microwave sensors onboard polar-orbiting satellites. Because microwave frequencies have the ability to partially penetrate clouds, valuable observations over data-sparse regions at these frequencies can be provided. Several bands in the microwave spectrum have been used to sound the atmosphere, notably those in the O2 (50–58 GHz) and H2O (around 183 GHz) absorption lines [11,12], providing radiance measurements for atmospheric temperature and water vapor profiling in nearly all weather conditions, except very heavy precipitation, and independently of daylight conditions. Based on the 183 GHz properties, data have been used for deep convective cloud detection [13,14,15], snow, hail, and rainfall detection [11,16,17,18], the evaluation of rainfall and convection prediction [19,20], and even the diagnostics of hurricane-like events in the Mediterranean [21], but there are indeed limited studies that address the usefulness of assimilating microwave radiances in the water vapor frequencies for forecasting.
It was found in many studies that the assimilation of microwave radiances has positive impacts on improving NWP skill scores, especially for mid-range lead times in global models [11,12,13,14,15]. Microwave radiance data assimilation has also shown positive impacts in a variety of applications such as rainfall prediction, snow prediction, streamflow prediction, mid-latitude storm prediction, and soil moisture prediction [22,23,24,25,26,27,28]. In the past two decades, microwave radiance data assimilation has also greatly contributed to large reductions in the error of typhoon track and intensity forecasts by providing valuable observations over oceans that can partially penetrate clouds around a typhoon [29,30,31]. These improvements are linked to a better representation of the upper-level warm core for the rapid intensification of cyclones [32,33,34,35,36,37,38]. In addition, the advancements in ensemble data assimilation techniques lead to better forecasts of typhoon intensity and a continued reduction in track errors because of the use of flow-dependent error statistics estimated from short-term ensemble forecasts, which should represent spatial correlations and mass–wind balances using the observation information provided by satellite radiances [38,39,40,41].
Polar-orbiting satellites have the advantage of providing globally-covering radiance observations, which is significantly important for global NWP models [42]; furthermore, the polar-orbiting radiances usually have much higher observing accuracy because of their low height and high spectral resolution in comparison with the geostationary satellites [43,44]. However, polar-orbiting satellites cannot provide frequently updated radiances observing a wide fixed regional area within a short time window, and thus may miss severe, fast-evolving weather events such as typhoons over ocean. On the contrary, because of the high spatial and temporal resolution and fixed observing view relative to Earth’s surface, sensors on geostationary satellites can produce continuous radiance observations that can rapidly resolve the evolution of high-impact storm systems from convective-scale to meso-scale or large-scale in a fixed observing domain [45,46,47]. To the author’s knowledge, for geostationary instruments in operation, only infrared radiances have been assimilated into the operational model. There are, so far, no geostationary meteorological satellites equipped with microwave observation instruments. Compared with infrared radiances, the microwave radiance data can partially penetrate clouds and rainy areas (though not heavy precipitating clouds), detecting the occurrence and development of the typhoon system in more detail [48,49,50,51]. Therefore, the geostationary microwave radiances can be beneficial to the improvement in the accuracy of numerical analysis and forecast of typhoon cases.
The possibility of a microwave sounder detecting the atmospheric state from a geostationary satellite has been long studied [52]. Such instruments would contribute to increase the observational efficiency provided by geostationary satellites to the sounding capability of the current observational system [53,54,55]. However, there has been few researches directly assimilating microwave radiances from geostationary satellites in regional or global models, and no such studies have been conducted for typhoon prediction applications. It is believed that microwave radiances from geostationary satellites will contribute to the improvement in forecast skill scores for rapidly developing severe storm systems, such as typhoons, through a data assimilation technique with a regional model utilizing frequent cycling setting.
In order to evaluate the potential impact of the geostationary microwave sounder (GEOMS) radiances for typhoon NWP and introduce a data assimilation view of the geostationary microwave sensor concept, the present study was conducted through a reanalysis-based observational system simulation experiment (OSSE). Radiance observations of the 183 GHz water vapor absorption band with different experimental configurations (cycling frequency, data resolution, and calibration accuracy) were investigated. The main reason for the choice of 183 GHz as the sounding channel on geostationary satellites is related to the limitation imposed by the antenna size, so as to achieve a compromise on the minimum desired spatial resolution [53,54]. The added value of assimilating microwave radiances from geostationary satellites will also be studied for the analyses and forecasts of the Lekima typhoon, which landed on Mainland China in early August 2019. Lekima was the strongest typhoon in 2019 and caused great casualties and property losses.
The rest of this paper is organized as follows. Section 2 describes the data used in this study, and the typhoon named Lekima. Section 3 details the GEOMS and its simulated radiances, the radiance data assimilation system, and its setup for GEOMS data, such as the bias correction and quality control. The Weather Research and Forecasting (WRF) model configurations and experimental design are discussed in Section 4. Experimental results are given in Section 5, with conclusions and discussions presented in Section 6 and Section 7.

2. Introduction to the Data Used and Typhoon Lekima

2.1. Introduction of Data Used

In this study, we used the fifth generation of the European Centre for Medium-Range Weather Forecasts (ECMWF) reanalysis (ERA-5) data [56] to simulate the synthetic observations and compute forecast skill scores. ERA-5 provides hourly estimates of a large number of atmospheric, land, and oceanic climate variables. The data cover the Earth on a 30 km grid and resolve the atmosphere using 137 levels from the surface up to a height of 80 km. ERA-5 combines vast amounts of historical observations into global estimates using advanced modelling and data assimilation systems. ERA-5 replaces the ERA-Interim reanalysis, which stopped being produced on 31 August 2019.
To verify the track and intensity prediction in this study, the best track of Typhoon Lekima provided by the Tropical Cyclone Data Center of China Meteorological Administration (CMA) [57] was also used. The CMA best track data information includes time, location (latitude and longitude), maximum wind speed (MWS), and minimum sea level pressure (MSLP), which can be used as the truth for typhoon prediction. These data are available via http://tcdata.typhoon.gov.cn/en/index.html (accessed on 20 July 2020).
In addition, to verify the rainfall forecasts, the China Hourly Merged Precipitation Analysis (CHMPA) data was employed as the rainfall observations. The CHMPA was developed by the National Meteorological Information Center of CMA and combines rainfall observations from satellite-retrieved Climate Prediction Center morphing technique (CMORPH) rainfall data with high-density and hourly automatic weather station rainfall data. The spatial and temporal resolution of CHMPA rainfall data is 0.1° × 0.1° and 1 h, respectively. CHMPA data are now available on the China meteorological data network (http://data.cma.cn/data (accessed on 20 July 2020)) [58].

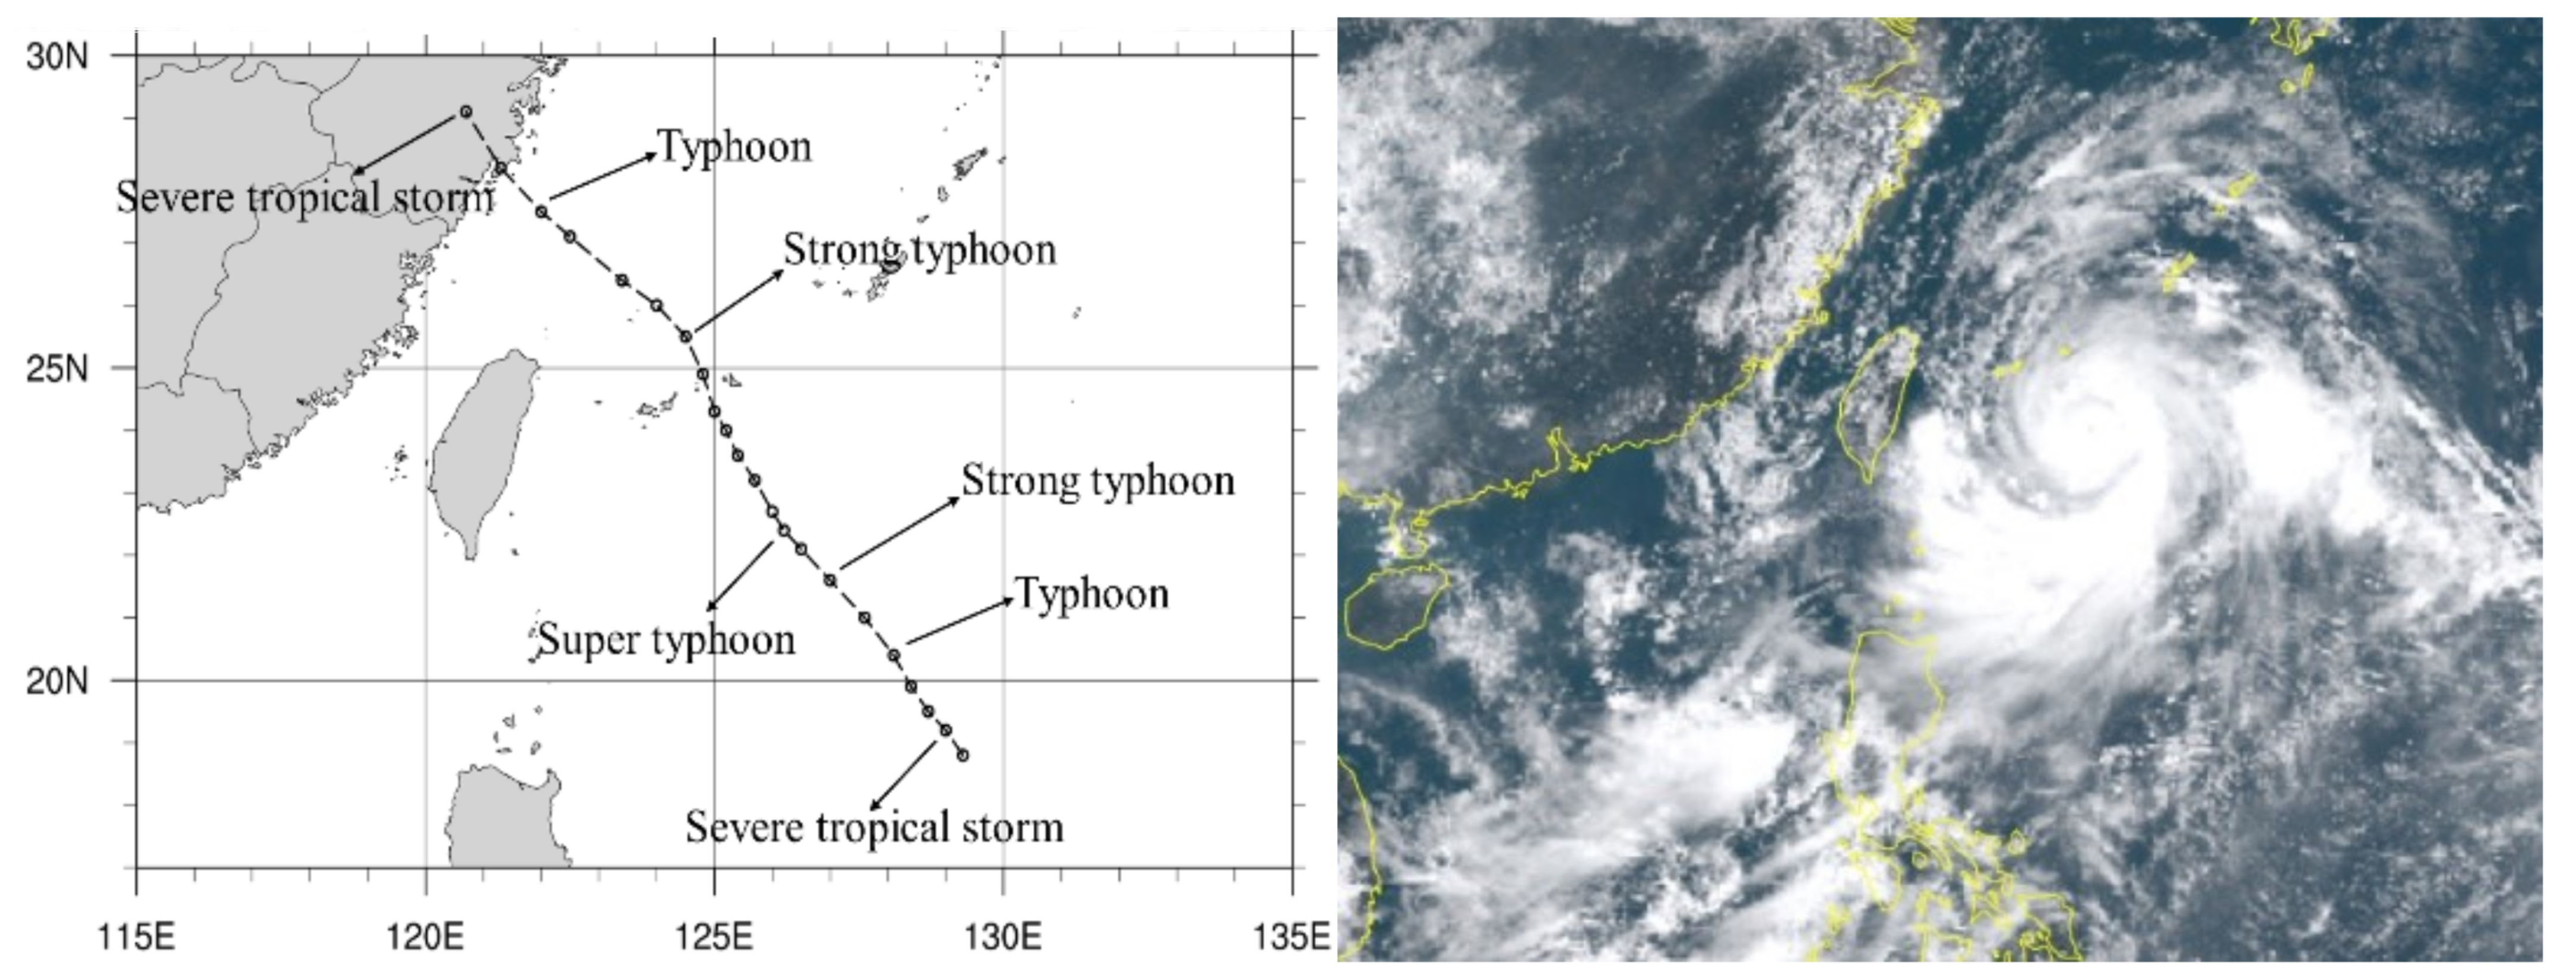
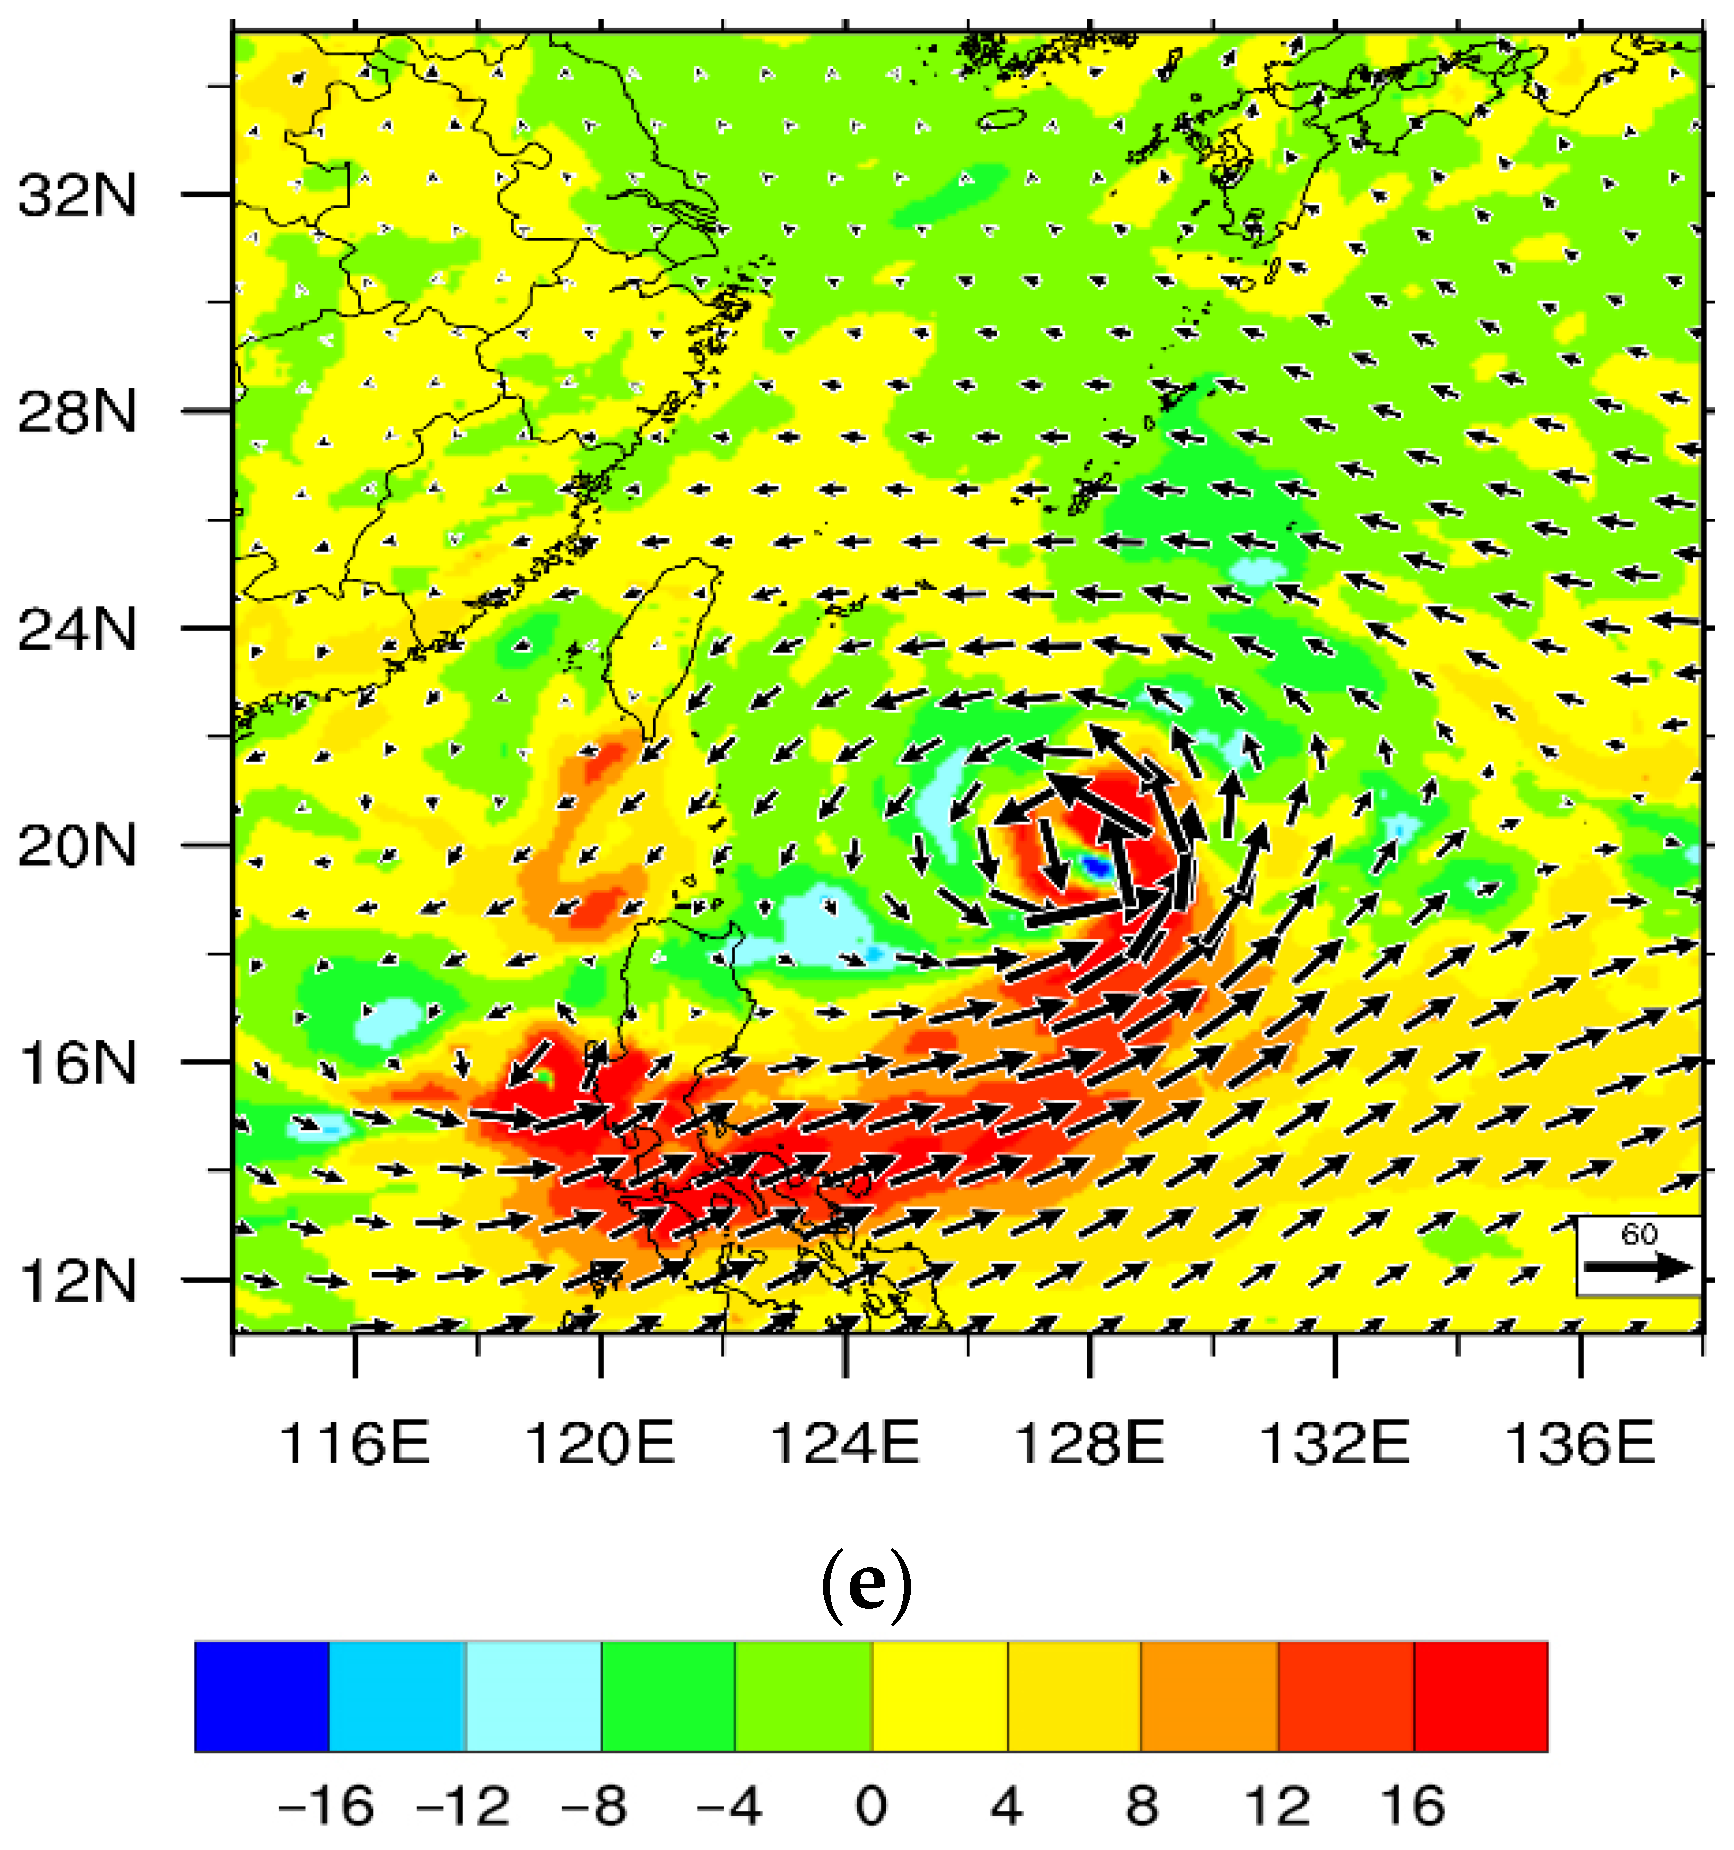
2.2. The Super Typhoon Lekima

Tropical cyclone Lekima (No. 1909) was generated on 4 August 2019 in a tropical disturbance cloud east of the Philippines. At 0900 UTC on 4 August, the CMA upgraded it from a tropical depression to a tropical storm. Lekima moved northwestward under the impact of the outer airflow of the Western Pacific Subtropical High. The intensity approached “typhoon” status at 2100 UTC on 6 August, and it was then strengthened as a super typhoon at 1500 UTC on 6 August. Lekima maintained this intensity until it landed on the coast of Chengnan Town, Wenling City, Zhejiang Province, in the early morning of the 10th in Beijing time (Figure 1). The wind force reached scale 16 (about 52 m·s−1), and the lowest pressure in the typhoon center was 930 hPa. After landing, the track of Lekima gradually changed from northwest to north, and the intensity gradually weakened. Lekima was the strongest typhoon in 2019, causing 14.024 million people in China to be affected by the disaster. Seventy-one people died or went missing, 2.097 million people were urgently transferred and resettled, and the direct economic loss was 53.72 billion yuan.

3. Methodologies

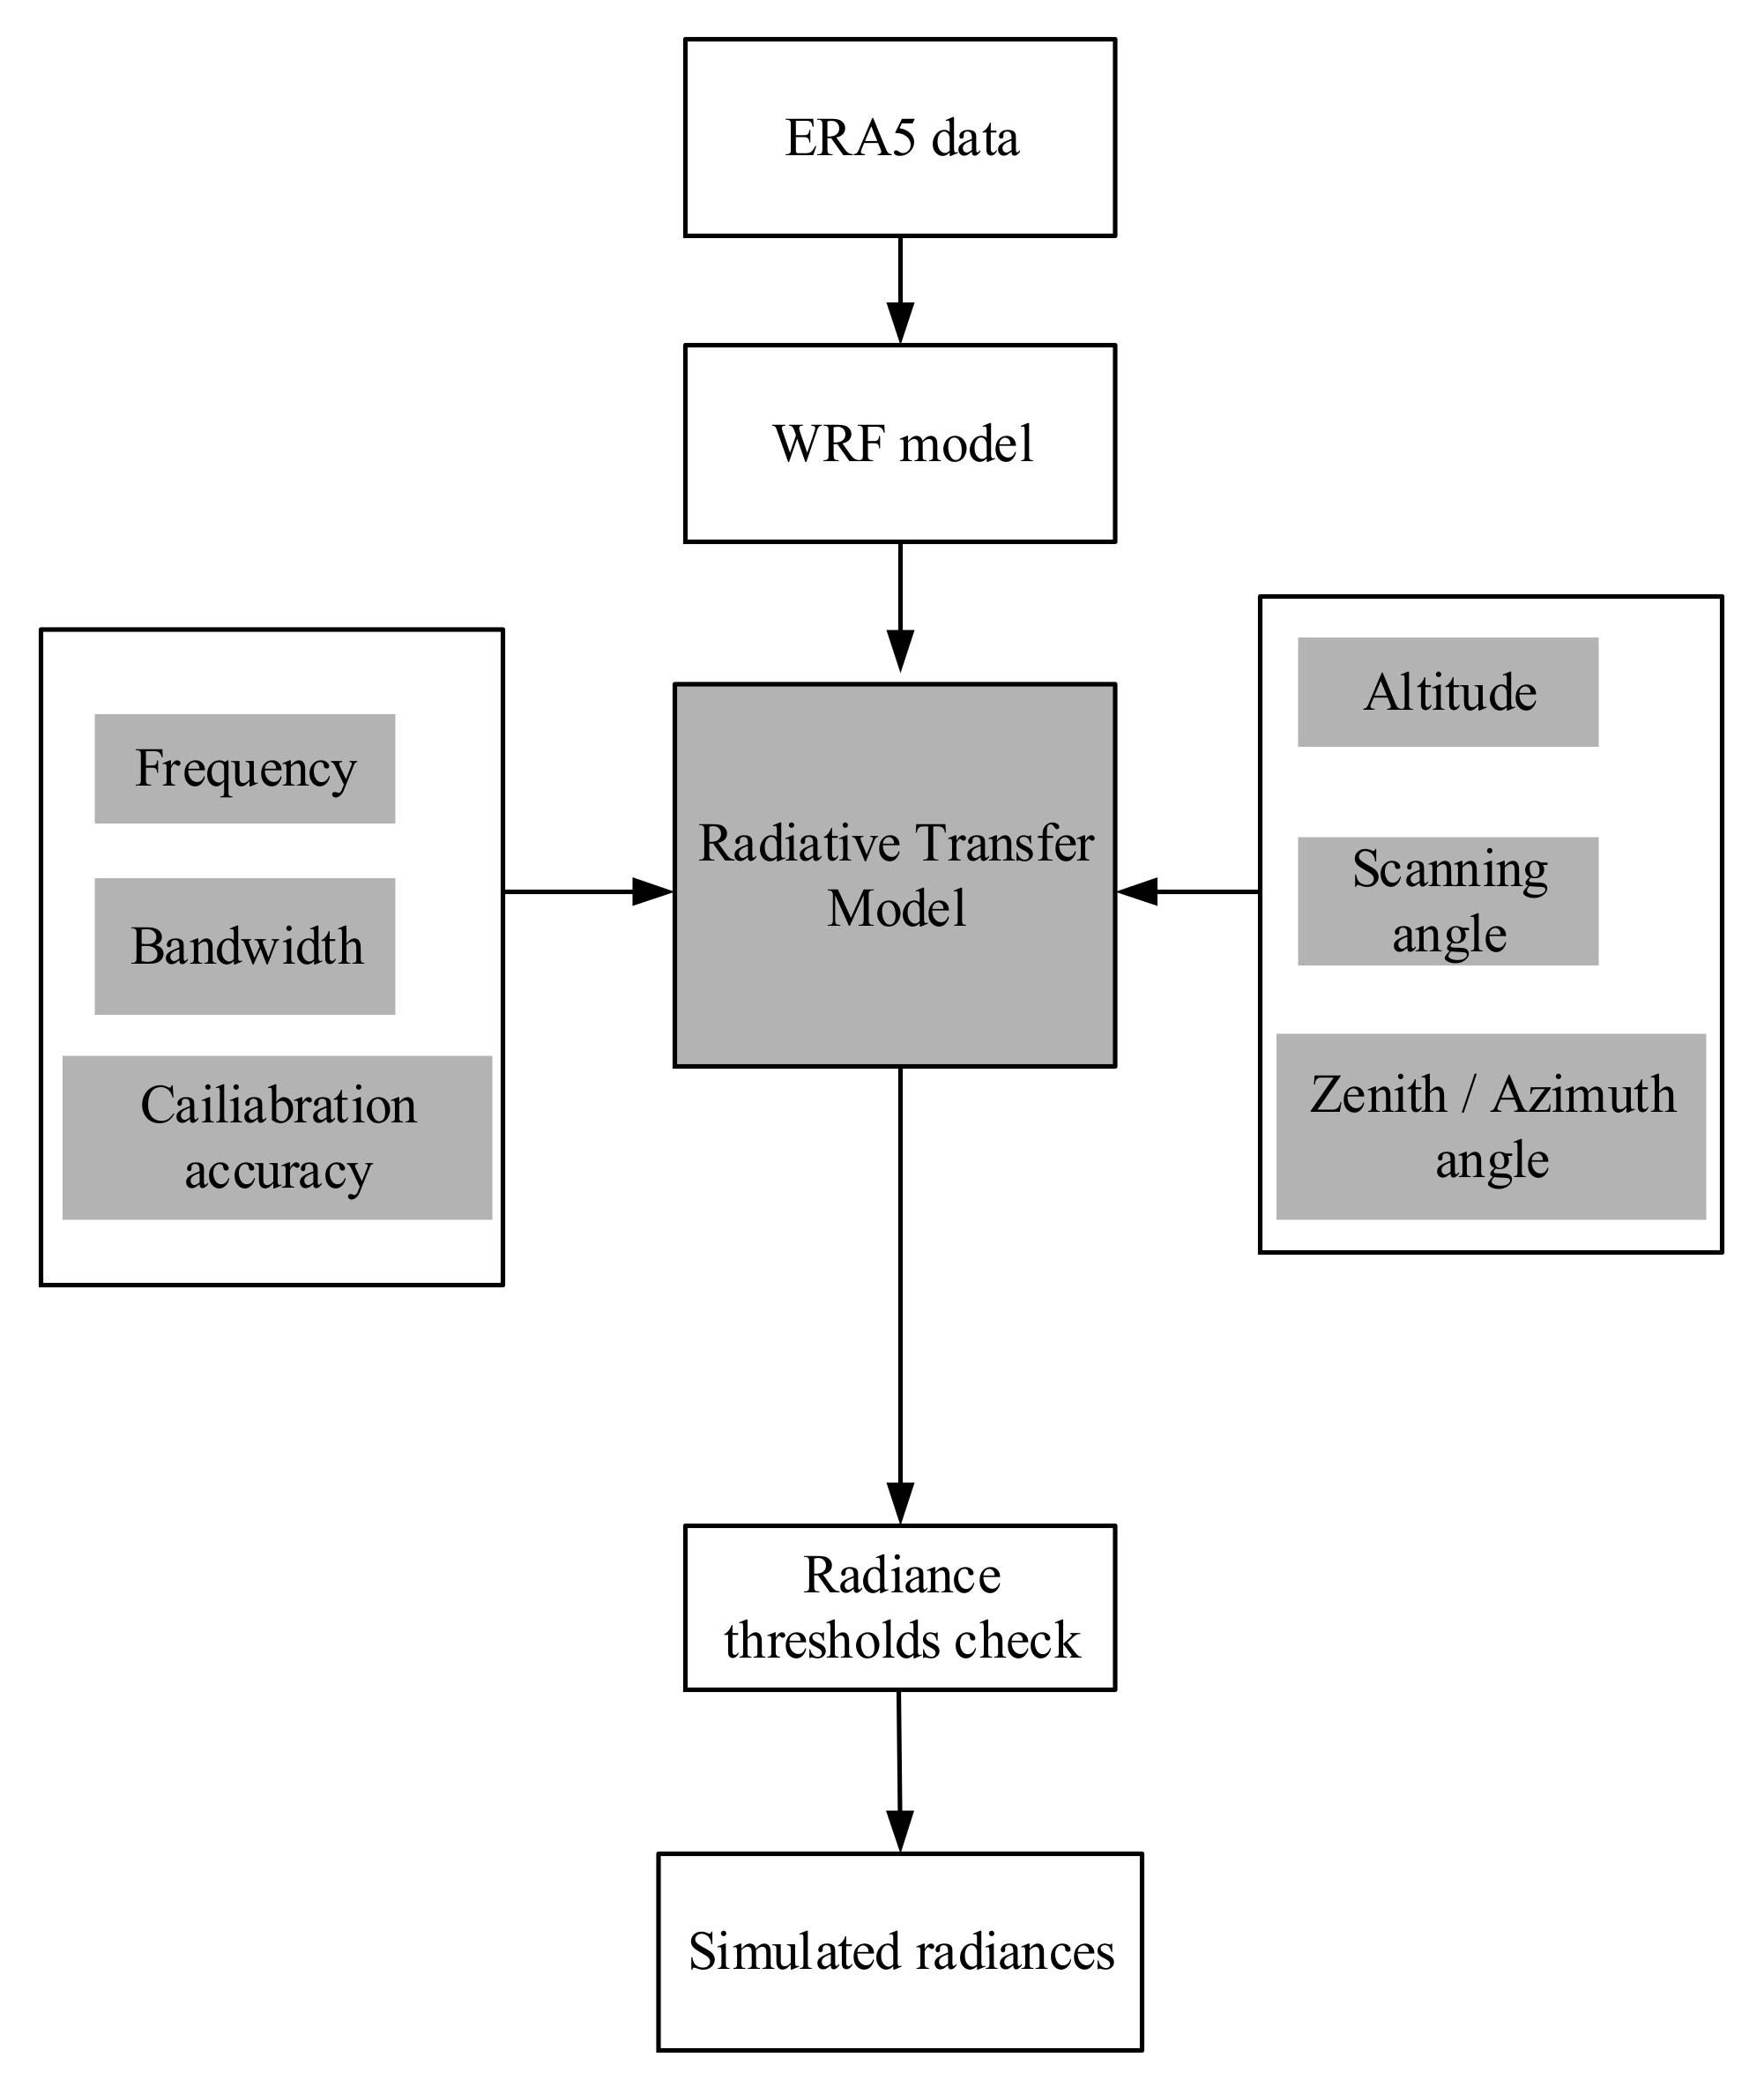
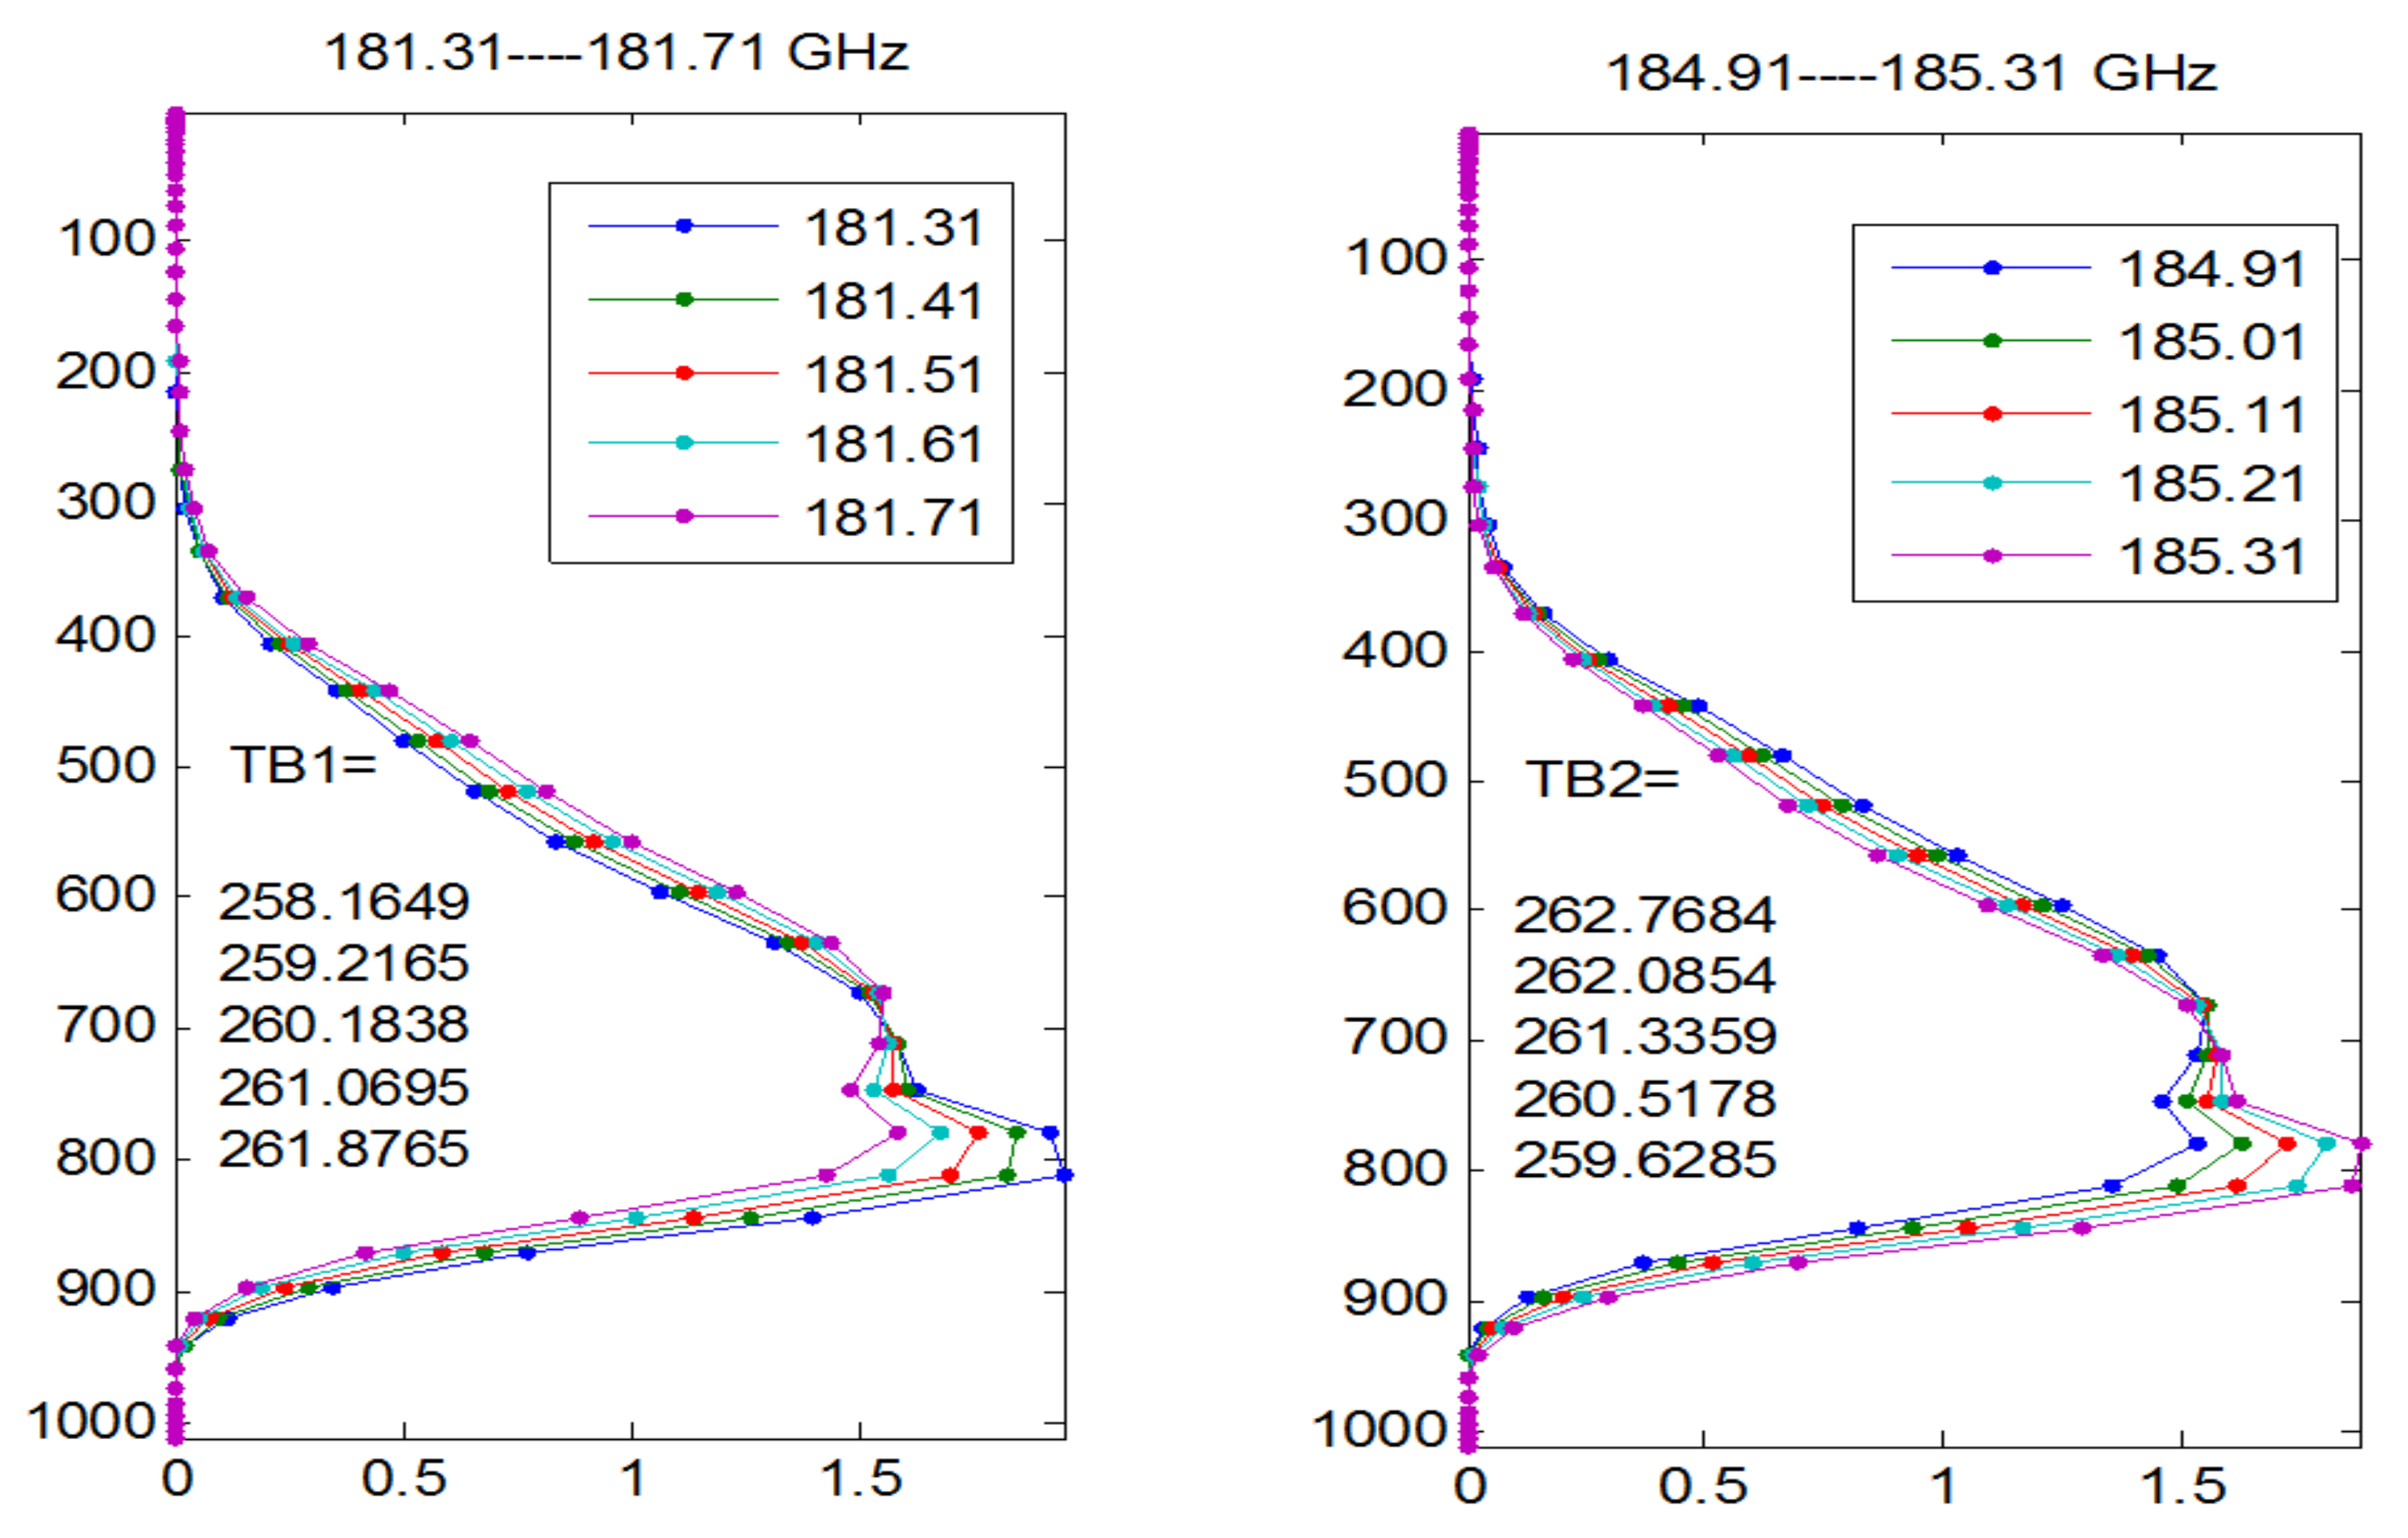
3.1. The GEOMS and Its Simulated Radiances

Microwave remote sensing uses microwave equipment such as microwave radiometer or microwave scatterometer to detect and receive the electromagnetic radiation and scattering characteristics of the measured object in the microwave band (wavelength from 1 mm to 1 m). Microwave remote sensing has the ability to work day and night in all weather and can partially penetrate clouds, which is not easily affected by meteorological conditions [59]. The geostationary microwave observations investigated in this study are synthetically generated by a simulated microwave sounder (GEOMS), which is under preparation to be put in geostationary orbit onboard the upcoming China Fengyun-4 geostationary satellite in the future. The details regarding the GEOMS characteristics (e.g., field of view and spectral resolution) are still under demonstration and designation and will be submitted in another paper. This paper mainly focuses on the potential impact of this kind of geostationary microwave radiances on typhoon prediction. The microwave-based sounder onboard geostationary satellite can detect the vertical distribution of temperature and humidity inside clouds as well as precipitation, constantly and frequently monitoring a fixed area and acquiring extremely high temporal resolution on wide-range Earth observation [60]. Thus, the GEOMS has the capability of continuously observing disastrous weather conditions such as tropical cyclones and heavy rainfall that happen suddenly and with a short duration in a microwave view. In this study, the 183 GHz water vapor absorption bands were chosen; the 183 GHz band sounds atmospheric humidity by the absorption/emission of microwave radiance, but is sensitive to cold clouds, as the wavelength is about the same size of the hydrometeors, which causes scattering and brightness temperature depression and consequently compromises humidity sounding under these conditions [13,61]. Thus, precipitating clouds and thick cold clouds need to be screened out. Two GEOMS configurations were selected, with a calibration accuracy of 0.3 K and 0.5 K, respectively, which were calculated using the calibration accuracy formula presented by He et al. [62]. The corresponding observation error standard deviation is less than 2 K for the 183 GHz water vapor band comparing the simulated observations with ERA-5 data.
The more realistic each of the OSSE components is, the more consistent the results will be with experiments using real observations [63]. Thus, the fifth generation of the ECMWF reanalysis (i.e., ERA-5) was used as a nature run or “true” atmospheric state in this study. The advantage of the reanalysis-based OSSE is a much easier verification process against real observations such as the ground-based rain-gauge data and typhoon best track obtained during actual weather events. The hourly ERA-5 data can be used to compute forecast skill scores, as well as to simulate the synthetic observations. The synthetic GEOMS radiances are simulated with a radiative transfer model that was applied to ERA-5 atmospheric columns processed by the WRF model.
In this study, in order to examine the performance of geostationary microwave radiances, a simulation system was set up, shown in Figure 2. The simulation system is composed of observation target modeling, observation process simulation of the sensor, and brightness temperature generation from the processed observation data. With adjustable parameters, such as orbit altitude, system frequency, bandwidth, scanning angle, and calibration accuracy, the system can simulate channel radiances with different configurations, thereby assessing geostationary microwave radiance performance under different conditions. Weighting function is used to validate the sounding characteristics for each channel, which shows the peak altitude for atmospheric sounding and indicates the relative contribution of each atmospheric layer to the observations. The distributions of weighting functions for the water vapor absorbing lines at 183 GHz are shown in Figure 3. The calculation of weighting functions is according to He et al. [64], who used the U.S. standard atmospheric profiles of temperature and moisture as input for the radiative transfer model. On a practical level, the hourly 0.25° ERA-5 global analysis data were first interpolated to 15 km using the WRF initializing program. The data in WRF I/O format was then used as input for the radiative transfer model using the atmospheric state parameters, including temperature and humidity profiles as well as hydrometeor content with a temporal resolution of 1 h, which was used by an advanced radiative transfer model named HI-URMT (the horizontally inhomogeneous unified microwave radiative transfer model) developed by CU-Boulder [65] to calculate brightness temperature detected by geostationary satellites at a water vapor absorption band, with atmospheric rain water, cloud water, cloud ice, and snow water considered in detail. Next, the simulation system can produce the synthetic radiance data with different resolution according to the user’s choice. Although this may be an approximate method due to the linear interpolation, it can be a practical choice because of the relatively large-scale typhoon weather system in this study.

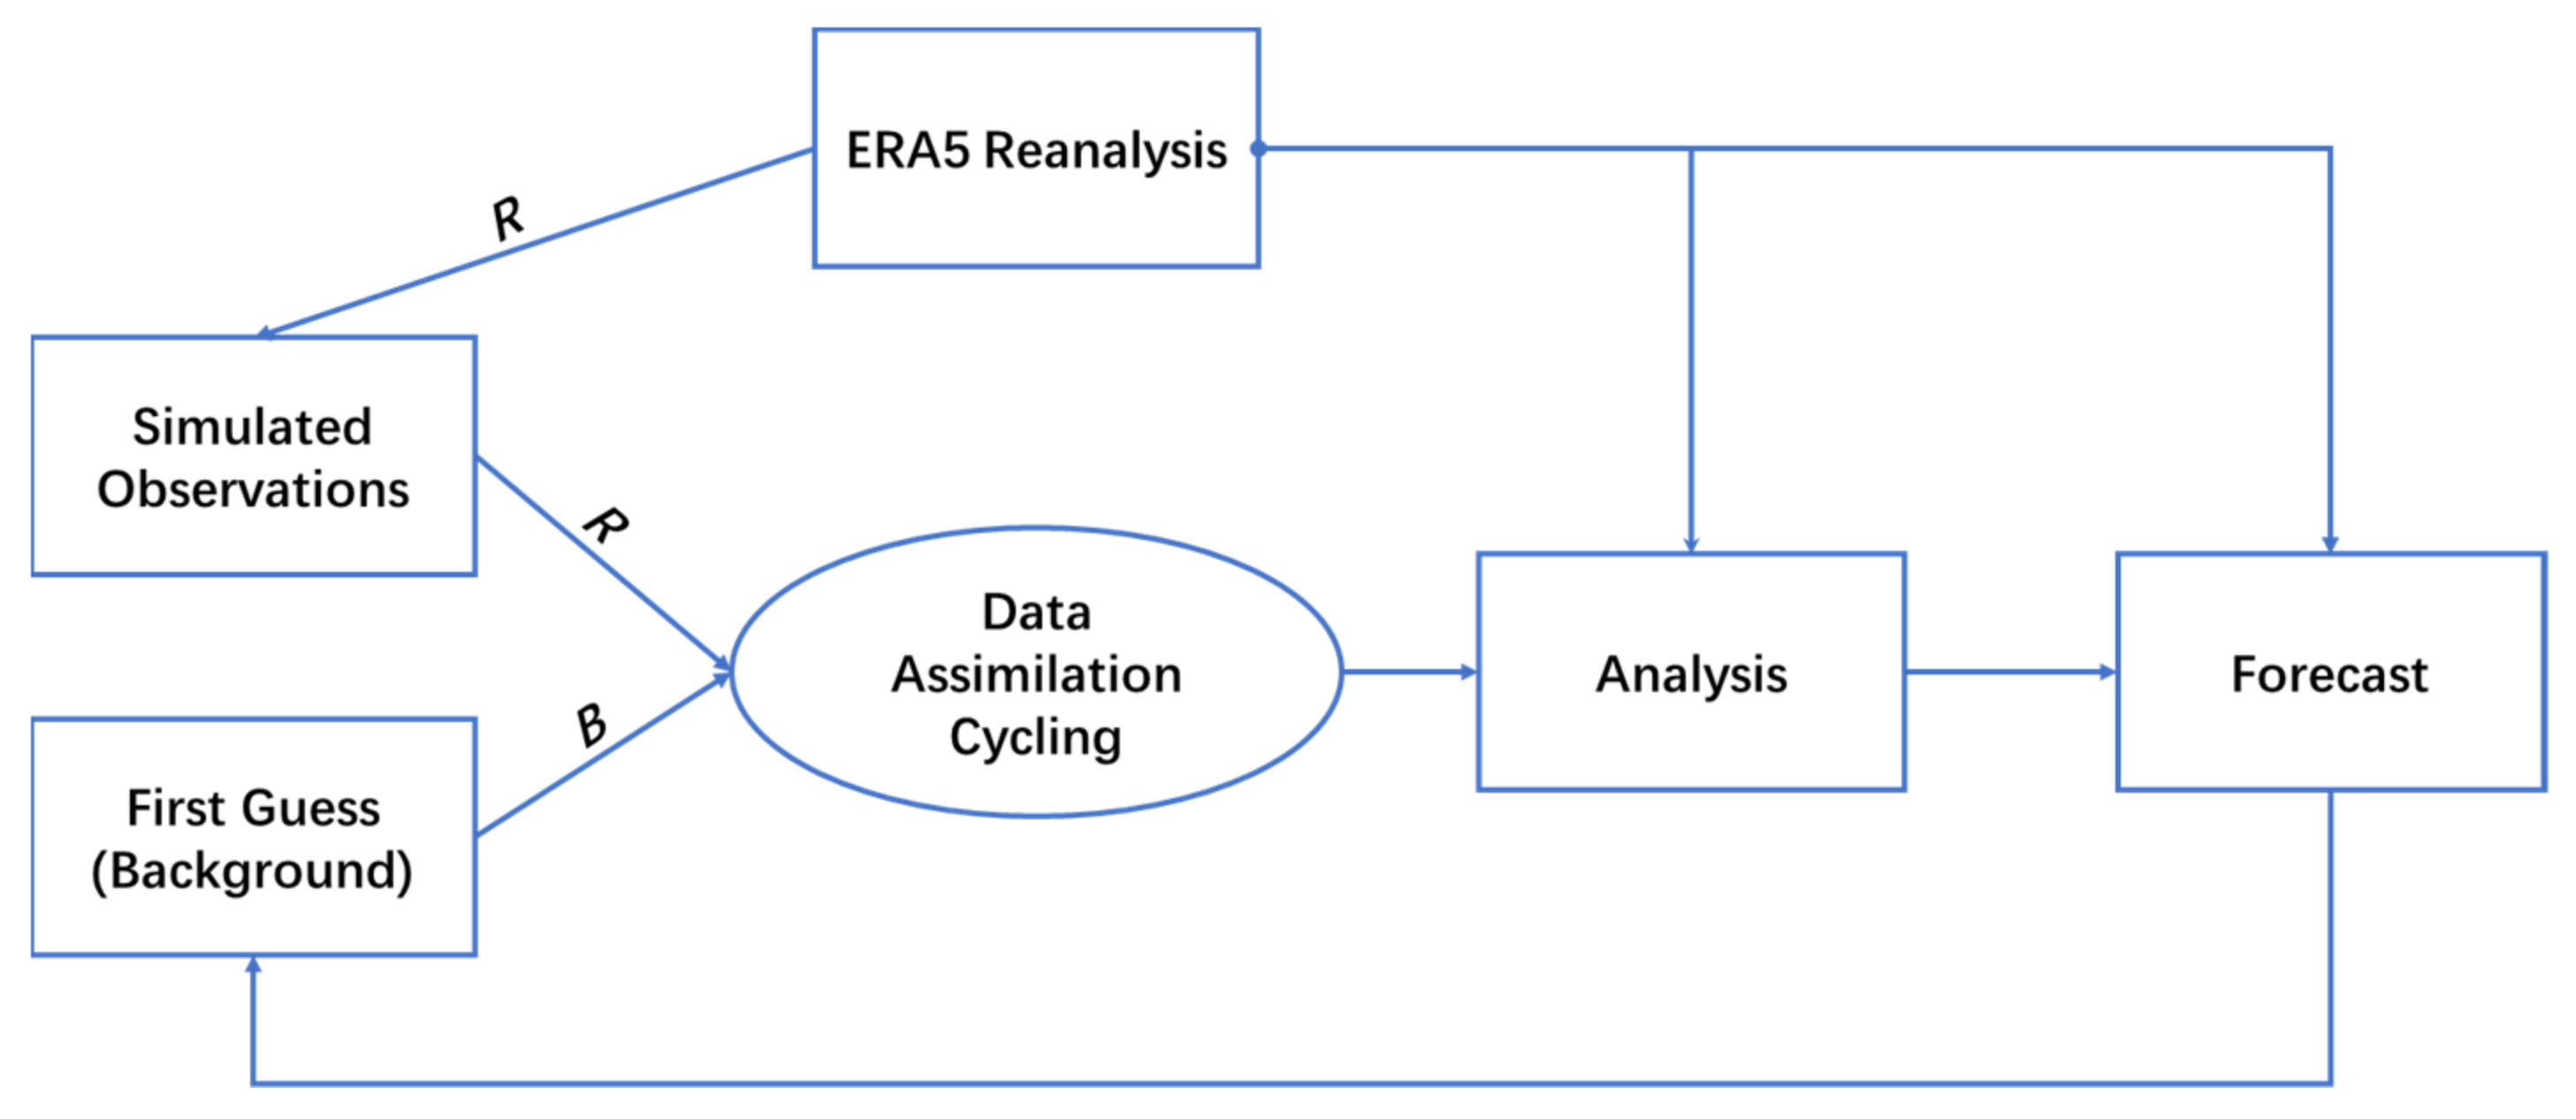
3.2. The Data Assimilation Methodology

The Weather Research and Forecasting model’s data assimilation (WRFDA) system was used in this study to assimilate the GEOMS radiances. The WRFDA was developed and maintained by the National Center for Atmospheric Research (NCAR). It has the capability of assimilating various observation data that include satellite radiance observations from sensors onboard different satellite platforms [66,67,68]. These data include 3DVar, 4DVar, and hybrid ensemble–variational (EnVar) data assimilation schemes for both operational and research applications [69]. In this study, we exploited the capability of assimilating GEOMS radiances in WRFDA. The hybrid EnVar was employed because it can efficiently introduce the flow-dependent background error information and thus produce an improved analysis for the atmospheric state through the iterative minimization of a prescribed cost function. The data assimilation problem is solved by minimizing the cost function in the EnVar method [70]:
J ( δ x 1 , α ) = 1 β 1 2 δ x 1 T B 1 δ x 1 + 1 1 β 1 2 α T A 1 α + 1 2 ( d H δ x ) T R 1 ( d H δ x )
where δ x 1 represents the analysis increments corresponding to the static background error covariance B, calculated using the National Meteorological Center (NMC) method [71]. The second term corresponds to the flow-dependent error covariance. α represents the augmented control variables. A denotes the spatial covariance localization of α . d = y o H x b represents the background departure. The analysis increment of the hybrid EnVar is a sum of two terms, which is defined as δ x = δ x 1 + n = 1 N α n x n , b e , where the second term represents the analysis increments corresponding to the flow-dependent ensemble error covariance. The symbol is an element-wise multiplication or Schur product. N represents the size of ensemble members. x n , b e is the nth ensemble member perturbation normalized by N 1 : x n , b e = ( x n , b x b ¯ ) / N 1 , where x b ¯ represents the ensemble mean, and x n , b the nth ensemble member. The WRFDA system also includes an ensemble transform Kalman filter (ETKF) scheme, employed to produce ensemble error covariances for the EnVar scheme [70]. The equation is as follows: x = x e Π C ( Γ + I ) 1 / 2 C T , where C and Γ represent the eigenvector and the eigenvalue of ( H x e ) T R 1 H x e , respectively. I is the identity matrix. Π = c 1 c 2 c i is the inflation factors, c i satisfies the equation d ˜ i T d ˜ i = T r ( R 1 H c i P i e H T + I ) , where d ˜ i = R 1 / 2 y i H x ¯ i , b is the departure normalized by the observation error covariance R. Since the current WRF data assimilation system assumes no observation error correlation, the off-diagonal term of the observation error covariance R is assumed to be 0 for the simplicity and computational efficiency in this study. P i e represents the flow-dependent ensemble covariance, and Tr denotes the trace of a matrix.

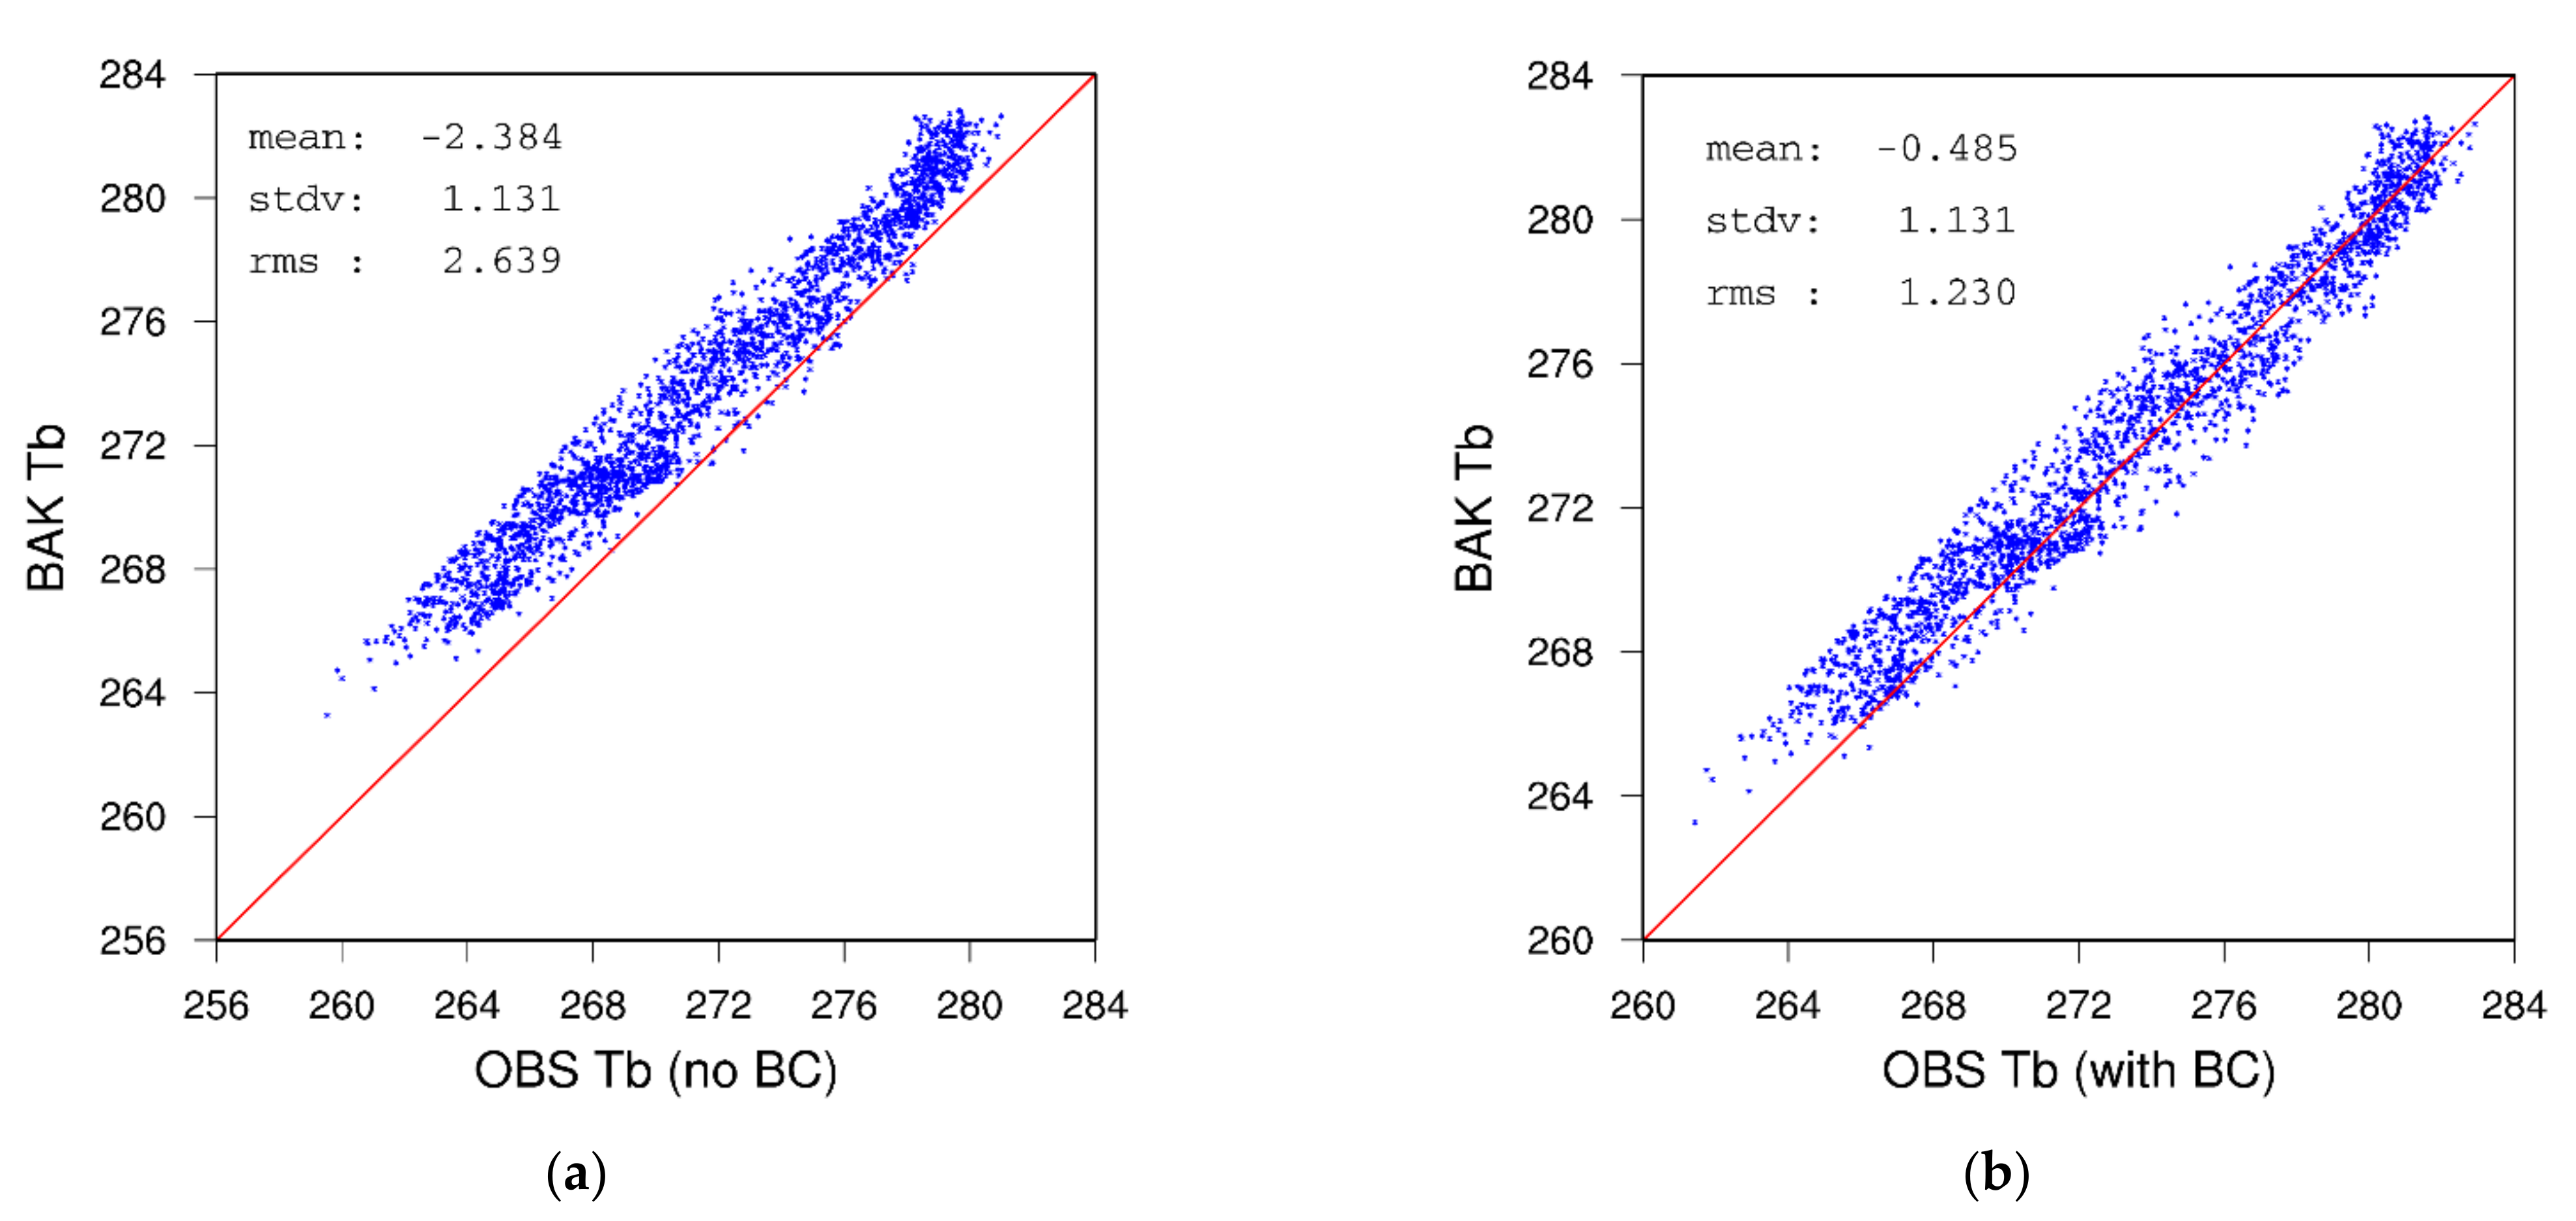
3.3. Variational Bias Correction

Radiance observations with systematic bias are usually bias-corrected before assimilation to meet the variational assumption that no bias exists in either the backgrounds or the observations [72,73]. The bias of radiance observations can be expressed as a linear combination of several predictors leading to the modified forward operator
H ˜ x , β = H x + β 0 + i = 1 N p β i p i
where x represents the model state vector, H represents the fast radiative transfer model, β0 represents a constant part of the total radiance bias, and pi and βi represent the ith predictor and the associated bias correction coefficients, respectively, which are both assumed to be channel-dependent. The bias correction can be estimated offline [74]. After including the predictors’ coefficients in the state vector, they can be also updated adaptively within the variational minimization iteration [75], which is called the variational bias correction (VarBC). The VarBC scheme employed in this study includes seven predictors: the 50–200 hPa and 300–1000 hPa layer thicknesses, the total column water vapor, the surface skin temperature, the scan position, and its square and cube. For brightness temperature from polar-orbiting satellites, the pixel index in the field of view can be used as the scan position. For radiance observations from geostationary satellites, the satellite zenith angle or their multiplicative inverse of the pixel can be used as the scan position. In this study, the satellite zenith angle was used as the scan position because we found that the satellite zenith angle and their multiplicative inverse of the pixel perform similar. The cost function J with radiance VarBC to be minimized associated with the model state and bias parameters becomes
J x , β = 1 2 x x b T B 1 x x b + 1 2 β β b T B β β β b + 1 2 y H ˜ x , β T R 1 y H ˜ x , β
where βb and Bβ represent the background bias correction coefficients and the corresponding error covariance, respectively. The bias correction coefficients are updated adaptively in the minimization iteration using the coefficients from previous cycling analysis as the background for each analysis.
In this study, we employ an “offline” mode approach [38] to run WRFDA’s VarBC, in which the hourly ERA-5 data are used as the backgrounds during the 10-day period before the typhoon. The scatter plots of model-calculated GEOMS brightness temperatures versus the radiance observations valid at 0000 UTC 06 August 2019 are shown in Figure 4. It can be seen that, after bias correction, the mean bias of the GEOMS radiances is clearly reduced (by about 80%) in comparison with the bias without correction. In addition, the root mean squared error (RMSE) is also obviously reduced by the bias correction. Furthermore, after assimilating the GEOMS radiance observations, the analysis results have much closer agreements with the observed radiances than the background does; both the RMSE and standard deviation (STDV) are reduced by about 25% and 30%, respectively (Figure 4c), indicating that the variational bias correction applied in this study is effective for directly assimilating the GEOMS radiances.

3.4. Quality Control

To reduce the random error and systematic bias usually existing in radiances, which arise from errors in the sensor and model, quality control is important for directly assimilating satellite radiance data. In this study, quality control procedures were applied to the GEOMS radiances as the following:
(1)
Surface type check. This check removes pixels with mixed surface types (for example, mixed predominately sea, mixed predominately sea ice, mixed predominately land, and mixed predominately snow) to reduce the impact of radiances with large error caused by inaccurate calculation of the surface emissivity on these pixels.
(2)
Gross check. This check removes radiances with brightness temperatures higher than 330 K or lower than 50 K.
(3)
Relative departure check. This check removes radiances if the departure exceeds three times the observation error.
(4)
Absolute departure check. This check removes radiances if the departure exceeds 3 K.
(5)
Cloud liquid water path (CLWP) check. This check removes radiances with CLWP ≥0.2 kg/m2 calculated from background.
Figure 5a shows the simulated radiance data of the 183 GHz channel after quality control procedures at 0000 UTC 6 August 2019. The differences between backgrounds and the observation fields (Figure 5b) and those between analyses and observation fields (Figure 5c) at the simulated GEOMS observed points that passed the above quality control steps are also presented as examples. The departures between the backgrounds and observations reach as large as about ±2 K. The departures between analyses and observations are significantly reduced compared to the former, especially near around the Typhoon Lekima area. Moreover, there are blank spaces around the typhoon center where the clouds are probably the thickest. The radiance observation error, the model error, and the radiative transfer error may be large in these areas, which can decrease the analysis results. Thus, the observations here, which have large error and relatively poor agreements with the model, were rejected by the data assimilation system through the built-in quality control procedures introduced in this part. However, the hybrid EnVar data assimilation method used in this study has the ability to build the flow-dependent spatial correlation between the typhoon center area and the environment area through the ensemble error covariance. A symmetrical observation error model for the geostationary microwave radiances can be developed in the future to better utilize the all-sky radiances, even in the area where the clouds are the thickest.

4. Experimental Setup

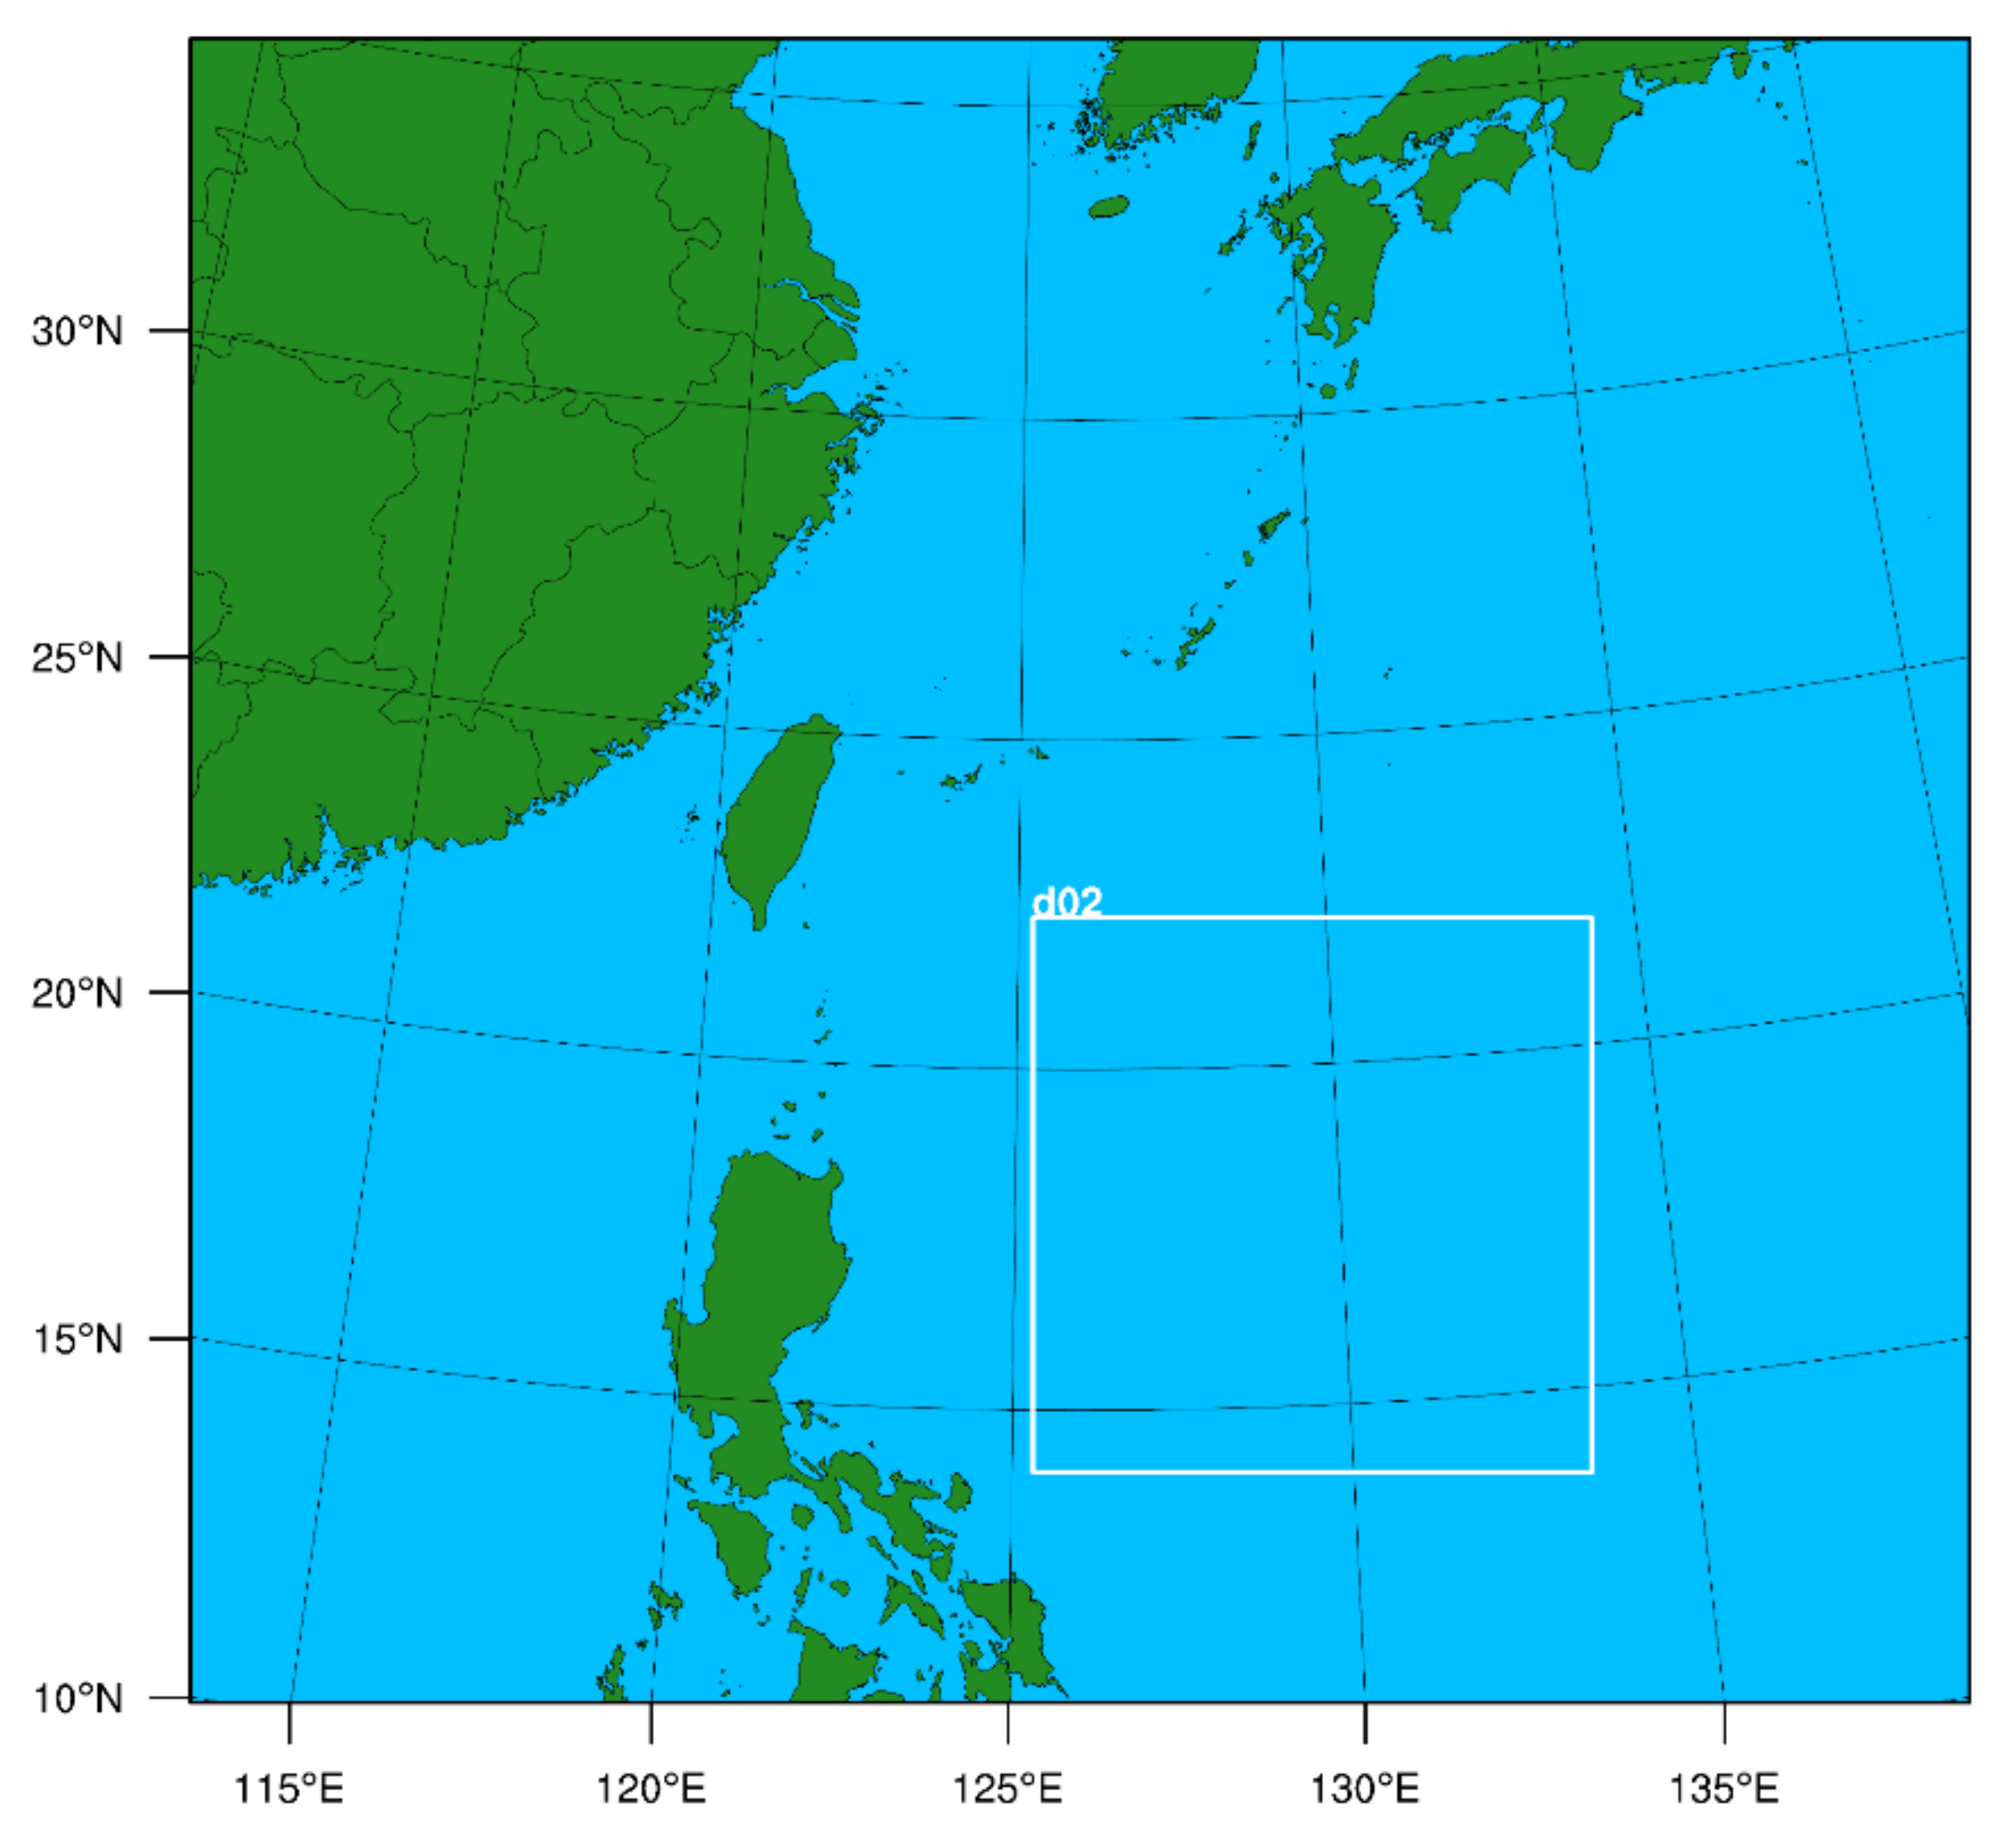
4.1. The Regional Model Configurations

The Advanced Research WRF model (WRF-ARW, hereafter WRF) version 4.1 [76] was employed in this study to generate the numerical weather forecasts over a computational domain spanning the western north Pacific and southeast coastal region in China (Figure 6). Moving-nested run was configured with a parent domain with 15 km horizontal grid spacing, with 208 × 196 model grid points and an inner two-way nesting domain of 5 km with 241 × 241 grid points. The domain was configured with a 10 hPa model top and 41 vertical levels. The time step was 90 s and 20 s for the outer and inner domains, respectively. The physical parameterizations were employed as follows (also summarized by Table 1): the WRF Single-Moment 6-class (WSM6) microphysics scheme [77], the Tiedtke cumulus scheme [78], the Rapid Radiative Transfer Model (RRTMG) longwave and shortwave radiation scheme [79], the Yonsei University (YSU) planetary boundary layer scheme [80], the revised MM5 surface layer scheme [81], and the unified Noah land surface model scheme [82]. In addition, cumulus parameterization was turned off for the 5 km setting in the inner domain.

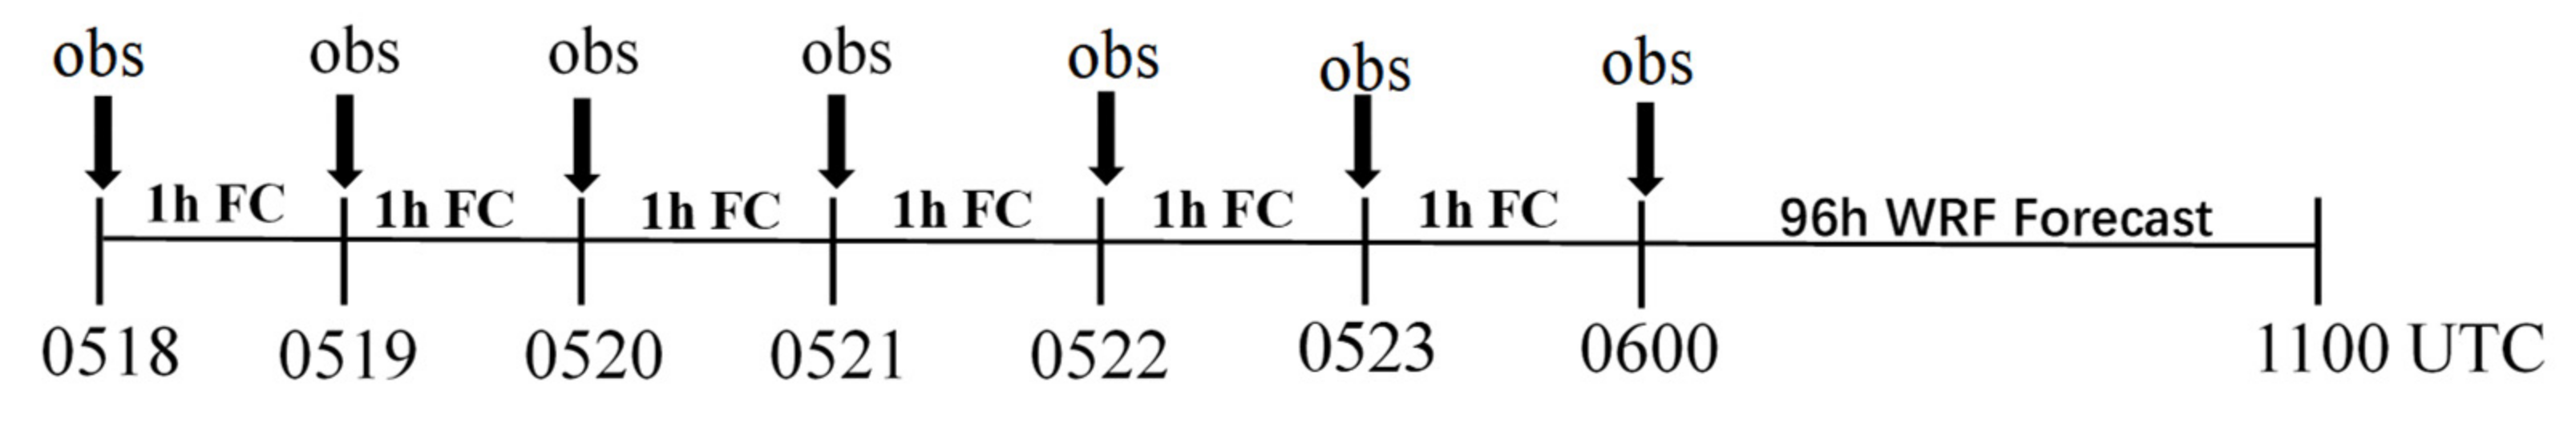
4.2. Data Assimilation Configurations and Experimental Design

In this study, the capability of assimilating GEOMS radiance observations was exploited in the WRFDA system to investigate its potential value on NWP of the super typhoon Lekima (Figure 7). Five parallel experiments were conducted, denoted as no DA (NDA), single time DA (SDA), hourly continuous DA (CDA)-1, CDA-2, and CDA-3, respectively, which are summarized in Table 2. NDA assimilated no GEOMS radiance data, which directly predicts using the initial and lateral boundary conditions provided by the interpolated National Centers for Environmental Prediction (NCEP) operational Global Forecast System (GFS) analysis, serving as a benchmark forecast in comparison with other GEOMS data assimilation experiments. SDA assimilated GEOMS radiances only once at the end of a six-hour time window. CDA-1 continuously assimilated radiances at hourly time intervals within the six-hour time period, with the GEOMS radiance resolution and calibration accuracy set to 30 km and 0.5 K, respectively. CDA-2 continuously assimilated radiances at hourly time intervals within the six-hour time period, with the GEOMS radiance resolution and calibration accuracy set to 15 km and 0.5 K, respectively. Finally, CDA-3 continuously assimilated radiances at hourly time intervals within the six-hour time period, with the GEOMS radiance resolution and calibration accuracy set to 15 km and 0.3 K, respectively. The GEOMS radiances assimilated in all experiments were thinned to reduce the impact of potential correlations [83,84]. Note that, in this study, GEOMS radiances were assimilated only in the outer domain.
This study attempted to rapidly assimilate geostationary microwave radiances using the WRF model for the typhoon case. The microwave radiances from polar-orbit satellite provide the observations only twice a day, which may not meet this study’s requirement for rapidly updated cycling data assimilation. Thus, we designed the SDA experiment, which assimilated radiances every 6 h as an assimilation baseline to better show the impact of the hourly cycling assimilation of GEOMS radiances (i.e., 1 h vs. 6 h). In addition, the GEOMS radiance resolution was limited by the antenna size because geostationary orbit altitudes are much larger than polar orbit altitudes, and a better calibration accuracy may lead to a better result but may increase the technological complexity for the satellite sensor, so CDA-2 and CDA-3 were additionally designed to show the influence of the candidate configurations on GEOMS radiance resolution and calibration accuracy.
A total of 25 partially cycling assimilating and forecasting runs were driven from 0000 UTC 05 August 2019 to 0000 UTC 11 August 2019 at a 6 h interval (Figure 8) for the hourly cycling data assimilation experiments. Each partially cycling run began with the first analysis at four synoptic times (0000, 0600, 1200, and 1800 UTC), which used NCEP GFS analysis as the background. The forecast initialized from the previous cycle’s analysis was then used as the background to finish an hourly analysis update. The cycling runs ended at the synoptic times, and the subsequent 96 h forecasts were then initialized. To remove the potential initial imbalance in the model after data assimilation, a digital filter initialization step using the Dolph filter was applied in the cycling runs [85]. The GFS analyses were interpolated to provide lateral boundary conditions for the numerical forecasts. The background error covariances in all experiments were provided by a combination of NMC and ETKF methods. The control variables for the static part of background error covariance include unbalanced velocity potential, stream-function, unbalanced surface pressure, unbalanced temperature, and pseudo relative humidity. For the first analysis, the 40 ETKF initial ensemble members were 6 h WRF forecasts initialized from the “random_CV” perturbations [86] to develop flow-dependent structures of the background error covariances. The first analyses occurred at 0000 UTC 5 August 2019 and used the previous 6 h forecasts as a background. The data assimilation cycle for each experiment continued until 0000 UTC 11 August 2019 (Figure 8).

5. Results

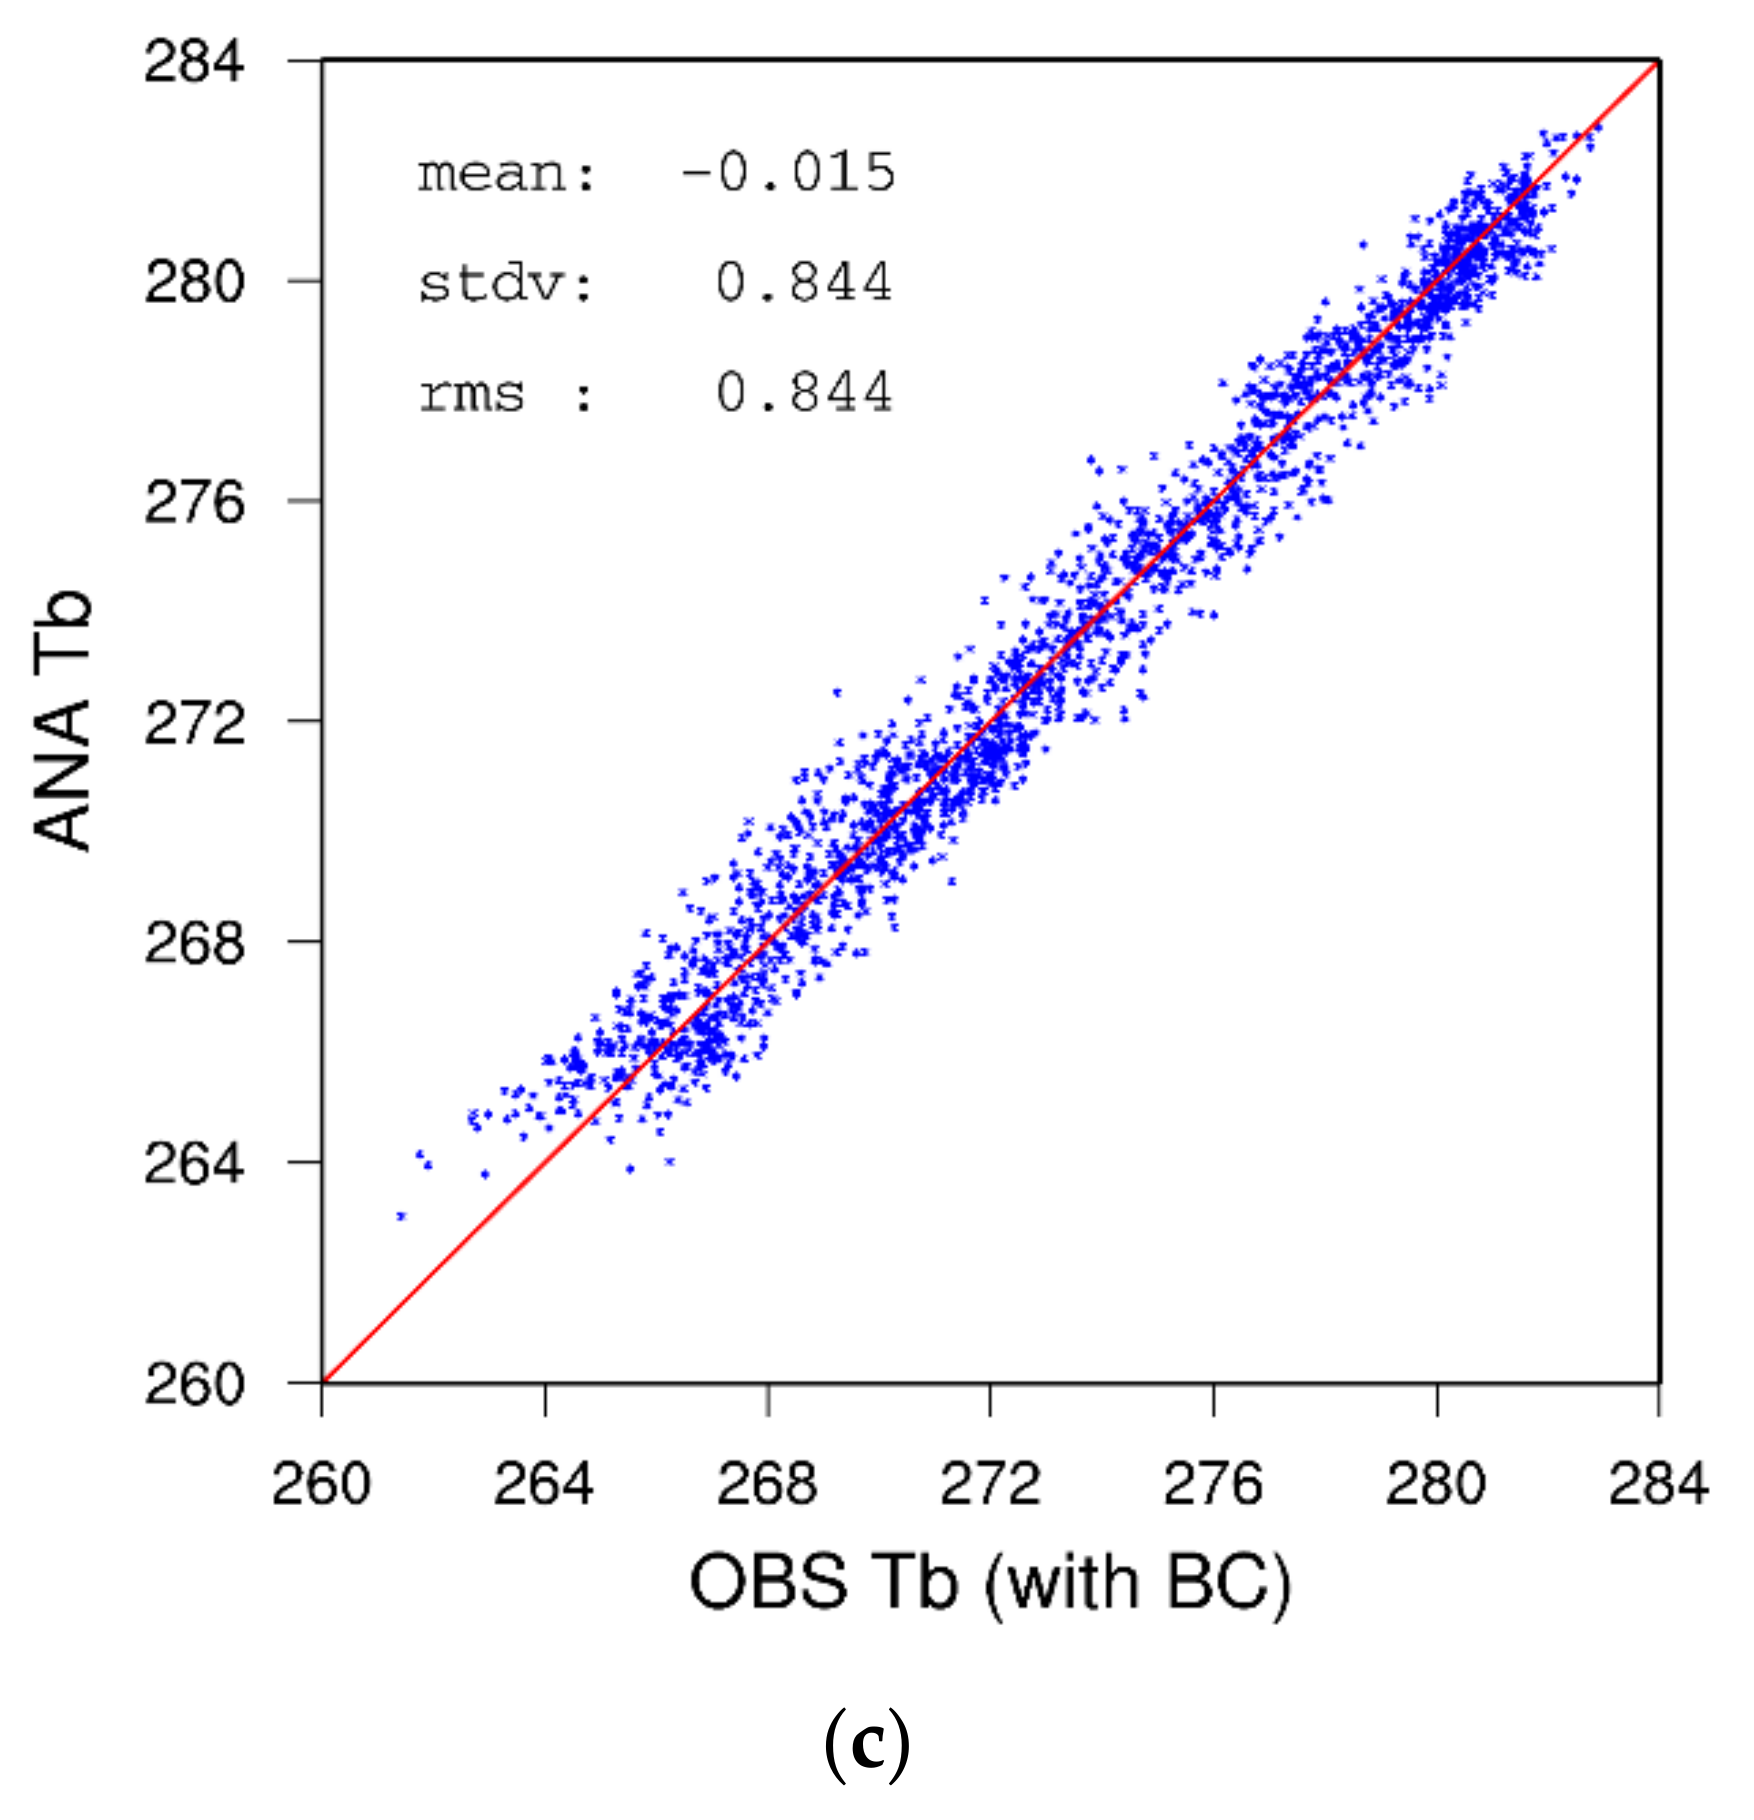
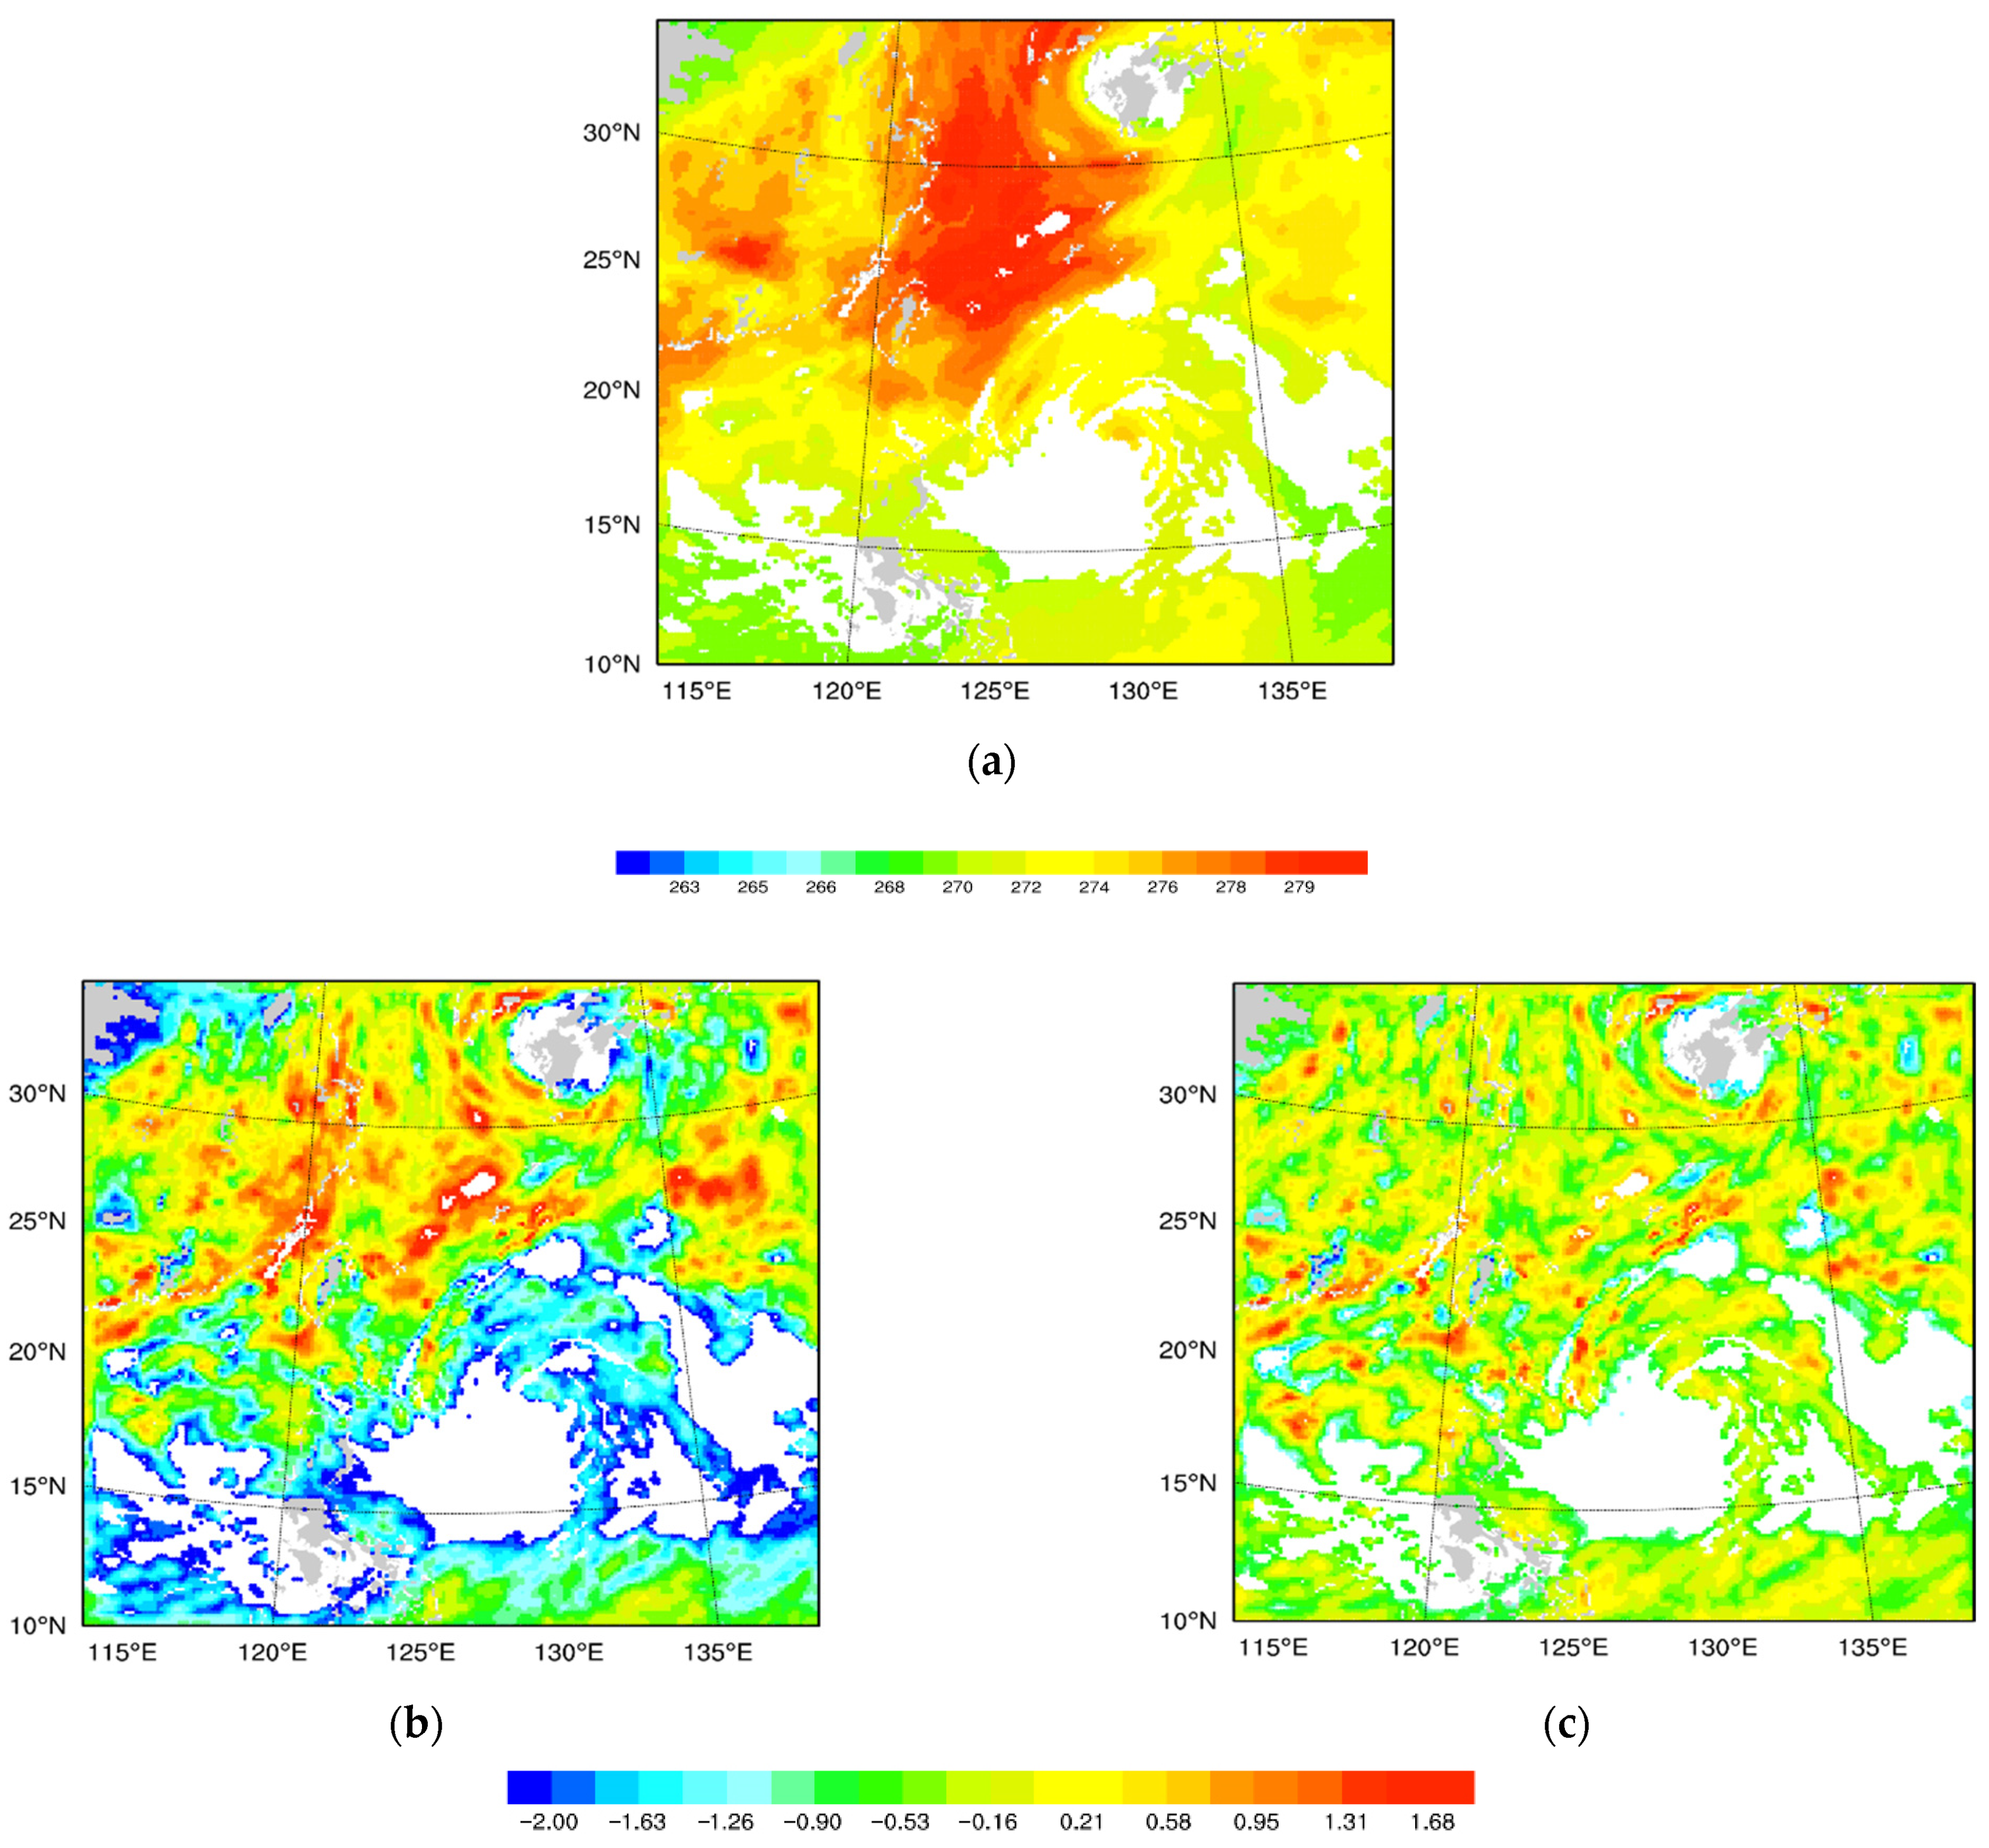
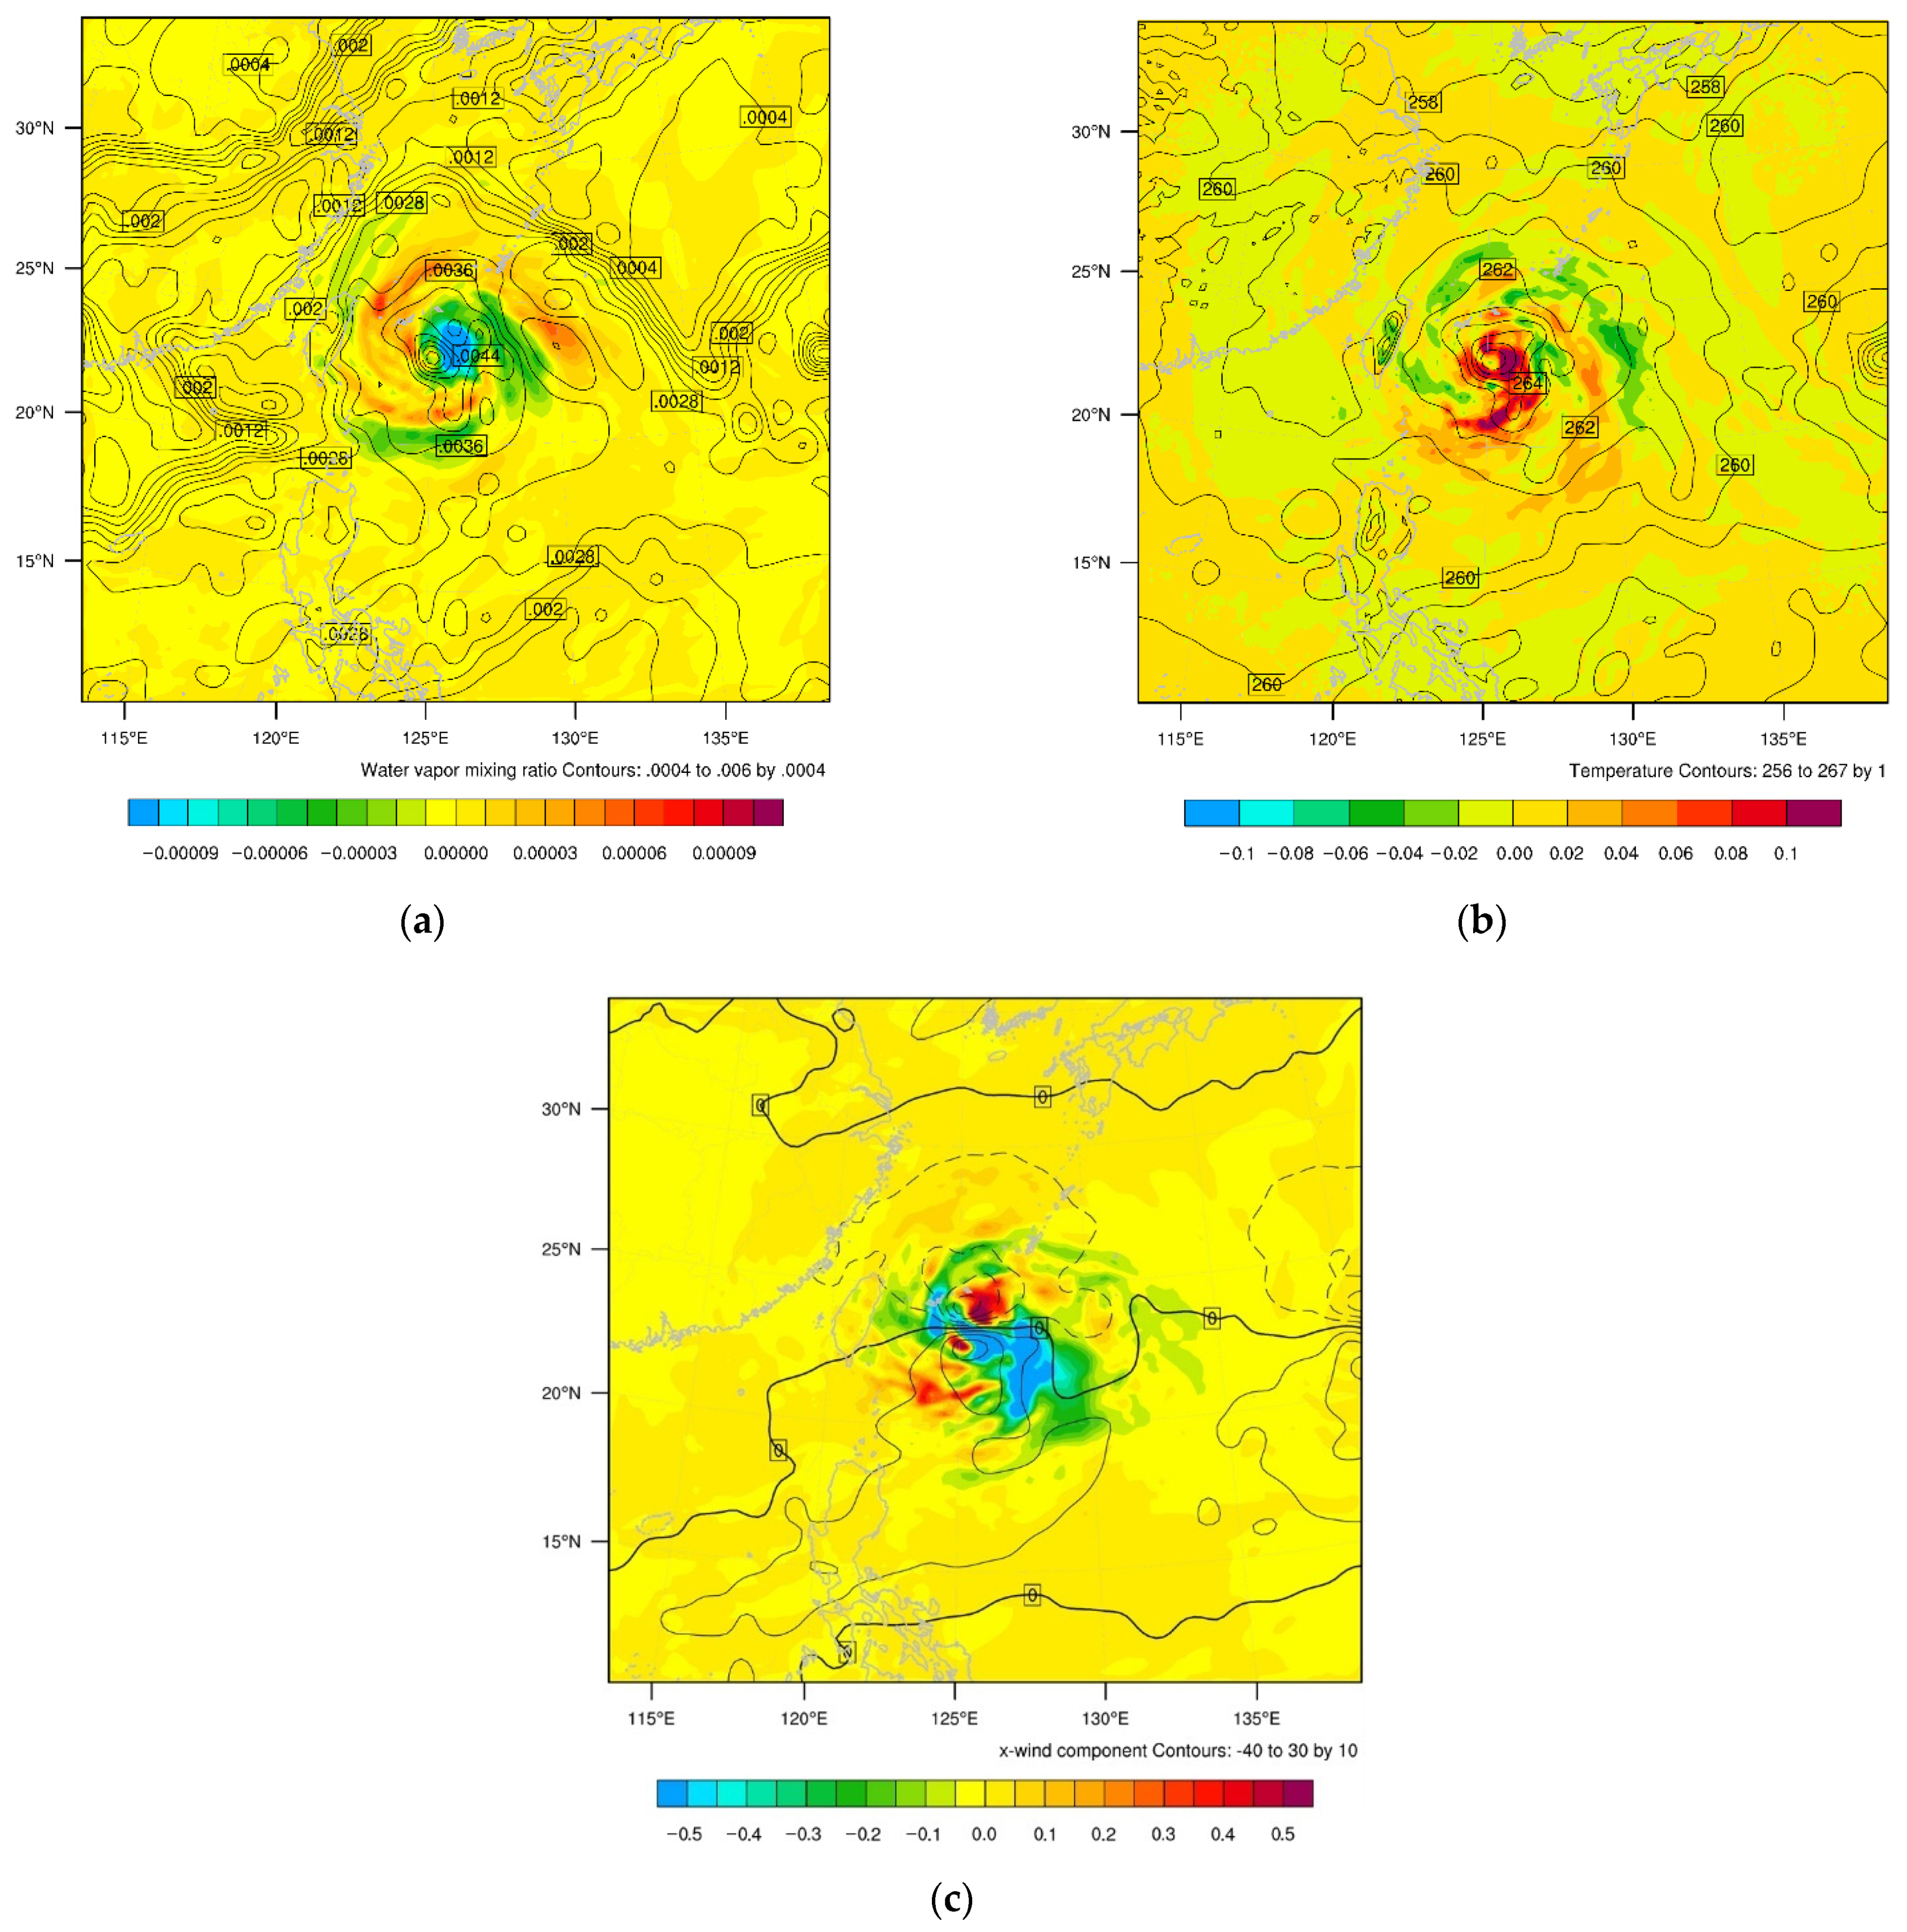
5.1. Single GEOMS Radiance Test

To check the correctness of the GEOMS water vapor radiance assimilation implementation and its influence on the model variables, we first performed a single GEOMS radiance test. A pseudo GEOMS brightness temperature observation was assumed to be located at the position of the typhoon center (23°N, 126°E) at 0600 UTC 8 August 2019. The observation innovation (i.e., observation minus background) was assumed to be 1 K, and the observation error was assumed to be 1 K. The analysis increment fields of humidity, temperature, and the x-component of wind variables at 500 hPa are shown in Figure 9. The increments present an anisotropic distribution corresponding to the typhoon structure due to the flow-dependent background error covariance within the hybrid EnVar data assimilation method. Assimilation of GEOMS radiances has a direct impact on the temperature and humidity fields, and an indirect impact on the wind field. Note that statistical multivariate correlation (mass–wind balance) implied in the background error covariance enables the creation of wind increments, even though radiances are not sensitive to the wind field. The single observation test shows that the typhoon structure in terms of humidity, temperature, and wind can be flow-dependently adjusted by the GEOMS humidity radiance through the spatial and multivariate correlations in the hybrid EnVar data assimilation method.

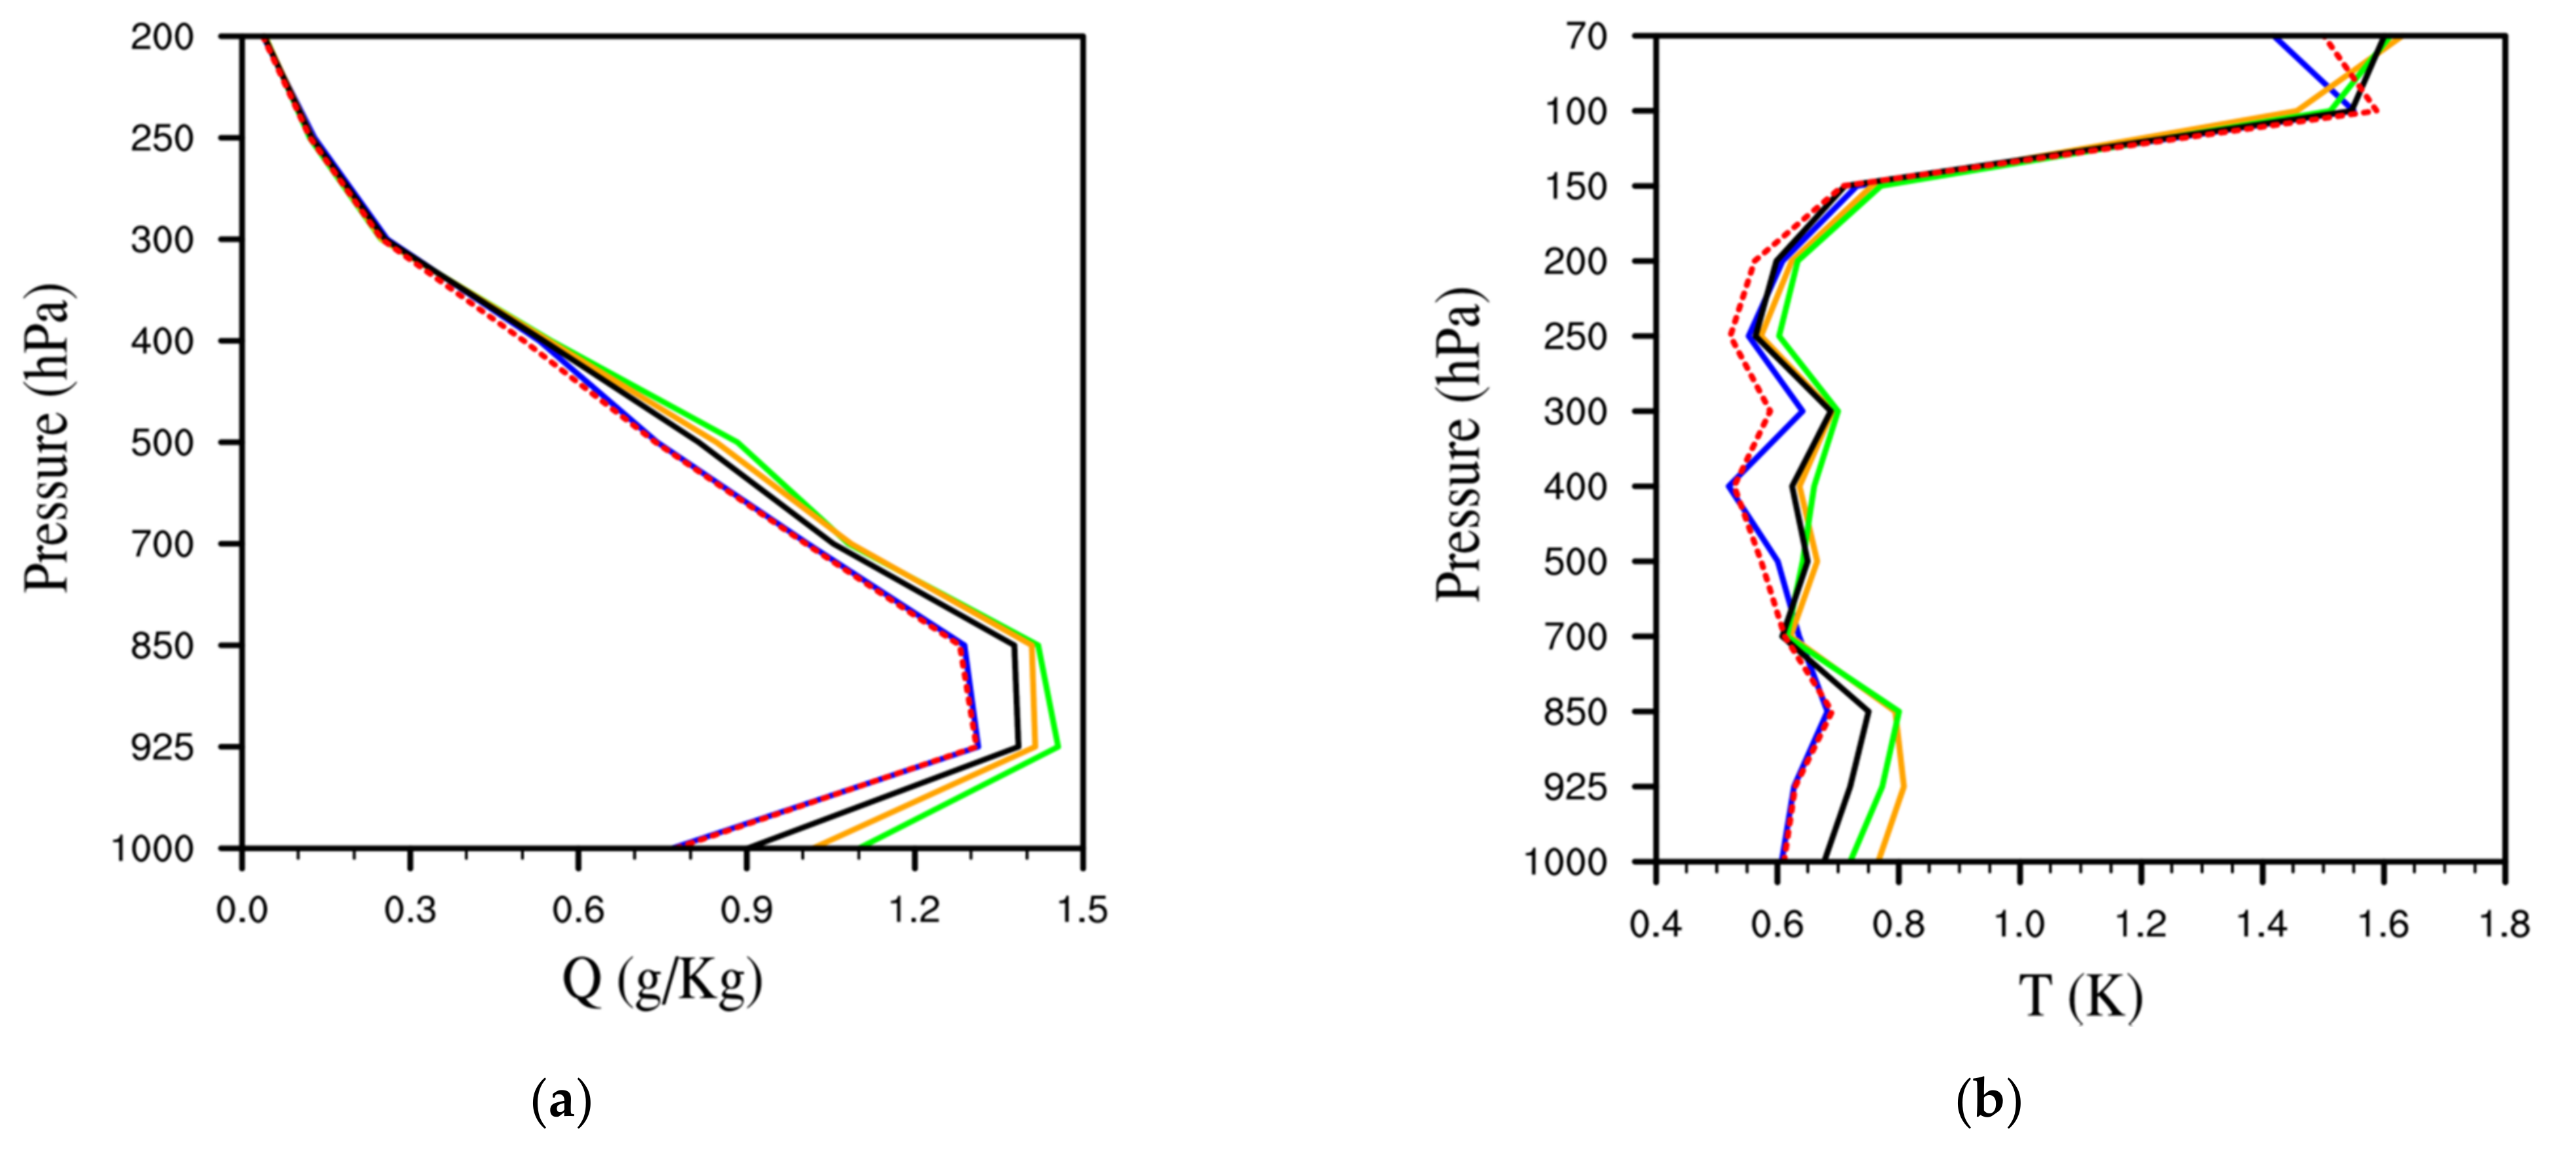
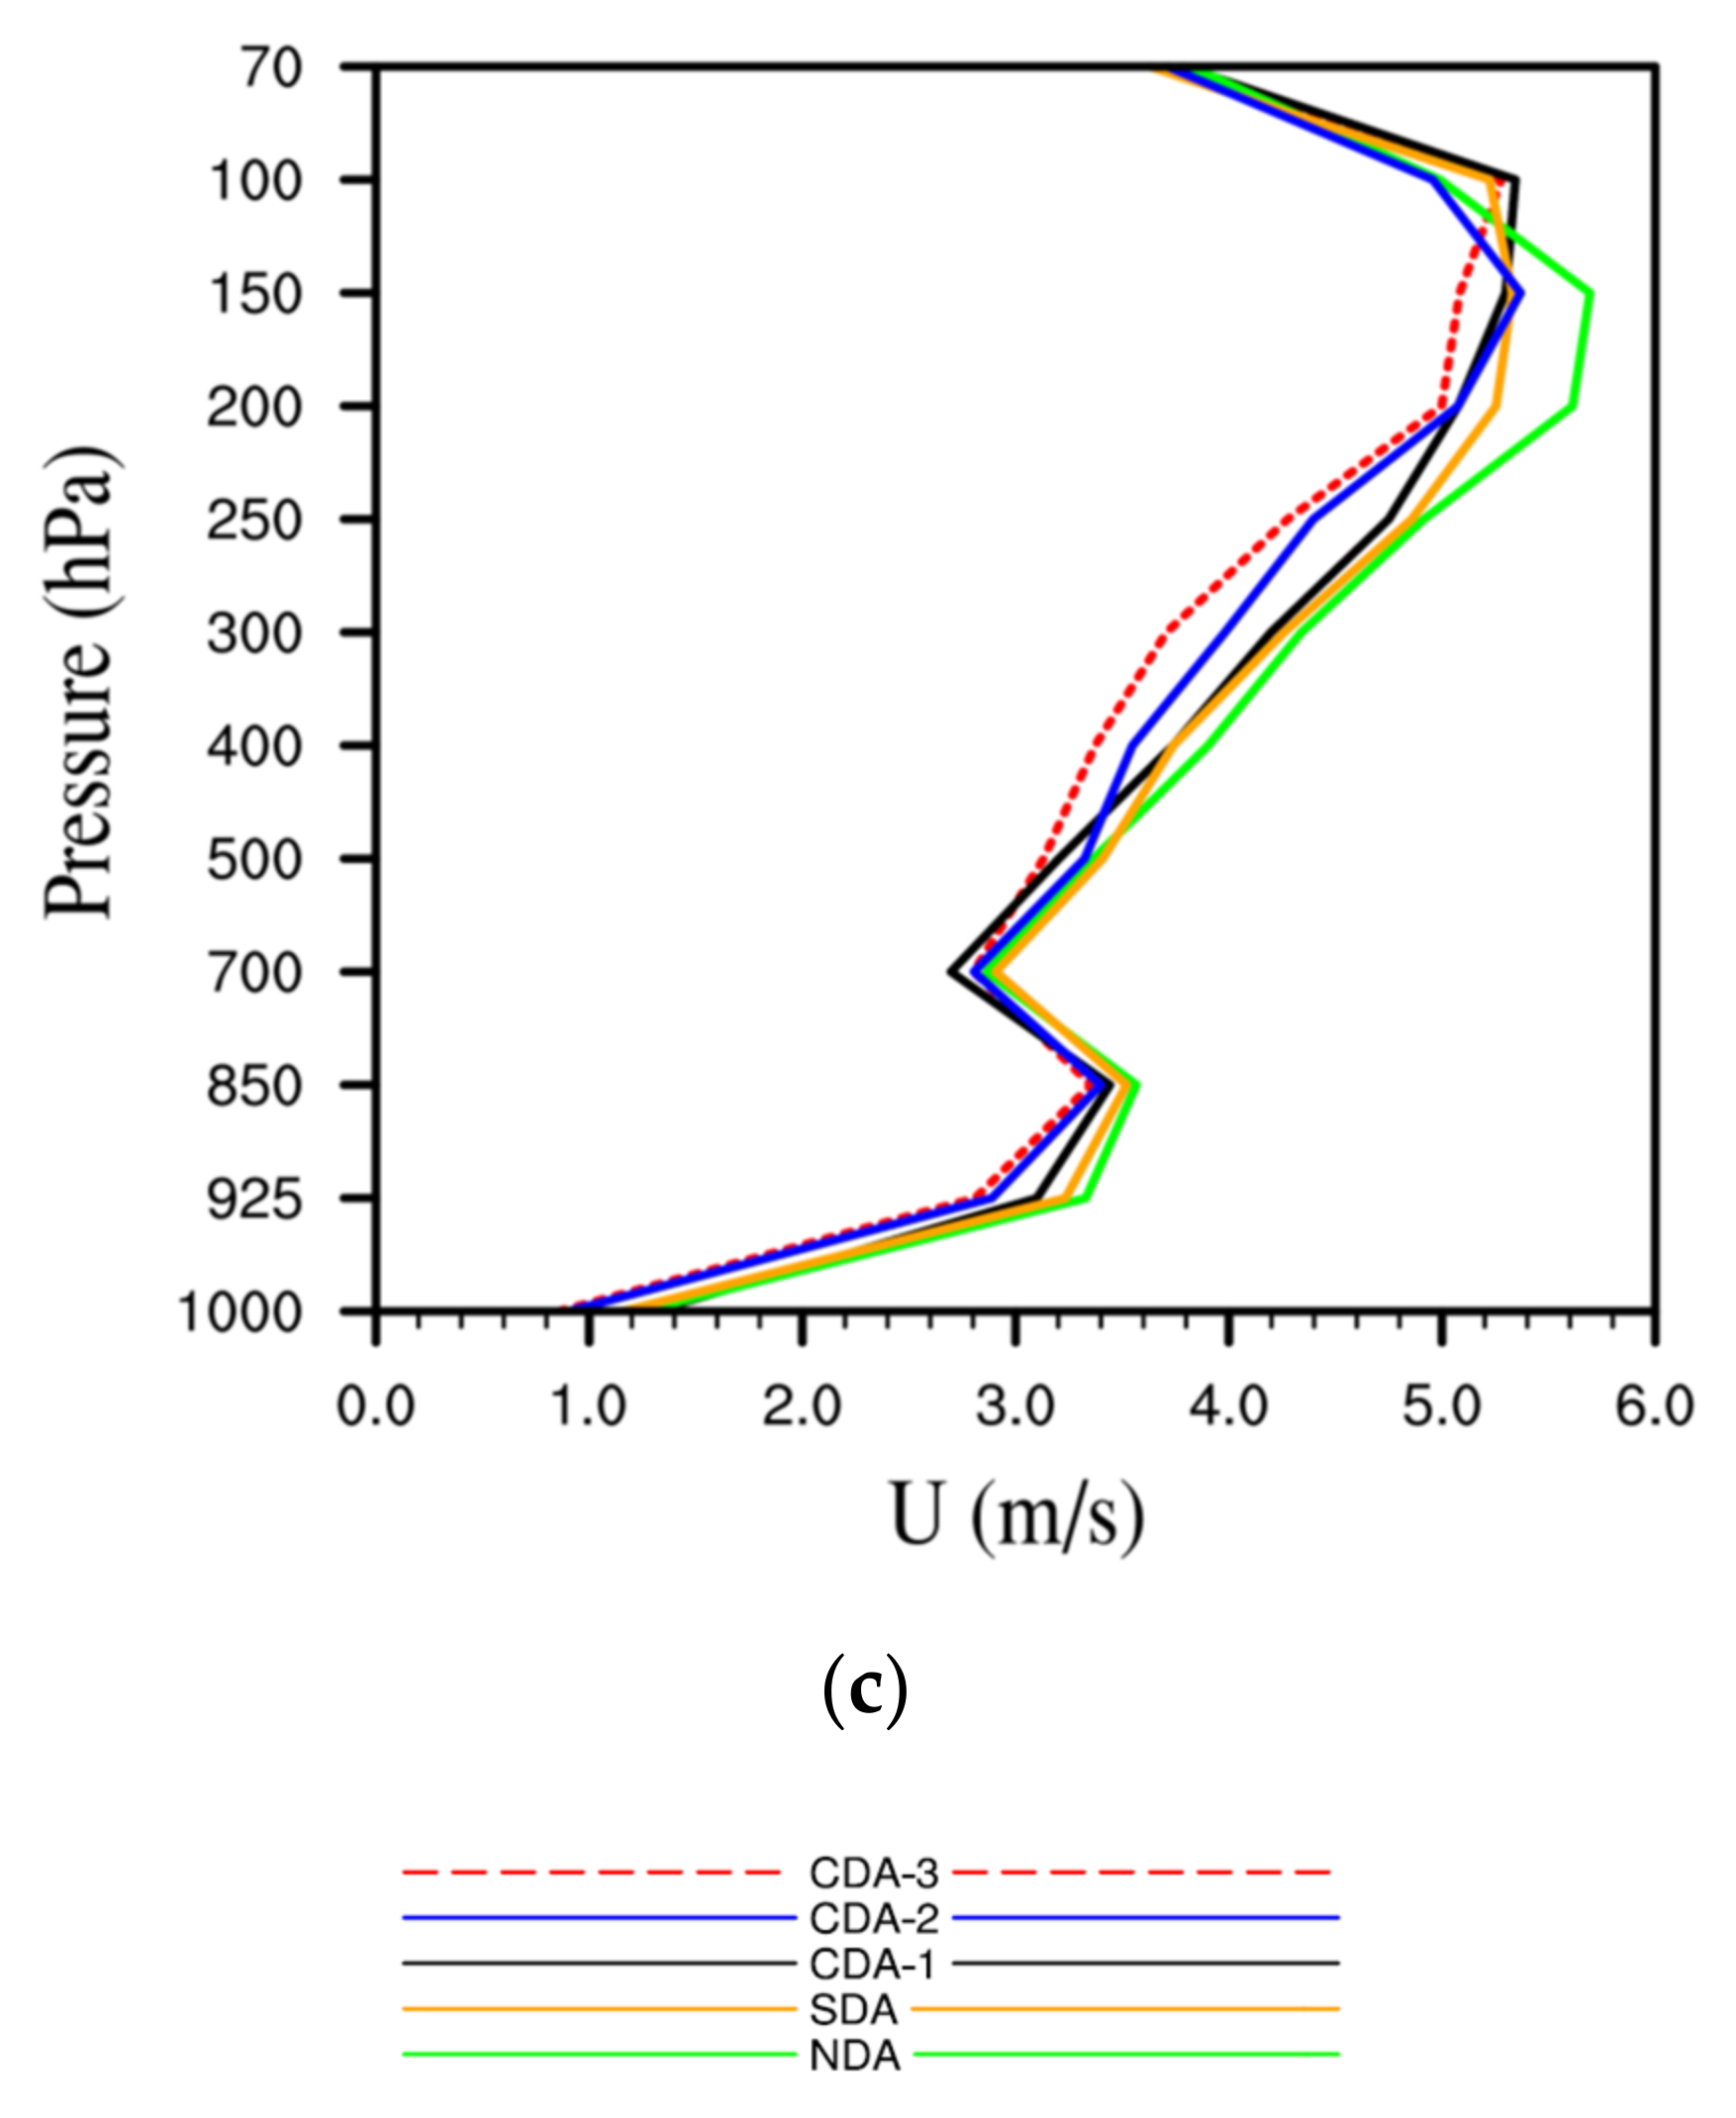
5.2. RMSE Verification against ERA-5

Figure 10a displays the average 24 h forecasting RMSE vertical profiles of water vapor mixing ratio, temperature, and zonal wind, respectively, which uses the ERA-5 data as truth. For humidity, the NDA experiment generated the worst result, while CDA-3 yielded the lowest RMSEs and was slightly better than CDA-2. The SDA is only better than the NDA, while the performance of CDA-1 lies between CDA-2 and SDA. The five experiments obtained similar results at above 400 hPa but show the advantages of assimilating GEOMS radiances in the middle and lower levels, indicating that valuable tropospheric humidity information from a low-level atmosphere can be extracted from GEOMS humidity sounder radiances. For temperature, differences between experiments become clear at below 150 hPa. SDA showed little impact on the temperature fields compared to NDA because of the lack of enough rapidly updated information from GEOMS radiances. CDA-3 looks clearly better than CDA-2 at levels between 150 and 850 hPa. However, these two experiments obtained comparable results at levels below 850 hPa. For the wind field, CDA-2 and CDA-3 generated markedly smaller RMSE results than the other experiments between 200 hPa and 500 hPa, which indicates that a continuous assimilation of GEOMS radiances also has a positive impact on wind fields, which may be influenced by the multivariable correlations (mass–wind balance) between model state variables provided by the background error covariance. The RMSE values for humidity, temperature, and wind variables for comparison are also displayed in Table 3, Table 4 and Table 5, respectively. It can be concluded from this part that the continuous assimilation, radiance resolution, and radiance accuracy may have different impacts on different variables. The higher space-time resolution of the GEOMS radiances helps improve the performance of NWP. Furthermore, the reduced RMSE of multiple model state variables can help to improve the predictions of typhoon intensity, track, and rainfall.

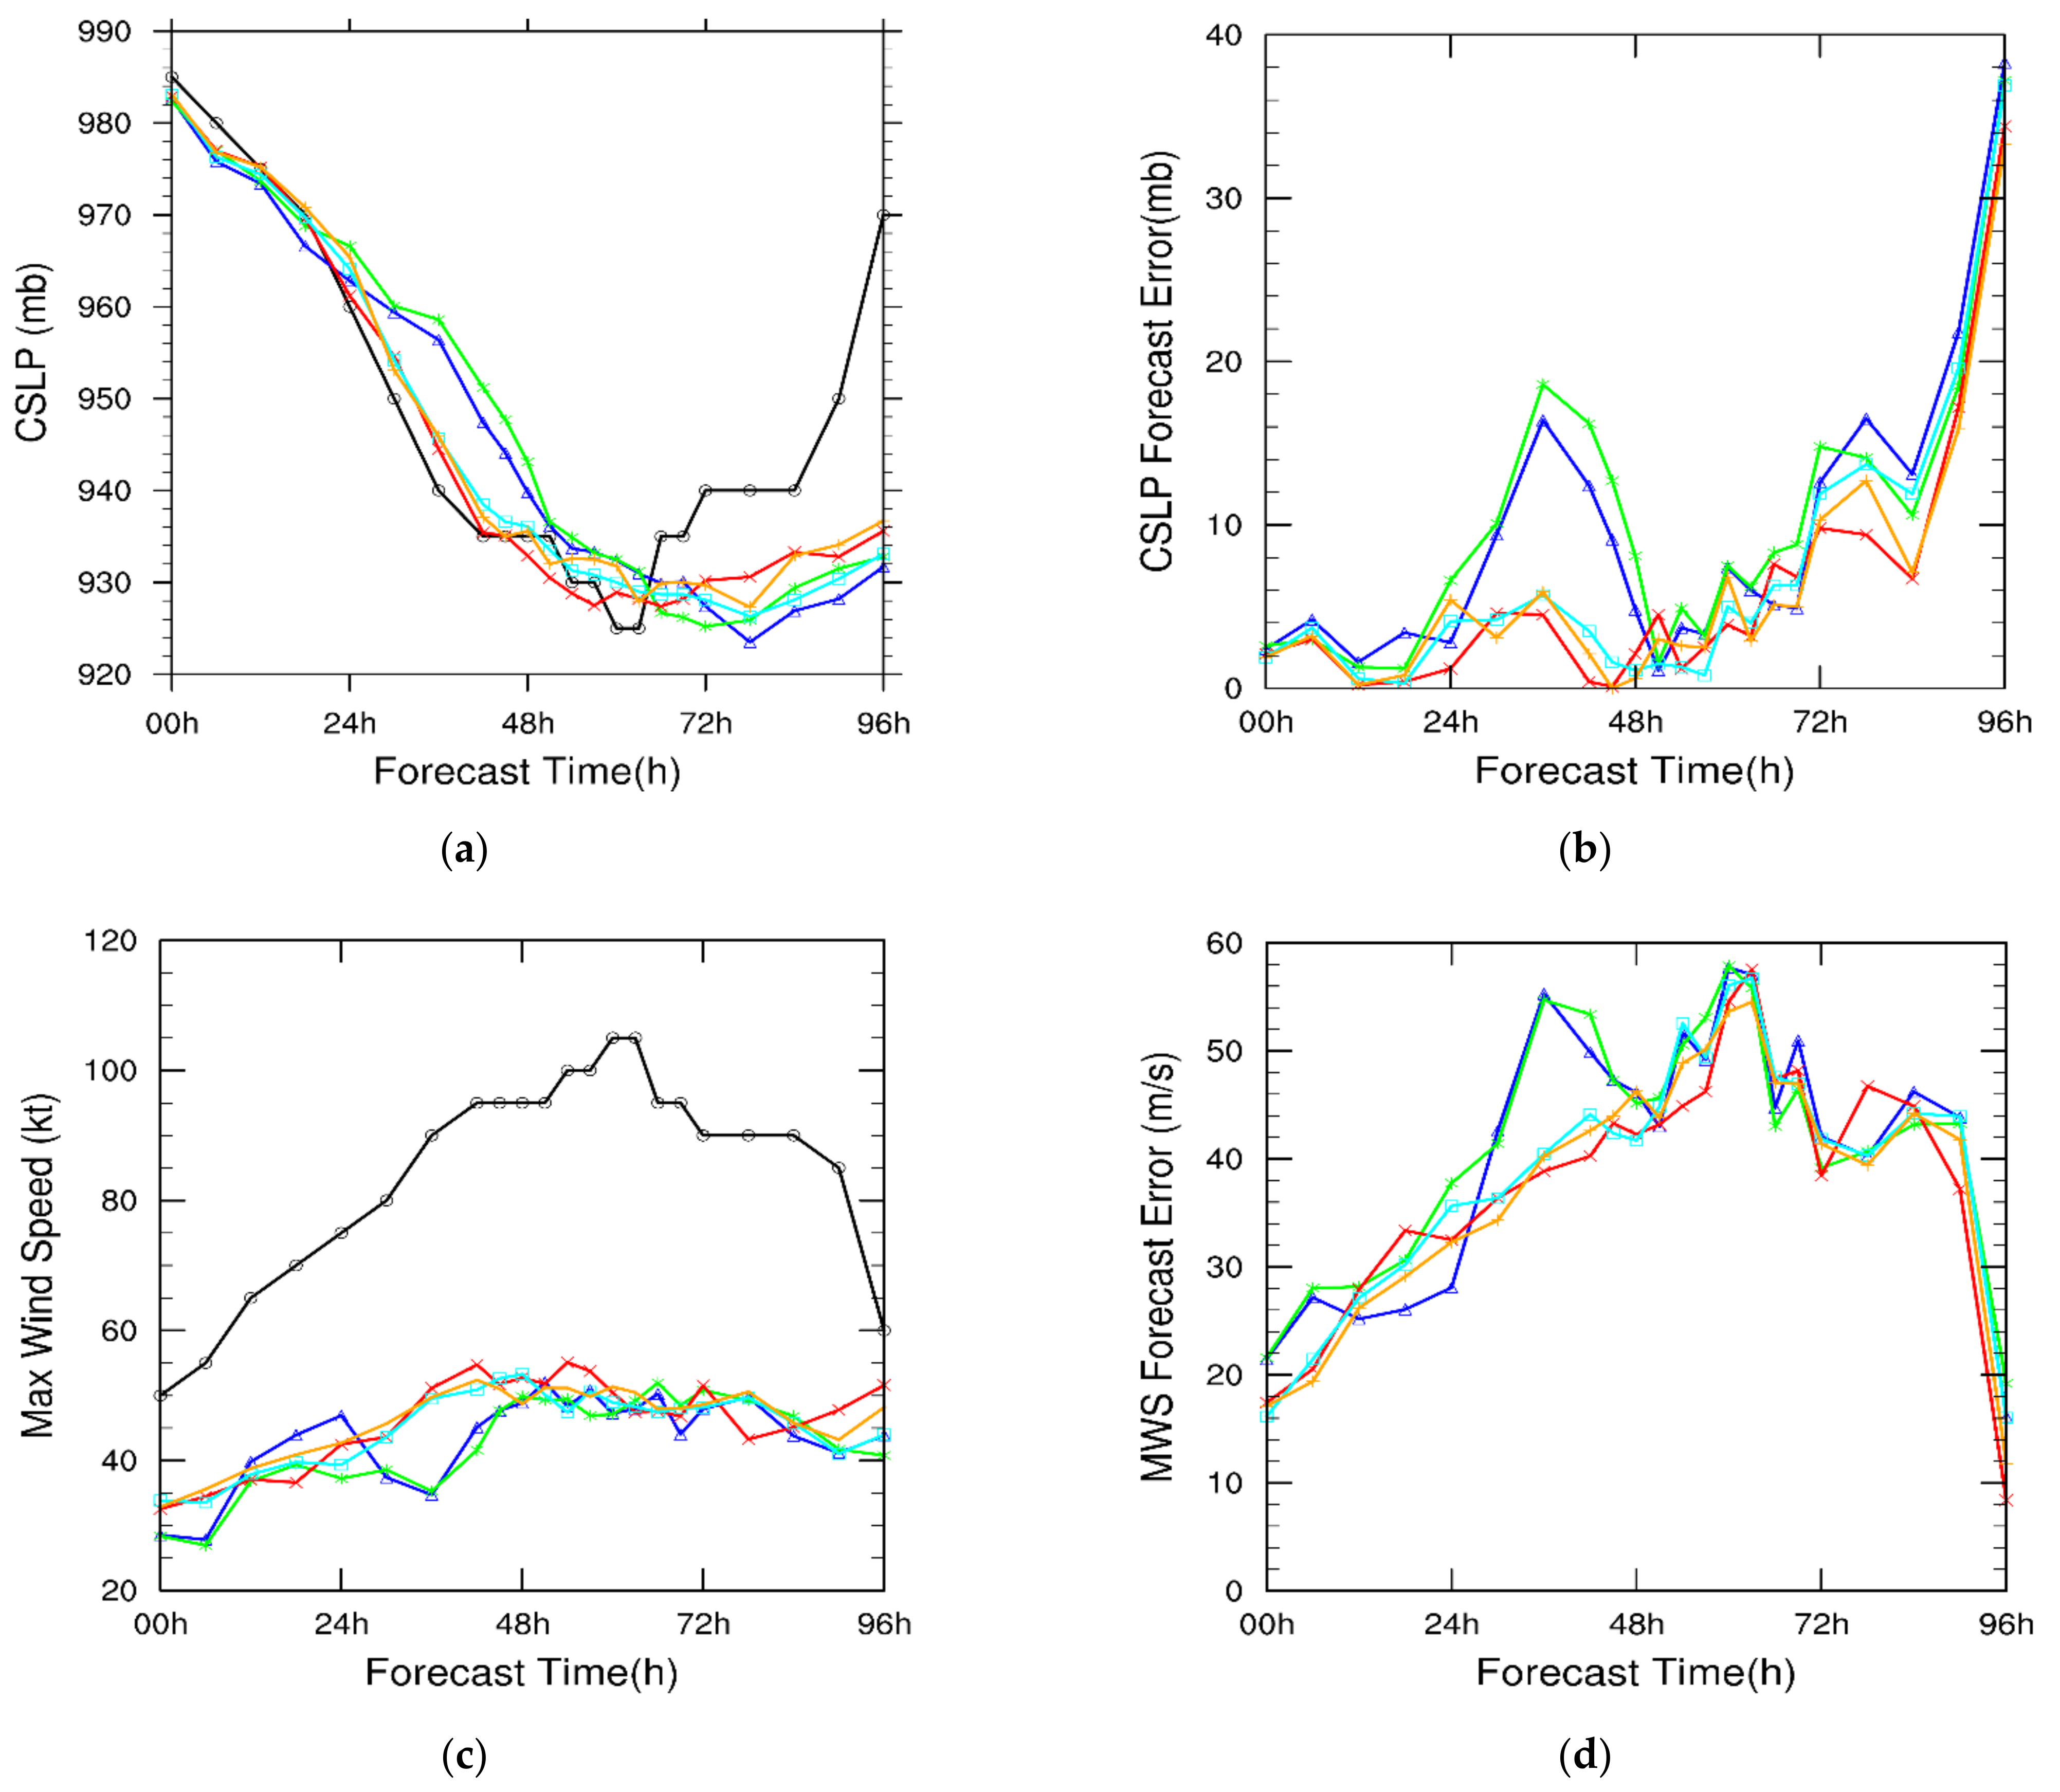
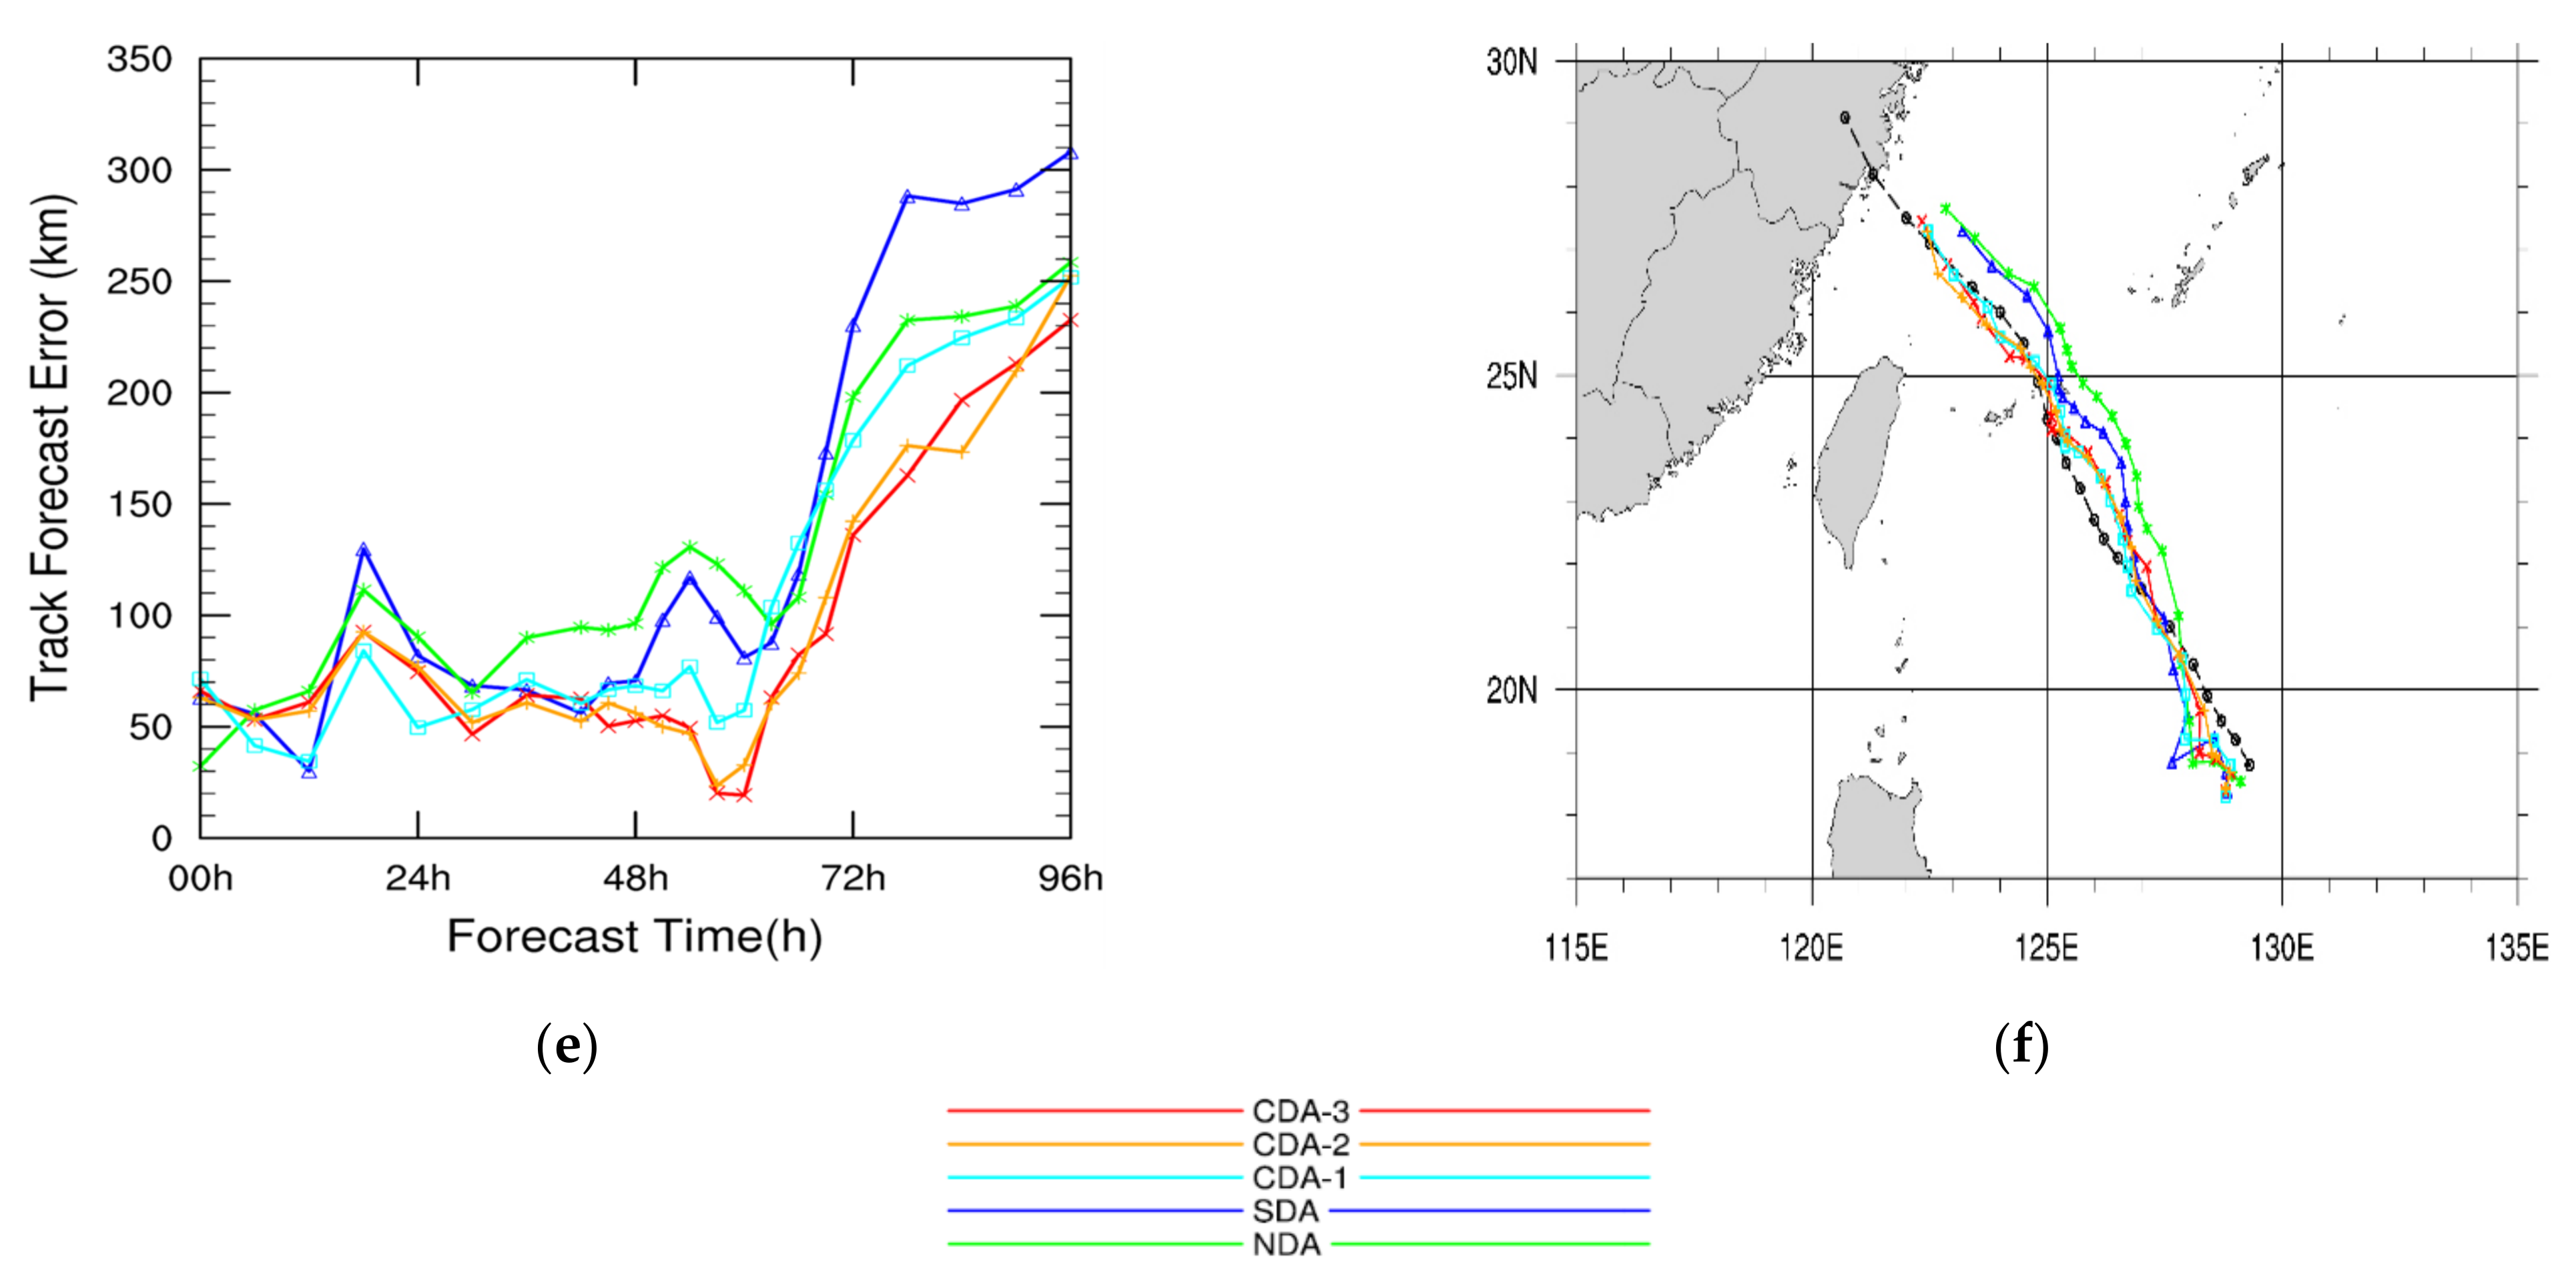
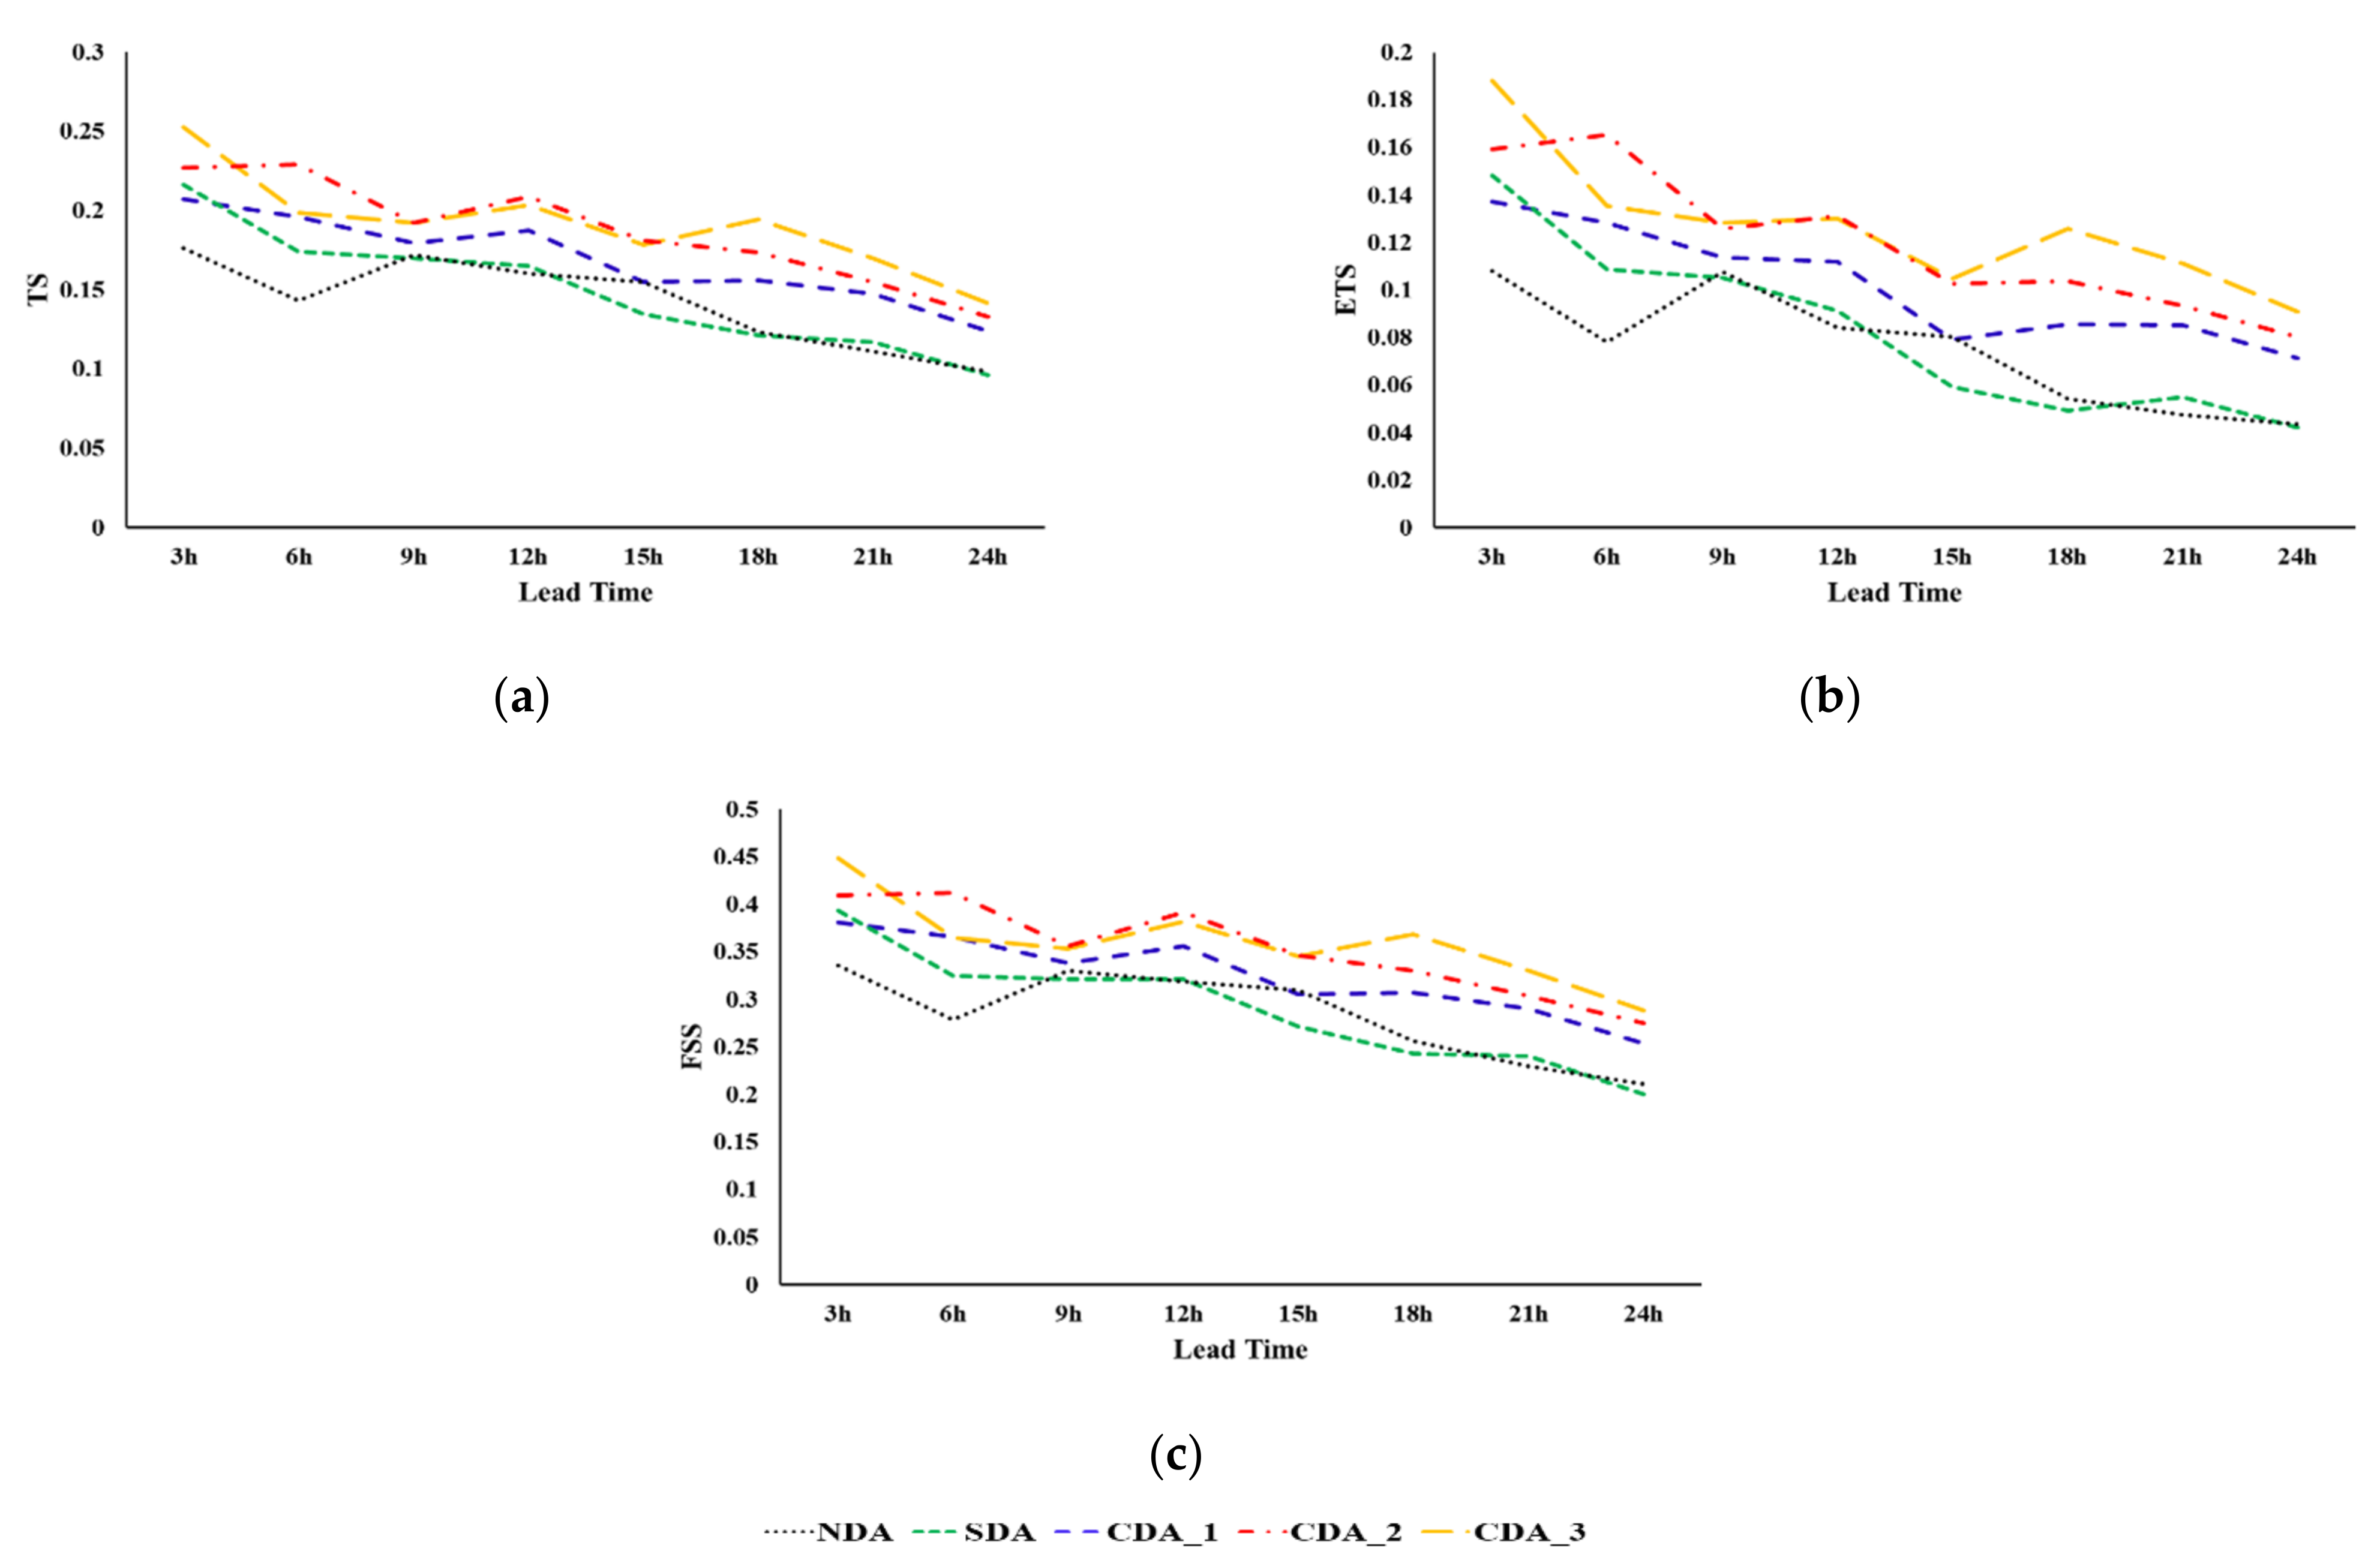
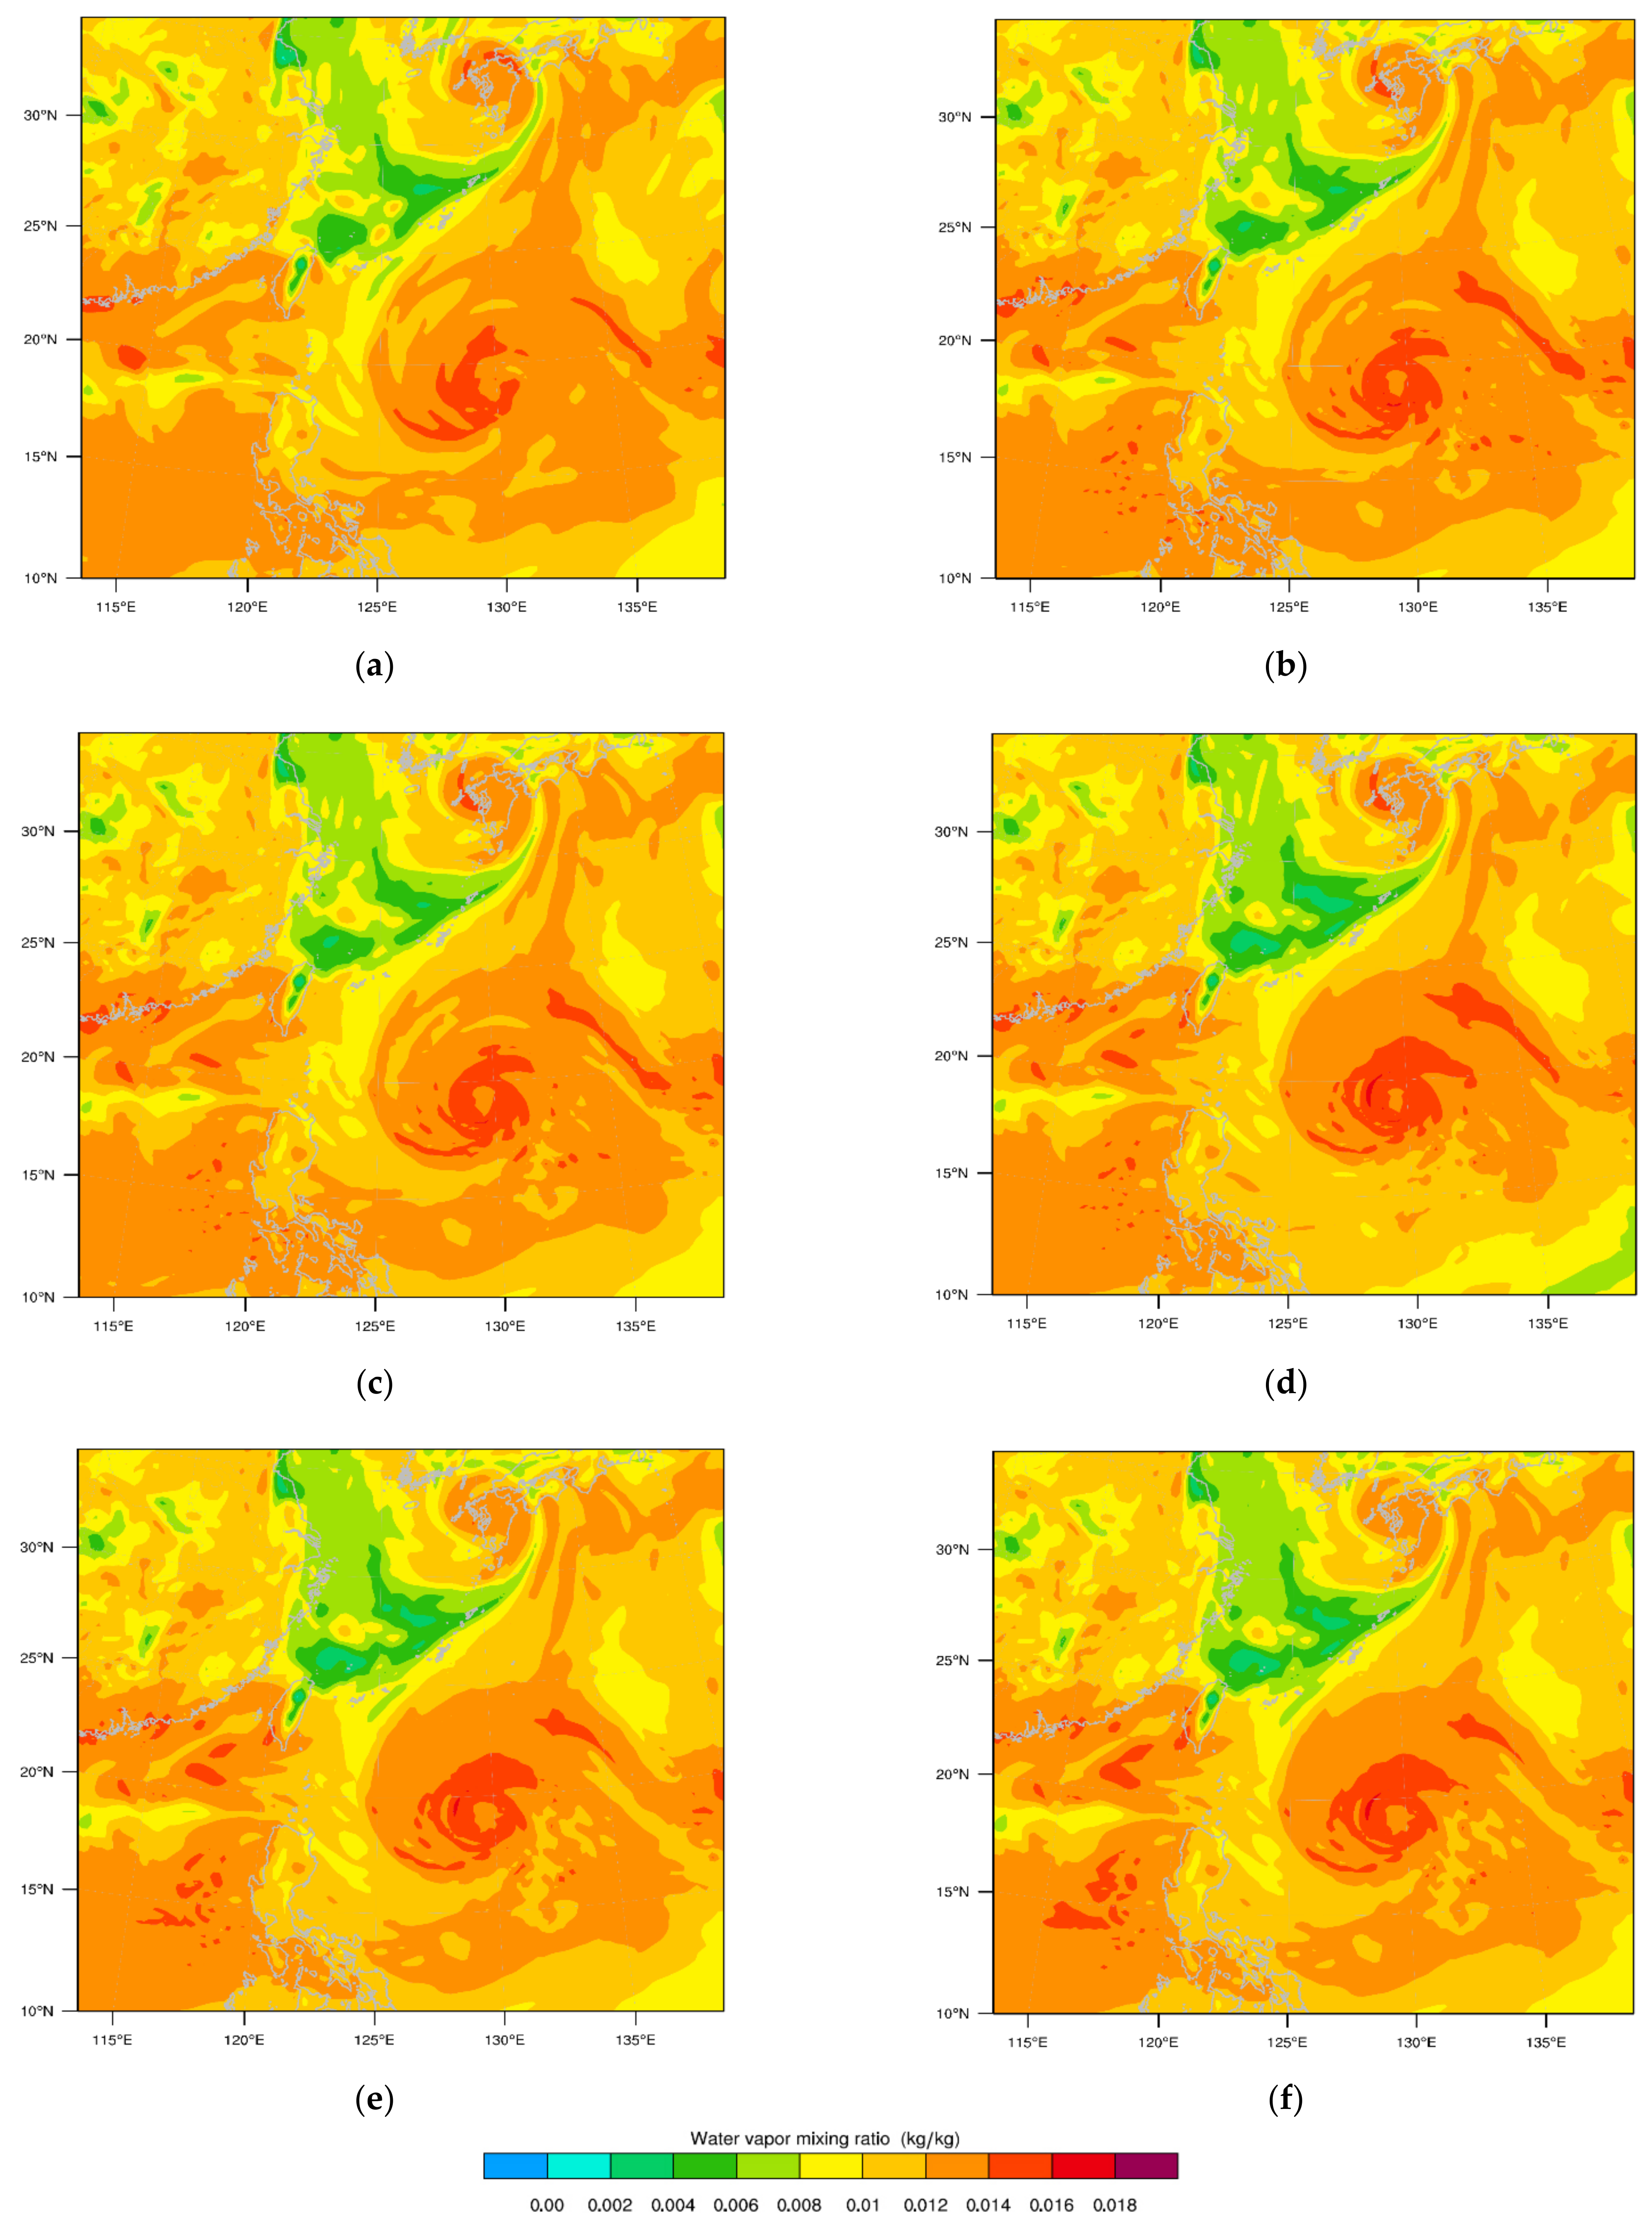
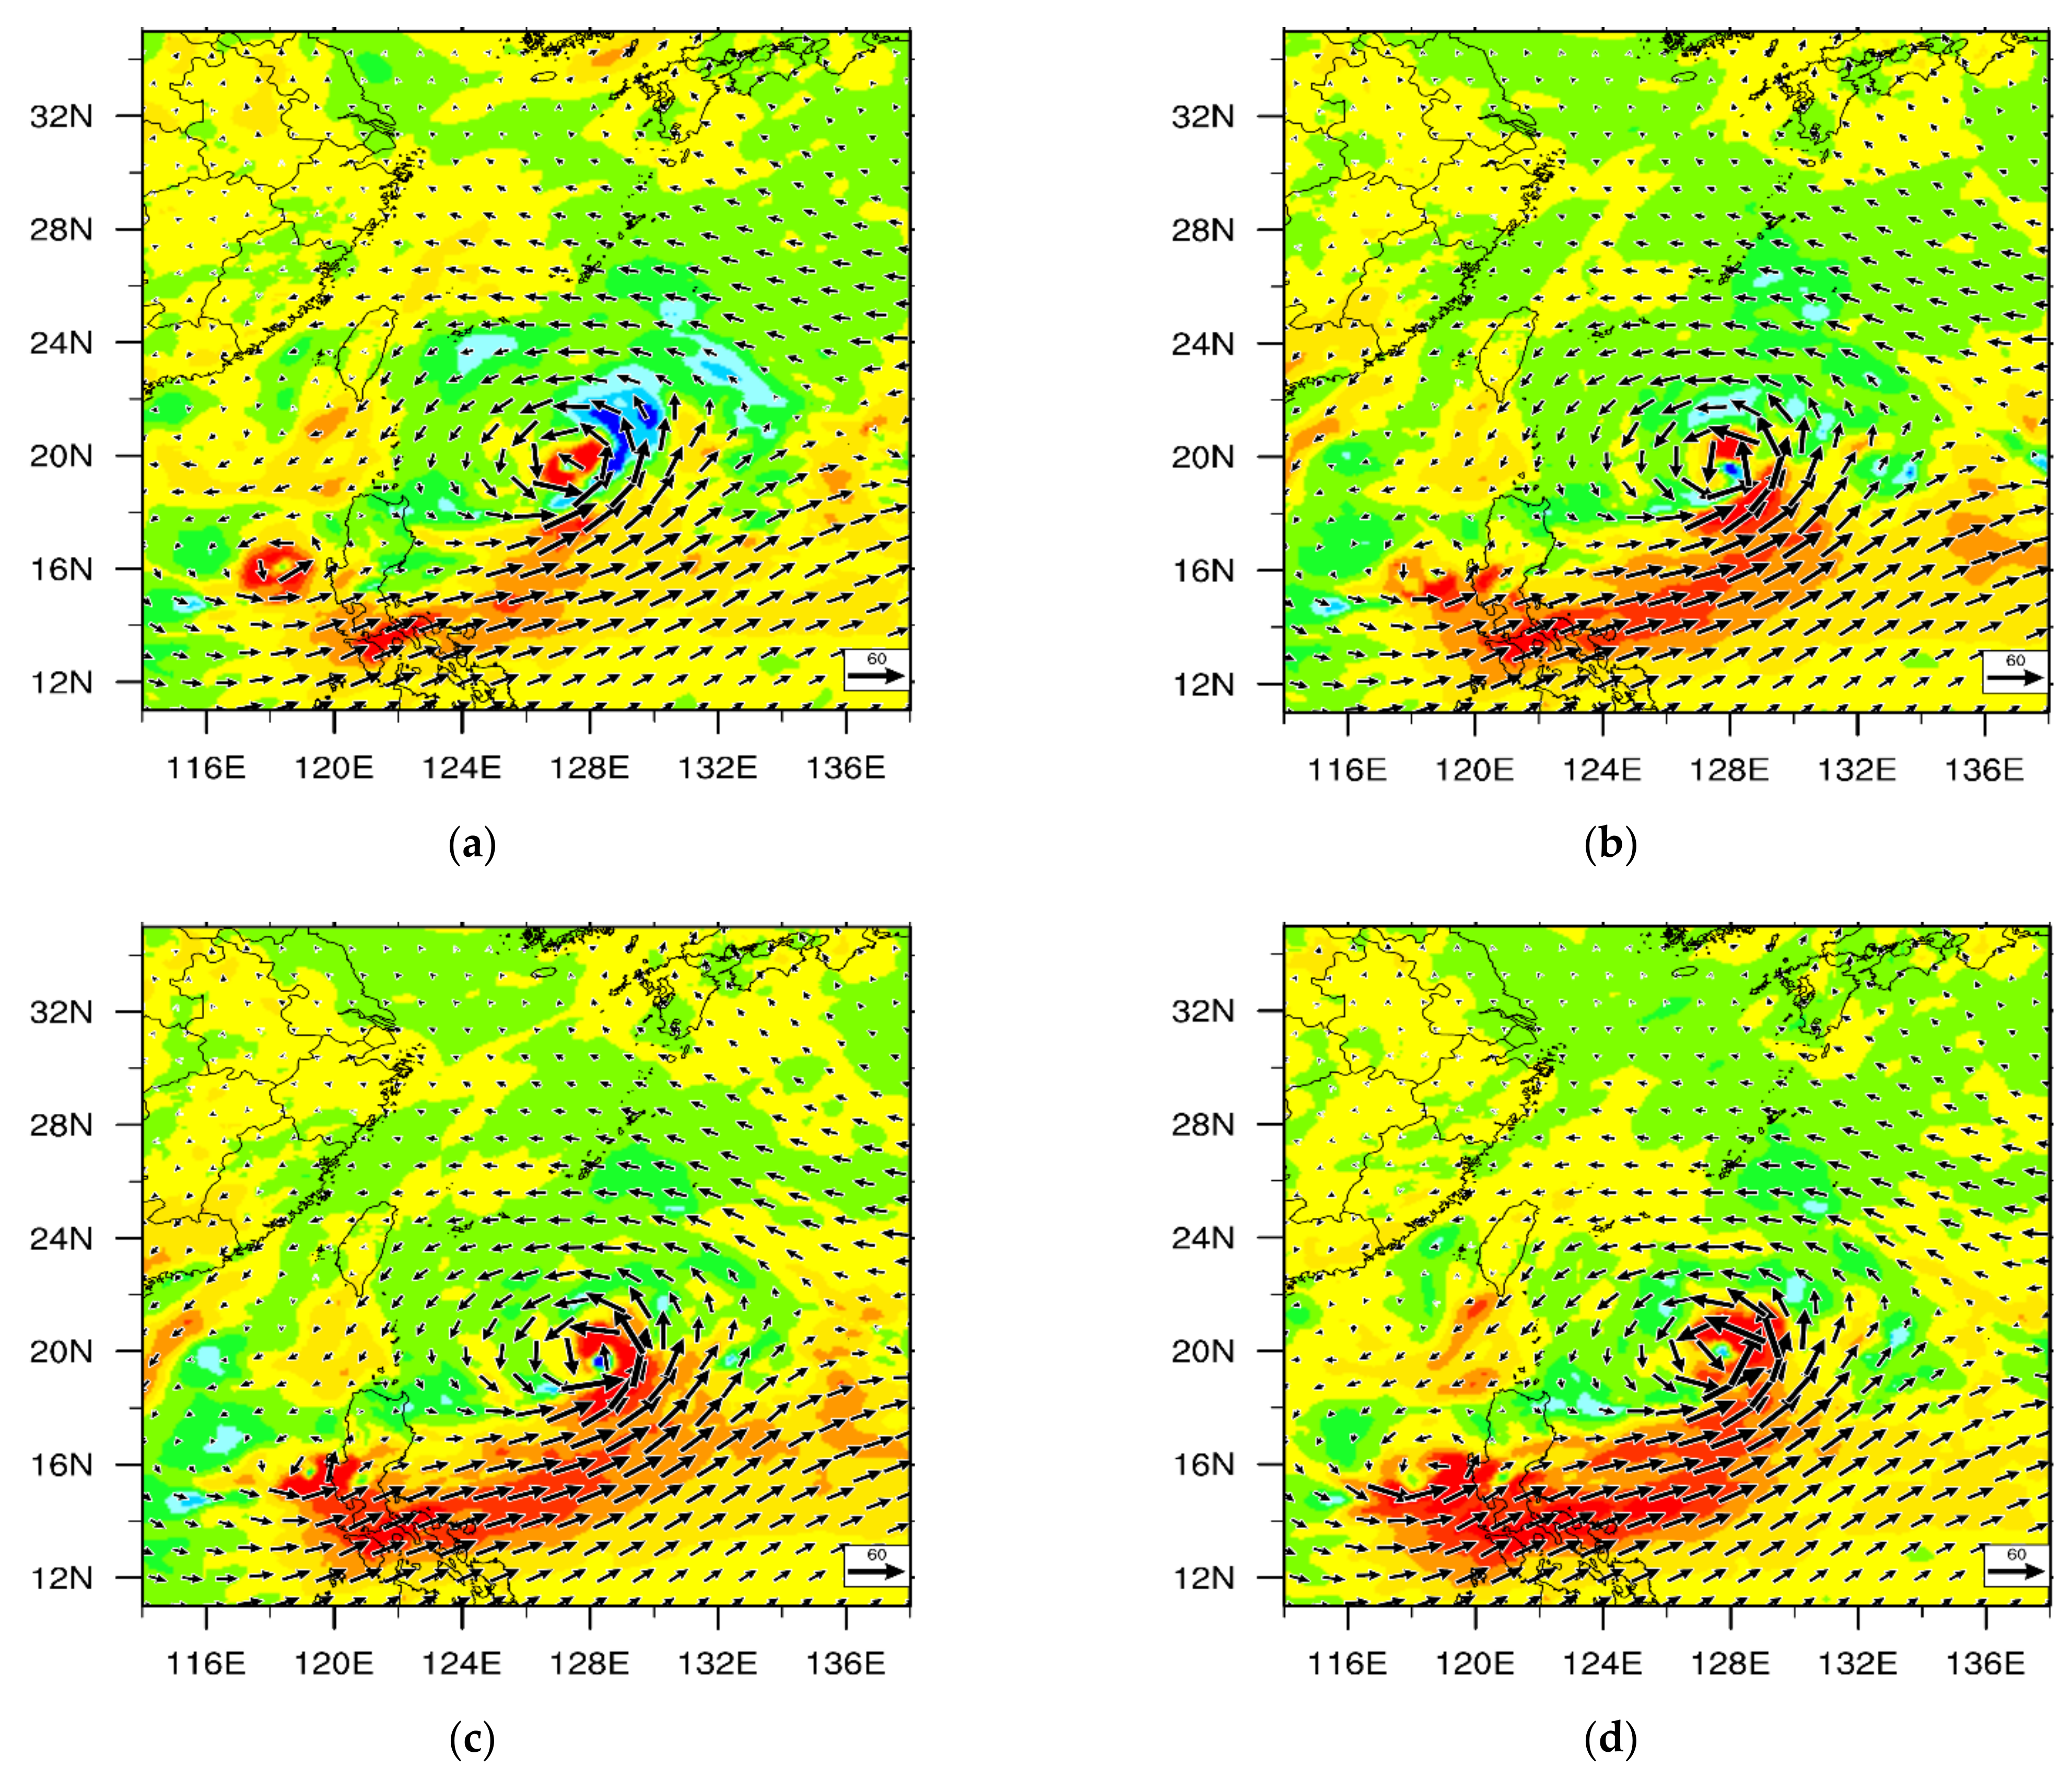
5.3. Impact on Typhoon Track and Intensity Forecast

The verification of typhoon track and intensity forecasts for NDA, SDA, CDA-1, CDA-2, and CDA-3 are discussed in this subsection. The best track data is provided by the tropical cyclone center of CMA. Table 6 presents the average typhoon intensity and track forecast performance of the different experiments. The continuous cycling data assimilation experiments overall outperform SDA and NDA in terms of the minimum sea level pressure (MSLP) error, the maximum wind speed (MWS) error, and the track error. CDA-3 shows a slightly better result than CDA-2, while NDA without any data assimilation generates the worst results.
The 96-h evolution of Typhoon Lekima’s MSLP and MWS of the best track and the five experiments (NDA, SDA, CDA-1, CDA-2, and CDA-3) are shown in Figure 11. The observed typhoon initializes at 985 hPa MSLP at 0000 UTC 6 August and continues to strengthen until 1200 UTC 9 August during the forecast period. A clear improvement of intensity forecast (the CSLP and MWS) of up to ~48 h was found in the GEOMS radiance data assimilation experiments. Later on, the advantages of assimilating GEOMS radiances become smaller, probably due to the model error and the lack of detailed typhoon structure information that can be provided by radar. In comparison with NDA and SDA, CDA yielded better intensity forecasting results in terms of the MSLP (Figure 11a,b). Note also that CDA-2 and CDA-3 both capture a more similar center pressure to the best track throughout most of the lead time. Figure 11c,d present the forecasting MWS as well as its error compared with the best track data. The MWS of the CDA experiments display slightly stronger results than those from NDA and SDA over the entire lead time. Although the MWS results of CDA-2 and CDA-3 are similar, they look much weaker than the best track, which may be caused by model error. The improvement in GEOMS radiance data assimilation for typhoon intensity may be limited by the model error from the parameterization in the surface processes and microphysical procedures [87].
Figure 11e shows the forecasting track error initialized from 0000 UTC 6 August against the best track data, and Figure 11f shows the best track as well as the 96-h predicted typhoon track. NDA generated the best results in the first 6 h but the worst results between 6 and 72 h of the lead time. SDA was better than NDA between 6 h and 72 h but became the worst after 72 h, which may be caused by the imbalance introduced by the single time data assimilation within the 6-h time window. The continuous cycling assimilation of GEOMS radiances (i.e., CDA-1, CDA-2, and CDA-3) generated the best results after 18 h of the lead time, and CDA-2 and CDA-3 showed the lowest track error, presumably due to their rapid-update utilization of microwave water vapor information in the typhoon analysis and prediction. We can attribute the improvement in track forecast to the more realistic intensity and vortex structure in the initial vortex because of the assimilation of GEOMS radiance data. This result is similar to those of Zhang et al. [48], where microwave radiances helped better describe the typhoon structure. In our study, general positive impacts on typhoon forecast were found in the OSSE experiments after assimilating the GEOMS radiances before 68 h; however, after 68 h, GEOMS data assimilations did not significantly impact typhoon track or intensity, in terms of MSLP or wind speed, which may have been caused by the model error and the lack of detailed typhoon structure information. Combining radar and geostationary satellite observations in the model may overcome this problem in future studies.
To evaluate the assimilating impact of GEOMS radiance observations on the vertical structure of Typhoon Lekima, west–east vertical cross-sections of the potential temperature and horizontal wind speed across the typhoon center in NDA, SDA, CDA-1, CDA-2, and CDA-3 are displayed in Figure 12, respectively. The mature typhoon eye and vortex circulation from CDA-3 are evident in Figure 12a, which is substantially stronger than those in other experiments. The vortex in the continuous cycling data assimilation experiments is generally stronger, having a more upright eyewall than that in NDA and SDA. It is also found that the prediction state from NDA without radiance analysis cannot strengthen the structure of the inner core, which is shown in Figure 12e. It can be concluded that assimilating fine-resolution and more accurate GEOMS radiance data helps establish a more axisymmetric and upright eyewall. In general, Typhoon Lekima analyzed by continuous cycling data assimilation presents more realistic characteristics than other methods. The inclusion of the rapid-update information from GEOMS radiance data contributes to the final forecasting improvement.

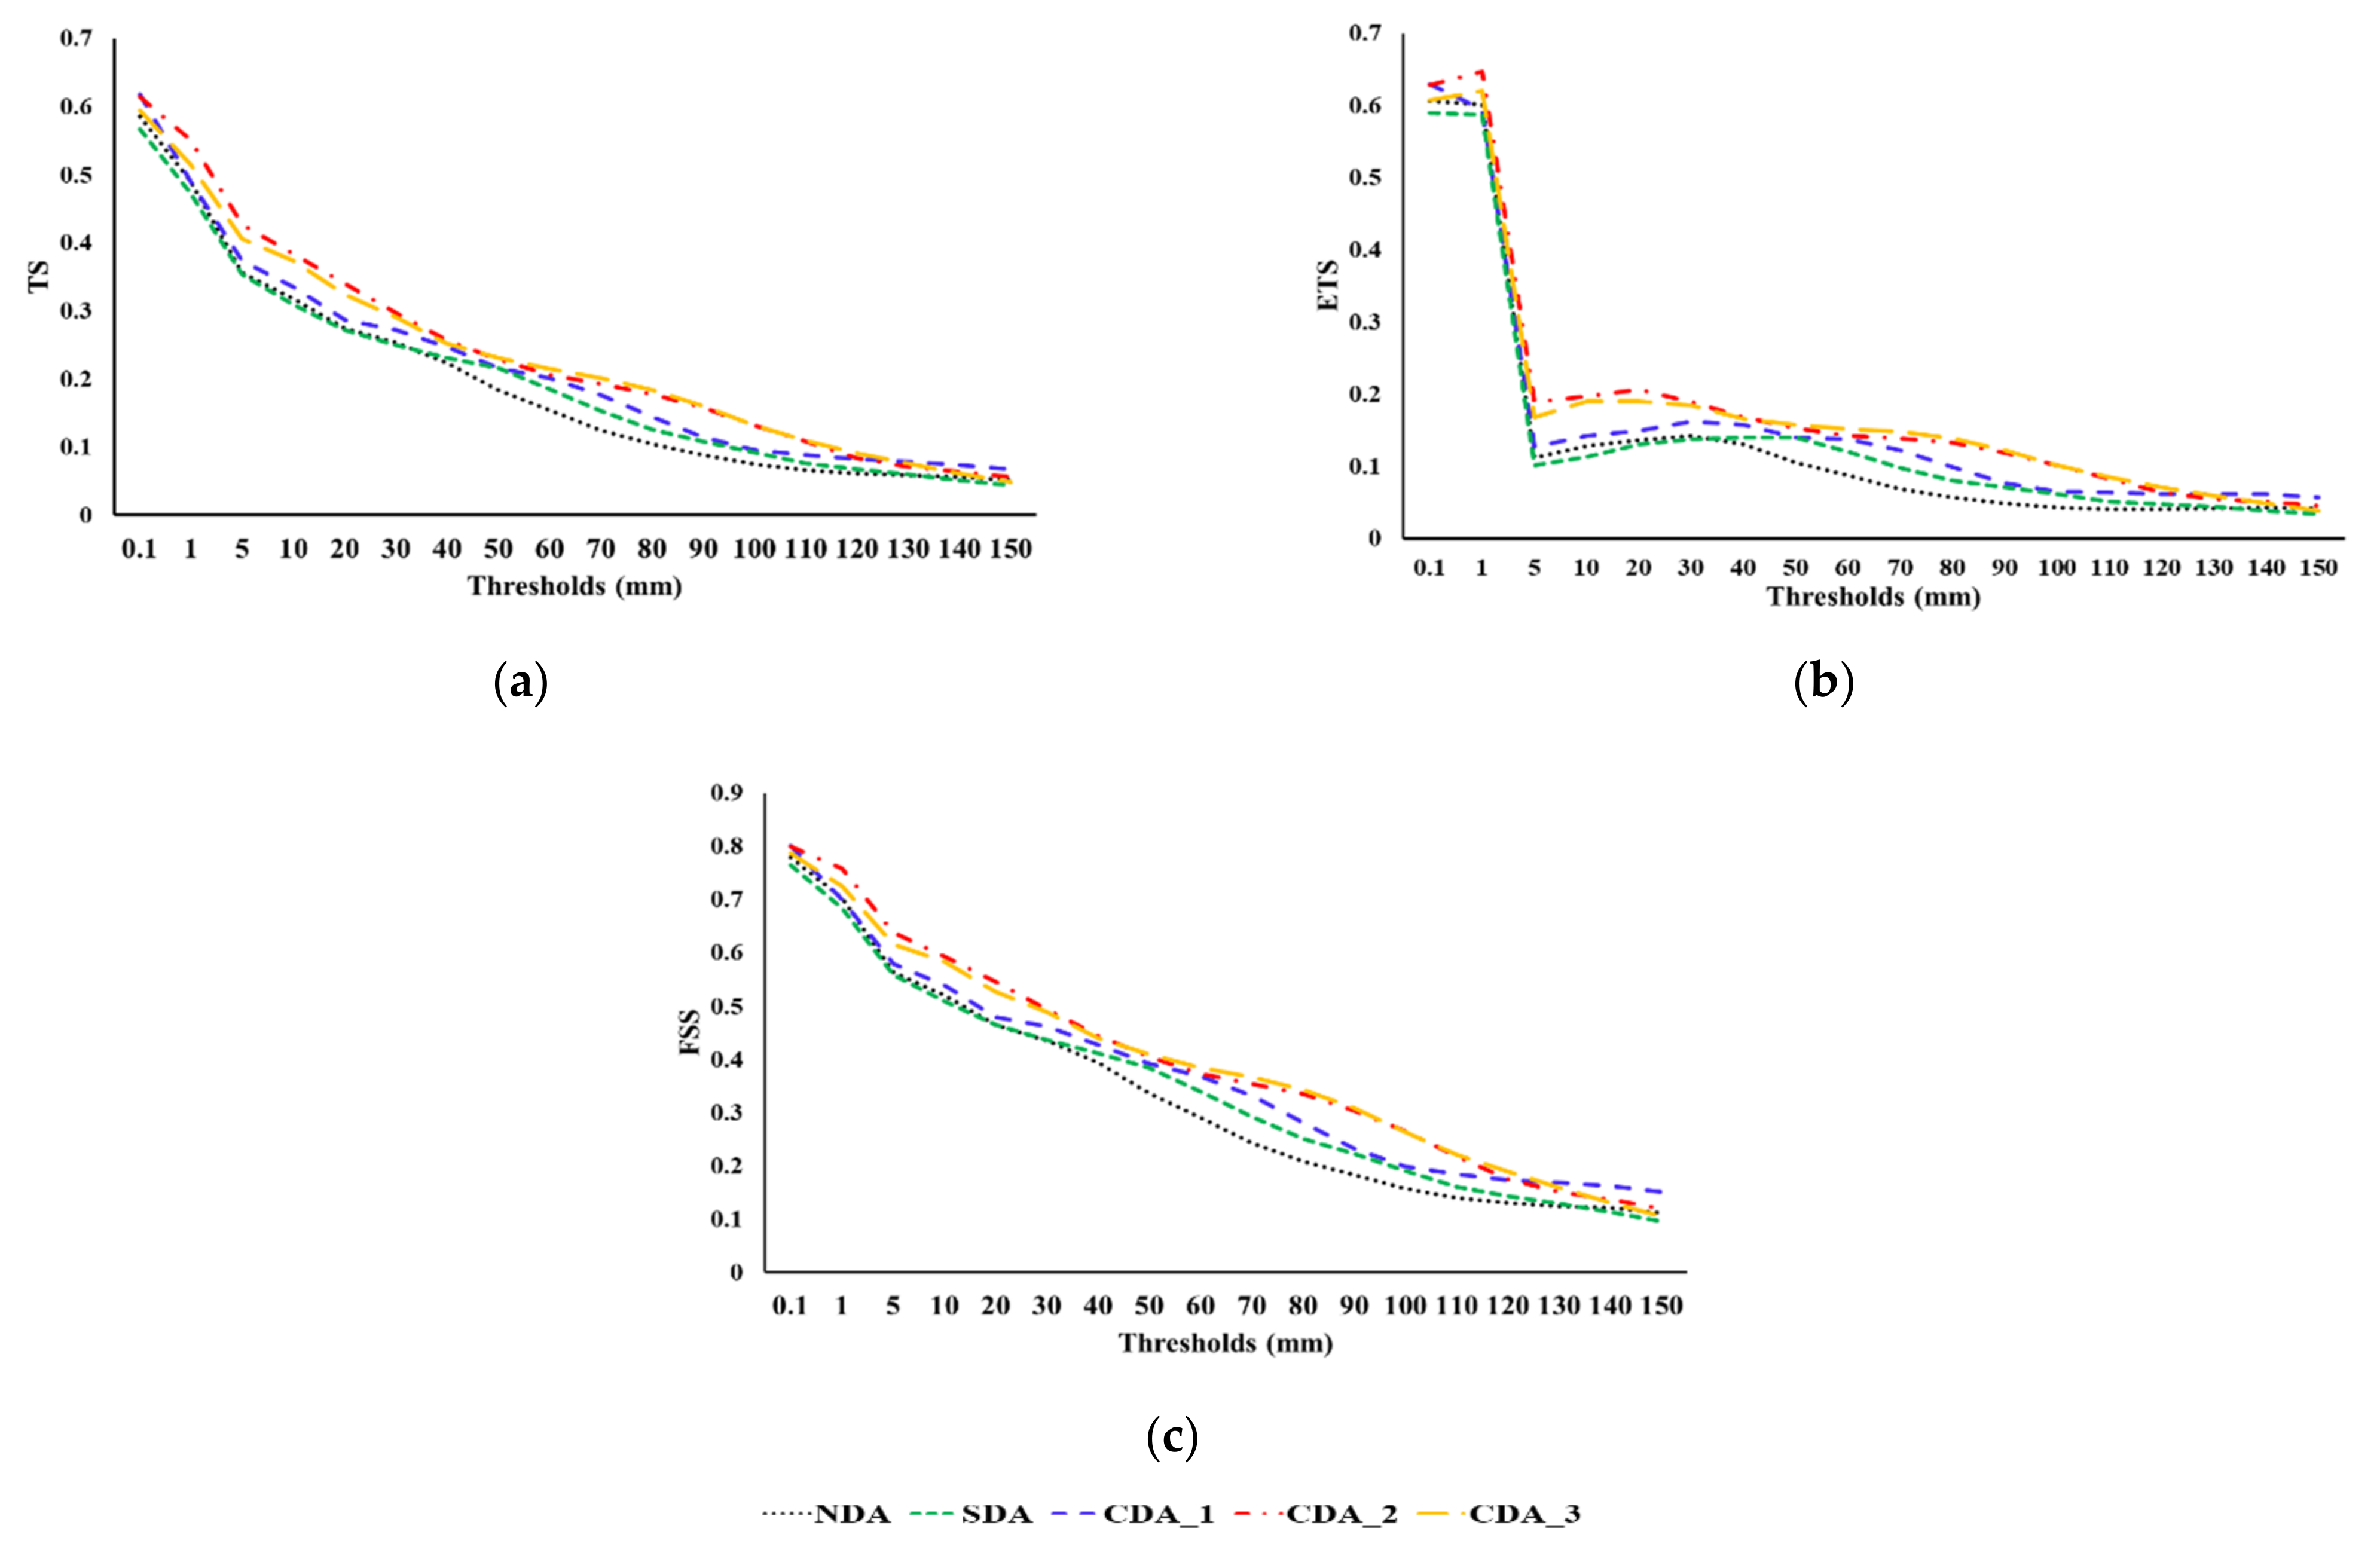
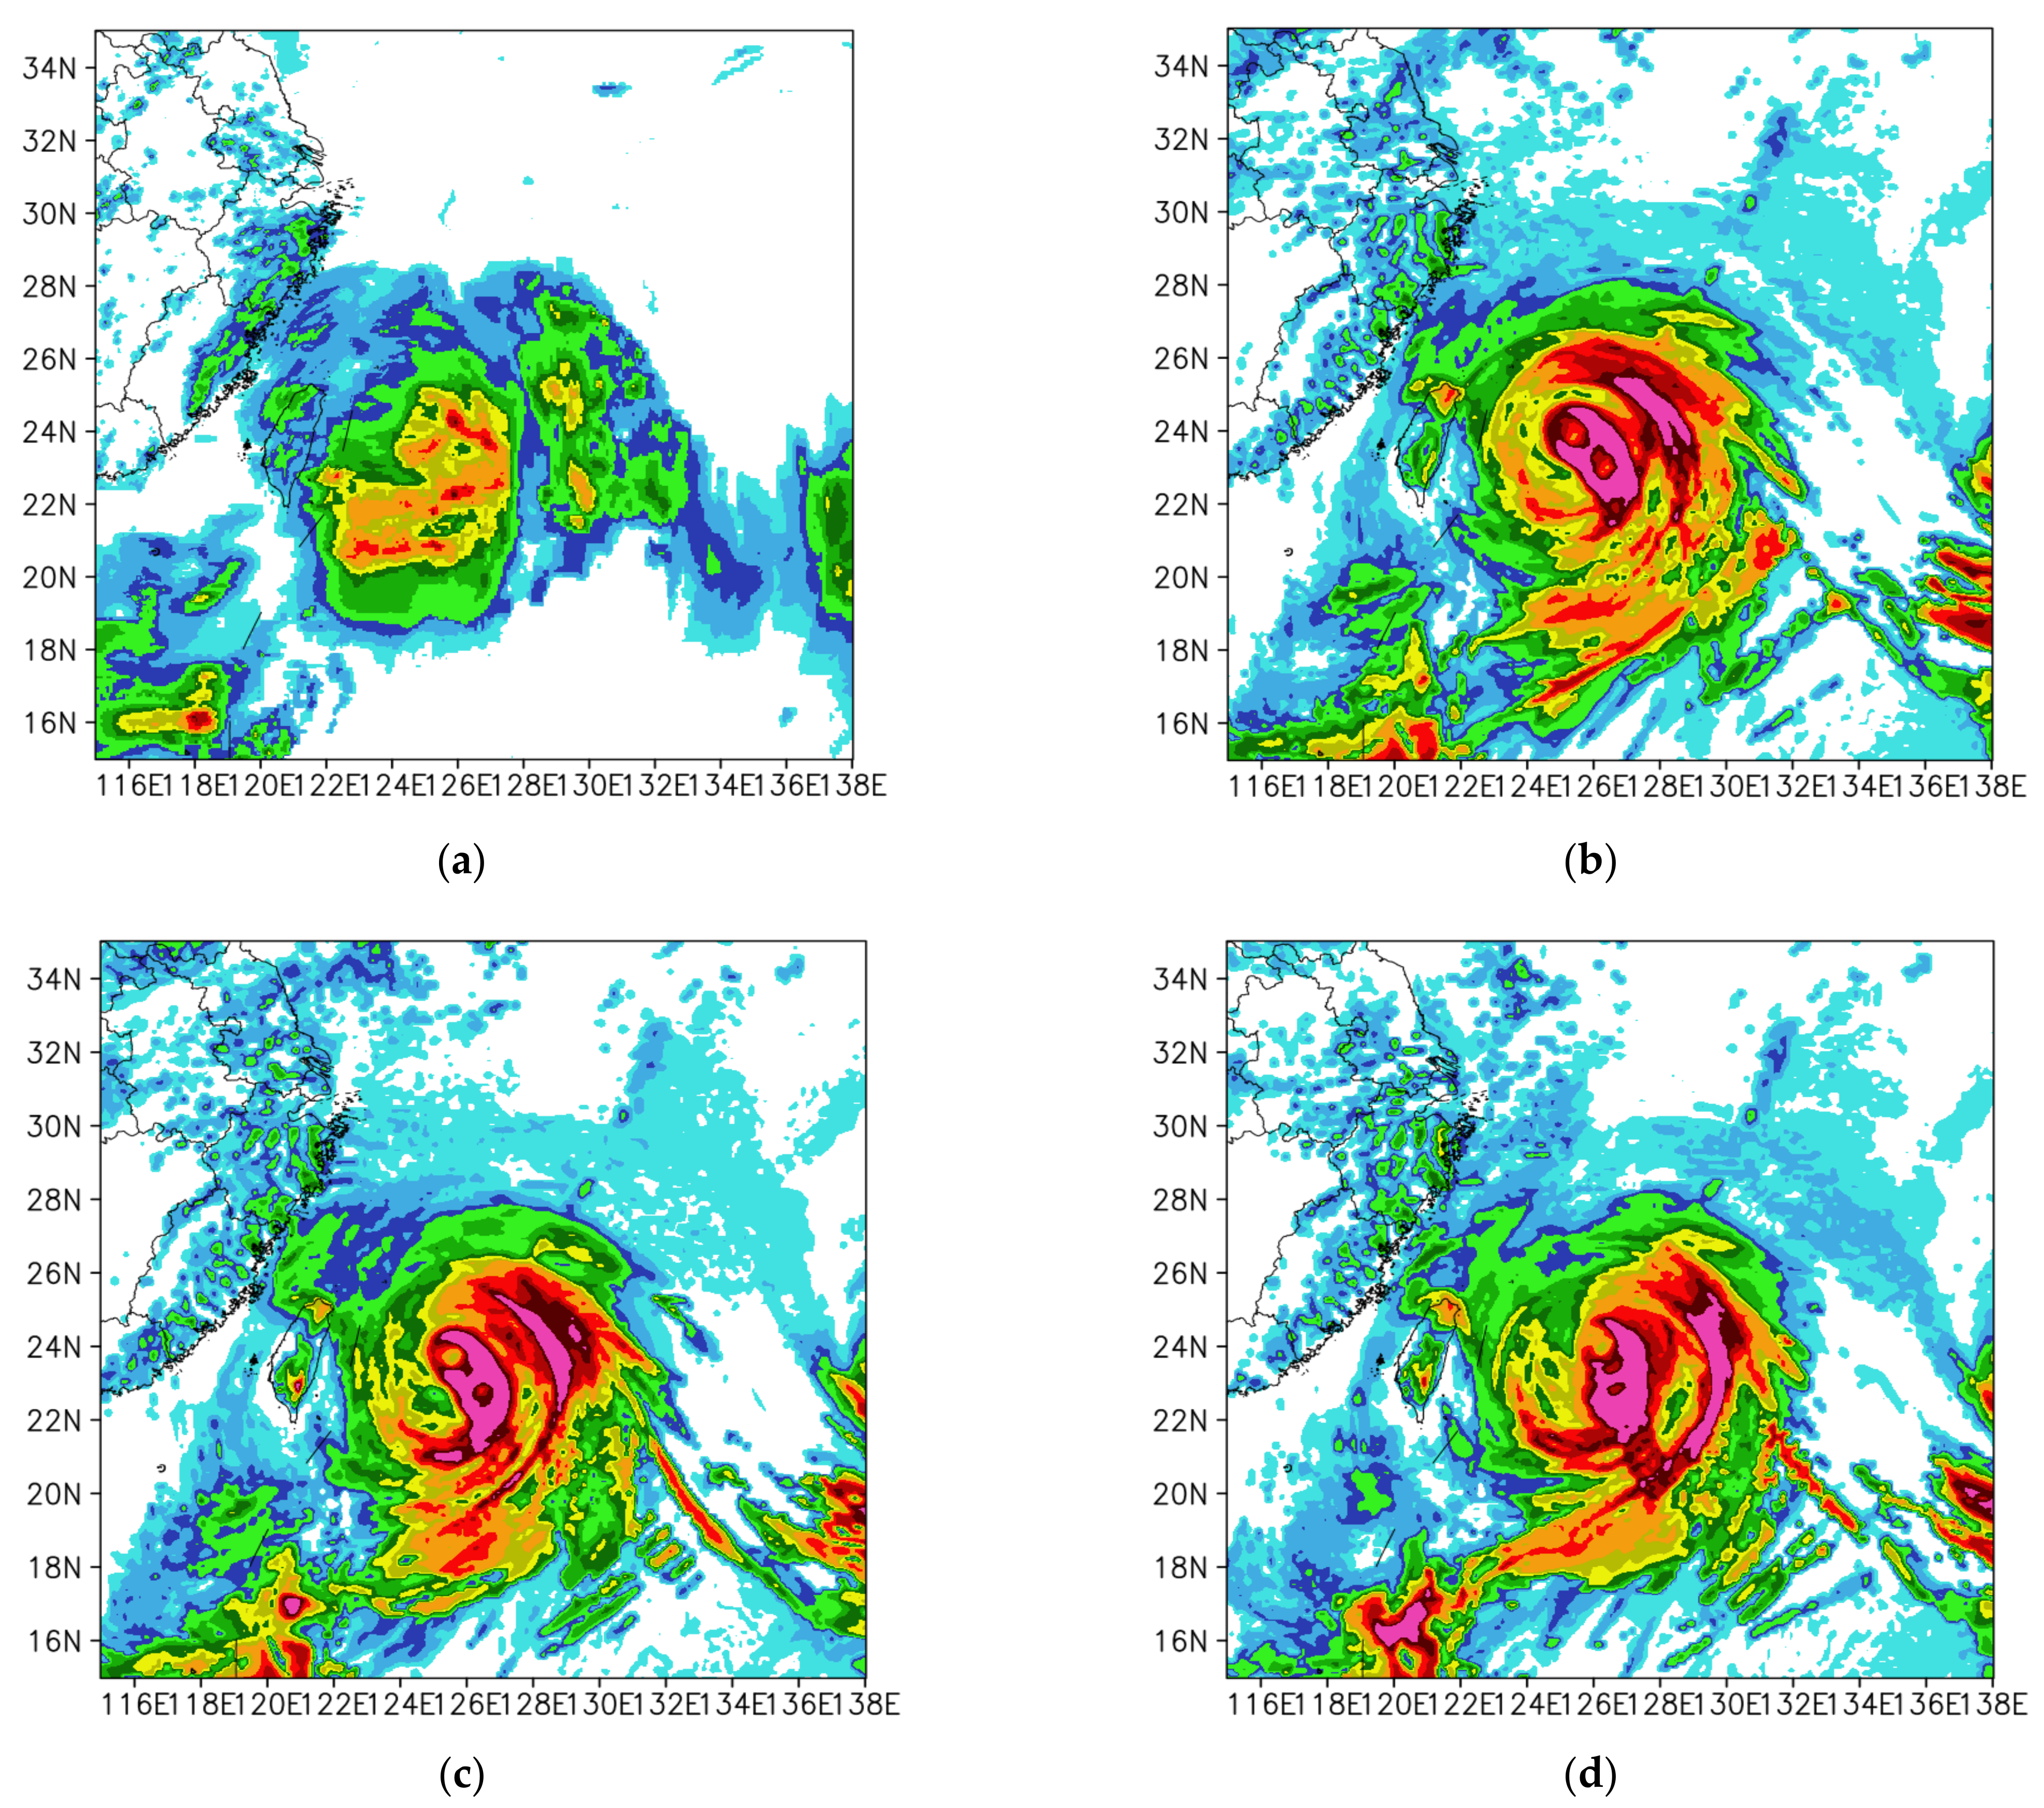
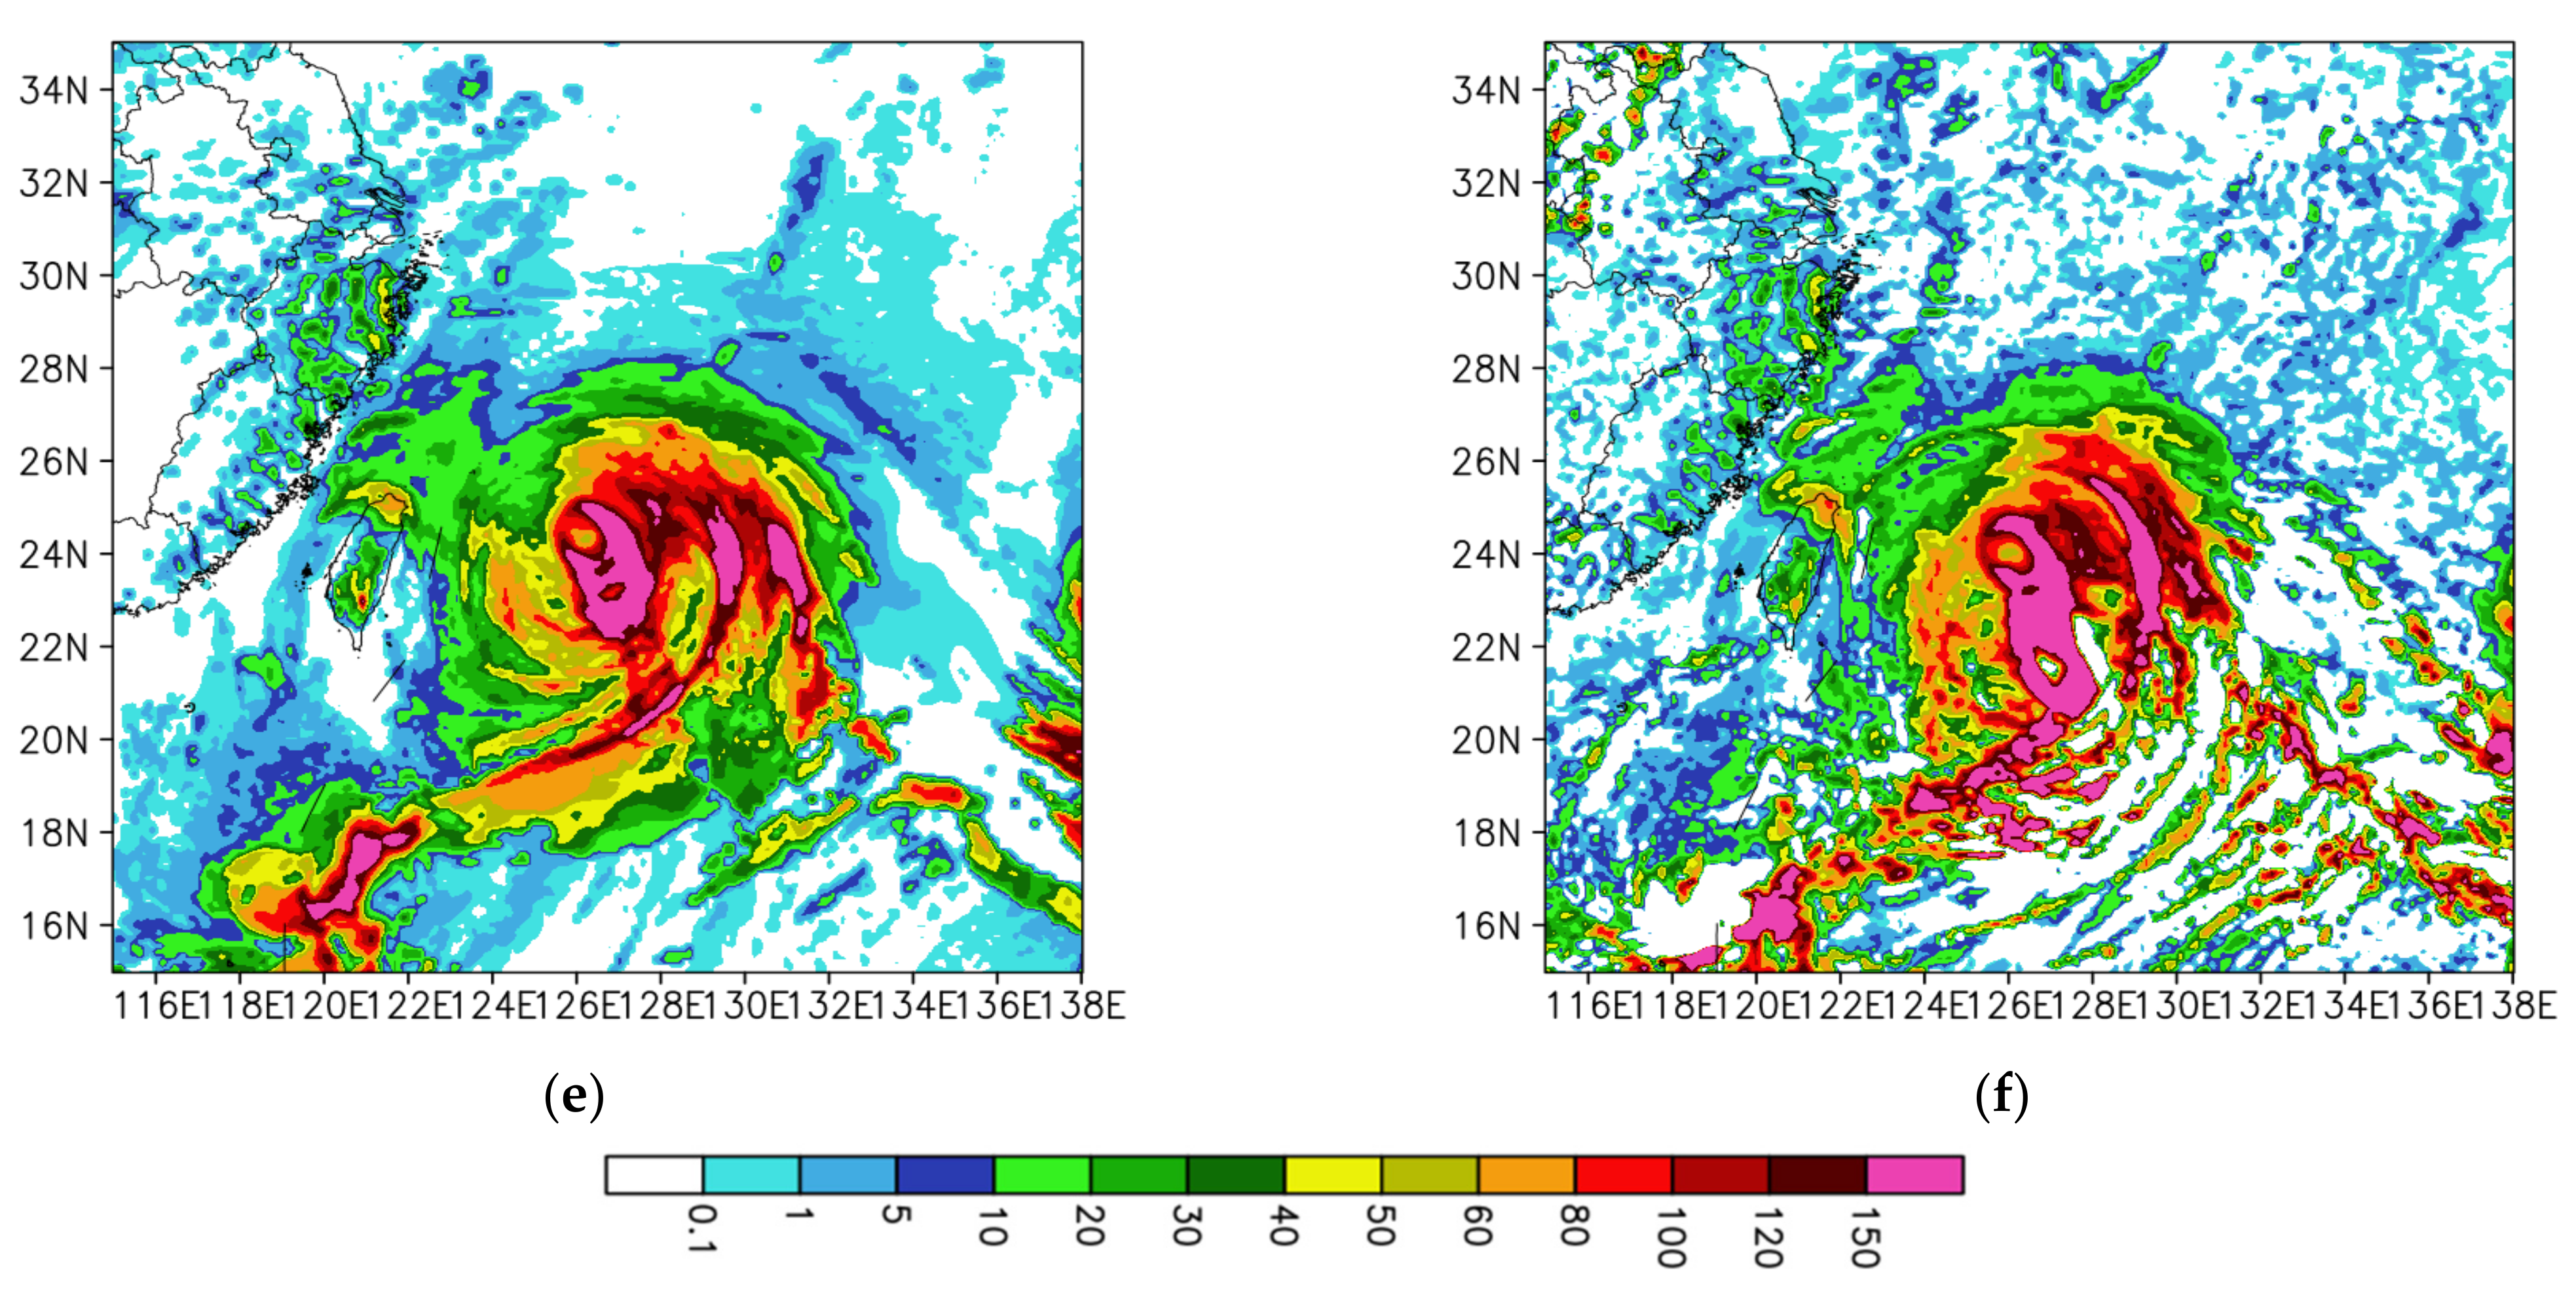
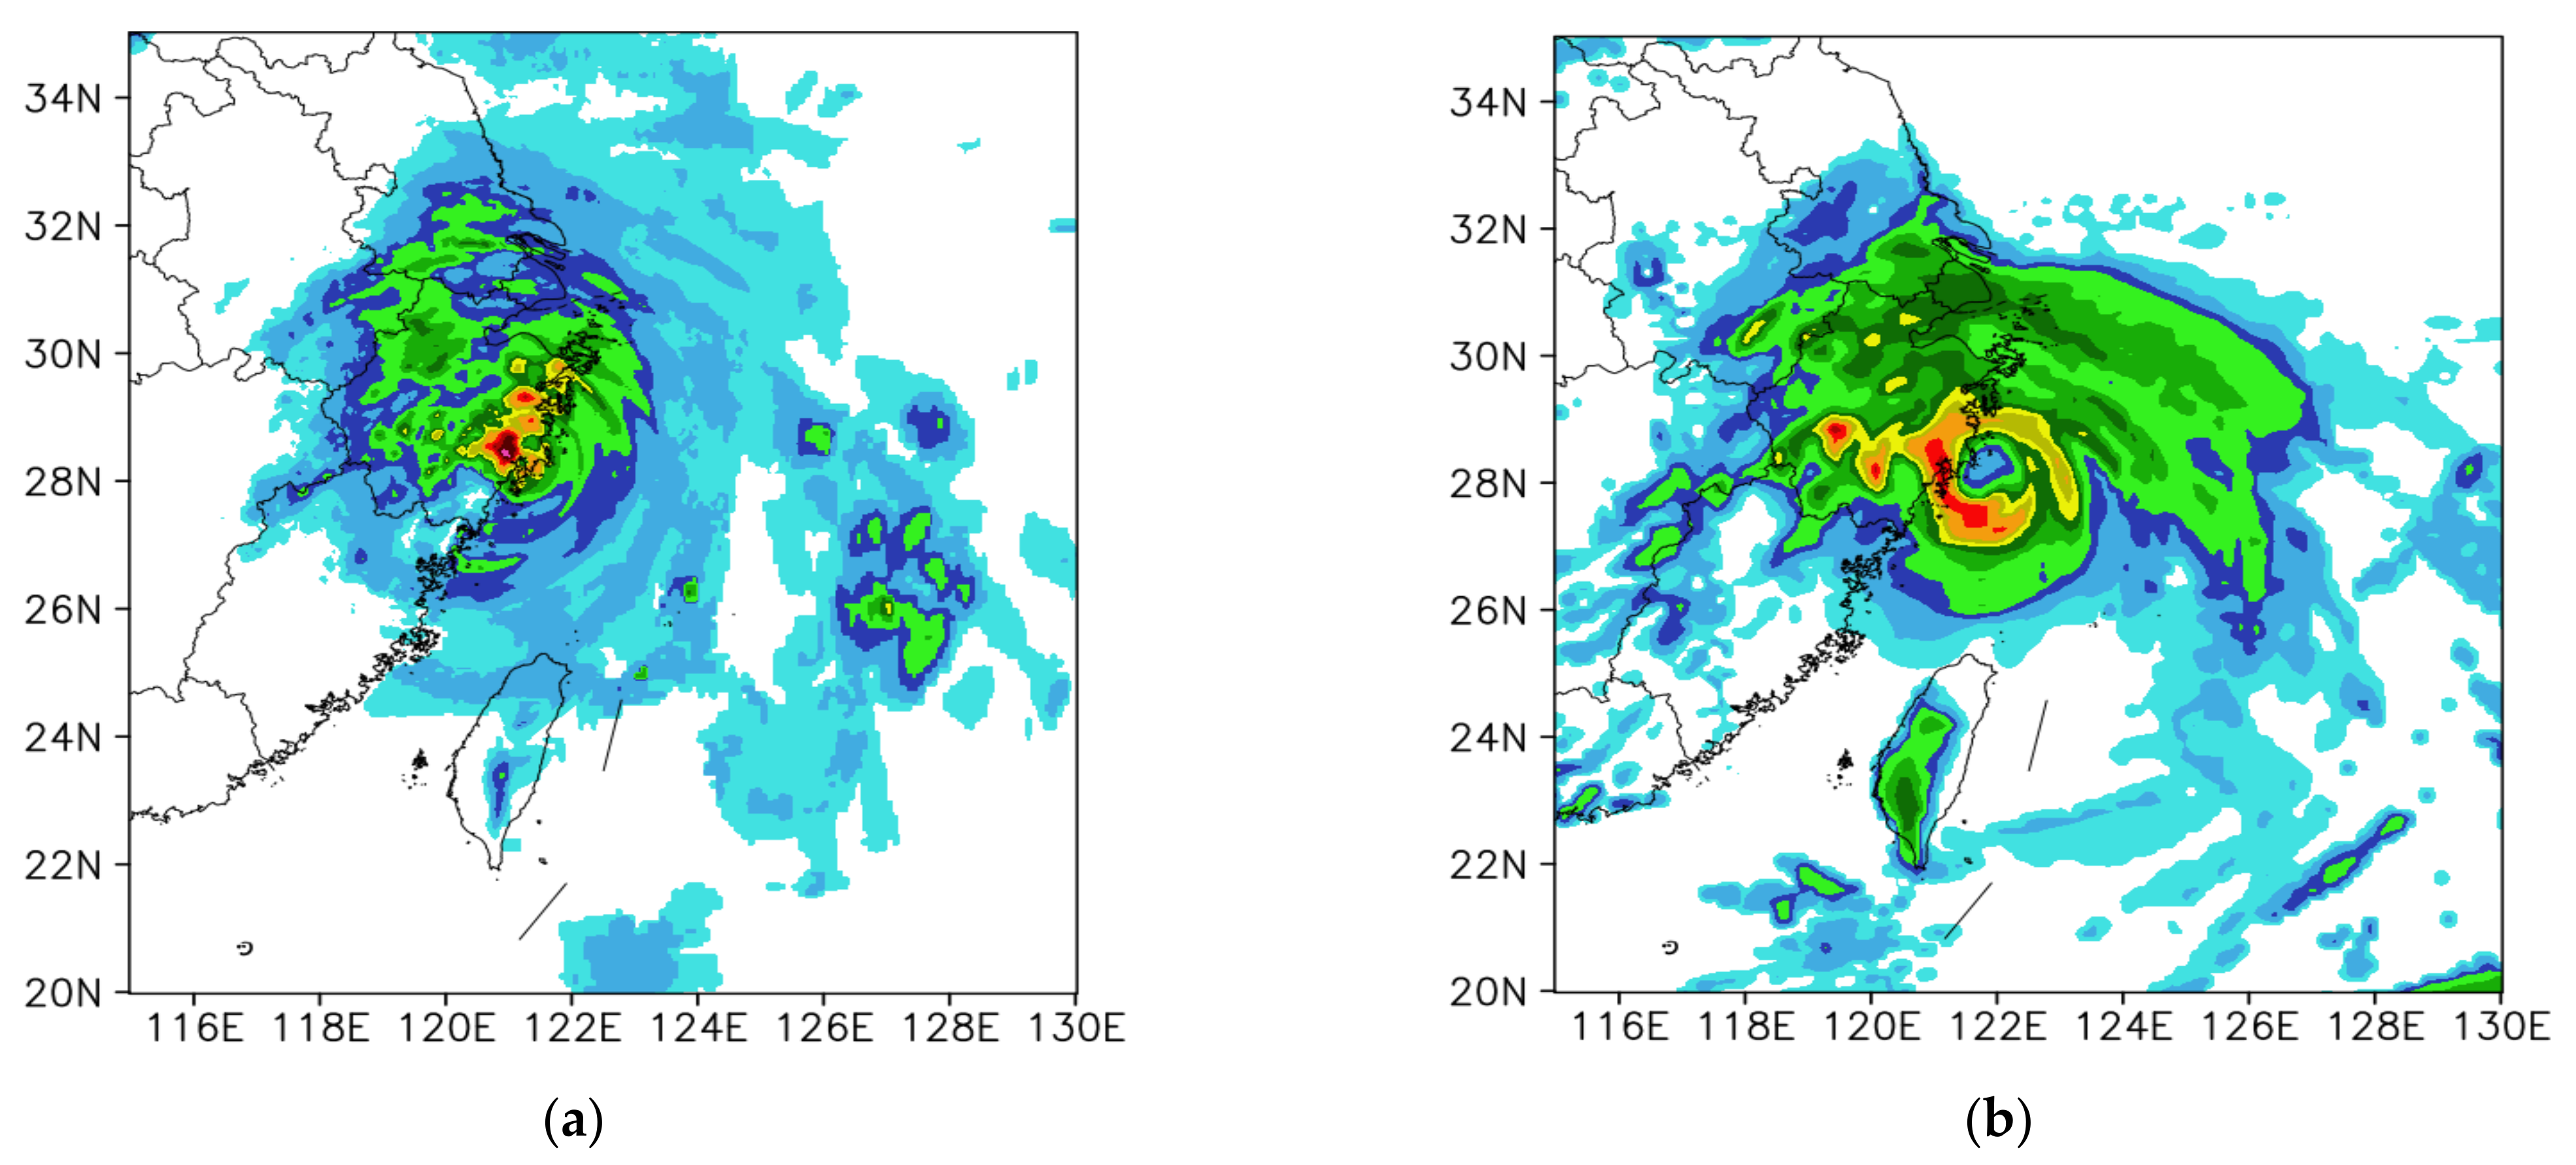
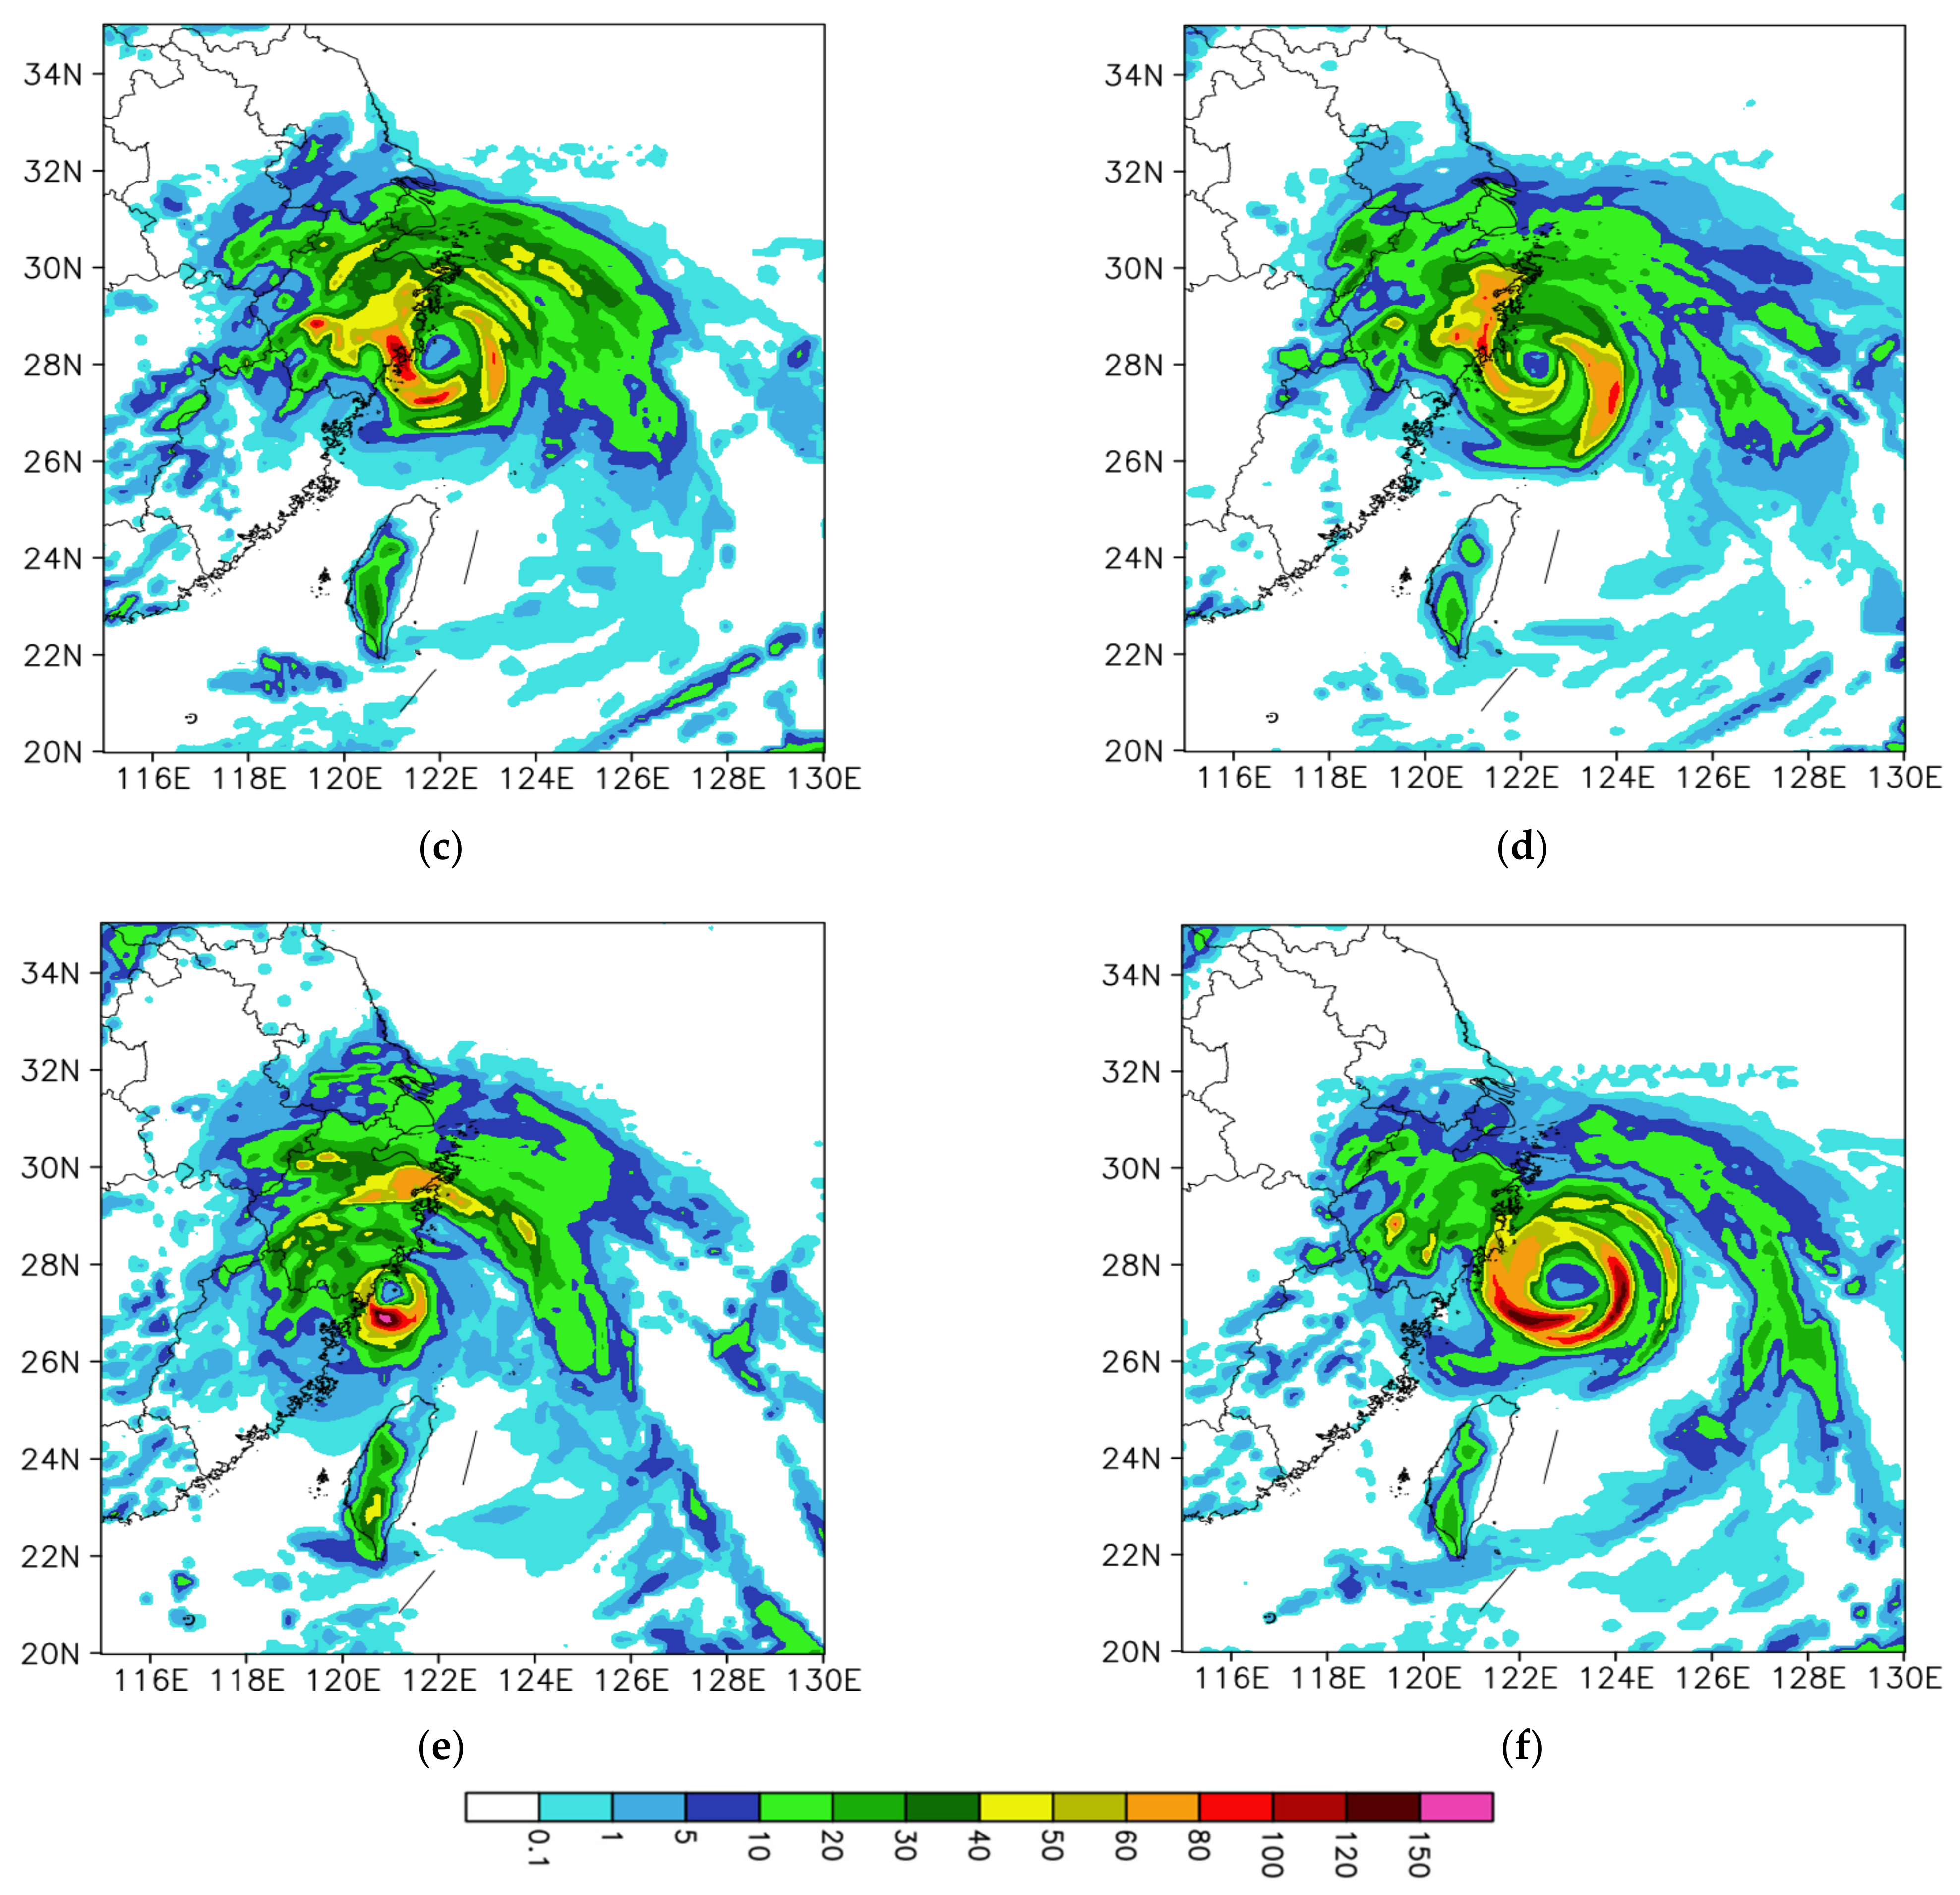
5.4. Impact on Rainfall Forecasts

To better present the impact of assimilating GEOMS radiances on precipitation prediction ability, three different verification metrics were applied. The first metric is the threat score (TS, also known as the critical success index), which measures the fraction of observing and/or forecasting events that are correctly predicted. TS ranges between 1 and 0, and a perfect score is 1. The second metric is the equitable threat score (ETS, also commonly known as the Gilbert skill score), which measures the fraction of observing events that are correctly predicted, which is adjusted for the frequency of hits that is expected to occur simply by random chance. The ETS ranges between –1/3 and 1, with negative or zero values indicating no skill, and 1 indicating a perfect score [88]. The third verification metric is a neighborhood verification method that is called the fractions skill score (FSS). FSS ranges from 0 to 1, with 1 representing complete overlap and 0 representing no overlap between forecasting and observing events, respectively [68,89]. Both TS and ETS are rainfall quantity scores, whereas FSS represents a location score (an alternative, concise method would be to use the structure, amplitude, and location (SAL) method of Wernly et al. [90]). A 30 km influence distance of the neighborhood was used in this study.
Figure 13 presents the rainfall forecast skill score as a function of lead time for every 3-h period of accumulated precipitation. CDA-2 and CDA-3 are comparable and show the best results. However, the former gives substantially better results than the latter run in the first 15 h of the lead time, and the former becomes worse than the latter afterwards. NDA generated the lowest scores, and CDA-1 was slightly better than NDA, except between 12 h and 18 h, during which the improvement was reduced. Figure 14 displays the TS, ETS, and FSS as a function of the threshold for 24 h of accumulated precipitation, respectively. Larger improvements in the rainfall forecast between 5 and 30 mm and in the rainfall forecast between 70 and 120 mm were observed in CDA-2 and CDA-3. Furthermore, the scores of CDA-1 and SDA are comparable with NDA and show an advantage at rainfalls greater than 40 mm. However, the improvements due to assimilating GEOMS radiance data become small for thresholds exceeding 120 mm, which may be influenced by the model error, lending to an overestimation of the final rainfall.
Figure 15 displays 12 h of accumulated precipitation for the five experiments (Figure 15b–f) initialized at 0000 UTC 8 August 2019, compared with the observed rainfall (Figure 15a). All the experiments captured the main coverage of the rainfall pattern, although the rainfall amounts were overpredicted, especially for NDA. CDA-3 and CDA-2 produced the best results in terms of the coverage. The performance of CDA-1 and SDA followed in sequence, although the former has few advantages over the latter in term of coverage accuracy. Figure 16 displays 3 h of accumulated precipitation for the five experiments (Figure 16b–f) initialized at 1800 UTC 9 August 2019 after the landfall of Lekima, compared with the observed rainfall (Figure 16a). It can be seen that CDA-2 and CDA-3 well captured the main coverage of the maximum rainfall over the coast area, and CDA-3 shows a better maximum pattern. CDA-1 underestimated the maximum rainfall compared with the observations. SDA and NDA almost misplaced the maximum center of the rainfall, and NDA significantly overestimated the rainfall over the offshore area.
Figure 17 presents the analyzed water vapor mixed ratio at 0000 UTC 6 August 2019. CDA-2 and CDA-3, among all experiments, most closely approach the ERA-5, indicating that the better results are due to a higher radiance resolution and calibration accuracy when assimilating the water vapor radiances. Better simulation of the water vapor led to better rainfall forecast results and perhaps, due to the physical balance in the model, improved typhoon intensity and track prediction.
It is also important to evaluate the water vapor flux, which denotes the magnitude and direction of the water vapor transport, since it has a significant impact on the maintenance and development of the rainfall weather system. The water vapor flux is denoted by Vq/g on isobaric levels, where q represents the specific humidity, V the wind vector, and g the gravitational acceleration [58]. Figure 18a–e display the differences between the ERA-5 and the 24 h water vapor flux forecast initialized at 0000 UTC 6 August 2019 at 850 hPa in the different experiments. Although similar directions of the water vapor flux in the five experiments were found, CDA-2 and CDA-3 produced weaker results than the others, which may have helped reduce the overprediction of the typhoon rainfall. The magnitude and coverage of water vapor flux around the center and southwestern area of the typhoon was significantly overpredicted in SDA and NDA, which may not favor any improvement in rainfall forecast. We can also conclude from Figure 17 and Figure 18 that the rapidly updated cycling assimilation of the GEOMS water vapor radiances with higher resolution and calibration accuracy produces better results, which may be due to the improved continuous adjusting of water vapor information in the model.

6. Conclusions

Sounding the atmosphere state using a microwave sensor onboard a geostationary satellite can contribute to a high observation resolution in terms of space and time in the microwave spectrum, which partially penetrates the cloud and rain area, providing temporally continuous and spatially wide-coverage observations in a uniform distribution for a high-impact weather system. This study firstly provides preliminary results regarding the potential assimilation impact of microwave sounder radiances at a 183 GHz water vapor band onboard a future geostationary satellite on typhoon prediction. To assimilate the simulated GEOMS radiance data, the Weather Research and Forecasting (WRF) model’s data assimilation (WRFDA) system was further developed in this study. In order to examine whether the very frequent-update microwave radiances can be beneficial to typhoon prediction using a mesoscale numerical model, observing system simulation experiments (OSSEs) were conducted using the hybrid EnVar data assimilation method.
The single GEOMS radiance test, which assimilated a single radiance observation of the 183 GHz water vapor band, indicated the characteristics of multi-variable correlations and flow dependence due to the observation operator and ensemble background error covariance of the hybrid EnVar data assimilation, presented by humidity, temperature, and wind field increments. The added value of assimilating GEOMS radiances in analyses and forecasts of Typhoon Lekima over the western north Pacific was evaluated. It was found, via verification against the ERA-5 data, that both analysis and forecast errors in terms of humidity, wind, and temperature were reduced after assimilating GEOMS radiance data. General positive assimilating impacts on typhoon track and intensity forecast during the early stages, before 68 h, were found in the OSSE experiments. However, GEOMS data assimilations did not significantly impact typhoon track or intensity in the later forecast range, after 68 h. This may be due to the model error and a lack of detailed typhoon structure information, which can be provided by radar (i.e., reflectivity or radial wind). Combining radar and geostationary satellite observations in the model may overcome this problem in future studies. Furthermore, rainfall forecast improvements were also found due to the assimilation impact of GEOMS radiances. It can be concluded that the microwave humidity sounder onboard a geostationary satellite provides a possibility to frequently (hourly in this study) assimilate wide-ranging microwave satellite information into a regional model at a finer resolution, which can potentially help to improve NWP.

7. Discussions

Since this study focuses on microwave water vapor radiance, the impact of humidity information on typhoon rainfall forecast and how it works have been discussed in detail. How the assimilation of humidity radiance influences temperature and wind fields was presented through the single radiance observation test. The large-scale RMSE values of humidity, temperature, and wind variables were reduced based on verification against the ERA-5 data. This improved typhoon intensity and track forecasts in the early stages and improved rainfall forecasts, due to the physical balance between multiple variables in the model. The improvement is limited due to other factors, such as the lateral boundary condition, physical parameterizations, the model error, the model domain and resolution, and the lack of radar observations. The typhoon structure in terms of temperature was not significantly improved in this study, perhaps because we only assimilated the humidity radiances. It would be also interesting to compare the assimilation of geostationary infrared radiances with microwave radiance in future work. In this first attempt, we used the hybrid 3DEnVar technique to assimilate GEOMS radiances using the WRF model. In the future, more complicated and advanced data assimilation methods (e.g., the hybrid four-dimensional ensemble–variational or hybrid ensemble four-dimensional variational methods) can be used to assimilate more frequent GEOMS radiance data to further improve the results. To improve performance in clear-sky areas and in cloudy and rainy areas, all-sky GEOMS radiance data assimilation will also be investigated.
In this study, the SDA experiment which assimilated radiances every 6 h as an assimilation baseline was designed to better show the impact of the hourly cycling assimilation of GEOMS radiances (i.e., 1 h vs. 6 h). Therefore, compared with previous studies, which assimilated microwave radiances for typhoon prediction limited by a low observation frequency, our study explored the potential impact of the rapidly updated assimilation of microwave radiances onboard a geostationary satellite. Another important conclusion is that the higher calibration accuracy (0.3 K vs. 0.5 K) and the finer radiance resolution (15 km vs. 30 km) of the GEOMS radiance observation also contribute to the improved results. It was also found that the GEOMS radiances with a relatively low resolution (30 km in this study) and calibration accuracy (0.5 K in this study) can achieve a better result through rapidly updated cycling assimilation compared to an experiment without GEOMS data assimilation or continuous data assimilation, which is due to the positive accumulated effect over time in the cycling forecast–analysis procedure. However, whether to be 0.3 K or 0.5 K or to be 15 km or 30 km are realistic choices with which the GEOMS designers are confronted. The GEOMS radiance resolution can be influenced by the antenna size because geostationary orbit altitudes are about 45 times larger than polar orbit altitudes. The final choice of those configurations in the design may be based on a tradeoff between budget and practical operational requirements, which are influenced by the complex relations between science benefits and project funds.

Author Contributions

Writing—original draft: Y.W. and J.H.; writing—review and editing: Y.C. and J.M. All authors have read and agreed to the published version of the manuscript.

Funding

This work is jointly sponsored by the National Key Research and Development Program of China (2017YFC1502102), the National Natural Science Foundation of China (42075148 and 41875129).

Data Availability Statement

The data used to support the findings of this study are available from the corresponding author upon request.

Acknowledgments

The authors thank editors and anonymous reviewers for their constructive comments and useful suggestions that significantly improved the manuscript. The authors also thank ECMWF for providing the ERA-5 reanalysis data and NCEP for sharing the GFS data. Authors also thank the NCAR for sharing the WRF and WRFDA codes.

Conflicts of Interest

The authors declare no conflict of interest.

References

  1. Derber, J.C.; Wu, W.S. The use of TOVS cloud-cleared radiance in the NCEP SSI analysis system. Mon. Weather Rev. 1998, 126, 2287–2299. [Google Scholar] [CrossRef]
  2. Prunet, P.; Thépaut, J.N.; Cassé, V.; Pailleux, J.; Baverez, A.; Cardinali, C. Strategies for the assimilation of new satellite measurements at Météo-France. Adv. Space Res. 2000, 25, 1073–1076. [Google Scholar] [CrossRef]
  3. McNally, T. The use of satellite data in polar regions. In Proceedings ECMWF Seminar on Polar Meteorology; ECMWF: Reading, UK, 2007; pp. 103–114. [Google Scholar]
  4. Hilton, F.; Atkinson, N.C.; English, S.J.; Eyre, J.R. Assimilation of IASI at the Met Office and assessment of its impact through observing system experiments. Q. J. R. Meteorol. Soc. 2009, 135, 495–505. [Google Scholar] [CrossRef]
  5. Rennie, M.P. The impact of GPS radio occultation assimilation at the Met Office. Q. J. R. Meteorol. Soc. 2010, 136, 116–131. [Google Scholar] [CrossRef]
  6. Bauer, P.; Auligné, T.; Bell, W.; Geer, A.; Guidard, V.; Heilliette, S.; Kazumori, M.; Kim, M.J.; Liu, H.-C.; McNally, A.P.; et al. Satellite cloud and precipitation assimilation at operational NWP centres. Q. J. R. Meteorol. Soc. 2011, 137, 1934–1951. [Google Scholar] [CrossRef] [Green Version]
  7. Kazumori, M. Satellite radiance assimilation in the JMA operational mesoscale 4DVAR system. Mon. Weather Rev. 2014, 142, 1361–1381. [Google Scholar] [CrossRef]
  8. Buehner, M.; Caya, A.; Carrieres, T.; Pogson, L. Assimilation of SSMIS and ASCAT data and the replacement of highly uncertain estimates in the Environment Canada Regional Ice Prediction System. Q. J. R. Meteorol. Soc. 2016, 142, 562–573. [Google Scholar] [CrossRef]
  9. Bauer, P.; Geer, A.J.; Lopez, P.; Salmond, D. Direct 4D-Var assimilation of all-sky radiance. Part I: Implementation. Q. J. R. Meteorol. Soc. 2010, 136, 1868–1885. [Google Scholar] [CrossRef]
  10. Zapotocny, T.H.; Jung, J.A.; Le Marshall, J.F.; Treadon, R.E. A two-season impact study of satellite and in situ data in the NCEP Global Data Assimilation System. Weather Forecast. 2007, 22, 887–909. [Google Scholar] [CrossRef] [Green Version]
  11. Bennartz, R.; Bauer, P. Sensitivity of microwave radiances at 85-183 GHz to precipitating ice particles. Radio Sci. 2003, 38, 8075. [Google Scholar] [CrossRef]
  12. Weng, F.; Zhao, L.; Ferraro, R.R.; Poe, G.; Li, X.; Grody, N.C. Advanced microwave sounding unit cloud and precipitation algorithms. Radio Sci. 2003, 38, 8068. [Google Scholar] [CrossRef]
  13. Hong, G.; Heygster, G.; Miao, J.; Kunzi, K. Detection of tropical deep convective clouds from AMSU-B water vapor channels measurements. J. Geophys. Res. Atmos. 2005, 110. [Google Scholar] [CrossRef] [Green Version]
  14. Rysman, J.F.; Claud, C.; Chaboureau, J.P.; Delanoë, J.; Funatsu, B.M. Severe convection in the Mediterranean from microwave observations and a convection-permitting model. Q. J. R. Meteorol. Soc. 2016, 142, 43–55. [Google Scholar] [CrossRef] [Green Version]
  15. Funatsu, B.M.; Rysman, J.F.; Claud, C.; Chaboureau, J.P. Deep convective clouds distribution over the Mediterranean region from AMSU-B/MHS observations. Atmos. Res. 2018, 207, 122–135. [Google Scholar] [CrossRef]
  16. Ferraro, R.R.; Weng, F.; Grody, N.C.; Zhao, L.; Meng, H.; Kongoli, C.; Pellegrino, P.; Qiu, S.; Dean, C. NOAA operational hydrological products derived from the advanced microwave sounding unit. IEEE Trans. Geosci. Remote 2005, 43, 1036–1049. [Google Scholar] [CrossRef]
  17. Ferraro, R.; Beauchamp, J.; Cecil, D.; Heymsfield, G. A prototype hail detection algorithm and hail climatology developed with the Advanced Microwave Sounding Unit (AMSU). Atmos. Res. 2015, 163, 24–35. [Google Scholar] [CrossRef] [Green Version]
  18. Edel, L.; Rysman, J.F.; Claud, C.; Palerme, C.; Genthon, C. Potential of passive microwave around 183 GHz for snowfall detection in the Arctic. Remote Sens. 2019, 11, 2200. [Google Scholar] [CrossRef] [Green Version]
  19. Claud, C.; Alhammoud, B.; Funatsu, B.M.; Lebeaupin Brossier, C.; Chaboureau, J.P.; Béranger, K.; Drobinski, P. A high resolution climatology of precipitation and deep convection over the Mediterranean region from operational satellite microwave data: Development and application to the evaluation of model uncertainties. Nat. Hazard Earth Syst. Sci. 2012, 12, 785–798. [Google Scholar] [CrossRef] [Green Version]
  20. Rysman, J.F.; Berthou, S.; Claud, C.; Drobinski, P.; Chaboureau, J.P.; Delanoë, J. Potential of microwave observations for the evaluation of rainfall and convection in a regional climate model in the frame of HyMeX and MED-CORDEX. Clim. Dyn. 2018, 51, 837–855. [Google Scholar] [CrossRef] [Green Version]
  21. Claud, C.; Alhammoud, B.; Funatsu, B.M.; Chaboureau, J.P. Mediterranean hurricanes: Large-scale environment and convective and precipitating areas from satellite microwave observations. Nat. Hazard Earth Syst. Sci. 2010, 10, 2199–2213. [Google Scholar] [CrossRef]
  22. Jones, A.S.; Vukićević, T.; Vonder Haar, T.H. A microwave satellite observational operator for variational data assimilation of soil moisture. J. Hydrometeorol. 2004, 5, 213–229. [Google Scholar] [CrossRef]
  23. Durand, M.; Kim, E.J.; Margulis, S.A. Quantifying uncertainty in modeling snow microwave radiance for a mountain snowpack at the point-scale, including stratigraphic effects. IEEE Trans. Geosci. Remote Sens. 2008, 46, 1753–1767. [Google Scholar] [CrossRef]
  24. Dechant, C.; Moradkhani, H. Radiance data assimilation for operational snow and streamflow forecasting. Adv. Water Resour. 2011, 34, 351–364. [Google Scholar] [CrossRef]
  25. Zou, X.; Qin, Z.; Weng, F. Improved quantitative precipitation forecasts by MHS radiance data assimilation with a newly added cloud detection algorithm. Mon. Weather Rev. 2013, 141, 3203–3221. [Google Scholar] [CrossRef]
  26. Che, T.; Li, X.; Jin, R.; Huang, C. Assimilating passive microwave remote sensing data into a land surface model to improve the estimation of snow depth. Remote Sens. Environ. 2014, 143, 54–63. [Google Scholar] [CrossRef]
  27. Xie, Y.; Xing, J.; Shi, J.; Dou, Y.; Lei, Y. Impacts of radiance data assimilation on the Beijing 7.21 heavy rainfall. Atmos. Res. 2016, 169, 318–330. [Google Scholar] [CrossRef]
  28. Kwon, Y.; Yang, Z.L.; Zhao, L.; Hoar, T.J.; Toure, A.M.; Rodell, M. Estimating snow water storage in North America using CLM4, DART, and snow radiance data assimilation. J. Hydrometeor. 2016, 17, 2853–2874. [Google Scholar] [CrossRef]
  29. Shen, F.; Xu, D.; Li, H.; Min, J.; Liu, R. Assimilation of GPM Microwave Imager Radiance data with the WRF hybrid 3DEnVar system for the prediction of Typhoon Chan-hom (2015). Atmos. Res. 2021, 251, 105422. [Google Scholar] [CrossRef]
  30. Wang, J.; Zhang, L.; Guan, J.; Zhang, M. Comparison of assimilating all-sky and clear-sky satellite radiance for Typhoon Chan-Hom and Nangka forecasts. Atmosphere 2020, 11, 599. [Google Scholar] [CrossRef]
  31. Kim, M.J.; Jin, J.; El Akkraoui, A.; McCarty, W.; Todling, R.; Gu, W.; Gelaro, R. The Framework for Assimilating All-Sky GPM Microwave Imager Brightness Temperature Data in the NASA GEOS Data Assimilation System. Mon. Weather Rev. 2020, 148, 2433–2455. [Google Scholar] [CrossRef] [Green Version]
  32. Zhu, T.; Zhang, D.L.; Weng, F. Impact of the Advanced Microwave Sounding Unit measurements on hurricane prediction. Mon. Weather Rev. 2002, 130, 2416–2432. [Google Scholar] [CrossRef]
  33. Zhao, Y.; Wang, B.; Ji, Z.; Liang, X.; Deng, G.; Zhang, X. Improved track forecasting of a typhoon reaching landfall from four-dimensional variational data assimilation of AMSU-A retrieved data. J. Geophys. Res. Atmos. 2005, 110. [Google Scholar] [CrossRef]
  34. Deng, G.; Zhang, D.; Zhu, T.; Wang, A. Use of the advanced microwave sounding unit data to improve typhoon prediction. Prog. Nat. Sci. 2009, 19, 369–376. [Google Scholar] [CrossRef]
  35. Zhang, D.L.; Chen, H. Importance of the upper-level warm core in the rapid intensification of a tropical cyclone. Geophys. Res. Lett. 2012, 39, L02806. [Google Scholar] [CrossRef] [Green Version]
  36. Shen, F.; Min, J. Assimilating AMSU-a radiance data with the WRF hybrid En3DVAR system for track predictions of Typhoon Megi (2010). Adv. Atmos. Sci. 2015, 32, 1231–1243. [Google Scholar] [CrossRef]
  37. Tian, X.; Zou, X. ATMS-and AMSU-A-derived hurricane warm core structures using a modified retrieval algorithm. J. Geophys. Res. Atmos. 2016, 121, 12630–12646. [Google Scholar] [CrossRef] [Green Version]
  38. Liu, Z.; Schwartz, C.S.; Snyder, C.; Ha, S.Y. Impact of assimilating AMSU-A radiances on forecasts of 2008 Atlantic tropical cyclones initialized with a limited-area ensemble Kalman filter. Mon. Weather Rev. 2012, 140, 4017–4034. [Google Scholar] [CrossRef] [Green Version]
  39. Li, J.; Liu, H. Improved hurricane track and intensity forecast using single field-of-view advanced IR sounding measurements. Geophys. Res. Lett. 2009, 36, L11813. [Google Scholar] [CrossRef]
  40. Schwartz, C.S.; Liu, Z.; Chen, Y.; Huang, X.-Y. Impact of assimilating microwave radiances with a limited-area ensemble data assimilation system on forecasts of Typhoon Morakot. Weather Forecast. 2012, 27, 424–437. [Google Scholar] [CrossRef]
  41. Xu, D.; Liu, Z.; Huang, X.-Y.; Min, J.; Wang, H. Impact of assimilating IASI radiance observations on forecasts of two tropical cyclones. Meteorol. Atmos. Phys. 2013, 122, 1–18. [Google Scholar] [CrossRef] [Green Version]
  42. Jung, J.A.; Zapotocny, T.H.; Le Marshall, J.F.; Treadon, R.E. A two-season impact study on NOAA polar-orbiting satellites in the NCEP Global Data Assimilation System. Weather Forecast. 2008, 23, 854–877. [Google Scholar] [CrossRef]
  43. Xu, D.; Huang, X.-Y.; Liu, Z.; Min, J. Impact of Assimilating Radiances with the WRFDA ETKF/3DVAR Hybrid System on the Prediction of Two Typhoons (2012). J. Meteorol. Res. 2015, 29, 28–40. [Google Scholar] [CrossRef]
  44. Li, X.; Zou, X. Bias characterization of CrIS radiances at 399 selected channels with respect to NWP model simulations. Atmos. Res. 2017, 196, 164–181. [Google Scholar] [CrossRef]
  45. Montmerle, T.; Rabier, F.; Fischer, C. Relative impact of polar-orbiting and geostationary satellite radiance in the Aladin/France numerical weather prediction system. Q. J. R. Meteorol. Soc. 2007, 133, 655–671. [Google Scholar] [CrossRef]
  46. Stengel, M.; Undén, P.; Lindskog, M.; Dahlgren, P.; Gustafsson, N.; Bennartz, R. Assimilation of SEVIRI infrared radiance with HIRLAM 4D-Var. Q. J. R. Meteorol. Soc. 2009, 135, 2100–2109. [Google Scholar] [CrossRef]
  47. Zou, X.; Qin, Z.; Weng, F. Improved coastal precipitation forecasts with direct assimilation of GOES-11/12 imager radiance. Mon. Weather Rev. 2011, 139, 3711–3729. [Google Scholar] [CrossRef] [Green Version]
  48. Zhang, H.; Xue, J.; Zhu, G.; Zhuang, S.; Wu, X.; Zhang, F. Application of direct assimilation of ATOVS microwave radiances to typhoon track prediction. Adv. Atmos. Sci. 2004, 21, 283–290. [Google Scholar] [CrossRef]
  49. Choi, Y.; Cha, D.H.; Lee, M.I.; Kim, J.; Jin, C.S.; Park, S.H.; Joh, M.S. Satellite radiance data assimilation for binary tropical cyclone cases over the western North Pacific. J. Adv. Model. Earth Syst. 2017, 9, 832–853. [Google Scholar] [CrossRef] [Green Version]
  50. Singh, K.S.; Mandal, M.; Bhaskaran, P.K. Impact of radiance data assimilation on the prediction performance of cyclonic storm SIDR using WRF-3DVAR modelling system. Meteorol. Atmos. Phys. 2019, 131, 11–28. [Google Scholar] [CrossRef]
  51. Xu, D.; Shu, A.; Shen, F. Effects of Clear-Sky Assimilation of GPM Microwave Imager on the Analysis and Forecast of Typhoon “Chan-Hom”. Sensors 2020, 20, 2674. [Google Scholar] [CrossRef]
  52. Gasiewski, A.J.; Voronovich, A.; Weber, B.L.; Stankov, B.; Klein, M.; Hill, R.J.; Bao, J.W. Geosynchronous microwave (GEM) sounder/imager observation system simulation. In Geoscience and Remote Sensing Symposium, IGARSS, Proceedings; IEEE: Toulouse, France, 2003; Volume 2, pp. 1209–1211. [Google Scholar] [CrossRef]
  53. Duruisseau, F.; Chambon, P.; Guedj, S.; Guidard, V.; Fourrié, N.; Taillefer, F.; Brousseau, P.; Mahfouf, J.F.; Roca, R. Investigating the potential benefit to a mesoscale NWP model of a microwave sounder on board a geostationary satellite. Q. J. R. Meteorol. Soc. 2017, 143, 2104–2115. [Google Scholar] [CrossRef]
  54. Prigent, C.; Pardo, J.R.; Rossow, W.B. Comparisons of the millimeter and submillimeter bands for atmospheric temperature and water vapor soundings for clear and cloudy skies. J. Appl. Meteorol. Climatol. 2006, 45, 1622–1633. [Google Scholar] [CrossRef] [Green Version]
  55. Roca, R.; Brogniez, H.; Chambon, P.; Chomette, O.; Cloch´e, S.; Gosset, M.E.; Mahfouf, J.-F.; Raberanto, P.; Viltard, N. The Megha-Tropiques mission: A review after three years in orbit. Front. Earth Sci. 2015, 3, 17. [Google Scholar] [CrossRef]
  56. Hersbach, H.; Bell, B.; Berrisford, P.; Hirahara, S.; Horányi, A.; Muñoz-Sabater, J.; Nicolas, J.; Peubey, C.; Radu, R.; Schepers, D.; et al. The ERA-5 global reanalysis. Q. J. R. Meteorol. Soc. 2020, 146, 1999–2049. [Google Scholar] [CrossRef]
  57. Ying, M.; Zhang, W.; Yu, H.; Lu, X.; Feng, J.; Fan, Y.; Zhu, Y.; Chen, D. An overview of the China Meteorological Administration tropical cyclone database. J. Atmos. Ocean. Technol. 2014, 31, 287–301. [Google Scholar] [CrossRef] [Green Version]
  58. Shen, Y.; Xiong, A.Y.; Wang, Y.; Xie, P.P. Performance of high-resolution satellite precipitation products over China. J. Geophys. Res. Atmos. 2010, 115, D02114. [Google Scholar] [CrossRef]
  59. Tsang, L.; Kong, J.A.; Shin, R.T. Theory of Microwave Remote Sensing; Wiley: Berkeley, CA, USA, 1985. [Google Scholar] [CrossRef]
  60. Gaier, T.; Kangaslahti, P.; Lambrigtsen, B.; Ramos-Perez, I.; Tanner, A.; McKague, D.; Ruf, C.; Flynn, M.; Zhang, Z.; Backhus, R.; et al. A 180 GHz prototype for a geostationary microwave imager/sounder-GeoSTAR-III. In Proceedings of the 2016 IEEE International Geoscience and Remote Sensing Symposium (IGARSS), Beijing, China, 10–15 July 2016; pp. 2021–2023. [Google Scholar] [CrossRef]
  61. Greenwald, T.J.; Christopher, S.A. Effect of cold clouds on satellite measurements near 183 GHz. J. Geophys. Res. Atmos. 2002, 107, 4170. [Google Scholar] [CrossRef] [Green Version]
  62. He, J.; Zhang, S.; Wang, Z. Advanced microwave atmospheric sounder (AMAS) channel specifications and T/V calibration results on FY-3C satellite. IEEE Geosci. Remote Sens. 2014, 53, 481–493. [Google Scholar] [CrossRef]
  63. Okamoto, K.; Owada, H.; Fujita, T.; Kazumori, M.; Otsuka, M.; Seko, H.; Ota, Y.; Uekiyo, N.; Ishimoto, H.; Hayashi, M.; et al. Assessment of the potential impact of a hyperspectral infrared sounder on the Himawari follow-on geostationary satellite. SOLA 2020, 16, 162–168. [Google Scholar] [CrossRef]
  64. He, Q.; Wang, Z.; He, J. Bias correction for retrieval of atmospheric parameters from the microwave humidity and temperature sounder onboard the Fengyun-3C satellite. Atmosphere 2016, 7, 156. [Google Scholar] [CrossRef] [Green Version]
  65. Zhang, K.; Gasiewski, A.J. Fast 3-D Inhomogeneous Radiative Transfer Model Using a Planar-Stratified Forward Algorithm and Horizontal Perturbation Series. IEEE Trans. Geosci. Remote 2020, 58, 6861–6873. [Google Scholar] [CrossRef]
  66. Yang, C.; Liu, Z.; Bresch, J.; Rizvi, S.R.; Huang, X.Y.; Min, J. AMSR2 all-sky radiance assimilation and its impact on the analysis and forecast of Hurricane Sandy with a limited-area data assimilation system. Tellus A 2016, 68, 30917. [Google Scholar] [CrossRef] [Green Version]
  67. Yang, C.; Liu, Z.; Gao, F.; Childs, P.P.; Min, J. Impact of assimilating GOES imager clear-sky radiance with a rapid refresh assimilation system for convection-permitting forecast over Mexico. J. Geophys Res. Atmos. 2017, 122, 5472–5490. [Google Scholar] [CrossRef] [Green Version]
  68. Wang, Y.; Liu, Z.; Yang, S.; Min, J.; Chen, L.; Chen, Y.; Zhang, T. Added value of assimilating Himawari-8 AHI water vapor radiances on analyses and forecasts for “7.19” severe storm over north China. J. Geophys Res. Atmos. 2018, 123, 3374–3394. [Google Scholar] [CrossRef]
  69. Barker, D.; Huang, X.-Y.; Liu, Z.; Auligné, T.; Zhang, X.; Rugg, S.; Ajjaji, R.; Bourgeois, A.; Bray, J.; Chen, Y.; et al. The weather research and forecasting (WRF) model’s community variational/ensemble data assimilation system: WRFDA. Bull. Am. Meteorol. Soc. 2012, 93, 831–843. [Google Scholar] [CrossRef] [Green Version]
  70. Wang, X.; Barer, D.M.; Snyder, C.; Hamill, T.M. A hybrid ETKF-3DVAR data assimilation scheme for the WRF model. Part I: Observing system simulation experiment. Mon. Weather Rev. 2008, 136, 5116–5131. [Google Scholar] [CrossRef] [Green Version]
  71. Parrish, D.F.; Derber, J.C. The National Meteorological Center’s spectral statistical interpolation analysis system. Mon. Weather Rev. 1992, 120, 1747–1763. [Google Scholar] [CrossRef]
  72. Dee, D.P.; Uppala, S. Variational bias correction of satellite radiance data in the ERA-Interim reanalysis. Q. J. R. Meteorol. Soc. 2009, 135, 1830–1841. [Google Scholar] [CrossRef]
  73. Zhu, Y.; Derber, J.; Collard, A.; Dee, D.; Treadon, R.; Gayno, G.; Jung, J.A. Enhanced radiance bias correction in the National Centers for Environmental Prediction’s Gridpoint Statistical Interpolation data assimilation system. Q. J. R. Meteorol. Soc. 2014, 140, 1479–1492. [Google Scholar] [CrossRef]
  74. Harris, B.A.; Kelly, G. A satellite radiance-bias correction scheme for data assimilation. Q. J. R. Meteorol. Soc. 2001, 127, 1453–1468. [Google Scholar] [CrossRef]
  75. Auligné, T.; McNally, A.P.; Dee, D.P. Adaptive bias correction for satellite data in a numerical weather prediction system. Q. J. R. Meteorol. Soc. 2007, 133, 631–642. [Google Scholar] [CrossRef]
  76. Skamarock, W.C.; Klemp, J.B.; Dudhia, J.; Gill, D.O.; Liu, Z.; Berner, J.; Wang, W.; Powers, J.G.; Duda, M.G.; Barker, D.M.; et al. A Description of the Advanced Research WRF Version 4; NCAR Tech, Note NCAR/TN-556+STR; National Center for Atmospheric Research: Boulder, CO, USA, 2019; p. 145. [Google Scholar] [CrossRef]
  77. Hong, S.Y.; Lim, J.O.J. The WRF single–moment 6–class microphysics scheme (WSM6). J. Korean Meteorol. Soc. 2006, 42, 129–151. [Google Scholar]
  78. Zhang, C.; Wang, Y.; Hamilton, K. Improved representation of boundary layer clouds over the southeast pacific in ARW–WRF using a modified Tiedtke cumulus parameterization scheme. Mon. Weather Rev. 2011, 139, 3489–3513. [Google Scholar] [CrossRef] [Green Version]
  79. Iacono, M.J.; Delamere, J.S.; Mlawer, E.J.; Shephard, M.W.; Clough, S.A.; Collins, W.D. Radiative forcing by long–lived greenhouse gases: Calculations with the AER radiative transfer models. J. Geophys. Res. 2008, 113, D13103. [Google Scholar] [CrossRef]
  80. Hong, S.Y.; Noh, Y.; Dudhia, J. A new vertical diffusion package with an explicit treatment of entrainment processes. Mon. Weather Rev. 2006, 134, 2318–2341. [Google Scholar] [CrossRef] [Green Version]
  81. Jimenez, P.A.; Dudhia, J.; Fidel Gonzalez–Rouco, J.; Navarro, J.; Montavez, J.P.; Garcia–Bustamante, E. A revised scheme for the WRF surface layer formulation. Mon. Weather Rev. 2012, 140, 898–918. [Google Scholar] [CrossRef] [Green Version]
  82. Tewari, M.; Chen, F.; Wang, W.; Dudhia, J.; LeMone, M.A.; Mitchell, K.; Ek, M.; Gayno, G.; Wegiel, J.; Cuenca, R.H. Implementation and verification of the unified NOAH land surface model in the WRF model. In Proceedings of the 20th Conference on Weather Analysis and Forecasting/16th Conference on Numerical Weather Prediction, Seattle, WA, USA, 12 January 2004; pp. 11–15. [Google Scholar]
  83. Liu, Z.Q.; Rabier, F. The interaction between model resolution, observation resolution and observation density in data assimilation: A one-dimensional study. Q. J. R. Meteorol. Soc. 2002, 128, 1367–1386. [Google Scholar] [CrossRef] [Green Version]
  84. Liu, Z.Q.; Rabier, F. The potential of high-density observations for numerical weather prediction: A study with simulated observations. Q. J. R. Meteorol. Soc. 2003, 129, 3013–3035. [Google Scholar] [CrossRef]
  85. Peckham, S.E.; Smirnova, T.G.; Benjamin, S.G.; Brown, J.M.; Kenyon, J.S. Implementation of a digital filter initialization in the WRF model and its application in the rapid refresh. Mon. Weather Rev. 2016, 144, 99–106. [Google Scholar] [CrossRef]
  86. Barker, D.M. Southern high-latitude ensemble data assimilation in the Antarctic mesoscale prediction system. Mon. Weather Rev. 2005, 133, 3431–3449. [Google Scholar] [CrossRef]
  87. Shen, F.; Min, J.; Xu, D. Assimilation of Radar radial velocity data with the WRF Hybrid ETKF-3DVAR system for the prediction of Hurricane Ike (2008). Atmos. Res. 2015, 169, 127–138. [Google Scholar] [CrossRef]
  88. Wang, C.C. On the calculation and correction of equitable threat score for model quantitative precipitation forecasts for small verification areas: The example of Taiwan. Weather Forecast. 2014, 29, 788–798. [Google Scholar] [CrossRef]
  89. Roberts, N.M.; Lean, H.W. Scale-selective verification of rainfall accumulations from high-resolution forecasts of convective events. Mon. Weather Rev. 2008, 136, 78–97. [Google Scholar] [CrossRef]
  90. Wernli, H.; Paulat, M.; Hagen, M.; Frei, C. SAL-A novel quality measure for the verification of quantitative precipitation forecasts. Mon. Weather Rev. 2008, 136, 4470–4487. [Google Scholar] [CrossRef] [Green Version]
Figure 1. The best track of Lekima from 2100 UTC on 6 August to 0000 UTC on 10 August provided by Tropical Cyclone Data Center of China Meteorological Administration (left panel); the Himawari-8 true color image of Lekima at 0000 UTC on 6 August provided by Japan Aerospace Exploration Agency Himawari Monitor P-Tree System (right panel).
Remotesensing 13 00886 g001
Figure 2. Framework of the geostationary microwave sounder (GEOMS) radiances simulating system.
Remotesensing 13 00886 g002
Figure 3. Weighting functions distributed from surface to 30 hPa for 183 GHz.
Remotesensing 13 00886 g003
Figure 4. The scatterplots of model-calculated GEOMS versus observed radiances (K) for (a) backgrounds before bias correction, (b) backgrounds after bias correction, and (c) analyses valid at 0000 UTC 06 August 2019.
Remotesensing 13 00886 g004aRemotesensing 13 00886 g004b
Figure 5. The GEOMS brightness temperature (K): (a) simulated observation; (b) observation minus background; (c) observation minus analysis at 0000 UTC 6 August 2019.
Remotesensing 13 00886 g005
Figure 6. Experimental domain. d02 denotes the initial position of the vortex center for the typhoon moving-nested run.
Remotesensing 13 00886 g006
Figure 7. Observing system simulation experiment framework. R denotes the observation error covariance; B denotes the background error covariance.
Remotesensing 13 00886 g007
Figure 8. Flow chart of one of the hourly partially cycling data assimilation runs. FC: Forecast.
Remotesensing 13 00886 g008
Figure 9. Analysis increments at 500 hPa of (a) water vapor mixing ration (shaded; kg/kg), (b) temperature (shaded; K), and (c) x-component of wind (shaded; m/s) of the single GEOMS radiance observation test. The black solid lines represent the corresponding background variables, respectively, at analysis time 0600 UTC 8 August.
Remotesensing 13 00886 g009
Figure 10. RMSE vertical profiles of 24 h forecast verified against ERA-5 data for five experiments: (a) water vapor mixed ratio (g/Kg); (b) temperature (K); (c) zonal wind (m/s).
Remotesensing 13 00886 g010aRemotesensing 13 00886 g010b
Figure 11. The predicted (a) minimum surface level pressure (hPa) and (b) its error (hPa). The predicted (c) maximum wind speed (m/s) and (d) its error (m/s). The predicted (e) track errors and (f) track of Lekima initialized from 0000 UTC 6 August 2019. The black line in (a,c,f) represent the best track data.
Remotesensing 13 00886 g011aRemotesensing 13 00886 g011b
Figure 12. Vertical cross-sections at 23° N of the horizontal wind speed (shaded; m/s) and potential temperature (5 K, contours) for (a) hourly continuous DA (CDA(-3, (b) CDA-2, (c) CDA-1, (d) single time DA (SDA), and (e) no DA (NDA) at 0000 UTC 9 August 2019.
Remotesensing 13 00886 g012aRemotesensing 13 00886 g012b
Figure 13. Rainfall forecast score as a function of forecast lead time for (a) threat score (TS), (b) equitable threat score (ETS), and (c) fraction skill score (FSS).
Remotesensing 13 00886 g013
Figure 14. Similar to Figure 13, but for 24-h accumulated rainfall forecast scores as a function of threshold. (a) threat score (TS), (b) equitable threat score (ETS), and (c) fraction skill score (FSS).
Remotesensing 13 00886 g014
Figure 15. (a) The observed total accumulated rainfall (mm) from 0000 UTC to 1200 UTC 08 August 2019 and the corresponding forecast rainfall of the five experiments: (b) CDA-3, (c) CDA-2, (d) CDA-1, (e) SDA, and (f) NDA.
Remotesensing 13 00886 g015aRemotesensing 13 00886 g015b
Figure 16. (a) The observed total accumulated rainfall (mm) after landfall from 0200 UTC to 0500 UTC 10 August 2019 and the corresponding forecast rainfall of the five experiments: (b) CDA-3, (c) CDA-2, (d) CDA-1, (e) SDA, and (f) NDA.
Remotesensing 13 00886 g016aRemotesensing 13 00886 g016b
Figure 17. Water vapor mixing ratio (kg/kg) of the analyses at 0000 UTC 6 August 2019 at 850 hPa. (a) ERA-5, (b) CDA-3, (c) CDA-2, (d) CDA-1, (e) SDA, and (f) NDA.
Remotesensing 13 00886 g017
Figure 18. Water vapor flux difference (shaded, (kg × m/s−2)/m−2) of 24-h forecasts initialized from 0000 UTC 06 August 2019 at 850 hPa. (a) CDA-3 minus ERA-5, (b) CDA-2 minus ERA-5, (c) CDA-1 minus ERA-5, (d) SDA minus ERA-5, and (e) NDA minus ERA-5.
Remotesensing 13 00886 g018aRemotesensing 13 00886 g018b
Table 1. Summary of the used physics parameterizations.
Physics Options Physics Schemes
Micro Physics Option WRF Single-Moment 6-Class Scheme
Cumulus Parameterization Option Tiedtke Scheme
Radiation Shortwave Physics Option Rapid Radiative Transfer Model Shortwave Scheme
Radiation Longwave Physics Option Rapid Radiative Transfer Model Longwave Scheme
Planetary Boundary Layer Physics Option Yonsei University Scheme
Surface Layer Physics Option Revised MM5 Scheme
Land Surface Physics Option Unified Noah Land Surface Model Scheme
Table 2. Details description of five experiments.
ExperimentDA SchemeRadiance ResolutionCalibration Accuracy
1NDANo DA\\
2SDASingle time DA30 km0.5 K
3CDA-1Hourly Continuous DA30 km0.5 K
4CDA-2Hourly Continuous DA15 km0.5 K
5CDA-3Hourly Continuous DA15 km0.3 K
Table 3. The humidity root mean squared error (RMSE) (g/kg) of 24 h forecasts verified against ERA-5 data at different levels (hPa).
1000925850700500400300250200
NDA1.11.4551.421.0810.8830.5510.2480.1210.041
SDA1.0181.4151.4081.0860.8460.5470.250.1250.04
CDA-10.9021.3851.3771.0540.8140.5380.2550.1240.027
CDA-20.7671.3131.2881.0090.740.530.2590.1290.038
CDA-30.7741.311.281.0050.7370.5020.2490.1210.037
Table 4. The temperature RMSE (K) of 24 h forecasts verified against ERA-5 data at different levels (hPa).
100092585070050040030025020015010070
NDA0.720.7730.80.6150.6420.6610.70.6030.6330.7711.5111.61
SDA0.7660.8080.7940.6220.6660.6360.6910.5730.6230.7561.4561.631
CDA-10.6770.720.750.6080.650.6240.6880.5640.5980.7111.5461.6
CDA-20.6070.6270.6820.6360.60.520.6410.5530.6080.7311.551.418
CDA-30.6110.6290.690.6120.5730.5290.5880.5220.5620.7081.5881.5
Table 5. The zonal wind RMSE (m/s) of 24 h forecasts verified against ERA-5 data at different levels (hPa).
100092585070050040030025020015010070
NDA1.2433.3293.5662.8653.3653.9034.344.9155.6125.6934.9893.82
SDA1.1573.2343.522.9073.4093.7394.2584.8585.2535.335.2223.629
CDA-11.33.13.4422.6973.23.7394.1984.755.0755.2985.3443.786
CDA-20.9052.8893.3992.8053.3243.5483.9824.3965.0755.3684.9573.712
CDA-30.8562.813.352.83.1313.3733.7084.2764.9985.0825.2783.731
Table 6. The average error of minimum sea level pressure (MSLP), maximum wind speed (MWS), and track, respectively.
NDASDACDA-1CDA-2CDA-3
MSLP Error (mb)9.829.106.635.935.72
MWS Error (m/s)42.1041.4539.8238.8738.66
Track Error (km)125.33113.01110.14110.04108.60
Publisher’s Note: MDPI stays neutral with regard to jurisdictional claims in published maps and institutional affiliations.

