Article

A Climate Hyperspectral Infrared Radiance Product (CHIRP) Combining the AIRS and CrIS Satellite Sounding Record

by
L. Larrabee Strow
1,2,*,†,
Chris Hepplewhite
2,†,
Howard Motteler
2,†,
Steven Buczkowski
2,† and
Sergio DeSouza-Machado
1,2,†
1
Physics Department, University of Maryland Baltimore County (UMBC), Baltimore, MD 21250, USA
2
Joint Center for Earth Systems Technology (JCET), University of Maryland Baltimore County (UMBC), Baltimore, MD 21250, USA
*
Author to whom correspondence should be addressed.
These authors contributed equally to this work.
Remote Sens. 2021, 13(3), 418; https://doi.org/10.3390/rs13030418
Submission received: 10 December 2020 / Revised: 13 January 2021 / Accepted: 19 January 2021 / Published: 26 January 2021

Abstract

:
A Climate Hyperspectral Infrared Radiance Product (CHIRP) is introduced combining data from the Atmospheric Infrared Sounder (AIRS) on NASA’s EOS-AQUA platform, the Cross-Track Infrared Sounder (CrIS) sounder on NASA’s SNPP platform, and continuing with CRIS sounders on the NOAA/NASA Joint Polar Satellite Series (JPSS) of polar satellites. The CHIRP product converts the parent instrument’s radiances to a common Spectral Response Function (SRF) and removes inter-satellite biases, providing a consistent inter-satellite radiance record. The CHIRP record starts in September 2002 with AIRS, followed by CrIS SNPP and the JPSS series of CrIS instruments. The CHIRP record should continue until the mid-2040’s as additional JPSS satellites are launched. These sensors, in CHIRP format, provide the climate community with a homogeneous sensor record covering much of the infrared. We give an overview of the conversion of AIRS and CrIS to CHIRP, and define the SRF for common CHIRP format. Considerable attention is paid to removing static bias offsets among these three sensors. The CrIS instrument on NASA’s SNPP satellite is used as the calibration standard. Simultaneous Nadir Overpasses (SNOs) as well as large statistical samplings of radiances from these three satellites are used to derive the instrument bias offsets and estimate the bias offset accuracy, which is ~0.03 K. In addition, possible scene-dependent calibration differences between CHIRP derived from AIRS and CHIRP derived from CrIS on the SNPP platform are presented.

Graphical Abstract

1. Introduction

Continuous hyperspectral satellite measurements of the earth’s up-welling infrared radiance spectrum started in 2002 with the The Atmospheric Infrared Sounder (AIRS) on NASA’s AQUA satellite platform [1] flying in a sun-synchronous polar orbit with a 13:30 ascending node equator crossing time. NOAA operational high-spectral resolution soundings started with the CrIS sounder series in 2012 first flying on NASA’s SNPP platform [2], followed by the NOAA/NASA Joint Polar Satellite System (JPSS) JPSS-1 CrIS in 2018. Three more JPSS CrIS sensors are under construction that should operate well past 2040. EUMETSAT introduced the Infrared Atmospheric Sounding Interferometer (IASI) hyperspectral infrared sounder [3] in 2007 on METOP-1, flying in the 21:30 ascending node equator crossing orbit. Two additional copies of IASI, all now operating, were launched at roughly 5-year intervals. The IASI hyperspectral infrared record will be continued with IASI-NG on EUMETSAT’s Polar System Second Generation (EPS-SG). Together these instruments will provide a long-term infrared radiance record of 40+ years that should become invaluable for climate science. All of these sensors exhibit high stability and at present the AIRS record of 18+ years is already useful for climate trending.
Conversion of hyperspectral radiances to geophysical variables generally takes two forms: (i) NWP data assimilation, and (ii) 1Dvar retrievals that invert the radiances using various techniques. Both of these approaches depend strongly on a-priori, or background, information in order to stabilize the inversions, which can subtly influence the retrieved geophysical variables, especially extremely small variations such as climate trends. In addition, changes in instrument calibration, whether due to instrument drifts, or to switching to a newer satellite, will influence a retrieved climate time series. Although the AIRS, CrIS, and IASI instruments all measure the upwelling infrared spectrum in the same nominal spectral band, they all have different spectral response functions (SRFs) that are centered on their own differing wavenumber grids. These differences can also impact long-term retrievals (or re-analysis records) due to slightly differing sensitivities based on different SRFs and channel centers, and due to the use of different forward models or radiative transfer algorithms (RTAs).
The proposed NASA Climate Absolute Radiance and Refractivity Observatory (CLARREO) mission [4] suggested the direct use of long-term radiance trends to detect the magnitude of climate change and feedbacks which can provide insight into the accuracy of climate models [5,6,7]. A full CLARREO mission would measure the radiances trends in both shortwave reflected solar and in the thermal infrared, but at present only the shortwave measurements are under consideration [8] using the International Space Station as the viewing platform. The key characteristic of CLARREO is high absolute accuracy, allowing multiple satellites launched periodically, but with no overlap, to provide a long-term trend of earth emitted radiances.
This paper describes a new hyperspectral infrared data set, the Climate Hyperspectral Infrared Radiance Product (CHIRP) that combines AIRS and CrIS satellite sounding records into a homogeneous and continuous radiance record that uses a common SRF across all instruments and removes inter-instrument radiance biases. The initial CHIRP products will not include IASI, this paper is therefore focused on the conversion of AIRS and CrIS to CHIRP and their associated calibration offsets. (Note that IASI is used in Section 3.1 to inter-compare SNPP CrIS with NOAA20 CrIS via SNOs.) This data set will provide a more stable and homogeneous set of radiances for retrievals and climate trend analyses than the existing disparate set of radiances from these satellite sounders. In one sense it may provide a subset (thermal infrared) of climate information envisioned by the CLARREO mission, but with far greater temporal and spatial sampling. However, CHIRP is not designed to have an absolute radiometric accuracy of 0.1 K as envisaged by CLARREO. Instead, CHIRP will provide a highly stable record of hyperspectral radiances, and especially radiance anomalies, that are intended to address climate-level anomalies.
CHIRP will have the stability of its parent data, which was recently established for AIRS [9] and is well within climate level trends, ranging from 0.03 K/decade for many channels, to 0.06 K/decade in the shortwave part of the AIRS spectra. A similar analysis of CrIS stability using the techniques in [9] can establish the stability of these two sensors. Further improvements in the stability of the AIRS radiances are expected in the future. However, errors in the calibration offsets applied to convert AIRS and NOAA20 to the SNPP CrIS calibration will also effect the apparent stability of the CHIRP data record, as discussed in Section 3. The absolute accuracy of CHIRP will be the same as the SNPP-CrIS radiometric accuracy, since SNPP-CRIS is used as the CHIRP radiometric standard. However, radiometric stability is expected to be far better than absolute accuracy, approaching 0.03 K/decade for CHIRP derived from AIRS.
The long-term stability of CHIRP will depend on the level to which inter-satellite biases can be corrected. In addition, there may also be differences in calibration that vary with scene, such as those due to detector non-linearity and system polarization effects. Two general approaches are used here to analyze inter-satellite biases, simultaneous nadir overpasses [10] and large statistical inter-comparisons [11]. The following inter-comparisons among these approaches suggests that inter-satellite biases can be reduced to the 0.03 K level for hyperspectral infrared sounders. Some preliminary results on differences in scene-dependent calibration are also summarized. The present discussion is not intended as a comprehensive validation of the CHIRP data set, which awaits production of the full data set for the AIRS and CrIS missions, but is focused on how the CHIRP data is processed, especially the inter-satellite calibration bias offset estimates.
CHIRP data can be used to (1) help improve long-term records from 1Dvar retrievals by removing inter-instrument bias offsets and allowing the use of a single RTA across many instruments, and (2) provide an homogeneous radiance record crossing instrument boundaries for direct measurements of radiance anomalies and trends, and comparisons to climate models and reanalysis products properly converted to radiances. A main goal of CHIRP is to provide high-quality homogeneous radiance anomalies (suitably time- and space-averaged) in order to perform retrievals from the radiance record that essentially need little a-priori information. This approach has already been used [9] to establish the AIRS stability using clear ocean scenes via anomaly retrievals of CO 2 , N 2 O, CH 4 , and sea-surface temperature. Work to produce gridded versions of CHIRP are underway, providing infrared radiance measurements similar to those envisioned for CLARREO.

2. CHIRP Sensor Record

The AIRS sounder on NASA’s EOS-AQUA, and the two CrIS sounders now in orbit, NASA’s SNPP-CrIS and NOAA/NASA JPSS-CrIS flying on NOAA20, are currently being converted to the CHIRP format. As additional JPSS CrIS sounders are launched, they will also be converted to CHIRP. For clarity, note that the terms JPSS-1, or J1, refer to the first satellite in the JPSS series which is also termed NOAA20 now that it is operating in orbit. A summary of each instrument’s operating characteristics can be found in [12]. We introduce a terminology for CHIRP here that will be used in the data product names: (1) CHIRP-AQ is CHIRP derived from AIRS on AQUA, (2) CHIRP-SN is CHIRP derived from CrIS on the SNPP platform, and (3) CHIRP-J1 is CHIRP derived from CrIS on the JPSS-1 satellite. Future versions of CHIRP will include CrIS on the full range of JPSS platforms, and include CHIRP-JN where N = 2, 3, and 4. In the remainder of this paper we will generally follow this nomenclature.
Table 1 defines the spectral range for the CHIRP product, which can be split for comparative purposes into the longwave, midwave, and shortwave spectral regions as indicated. The midwave and shortwave CHIRP bands derived from AIRS are somewhat narrower due to the restricted spectral coverage. Channels that are present in CHIRP-SN and CHIRP-J1+, but not CHIRP-AQ, are flagged in the QC array chan_qc.
Figure 1 illustrates brightness temperature (BT) spectra for AIRS, CrIS, and IASI (for reference). The CrIS spectra shown here are Hamming apodized, which is almost universally done before data assimilation or retrievals, although CrIS radiance spectra are provided by both NOAA and NASA with a sinc SRF. IASI has the highest spectral resolution, followed by AIRS, but only in the longwave band. There are two CrIS spectra shown, one for Normal Spectral Resolution (NSR) and one for Full Spectral Resolution (FSR), both Hamming apodized. SNPP-CrIS operated in NSR mode until 4 December 2014 when it was switched to FSR operation, with further enhancements added on 2 November 2015.
The spectra of all these sensors are quite similar in wavenumber range, although only IASI has full spectral coverage, from 645 to 2760 cm 1 . AIRS is missing several small wavenumber regions (only the gap from 1136–1216 cm 1 is easily visible in Figure 1). AIRS has a large gap from 1613–2181 cm 1 that is not filled in the AIRS L1c product. CrIS has coverage gaps from 1095–1210 cm 1 and 1750–2155 cm 1 .
AIRS is a grating spectrometer with a nominal resolving power of 1200. Although the AIRS midwave and shortwave spectral resolution is higher than CrIS for NSR mode, it is lower than CrIS for the FSR mode. The algorithm [13] to convert the AIRS spectra to those for an interferometer is most accurate and stable if the target interferometer has at least slightly lower spectral resolution than AIRS. This led us to choose the CHIRP SRF to be the Hamming apodized output of an interferometer with maximum optical path difference (OPD) of 0.8 cm, 0.6 cm, and 0.4 cm for the longwave, midwave, and shortwave bands respectively, as outlined in Table 1. This choice means that CHIRP will not convert SNPP-CrIS radiances from mission start to 4 December 2014 to CHIRP format, since NSR mode radiances cannot be converted to CHIRP. We deem this an acceptable choice since AIRS was operating during that time period. Note that the CHIRP radiances will be produced for the complete AIRS mission, and for all SNPP- and NOAA-20 CrIS observations that are in FSR mode. Users can decide which version of CHIRP to use when CHIRP versions from multiple instruments are available.
CrIS parent CHIRP radiances will be created using the NASA CrIS L1b products [14]. Conversion of CrIS FSR mode to CHIRP is straightforward, requiring a double fourier transform for the midwave and shortwave bands. The 0.8 cm OPD CrIS SDR spectra (sinc SRF) are fourier-transformed, the interferograms are truncated to the CHIRP OPD values as shown in Table 1, and then fourier-transformed back to radiance space followed by Hamming apodization.

2.1. The AIRS to CHIRP Translation

Motteler et al. [13] describes the conversion of AIRS to CrIS NSR radiances. This is done by deconvolving AIRS to an intermediate resolution, typically a 0.1 cm 1 grid, and reconvolving this to the CrIS NSR SRF, followed by a small linear correction. The process for CHIRP-AQ is similar, except the reconvolution is done to the CHIRP resolutions.
Each CHIRP-AQ channel can be represented as a linear combination of multiple AIRS channels. Figure 2 gives an example, for the CHIRP channel at 1420 cm 1 . The green circles (at AIRS channel frequencies) are weights for the linear combination of AIRS channels that gives us the CHIRP channel. The CHIRP value is shown paired with the corresponding CHIRP nominal MW Hamming-apodized SRF, while the AIRS weights are paired with the corresponding AIRS SRFs, normalized to the weight values. The figure shows only the most significant AIRS weights. Both the AIRS weights and the CHIRP response function span the AIRS frequency band—the CHIRP response function as an apodized sinc, and the AIRS weights with a roughly sinc-like distribution. The combined weight of these outliers is relatively small.
The linear correction applied after the reconvolution in the AIRS to CHIRP translation consists of a separate linear function for each channel. In [13] we call this the “statistical correction” since it is derived from regression over a large set of diverse profiles, while the core AIRS to CHIRP translation has no statistical component. While the qualitative behavior of the CHIRP statistical corrections are identical to those shown in [13] they differ quantitatively since CHIRP has higher spectral resolution than CrIS in NSR mode.
Figure 3 shows the magnitude of this statistical correction for the global mean radiance. These corrections are mostly well below 0.1 K, although there are a few spectral regions with corrections as large as ~0.3 K. The AIRS SRFs are not always perfectly smooth (i.e., nearly gaussian), and sometimes contain small-scale irregularities due to fringing in the AIRS entrance filters; see Figure 3, Figure 4 and Figure 5 in [15]. We suspect that some of the larger statistical corrections may be due to the translation not working as well when the AIRS SRFs deviate too much from a generalized Gaussian. In November 2003 the AIRS instrument suffered a shutdown, and during the subsequent return to operation the temperature of the entrance filters changed slightly, which caused the entrance filter fringes to shift [16]. The change in BT due to these shifts in the filter fringes is shown in Figure 6 of reference [16], which bears some similarity to the patterns shown in Figure 3, especially in the midwave and longwave. The ringing shown in Figure 3 near 2200 cm 1 has the same period as in Figure 6 in [16].
CHIRP-AQ is created using the NASA AIRS L1c product [17]. The L1c product, derived from the AIRS L1b standard radiance product, has been corrected for small channel frequency shifts during the AIRS mission. L1b channels with very high noise that occur randomly or that exist throughout the mission are filled in the L1c product with simulated radiances ultimately based on a principal component replacement scheme (see the AIRS L1c Algorithm Theoretical Basis Document [17] for details). In addition, several of the smaller wavenumber gaps in the AIRS spectra are also simulated using principal components trained on a large ensemble of simulated spectra using a diverse set profiles.
Since there are a number of AIRS channels that are noisy, or dead, some of the AIRS contributions to a CHIRP channel will come from AIRS L1c that have been filled with a synthetic radiances, as discussed above. The can especially be true for CHIRP channels near the ends of AIRS detector arrays where a spectral gap can exist. For this reason, the CHIRP-AQ product provides a measure of the filling, called synth_frac. CHIRP channels with synth_frac = 1 are derived solely from AIRS fill channels. A majority of CHIRP channels derived from AIRS have synth_frac < 0.02. A synth_frac threshold of 0.02 is very conservative. It is important for the user to understand this, and pick channels for scientific use accordingly. The behavior of channels with significant fill values is discussed in more detail in Section 3.
Error estimates for the conversion of AIRS to CHIRP were derived by creating simulated monochromatic spectra for 49 diverse atmospheric profiles, and directly converting these to CHIRP format by convolution with the CHIRP SRF. The 49 profile set are the same used to train the NASA AIRS and CrIS forward models [18]. These same monochromatic spectra were then used to simulate AIRS spectra by convolution with the AIRS SRFs. The simulated AIRS spectra were then converted to CHIRP format using the approaches presented here, including the statistical correction. Figure 4 shows the spectral differences between the direction convolution of the monochromatic radiances to CHIRP format and those derived by converting the AIRS simulated spectra to CHIRP. Figure 4a. shows the bias of AIRS CHIRP minus direct convolution to CHIRP “Truth”, and Figure 4b. gives the standard deviation of the differences over the 49 profiles. A different view of the bias difference spectrum shown in Figure 4a. is given in Figure 4c. which is a histogram of the bias difference spectrum. This shows that the vast majority of channels have conversion accuracies below 0.01 K with a nominal gaussian distribution.

2.2. NEdN Estimates

Figure 5 shows estimates of the noise equivalent differential radiance (NEdN) for AIRS and CrIS-parent CHIRP. NEdN estimates for the current CHIRP product are provided as per-granule summaries. (CrIS data is also summarized this way, while AIRS L1c data includes values for every observation, but only for the non-synthetic values.) As a starting point for our CHIRP-AQ estimate, we average the AIRS NEdN over a granule, and interpolate the missing synthetic values. Our estimate is then obtained by adding noise with a normal distribution at the AIRS NEdN to blackbody radiance at 280 K, translating this to CHIRP, and measuring the noise of the translation [13]. The CHIRP-SN and J1 estimates are obtained with simple scaling factors, taking into account both the Hamming apodization, for longwave band, and apodization and down-interpolation, for the midwave and shortwave band. For both translations, NEdN is reduced significantly in comparison with the parent.
These noise estimates do not take into account correlation of noise in the parent sounder NEdN estimates. This is relatively small for CrIS, where it is mainly a side effect of the self-apodization correction in the shortwave band [19]. Pagano et.al. [20] also show relatively low levels of correlated noise in AIRS, although possibly not negligible in the extreme longwave channels. In the future we plan to provide a measure of correlation, and possibly also NEdN estimates factored into correlated and uncorrelated components. This will be done in the form of relatively static estimates.

3. Inter-Satellite CHIRP Bias Corrections

Corrections for radiometric calibration differences between AIRS and SNPP-CrIS, and between NOAA20 and SNPP-CrIS are determined after their respective radiances are converted to the CHIRP SRF. Two approaches are used for determination of inter-satellite biases. Most of this section concentrates on the bias differences between AIRS and SNPP-CrIS since (a) SNPP-CrIS is used as the CHIRP radiance standard, and (b) AIRS and CrIS are very different instruments with significant SRF differences. The NOAA20-CrIS bias differences with SNPP-CrIS are significantly smaller, which is unsurprising since the CrIS instruments aboard SNPP and NOAA20 are nearly identical, even though the NOAA20 CrIS blackbody design is thought to be an improvement over the SNPP version. SNPP-CrIS is presently used as the CHIRP radiance standard since it has overlapped with AIRS for a much longer time, allowing more extended inter-comparisons than AIRS with NOAA20 CrIs.
Two techniques are used to evaluate bias differences between satellites as summarized above, SNOs and large statistical inter-comparisons of radiances. The location of SNOs varies with the pair of satellites under consideration since the details of the orbit geometry determine the SNO locations and time differences. 
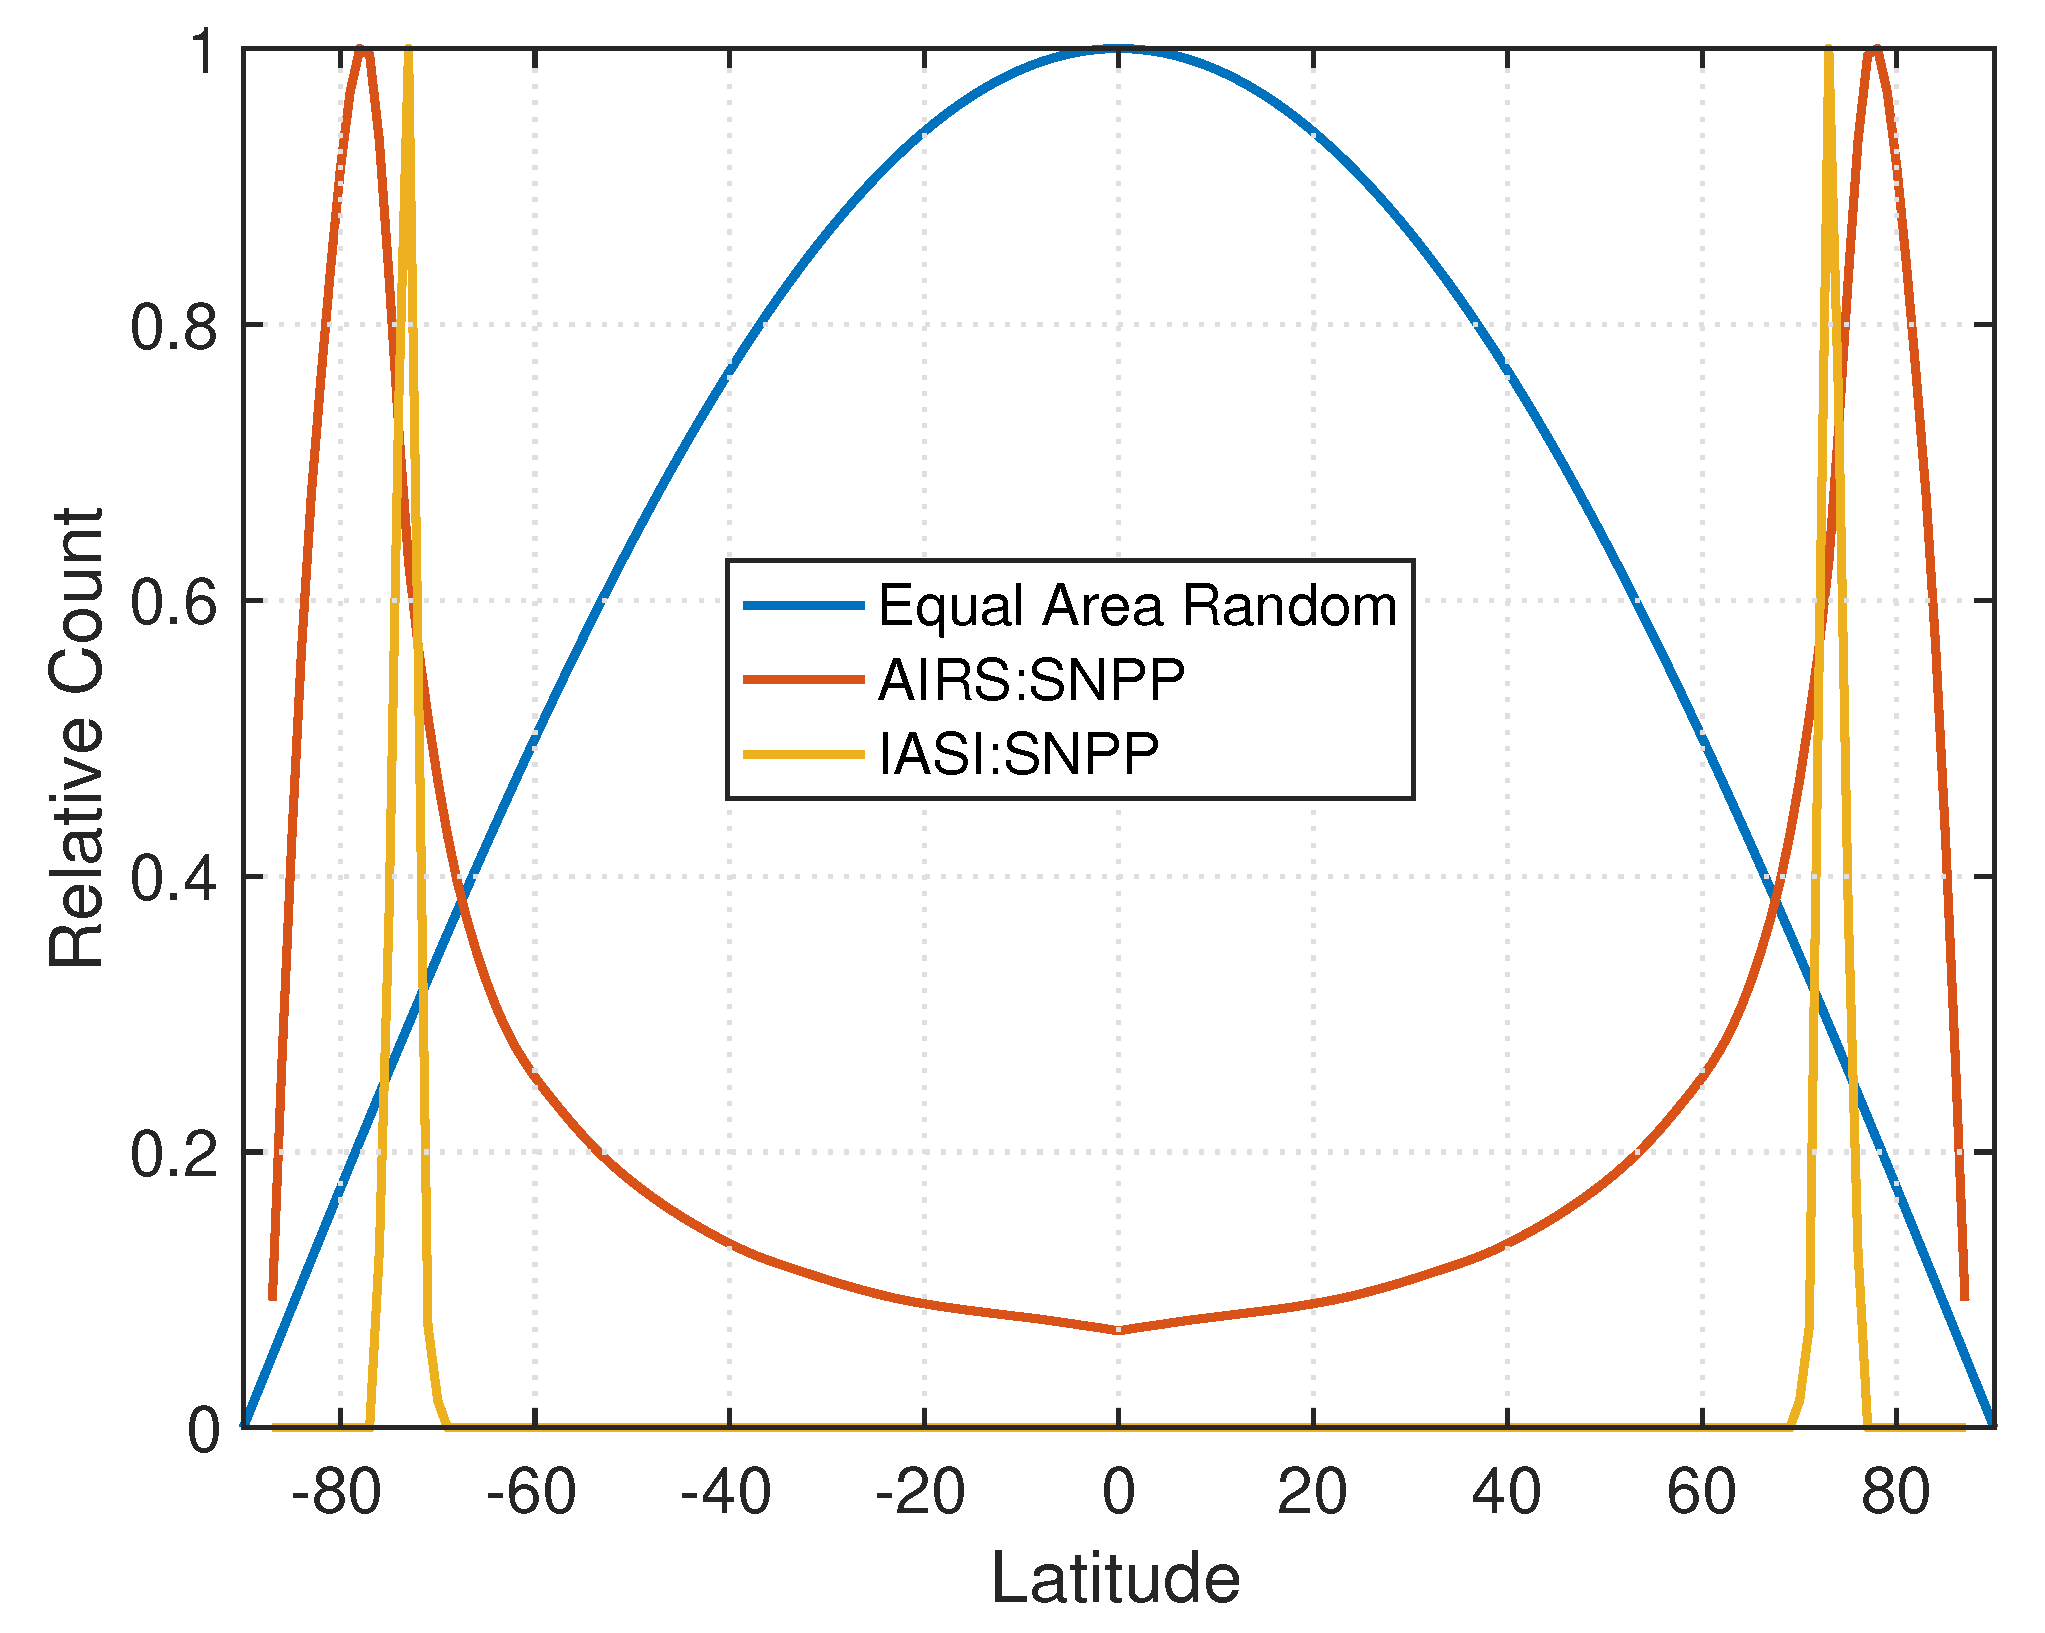
Figure 6 summarizes the latitude sampling of the AIRS:SNPP-CrIS sets and the IASI:SNPP-CrIS SNOs. The AIRS:SNPP-CrIS SNOs use a maximum spatial offset of 13 km and temporal offset of 10 min. While these SNOs peak near ±78 there are a considerable number of SNOs occurring at all latitudes. The IASI:SNPP-CrIS SNOs, for maximum offsets of 13 km and 20 min, peak very sharply at ±73 and are therefore not particularly representative of the global mean. The IASI:NOAA20-CrIS SNO sampling is similar to that for SNPP-CrIS.
Note that there are no SNPP:NOAA20 SNOs [21] since SNPP and NOAA20 are in essentially identical orbits except for a half-orbit along track separation. However, it is possible to use IASI as a SNO transfer standard by taking the double difference (NOAA20−IASI)SNO− (SNPP − IASI)SNO = (NOAA20 − SNPP)SNO, which was also used in [21], but for only a small number of SNOs (~1000) and only those in the north polar area. The double-difference approach using AIRS as the SNO transfer standard can also be used for the CHIRP channels that exist for AIRS derived CHIRP.
The latitude sampling for global equal-area sampling is also shown since that was used to build the statistical sampling data set. These statistical data sets are a 1% random, equal-area, sample for AIRS and the two CrIS instruments, taken over a 12 month period. We consider this statistical set of samplings more appropriate than SNO samplings for climate applications, since the statistical samplings are area-weighted and therefore represent accurate global samplings. The SNO samplings for AIRS and IASI are heavily weighted to very high latitudes and therefore they sample a highly aliased set of radiances that are far from globally representative. However, if the sensor calibration differences for any given spectral channel can indeed be mostly characterized by constant BT differences, then the SNO results will be very similar to the global statistical sampling results, and indeed they are very similar. Although we use the statistical intercomparisons to convert the AIRS and NOAA20-CrIS calibration to SNPP-CrIS, we use the calibration differences between the statistical samplings and SNO approach to estimate the uncertainties in the calibration conversions.
In order to minimize the effects of any drift in any of these instruments, a common time period of 1 March 2018 to 28 February 2019, was used for both the SNO and statistical data sets. This particular time period allowed a full year comparison between SNPP and NOAA20 CrIS, starting soon after NOAA20-CrIS began scientific operations, and before SNPP-CrIS suffered an outage of several months due to the failure of side-1 midwave electronics module. Only days when each instrument had a total number of observations within 2% of each other were used to minimize any aliasing. This ensures that all three sensors sampled the same underlying statistical set of data. For brevity, these data sets are referred to as the “2018” sets. Using a common 12-month time period for the radiometric correction of NOAA-20 CrIS and AIRS to the SNPP CrIS radiometric calibration provides the reference time (zero-offset) for application of any future improvements in stability in the three input sensor radiance records presently used for producing CHIRP.
The 1% statistical samplings used here contained approximately 3.7 million observations. The SNOs for AIRS:SNPP-CrIS had ~1.5 million paired samples, while the SNOs for IASI:SNPP-CrIS and IASI:NOAA20-CrIS sets each contain ~65 thousand observations. Note that for this work, all SNO and statistical samplings average over all 9 CrIS FOVs (focal plane detectors).

3.1. CHIRP:AQ and CHIRP:J1 Bias Offsets versus CHIRP:SN

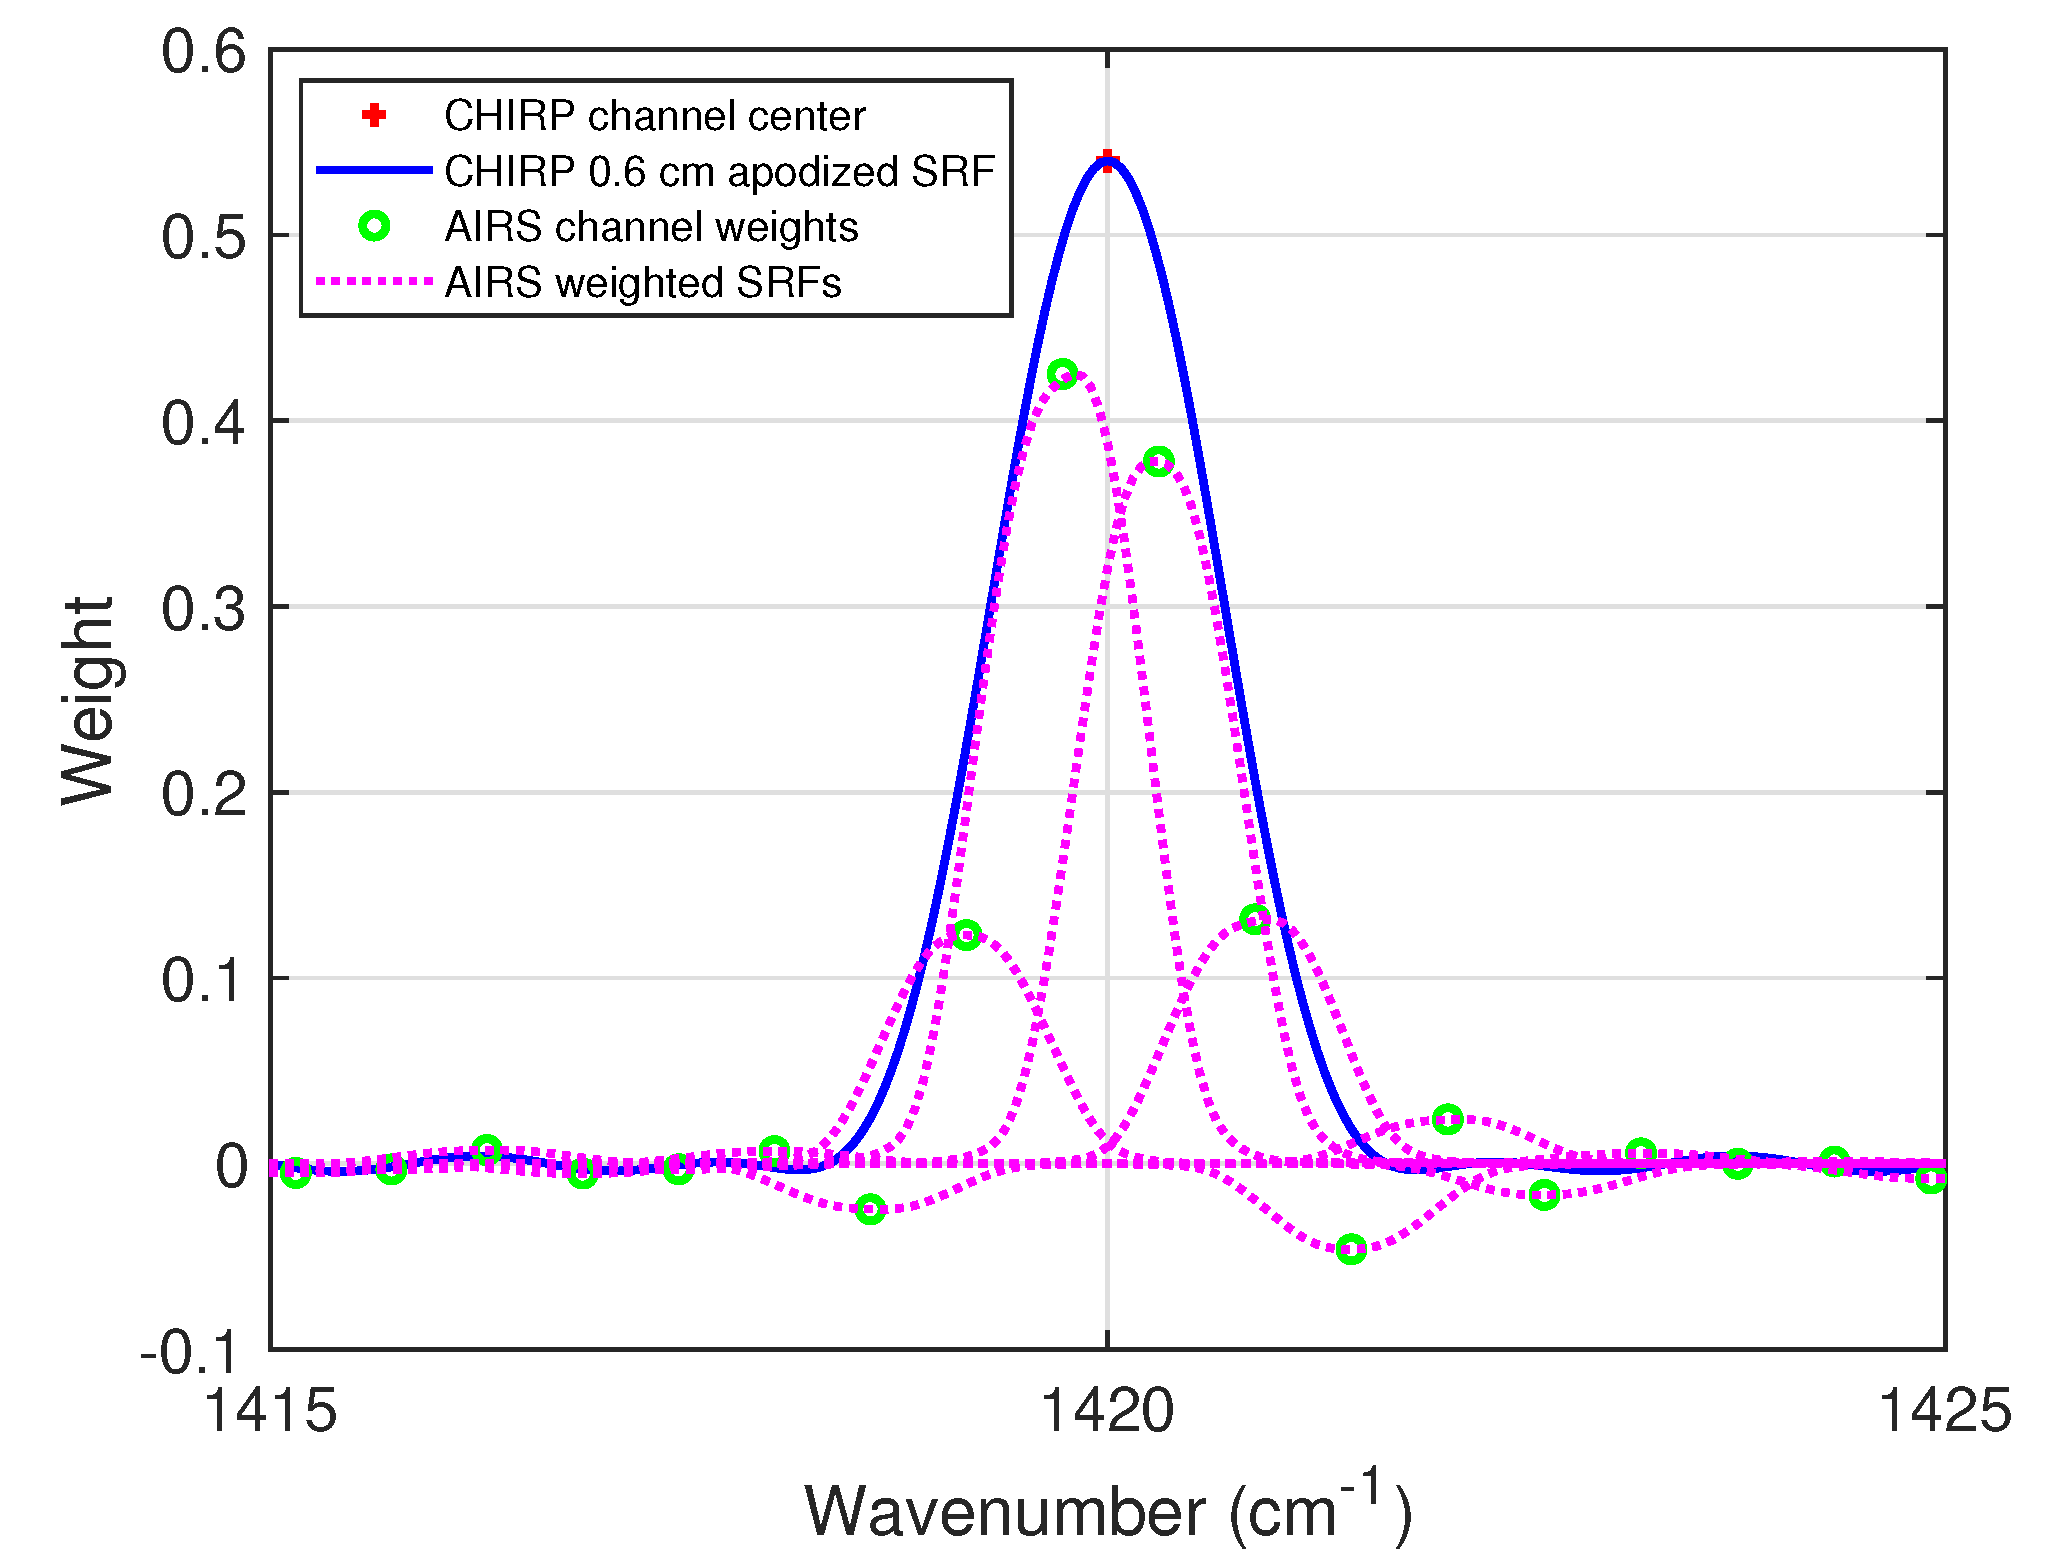
AIRS is a grating spectrometer with 2378 spectral channels arranged over 17 different detector arrays. Each AIRS channel has a slightly different SRF with non-uniform center frequency spacings characteristic of grating instruments. A non-negligible number of channels either have very high noise or are inoperable. In addition, as discussed earlier, the AIRS L1c product contains a number of simulated channels that are located in-between detector modules. Conversion of AIRS L1c to the CHIRP SRF requires knowledge of a considerable number of AIRS channels, as illustrated in Figure 2 to create a CHIRP channel radiance.
One primary diagnostic of the quality and heritage of a CHIRP channel created from AIRS is the fraction of AIRS synthetic radiances used to create a CHIRP channel radiance. The AIRS L1c product provides a per-granule summary of the number of times each channel has been synthesized, L1cNumSynth. We linearize the AIRS to CHIRP conversion and apply this to L1cNumSynth to get corresponding values for CHIRP. These are normalized as a fraction and becomes the CHIRP field “synth_frac”, indicating the level of simulated data used to create that channel. Users should avoid channels with high values of synth_frac, although these channel will likely introduce very little bias and have very representative standard deviations relative to RTA calculations. Probably the most dangerous use of these channels would be to sense minor constituents, which were not part of the statistical training used to create their radiances. Note that synth_frac will generally not change significantly over time, although it may increase for a short time when an AIRS channel has a short-term noise (POP) event. It will also change if an AIRS detector ceases operation, or vice-versa, but these are very infrequent events.
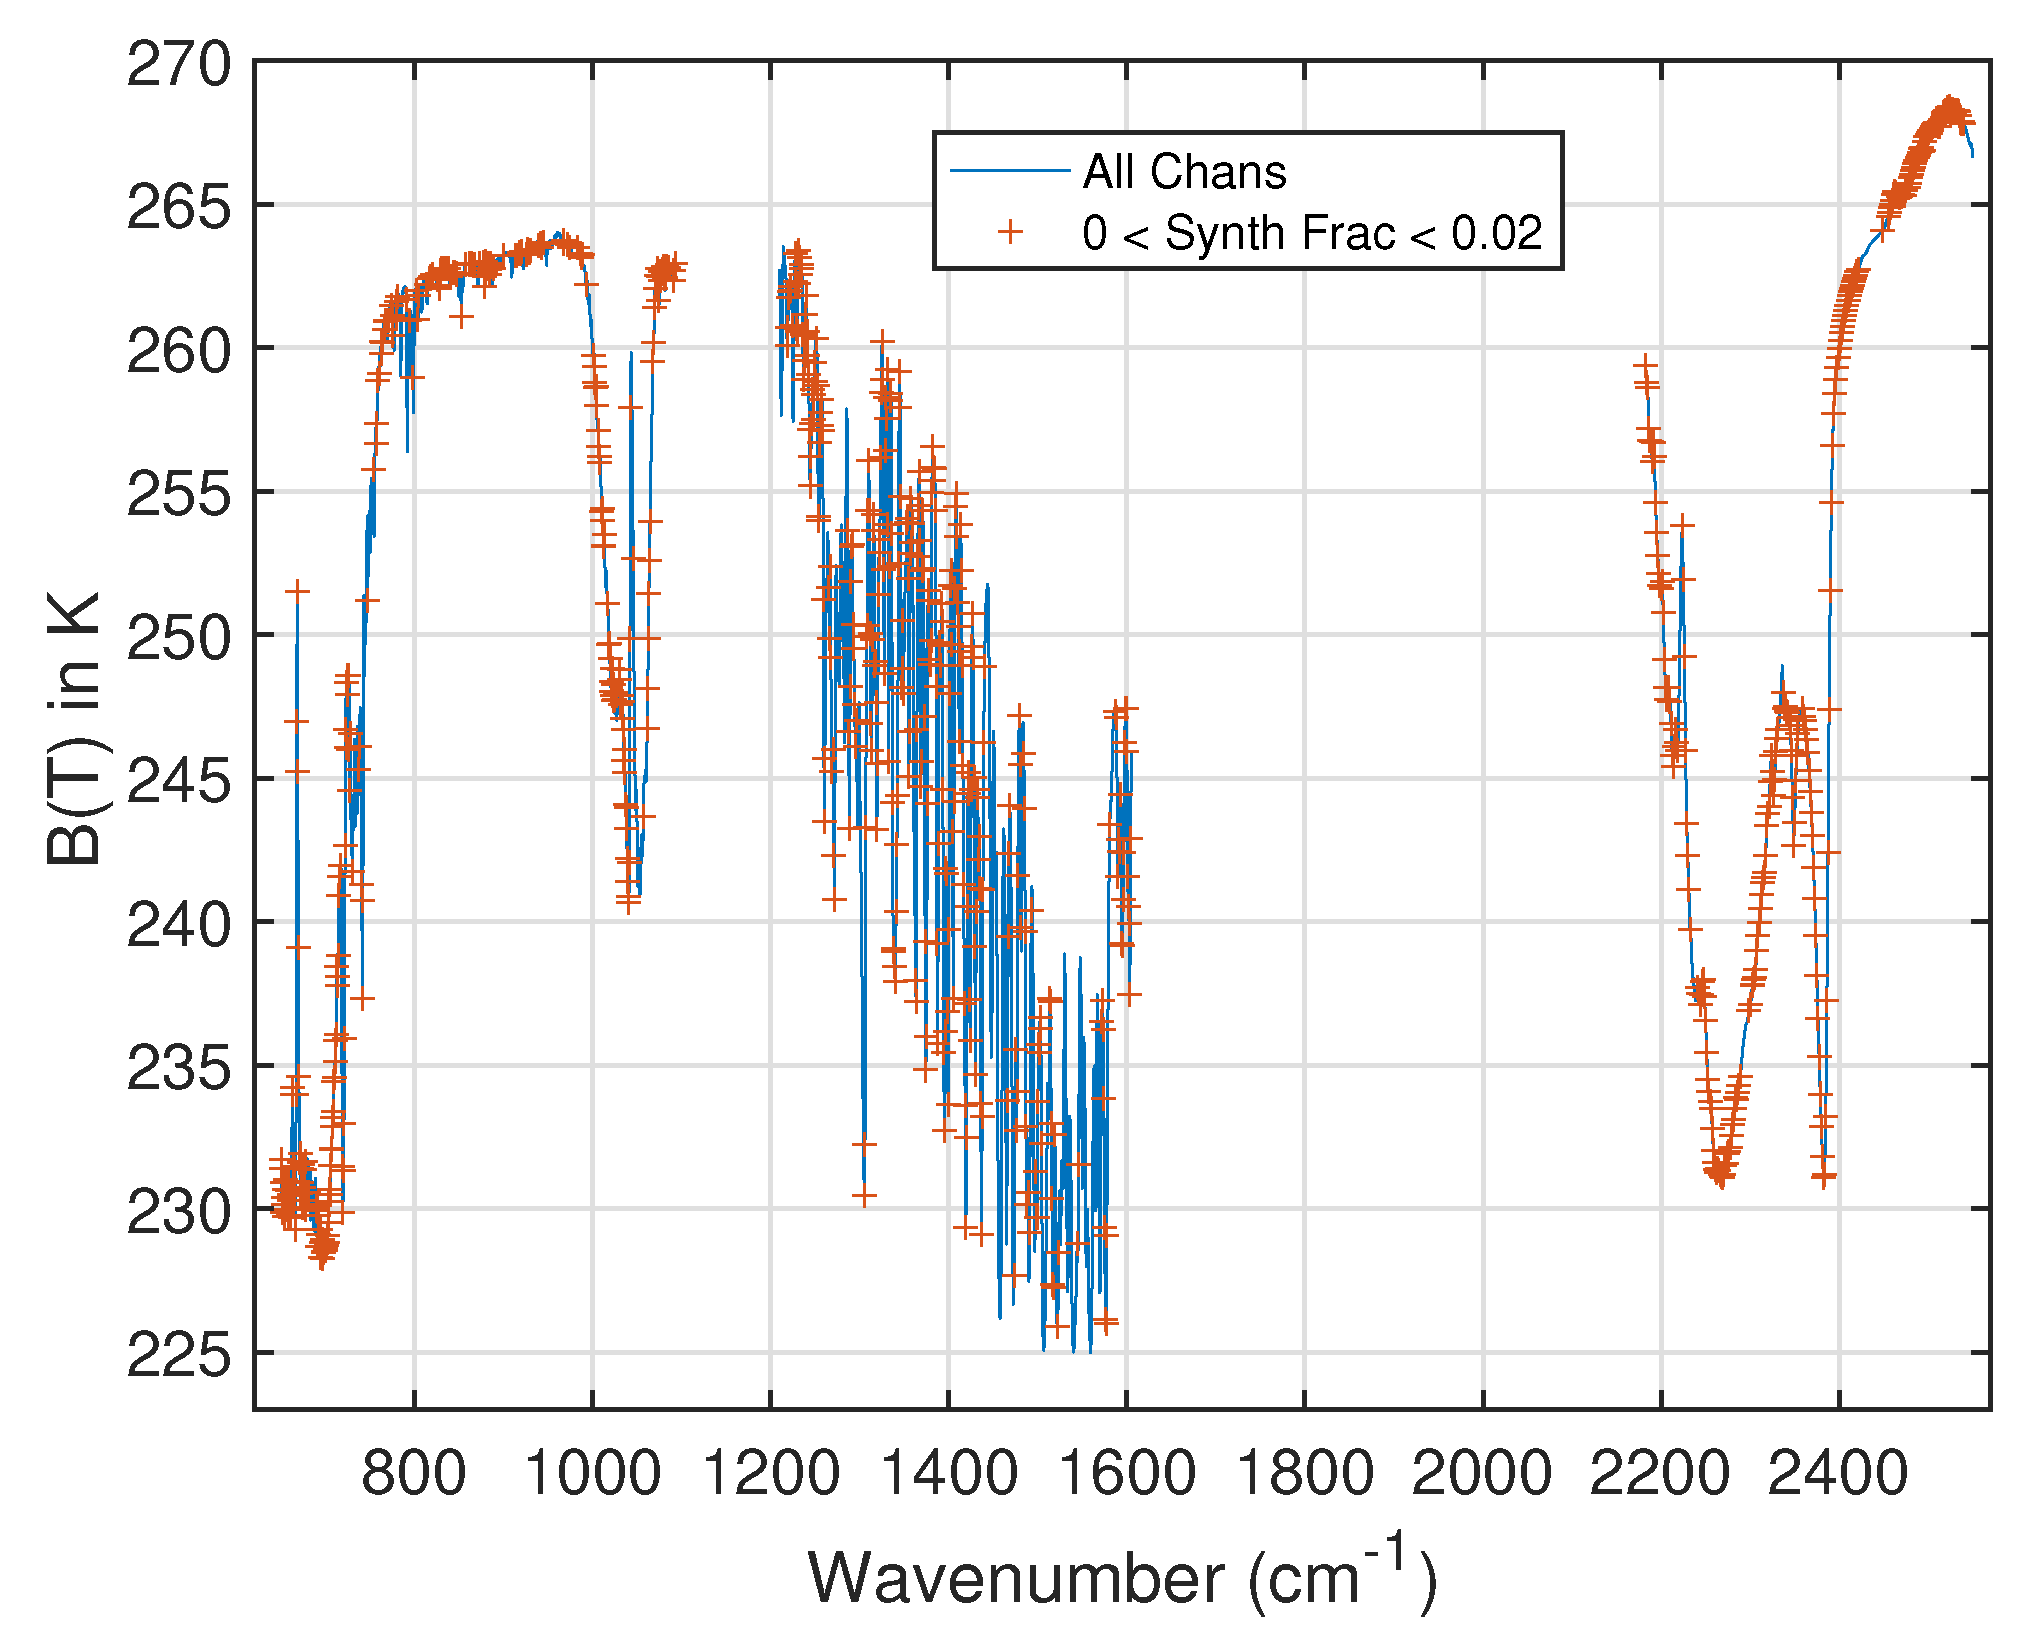
Fortunately, a very large percentage of the CHIRP channels have synth_frac values below 0.02, and these form a large enough ensemble of channels for existing retrieval or NWP applications. 
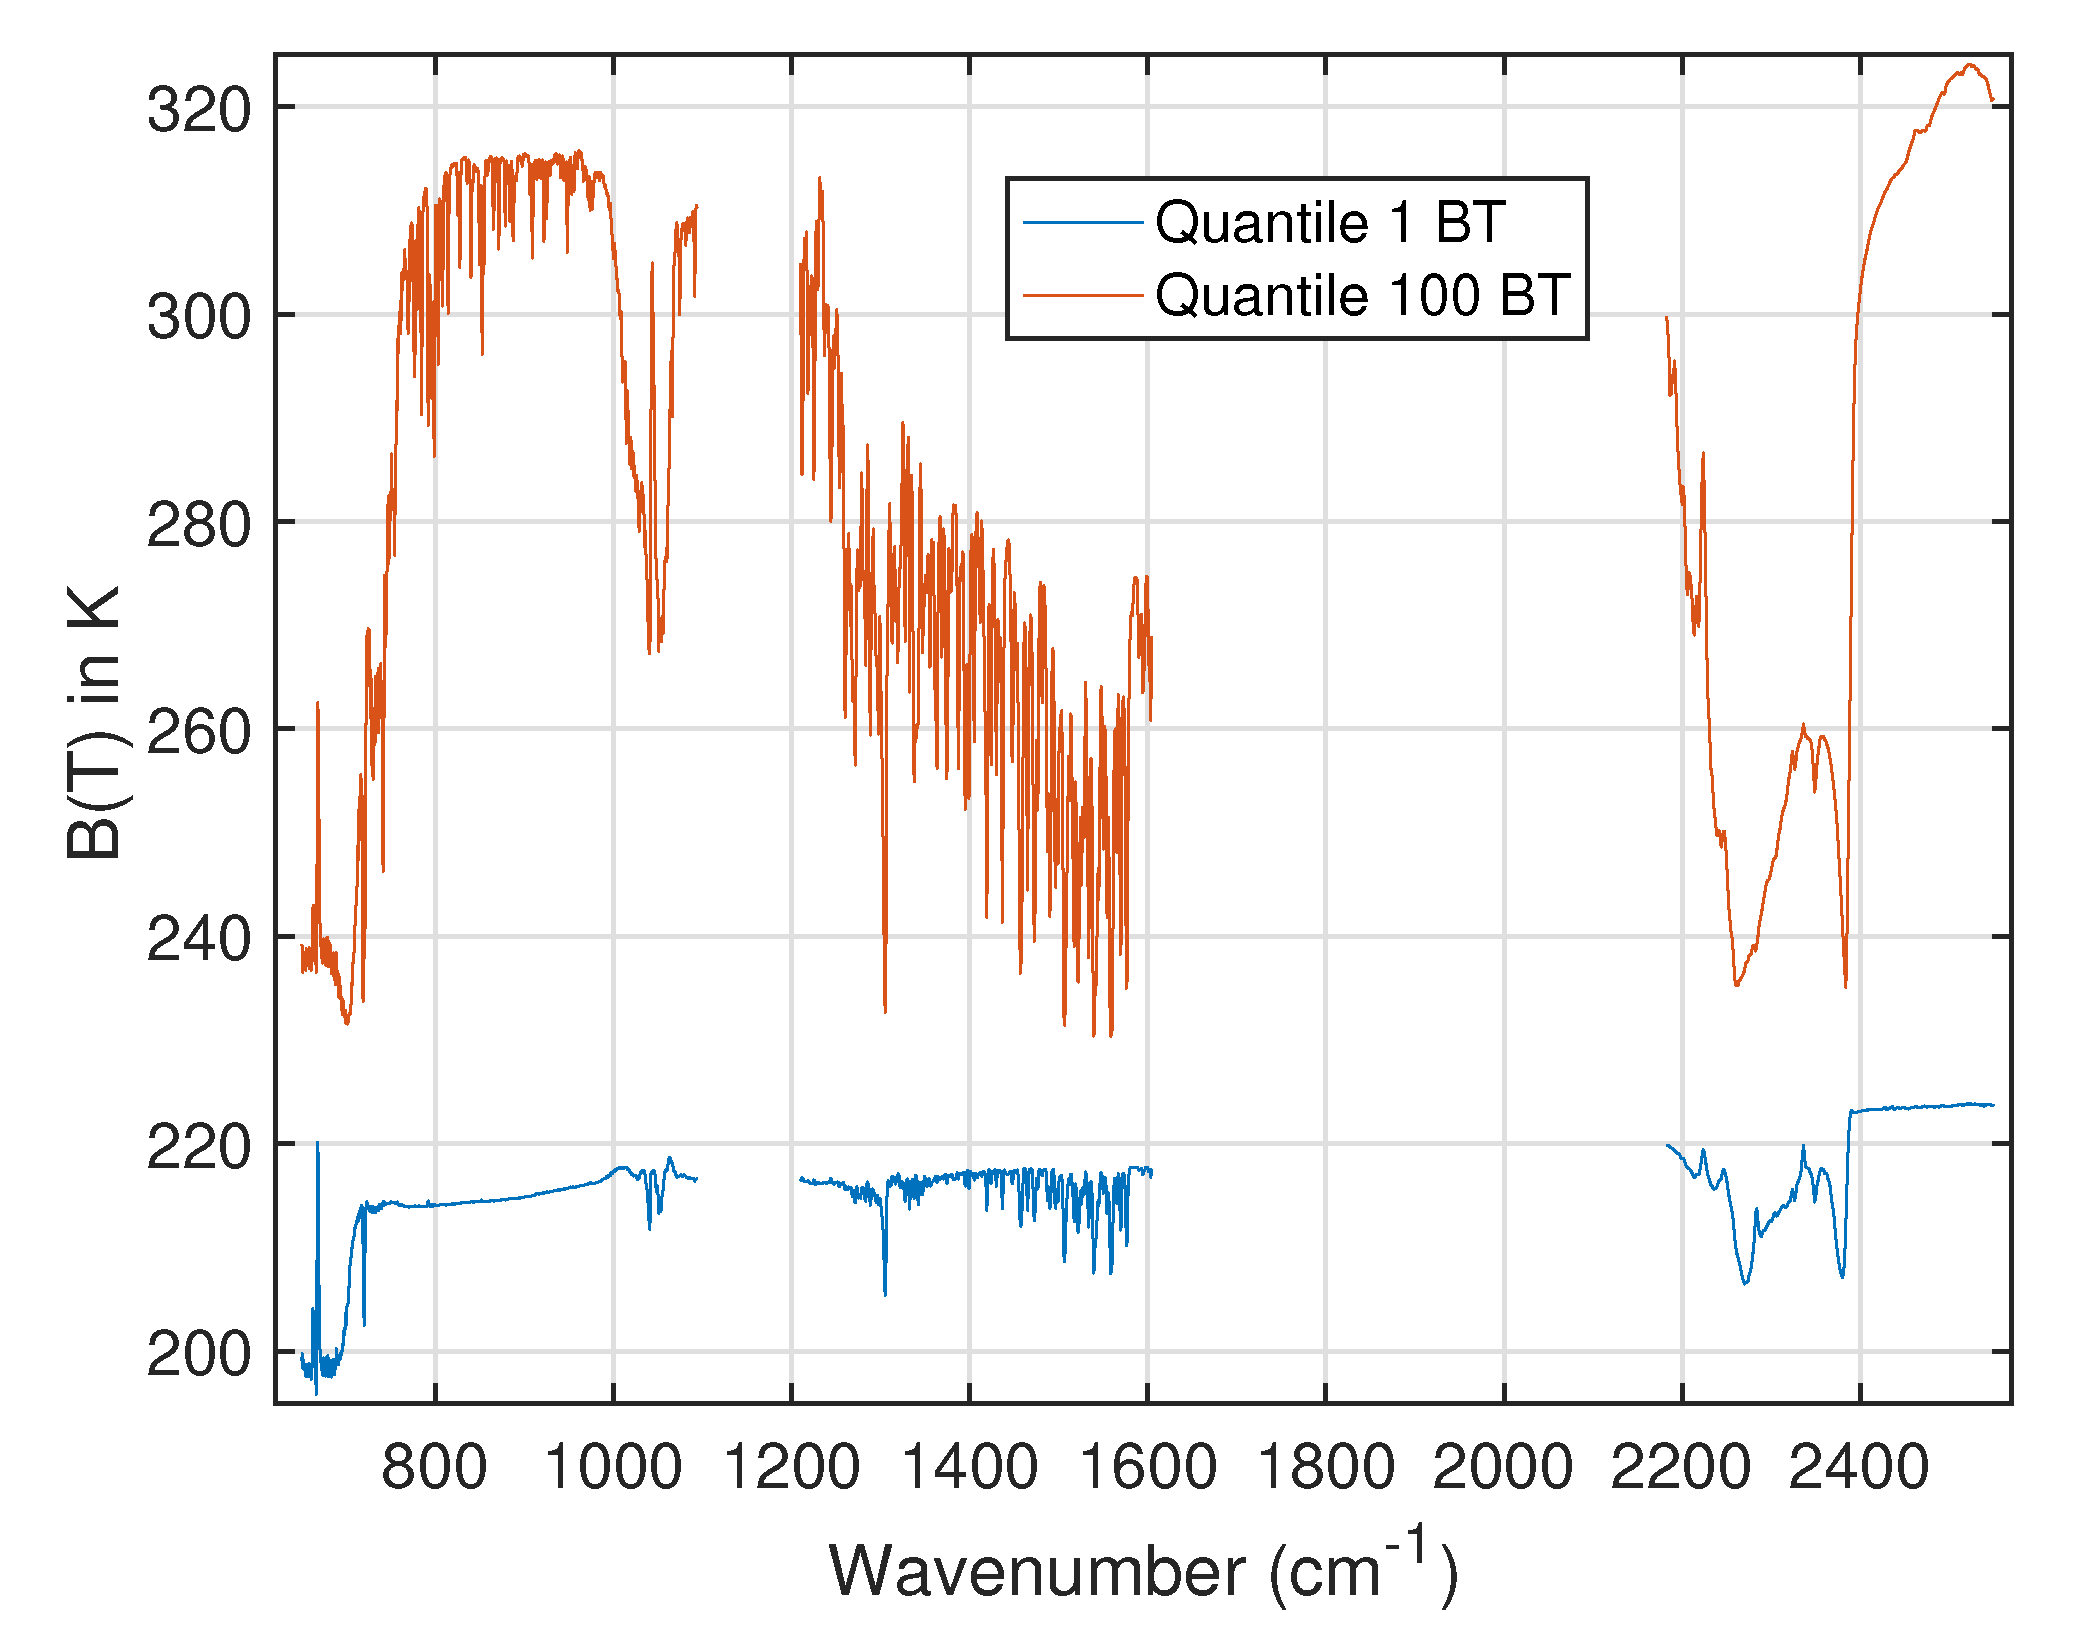
Figure 7 is a sample CHIRP spectrum derived from AIRS for a randomly selected day, 18 August 2018. The red plus markers indicate CHIRP channels where synth_frac is less than 0.02. Qualitatively the channels with synth_frac less than 0.02 are distributed over a wide range of BT values including those sensing temperature, water vapor, ozone, methane, and other minor gases. Approximately 55% of the AIRS derived CHIRP channels have synth_frac below 0.02, and an additional 20% of channels have synth_frac between 0.02 and 0.25.
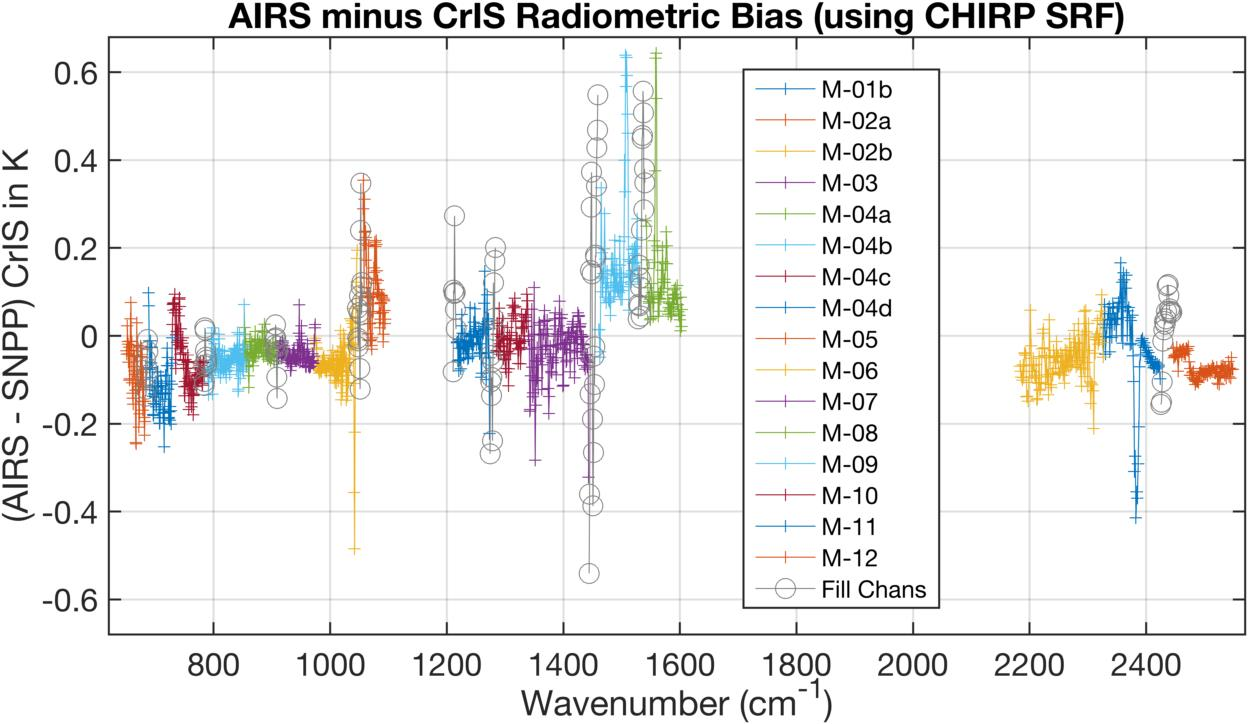
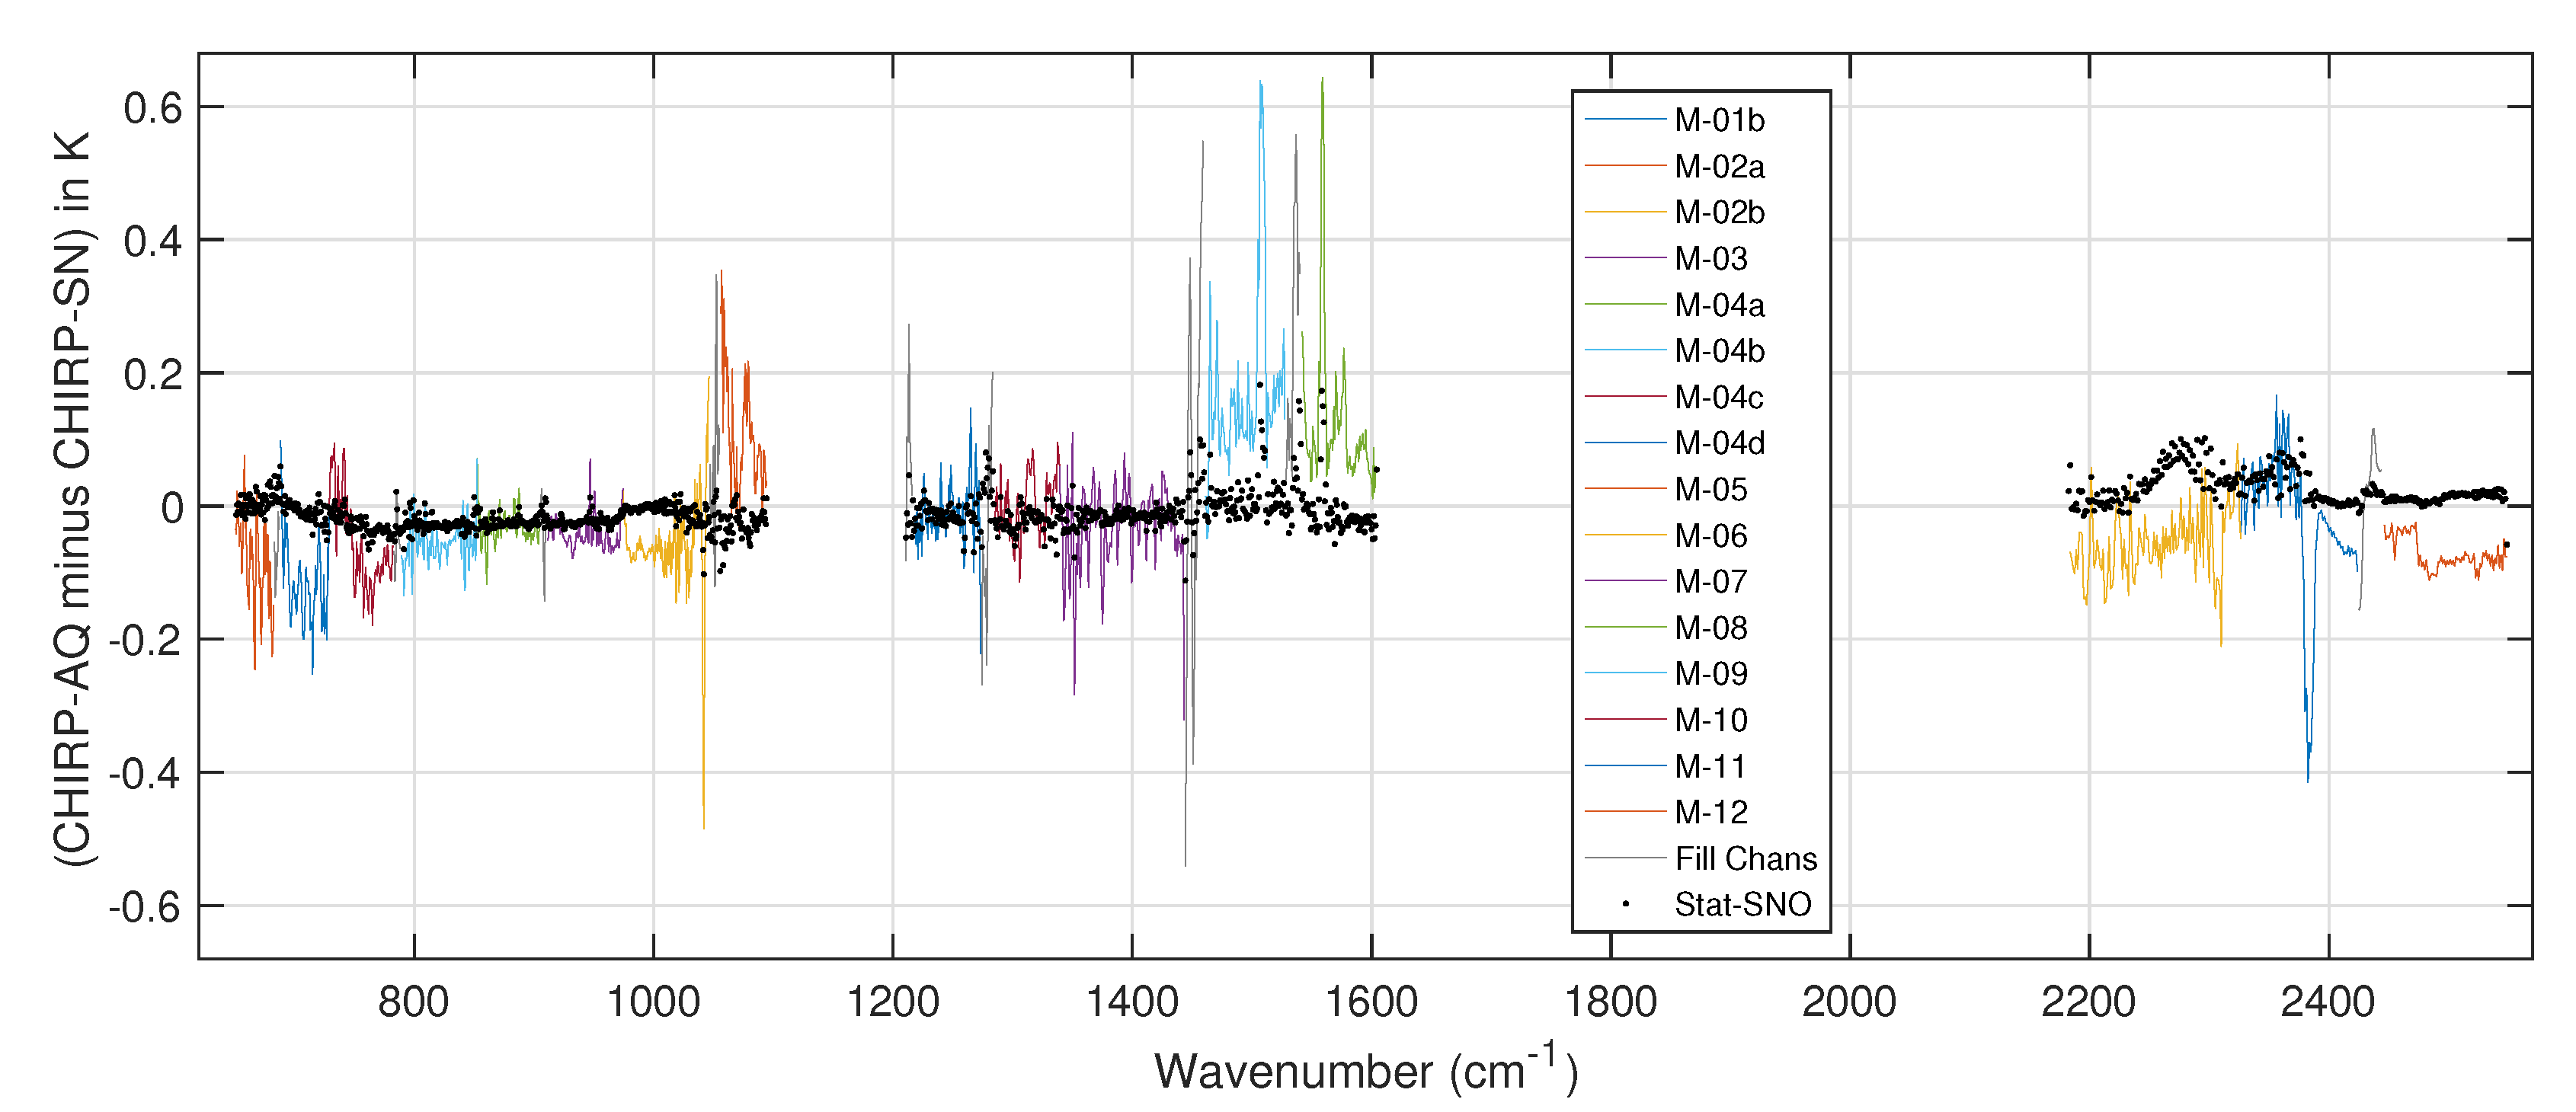
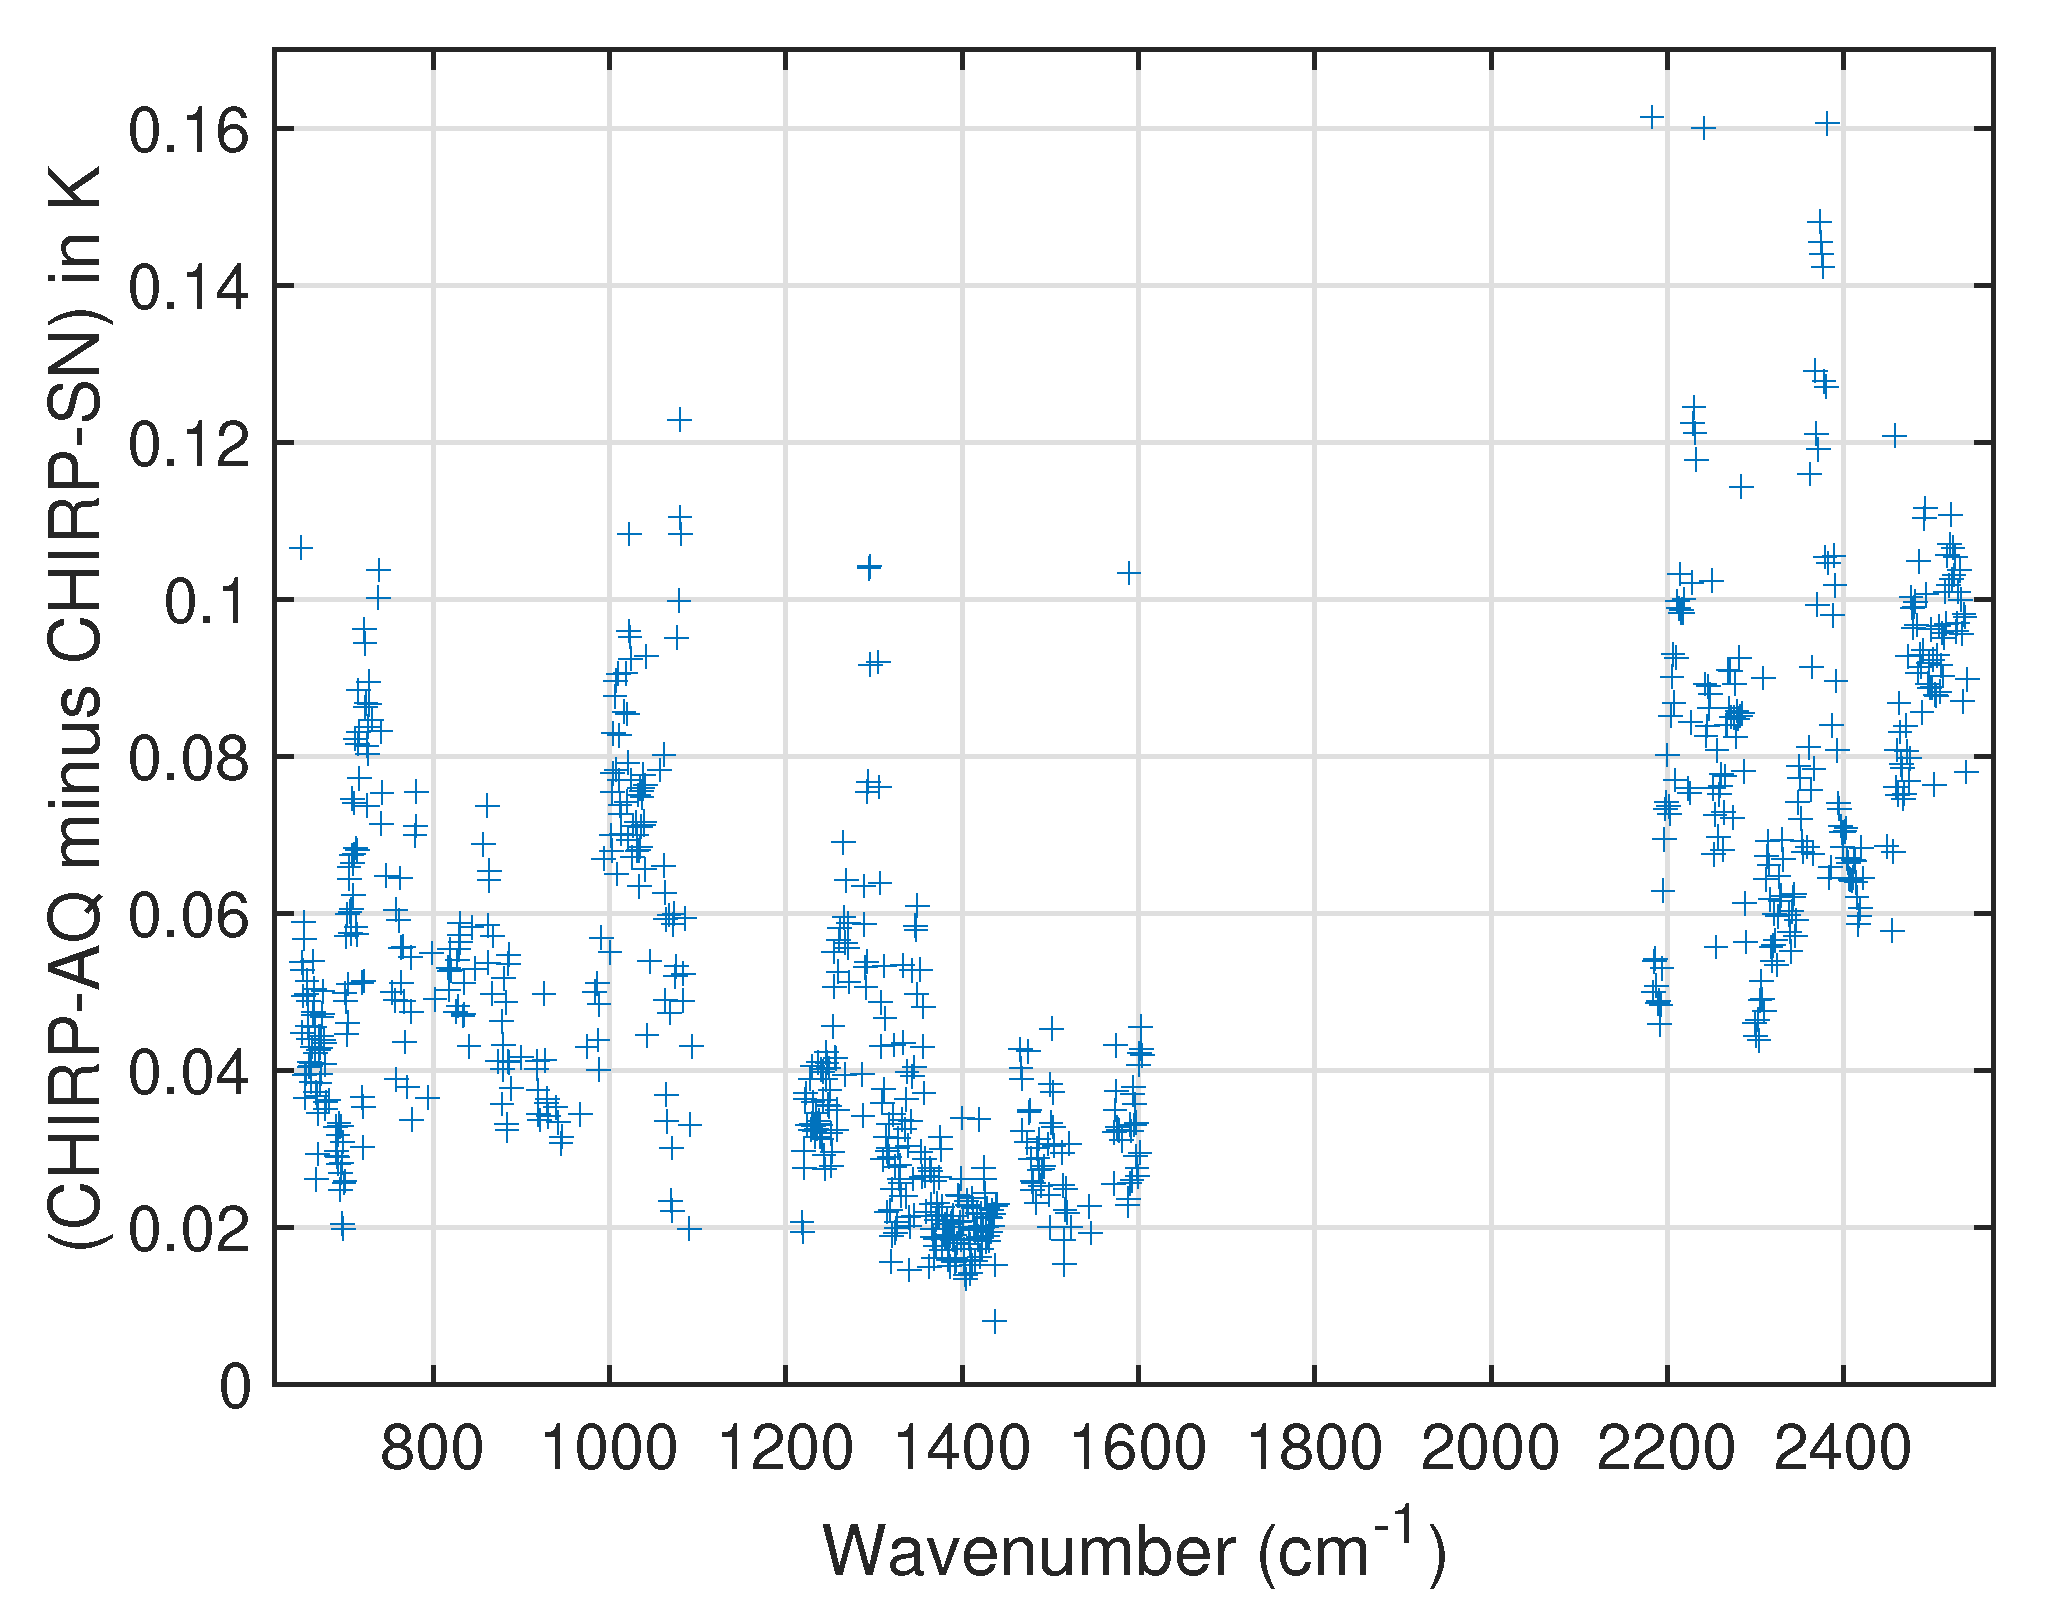
Figure 8 summarizes the (CHIRP-AQ minus CHIRP-SN) bias for all CHIRP-AQ channels. The colors denote the locations of different AIRS detector modules that contribute to CHIRP-AQ. These biases were derived from the 1 percent random subset of AIRS and SNPP-CrIS radiances for 2018. Small corrections are required to compare the means of the AIRS versus CrIS statistical samples in Figure 8 since these two instruments have slightly different mean secant viewing angles which for AIRS is 1.2225, while the mean for CrIS (over all 9 FOVs) is 1.2433, or a difference of AIRS minus CrIS = −0.0208. The AIRS and CrIS BT means are corrected for this small secant offset by interpolating the BT means tabulated by secant angle, to the mean secant angle for all samples. This correction varies from ~−0.1 K to +0.05 K depending on the spectral region and is only required to inter-compare the statistical BT means in order to derive bias offsets.
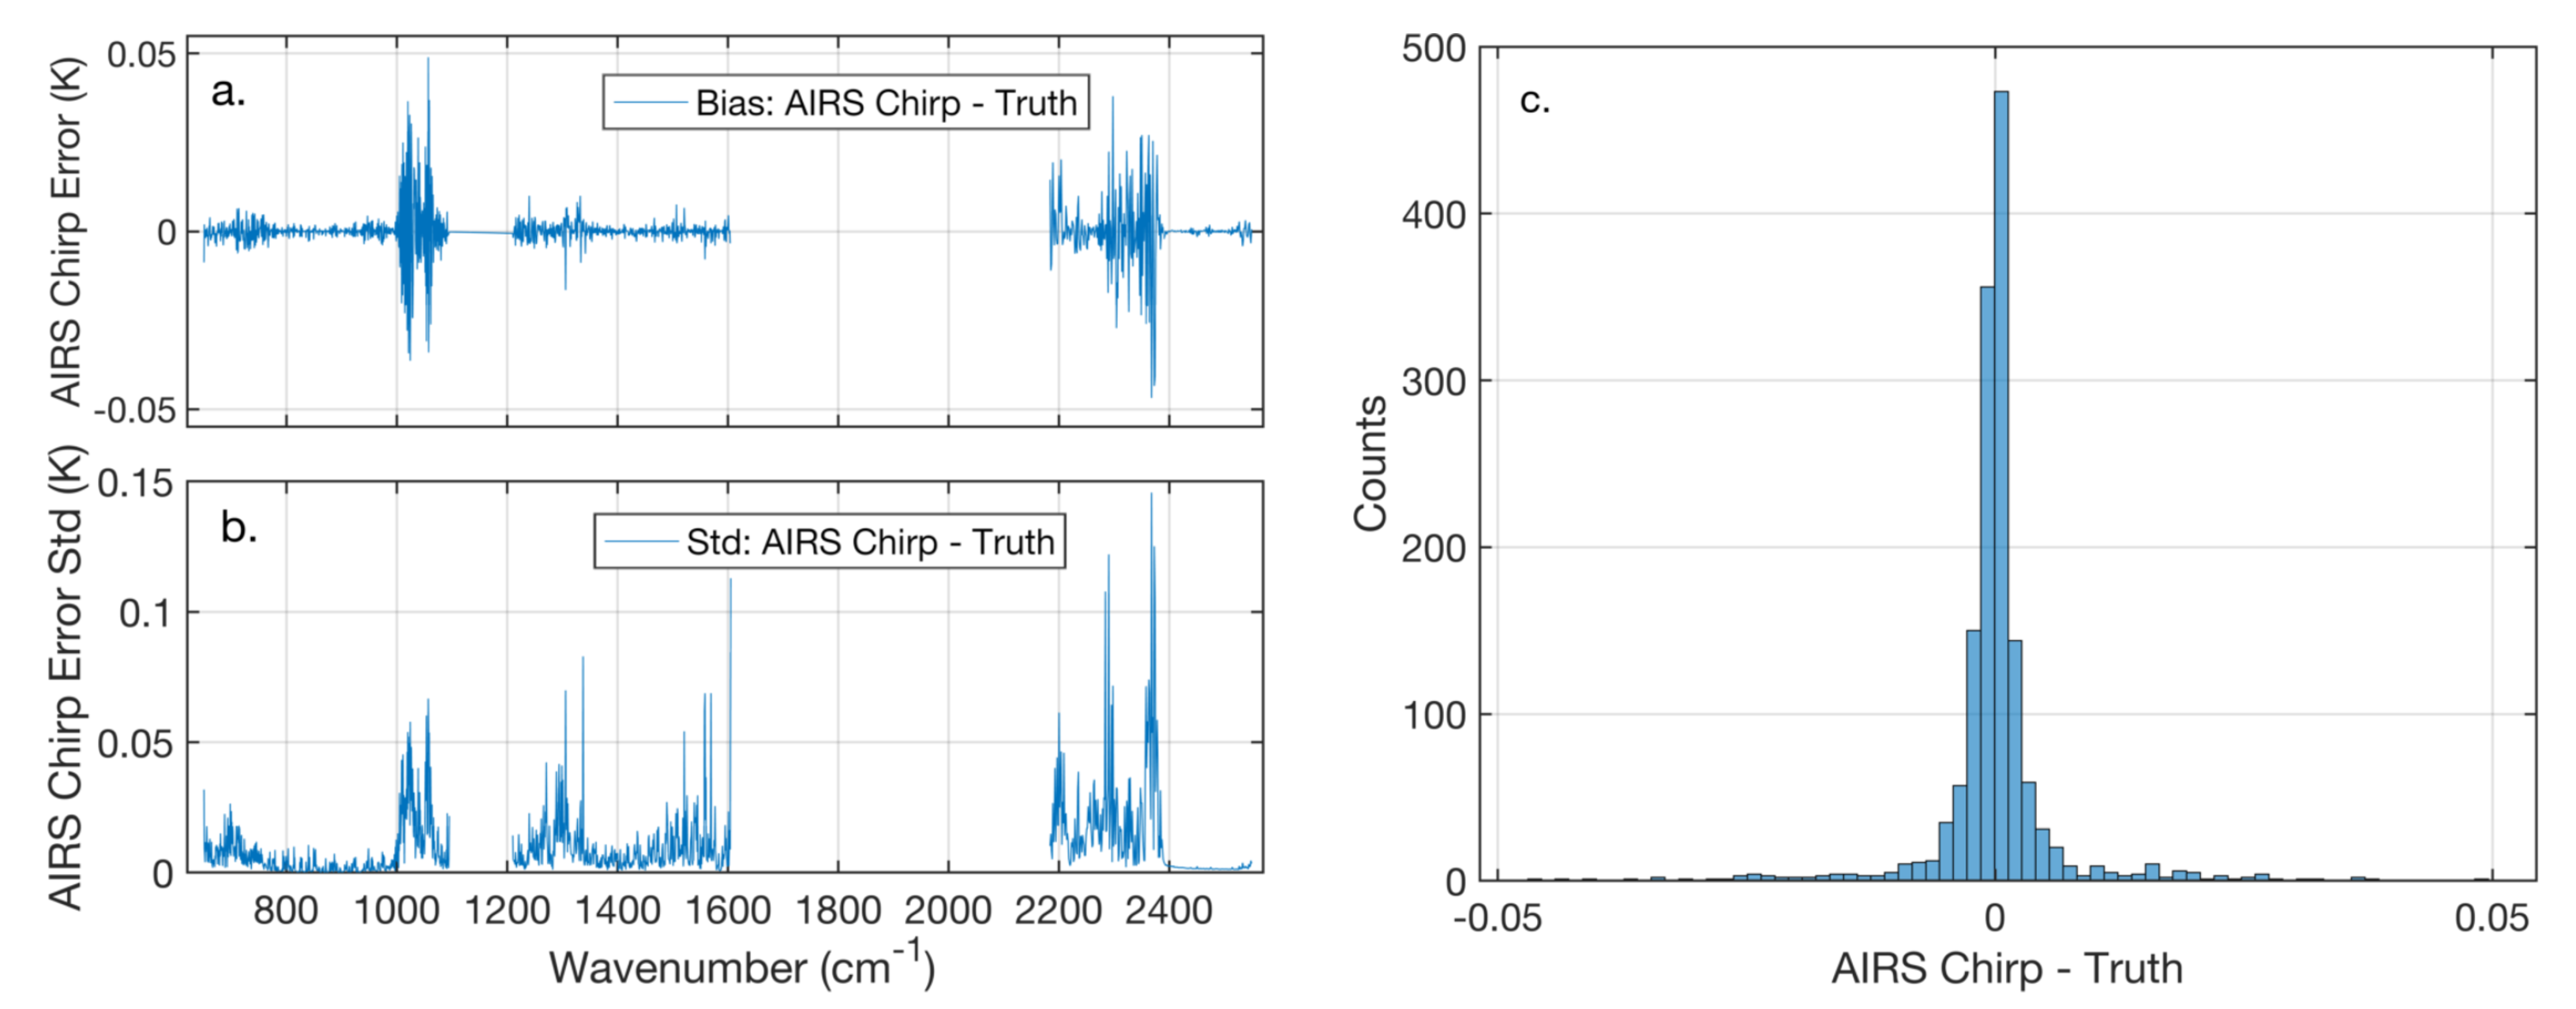
CHIRP-AQ minus CHIRP-SN biases were also derived using SNOs. The difference between (CHIRP-AQ minus CHIRP-SN) using the statistical data set compared to the SNO data set are also shown in Figure 8 (black dots). These two techniques give very similar bias differences, which suggests that any scene dependence of the inter-satellite biases are relatively small. The standard deviation over all CHIRP channels, between these two bias estimation, approaches 0.006 K ± 0.030 K (statistical minus SNO approach), suggesting that the accuracy of the statistically derived biases is on the order of 0.03 K.
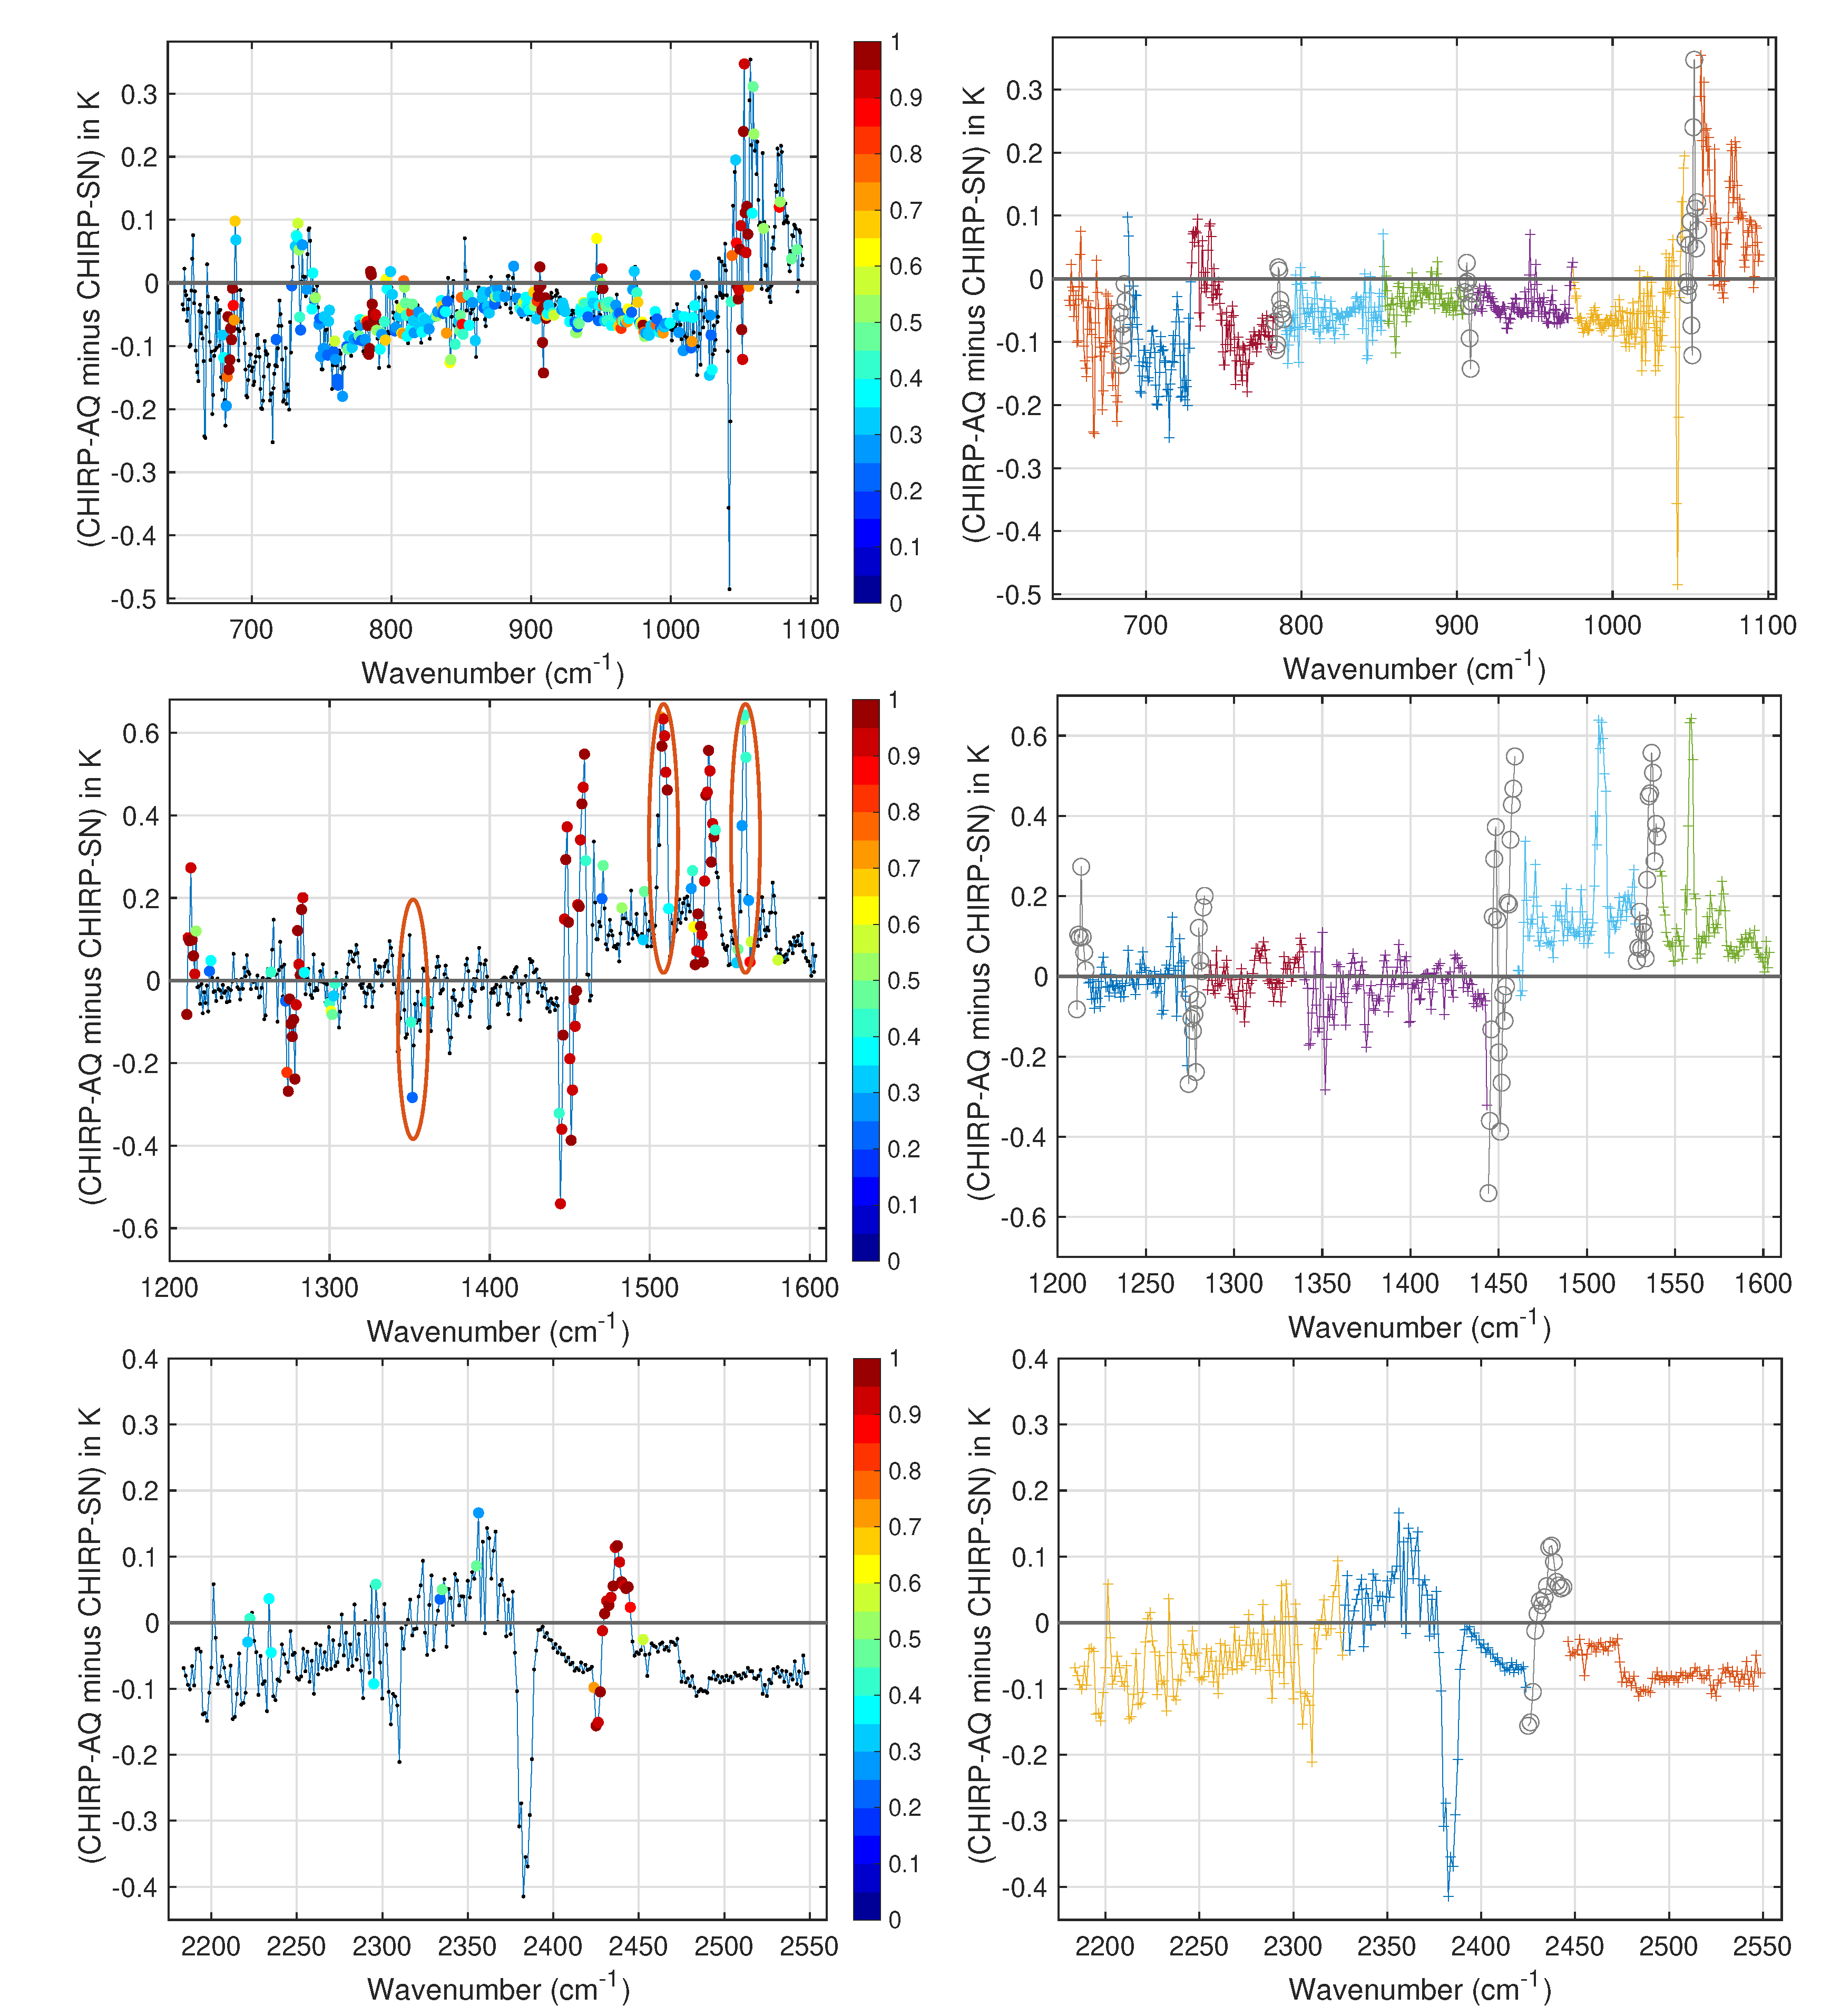
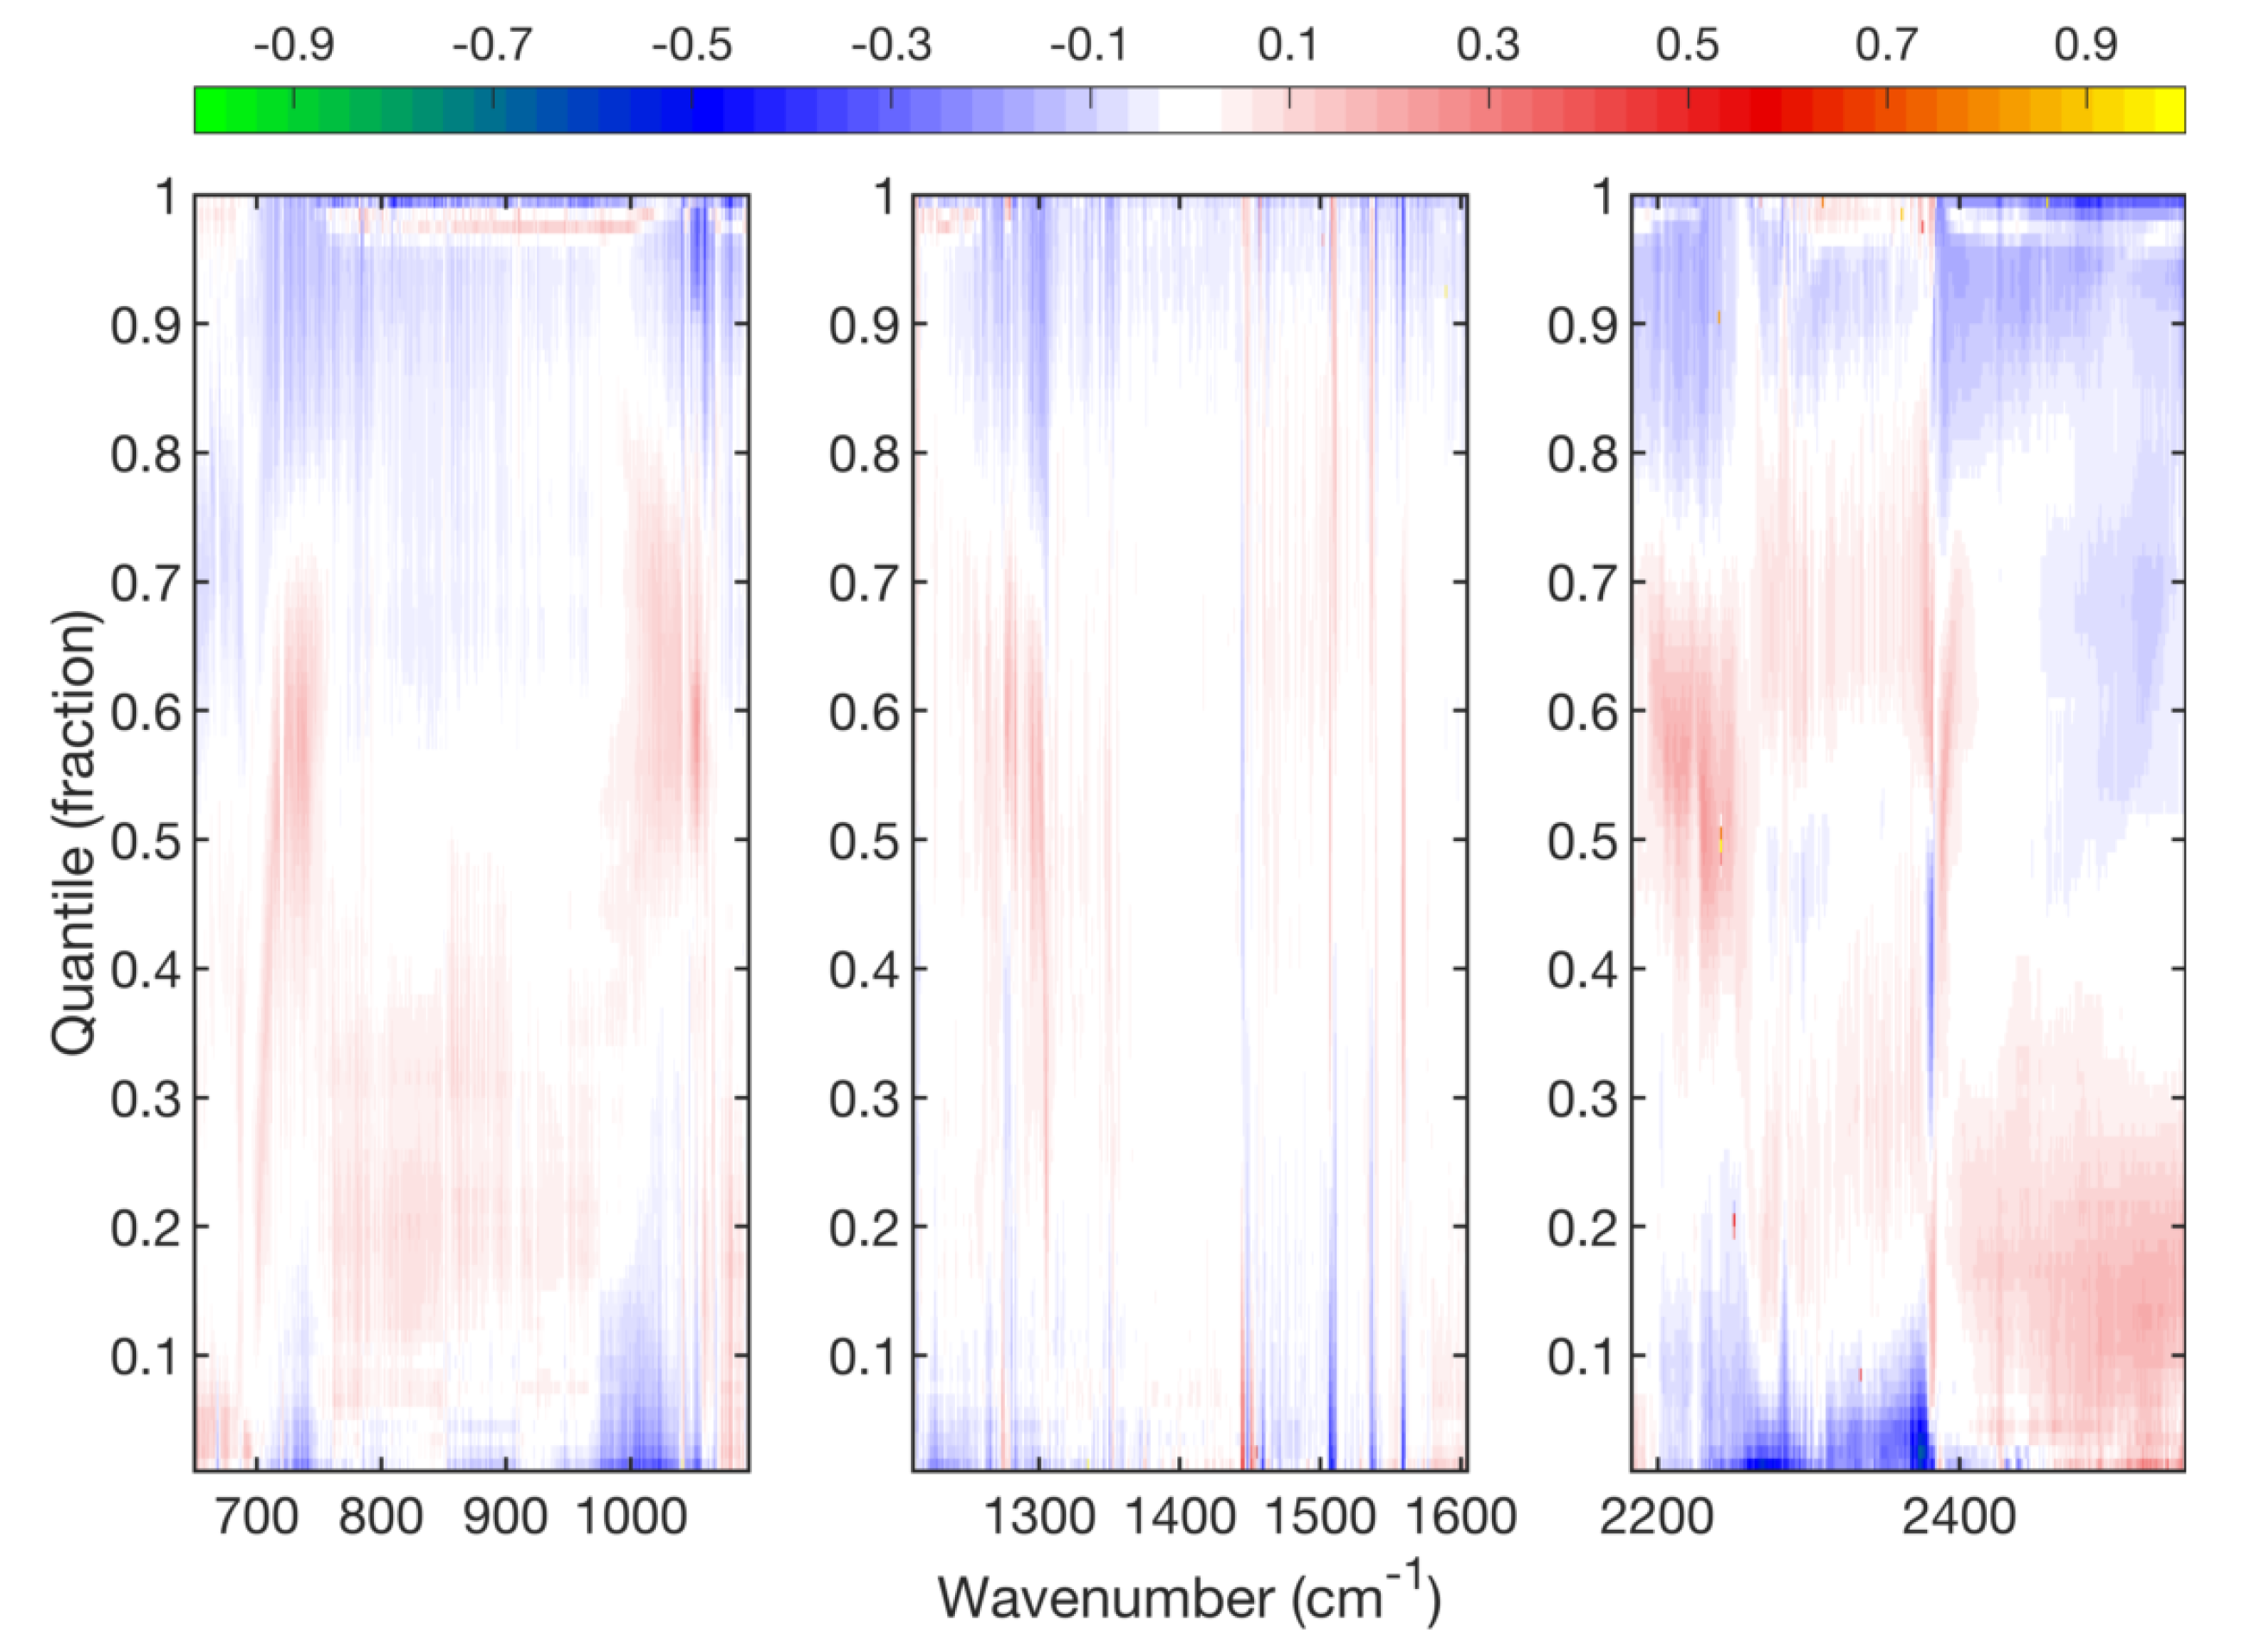
Figure 9 repeats the (CHIRP-AQ minus CHIRP-SN) biases shown in Figure 8 but with filled circles added to indicate the CHIRP channels with synth_frac greater than 0.02 (left column). The biases in the left column are repeated in the right column, but now with the locations of the AIRS L1c detector arrays shown in different colors (as in Figure 8) and with the AIRS L1c filled gap channels denoted by gray lines and circles.
These curves clearly show that CHIRP channels located in the AIRS spectral gaps have very high synth_frac values and should be avoided in general. There are just a few regions, circled in red, where CHIRP synth_frac values are high that are not located in AIRS L1c filled-gaps in the midwave band. These AIRS channels have extremely high noise or are completely inoperable. The CHIRP channels with high synth_frac values generally also have higher biases relative to CHIRP:SN, which is expected since they are derived from AIRS L1c channels containing synthetic radiances. The synthetic CHIRP channels in the window region are quite accurate, while those in the midwave water band have bias errors of up to 0.6 K.
These synthetic biases are removed in CHIRP, but additional analysis is needed to determine their overall quality. However, as stated above, there is generally no need to use these channels for retrievals or assimilation. The wavelength dependence of the remaining good channels is, of course, some combination of bias errors due to AIRS and SNPP-CrIS.
It is possible to recognize spectral dependencies of the biases that correlate with locations of AIRS detector arrays. For example, there is a considerable shift between the high wavenumber end of the AIRS M11 array and the low wavenumber end of the M10 array, near 728 cm 1 . The AIRS M-05 detector array covering the 1056–1136 cm 1 range is known to have calibration issues so it is not surprising that the biases are larger in that region. The bias differences in the midwave region are very small for good channels, although the 1460–1605 cm 1 region that covers the M-04a and M-04b detector arrays is offset by ~0.05 K from the biases of the other midwave modules.
The large negative bias feature in the shortwave band near 2382 cm 1 coincides with very low scene temperatures which can be difficult to calibrate accurately in the shortwave. In addition, the BT values increase very rapidly with wavenumber past 2382 cm 1 . This suggests that very small errors in either instrument’s SRF wing could contribute to larger than normal errors at the channel center. Similar behavior is seen in the NOAA20-CrIS minus SNPP-CrIS biases discussed in the Section 3.2.
The long-term stability of CHIRP, as discussed in Section 1, is determined by the combination of the parent instrument stability, and the accuracy of the inter-instrument calibration adjustments. It is far better to characterize individual instrument’s stability using their radiances in native format rather than in the context of CHIRP, since CHIRP consists of linear combinations of parent channels (except for the longwave band when CrIS is the parent instrument).
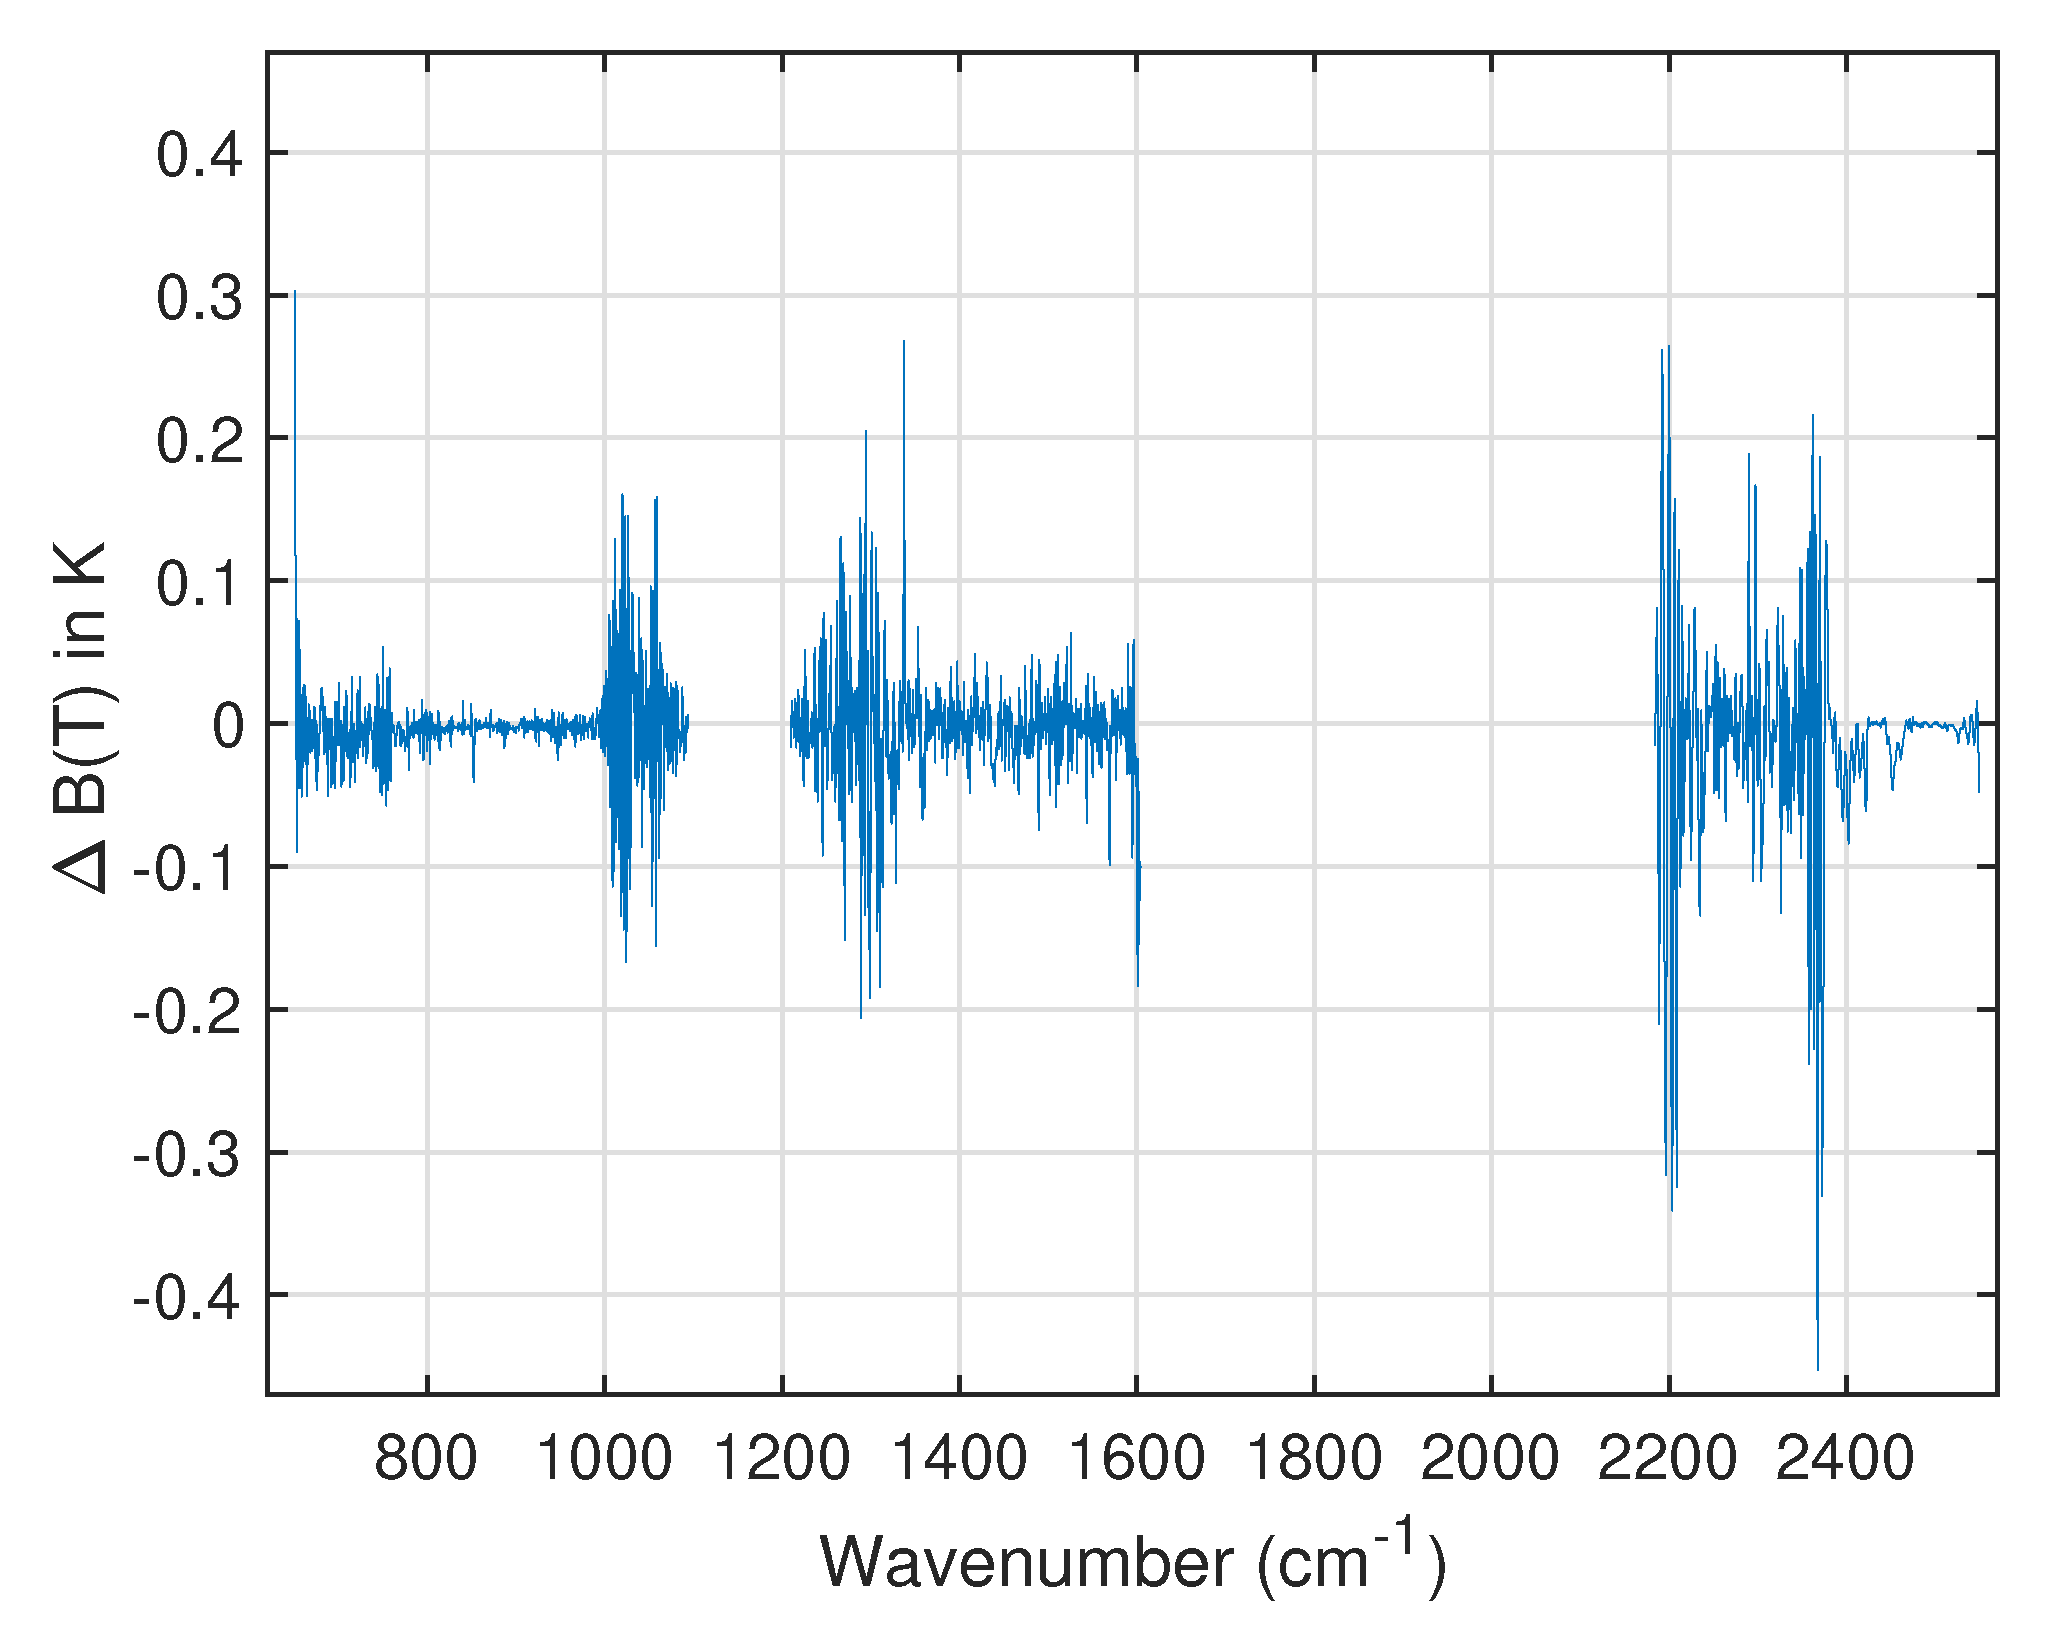
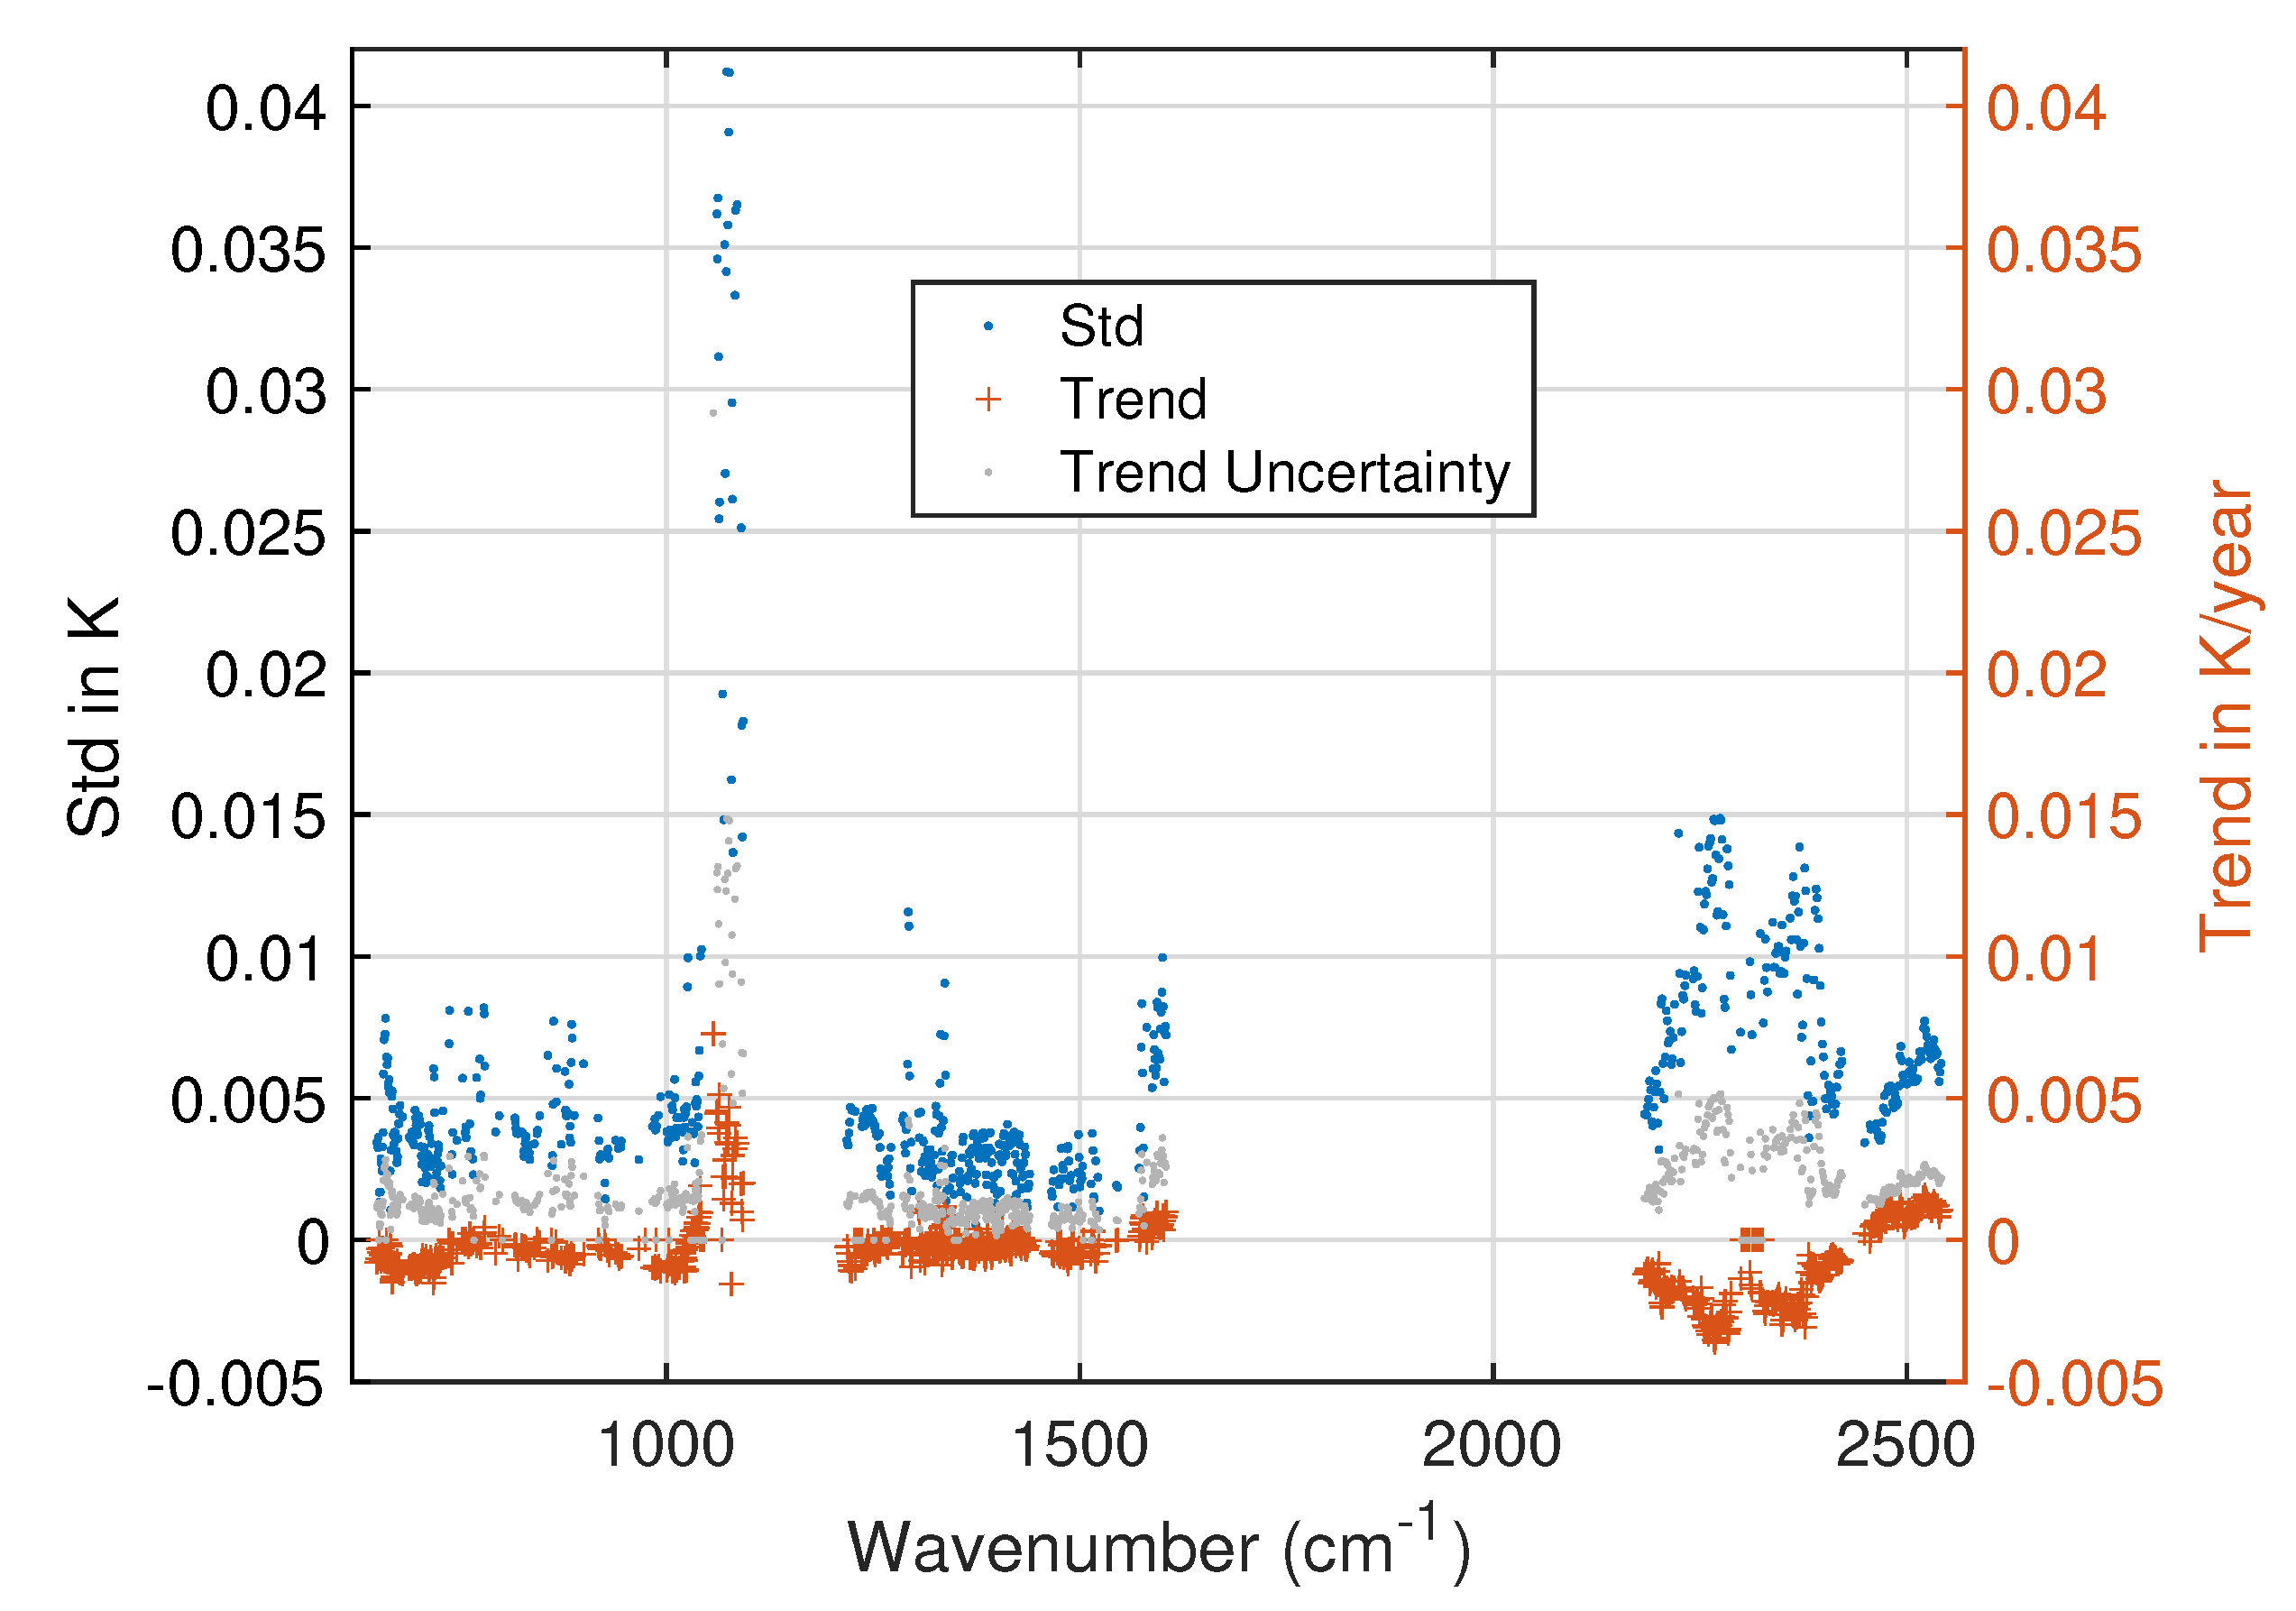
A partial examination of the relative stability of AIRS and SNPP-CrIS is shown in Figure 10 that illustrates the variability in the relative calibration between these two sensors, at least over the nominal 2015–2020 time frame (actual times are 1 March 2015 through 28 February 2020). The standard deviation derived from the five yearly averages of the CHIRP-AQ minus CHIRP-SN calibration bias is seen to generally be below 0.005 K, except in the very cold shortwave channels, and in the AIRS M-05 array, which is well-known to have performance problems. Moreover, a linear fit of the five yearly biases over time has a trend (slope) of nearly zero, as shown in red. The observed trends are all at or below the 2- σ uncertainty in the slope, shown in gray. This emphasizes the unimportance of the exact choice of year for computing the calibration bias offsets, since their relative calibration differences are quite constant in time.

Scene Dependence of (AIRS-SNPP-CrIS) Biases

Removing bias differences between two sensors is the first step in forming accurate long-term satellite radiance measurements. However, detector non-linearity and other effects such as instrument polarization can produce differences in bias-corrected data that could potentially affect scientific conclusions. Modern satellite sounders such as AIRS, CrIS, and IASI are characterized very carefully in pre-flight thermal vacuum testing, including variable scene calibrations in order to quantify non-linearity, etc. Both AIRS [20] and CrIS [2] have undergone extensive studies to minimize detector non-linearity, minimizing scene dependent differences among the radiances records for these satellites.
A simple procedure for inter-comparing scene dependent calibration using the statistical data sets for AIRS and SNPP-CrIS uses the quantile approach of Wilcox et al. [22]. One simply computes the cumulative probability distribution for each data set (here the 3.7 million BT observations for 2018 sets for AIRS and SNPP-CrIS). A probability scale from 0 to 1 in steps of 0.01 (1%) was used to generate the cumulative probably distribution, or quantiles, for each sensor. The maximum and minimum quantile values in this data set are shown in Figure 11, the other 98 quantiles lie in-between these values. The quantiles are computed starting from low BT to highest BT. Therefore, the quantile from 0 to 0.01 in cumulative probability contains the coldest 1% of observations.
The difference between the quantiles for each sensor are a good measure of the differences in scene dependent calibration of these sensors. Simulation tests easily show the power of this approach. Quantiles were computed for each CHIRP channel from the randomly selected AIRS and SNPP-CrIS 2018 data set. Figure 12 plots the BT difference of the AIRS minus SNPP-CRIS quantiles for each channel, separated by band, with the mean BT difference over all quantiles removed in order to highlight the quantile variability. The color scale is the BT quantile difference in K. Although the color scale is ±1 K, all of the quantile differences are well below that level. The differences have structure which can be interpreted by keeping in mind the BT range for each channel and the nominal location in the atmosphere that dominates the emission for each channel and the BT range of each channel.
For example, in general the AIRS stratospheric channels (<700 cm 1 ) are slightly hotter than the SNPP-CrIS channel for cold scenes (quantile fraction 0–0.1 in Figure 12). The midwave band shows almost no scene dependence and the channels that do have non-zero quantile differences are associated with fill channels. The shortwave band shows a clear difference in scene dependence between ~2390 cm 1 and higher compared to lower wavenumbers, but keep in mind that the BT range that corresponds with the quantile fraction varies greatly with wavenumber.
A summary statistic of the scene dependence is given in Figure 13 where we plot the standard deviation, over all quantile fractions, of the quantile differences (from Figure 12). We limit this to non-fill CHIRP channels, i.e., channels with synth_frac < 0.02. Figure 13 shows that these scene difference standard deviations are on the order of 0.02–0.1 K max in the longwave and midwave bands, increasing to 0.06–0.16 K in the shortwave band. These differences are below sensor noise levels and are unlikely to affect retrievals or NWP assimilation. For climate applications, significant scene averaging is generally performed, which will likely minimize any effects of these small scene dependent calibrations.
A persistent feature of Figure 12 appears in the 0.97 and hotter quantiles for surface channels, in all three bands. It is unlikely that the instrument calibrations have such a sharp variation over such a small BT range (5–10 K). This result suggests that CrIS has a hotter calibration for the hottest scenes, i.e., the highest quantiles near unity are blue. The histograms (or PDFs) of the AIRS and CrIS CHIRP BT values for a window channel (900.625 cm 1 ) shown in Figure 14 help explain these window features. In Figure 14a. one cannot differentiate AIRS from CrIS CHIRP counts since they are so similar. Figure 14b. plots the fractional count difference between AIRS and CrIS, per scene BT bin for a 1% statistical sampling of both instrument’s BT values for calendar year 2016. This curve cannot directly provide calibration differences since the BT binning is performed with each instruments reported BT values. However, note that at the highest BT values CrIS has about 10% more hot scenes than AIRS.
A possible cause for CrIS recording more scenes for high BT values is the difference in the AIRS versus CrIS effective field-of-view size. CrIS uses image-motion compensation (to minimize cloud shifts during recording of the interferogram) and therefore has a sharp effective FOV 14 km in diameter. Although AIRS has a nominal 13.5 km FOV size, in the cross-track direction the single footprint sampling is continuous, which results in a slightly larger effective FOV and slightly correlates the cross-track BT measurements. If extremely hot scenes are more likely to have a smaller spatial extent, which is also likely, then CrIS will statistically record more scenes with hot BT values. Although quantitatively unproven (which is possible using co-located MODIS and VIIRS imagery), we believe this provides a reasonable explanation for the somewhat anomalous behavior of the hot quantile differences seen in Figure 12, and suggests that it is not a radiometric calibration issue but a sampling (FOV size) difference. Note that AIRS will appear hotter than CrIS at slightly lower BT quantiles in order to normalize the cumulative probability distribution properly. This discussion highlights non-calibration differences in these instruments that may prove important for some scientific analyses using CHIRP, such as quantification of BT extrema over time.
A final illustration of the accuracy of the CHIRP conversion is given in Figure 15, where histograms of counts for a channel in the 675 cm 1 region are plotted. The conversion of AIRS to the CHIRP SRF removes both SRF shape differences, but, just as important, SRF channel center differences. Histograms of BT counts allow a very detailed examination of the CHIRP conversion. The histogram of AIRS converted to CHIRP BT values for the 675 cm 1 channel are plotted in blue, for all radiances for single day (4 September 2018). The only differences between the native SNPP-CrIS L1b BT values for this channel and the CHIRP values is the Hamming apodization. AIRS and CrIS are in different orbits so there will not be complete agreement between AIRS converted to CHIRP, and CrIS converted to CHIRP, for a single day. However, given the large sampling we expect reasonable agreement, especially for a stratospheric channel. The histogram for the AIRS L1b (native SRF) channel is plotted in yellow. This channel is close to 675.00 cm 1 , offset by only 0.06 cm 1 .
Clearly the CHIRP radiances derived from AIRS and those (in a different orbit) derived from CrIS are highly similar over the full BT range. The AIRS histogram peak is offset by about 2.5 K, mostly due to the different (higher) spectral resolution of AIRS. A remarkable result is the behavior of these histograms in the hot tail near 230 K. Here we see a drop in the histogram of the AIRS and CrIS CHIRP radiances overlaying very closely during a 2-orders of magnitude drop in counts. The native AIRS histogram in this wing also drops quickly, but is clearly offset in BT from the CHIRP histograms. This provides some confidence that the CHIRP conversion of AIRS has very high fidelity.

3.2. CHIRP (NOAA20-CrIS-SNPP-CrIS) Bias Offsets

The CHIRP:J1 and CHIRP:SN bias offsets were also computed two different ways as outlined in the beginning of Section 3. The SNO approach uses IASI (METOP-A) as a transfer standard since there are no SNOs between SNPP and NOAA20. This restricts inter-comparisons of SNPP to NOAA20 CrIS to narrow bands at high latitudes near ±73 , unlike the AIRS:SNPP-CrIS SNOs which include all latitudes, although they are also more numerous at high latitudes, as shown in Figure 6. The latitude sampling of the AIRS:NOAA20:CrIS SNOs are similar to those for the AIRS:SNPP:CrIS SNOs, but since AIRS cannot provide the 1605 to 1750 cm 1 CHIRP channels, IASI SNOs were the better choice for SNO inter-comparisons. The conversion of of IASI radiances to CHIRP format follows the double-fourier transform approach described in [21], except instead of converting to an interferometer with the CrIS OPDs, we convert to the CHIRP OPDs.
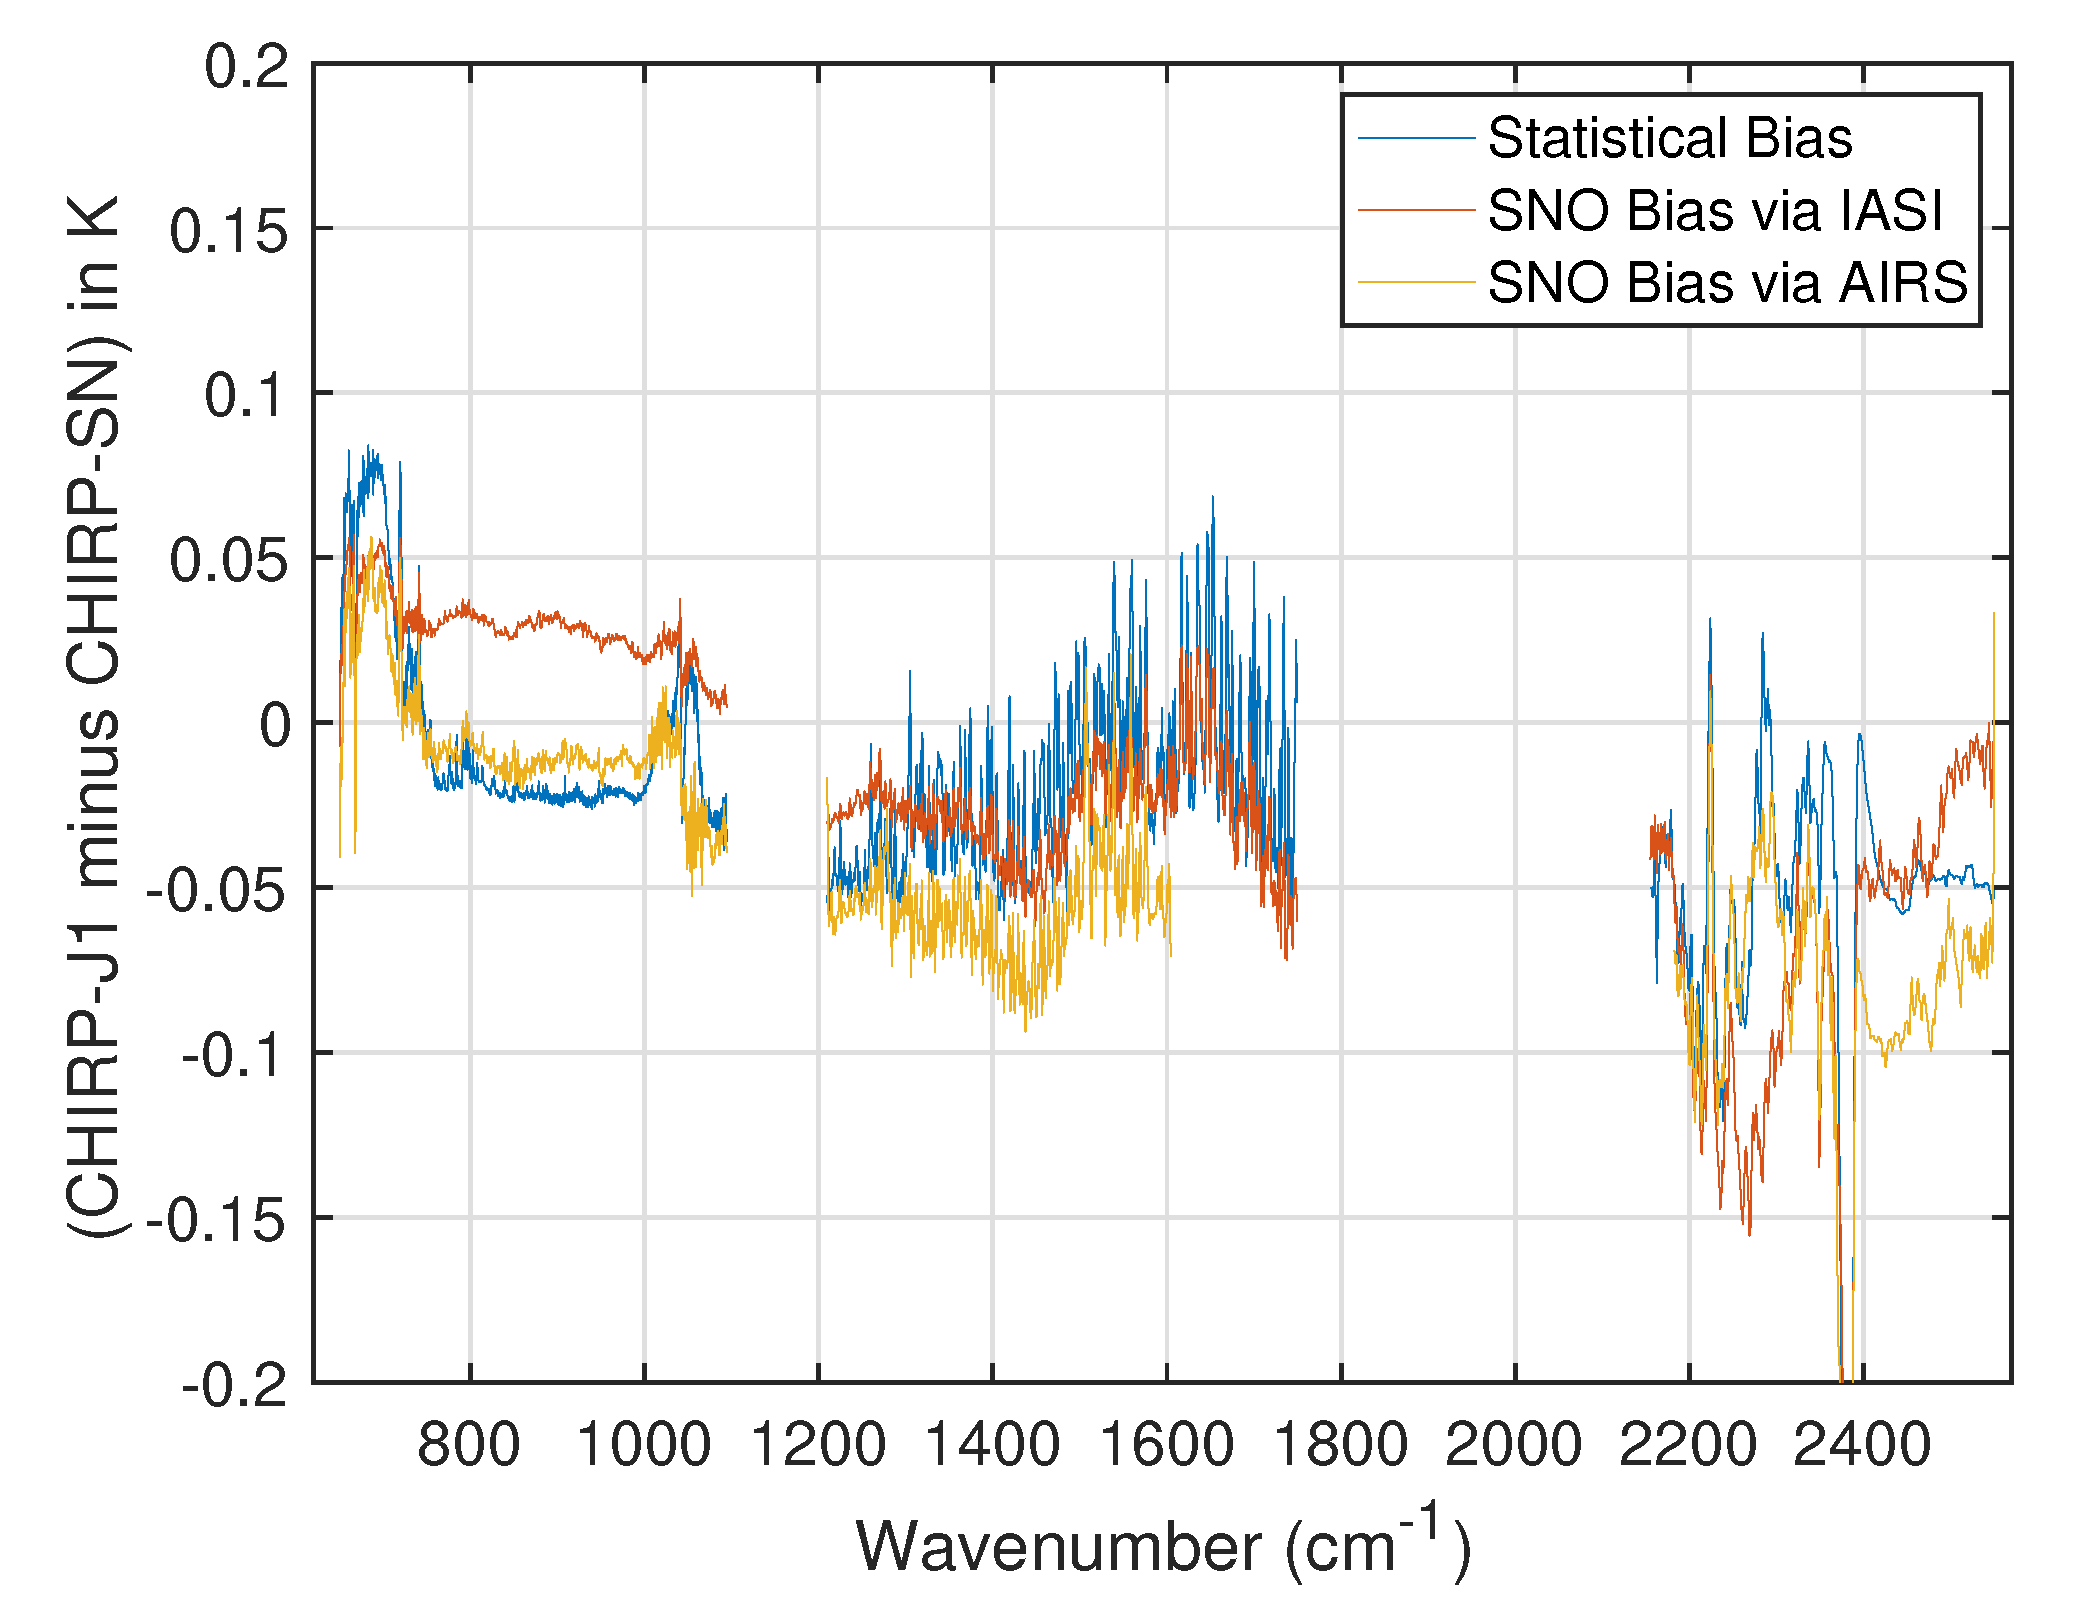
Figure 16 shows the mean biases for the NOAA20 and SNPP-CrIS radiances using (a) the 1% equal-area weighted 2018 statistical data set, (b) SNOs via a double-difference using IASI on METOP-A, and (c) SNOs between AIRS and NOAA20-CrIS, which are missing the high wavenumber end of the midwave band. Note that the BT difference range of this figure is almost 3.5× smaller than the corresponding figure for the AIRS and SNPP:CrIS biases (Figure 8). This is not unexpected since the two CrIS instruments are essentially identical.
The agreement among these three estimates for the NOAA20-CrIS bias offset from SNPP-CrIS appear to vary with band, and vary within the band in the shortwave. As with the AIRS:SNPP-CrIS bias offsets, the statistically derived bias offset is used when creating the CHIRP data set, given its more uniform sampling. Following our discussion of the AIRS:SNPP-CrIS bias errors, a nominal estimate of the uncertainty in the AIRS:SNPP-CrIS bias is the difference between the statistically derived bias and IASI SNO double difference bias. The standard deviation, over all CHIRP channels, between these two bias estimation approaches is 0.008 K ± 0.035 K (statistical minus SNO approach), suggesting that the accuracy of the statistically derived biases is on the order of 0.035 K, very similar to the AIRS:SNPP-CrIS bias estimate uncertainty. These biases are quite similar to those derived by Wang and Chen [21] using small samples of polar-only data, although our peak differences are generally somewhat smaller than their results.
Note that the use of IASI SNOs as a transfer standard to establish calibration offsets between SNPP- and NOAA20-CrIS also suggests that any future gaps that could occur in the overlap of two CrIS instruments in the JPSS series should still permit inter-satellite radiometric calibration corrections. If the “third party” or transfer standard satellite (e.g., IASI) is in operation for a long-enough time period, and this time period overlaps both version of CrIS, then the double-difference SNO approach used here allows for calibration offset corrections between two CrIS sensors that were not in orbit simultaneously. Therefore the CHIRP data product calibration traceability can potentially span CrIS satellite operation gaps if they do not last too long. Larger gaps that cannot use a third-party to inter-calibrate could possibly be corrected using the approaches applied in [9] to estimate AIRS calibration stability, which included identifying offsets in the AIRS radiometry that took place due to instrument shutdowns of days to several weeks. The calibration standards in [9] were the secular in-situ record of CO 2 , N 2 O, and ocean sea-surface temperatures, which are extremely well characterized and are stable enough to establish radiometric stability well below present climate trends.

4. Summary

CHIRP is a new hyperspectral infrared satellite radiance record combining the AIRS and CrIS records, with the possible addition of IASI in the future. CHIRP provides radiances with a common SRF and channel center locations from the beginning of the AIRS record in 2002 through the end of the NOAA/NASA JPSS CrIS record, which will likely be sometime after 2040. Considerable overlaps in the CHIRP record from the source instruments AIRS, SNPP-CrIS (when in FSR mode), and NOAA20-CrIS will allow detailed validation of the CHIRP record once it is produced.
This work provides the definition of the CHIRP product, especially the CHIRP SRF. The long-term stability of the CHIRP product is greatly enhanced by removing static bias offsets among the three sensors contributing to CHIRP. The SNPP-CrIS sensor was chosen as the radiance standard for this version of CHIRP and considerable attention was given to the development of the CH:AIRS and CH:NOAA20 biases relative to CH:SNPP, including estimates of the uncertainties in these bias estimates. The final CHIRP products have these biases removed.
An rough estimate of the apparent stability of CHIRP due to incorrect bias offsets can be made by assuming a worst-case scenario where CHIRP consists of three instruments, each of which lasted for five years. If the calibration offset error between these three instruments is our estimated uncertainty of +0.03 K, the worst case would occur if a +0.03 K offset error was added at the beginning of operation for the second instrument, and an additional 0.03 K added when the third instrument started operation. This produces a linear trend (slope) of 0.005 K/year or 0.05 K/decade. This level of stability is certainly below the average level of climate trends. More rigorous estimates of the stability of CHIRP will be made in the future using the techniques introduced in [9] that used trends in CO 2 and sea-surface temperature climatologies to constrain uncertainties in the stability of the AIRS radiance record.
We also note that bias differences between these sensors are quite small, generally within ±0.1 K for CrIS SNPP versus CrIS NOAA20, and within ±0.2 K (for good AIRS parent channels) for AIRS versus CrIS SNPP. These differences are not unexpected and are generally below the radiance accuracy estimates given for AIRS by Pagano et al. [20] and for CrIS SNPP by Tobin et al. [23].

Author Contributions

Conceptualization, L.L.S. and H.M.; Data curation, S.B.; Formal analysis, C.H. and H.M.; Investigation, S.D.-M.; Software, C.H., H.M. and S.B.; Validation, C.H., H.M. and S.D.-M.; Writing—original draft, L.L.S., C.H. and H.M.; Writing—review & editing, L.L.S., C.H., H.M. and S.D.-M. All authors have read and agreed to the published version of the manuscript.

Funding

This research was funded by NASA Goddard Spaceflight Center to the University of Maryland Baltimore County, Joint Center for Earth Systems Technology, under Task 141.

Conflicts of Interest

The authors declare no conflict of interest. The funders had no role in the design of the study; in the collection, analyses, or interpretation of data; in the writing of the manuscript, or in the decision to publish the results.

References

  1. Aumann, H.H.; Chahine, M.T.; Gautier, C.; Goldberg, M.D.; Kalnay, E.; McMillin, L.M.; Revercomb, H.; Rosenkranz, P.W.; Smith, W.L.; Staelin, D.H.; et al. AIRS/AMSU/HSB on the Aqua Mission. IEEE Trans. Geosci. Remote Sens. 2003, 41, 253. [Google Scholar] [CrossRef] [Green Version]
  2. Han, Y.; Revercomb, H.; Cromp, M.; Gu, D.; Johnson, D.; Mooney, D.; Scott, D.; Strow, L.; Bingham, G.; Borg, L.; et al. Suomi NPP CrIS measurements, sensor data record algorithm, calibration and validation activities, and record data quality. J. Geophys. Res. Atmos. 2013, 118, 12–734. [Google Scholar] [CrossRef]
  3. Hilton, F.; Armante, R.; August, T.; Barnet, C.; Bouchard, A.; Camy-Peyret, C.; Capelle, V.; Clarisse, L.; Clerbaux, C.; Coheur, P.F.; et al. Hyperspectral Earth Observation from IASI: Five Years of Accomplishments. Bull. Am. Meteorol. Soc. 2012, 93, 347–370. [Google Scholar] [CrossRef]
  4. Wielicki, B.A.; Young, D.; Mlynczak, M.; Thome, K.; Leroy, S.; Corliss, J.; Anderson, J.; Ao, C.; Bantges, R.; Best, F.; et al. Achieving Climate Change Absolute Accuracy in Orbit. Bull. Am. Meteorol. Soc. 2013, 94, 1519–1539. [Google Scholar] [CrossRef] [Green Version]
  5. Leroy, S.; Anderson, J.; Dykema, J.; Goody, R. Testing Climate Models Using Thermal Infrared Spectra. J. Clim. 2008, 21, 1863–1875. [Google Scholar] [CrossRef]
  6. Leroy, S.S.; Anderson, J.G.; Ohring, G. Climate Signal Detection Times and Constraints on Climate Benchmark Accuracy Requirements. J. Clim. 2008, 21, 841–846. [Google Scholar] [CrossRef] [Green Version]
  7. Liu, X.; Wu, W.; Wielicki, B.A.; Yang, Q.; Kizer, S.H.; Huang, X.; Chen, X.; Kato, S.; Shea, Y.L.; Mlynczak, M.G. Spectrally Dependent CLARREO Infrared Spectrometer Calibration Requirement for Climate Change Detection. J. Clim. 2017, 30, 3979–3998. [Google Scholar] [CrossRef] [PubMed]
  8. Wielicki, B.; Lukashin, C.; Shea, Y.; Kopp, G.; Pilewskie, P.; Smith, P.; Thome, K.; Limaye, S.; Fleming, G.; Ucker, G.; et al. CLARREO Pathfinder Mission: Calibrating Climate Observing Systems of the Future. In Proceedings of the 15th Conference on Atmospheric Radiation, American Meteorological Society, Vancouver, BC, Canada, 9–13 July 2018. [Google Scholar]
  9. Strow, L.L.; DeSouza-Machado, S. Establishment of AIRS climate-level radiometric stability using radiance anomaly retrievals of minor gases and sea surface temperature. Atmos. Meas. Tech. 2020, 13, 4619–4644. [Google Scholar] [CrossRef]
  10. Cao, C.; Weinreb, M.; Xu, H. Predicting Simultaneous Nadir Overpasses among Polar-Orbiting Meteorological Satellites for the Intersatellite Calibration of Radiometers. J. Atmos. Ocean. Technol. 2004, 21, 537–542. [Google Scholar] [CrossRef]
  11. Weatherhead, E.C.; Harder, J.; Araujo-Pradere, E.A.; Bodeker, G.; English, J.M.; Flynn, L.E.; Frith, S.M.; Lazo, J.K.; Pilewskie, P.; Weber, M.; et al. How long do satellites need to overlap? Evaluation of climate data stability from overlapping satellite records. Atmos. Chem. Phys. 2017, 17, 15069–15093. [Google Scholar] [CrossRef] [Green Version]
  12. Smith, N.; Barnet, C.D. Uncertainty Characterization and Propagation in the Community Long-Term Infrared Microwave Combined Atmospheric Product System (CLIMCAPS). Remote Sens. 2019, 11, 1227. [Google Scholar] [CrossRef] [Green Version]
  13. Motteler, H.E.; Strow, L.L. AIRS Deconvolution and the Translation of AIRS-to-CrIS Radiances With Applications for the IR Climate Record. IEEE Trans. Geosci. Remote Sens. 2019, 57, 1793–1803. [Google Scholar] [CrossRef]
  14. Taylor, J.; Strow, L.; Revercomb, H.; Tobin, D.; Motteler, H.; Braun, J.; Feltz, M.; Garcia, R.; Knuteson, R.; Martin, G.; et al. NASA Cross Track Infrared Sounder (CrIS) Level 1B Delta Algorithm Theoretical Basis Document (ATBD); The National Aeronautics and Space Administration: Washington, DC, USA, 2019. [Google Scholar] [CrossRef]
  15. Strow, L.L.; Hannon, S.E.; Weiler, M.; Overoye, K.; Gaiser, S.L.; Aumann, H.H. Prelaunch spectral calibration of the atmospheric infrared sounder (AIRS). IEEE Trans. Geosci. Remote Sens. 2003, 41, 274–286. [Google Scholar] [CrossRef]
  16. Strow, L.L.; Hannon, S.E.; De-Souza Machado, S.; Motteler, H.E.; Tobin, D.C. Validation of the Atmospheric Infrared Sounder radiative transfer algorithm. J. Geophys. Res. Atmos. 2006, 111. [Google Scholar] [CrossRef]
  17. Aumann, H.; Broberg, S.; Manning, E.; Pagano, T.; Sutin, B.; Strow, L. AIRS Level 1C Algorithm Theoretical Basis Document, Version 6.7; Jet Propulsion Laboratory, California Institute of Technology: Pasadena, CA, USA, 2020. [Google Scholar]
  18. Strow, L.; Hannon, S.; Souza-Machado, D.S.; Motteler, H.; Tobin, D. An overview of the AIRS radiative transfer model. IEEE Trans. Geosci. Remote Sens. 2003, 41, 303–313. [Google Scholar] [CrossRef] [Green Version]
  19. Han, Y.; Suwinski, L.; Tobin, D.; Chen, Y. Effect of self-apodization correction on Cross-track Infrared Sounder radiance noise. Appl. Opt. 2015, 54, 10114. [Google Scholar] [CrossRef] [PubMed]
  20. Pagano, T.S.; Aumann, H.H.; Broberg, S.E.; Cañas, C.; Manning, E.M.; Overoye, K.O.; Wilson, R.C. SI-Traceability and Measurement Uncertainty of the Atmospheric Infrared Sounder Version 5 Level 1B Radiances. Remote Sens. 2020, 12, 1338. [Google Scholar] [CrossRef] [Green Version]
  21. Wang, L.; Chen, Y. Inter-Comparing SNPP and NOAA-20 CrIS Toward Measurement Consistency and Climate Data Records. IEEE J. Sel. Top. Appl. Earth Obs. Remote Sens. 2018, 12, 2024–2031. [Google Scholar] [CrossRef]
  22. Wilcox, R.R. Comparing Two Independent Groups Via Multiple Quantiles. J. R. Stat. Soc. Ser. D 1995, 44, 91–99. [Google Scholar] [CrossRef]
  23. Tobin, D.; Revercomb, H.; Knuteson, R.; Taylor, J.; Best, F.; Borg, L.; DeSlover, D.; Martin, G.; Buijs, H.; Esplin, M.; et al. Suomi-NPP CrIS radiometric calibration uncertainty. J. Geophys. Res. Atmos. 2013, 118, 10589–10600. [Google Scholar] [CrossRef]
Figure 1. Sample BT spectra for the instruments that will contribute to the CHIRP product. Only AIRS is shown on a correct BT scale, the others are offset. Times when CrIS operates in NSR mode (denoted CrIS-Hamming here) are not included in CHIRP.
Remotesensing 13 00418 g001
Figure 2. Illustration of how a CHIRP radiance is created from AIRS for a sample mid-wave CHIRP channel centered at 1420 cm 1 . Note the relatively large number of AIRS channel weights that have very small contributions to the CHIRP channel.
Remotesensing 13 00418 g002
Figure 3. Example showing the magnitude of the statistical correction used in the AIRS to CHIRP translation, after deconvolution of AIRS and reconvolution to the CHIRP spectral resolution. The large ringing near 2200 cm 1 is likely due to fringes in the AIRS spectral response functions that are not accurately accounted for in the AIRS to CrIS conversion.
Remotesensing 13 00418 g003
Figure 4. Accuracy of the CHIRP translation from AIRS using 49 highly variable test radiances. Truth is defined as the AIRS radiance computed from a line-by-line monochromatic radiance spectrum. Bias error in shown in (a), the standard deviation over the 49 profiles in (b), and (a) histogram of the bias errors in (a). are shown in (c). clearly showing that most bias errors are below 0.01 K.
Remotesensing 13 00418 g004
Figure 5. NEdN estimates for the AIRS and CrIS NPP parent CHIRP. The down-interpolation for CrIS parent and the translation for AIRS-parent, together with the Hamming apodization applied to both, have the effect of significantly decreasing NEdN in comparison with the parent measurements.
Remotesensing 13 00418 g005
Figure 6. Latitude sampling for equal area random sampling used here for statistical inter-comparisons, SNO pairs between AIRS and SNPP, and SNO pairs between IASI and SNPP.
Remotesensing 13 00418 g006
Figure 7. Sample CHIRP spectrum with channels containing less than a 0.02 synthetic fraction (from AIRS L1C). In generally low synthetic fraction denotes high quality channels.
Remotesensing 13 00418 g007
Figure 8. BT bias between AIRS and SNPP-CrIS, both converted to the CHIRP spectral response. The colors denote the locations of different AIRS detector modules that contribute to CHIRP. These biases were derived from the 2018, 1 percent random subset of AIRS and SNPP-CrIS radiance, with a small correction for differences in the mean secant angle for each instrument (see text). The black dots represent the difference between these biases, and biases derived from the AIRS and SNPP-CrIS SNOs. Biases derived from both techniques are very similar with a mean difference of ~0.03K.
Remotesensing 13 00418 g008
Figure 9. Zooms of Figure 8. The left and right columns show identical copies of the data from Figure 8. On the left any channel with synth_frac greater than 0.02 is highlighted with a circle whose color denotes the fractional value of CHIRP product synth_frac for that channel as defined in the colorbar. The right hand column highlights the AIRS module array colors used to generate those CHIRP channel (same colors as in Figure 8) as well as the wavenumber locations of AIRS L1c fill channels (gray lines and circles). Red circles for the midwave, left column, indicate regions with high fill values located where AIRS L1c channels exist, but are very noisy or contain dead detectors.
Remotesensing 13 00418 g009
Figure 10. Measures of variability in the CHIRP-AQ minus CHIRP-SN calibration bias (as shown in Figure 8) derived from five yearly averages of the bias (∼2015–2020). Blue is the standard deviation of the calibration bias over the five years. The linear trend in these biases, again over five years, is plotted in red, and the 2- σ uncertainty in that trend is plotted in gray. Note that these metrics of variability in the instrument calibration biases are very small compared to uncertainties in the inter-instrument bias corrections of ∼0.03 K as discussed in the text.
Remotesensing 13 00418 g010
Figure 11. BT values for maximum (quantile 0.99–1.00) and minimum (quantile 0.00–0.01) returned by a 100-bin cumulative probability calculation on the 1% equal-area sampling of CHIRP-AQ and CHIRP-SN radiances for 2018. Quantiles had constant cumulative probability steps of 0.01 (1% probability).
Remotesensing 13 00418 g011
Figure 12. CHIRP-AQ cumulative probability quantile values minus the CHIRP-SN quantiles. Color scale is in Δ BT. Note that window channels in the higher quantiles (0.97) are hotter for AIRS, then turning colder in the last few quantiles. This may be due to CrIS’s slightly smaller field-of-view which leads to slightly more observations of very hot scenes.
Remotesensing 13 00418 g012
Figure 13. The standard deviation in K of the quantile differences shown in Figure 12, taken over the 100 cumulative probability quantiles. Only channels where the CHIRP-AQ fill values are less than 0.02 are shown.
Remotesensing 13 00418 g013
Figure 14. Histogram of CHIRP-AQ and CHIRP-SN observations for the 1% random sampling of the 900.625 cm 1 channel for calendar year 2016. The AIRS and CrIS results overlay in panel (a). In panel (b). the fractional count difference, per BT bin, is displayed showing a significantly more hot observations by CrIS compared to AIRS past 320 K.
Remotesensing 13 00418 g014
Figure 15. Histogram of 1-day’s worth of global BT observations for the (i) CHIRP-AQ channel at 675 cm 1 , (ii) CHIRP-SN channel at 675 cm 1 , and (iii) closest AIRS channel at 674.94 cm 1 . For 1-day’s worth of data CHIRP:AQ will not necessarily be exactly the same as CHIRP-SN since they are in different orbits. However, note the high similarity between CHIRP-AQ and CHIRP-SN, especially in the high BT wing of the histogram.
Remotesensing 13 00418 g015
Figure 16. BT bias between NOAA20 and SNPP CrIS instruments, both converted to the CHIRP spectral response. These biases were derived from a 1-year 1 percent random subset of all NOAA20 and SNPP-CrIS radiances. Also shown are the SNO biases derived from either AIRS or IASI. Unlike Figure 8, these are double difference SNOs, ie SNO(NOAA20 − IASI) − SNO(SNPP − IASI) = SNO(NOAA20-SNPP), and similarly using AIRS as the SNO intermediary.
Remotesensing 13 00418 g016
Table 1. CHIRP bands and their spectral resolution relative to CrIS normal spectral resolution (NSR) and high spectral resolution radiances (FSR), with associated maximum optical path differences (OPD).
LongwaveMidwaveShortwave
Spectral Range CHIRP-SN,-J1 (cm 1 )650–10951210–17502155–2550
Spectral Range CHIRP-AQ (cm 1 )650–10951210–16052183–2550
Wavenumber spacing (cm 1 )0.6250.8331.250
NSR OPD (cm)0.80.40.2
FSR OPD (cm)0.80.80.8
CHIRP OPD (cm)0.80.60.4
CHIRP Resolution
Relative to NSR100%150%200%
Relative to FSR100%75%50%
Publisher’s Note: MDPI stays neutral with regard to jurisdictional claims in published maps and institutional affiliations.

