Article

Exploring Annual Urban Expansions in the Guangdong-Hong Kong-Macau Greater Bay Area: Spatiotemporal Features and Driving Factors in 1986–2017

1
MNR Key Laboratory for Geo-Environmental Monitoring of Great Bay Area & Guangdong Key Laboratory of Urban Informatics & Shenzhen Key Laboratory of Spatial Smart Sensing and Services, Shenzhen University, Shenzhen 518060, China
2
College of Civil and Transportation Engineering, Shenzhen University, Shenzhen 518060, China
3
Department of Earth System Sciences, Tsinghua University, Beijing 100084, China
4
Department of Geological and Atmospheric Sciences, Iowa State University, Ames, IA 50011, USA
5
School of Architecture & Urban Planning, Shenzhen University, Shenzhen 518060, China
*
Author to whom correspondence should be addressed.
Remote Sens. 2020, 12(16), 2615; https://doi.org/10.3390/rs12162615
Submission received: 13 July 2020 / Revised: 5 August 2020 / Accepted: 10 August 2020 / Published: 13 August 2020
(This article belongs to the Special Issue Urban Land Use Mapping and Analysis in the Big Data Era)

Abstract

:
The Guangdong–Hong Kong–Macau Greater Bay Area (GBA) of China is one of the largest bay areas in the world. However, the spatiotemporal characteristics and driving mechanisms of urban expansions in this region are poorly understood. Here we used the annual remote sensing images, Geographic Information System (GIS) techniques, and geographical detector method to characterize the spatiotemporal patterns of urban expansion in the GBA and investigate their driving factors during 1986–2017 on regional and city scales. The results showed that: the GBA experienced an unprecedented urban expansion over the past 32 years. The total urban area expanded from 652.74 km2 to 8137.09 km2 from 1986 to 2017 (approximately 13 times). The annual growth rate during 1986–2017 was 8.20% and the annual growth rate from 1986 to 1990 was the highest (16.89%). Guangzhou, Foshan, Dongguan, and Shenzhen experienced the highest urban expansion rate, with the annual increase of urban areas in 51.51, 45.54, 36.76, and 23.26 km2 y−1, respectively, during 1986–2017. Gross Domestic Product (GDP), income, road length, and population were the most important driving factors of the urban expansions in the GBA. We also found the driving factors of the urban expansions varied with spatial and temporal scales, suggesting the general understanding from the regional level may not reveal detailed urban dynamics. Detailed urban management and planning policies should be made considering the spatial and internal heterogeneity. These findings can enhance the comprehensive understanding of this bay area and help policymakers to promote sustainable development in the future.

Graphical Abstract

1. Introduction

Over the past decades, an unprecedented urbanization process and urban land expansion have occurred globally. From 1900 to 2018, the global urban population rate increased from 10% to 55.3% [1]. With the demand of cities construction and booming population, rapid urban land expansions have occurred. The global urban areas have quadrupled during 1970–2000 and are expected to triple by 2030 [2,3]. As the most drastic land-use/land-cover change [4,5], urban expansion has profoundly changed the Earth’s eco and socioeconomic systems [6,7]. It brings not only industrial development, economic growth, and population aggregation, but also environmental pollution (e.g., air pollution [8], water pollution [9], and soil pollution [10]), urban heat-island effect, and biodiversity reduction [6,11,12]. However, the causes, processes, patterns, and consequences of urban expansion still remain unclear [13]. Therefore, it is of great significance to study the temporal and spatial characteristics of urban expansion and identify the driving factors to understand the mechanism and process of urbanization and support the sustainable development of cities.
As the most populous country in the world, China has experienced overwhelming urbanization since the implementation of ‘the reform and opening-up’ policy in 1978 [3,14]. For the period of 1978 to 2018, the urban areas in China expanded about 6 times, with the urbanization level soaring to 59.58% and urban citizens reaching 831.37 million in 2018 [15]. Besides the three traditional large urban agglomerations: the Yangtze River Delta, the Pearl River Delta, and the Jing–Jin–Ji region, China put forward and attached great importance to the new ‘Guangdong–Hong Kong–Macau Great Bay Area’ (GBA). The GBA is one of the most populous, open, and economically developed areas in China and is expected to be a world-famous super-urban agglomeration in the future. Therefore, as a typical example of the remarkable urbanization in China, studying the spatiotemporal evolution and driving forces of the GBA can contribute to the regional urban planning and sustainable development, and provide a reference to other urban agglomerations [16,17].
Remote Sensing (RS) provides a dynamic, effective, and spatially explicit method to detect the urban expansion processes on different scales [18]. Many studies have been conducted to study urban expansion with RS techniques all over the world [3,19,20,21,22]. Thanks to the newly developed heterogeneous, long-term, and high-resolution RS dataset, researchers could avoid duplicate efforts and concentrate more on the practical issues and the application of urban information to build sustainable and healthy cities. These applications also enlarge the influence of the dataset and in turn boost the development of RS. Currently, most studies mainly focused on the urban expansion of the individual city and urban agglomeration for several years [23,24], very few studies detected the annual urban expansion process with the high-resolution dataset for a long time period. For the GBA, Yang et al. [25,26] studied the spatiotemporal evolution and inducing ecological quality changes of the GBA for the years 1987, 1997, 2007, and Liu et al. [27] used the modified liner spectral mixture analysis method to extract the impervious surface of the GBA for every five years during 1987-However, they only studied the urban evolution processes for every few years. To our knowledge, no study was found to assess the annual urban expansion and driving factors in the GBA yet. Moreover, as stated in previous studies, studying the driving factors quantitatively and combing with socio-economic data are necessary to understand the process of urban expansion and support the sustainable development of the GBA.
After detecting urban expansion with RS techniques, identifying the driving forces of urban expansion is crucial to advance our understanding of the urban evolution processes and mechanisms [13]. Previous studies showed that the key determinants of urban expansion in China included physical and socio-economic factors [28,29,30,31,32]. Physical factors, including topological factors (slope and elevation), spatial proxy factors, and neighborhood factors are considered important factors affecting urban expansion [12,29]. Socio-economic factors, such as Gross Domestic Product (GDP), population, and policies influenced urban expansion [33,34,35]. However, many studies only analyzed the driving factors of single cities [30]. Some studies studied the driving mechanism of urban land expansion with different quantitative methods, such as bivariate regression [36,37], multiple linear regression [3], logistic regression [16], and analytic hierarchy process [38]. Most of these methods can calculate the relative importance of different factors quantitatively, but can not determine the interactive effects of several driving factors [39]. In addition, the spatial stratified heterogeneity of driving factors should be considered. Geographical Detector is a statistical method to reveal the driving factors behind urban expansion, considering both the spatial stratified heterogeneity and the interaction among driving factors [40]. Therefore, geographical detector can be used to study the main driving factors and their interactions behind urban expansion.
In this study, the spatiotemporal dynamics and driving forces of urban expansion in the GBA were investigated over 1986–With long-term annual RS data integrated with GIS techniques and geographical detector, (1) the annual spatiotemporal distribution of urban areas was mapped and the spatiotemporal patterns of urban expansion were quantified; (2) the temporal changes and spatial heterogeneity were analyzed on regional and city scales; (3) the driving forces of urban expansion were quantified, considering both physical and socioeconomic factors. The policy implications of the results were discussed. The results could help to develop this bay area sustainably and provide useful insights to urban planning, urban management, and future sustainable urbanization.

2. Materials and Methods
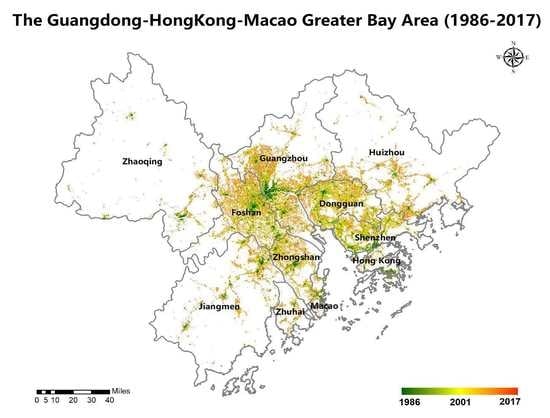
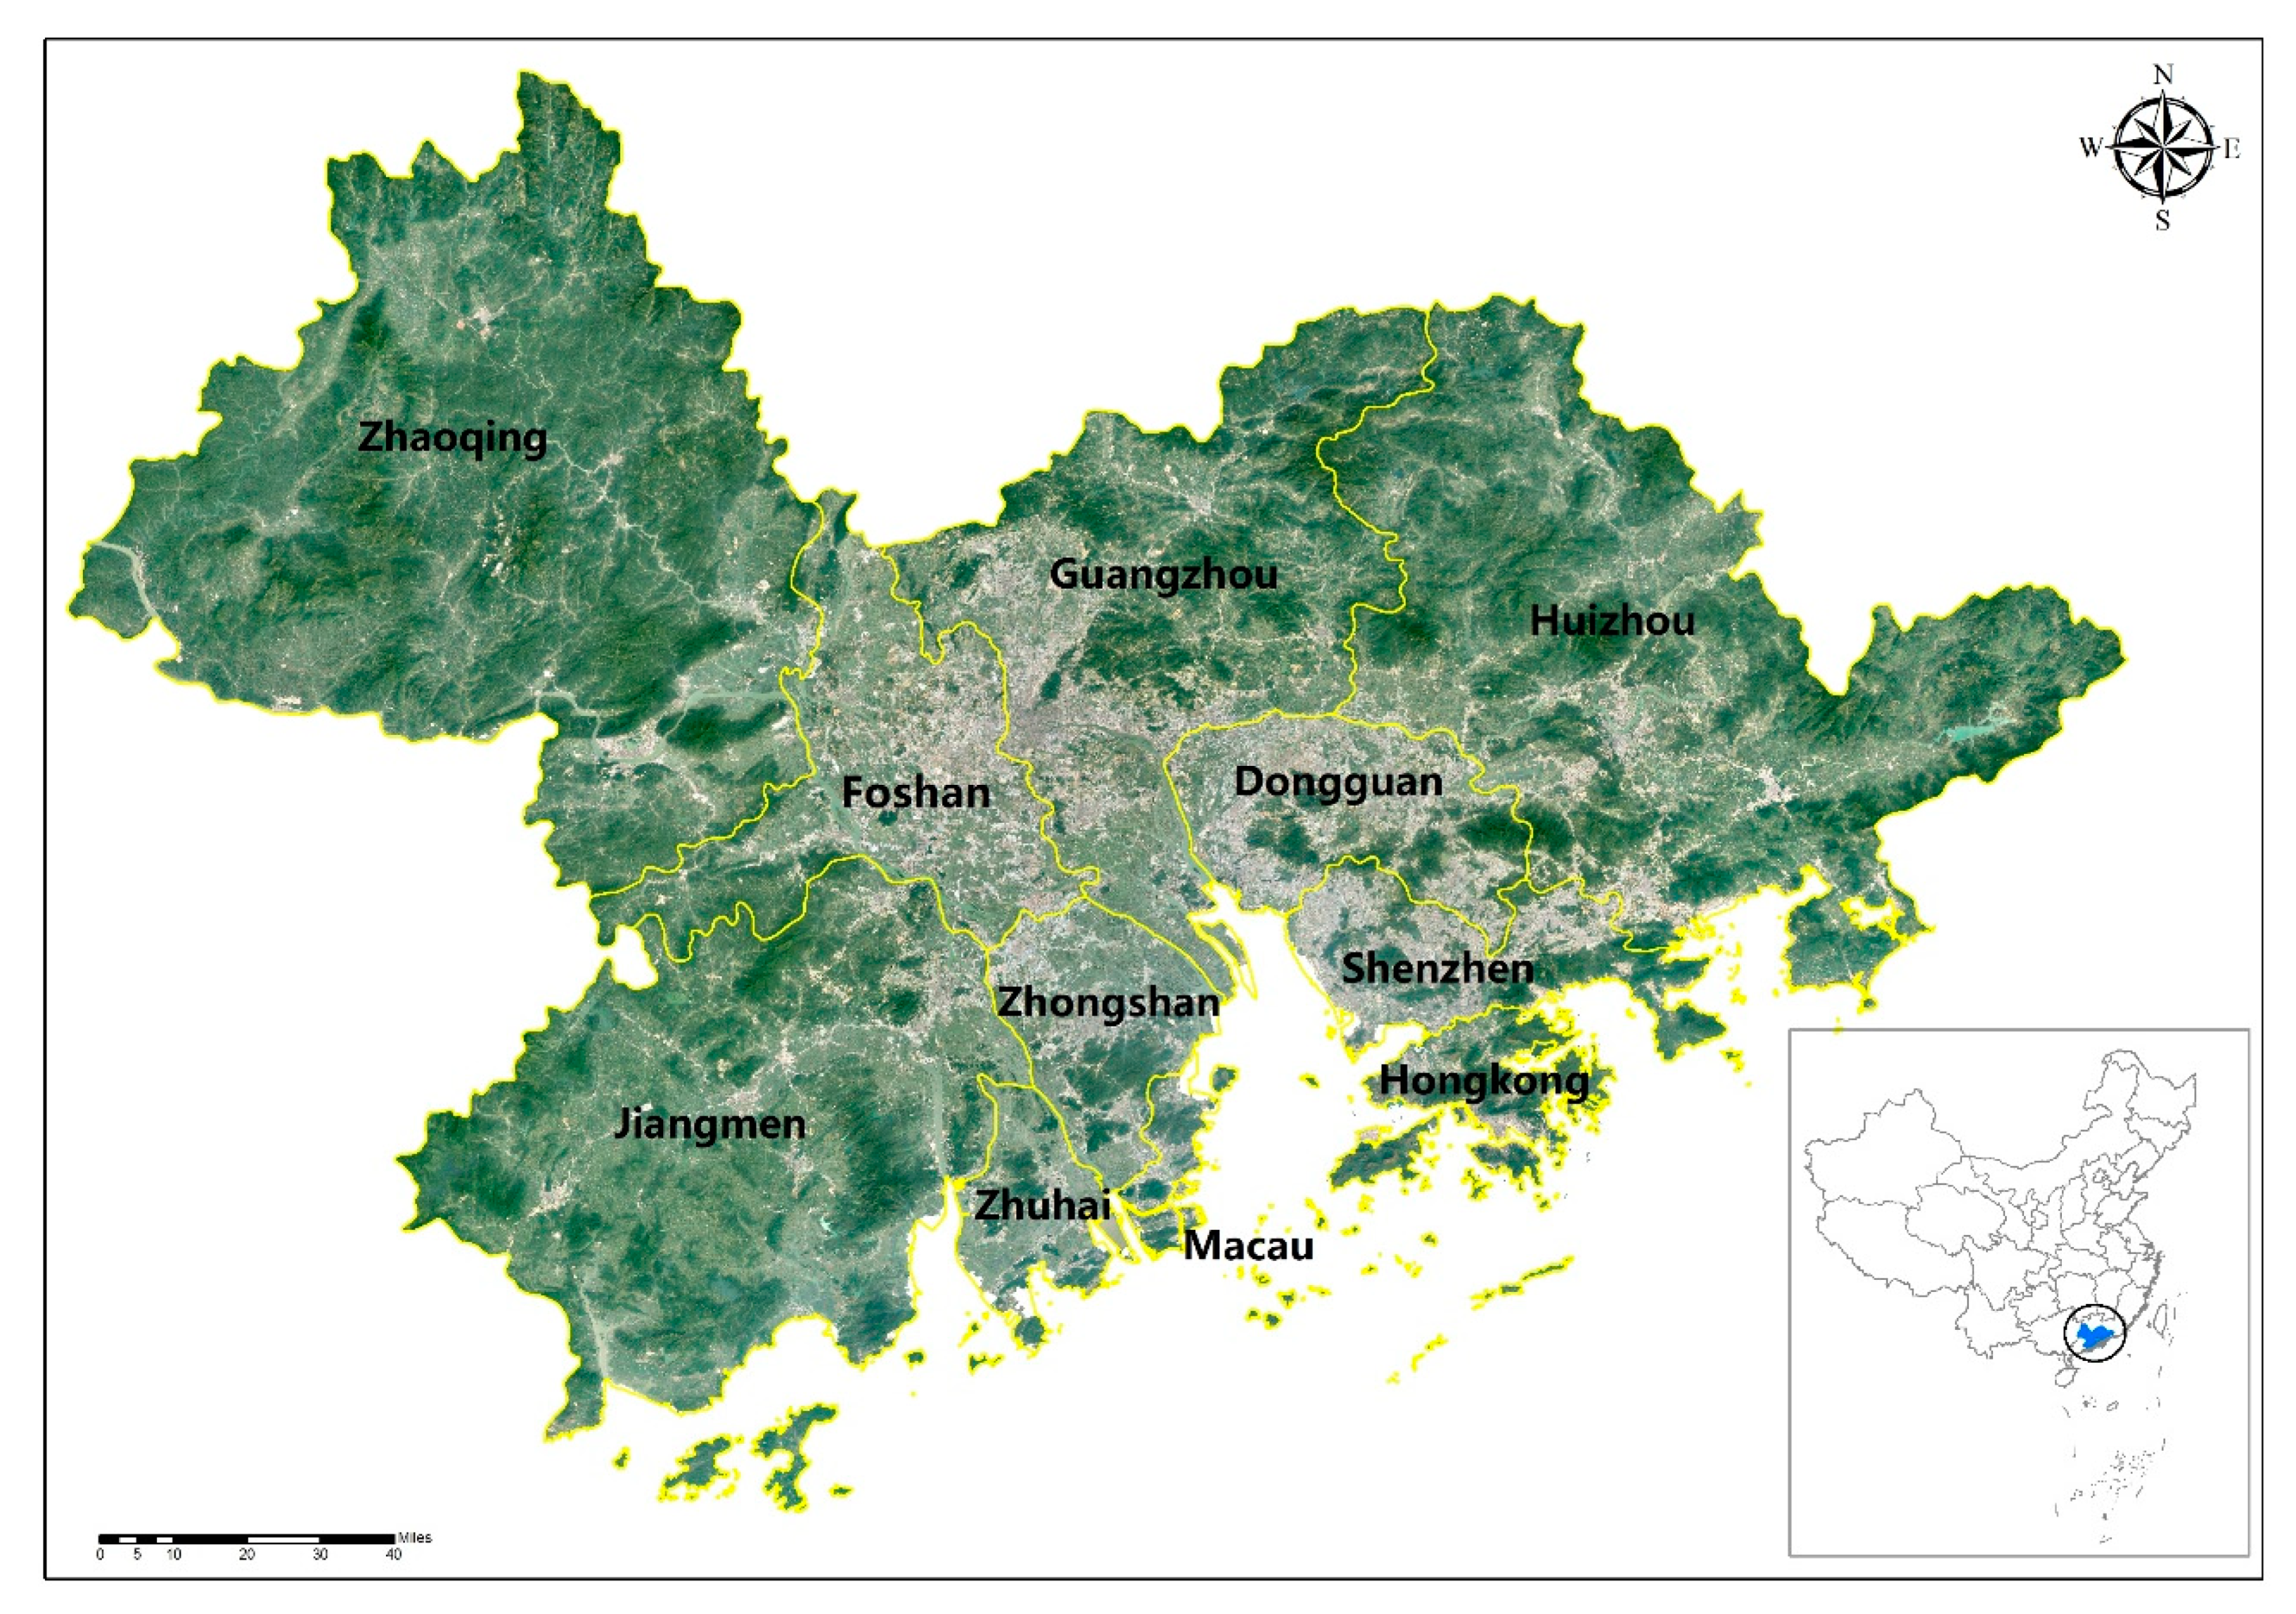
2.1. Study Area

The GBA located in the southern coastal area of China (21°32′–24°26′N, 111°20′–115°24′E). It includes Hong Kong, Macau, and nine cities in Guangdong Province (Guangzhou, Shenzhen, Foshan, Jiangmen, Zhongshan, Huizhou, Dongguan, Zhaoqing, and Zhuhai) (Figure 1), with a population of about 70 million and a total area of about 56,000 km2 (Table 1). This bay area is one of the most economically developed and open areas in China. It has numerous high-tech industries, manufacturing factories, international companies, financial services, and educational resources, contributing to 12.57% of China’s GDP (10.87 trillion yuan = 1.64 trillion US dollars) with 0.6% of China area in 2018 [15]. It is a typical example of the remarkable urbanization in China and the gateway of China to access the world. China government pays much attention to the construction and development of the GBA. According to the development plan for Guangdong-Hong Kong—Macau Greater Bay Area [41], the GBA is considered as a key strategic area for China’s development. Numerous polices and plans have been announced to simulate regional development (Table S1).

2.2. Data Sources and Processing

Impervious surface is the most significant feature of human settlements and it is widely used to represent the urban areas [42]. Timely, accurate, and frequent information on urban areas is fundamental for urban monitoring and management. In this study, we used a dataset of impervious surfaces for China during 1986–2017 with annual temporal resolution and 30 m spatial resolution [43]. This dataset was developed based on Landsat images from NASA and processed on the Google Earth Engine platform. It is the first dataset with annual urban area in China and high spatial details [43]. In previous studies, the best maps of urban areas are only made for every five years [44]. The dataset was proven to be reliable with overall classification accuracies of evaluation reaching more than 90% [43]. Before, the maps of the GBA only existed for every ten years (i.e., 1987, 1997, 2007, and 2017) [25]. The annual dataset can provide more timely and detailed information on urban expansion of the GBA.
For analyzing the driving factors, elevation and slope were calculated from the digital elevation model (DEM) of the Space Shuttle Radar Topography Mission (SRTM) provided by NASA (Table 2). Slope was calculated from the DEM with the ‘slope’ function (in the ‘Spatial Analyst’ module) in ArcGIS 10.5 software. The socioeconomic data of the 11 cities were derived from national, regional, and city statistics data during 1986–2017, including population, financial income, GDP, and road length [45,46,47,48].

2.3. Urban Expansion Anallysis

Three indexes, annual increase (AI, km2 y−1), expansion intensity (EI, %), and annual growth rate (AGR, %) [21,49], were used to quantify the magnitude and intensity of urban expansion. AI and EI can directly measure the annual change and intensity of urban areas and they are useful for comparing urban expansion over different periods in the same area [21,49]. AGR eliminates the effect of city size and measures the urban expansion of different cities in the same period [21,49]. The indexes were defined as follows (Equations (1)–(3)).
A I = A e n d A s t a r t n
E I = A e n d A s t a r t n × A s t a r t
A G R = [ ( A e n d A s t a r t ) 1 n 1 ] × 100 %
where AI, EI, and AGR represent the annual increase area, expansion intensity, and growth rate of different urban areas, respectively. Astart and Aend represent the urban areas at the starting and end year. N represents the number of spanning years.

2.4. Drving Forces Analysis

2.4.1. Potential Driving Factors and Sources

The potential socioeconomic and physical driving factors were considered according to previous studies [12,50,51] (Table 2).
The socioeconomic factors include three driving forces: population (Pop), Gross Domestic Product (GDP), and local financial income (Income). Pop is a crucial factor of urban expansion. Since economic development is usually the preferential goal of local governments and urban expansion is largely dependent on the revenue from “local land finance”, GDP is an important variable to promote rapid urban expansion [34]. Income is the basic fund guarantee for urban construction and development. The raw data for these three driving factors for each city, Hong Kong, and Macau were derived from the China statistical yearbook, the China city statistical yearbook, the Guangdong provincial statistical yearbook, and the Hong Kong, and Macau statistical yearbooks [45,46,47,48,52].
The physical factors contain four quantitative variables: Elevation, Slope, Dis2city, and Road. Elevation and Slope represent the physical characteristics of the city and they are the restricting factors of urban expansion, especially for the areas with worse natural conditions and limited space [53]. They were calculated from the SRTM 30 m DEM with ArcGIS 10.5 and they do not change over time as the inherent property (Table 2).
The distances to the center city (Dis2city) were considered as spatial proxy factor. This variable influenced urban expansion via locational effects on a small scale. Areas close to central cities were expected to have a higher likelihood of urban expansion because they have greater access to socio-economic resources at lower transport costs. Here, Hong Kong was defined as the center city and Dis2city was calculated using the “Euclidean Distance Analysis” and “Zonal Statistics” tools in ArcGIS 10.5 and did not change over time as the inherent property.
The total road length in each administrative area (Road) was used as the infrastructure factor to show transportation accessibility, which usually guides urban expansion [54]. Usually, the regions with longer road length and advanced transportation are easier to access other regions and can expand quickly. Transportation infrastructure in the GBA has greatly improved in the last few decades. It was derived from the China statistics yearbook, the China city statistical yearbook, the Guangdong provincial statistical yearbook, and the Hong Kong, and Macau statistical yearbook [45,46,47,48].

2.4.2. Geographical Detector

The geographical detector method is a spatial statistical method to study the relationship between geographical phenomena (Y) and the explaining factors (X) [55]. It includes four detectors: factor detector, risk detector, ecological detector, and interaction detector [56]. The factor detectors can quantitatively calculate the relative importance of determinants. In this study, Y was defined as the intensity of the urban expansion and X was defined as the physical and socio-economic factors. By using the geographical detector, the power of determinant (q) was calculated to measure the affinity between urban expansion and driving factors (Equation (4)) [56]:
q = 1 1 N δ 2 i = 1 L N i δ i 2
where N is the number of samples, Ni is the number of samples in each category, and L is the number of classification categories. δ2 is the variance of Y and δi2 is the variance for each classification category Y. q € [0, 1] and q = 1 indicates that Y is completely determined by X while q = 0 indicates there is no association between Y and X. A higher value of q indicates a stronger spatially stratified heterogeneity of Y [55].
The interaction detector shows the inter-relationship among the driving factors, whether they depend on each other and they are weakened or enhanced by each other [40]. In this study, the factor detector and interaction detector were used to explore which were the important driving factors, how much they contributed, and how different factors interacted with each other. We used the K-means algorithm to categorize the variables. Details of the method can be found in Wang et al. [40].

3. Results

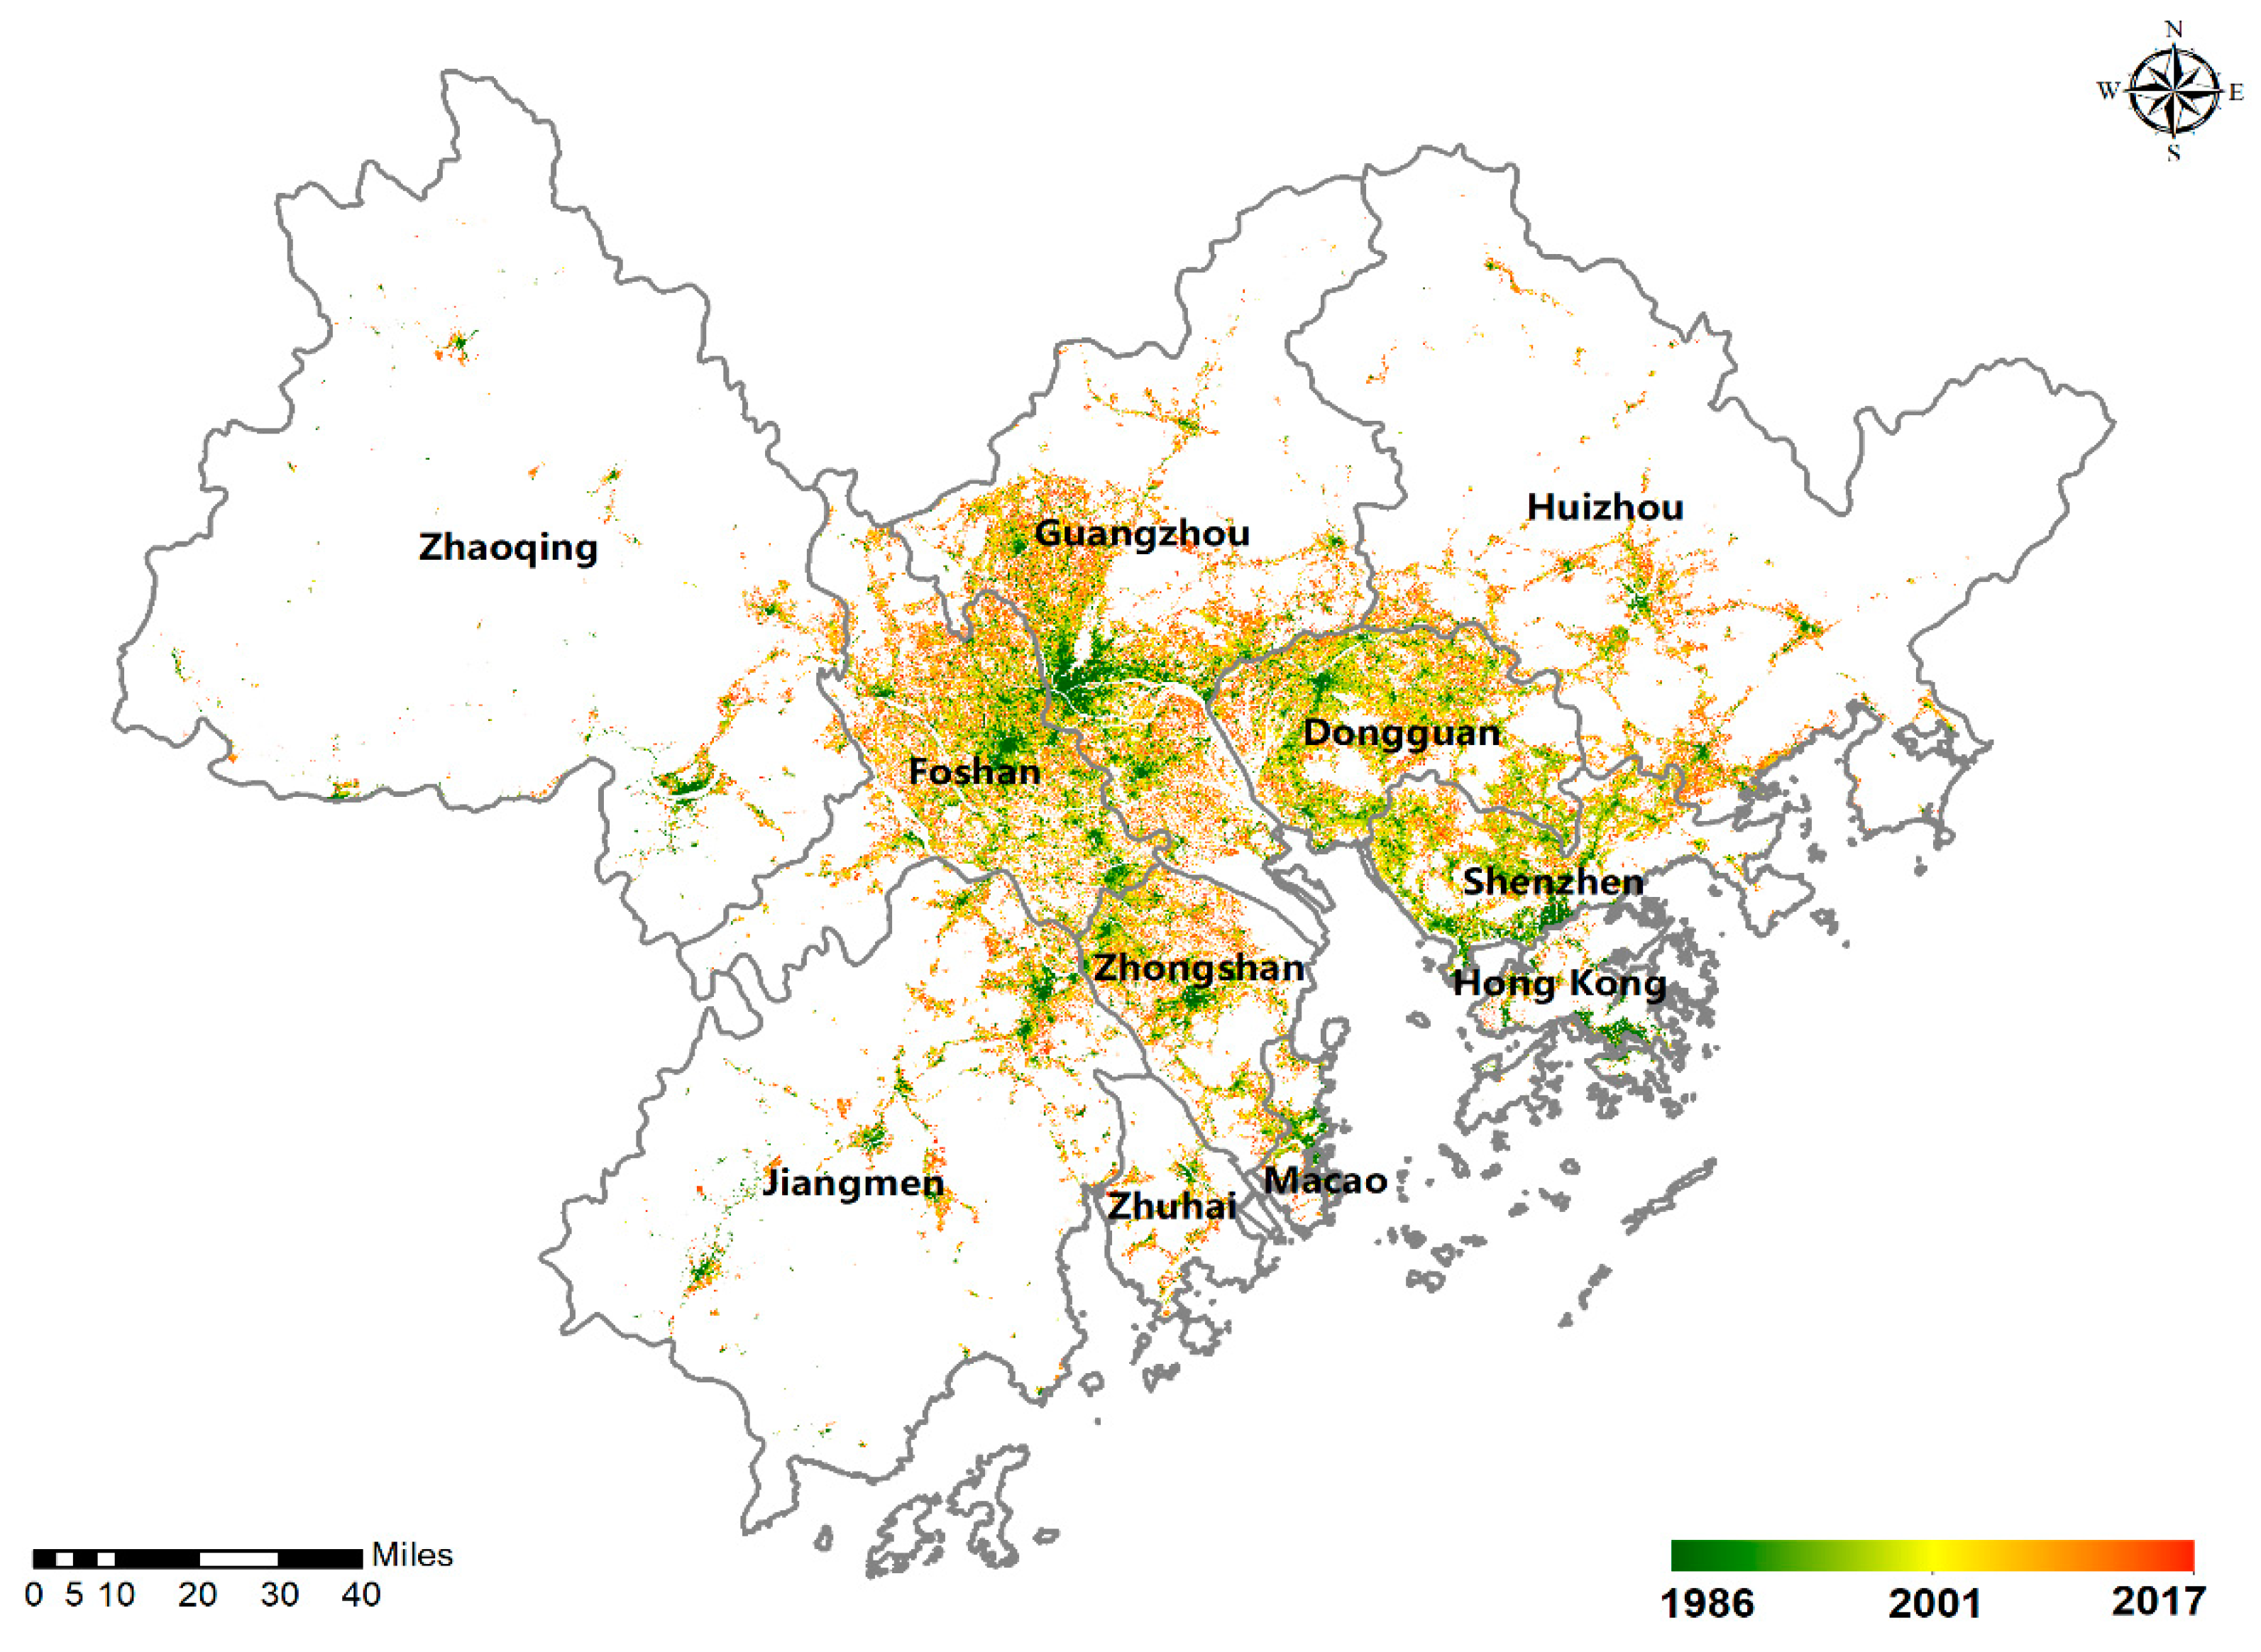
3.1. Urban Expansion in the GBA

Table 3 shows the urban area, annual urban area change, AI, EI, and AGR of the GBA from 1986 to 2017. The results show that over the past 32 years, the GBA has experienced considerable and dramatic urban expansion (Table 3 and Figure 2). The urban area increased dramatically from 652.74 km2 in 1986 to 8137.09 km2 in 2017 (about 13 times), accounting for 1.18% and 14.70% of the local territory area, respectively (Table 3). Detailed annual urban area changes are shown in Table S2. The 1990–1995 period had the biggest AI of 218.02 km2 y−1 (EI and AGR equal 15.30% and 11.47% in 1990–1995, respectively), followed by 2005–2010 (216.96 km2 y−1), 2000–2005 (203.19 km2 y−1), 1995–2000 (192.01 km2 y−1), and 2010–2015 (186.51 km2 y−1). The values of EI and AGR were the highest during 1986–1990 (23.65% and 16.89%, respectively) and decreased to 2.91% and 2.72% during 2010–2015, respectively. The results showed that 1986–1990 was the period with the highest annual growth rate while the urban expansion slowed down in recent years but still with significantly increasing rates. Detailed annual changes of AI, EI, and AGR are shown in Table S3.
Detailed spatial and temporal changes of urban expansion in the GBA during 1986–2017 are shown in Figure Foshan, Dongguan, Zhongshan, and Shenzhen were the cities with the biggest urban expansion. In 1986, the original urban areas mainly focused on Hong Kong, Macau, central Foshan, central Dongguan, and western Guangzhou. In 2017, the urban areas of the GBA mainly focused in the central area of the GBA, adjacent to the Pearl River Estuary. Zhaoqing, Jiangmen, Huizhou, and Zhuhai still held large areas not developed yet in 2017.

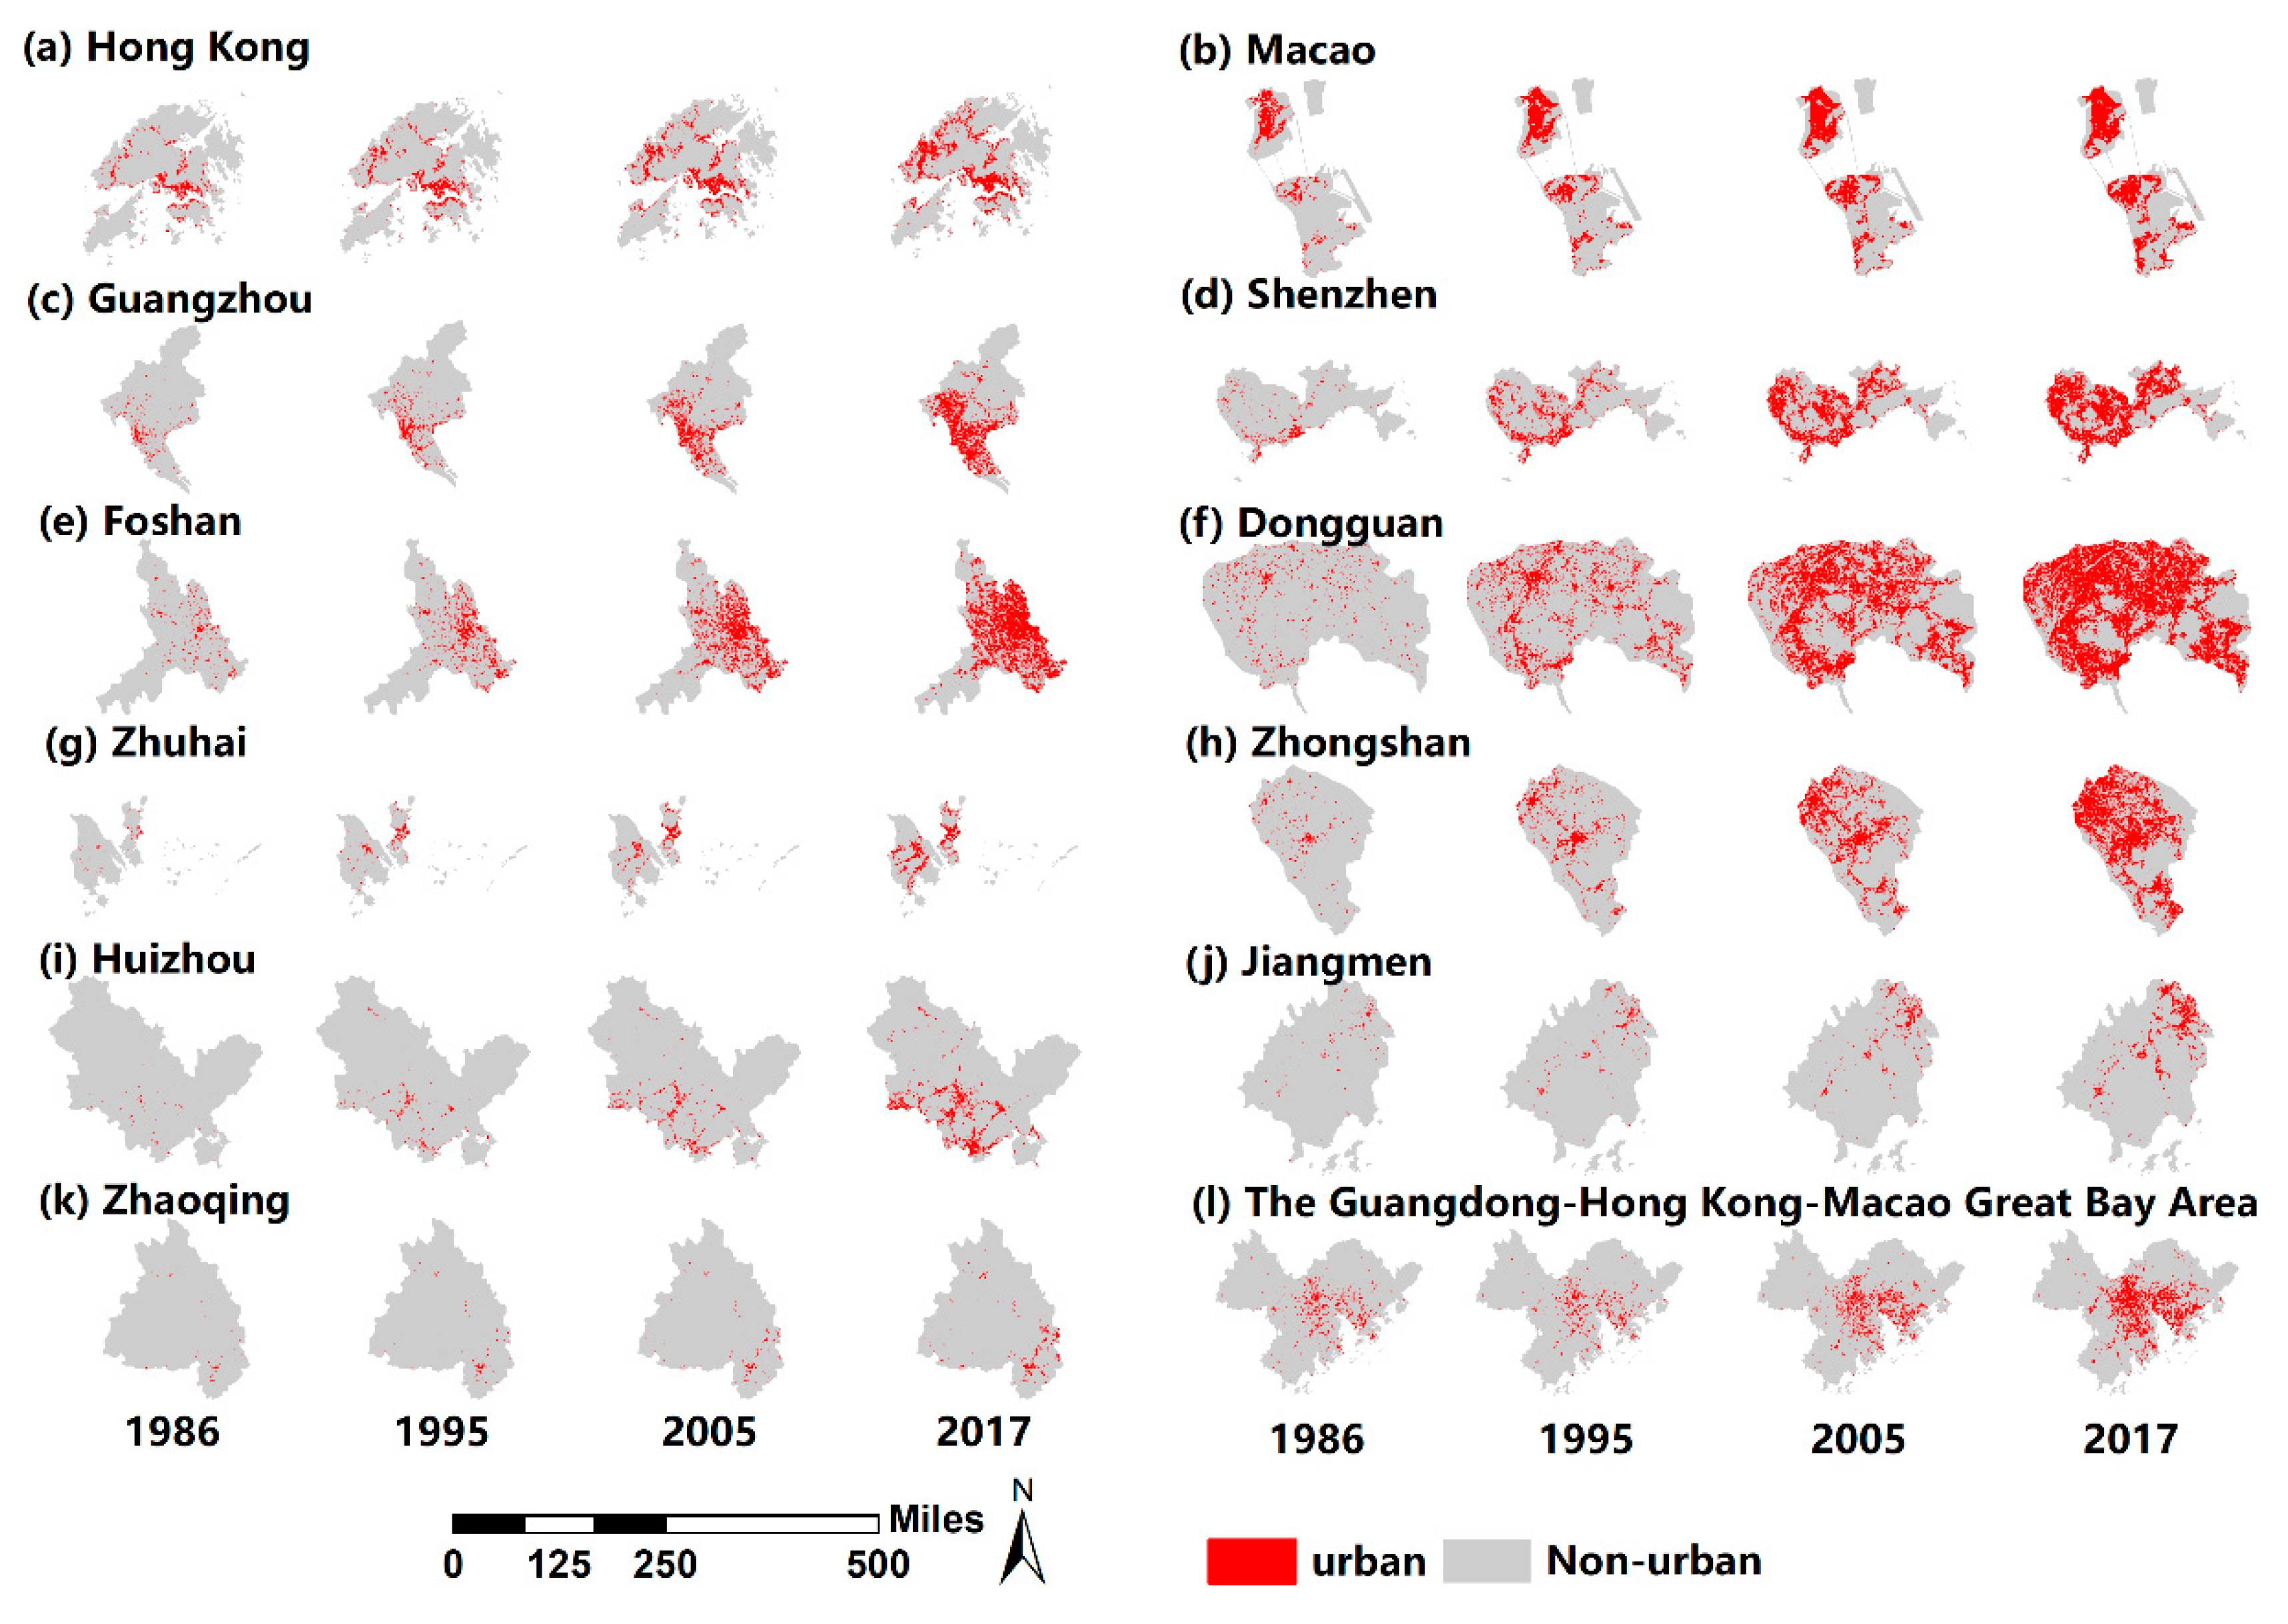
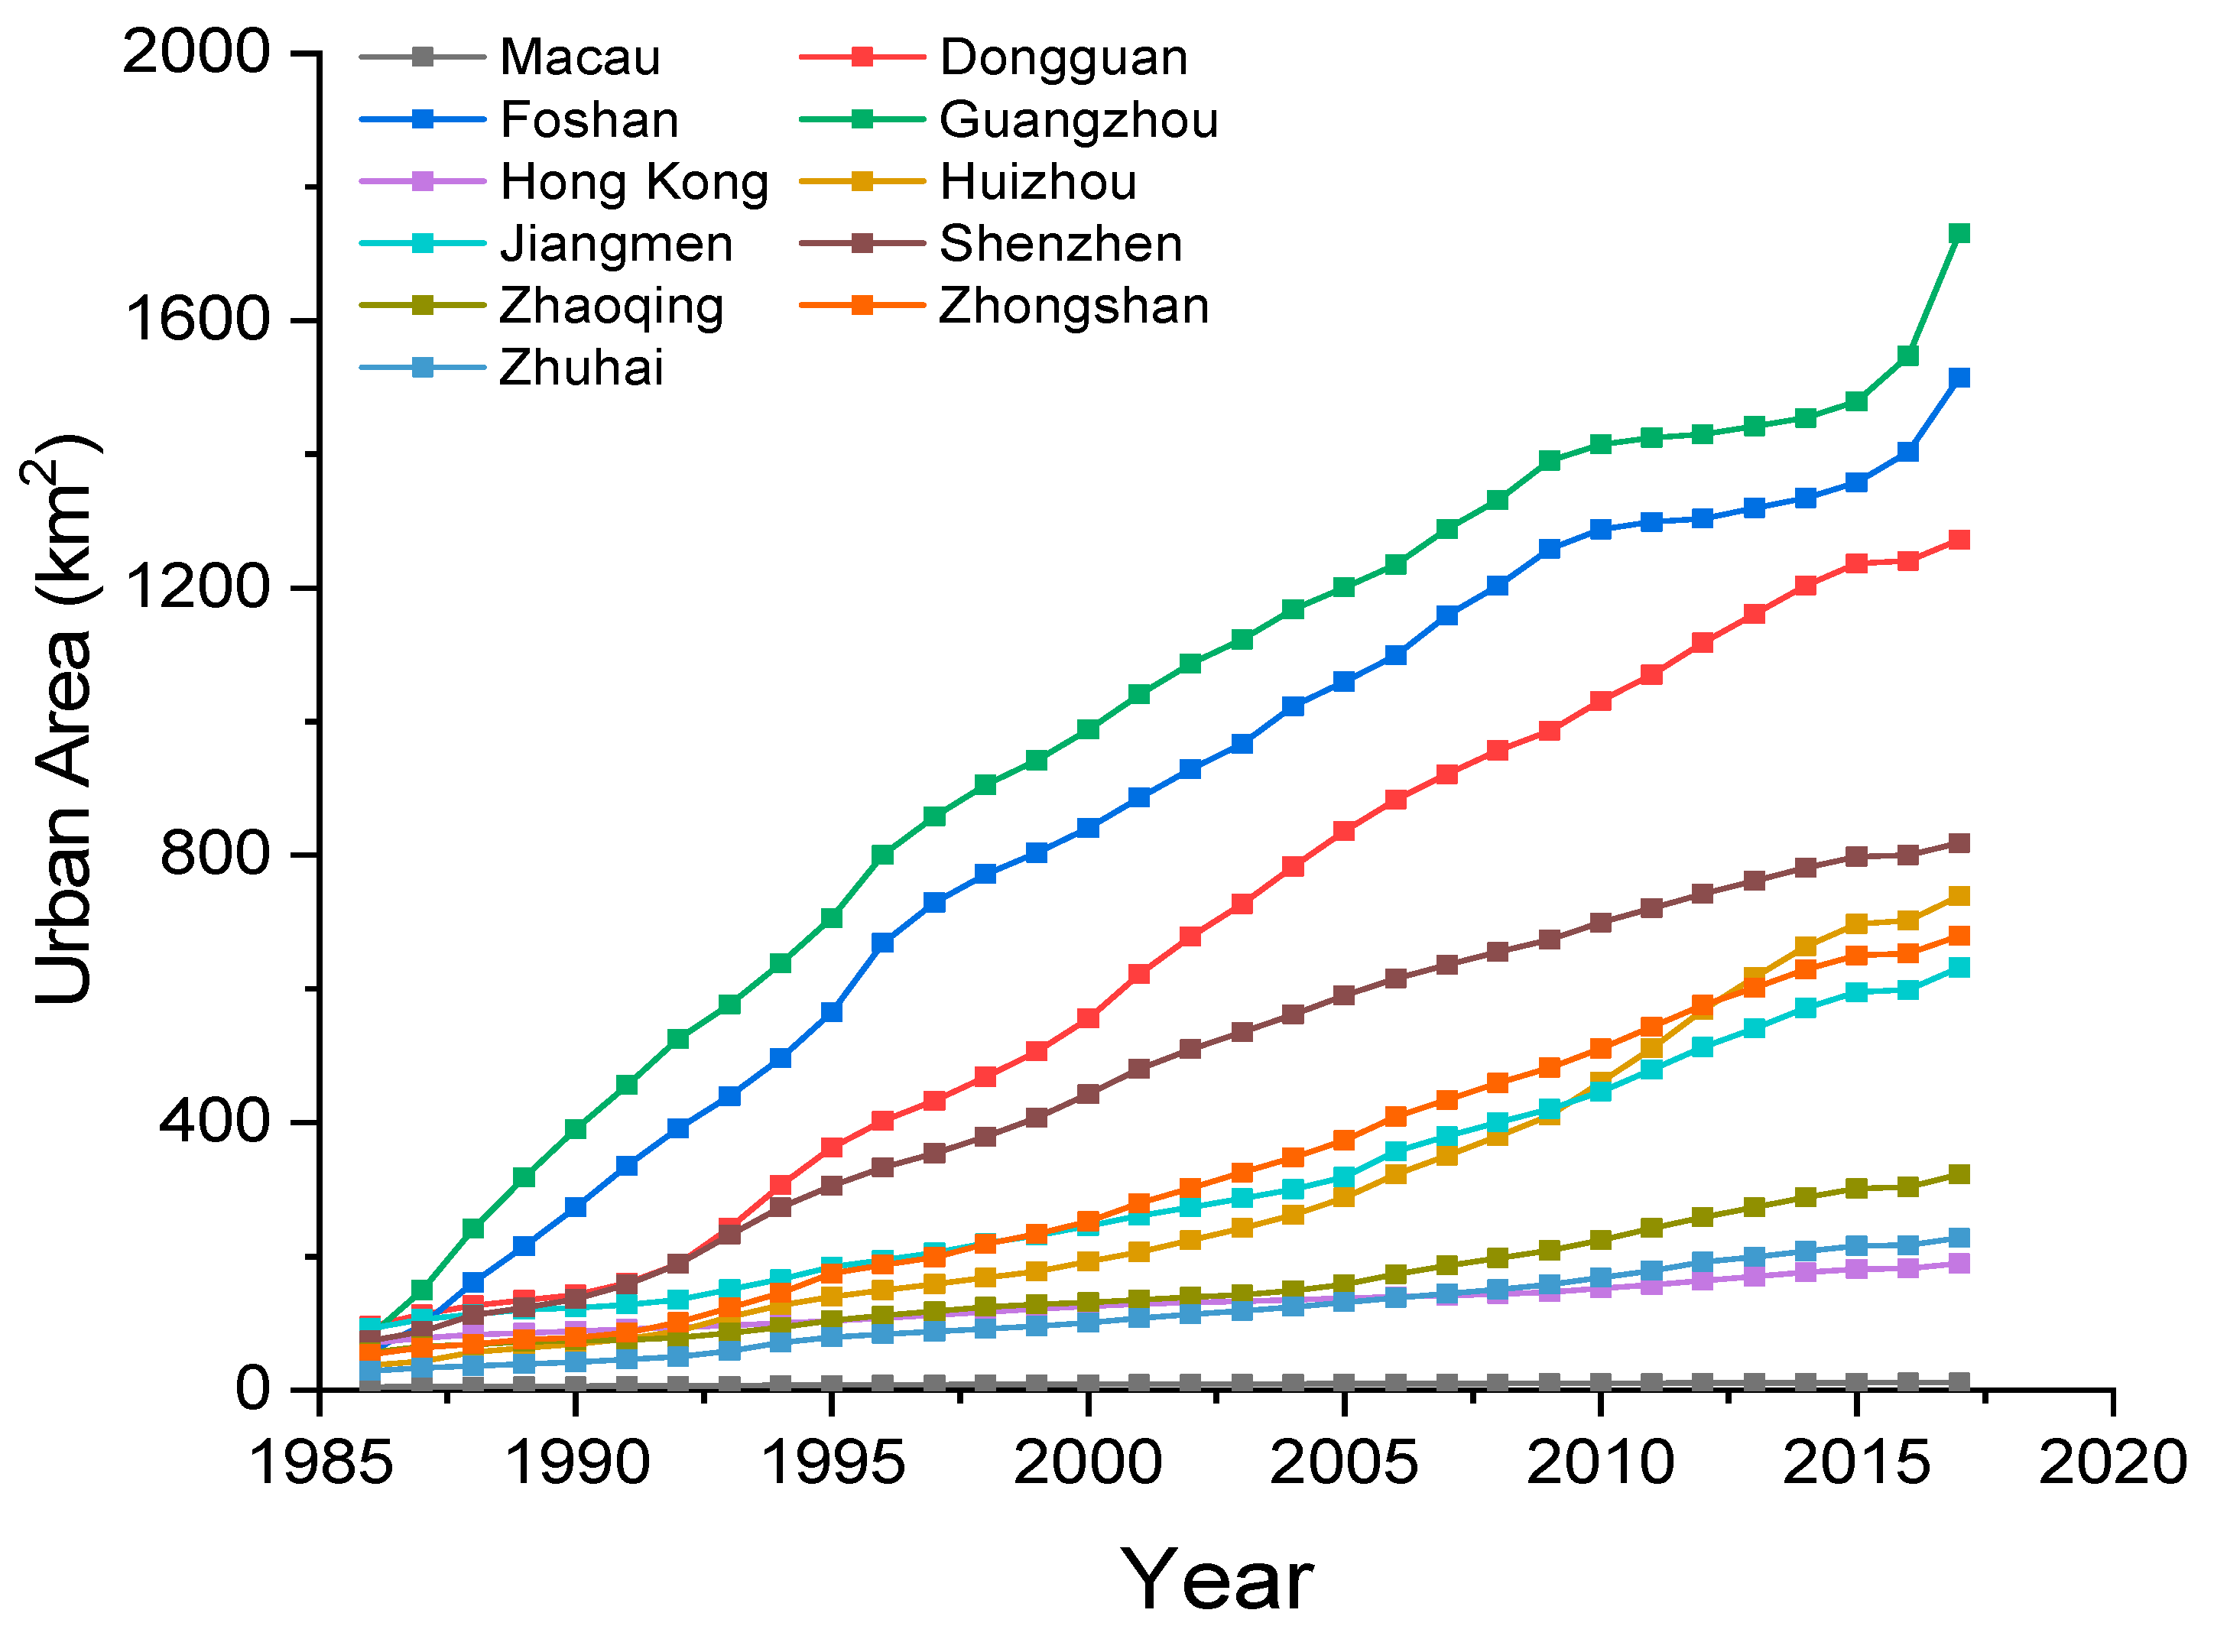
3.2. Comparison among Cities

Figure 3 shows the spatiotemporal patterns of urban expansions in the 11 cities of the GBA. All cities have experienced rapid urbanization during 1986–2017, particularly Guangzhou, Shenzhen, Foshan, and Dongguan. Hong Kong, Macau, Guangzhou, and Foshan mainly expanded from their original urban cores (Figure 3a–c,e). Dongguan and Zhongshan expanded to reach Guangzhou and Foshan from their original urban cores, mainly expanding in the west and northwest directions (Figure 3f,h). It is worth noticing that with the development of Shenzhen, the urban areas of Dongguan also expanded towards Shenzhen (south direction), especially after The urban areas of Shenzhen, Zhuhai, Huizhou, Jiangmen, and Zhaoqing were distributed across whole cities, forming a multi-nuclear urbanization pattern with many polygons around urban cores (Figure 3d,g,i–k).
Table 4 demonstrates the urban expansion characteristics and expansion velocity of the 11 cities in the GBA. Detailed annual urban areas are shown in Table SIn 1986, Dongguan had the biggest urban area (95.83 km2) and Macau held the smallest one (4.33 km2) (Figure 4 and Table S2). From 1986 to 2017, urban areas increased by 21, 11, 3, 3, 26, 20, 7, 13, 13, 6, and 8 times in Guangzhou, Shenzhen, Hong Kong, Macau, Foshan, Huizhou, Jiangmen, Zhongshan, Dongguan, Zhaoqing, and Zhuhai, respectively (Figure 4 and Table S2). The urban areas in Guangzhou, Foshan, and Dongguan exceeded 1000 km2 and the urban areas in Shenzhen, Huizhou, Jiangmen, and Zhongshan increased by more than 500 kmThe other cities expanded by less than 400 km2 in 2017 (Table S2). In 2017, Guangzhou had the biggest urban area (1730.42 km2) and Macau held the smallest one (11.31 km2), with the proportion of 24.25% and 33.14% of the local territory area, respectively (Figure 4 and Table S2).
A comparison among the 11 cities shows that Guangzhou, Macau, and Foshan had the highest AI during 1986–1995 and 1996–2005 (greater than 25 km2 y−1) (Table 4). During 2006–2015, Huizhou, Dongguan, Foshan, Guangzhou, Jiangmen, and Zhongshan had a relatively high level of AI (exceeded 25 km2 y−1) while other cities had an AI lower than 19 km2 y−1 (Table 4). The EI of Foshan, Guangzhou, Huizhou, Dongguan, and Shenzhen exceeded 38% in 1986–2017, particularly Foshan, Guangzhou, and Huizhou, exceeding 50%. During 1986–2017, the highest annual urban growth occurred in Guangzhou and Foshan with an AI of 51.51 and 45.54 km2 y−1, followed by Dongguan and Shenzhen (36.76 and 23.26 km2 y−1 respectively). The AGR of Foshan, Huizhou, Dongguan, Shenzhen, and Zhongshan exceeded 7.79% and it is noteworthy that the AGR and EI were the smallest in Macau (3.04% and 5.03% respectively) (Table 4).

3.3. Driving Factors behind the Urban Expansion

The results of the factor detector showed that during 1986–1995, the most important factors were road length and GDP (q = 0.46 and 0.39 respectively) (Table 5). During 1996–2005, elevation (q = 0.47), GDP (q = 0.46), and road length (q = 0.46) were the most important factors. In recent years, the most important factors were the socio-economic factors of income, GDP, and population with q equals 0.72, 0.71, and 0.45, respectively. The temporal changes show that GDP was one of the most important factors for all periods and the importance was increasing. The contribution of socioeconomic factors was increasing while the contribution of physical factors was decreasing with time (Table 5a). The results of the interaction detector revealed that all factors had an enhancement interaction relationship for urban expansion (Table 5b). The q values of X1∩X3, X3∩X4, and X3∩X7 were the highest, with q of 0.96, 0.96, and 0.97, respectively, which means that elevation, population, and road length have a stronger enhancement effect.

4. Discussion

4.1. Urban Expansion and Driving Factors of the GBA

Over the past three decades, the GBA has experienced rapid urban expansion. From 1986 to 2017, the urban areas have increased about 13 times (Section 3.1). Guangzhou, Shenzhen, Foshan, and Dongguan recorded the greatest changes with an average magnitude of 1256.49 km2 and Hong Kong and Macau had lower magnitudes of change (118.53 and 6.98 km2, respectively).
Our results indicated that during 1986–1995 and 1996–2005, elevation, GDP, and road length were the main factors influencing urban expansion in this early stage (Table 5). Physical factors, such as elevation and slope are the basic constraints to urban expansion [21,57]. Generally, lower elevation and smaller slope are associated with high urban expansion [17,21]. Our results showed that the urban expansion in the GBA was mainly located in the central plain of the GBA (average 127.3 m with a slope of 7.8°), not the northern and western mountainous areas. At the early stage, the physical factors role as the natural controlling factors played a more important role while with the development of economy, transportation, and modern technology, socioeconomic factors have become more important in recent years. From 2006 to 2015, the most important factors were population, GDP, and income. Previous studies also showed the importance of population and GDP on urban expansion [58]. The positive impact of population on urban expansion can be explained by increasing urban land demand to support urban population growth. The population of the GBA has increased 5.54 times (approximately 5.52 million people) in 2005–2017, born locally or migrated from outside, resulting in the rapidly increasing urban population. GDP and income reflected the rapid economic growth of the GBA and they were also important drivers of urban expansion. From 1986 to 2017, the GBA has witnessed rapid economic and industrial development, with GDP boosting from 2842.45 trillion RMB in 1986 to 92,824.54 trillion RMB in 2017 (Figure 1). This economic growth is often associated with industrial reconstruction, that is, the transfer of first industry in rural areas to second and third industries in urban areas, thus promoting urbanization. Income is the direct index of local government revenue and the major economic source of urban construction and development [33,34,35]. Many supporting policies have been launched by local and central government (Table S1). These policies shave greatly boosted the economic growth and urban development in the GBA, especially the “reform and opening-up policy”.

4.2. Comparison of the Cities in the GBA

For the 11 individual cities in GBA, Guangzhou, Shenzhen, Foshan, and Dongguan had the greatest magnitude of urban expansion in 1986–2017, with the average magnitude of 44.23, 22.64, 40.96, and 35.37 km2 y, respectively. Hong Kong and Macau had experienced the smallest change (3.44 and 0.21 km2 y−1, respectively).
Hong Kong and Macau were historically occupied by western countries, thus they developed earlier with advanced technology and economy. The free-trade economic system and large investment for infrastructure construction can significantly facilitate urban expansions in their early stages. However, their expanding rates slowed down after 1990, mainly because of natural restrictions. Macau is surrounded by ocean on all sides and has a land area of less than 40 km2, which imposes a natural limit. Hong Kong is mountainous and its flat terrain only accounts for 16% of the total area [47]. The remaining 84% is not suitable for urban construction and agricultural development [59]. There are also strict policies limiting the land utilization in Hong Kong [60]. Thus, the average growth rates of Hong Kong were the smallest.
Guangzhou, Shenzhen, Dongguan, and Foshan had the highest urban growth rates in 1986–2017, which mainly benefited from the exponentially increasing population and GDP. The population and GDP of these four cities have exploded to 41.56 million people and 56171.76 trillion RMB in 2017, occupying about 61.14% and 60.51% of the population and GDP of the GBA, respectively (Figure S1). As supported by other studies [35], our results indicated that population and GDP were the main driving factors of urban expansion, thus, the large population and GDP of Guangzhou, Shenzhen, Foshan, and Dongguan produced a large magnitude of the changes in urban areas.

4.3. Policy Implications

As shown in our results, the urban expansion characteristics and driving factors of different cities are various. It is important to make a rational regional collaboration strategy for the cities to play their respective advantages and support each other. According to The Development Plan for the Guangdong-Hong Kong-Macau Greater Bay Area, Hong Kong will develop to the center of finance and international trade, Macau will develop to a center of world-class tourism and entertainment, Guangzhou will focus on its role as an international business center and integrated transport hub, and Shenzhen will become world-leading in innovation and creativity [41]. This plan is in accordance with our results that Guangzhou, Foshan, Dongguan, and Shenzhen are the cities with the highest urban expansion rate. Moreover, considering the geographic condition, these four cities can be the core cities, together with Hong Kong and Macau, to develop smaller clusters for city collaborative development. There are plans to enlarge Guangzhou, Foshan, and Zhaoqing to be one (named ‘Guang-Fo-Zhao’) and Shenzhen, Dongguan, and Huizhou to be one (named ‘Shen-Guan-Hui’). The main idea is to make full use of the resources and strengths of the major cities to impact surrounding areas. It is not only beneficial for the surrounding cities but also for the core cities, because they also need support from the surrounding cities, including labor forces, food (like vegetables, cereals, meat, and milk), and natural resources. So, it is important to further study the effectiveness of different city group strategies and provide optimizing suggestions for the sustainable and high-quality development of the GBA.
Many studies have shown that urban expansion has a negative impact on the environment [2,21,61]. For example, the freshwater of the pearl river and coastal areas are badly polluted because of the massive nutrients discharge from factories, cities, and agricultural production with economic development and population increase. In 2018, 28.2% of the water quality is worse than standard III in Guangdong [62] and the government of Guangdong province has announced the investment of 8.4 billion RMB to fight against water pollution [63]. Land shortage is another problem in the GBA. For example, Shenzhen has over 20 million residents living on less than 2000 km. In 2016, the population density was 5962 people per km2, ranking the first in mainland China [15]. At present, the construction land area available in Shenzhen is only about 1/3 of that available for Beijing and Shanghai and 1/2 of that for Guangzhou. Thus, the type of urban expansion is changing from ‘’edge-expansion” to “infilling” and the constraints of land resources are more serious [25]. It is urgent to realize the high-quality and conservation-oriented land utilization. Therefore, it is a great challenge to manage the trade-offs between limiting the population growth, protecting the environment, and maintaining regional economic. It should be realized that urban evolution and development of the GBA is a complex and interactional system. Our study can serve as the foundation for local governments and urban planners to study the ecological carrying capacity of the GBA, plan the ecological red line to protect the environment, and plan the satellite towns and industrial parks in the suburbs to relieve the urban intensification. In the next step, more studies will be conducted to study the environmental inter-connections and regional collaboration among cities in the region.
As we discussed above, the GBA has experienced dramatic and intense urban expansion processes during the past 32 years. Some environmental problems have appeared and the sustainable development of the GBA faces great challenges. In addition, as we found that GBA and individual cities have different changing urban expansion features and driving factors. These require effective urban planning and management policies. Decision-makers should consider the differences in region, urban size, and hierarchy. This decision-making process may help to improve the traditional “one size fits all” policies. For example, for Guangzhou, Shenzhen, Dongguan, and Foshan, it is crucial to both strengthen urban governance and undertake the high-quality and sustainable development of cities. Our findings can be used for future urban planning of the GBA. Our method can also be used in other areas by processing long-term RS data and analyzing the spatiotemporal changes of urban expansion with different indicators. The driving factors can also be analyzed with local socioeconomic and physical data.

4.4. Limitation and Future Work

Although the spatiotemporal features and driving factors of annual urban expansions in the GBA were identified in this study, some limitations and future work can be further explored in the future. Firstly, the resolution of the RS dataset used in this study was 30 m. The resolution can be improved with high-resolution remote sensing data, which can help to obtain the more precise information and support precise urban planning and management. Secondly, we included both the important socioeconomic and physical factors in the driving factors analysis, summarized the urban development related policies of the GBA during 1986–2017, and analyzed the influence of policies qualitatively. Policies are important factors of urban expansion and it is crucial to develop appropriate methods to measure the influence of policies quantitively. This topic, however, is beyond the scope of the current investigation and will be explored in the future. Finally, in order to help local governments balance urban development and eco-environment protection, there is an urgent need to study the ecological effects of urban expansion, ecological service values changes, and ecological carrying capacity of the GBA.

5. Conclusions

The spatiotemporal features and driving forces of urban expansion within the GBA in China during 1986–2017 were analyzed on different scales by combing RS, GIS techniques, and the geographical detector. The results revealed an unprecedented urban growth in the GBA over the past 32 years, with the total urban areas expanding from 652.74 km2 in 1986 to 8137.09 km2 in 2017 (approximately 13 times) and an 8.28% average annual growth rate. The period from 1986 to 1990 had the highest annual growth rate of the GBA (16.89%). All 11 cities in the GBA experienced unprecedented urban growth, especially Guangzhou, Foshan, Dongguan, and Shenzhen. The urban areas of these four cities expanded from 82.17, 57.43, 95.83, and 74.11, respectively, in 1986 to 1730.42, 1514.55, 1272.05, and 818.49, respectively in 2017 and the annual increase in urban areas was 51.51, 45.54, 36.76, and 23.26 km2 y−1, respectively. Behind the rapid urban expansion, the driving factors varied across different cities and periods. For the GBA, GDP, income, road length, and population were the most important driving factors and they had an enhancement interaction effect for urban expansion. The GBA also faces challenges of balancing regional economic development and eco-environment protection, so sustainable urban study, planning, and management are urgent. It is hoped that this study will help policymakers to promote sustainable development of the GBA.

Supplementary Materials

The following are available online at https://www.mdpi.com/2072-4292/12/16/2615/s1, Table S1: The major policies in the GBA during 1979–2017, Table S2: The annual urban area of 11 cities in the GBA during 1986–2017, Table S3: The annual urban area, AI, and AGR of the GBA during 1986–2017; Figure S1: the changes of GDP and population of the 11 cities in the GBA during 1986–2017; Video S1: the annual urban expansion process of the GBA during 1986–2017.

Author Contributions

J.Z. conducted the data analyses and prepared the manuscript; J.Z., L.Y., and X.L. developed the methodology and curated the data; J.Z., C.Z., and X.W. contributed to the experiments; C.Y., Q.L., T.S., W.G., and G.W. supervised and edited the manuscript. All authors contributed to the discussion and edited the manuscript. All authors have read and agreed to the published version of the manuscript.

Funding

This research was funded by National Natural Science Foundation of China (No. 41901248 and 41890854), Shenzhen Science and Technology Innovation Committee (No. JCY20180507182022554 and JCY20170302144323219), the 2019 major research project of Shenzhen municipal government, and the National Key Scientific and Technological Infrastructure project “Earth System Science Numerical Simulator Facility” (EarthLab).

Conflicts of Interest

The authors declare no conflict of interest.

References

  1. United Nations. World Urbanization Prospects; United Nations Department of Economic and Social Affairs: New York, NY, USA, 2018. [Google Scholar]
  2. Seto, K.C.; Güneralp, B.; Hutyra, L.R. Global forecasts of urban expansion to 2030 and direct impacts on biodiversity and carbon pools. Proc. Natl. Acad. Sci. USA 2012, 109, 16083–16088. [Google Scholar] [CrossRef] [PubMed] [Green Version]
  3. Seto, K.C.; Fragkias, M.; Güneralp, B.; Reilly, M.K. A Meta-Analysis of Global Urban Land Expansion. PLoS ONE 2011, 6, e23777. [Google Scholar] [CrossRef] [PubMed]
  4. Turner, B.L.; Lambin, E.F.; Reenberg, A. The emergence of land change science for global environmental change and sustainability. Proc. Natl. Acad. Sci. USA 2007, 104, 20666–20671. [Google Scholar] [PubMed] [Green Version]
  5. Vitousek, P.M.; Mooney, H.A.; Lubchenco, J.; Melillo, J.M. Human Domination of Earth’s Ecosystems. Science 1997, 277, 494–499. [Google Scholar] [CrossRef] [Green Version]
  6. Seto, K.C.; Sánchez-Rodríguez, R.; Fragkias, M. The New Geography of Contemporary Urbanization and the Environment. Annu. Rev. Environ. Resour. 2010, 35, 167–194. [Google Scholar] [CrossRef] [Green Version]
  7. Zhao, S.; Peng, C.; Jiang, H.; Tian, D.; Lei, X.; Zhou, X. Land use change in Asia and the ecological consequences. Ecol. Res. 2006, 21, 890–896. [Google Scholar] [CrossRef]
  8. Lin, B.; Zhu, J. Changes in urban air quality during urbanization in China. J. Clean. Prod. 2018, 188, 312–321. [Google Scholar] [CrossRef]
  9. Ren, W.; Zhong, Y.; Meligrana, J.; Anderson, B.; Watt, W.; Chen, J.; Leung, H.-L. Urbanization, land use, and water quality in Shanghai: 1947–1996. Environ. Int. 2003, 29, 649–659. [Google Scholar] [CrossRef]
  10. Marcotullio, P.J.; Braimoh, A.K.; Onishi, T. The Impact of Urbanization on Soils. In Land Use and Soil Resources; Springer: Dordrecht, The Netherlands, 2008; pp. 201–250. [Google Scholar]
  11. Grimm, N.B.; Faeth, S.H.; Golubiewski, N.E.; Redman, C.L.; Wu, J.; Bai, X.; Briggs, J.M. Global Change and the Ecology of Cities. Science 2008, 319, 756–760. [Google Scholar] [CrossRef] [Green Version]
  12. Li, X.; Zhou, W.; Ouyang, Z. Forty years of urban expansion in Beijing: What is the relative importance of physical, socioeconomic, and neighborhood factors? Appl. Geogr. 2013, 38, 1–10. [Google Scholar] [CrossRef]
  13. Kaza, N. The changing urban landscape of the continental United States. Landsc. Urban Plan. 2013, 110, 74–86. [Google Scholar] [CrossRef]
  14. Chuang-Lin, F. The urbanization and urban development in China after the reform and opening-up. Econ. Geogr. 2009, 29, 19–25. [Google Scholar]
  15. China National Bureau of Statistics. 2019 China Statistical Yearbook. Available online: http://www.stats.gov.cn/tjsj/ndsj/201s9/indexeh.htm (accessed on 15 June 2020).
  16. Long, Y.; Gu, Y.; Han, H. Spatiotemporal heterogeneity of urban planning implementation effectiveness: Evidence from five urban master plans of Beijing. Landsc. Urban Plan. 2012, 108, 103–111. [Google Scholar] [CrossRef]
  17. Ju, H.; Zhang, Z.; Zuo, L.; Wang, J.; Zhang, S.; Wang, X.; Zhao, X. Driving forces and their interactions of built-up land expansion based on the geographical detector—a case study of Beijing, China. Int. J. Geogr. Inf. Sci. 2016, 30, 2188–2207. [Google Scholar] [CrossRef]
  18. Sutton, P.C. A scale-adjusted measure of “Urban sprawl” using nighttime satellite imagery. Remote Sens. Environ. 2003, 86, 353–369. [Google Scholar] [CrossRef]
  19. Deng, J.S.; Wang, K.; Hong, Y.; Qi, J.G. Spatio-temporal dynamics and evolution of land use change and landscape pattern in response to rapid urbanization. Landsc. Urban Plan. 2009, 92, 187–198. [Google Scholar] [CrossRef]
  20. Sexton, J.; Song, X.-P.; Huang, C.; Channan, S.; Baker, M.E.; Townshend, J.R. Urban growth of the Washington, D.C.–Baltimore, MD metropolitan region from 1984 to 2010 by annual, Landsat-based estimates of impervious cover. Remote Sens. Environ. 2013, 129, 42–53. [Google Scholar] [CrossRef]
  21. Wu, W.; Zhao, S.; Zhu, C.; Jiang, J. A comparative study of urban expansion in Beijing, Tianjin and Shijiazhuang over the past three decades. Landsc. Urban Plan. 2015, 134, 93–106. [Google Scholar] [CrossRef]
  22. Benza, M.; Weeks, J.R.; Stow, D.A.; López-Carr, D.; Clarke, K.C. A pattern-based definition of urban context using remote sensing and GIS. Remote Sens. Environ. 2016, 183, 250–264. [Google Scholar] [CrossRef] [Green Version]
  23. Yeh, C.-T.; Huang, S.-L. Investigating spatiotemporal patterns of landscape diversity in response to urbanization. Landsc. Urban Plan. 2009, 93, 151–162. [Google Scholar] [CrossRef]
  24. Li, Y.; Zhu, X.; Sun, X.; Wang, F. Landscape effects of environmental impact on bay-area wetlands under rapid urban expansion and development policy: A case study of Lianyungang, China. Landsc. Urban Plan. 2010, 94, 218–227. [Google Scholar] [CrossRef]
  25. Yang, C.; Li, Q.; Zhao, T.; Liu, H.; Gao, W.; Shi, T.; Guan, M.; Wu, G. Detecting Spatiotemporal Features and Rationalities of Urban Expansions within the Guangdong–Hong Kong–Macau Greater Bay Area of China from 1987 to 2017 Using Time-Series Landsat Images and Socioeconomic Data. Remote Sens. 2019, 11, 2215. [Google Scholar] [CrossRef] [Green Version]
  26. Yang, C.; Zhang, C.; Li, Q.; Liu, H.; Gao, W.; Shi, T.; Liu, X.; Wu, G. Rapid urbanization and policy variation greatly drive ecological quality evolution in Guangdong-Hong Kong-Macau Greater Bay Area of China: A remote sensing perspective. Ecol. Indic. 2020, 115, 106373. [Google Scholar] [CrossRef]
  27. Liu, F.; Zhao, Y.; Muhammad, R.; Liu, X.; Chen, M. Impervious Surface Expansion: A Key Indicator for Environment and Urban Agglomeration—A Case Study of Guangdong-Hong Kong-Macao Greater Bay Area by Using Landsat Data. J. Sens. 2020, 2020. [Google Scholar] [CrossRef]
  28. Jiang, L.; Deng, X.; Seto, K.C. Multi-level modeling of urban expansion and cultivated land conversion for urban hotspot counties in China. Landsc. Urban Plan. 2012, 108, 131–139. [Google Scholar] [CrossRef]
  29. Estoque, R.C.; Murayama, Y. Landscape pattern and ecosystem service value changes: Implications for environmental sustainability planning for the rapidly urbanizing summer capital of the Philippines. Landsc. Urban Plan. 2013, 116, 60–72. [Google Scholar] [CrossRef]
  30. Liu, J.; Zhan, J.; Deng, X. Spatio-temporal Patterns and Driving Forces of Urban Land Expansion in China during the Economic Reform Era. AMBIO J. Hum. Environ. 2005, 34, 450–455. [Google Scholar] [CrossRef]
  31. Brueckner, J.K.; Fansler, D.A. The Economics of Urban Sprawl: Theory and Evidence on the Spatial Sizes of Cities. Rev. Econ. Stat. 1983, 65, 479–482. [Google Scholar] [CrossRef]
  32. McGrath, D.T. More evidence on the spatial scale of cities. J. Urban Econ. 2005, 58, 1–10. [Google Scholar] [CrossRef]
  33. Zhang, Z.; Wen, Q.; Liu, F.; Zhao, X.; Liu, B.; Xu, J.; Yi, L.; Hu, S.; Wang, X.; Zuo, L.; et al. Urban expansion in China and its effect on cultivated land before and after initiating “Reform and Open Policy”. Sci. China Earth Sci. 2016, 59, 1930–1945. [Google Scholar] [CrossRef]
  34. Fang, C.; Li, G.; Wang, S. Changing and Differentiated Urban Landscape in China: Spatiotemporal Patterns and Driving Forces. Environ. Sci. Technol. 2016, 50, 2217–2227. [Google Scholar] [CrossRef]
  35. Li, G.; Sun, S.; Fang, C. The varying driving forces of urban expansion in China: Insights from a spatial-temporal analysis. Landsc. Urban Plan. 2018, 174, 63–77. [Google Scholar] [CrossRef]
  36. Wu, K.-Y.; Zhang, H. Land use dynamics, built-up land expansion patterns, and driving forces analysis of the fast-growing Hangzhou metropolitan area, eastern China (1978–2008). Appl. Geogr. 2012, 34, 137–145. [Google Scholar] [CrossRef]
  37. Haregeweyn, N.; Fikadu, G.; Tsunekawa, A.; Tsubo, M.; Meshesha, D.T. The dynamics of urban expansion and its impacts on land use/land cover change and small-scale farmers living near the urban fringe: A case study of Bahir Dar, Ethiopia. Landsc. Urban Plan. 2012, 106, 149–157. [Google Scholar] [CrossRef]
  38. Thapa, R.B.; Murayama, Y. Scenario based urban growth allocation in Kathmandu Valley, Nepal. Landsc. Urban Plan. 2012, 105, 140–148. [Google Scholar] [CrossRef]
  39. Fang, S.; Gertner, G.Z.; Sun, Z.; Anderson, A.A. The impact of interactions in spatial simulation of the dynamics of urban sprawl. Landsc. Urban Plan. 2005, 73, 294–306. [Google Scholar] [CrossRef]
  40. Wang, J.; Li, X.; Christakos, G.; Liao, Y.; Zhang, T.; Gu, X.; Zheng, X.-Y. Geographical Detectors-Based Health Risk Assessment and its Application in the Neural Tube Defects Study of the Heshun Region, China. Int. J. Geogr. Inf. Sci. 2010, 24, 107–127. [Google Scholar] [CrossRef]
  41. The Central Government of China. The Development Plan for the Guangdong-Hong Kong-Macao Greater Bay Area; The Central Government of China: Beijing, China, 2019.
  42. Bounoua, L.; Nigro, J.; Zhang, P.; Thome, K.; Lachir, A. Mapping urbanization in the United States from 2001 to 2011. Appl. Geogr. 2018, 90, 123–133. [Google Scholar] [CrossRef]
  43. Gong, P.; Li, X.; Zhang, W. 40-Year (1978–2017) human settlement changes in China reflected by impervious surfaces from satellite remote sensing. Sci. Bull. 2019, 64, 756–763. [Google Scholar] [CrossRef] [Green Version]
  44. Liu, X.; Hu, G.; Chen, Y.; Li, X.; Xu, X.; Li, S.; Pei, F.; Wang, S. High-resolution multi-temporal mapping of global urban land using Landsat images based on the Google Earth Engine Platform. Remote Sens. Environ. 2018, 209, 227–239. [Google Scholar] [CrossRef]
  45. China National Bureau of Statistics. China Statistical Yearbook; China National Bureau of Statistics: Beijing, China, 2018.
  46. Statistics Bureau of Guangdong Province. Guangdong Province Statistics Year Book; Statistics Bureau of Guangdong Province: Guangzhou, China, 2018.
  47. Statistics and Census Service of Macau. Macau Yearbook of Statistics. Available online: https://www.dsec.gov.mo/Statistic.aspx?lang=en-US&NodeGuid=d45bf8ce-2b35-45d9-ab3a-ed645e8af4bb (accessed on 15 June 2020).
  48. Census and Statistics Department of Hong Kong. Hong Kong Statistics. Available online: https://www.censtatd.gov.hk/hkstat/ (accessed on 1 July 2020).
  49. Yang, C.; Li, Q.; Hu, Z.; Chen, J.; Shi, T.; Ding, K.; Wu, G. Spatiotemporal evolution of urban agglomerations in four major bay areas of US, China and Japan from 1987 to 2017: Evidence from remote sensing images. Sci. Total Environ. 2019, 671, 232–247. [Google Scholar] [CrossRef] [PubMed]
  50. Yue, W.; Liu, Y.; Fan, P. Measuring urban sprawl and its drivers in large Chinese cities: The case of Hangzhou. Land Use Policy 2013, 31, 358–370. [Google Scholar] [CrossRef]
  51. Ma, Y.; Xu, R. Remote sensing monitoring and driving force analysis of urban expansion in Guangzhou City, China. Habitat Int. 2010, 34, 228–235. [Google Scholar] [CrossRef]
  52. China National Bureau of Statistics. China City Statistical Yearbook; China National Bureau of Statistics: Beijing, China, 2018.
  53. Braimoh, A.K.; Onishi, T. Spatial determinants of urban land use change in Lagos, Nigeria. Land Use Policy 2007, 24, 502–515. [Google Scholar] [CrossRef]
  54. Wu, F. Urban restructuring in China’s emerging market economy: Towards a framework for analysis. Int. J. Urban Reg. Res. 1997, 21, 640–663. [Google Scholar] [CrossRef]
  55. Wang, J.; Xu, C. Geodetector: Principle and prospective. Acta Geogr. Sin. 2017, 72, 116–134. [Google Scholar]
  56. Wang, J.; Zhang, T.; Fu, B. A measure of spatial stratified heterogeneity. Ecol. Indic. 2016, 67, 250–256. [Google Scholar] [CrossRef]
  57. Tan, M.; Xiu, L.I.; Chang, L.U. An analysis of driving forces of urban land expansion in China. Econ. Geogr. 2003, 23, 635–639. [Google Scholar]
  58. Taubenböck, H.; Wiesner, M.; Felbier, A.; Marconcini, M.; Esch, T.; Dech, S. New dimensions of urban landscapes: The spatio-temporal evolution from a polynuclei area to a mega-region based on remote sensing data. Appl. Geogr. 2014, 47, 137–153. [Google Scholar] [CrossRef]
  59. Mu, F.; Zhang, Z. A comparative study of urban expansion on Hong Kong and Macao special administrative region in the past three decades. In Proceedings of the 2008 International Workshop on Earth Observation and Remote Sensing Applications, Beijing, China, 30 June–2 July 2008. [Google Scholar]
  60. Wang, H.; Zhang, X.; Skitmore, M.; Skitmore, M. Implications for sustainable land use in high-density cities: Evidence from Hong Kong. Habitat Int. 2015, 50, 23–34. [Google Scholar] [CrossRef]
  61. Wei, Y.D.; Ye, X. Urbanization, urban land expansion and environmental change in China. Stoch. Environ. Res. Risk Assess. 2014, 28, 757–765. [Google Scholar] [CrossRef]
  62. China Ministry of Environmental Protection. China Statistical Yearbook on Environment; China Statistics Press: Beijing, China, 2019.
  63. The Central Government of China. Guangdong Invested 8.4 Billion Yuan to Ensure the Safety of Drinking Water Sources. Available online: http://www.gov.cn/xinwen/2019-01/21/content_5359651.htm (accessed on 1 July 2020).
Figure 1. The location of the Guangdong-Hong Kong-Macau Greater Bay Area (GBA)
Remotesensing 12 02615 g001
Figure 2. The annual urban expansion process in the GBA during 1986–2017.
Remotesensing 12 02615 g002
Figure 3. The urban areas of every city in the GBA from 1986 to 2017.
Remotesensing 12 02615 g003
Figure 4. The temporal changes of urban areas of the cities in the GBA during 1986–2017.
Remotesensing 12 02615 g004
Table 1. Population (Pop) and Gross Domestic Product (GDP) of the GBA during 1986–2017.
Area1986199520052017
PopGDPPopGDPPopGDPPopGDP
GBA2395.212842.453030.7913,446.493492.8730226.516797.7100,326.9
Guangzhou555.41139.55646.711260.31750.535187.851449.8421,503.15
Shenzhen51.5041.6599.16842.79181.935035.771190.8422,490.06
Foshan258.6456.57311.06563.72354.482383.18765.679398.52
Huizhou18.2116.63255.90229.57297.58805.11475.553830.58
Jiangmen334.6147.17371.81362.73386.24801.70456.172690.25
Zhongshan107.3523.23125.25175.82140.82885.72326.003430.31
Dongguan123.0130.02143.65296.45165.652188.19749.667582.09
Zhaoqing309.1122.22355.97163.66396.48435.95408.462110.01
Zhuhai42.5911.1163.24182.6989.60640.53176.542675.18
Hong Kong552.462350615.608931.25681.3011,106.25733.6621,456.75
Macau42.32104.3042.44437.548.26756.2565.313160.00
Note: All statistics data were obtained from local statistics yearbook. Pop unit: ten thousand; GDP unit: 100 million RMB and 1 RMB is about 0.16 US Dollar.
Table 2. Variables used to study the driving factors of urban expansion.
Variable TypesVariableDescriptionSources
Socioeconomic factorsPopPopulation (10,000 people/km2)From China statistical yearbook, China city statistical yearbook, Guangdong provincial statistical yearbook, Hong Kong, and Macau statistical yearbook [45,46,47,48,52]
GDPGross Domestic Product (100 million Yuan RMB)From China statistical yearbook, China city statistical yearbook, Guangdong provincial statistical yearbook, Hong Kong, and Macau statistical yearbook [45,46,47,48,52]
Incomelocal financial income (100 million Yuan RMB)From China statistical yearbook, China city statistical yearbook, Guangdong provincial statistical yearbook, Hong Kong, and Macau statistical yearbook [45,46,47,48,52]
Physical factorsElevationElevation (m)Calculated using ArcGIS 10.5 from the SRTM 30 m DEM (https://earthexplorer.usgs.gov/)
SlopeSlope (degree)Derived using the Slope Analysis tool in ArcGIS 10.5 from the SRTM 30 m DEM (https://earthexplorer.usgs.gov/)
Dis2cityDistance to center city (m)Calculated using the Euclidean Distance Analysis and Zonal Statistics tool in ArcGIS 10.Here the center city is defined as Hong Kong because it’s the most developed city in the GBA
RoadRoad length (m)From China statistics yearbook, China city statistical yearbook, Guangdong provincial statistical yearbook, and Hong Kong and Macau statistical yearbook [45,46,47,48,52]
Table 3. Urban expansion in the GBA during 1986–2017.
YearUrban AreaRatio of Urban Area to GBA’s Territory AreaPeriodArea ChangeAIEIAGR
(km2)(%) (km2)(km2 y−1)(%)(%)
1986652.741.18
19901424.592.571986–1990771.85154.3723.6516.89
19952732.684.941990–19951308.09218.0215.3011.47
20003884.717.021995–20001152.03192.01 7.036.04
20055103.839.222000–20051219.12203.19 5.234.65
20106405.5711.572005–20101301.74216.96 4.253.86
20157524.6313.592010–20151119.06186.51 2.912.72
20178137.0914.70
Table 4. Annual increase (AI) in urban area (km2 y−1), expansion intensity (EI) (%), and annual growth rate (AGR) (%) for cities in the GBA during 1986–2015.
IndexCity1986–19951996–20052006–20151986–2017
AI (km2 y−1)GBA207.99 215.56 220.07 233.89
Guangzhou62.4144.9525.3451.51
Shenzhen23.1625.8718.9123.26
Hong Kong3.273.083.973.70
Macau0.310.180.150.22
Foshan50.7944.9827.1045.54
Huizhou10.2413.5037.1821.93
Jiangmen9.1912.2325.1616.87
Zhongshan12.1118.0925.1319.57
Dongguan26.6943.0536.3836.76
Zhaoqing4.804.9013.088.33
Zhuhai 5.034.747.676.21
EI (%)GBA31.877.894.3135.83
Guangzhou75.956.362.1162.68
Shenzhen31.258.463.2031.39
Hong Kong4.602.972.895.22
Macau7.222.371.575.03
Foshan88.447.962.5679.29
Huizhou27.409.6612.9058.68
Jiangmen9.956.647.8918.26
Zhongshan22.6610.376.7336.61
Dongguan27.8511.874.3538.35
Zhaoqing8.584.718.2914.90
Zhuhai 17.475.985.8521.53
AGR (%)GBA15.395.843.598.20
Guangzhou24.004.941.929.99
Shenzhen15.226.162.787.79
Hong Kong3.862.602.543.12
Macau5.582.131.463.04
Foshan25.705.882.2810.77
Huizhou14.106.808.369.78
Jiangmen7.155.115.856.20
Zhongshan12.567.165.168.27
Dongguan14.247.893.628.42
Zhaoqing6.393.876.075.63
Zhuhai 10.634.704.626.67
Table 5. The q values of (a) factor detector, and (b) interaction detector analysis of cities in the GBA during 1986–2017.
(a) Factor Detector(b) Interaction Detector
q1986–1995q1996–2005q2006–2015X1X2X3X4X5X6X7
X10.300.470.190.47
X20.110.240.360.560.24
X30.240.340.450.960.630.34
X40.390.460.710.920.600.960.46
X50.070.070.720.930.410.650.700.07
X60.250.250.110.780.580.650.690.500.25
X70.460.460.230.930.610.970.530.680.740.46
X1 = Elevation; X2 = Slope; X3 = Pop; X4 = GDP; X5 = Income; X6 = Dis2city; X7 = Road.

