Remotely Sensing the Source and Transport of Marine Plastic Debris in Bay Islands of Honduras (Caribbean Sea)
by
 ,
,
Aikaterini Kikaki
1,*, 
Konstantinos Karantzalos
1,
Caroline A. Power
2 and
Dionysios E. Raitsos
3 1
Remote Sensing Laboratory, National Technical University of Athens, 15780 Zographou, Greece
2
Roatan Marine Park, Roatan, Bay Islands 34101, Honduras
3
Department of Biology, National and Kapodistrian University of Athens, 15784 Athens, Greece
*
Author to whom correspondence should be addressed.
Remote Sens. 2020, 12(11), 1727; https://doi.org/10.3390/rs12111727
Submission received: 30 April 2020
/
Revised: 22 May 2020
/
Accepted: 26 May 2020
/
Published: 27 May 2020
(This article belongs to the Special Issue Feature Paper Special Issue on Ocean Remote Sensing)
Abstract
:Plastic debris in the global ocean is considered an important issue with severe implications for human health and marine ecosystems. Here, we exploited high-resolution multispectral satellite observations over the Bay Islands and Gulf of Honduras, for the period 2014-2019, to investigate the capability of satellite sensors in detecting marine plastic debris. We verified findings with in situ data, recorded the spectral characteristics of floating plastic litter, and identified plastic debris trajectories and sources. The results showed that plastic debris originating from Guatemala’s and Honduras’ rivers (such as Motagua, Ulua, Cangrejal, Tinto and Aguan) ends up in the Caribbean Sea, mainly during the period of August to March, which includes the main rainfall season. The detected spatial trajectories indicated that floating plastic debris travels with an average speed of 6 km d−1, following primarily a southwest (SW) to northeast (NE) direction, driven by the prevailing sea surface currents. Based on several satellite observations, there is no indication of a specific accumulation point, since plastic debris is dispersed by the dynamic circulation in the broader region. Our findings provide evidence that satellite remote sensing is a valuable, cost-effective tool for monitoring the sources and pathways of plastic debris in marine ecosystems, and thus could eventually support management strategies in the global ocean.
1. Introduction
With evidence of a significant cumulative increase over the last 60 years, plastic debris in marine environments is currently considered one of the most topical issues in marine pollution due to its potential impact on human and ecosystem health [1,2]. The global amount of microplastic debris was estimated between 93 and 236 thousand metric tonnes for 2014 [3], while there is also sufficient evidence that the largest plastics accumulator (Great Pacific Garbage Patch) is constantly growing [4]. Plastic debris has been found in fish [5] in different trophic levels and habitats. In fact, plastic debris was found in >25% of individual animals and in >50% of the species collected in fish markets in USA and Indonesia, revealing that plastic debris poses a threat to marine animals and human health. Plastic debris events have been reported even in deep-sea organisms (such as Cnidaria, Echinodermata and Arthropoda) in the equatorial mid-Atlantic and the SW Indian ocean, mainly due to their exposure to human waste and ingestion of plastic microfibres [6]. Microplastics from various sources have been also found on seafloor sediments [7], in sea surface microlayer in estuarine systems [8] and in arctic waters [9], indicating that marine debris is abundant across all marine systems.
Runoff (including riverine outflow) and beach users are important sources of marine debris in coastal regions, while offshore transport by ocean currents has been shown to be the most important driving force to the open waters [10]. Between 1.15 and 2.41 million tonnes of plastic waste enters the ocean every year from rivers, with over 74% of emissions occurring between May and October [11]. Mani et al. [12] indicated almost 900 thousand plastic particles per km-2 along the Rhine River, reflecting the significant role of rivers as debris pathways to the open seas. The large mass of mismanaged plastic waste [13] directly affects the amount of plastics in marine ecosystems, while the constant increase in plastic production [14] can potentially have a significant impact on the amount of expected marine plastic debris discharges.
Nevertheless, understanding plastic debris distribution dynamics is challenging as it is influenced by its own physical characteristics (density, size) as well as environmental features (such as winds, waves, thermohaline gradients) [15]. In particular, time series of plastic concentrations in the western North Atlantic Ocean [14] (1986 to 2008) showed that the highest concentrations were associated with sea surface currents transport, indicating that floating plastic debris is a passive tracer of ocean dynamics. Lusher et al. [16] found microplastics in surface and subsurface Arctic waters that entered the sea via coastal sewage and wastewater and were transported by large-scale currents to the open ocean. They also showed that sea surface temperature is an important predictor of microplastics abundance, influencing water mass circulation (i.e., cyclonic eddies, gyres and seafronts). Kataoka et al. [17] used high-resolution aerial imagery in order to estimate debris distribution around Vancouver Island (Canada) and relate its accumulation to Ekman flow and prevailed winds. The majority of litter-detection studies have been primarily conducted using conventional methods (e.g., trawl, glass plate, net). These methodological approaches are effective; however, they have weaknesses including the relatively high-cost, the need for personnel, the deployment proximity to the land, and the low spatiotemporal coverage of the acquired data. Alternatively, satellite remote sensing could provide adequate information in detecting plastic debris at the surface of the oceans at high spatial and temporal scales.
For instance, Light Detection And Ranging (LIDAR) imagery [18] and high-resolution commercial satellite data [19] have been used with machine learning techniques for beach debris identification and classification. Worldview-2, Advanced Spaceborne Thermal Emission and Reflection Radiometer (ASTER) and Synthetic Aperture Radar (SAR) satellite datasets have been efficiently employed in monitoring marine plastic debris events, for instance, after the great east Japan earthquake on March 2011, when a remarkable amount of >1.5 million tonnes of debris was generated [20,21]. Satellite data coupled with ocean models have also been employed to investigate the temporal variability of marine debris, its anthropogenic sources [22,23] and its accumulation patterns [24]. Regardless of the benefits exploiting such cost-effective tools, there are indeed limited studies utilizing high-spatiotemporal-resolution satellite-derived information from contemporary sensors.
In this study, high-resolution satellite observations acquired from multiple sensors and verified with in situ data were processed, aiming to detect and monitor the source and transport of marine plastic debris around Bay Islands in the Caribbean Sea. The selected region is ideal for such scope, since remarkable amounts of plastic debris have been reported, facilitating the remote sensing validation. In particular, between 2014–2019, we collected several in situ data of marine plastic debris (via vessel and diving expeditions), utilized local stakeholders’ reports and processed numerous high-resolution multispectral satellite data from three contemporary satellite missions (Planet, Sentinel-2, Landsat-8) over the region of interest. We have detected and verified multiple floating plastic debris incidents by additionally recording and assessing in a systematic manner the spectral signatures from pure floating plastics and discriminating them from other floating features on the sea surface (e.g., Sargassum, foam). Moreover, we explored plastic debris sources and distribution dynamics based on multitemporal remote-sensing observations, surface circulation model outputs and wind data. It should be noted that the main objective in this study was not to develop an automated approach, a spectral index or an algorithm for the detection of floating marine plastics. The deployment of an operational marine debris detection system is quite challenging since multi-modal data from different remote sensing sensors have to be seamlessly blended and integrated with additional ancillary data and complex numerical models. Moreover, the detection of submerged plastics and spatially scattered debris is still challenging, as very high-resolution remote sensing observations and direct measurements are required. Through our work, the primary goal was to exploit satellite remote observations from all available high-resolution data for several years, verify findings with in situ data, record the spectral characteristics of the floating plastic litter for numerous cases in different seasons and integrate other weather and ancillary data to identify marine plastic trajectories as well as possibly detect the source of marine plastic entering our seas. Our results stress that the concurrent exploitation of several satellite remote sensing observations can form an efficient tool for monitoring marine plastic debris. The current methodological approach may reinforce marine plastic debris management strategies (including prevention actions) and could be further used for validating global prediction models of plastic debris.
2. Materials and Methods
2.1. Earth Observation Data
From June 2014 to December 2018, a total amount of 125 Landsat-8 (L8) OLI level1T data and 340 Sentinel-2 (S2) MSI level1C images were acquired from the U.S Geological Survey (https://earthexplorer.usgs.gov/) and Copernicus Hub (https://scihub.copernicus.eu/). In particular, three L8 path/row (i.e., 19/49, 18/49 and 17/49) and eight S2 tiles (i.e., 16PCC, 16PDC, 16PEC, 16PFC, 16PGC, 16QFD, 16QED and 16QDD) were selected, covering the study area (Supplementary Figures S2–S4). For the year of 2019, data were collected from late August to September 2019. The satellite data with a cloud presence of over 25% were rejected and were not further processed. The rest of the data were atmospherically corrected, and surface reflectance values were extracted using ACOLITE atmospheric processor [25]. Land and clouds were masked through Geographic Information System software (QGIS). Moreover, apart from the open S2 and L8 data with 10 m and 30 m spatial resolution, respectively, additional high-resolution data were obtained from Planet Labs, USA (https://www.planet.com). In particular, more than 400 images with spectral bands on the visible and near-infrared were observed at a spatial resolution between 3 m and 5 m, while 40 of them were processed and analyzed for mapping the observed plastic debris and Sargassum in the study area. For the Planet data, already atmospheric-corrected images were employed for both debris annotation and spectral signatures calculation.
2.2. Ground Truth/Ancillary Data Collection
Between 2014 and 2019, in situ data were collected through vessel and diving expeditions around Bay islands (Supplementary Table S1). Additional data were obtained from local stakeholders who were engaged in beach cleanup, professional diving, the “Dive Against Debris” initiative, fishing and media in Honduras, and the Solid Waste Management office of the Municipality of Zacapa in Guatemala. Information about floating plastic debris and Sargassum occurrences and trajectories was systematically recorded and used as reference data against the multitemporal observations on the satellite data. For Sargassum events, reports from the South Florida Optical Oceanography Laboratory were also employed and analyzed. Meteorological and sea state data (e.g., precipitation, wind, sea surface currents) were also acquired for a six-year period, i.e., 2014-2019. These data were associated and linked with the multitemporal satellite observations and debris events. In particular, daily precipitation data were acquired from the La Ceiba station (15° 44′ 53″N, 86° 50′ 36″W) through the National Oceanographic Data Center of National Oceanic and Atmospheric Administration (NOAA) (https://www.nodc.noaa.gov/). Moreover, data regarding the wind direction and speed were derived from the National Data Buoy Center (https://www.ndbc.noaa.gov/) and NASA Prediction of Worldwide Energy Resources (https://power.larc.nasa.gov/data-access-viewer). Sea surface currents velocity and direction was estimated using daily ocean physics analysis data from (CMEMS, http://marine.copernicus.eu/).
2.3. Detecting and Discriminating Floating Plastic Debris and Sargassum
Based on the multitemporal reference data from in situ observations, numerous satellite images from different satellite missions were collected and annotated with plastic debris polygons in a Geographic Information System environment (i.e., QGIS). In particular, an intensive and laborious manual on-screen digitization was performed from photo-interpretation experts, annotating numerous images with plastic debris and Sargassum slicks. Apart from these two primary categories (i.e., plastic debris and Sargassum), plastics were also subdivided into individual polygons according to the observed density of the plastics, i.e., (a) dense, (b) medium and (c) sparse. In total, around 1500 pixels of “dense”, 3200 pixels of “medium” and 5000 pixels of “sparse” pixels were digitized. Based on the in situ data and verified debris events around the Roatan and Cayos Cochinos islands, numerous pixels containing clear material observations (i.e., not mixed pixels) were collected towards calculating the spectral signatures of both plastic debris and Sargassum from the multitemporal multispectral data. In order to do so, around 1600 reflectance values were extracted from the satellite data and compared with the literature [19,26,27,28,29]. Since we collected and processed numerous satellite images, the detection and verification of plastics were performed on data acquired under various weather and ocean conditions. Despite these diverse conditions, the performed atmospheric corrections and spectral signatures extraction and assessment contributed to the effective detection of debris and its successful discrimination from other floating objects/features (Figure S1). We have to note that the presence of clouds was the main barrier for plastic debris detection.
2.4. Spectral Signatures
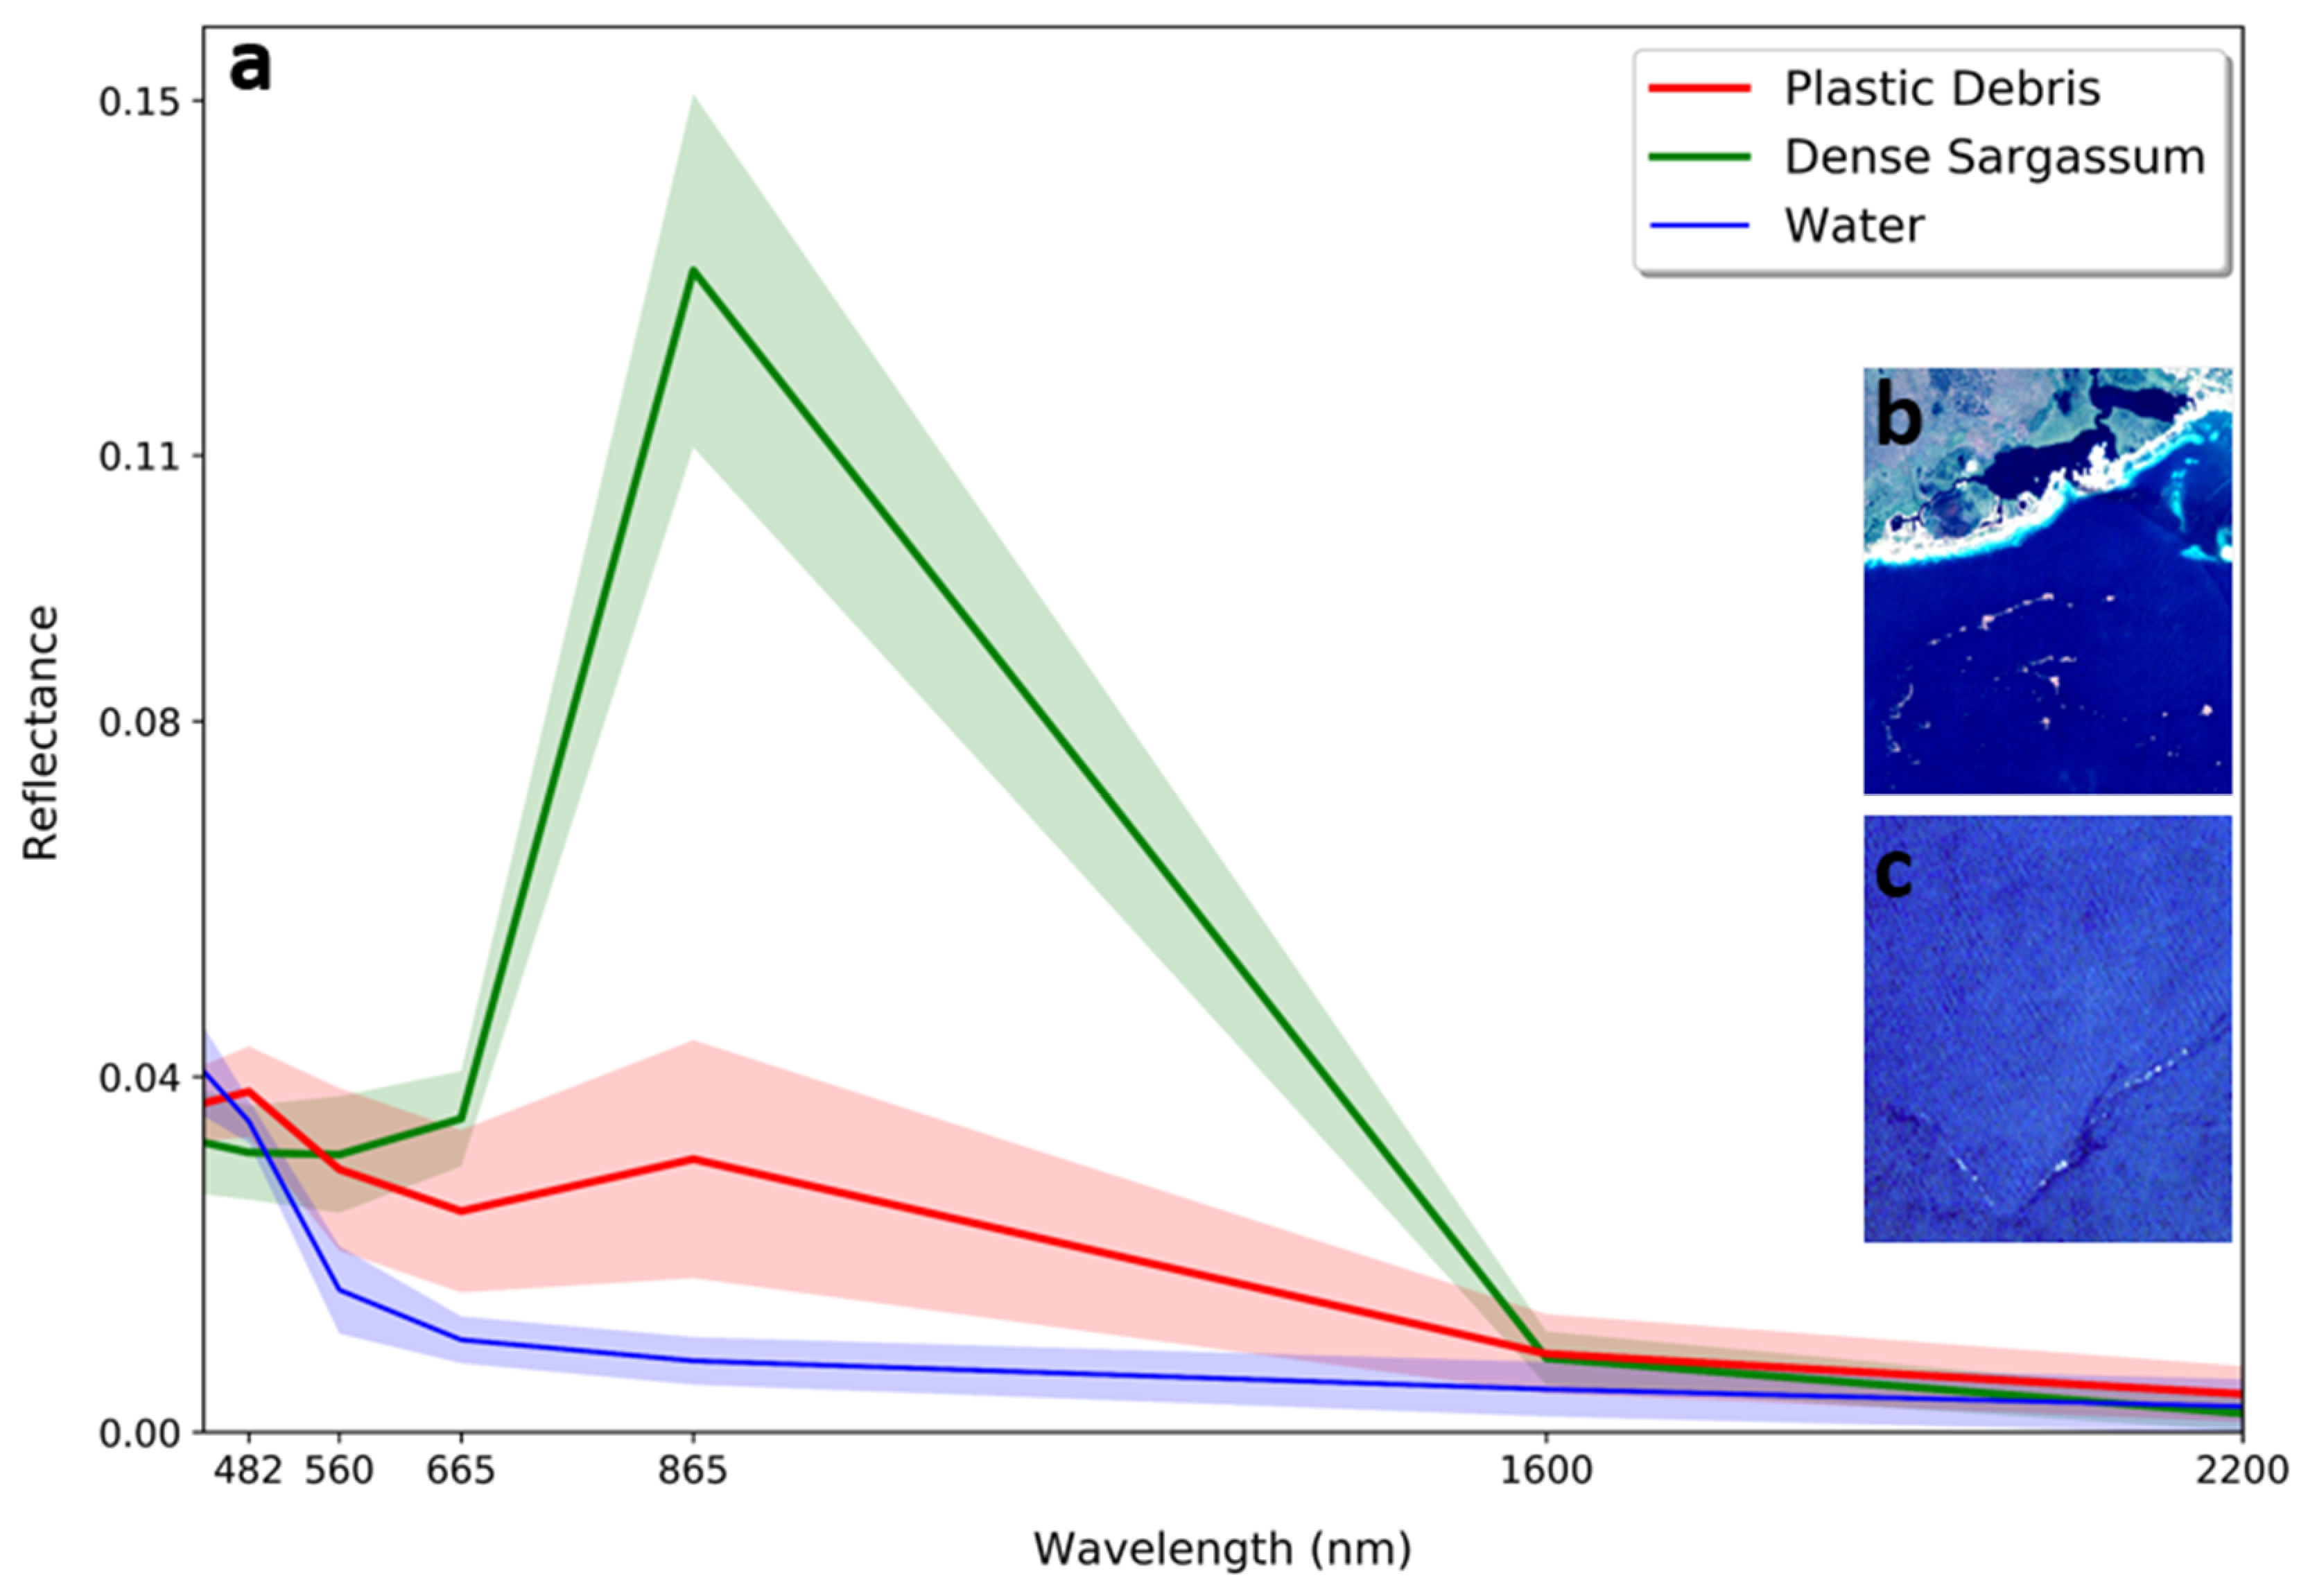
The systematic recording of both plastic and Sargassum spectral signatures on numerous satellite multispectral data led to discrimination of these floating features. Figure 1 demonstrates the spectral signatures of plastic debris, dense Sargassum and water pixels derived from Landsat-8 and Sentinel-2 satellite sensors. Both floating materials result in an enhanced reflectance at the Near-Infrared region [2,26,29]. However, we observed that floating macroalgae leads to a significantly higher peak at Near-Infrared (NIR) and higher absorption at the Shortwave-Infrared (SWIR) region. This finding contributed also to the aforementioned annotation step. Sargassum presented an increasing reflectance at visible wavelengths, as the opposite occurred for plastic debris. This fact means that we are capable of separating the optical signatures of those two different materials. Our analysis in general agrees with the recent study of [29]. However, reflectance peak of plastics at blue and green bands is slightly lower in our study, as we did not record only spectral signatures of very dense plastic debris (e.g., like the ones from artificial plastic targets that were employed for some cases in [29]). Observed Sargassum reflectance peak at Near-Infrared band is higher in our work, and this is expected as we selected pixels over large Sargassum blooms and annotated them as “dense”. Regarding atmospheric correction in regions over the sea, we recorded slightly higher reflectance at the blue band, which is possibly due to different employed version of ACOLITE.
2.5. Identification of Plastic Debris Events
Along with the events that were directly verified with in situ observations, additional debris events were detected based on the observed spectral signatures, plastic debris characteristics reported in the literature, the detected debris size and pattern, the successful detection of debris on multitemporal data, the successful correlation of the estimated trajectories and sea surface currents direction, their association with specific river discharges and corresponding rainfall events. The detected debris was verified based on the aforementioned criteria and was discriminated from any other sea surface structure that may resemble plastic debris i.e., mainly seawater convergences and fronts. In Table 1, all the detected and verified events, the corresponding satellite data and the verification manner are presented.
2.6. Plastic Debris Quantification and Tracking
In order to quantify the detected plastics, the area of every debris slick was calculated based on the number of pixels at every given polygon and the spatial resolution of the satellite image (Table 2). An adjustment based on material density (i.e., dense, medium and sparse) was applied for every plastic debris pixel. In order to estimate the weight of the detected plastics per polygon, we made the following assumptions based also on the corresponding in situ observations: the average thickness of the observed dense floating plastics was approximately 30 cm, which results in a plastic mass of 5000 tonnes per km2. Although field and laboratory observations are accurate and direct methods for plastics properties examination, prediction models can provide an automated and cost-effective indication of discharged plastic debris weight per river based on waste management, population density and hydrological information. For this reason, the satellite-estimated weight for all events was also compared with the ones derived from state-of-the-art global prediction models [11]. In order to do so, the required geospatial data were obtained and monthly plastic mass midpoint estimates [11] were used for each river (Table 2).
2.7. Potential Bias
In several cases of in situ collections, the floating plastic debris was mixed at a certain extent with macroalgae species or organic material (wood, tree branches etc.). This is expected and in accordance with the literature [30]. Due to the spatial resolution of the satellite data (i.e., 3 m to 30 m), discrimination of plastics from other floating features was not achievable at the pixel level. Spectral unmixing was also beyond the scope of this work. For this reason, throughout this study, only the clear—inside the range of their standard deviation (Figure 1)—plastic pixels were considered and annotated. We estimated the weight with the same manner for all events; however, these estimations are representative for our study area with cases of dense plastic masses [31].
3. Experimental Results
During a six-year period (2014–2019), multitemporal high-resolution satellite datasets from Sentinel-2 (10 m spatial resolution), Landsat-8 (30 m) and Planet (3–5 m) along with in situ observations were systematically collected and processed over Bay Islands, for the identification and verification of plastic debris events. Towards this direction, we collected satellite data over a broader area of Caribbean Sea, including the southeastern part of Honduras’ Gulf and the northern part of Honduras’ coastline (see Methods). The next subsections describe (i) the process of detecting and verifying the plastic debris from space (Figure 2 and Figure 3), (ii) its spatial distribution and extent in the study area (Figure 4), its major characteristics (Table 2), (iii) the detection of debris source (Figure 5) and (iv) the observed dominant transport trajectories of floating debris (Figure 6).
3.1. Detecting Marine Plastic Debris From Satellite Observations
Plastic debris pixels identification was achieved through interpretation of satellite-derived data from three satellite missions (Figure 2 and Supplementary Figures S5 and S6). Using successive satellite images before and after the reported plastic events, we managed to detect their sources at the rivers’ mouths as well as their transport trajectories in Bay Islands area. In almost all cases that plastics were detected and tracked, they were accumulated at dense masses following linear trajectories. Plastic debris was occasionally detected in fronts, which were identified in satellite data through blue color differentiation due to discrete water masses (e.g., Figure 2c,d).
Our results were verified with in situ data that were collected around the Bay Islands i.e., Roatan, Utila and Cayos Cochinos (Figure 3). Collected data indicated dense plastic masses of 6 km length (on average), and their widths varied from 1 m to 40 m. Plastic debris in the Bay Islands was dominated by macroplastics and secondary microplastics, reflecting its proximity to land and plastic pollution sources. In some cases (i.e., October 2017, November 2016 and November 2015), satellite data captured exactly the region of observed plastic debris, and in other cases (i.e., September 2014, October 2016, October 2018,) plastics were detected in satellite data up to 10 km from the in situ collections (Figure 3).
3.2. Spatial Distribution and Descriptive Information of Plastic Debris
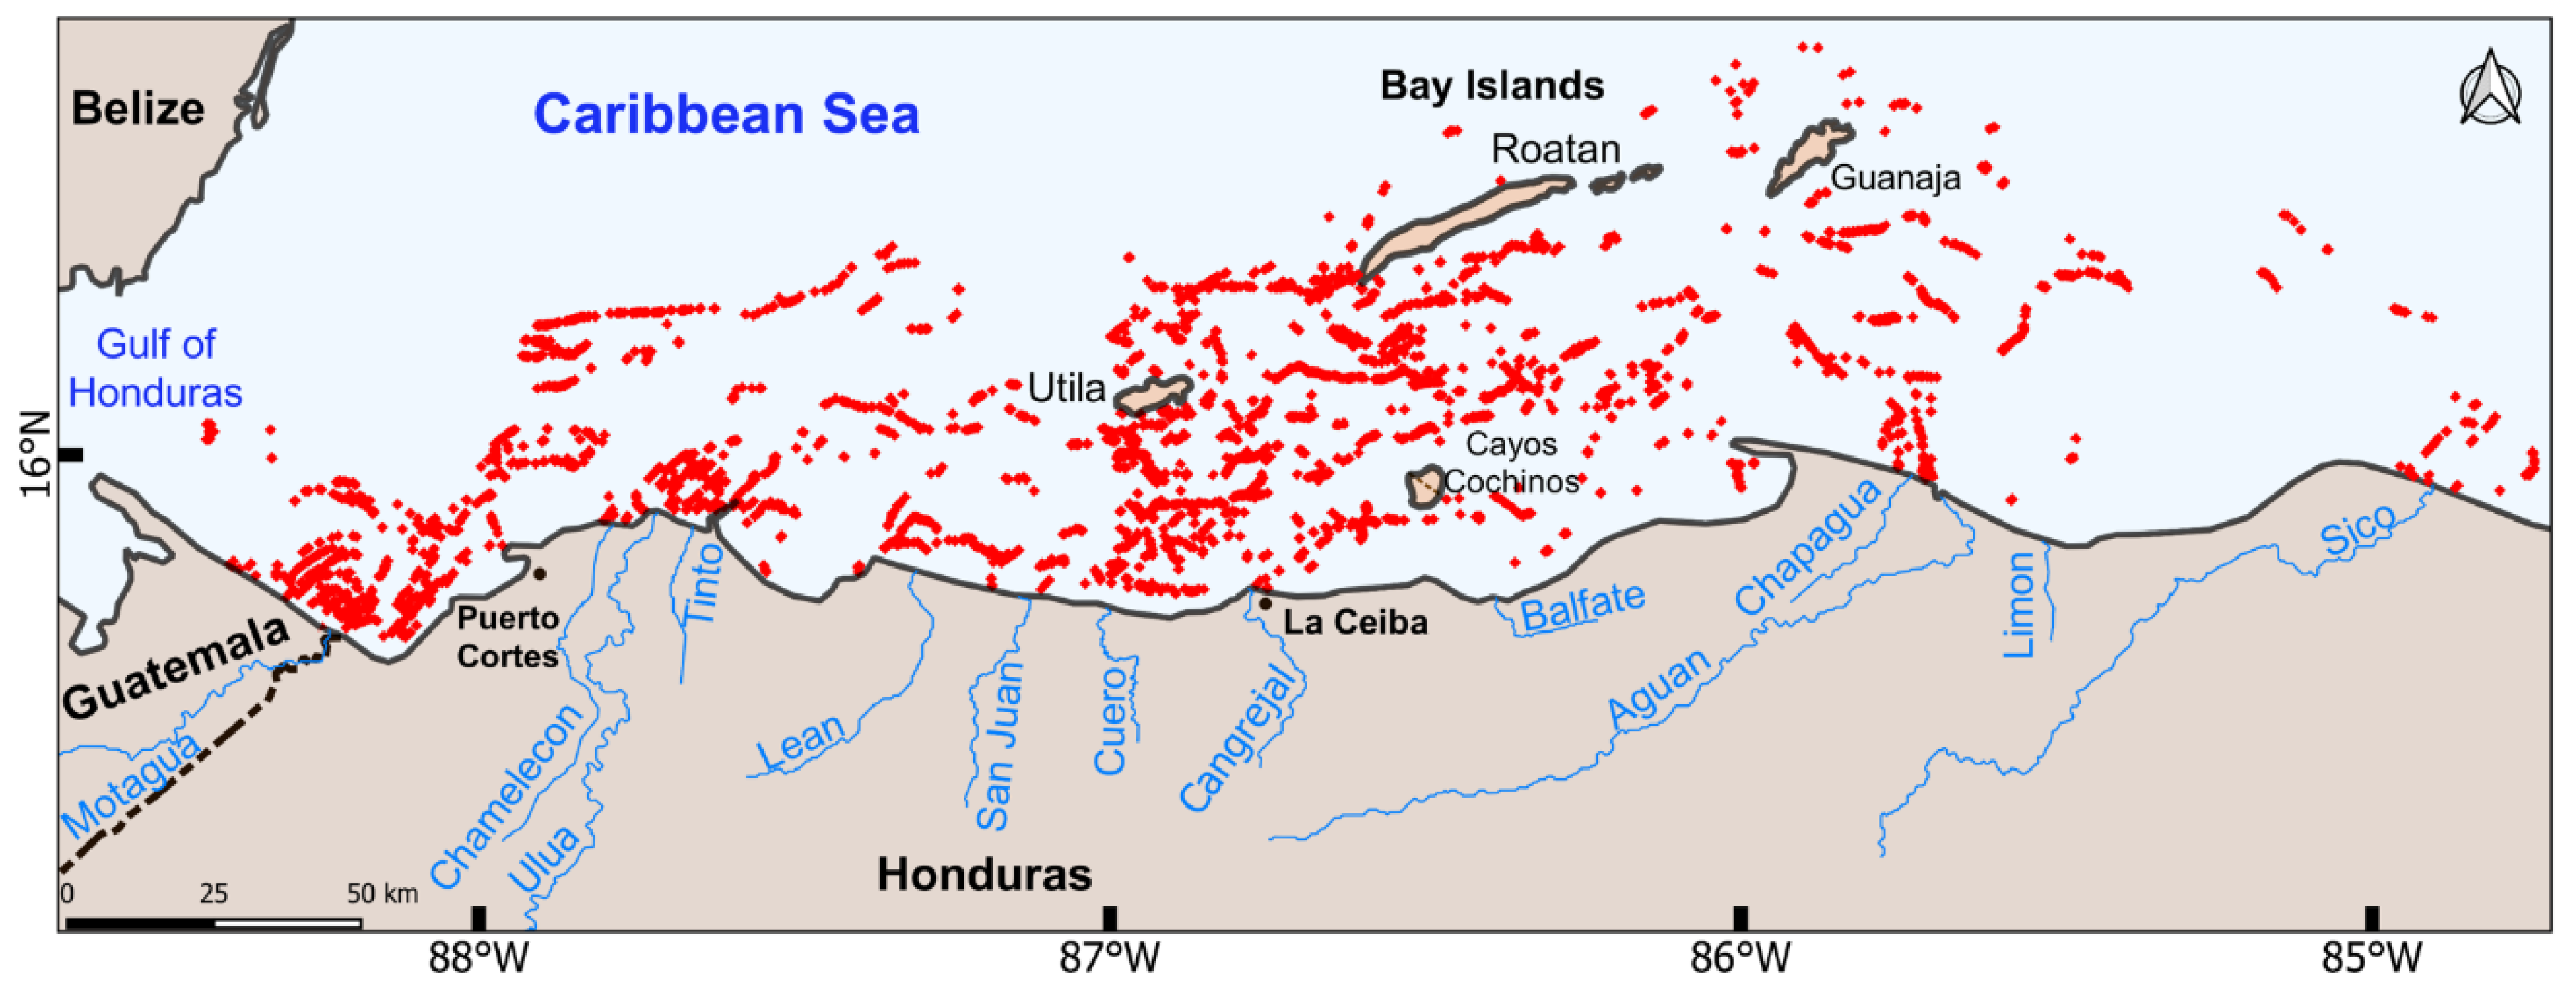
A validation procedure was applied on all reported plastic debris events from in situ collections, leading to plastic debris pixels detection and annotation in the available satellite data from 2014 onwards (Figure 4). In our study area, there is no evidence of a specific region where plastics accumulate. Instead, plastic debris seems to be distributed and travel all over the region, indicating a potential dynamic circulation influencing its transport around the Bay Islands. Our detections highlight that Guatemala’s and Honduras’ river mouths are the main sources of plastic pollution in the study area.
In particular, the Motagua River (Guatemala) and Ulua River (Honduras) seem to be major sources of frequent plastic debris discharges, followed by Tinto, Cangrejal and Aguan rivers (Honduras). Other relatively large (e.g., Sico, Chamelecon) and smaller rivers (e.g., Lean, Cuero) in Honduras have been also detected as occasional plastic debris sources (Figure 4).
In order to obtain more descriptive information about plastic debris source and transport in the Bay Islands, we examined their characteristics during all recorded events. Table 2 summarizes the satellite-detected events and provides information regarding the surface area covered by debris, its estimated weight, the detected trajectory based on multitemporal observations and oceanographic conditions for the corresponding dates, i.e., surface currents and wind speed/ direction. In total, 20 plastic debris events were recorded based on in situ collections, satellite observations and photo-interpretation.
Analyzing the numerous collected data, we found that plastic debris events occurred during late summer to early Spring (August to March). During the specific events, plastics were still accumulated in dense masses, reinforcing the capability of their detection, yet their spread, as well as their progressive degradation in smaller plastic debris, did not allow further detection in available satellite data. Table 2 demonstrates that September, October, January and November were the months with a significant presence of floating plastics at sea. Regarding the duration of their presence at sea surface during the study period, in 2016 and 2017, the events lasted for five months, while in 2018 they lasted for more than half a year. Based on the outcomes of debris detection and quantification (see Methods) for all reported events, we found that the total area of detected plastic debris was 0.77 km2 in 2018, 0.5 km2 in 2017 and 0.23 km2 in 2016.
During the recorded events, currents appeared to have an SW–NE direction with velocities ranging from 0.06 to 0.26 m/s (Supplementary Figure S7) and easterly winds prevailed with recorded speeds of 1.3 to 6.3 m/s. Based on the multitemporal satellite data, debris tracking (i.e., detection of the same plastics at different locations/ images on different dates) was achieved for 13 out of the 20 plastic debris events.
Combining information from in situ data and remote sensing observations, we calculated the plastic debris speed for those events. According to Table 2, plastics’ travelling speed ranged from 0.02 to 0.14 m/s; however, in every case their speed was found to be lower than the currents’ speed. This indicates that debris travels at a slower pace than the speed of sea surface currents, probably due to its heavy weight and submerged structure. For this reason, we examined if larger, heavier patches could lead to relative lower travelling speeds. However, testing such hypothesis offers no such evidence, since no correlation was found between the estimated debris weight and its speed (r2 = 0.02, p >0.05, n = 13), indicating that the travelling pace is mainly controlled by the intensity of ocean currents regardless of its weight. For almost all cases indeed, we found that prevailing currents were strong enough to transport plastic debris. The estimated speed of plastic debris (Table 2) was highly correlated with currents’ velocity (r2 = 0.75, p < 0.005, n = 13), yet debris speed did not present any correlation with wind speed (r2 = 0.01, p > 0.05, n = 13). The latter result could be expected, as prevailing eastern wind direction affected debris movement only for the detected event during November 2015 (Table 2).
3.3. Identifying the Source of the Floating Debris
For all of the recorded events (n = 20) we found that the detected floating debris was originating from certain river mouths (Figure 5), and the discharges were related to major recorded rainfalls. All satellite sensors captured plastic debris mostly at river plumes, while only the very high-resolution Planet sensor recorded plastics at the rivers’ tidal area (Supplementary Figure S5a). Satellite data were also capable of verifying in situ observations of massive plastic debris areas along large rivers in the mainland. For example, in late August/ early September 2019, debris source was verified with in situ observations along the Motagua River around the city of Zacapa (Guatemala), which is 170 km away from the river’s estuary (Video S1). The detected debris floating along the river Motagua (Figure 5b) was only partially captured on custom-made litter-stopping booms (nets with plastics, Figure 5c), while the majority of plastics (i.e., mostly plastic bottles, plates and food wrappers) were discarded through Motagua River mouth. Satellite data evidently detected plastic debris areas during September 2019 (Figure 5e,f,g).
3.4. Dominant Travelling Trajectories of Floating Debris
Based on the detection of floating debris at multiple sequential dates, we managed to track plastic debris transport and estimate its travelling trajectories for 13 out of 20 reported events (Figure 6, Supplementary Figures S8 and S9). A quite representative case was the reported event of late September–October 2017, during which remarkable amounts of plastics were discharged following the rainfalls of the 24th–25th of September 2017 and onwards. In particular, on the 7th and 9th of October, plastics from Cangrejal River were tracked on Planet and Sentinel-2 data in a distance of 16 km up to 48 km from the river’s mouth.
Tracking of floating debris was achieved in the multitemporal satellite data between the 7th and 9th of October. On the 7th of October, two plastic slicks were detected on a Planet image (1 km and 600 m length, respectively) originating from the Cangrejal River. On the 9th of October (Planet and Sentinel-2 images), the same debris was detected and tracked (1500 m length) travelling towards Cayos Cochinos, indicating that the two previous instances had been accumulated into this larger one. Based on detected river discharges, identified plastic slicks, tracking and surface circulation, we estimated plastic debris travelling trajectories in the Bay Islands area for October 2017. Our findings indicate that sea surface currents transported plastic debris in a SW-NE direction, and due to the local dynamic circulation, debris travelled over a long distance up to 170 km from the source (Figure 6).
4. Discussion
Plastics are rapidly increasing in both coastal and oceanic environments, highlighting the urgent need for continuous tracking and monitoring, as well as for implementing prevention measures. Here, we examined the effectiveness of satellite sensors in monitoring plastic debris, with the Bay Islands province as a case study. Over this region, large dense masses of floating plastics frequently occurred, suggesting that it is an ideal region to investigate plastic debris dynamics. In situ collection revealed several types of plastics, including bags, bottles, plates, caps, forks, spoons and food wrappers, which are the most commonly recorded macroplastics, in accordance with Ocean Conservancy reports [32].
Additionally, the frequently observed floating macroalgae Sargassum slicks in the region, originating from the east [33,34], shows that this province is ideal for satellite discrimination of plastic debris from floating macroalgae species (see Methods). Our results indicated that satellite sensors are capable of detecting plastic debris, as we managed to identify all of the reported events. Moreover, our findings are contributing to recent open issues and critical questions [30] regarding plastic debris source, transport, distribution and natural processes that influence them. In particular, based on in situ collection (vessel expeditions and citizen science reports) and remote sensing, we attempted to respond to several of the suggested questions. Each identified event was described in detail, regarding the plastic debris source (i.e., specific rivers) and amount (i.e., detected floating debris size and estimated weight). Using temporarily dense satellite observations, we also estimated (for certain events) plastic debris velocities and trajectories, leading to an overall quantitative and qualitative description of plastic debris characteristics in the Bay Islands of the Caribbean Sea.
Driven from numerous satellite observations during the reported events (2014–2019), plastic debris covered a total area of 1.6 km2 with a total estimated weight of 8000 tonnes (Table 2). Our findings are in accordance with the local stakeholders, which indicate that floating plastic debris has been increasing from 2016 onwards. In particular, currently, shores have to be cleaned up from local authorities more frequently than in 2016 and the years before i.e., from 1–2 times per year, steadily to minimum 3–4 times, depending on the year. Moreover, our results indicated that plastic debris was distributed all over the region (Figure 4), highlighting that there is an urgent need for local authorities to take prevention measures at the national level. Additional in situ data need to be collected, also within the water column, in order to examine the biological and chemical mechanisms that control plastics degradation, movement and accumulation in the study area.
Furthermore, based on verified multiple observations and cross-validation between the different satellite sensors and in situ data, the main source of the plastic debris was found to be the river discharges from the corresponding catchment basins of Honduras and Guatemala. Plastics enter the Caribbean Sea through the river estuaries, travelling over long distances up to 200 km from the source, due to dynamic surface circulation. Plastic debris was systematically recorded after major rainfall events between the months of August and March, which includes the main rainfall season (i.e., October to February) [35]. Large rivers (e.g., Motagua, Ulua, and Aguan) were the major plastic pathways towards Bay Islands, confirming recent studies reporting on the significant impact of river discharges on marine plastic pollution [36,37]. Apart from these major contributors, smaller rivers that pass through cities (e.g., La Ceiba City—Cangrejal River) and plastic waste sourcing from major harbors (e.g., Puerto Cortes harbor) were also detected to contribute to plastic pollution in the study area.
Based on multitemporal satellite, meteorological (e.g., precipitation) and oceanographic datasets (e.g., currents), plastic floating debris was tracked and monitored, allowing us to record and estimate its travel distances and trajectories. The detected and verified debris trajectories indicated that sea surface currents significantly affect plastic debris transportation and distribution in the Bay Islands region. This is in accordance with the literature [14] since floating debris has been proven to be strongly affected by ocean circulation. Floating debris was detected occasionally at fronts, which is also in accordance with the literature [23]. Plastic debris followed, in general, an eastward direction. Regarding the main oceanographic features, in most cases, the Honduras gyre [38,39] was observed (~100 km) north of our study area. In cases that the Honduras gyre was located closer to our study area (Figure S7), we did not observe any relevant floating debris patterns, indicating the gyre as a transporting driver. However, further investigation is needed to explore how smaller features (such as the cyclonic eddy between Cayos Cochinos and Roatan islands) [40,41] possibly contribute to plastic debris transportation in Bay Islands area.
Regarding oceanic conditions that were recorded during reported debris events over the Bay Islands, we found that the main current direction was SW–NE and the mean current velocity was 0.11 m/s. Easterly winds prevailed, and the mean wind speed was found to be 4.4 m/s. The multitemporal tracking of plastic debris indicated a mean debris velocity of 0.07 m/s. Our findings about the mean current velocity and wind conditions are consistent with previous studies [42,43]. According to the literature, the travelling speed of the detected marine debris varies from 0.05 m/s when it follows the geostrophic speed of currents, like in North Pacific [44], to 0.35 m/s after tsunami [21], and 0.5 m/s when debris velocity is constrained by boundary currents like the Gulf Stream.
Satellite-derived monitoring of plastic debris certainly has acknowledged weaknesses, and for this reason, we managed to track its distribution in 13 out of 20 recorded events. Continuous tracking of debris from the source (i.e., river mouth) towards the open ocean was not always possible. This fact is attributed to the lack of daily satellite observations, the relative high cloud coverage (cases with >25% coverage is common during rainfalls), and the spatial resolution of open-access data (i.e., S2 and L8), which cannot capture debris spread, especially during stormy conditions (indeed, in most of the cases that debris tracking failed, the wind speed was greater than 5 m/s and currents velocity was ≥0.1 m/s, while rainfall ranged from 49 mm to 292 mm). Comprehensive marine debris monitoring is certainly interdisciplinary by nature. Satellite-derived approaches allow the detection and tracking of floating debris at the surface, rather than providing information on the submerged litter [2]. More field campaigns accompanied with auxiliary observations have to be carried out in order to examine in more detail how the precipitation amount, wind speed and vertical mixing influence plastics abundance and trajectories on sea surface [45]. For instance, it has been suggested that future efforts should involve a thorough investigation of physical processes that affect plastic debris transport across multiple scales (e.g., Ekman, waves, Langmuir circulation), to successfully report their vertical and horizontal distribution in the water column [46].
In addition, to further validate the satellite-derived outcomes, we compared our results with state-of-the-art global plastic debris modeling procedures [11]. Regarding the estimated weight and maximum plastics input per season, our results differ slightly from model predictions. In particular, the global model predictions, for most of the rivers within our study area, suggest that the season with the maximum input of plastics is from October to December. However, evidence from satellite observations shows that the maximum plastic debris season is longer (i.e., from September to January). Regarding weight estimations, model predictions seem to underestimate river plastic inputs during the period of January to March, when river plastic inputs detected from remote-sensing were important. However, in order to obtain more accurate comparison results, model outputs need to be produced during the same period of time. Our weight estimations may be higher than previously reported in other regions (e.g., the Mediterranean Sea) [47]; however, plastic patches observed here were remarkably dense. Due to the heterogeneity of polymers that marine plastic debris is composed of, additional in situ and laboratory measurements would increase the accuracy of weight estimation. To this end, future studies should incorporate a more multidisciplinary approach to reach an integrated marine debris monitoring system [2], where model outputs could be further improved by synergistically combined satellite-derived observations and in situ collections.
The identified gradual increase in plastic marine pollution must be further studied in relation also with the rapid urbanization and Municipal Solid Waste Management (MSWM) in the Caribbean Sea. In particular, Honduras’ urban population has been increased from 22.7% to 55.3% during the period of 1960–2016, while in Guatemala, the corresponding percentage increased from 31.1% to 52%. For both countries, MSWM is very challenging [48], as open-air waste burning, uncontrolled open-air dumps and disposal in water bodies are common waste activities [49,50]. Lack of recycling and insufficient waste treatment technology is also an essential issue leading to high plastic amounts in landfills and dumps [50]. According to an earlier study [51], there is no policy for waste management in most urban areas in Guatemala, while in Honduras, only urban areas have access to municipal waste collection services. It is worth mentioning that in the largest cities of Honduras, only 28% of the domestic waste is collected and only 3.7% of the total waste ends up in a sanitary or controlled landfill.
5. Conclusions
To sum up, the high-resolution multispectral satellite data can contribute significantly to the efficient monitoring of marine litter dynamics, the detection of its origin and the dominant marine plastic pathways. Ocean circulation plays an important role in marine debris transportation, as in most examined cases, surface currents lead to the dispersion of plastic debris in the whole region. Satellite and in situ observations should be further analyzed synergistically to monitor the plastic debris dynamics in major accumulation hotspots such as the North Atlantic gyre, which is the most essential “attractor” [14,52] in the surrounding region, as well as the possibility of the Honduras gyre being the local accumulation center of debris. Limitations regarding mainly the continuous tracking of plastic debris (e.g., on a daily basis) highlight the need for automated machine learning algorithms capable of plastic pollution detection using any additional optical or radar earth observation data. Machine learning algorithms have proven valuable in forecasting various water quality parameters [53,54]; therefore, the successive continuation of plastic debris detection efforts should involve an automated approach (such as machine learning) encompassing both high-resolution satellite and in situ observations. New technology and specific satellite sensors capable of direct tracking of plastic debris could alter our understanding of marine plastic dynamics remarkably. A new waste management plan must be set up for Guatemala and Honduras, including both citizens and industries. Recycling and integrated waste management systems, should be implemented everywhere within a country (including smaller towns and villages in the mainland) and not only in the coastal large cities. A well-designed management strategy is required to protect marine life and public health at a global scale [55]. Except for national waste-management laws and local stakeholders’ involvement, management strategies should facilitate a collaboration between marine debris networks [56,57]. Eventually, international conventions [58] can play a key role in reducing the produced plastic waste quantity and plastic hazards through their lifecycle.
Supplementary Materials
The following are available online at https://www.mdpi.com/2072-4292/12/11/1727/s1, Table S1: Reported plastic debris events along with corresponding coordinates (WGS’84); Figure S1: Indicative sea state and weather conditions among the numerous collected and processed satellite data; Figure S2: Indicative satellite data for late September and October 2016 plastic debris event; Figure S3: Indicative satellite data for late September and October 2017 plastic debris event; Figure S4: Indicative satellite data for October 2018 plastic debris event; Figure S5: The detected plastics (red dots in the map) and snapshots of the corresponding satellite images at the Gulf of Honduras and Bay Islands during October 2018; Figure S6: The detected plastic debris (red dots in the map) and snapshots of the corresponding satellite images at the Gulf of Honduras and Bay Islands during late September and October 2016; Figure S7: Sea surface currents direction and velocity for the 9th of October 2017 as derived from CMEMS (Global ocean 1/12° physics analysis and forecast daily product); Figure S8: Plastic debris source, corresponding river discharges and estimated debris trajectories based on the multitemporal detections in the Gulf of Honduras and Bay Islands during October 2018; Figure S9: Plastic debris source, corresponding river discharges and estimated debris trajectories based on the multitemporal detections in the Bay Islands during late September and October 2016; Video S1: Plastic pollution along the Motagua River near Zacapa city (late August 2019).
Author Contributions
A.K., K.K. and C.A.P. designed the study. A.K. and K.K. processed satellite data. C.A.P. collected in situ data. A.K., D.E.R. and K.K prepared the experimental validation and wrote the manuscript. A.K., K.K. and D.E.R. prepared figures and tables. All authors reviewed the manuscript. All authors have read and agreed to the published version of the manuscript.
Acknowledgments
We thank Kostas Tsiaras and Harilaos Kontoyiannis for useful discussions. We would like to thank Julio R. Guzman Perdomo from the Solid Waste Management of Municipality of Zacapa for sharing openly his multimedia recordings regarding plastic pollution along Motagua river, contributing to our in situ data collection.
Conflicts of Interest
The authors declare no conflict of interest.
References
- Ostle, C.; Thompson, R.C.; Broughton, D.; Gregory, L.; Wootton, M.; Johns, D.G. The rise in ocean plastics evidenced from a 60-year time series. Nat. Commun. 2019, 10, 1–6. [Google Scholar] [CrossRef]
- Maximenko, N.; Corradi, P.; Law, K.L.; Van Sebille, E.; Garaba, S.P.; Lampitt, R.S.; Galgani, F.; Martinez-Vicente, V.; Goddijn-Murphy, L.; Veiga, J.M.; et al. Toward the integrated marine debris observing system. Front. Mar. Sci. 2019, 6, 447. [Google Scholar] [CrossRef] [Green Version]
- Van Sebille, E.; Wilcox, C.; Lebreton, L.; Maximenko, N.; Hardesty, B.D.; Franeker, J.; Eriksen, M.; Siegel, D.; Galgani, F.; Law, K.L. A global inventory of small floating plastic debris. Environ. Res. Lett. 2015, 10, 124006. [Google Scholar] [CrossRef]
- Lebreton, L.; Slat, B.; Ferrari, F.; Sainte-Rose, B.; Aitken, J.; Marthouse, R.; Hajbane, S.; Cunsolo, S.; Schwarz, A.; Levivier, A.; et al. Evidence that the Great Pacific Garbage Patch is rapidly accumulating plastic. Sci. Rep. 2018, 8, 1–15. [Google Scholar] [CrossRef] [PubMed] [Green Version]
- Rochman, C.M.; Tahir, A.; Williams, S.L.; Baxa, D.V.; Lam, R.; Miller, J.T.; Teh, F.; Werorilangi, S.; The, S.J. Anthropogenic debris in seafood: Plastic debris and fibers from textiles in fish and bivalves sold for human consumption. Sci. Rep. 2015, 5, 14340. [Google Scholar] [CrossRef]
- Taylor, M.L.; Gwinnett, C.; Robinson, L.F.; Woodall, L.C. Plastic microfibre ingestion by deep-sea organisms. Sci. Rep. 2016, 6, 33997. [Google Scholar] [CrossRef] [Green Version]
- Martin, J.; Lusher, A.; Thompson, R.C.; Morley, A. The deposition and accumulation of microplastics in marine sediments and bottom water from the Irish continental shelf. Sci. Rep. 2017, 7, 10772. [Google Scholar] [CrossRef] [Green Version]
- Anderson, Z.T.; Cundy, A.B.; Croudace, I.W.; Warwick, P.E.; Hernandez, O.C.; Stead, J.L. A rapid method for assessing the accumulation of microplastics in the sea surface microlayer (SML) of estuarine systems. Sci. Rep. 2018, 8, 1–11. [Google Scholar] [CrossRef]
- Cozar, A.; Marti, E.; Duarte, C.M.; Lomas, J.G.; Van Sebille, E.; Ballatore, T.J.; Eguiluz, V.M.; Gonzalez-Gordillo, J.I.; Pedrotti, M.L.; Echevarria, F.; et al. The Arctic ocean as a dead end for floating plastics in the North Atlantic branch of the thermoaline circulation. Sci. Adv. 2017, 3, e1600582. [Google Scholar] [CrossRef] [Green Version]
- Willis, K.; Hardesty, B.D.; Kriwoken, L.; Wilcox, C. Differentiating littering, urban runoff and marine transport as sources of marine debris in coastal and estuarine environments. Sci. Rep. 2017, 7, 44479. [Google Scholar] [CrossRef] [Green Version]
- Lebreton, L.C.M.; Van der Zwet, J.; Damsteeg, J.W.; Slat, B.; Andrady, A.; Reisser, J. River plastic emissions to the world’s oceans. Nat. Commun. 2017, 8, 15611. [Google Scholar] [CrossRef] [PubMed]
- Mani, T.; Hauk, A.; Walter, U.; Burkhardt-Holm, P. Microplastics profile along the Rhine river. Sci. Rep. 2015, 5, 1–7. [Google Scholar] [CrossRef] [PubMed]
- Jambeck, J.R.; Geyer, R.; Wilcox, C.; Siegler, T.R.; Perryman, M.; Andrady, A.; Narayan, R.; Law, K.L. Plastic waste inputs from land into the ocean. Science 2015, 347, 768–771. [Google Scholar] [CrossRef] [PubMed]
- Law, K.L.; Moret-Ferguson, S.; Maximenko, N.; Proskurowski, G.; Peacock, E.; Hfner, J.; Reddy, C.M. Plastic accumulation in the north Atlantic subtropical gyre. Science 2010, 329, 1185–1188. [Google Scholar] [CrossRef] [Green Version]
- Zhang, H. Transport of microplastics in coastal areas. Estuar. Coast. Shelf Sci. 2017, 199, 74–86. [Google Scholar] [CrossRef]
- Lusher, A.L.; Tirelli, V.; O’Connor, I.; Officer, R. Microplastics in Arctic polar waters: The first reported values of particle in surface and sub-surface samples. Sci. Rep. 2015, 5, 14947. [Google Scholar] [CrossRef]
- Kataoka, T.; Murray, C.C.; Isobe, A. Quantification of marine macro-debris abundance around Vancouver island, Canada, based on archived aerial photographs processed by projective transformation. Mar. Pollut. Bull. 2017, 132, 44–51. [Google Scholar] [CrossRef]
- Ge, Z.; Shi, H.; Mei, X.; Dai, Z.; Li, D. Semi-automatic recognition of marine debris on beaches. Sci. Rep. 2016, 6, 1–9. [Google Scholar] [CrossRef] [Green Version]
- Acuna-Ruz, T.; Uribe, D.; Taylor, R.; Amezquita, L.; Guzman, M.C.; Merrill, J.; Martinez, P.; Voisin, L.; Mattar, C. Anthropogenic marine debris over beaches: Spectral characterization for remote sensing applications. Remote Sens. Environ. 2018, 217, 309–322. [Google Scholar] [CrossRef]
- Arii, M.; Koiwa, M.; Aoki, Y. Applicability of Sar to marine debris surveillance after the great east Japan earthquake. IEEE J. Sel. Top. Appl. Earth Obs. Remote Sens. 2014, 7, 1729–1744. [Google Scholar] [CrossRef]
- Matthews, J.P.; Ostrovsky, L.; Yoshikawa, Y.; Komori, S.; Tamura, H. Dynamics and early post-tsunami evolution of floating marine debris near Fukushima Daiichi. Nat. Geosci. 2017, 10, 598–605. [Google Scholar] [CrossRef]
- Agustin, A.E.; Merrifield, M.A.; Potemra, J.T.; Morishige, C. Temporal variability of marine debris deposition at Tern island in the Northwestern Hawaiian islands. Mar. Pollut. Bull. 2015, 101, 200–207. [Google Scholar] [CrossRef] [PubMed]
- Pichel, W.G.; Veenstra, T.S.; Churnside, J.H.; Arabini, E.; Friedman, K.S.; Foley, D.G.; Brainard, R.E.; Kiefer, D.; Ogle, S.; Clemente-Colon, P.; et al. GhostNet marine debris survey in the Gulf of Alaska-Satellite guidance and aircraft observations. Mar. Pollut. Bull. 2012, 65, 28–41. [Google Scholar] [CrossRef] [PubMed]
- Atwood, E.; Falcieri, F.M.; Piehl, S.; Bochow, M.; Matthies, M.; Franke, J.; Carniel, S.; Sclavo, M.; Laforsch, C.; Siegert, F. Coastal accumulation of microplastics particles emitted from the Po river, northern Italy: Comparing remote sensing and hydrodynamic modelling with in situ sample collections. Mar. Pollut. Bull. 2019, 138, 561–574. [Google Scholar] [CrossRef] [PubMed]
- Vahellemont, Q.; Ruddick, K. ACOLITE for sentinel-2: Aquatic applications of MSI imagery. In Proceedings of the 2016 ESA Living Planet Symposium, Prague, Czech Republic, 9–13 May 2016; ESA Special Publication SP-740: Noordwijk, The Netherlands, 2016. [Google Scholar]
- Hu, C.; Feng, L.; Hardy, R.; Hochberg, E.J. Spectral and spatial requirements of remote measurements of pelagic Sargassum macroalgae. Remote Sens. Environ. 2015, 167, 229–246. [Google Scholar] [CrossRef]
- Garaba, S.P.; Dierssen, H.M. An airborne remote sensing case study of synthetic hydrocarbon detection using short-wave infrared absorption features identified from marine-harvested macro- and microplastics. Remote Sens. Environ. 2018, 205, 224–235. [Google Scholar] [CrossRef]
- Maximenko, N.; Arvesen, J.; Asner, G.; Carlton, J.; Castrence, M.; Centurioni, L.; Chao, Y.; Chapman, J.; Chirayath, V.; Corradi, P.; et al. Remote Sensing of Marine Debris to Study Dynamics, Balances and Trends. Available online: https://ecocast.arc.nasa.gov/las/Reports%20and%20Papers/Marine-Debris-Workshop-2017.pdf (accessed on 24 April 2020).
- Biermann, L.; Clewley, D.; Martinez-Vicente, V.; Topouzelis, K. Finding plastic patches in coastal waters using optical satellite data. Sci. Rep. 2020, 10, 1–10. [Google Scholar] [CrossRef]
- Martinez-Vicente, V.; Clark, J.R.; Corradi, P.; Aliani, S.; Arias, M.; Bochow, M.; Bonnery, G.; Cole, M.; Cozar, A.; Donnelly, R.; et al. Measuring marine plastic debris from space: Initial assessment of observation requirements. Remote Sens. 2019, 11, 2243. [Google Scholar] [CrossRef] [Green Version]
- Lechner, A.; Keckeis, H.; Lumesberger-Loisl, F.; Zens, B.; Krusch, R.; Tritthart, M.; Glas, M.; Schludermann, E. The Danube so colourful: A potpourri of plastic litter outnumbers fish larvae in Europe’s second largest river. Environ. Pollut. 2014, 18, 177–181. [Google Scholar] [CrossRef] [Green Version]
- Ocean Conservancy. Trash Travels. From Our Hands to the Sea, Around the Globe and Through Time. Available online: https://oceanconservancy.org/wp-content/uploads/2017/04/2010-Ocean-Conservancy-ICC-Report.pdf (accessed on 18 January 2020).
- Wang, M.; Hu, C. Predicting Sargassum blooms in the Caribbean Sea from MODIS observations. Geophys. Res. Lett. 2017, 44, 3265–3273. [Google Scholar] [CrossRef]
- Wang, M.; Hu, C.; Barnes, B.B.; Mitchum, G.; Lapointe, B.; Montoya, J.P. The great Atlantic Sargassum belt. Science 2019, 365, 83–87. [Google Scholar] [CrossRef] [PubMed]
- Scmitt, D.; Gischler, E. Recent sedimentary facies of Roatan (Bay Islands, Honduras), a Caribbean oceanic barrier reef system. Facies 2016, 63, 5. [Google Scholar] [CrossRef]
- Kataoka, T.; Nihei, Y.; Kudou, K.; Hinata, H. Assessment of the sources and inflow processes of microplastics in the river environments of Japan. Environ. Pollut. 2019, 244, 958–965. [Google Scholar] [CrossRef] [PubMed]
- Simon-Sanchez, L.; Grelaud, M.; Garcia-Orellana, J.; Ziveri, P. River deltas as hotspots of microplastic accumulation: The case study of the Ebro river (NW Mediterranean). Sci. Total Environ. 2019, 687, 1186–1196. [Google Scholar] [CrossRef]
- Carillo, L.; Johns, E.M.; Smith, R.H.; Lamkin, J.T.; Largier, J.L. Pathways and hydrography in Mesoamaerican barrier reef system part 1: Circulation. Cont. Shelf Res. 2015, 109, 164–176. [Google Scholar] [CrossRef]
- Cherubin, L.M.; Kuchinke, C.P.; Paris, C.B. Ocean circulation and terrestrial runoff dynamics in the Mesoamerican region from spectral optimization of SeaWIFS data and a high resolution simulation. Coral Reefs 2008, 27, 503–519. [Google Scholar] [CrossRef]
- Sheng, J.; Wang, L.; Andrefouet, S.; Hu, C.; Hatcher, B.G.; Muller-Karger, F.E.; Kjerfve, B.; Heyman, W.D.; Yang, B. Upper ocean response of the Mesoamerican Barrier Reef System to Hurricane Mitch and coastal freshwater inputs: A study using Sea-viewing Wide Field-of-view Sensor SeaWIFS ocean color data and a nested-grid ocean circulation model. J. Geophys. Res. 2007, 112, C07016. [Google Scholar] [CrossRef] [Green Version]
- Tang, L.; Sheng, J.; Hatcher, B.; Sale, P. Numerical study of circulation, dispersion, and hydrodynamic connectivity of surface waters on the Belize shelf. J. Geophys. Res. 2006, 111, C01003. [Google Scholar] [CrossRef] [Green Version]
- Potemra, J.T. Numerical modeling with application to tracking marine debris. Mar. Pollut. Bull. 2012, 65, 42–50. [Google Scholar] [CrossRef]
- Mehrtens, C.J.; Rosenheim, B.; Modley, M.; Young, R.S. Reef morphology and sediment attributes Roatan, Bay islands, Honduras. Carbonates Evaporites 2001, 16, 131–140. [Google Scholar] [CrossRef]
- Lebreton, L.C.M.; Greer, S.D.; Borrero, J.C. Numerical modelling of floating debris in the world’s oceans. Mar. Pollut. Bull. 2012, 64, 653–661. [Google Scholar] [CrossRef]
- Goldstein, M.C.; Titmus, A.J.; Ford, M. Scales of spatial heterogeneity of plastic marine debris in the northeast Pacific Ocean. PLoS ONE 2013, 8, e80020. [Google Scholar] [CrossRef] [PubMed]
- Van Sebille, E.; Aliani, S.; Law, K.L.; Maximenko, N.; Alsina, J.M.; Bagaev, A.; Bergmann, M.; Chapron, B.; Chubarenko, I.; Cozar, A.; et al. The physical oceanography of the transport of floating marine debris. Environ. Res. Lett. 2020, 15, 023003. [Google Scholar] [CrossRef] [Green Version]
- Suaria, G.; Avio, C.G.; Mineo, A.; Lattin, G.L.; Magaldi, M.G.; Belmonte, G.; Moore, C.J.; Regoli, F.; Aliani, S. The Mediterranean plastic soup: Synthetic polymers in Mediterranean surface waters. Sci. Rep. 2016, 6, 37551. [Google Scholar] [CrossRef] [PubMed]
- Aparcana, S. Approaches to formalization of the informal waste sector into municipal solid waste management systems in low-and middle-income countries: Review of barriers and success factors. Waste Manag. 2017, 61, 593–607. [Google Scholar] [CrossRef] [PubMed] [Green Version]
- Espinoza, P.; Arce, E.; Daza, D.; Faure, M.; Terraza, H. Regional Evaluation of Municipal Solid Waste Management in Latin America and the Caribbean: Report PAHO. Available online: https://pdfs.semanticscholar.org/e546/4faa1903ac5bf8f8cefb6a08c48a301fbd7a.pdf?_ga=2.167873441.186345926.1579257859-1633955027.1542015028 (accessed on 15 January 2020).
- Hettiarachchi, H.; Ryu, S.; Caucci, S.; Silva, R. Municipal solid waste management in Latin America and the Caribbean: Issues and potential solutions form the governance perspective. Recycling 2018, 3, 19. [Google Scholar] [CrossRef] [Green Version]
- Lu, M.; Chernaik, M.; Weiskel, H. Ocean Waste in the Gulf of Honduras. Available online: https://elaw.org/sites/default/files/reports/ELAW_Solid_Waste_and_Transport_Report.pdf (accessed on 15 January 2020).
- Van Sebille, E.; England, M.H.; Froyland, G. Origin, dynamics and evolution of ocean garbage patches from observed surface drifters. Environ. Res. Lett. 2012, 7, 044040. [Google Scholar] [CrossRef]
- Alizadeh, M.J.; Kavianpour, M.R.; Adolf, M.D.J.; Shamshirband, S.; Chau, K.W. Effect of river flow on the quality of estuarine and coastal waters using machine learning models. Eng. Appl. Comput. Fluid Mech. 2018, 12, 810–823. [Google Scholar] [CrossRef] [Green Version]
- Shamshirband, S.; Nodoushan, E.J.; Adolf, J.E.; Manaf, A.A.; Mosavi, A.; Chau, K.W. Ensemble models with uncertainty analysis for multi-day ahead forecasting of chlorophyll a concentration in coastal waters. Eng. Appl. Comput. Fluid Mech. 2019, 13, 91–101. [Google Scholar] [CrossRef] [Green Version]
- Geyer, R.; Jambeck, J.R.; Law, K.R. Production, use and fate of all plastics ever made. Sci. Adv. 2017, 3, e1700782. [Google Scholar] [CrossRef] [Green Version]
- Wu, H.H. A study of transnational regulatory governance for marine plastic debris: Trends, challenges, and prospect. Mar. Policy 2020. In press Corrected proof. [Google Scholar] [CrossRef]
- Kandziora, J.H.; Van Toulon, N.; Sobral, P.; Taylor, H.L.; Ribbink, A.J.; Jambeck, J.R.; Werner, S. The important role of marine debris networks to prevent and reduce ocean plastic pollution. Mar. Pollut. Bull. 2019, 141, 657–662. [Google Scholar] [CrossRef] [PubMed]
- Raubenheimer, K.; McIlgorm, A. Can the Basel and Stockhom conventions provide a global framework to reduce the impact of marine plastic litter? Mar. Policy 2018, 96, 285–290. [Google Scholar] [CrossRef] [Green Version]
Figure 1.
The systematically recorded, from the multispectral remote sensing data, spectral signatures of plastic debris, dense Sargassum and seawater along with their standard deviation (n = 1600). (a) Spectral signatures of plastic debris (red), dense Sargassum (green) and water (blue). (b) An indicative Planet image with dense Sargassum. (c) Indicative Planet image with plastic debris.

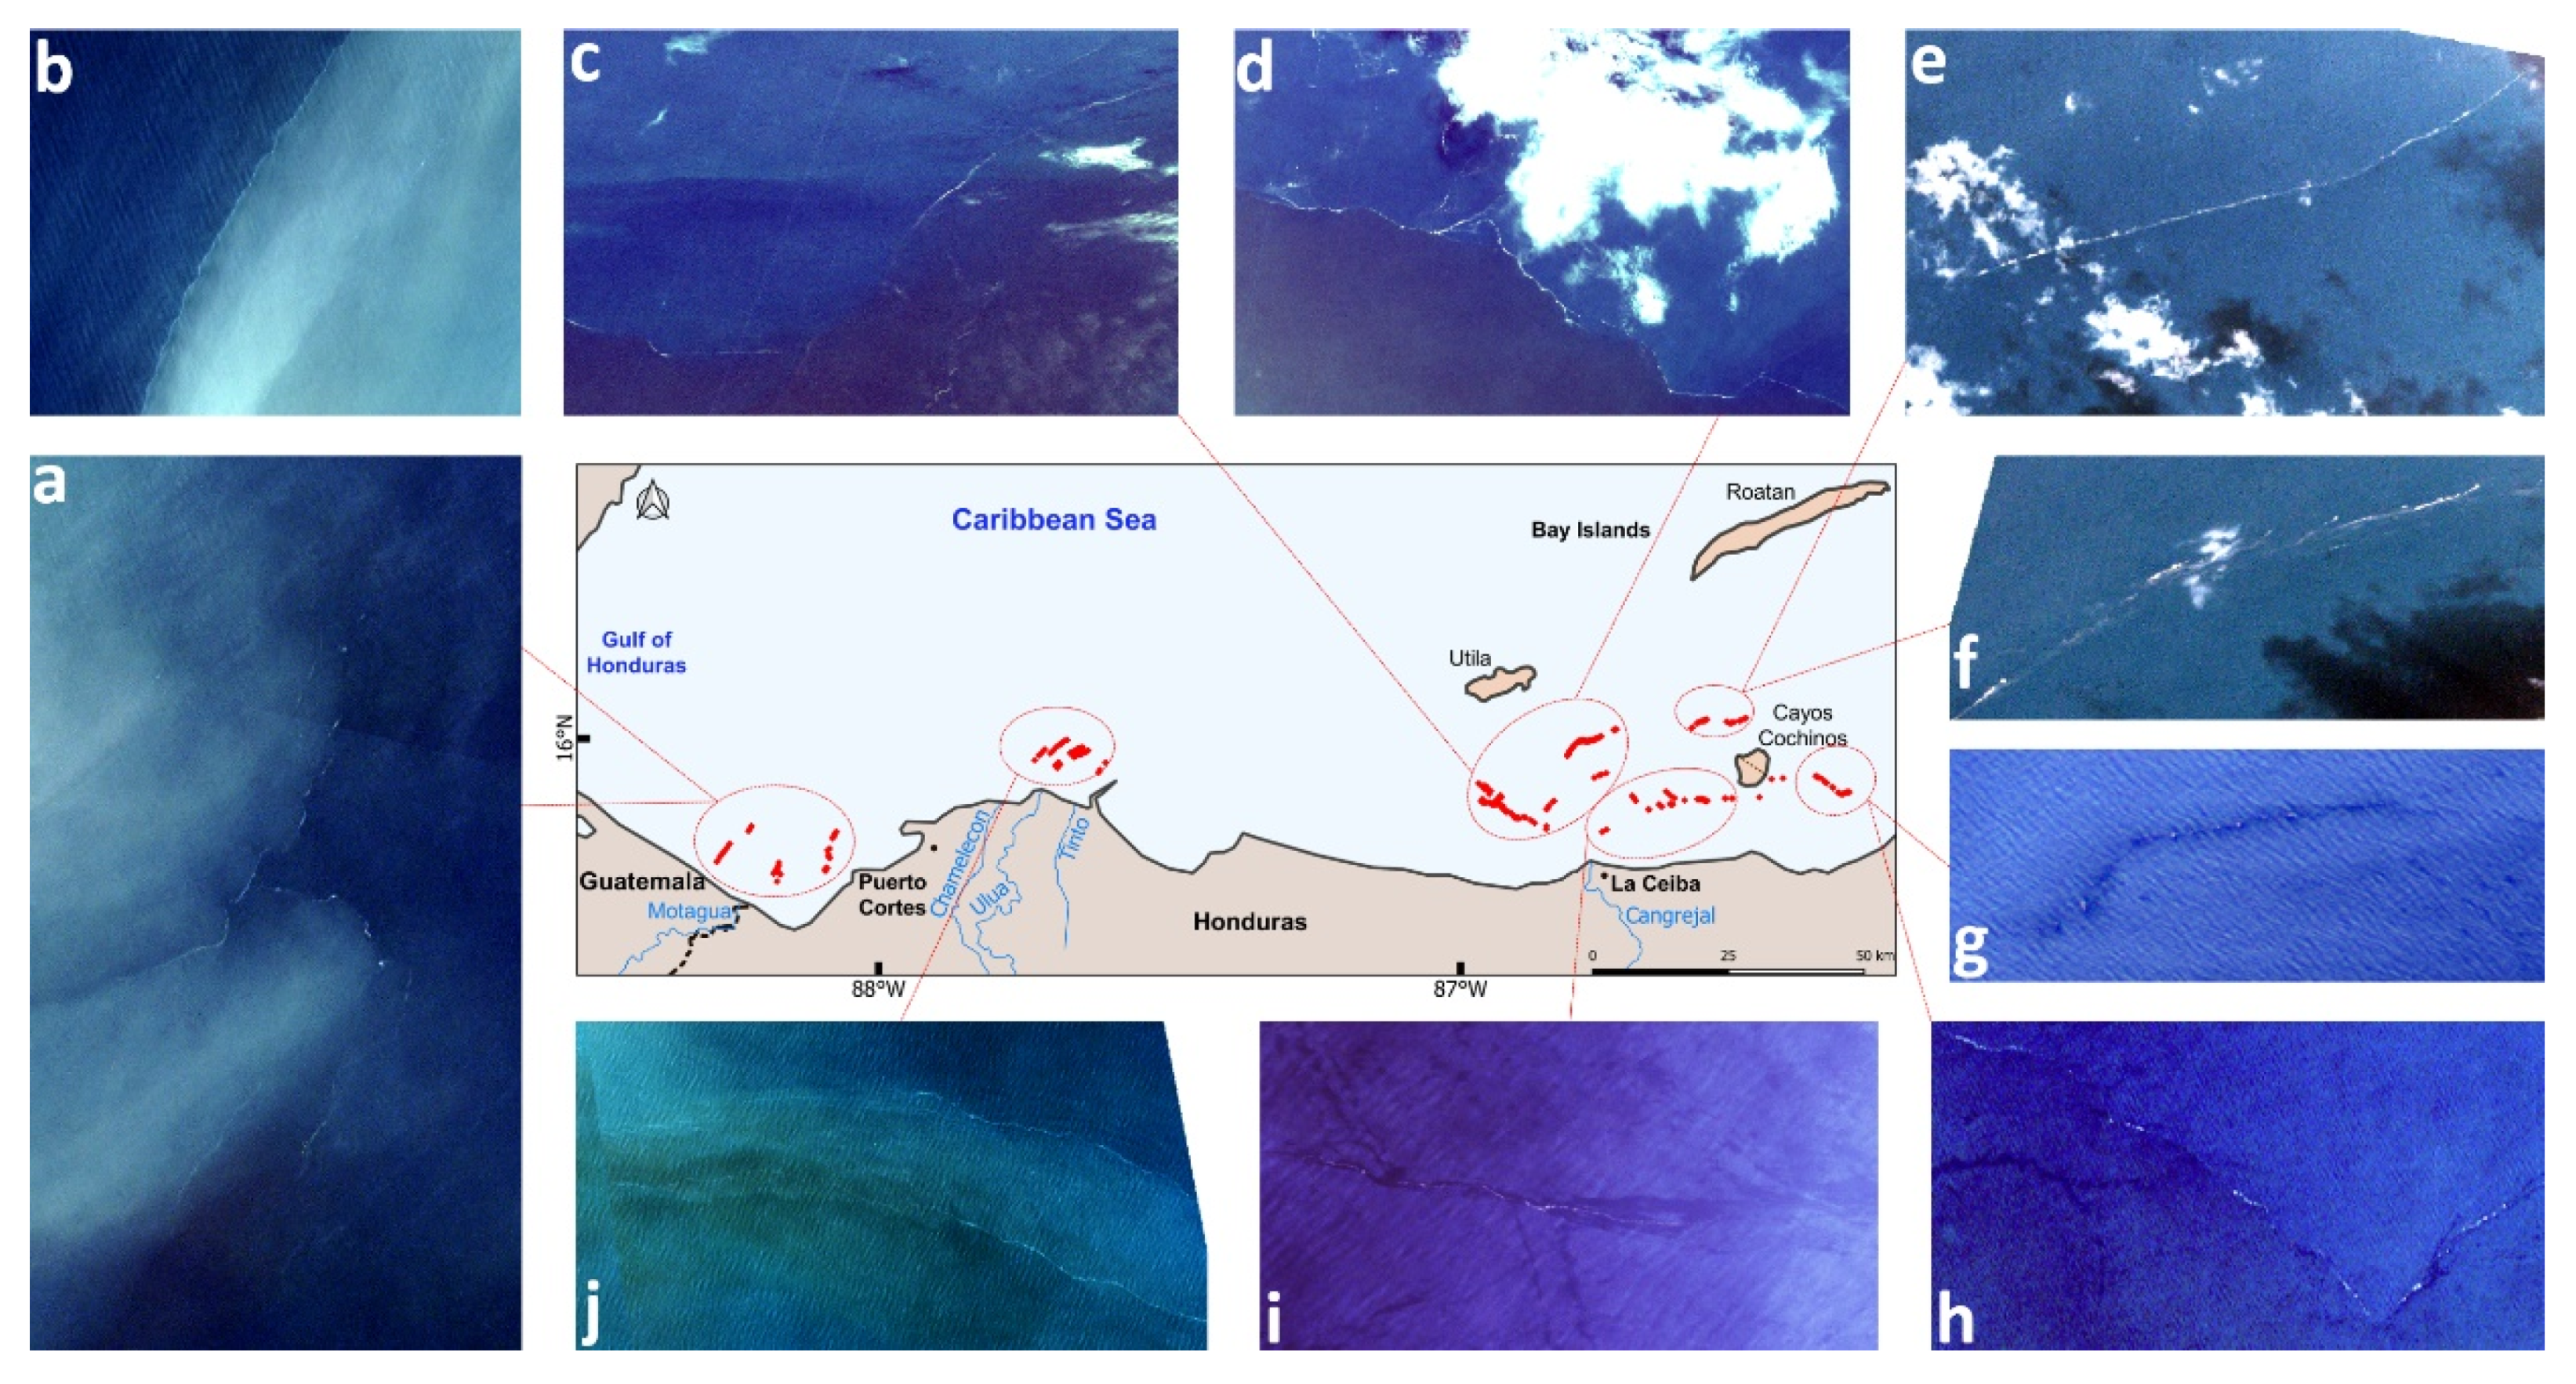
Figure 2.
The detected plastic debris (red dots in the map) and snapshots of the corresponding satellite images at the Gulf of Honduras and Bay Islands during late September–October 2017. (a,b) Planet images with the detected plastic debris from the Motagua River on 27/9/2017. (c,d) The location of the detected debris on 15/10/2017. (e,f) Two days afterwards (17/10/2017), debris reached Cayos Cochinos island. (g) Debris trails were detected (9/10/2017) on a Sentinel-2 image. (h) Same as (g) but on a Planet image. (i) Debris detected on 7/10/2017 indicating that River Cangrejal also contributes to plastic pollution. (j) Planet data (27/9/2017) with the detected plastics originating from the Chamelecon, Ulua and Tinto rivers.

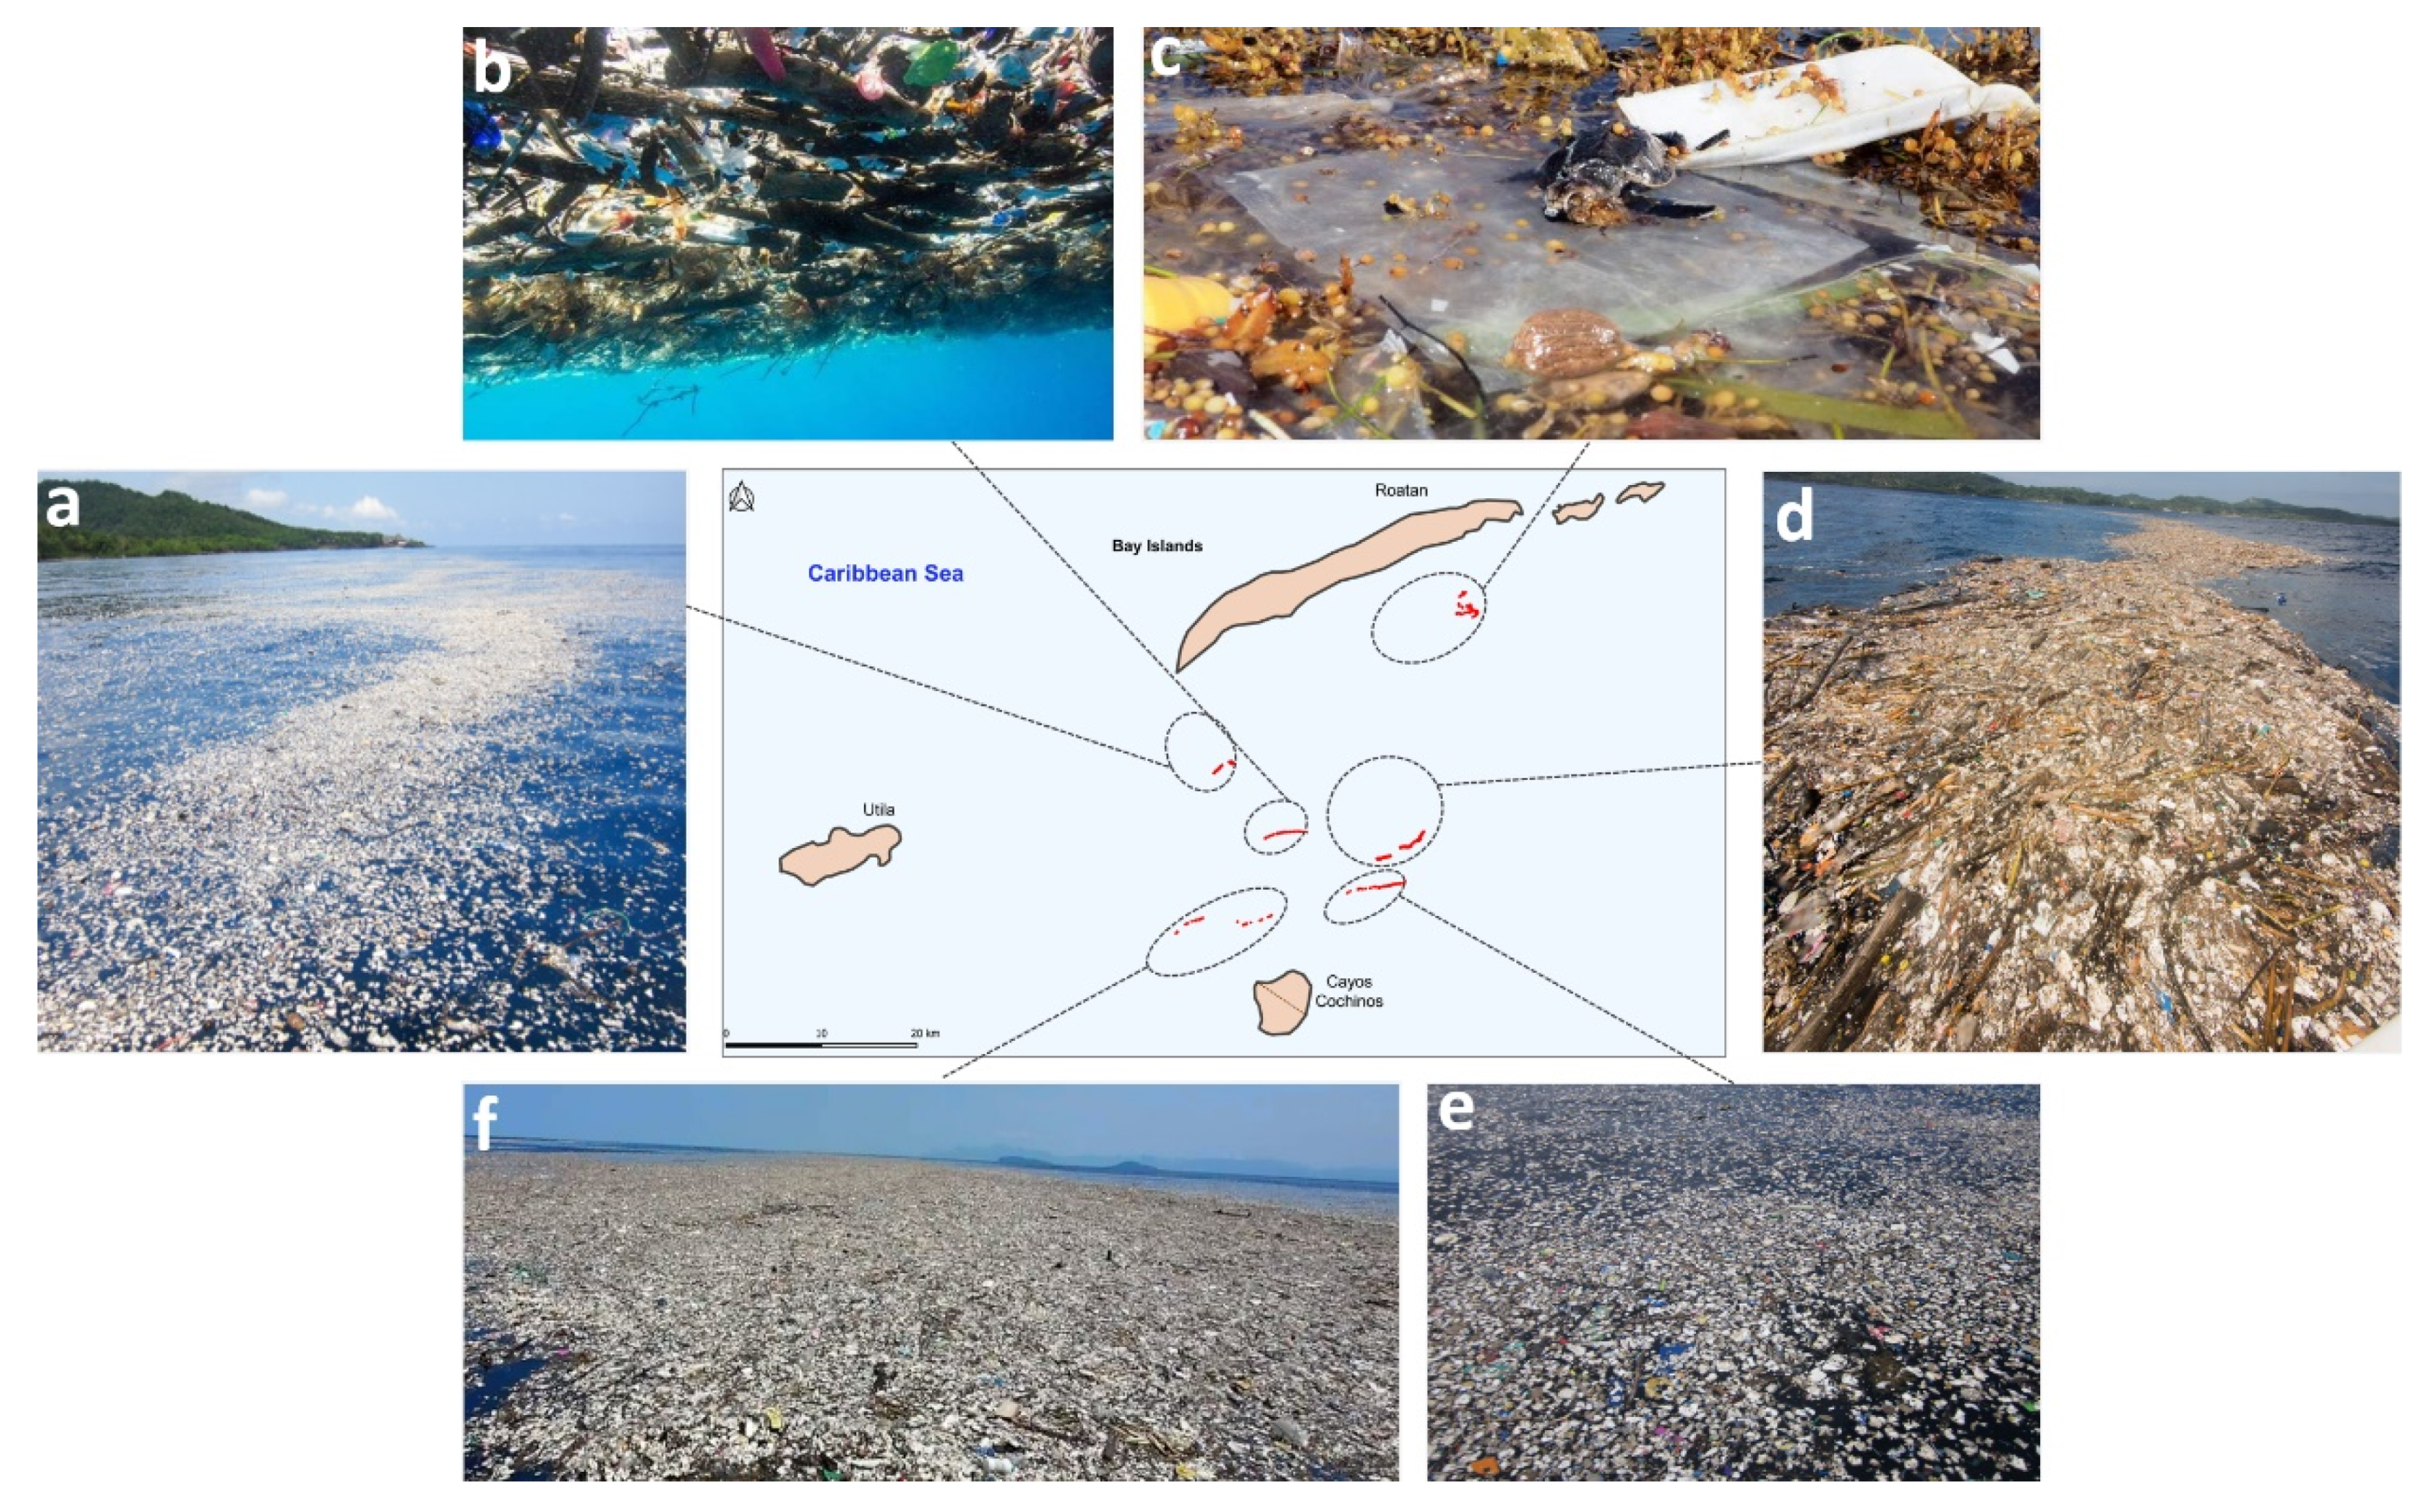
Figure 3.
Detected plastic debris in satellite data (red dots in the map) and the corresponding in situ verification during the years of 2014–2018 around Bay Islands. (a) Collected in situ data southwest of Roatan island in September 2014. (b) In situ observations and underwater capture in November 2016. (c) Collected plastics in Roatan area. Sargassum macroalgae and a dead juvenile turtle were also recorded (October 2018). (d) Observed plastics during October 2016. Organic material (i.e., wood) was also recorded. (e) Observed plastic masses during November 2015. (f) Large plastic masses recorded in October 2017. Caroline Power acquired the photos of this figure.

Figure 4.
Total satellite-detected marine plastic debris from 2014 to 2019 in the southeast Gulf of Honduras and Bay Islands in the Caribbean Sea (red dots in the map). Plastics debris enters Caribbean Sea through river discharges. Plastic debris travels long distances dispersed in the entire study area.

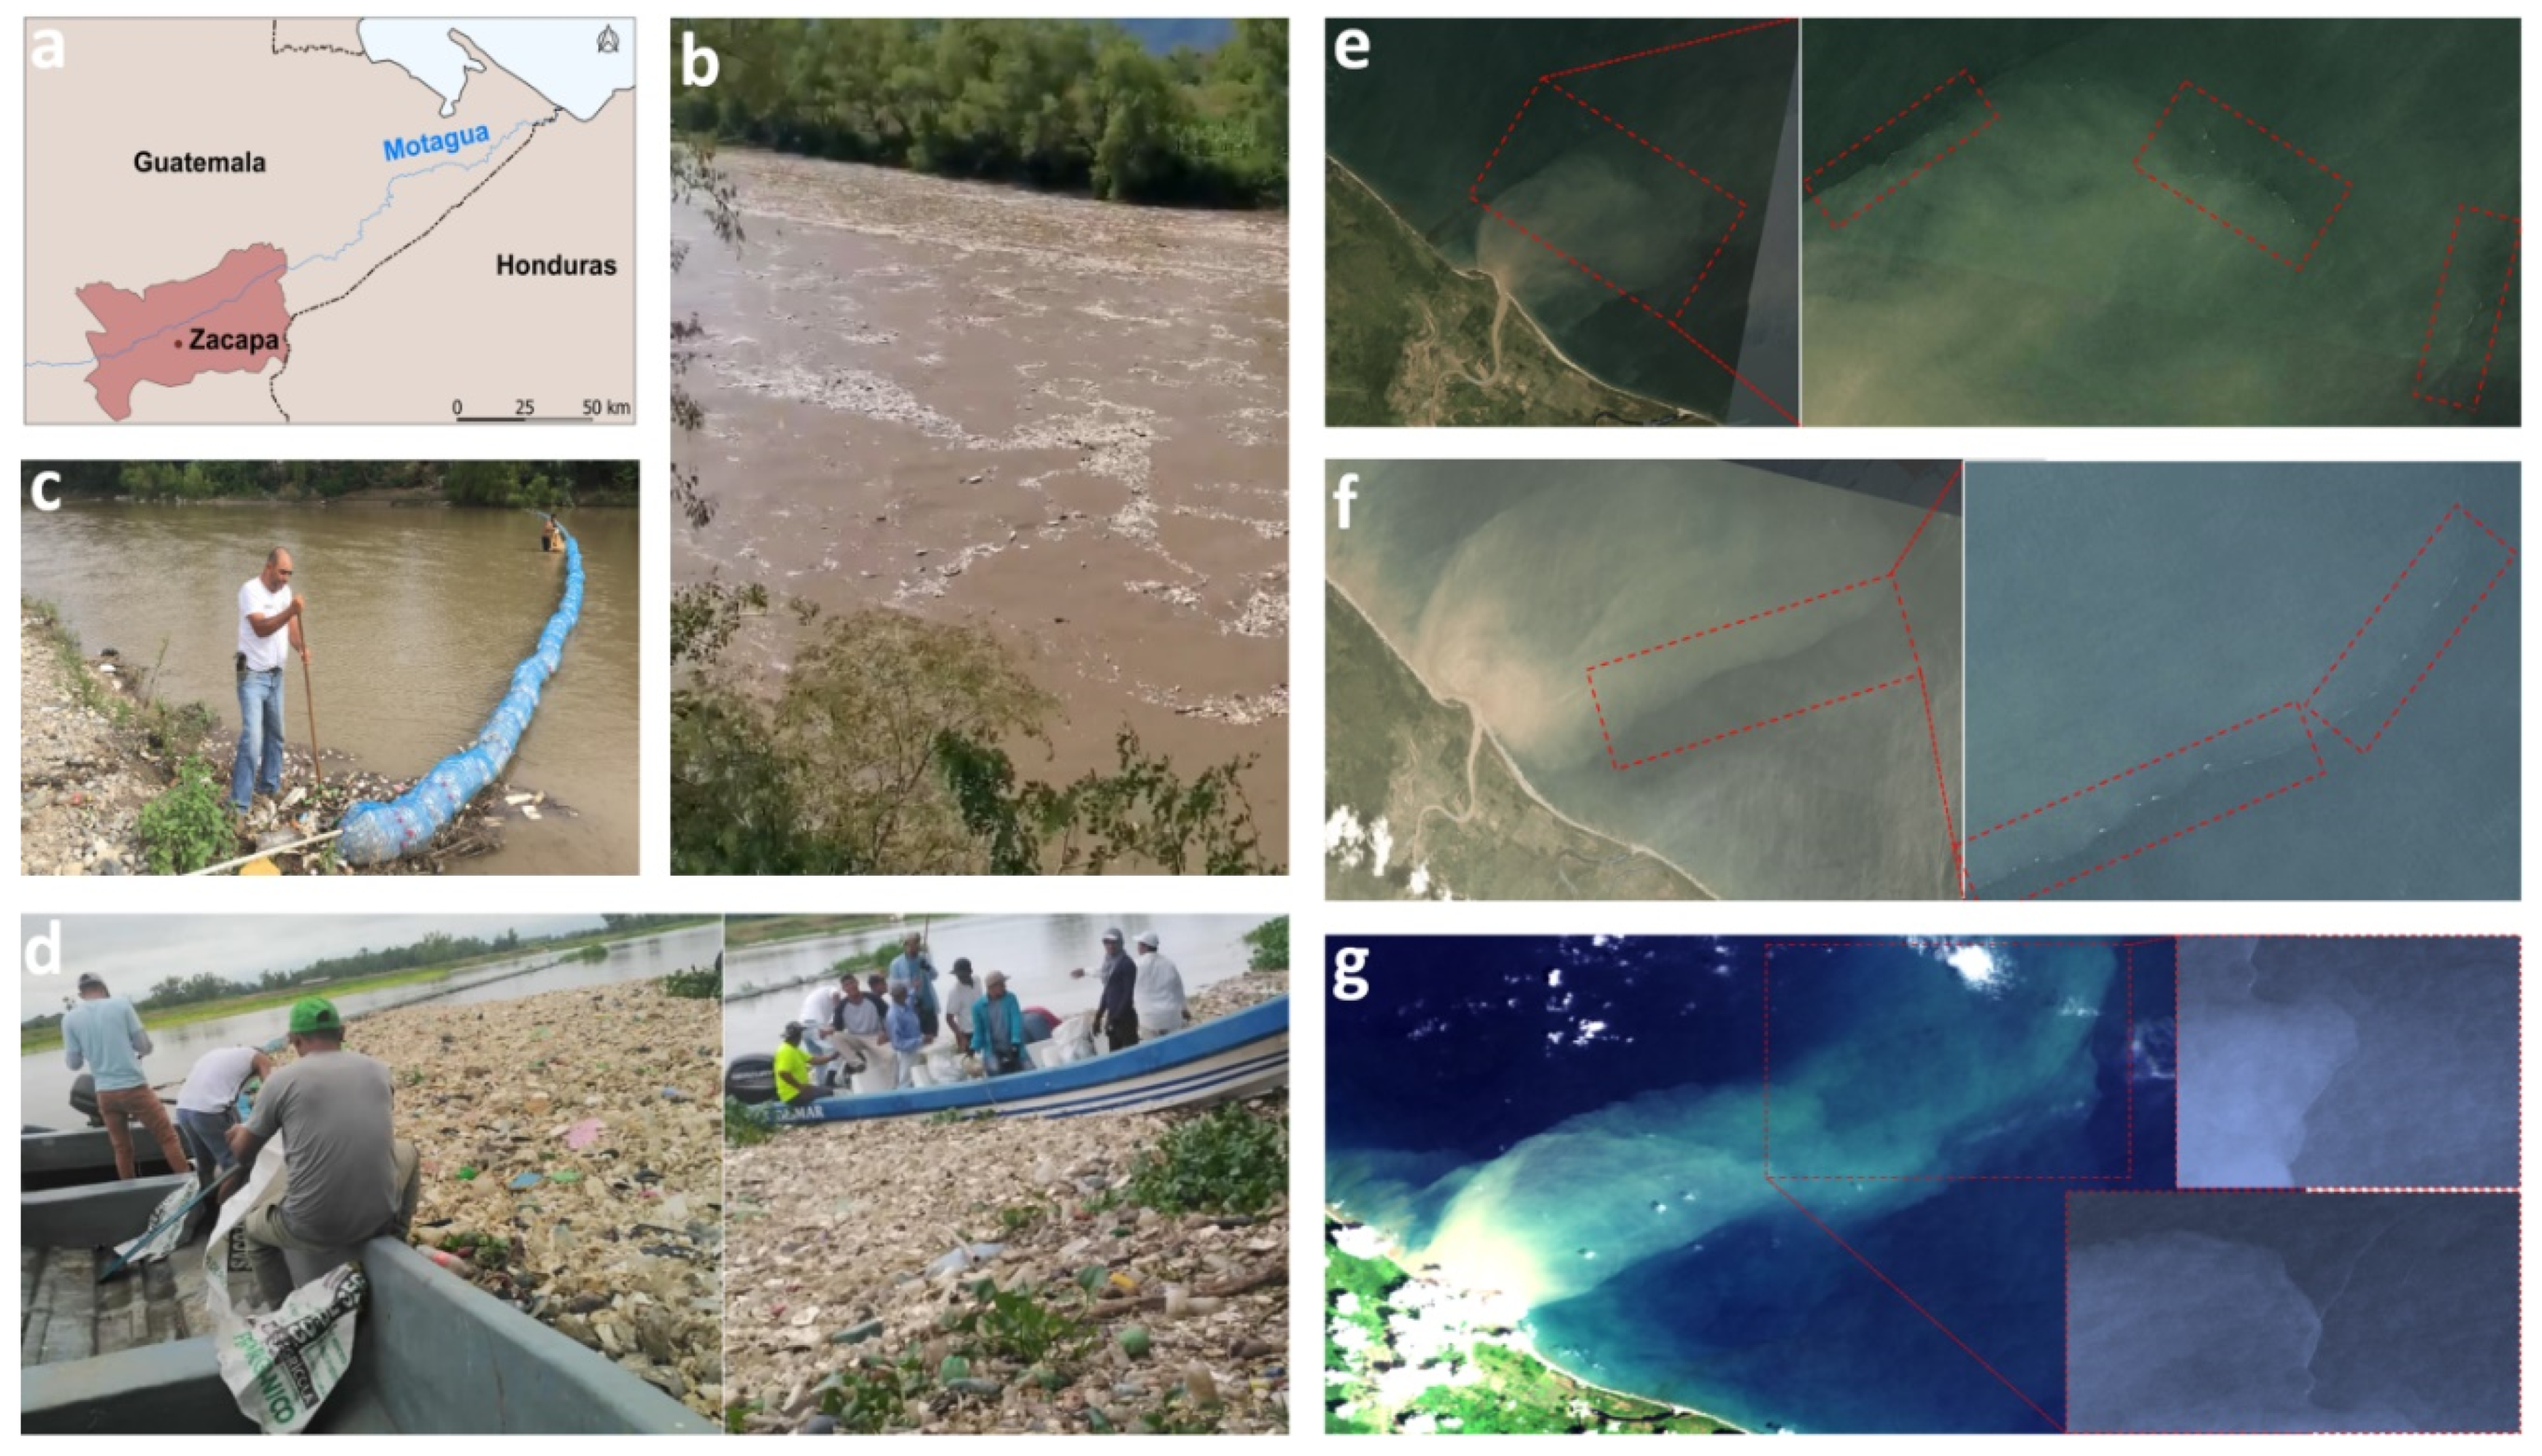
Figure 5.
Detected floating plastic debris along the Motagua River in the Zacapa province of Guatemala and the corresponding discharges detected in satellite data during late August/ September 2019. (a) Location of Zacapa city. (b) Recorded plastic debris along the Motagua River. (c,d) Plastics partially collected by booms, which managed to collect only a small amount of debris, since they were rapidly overwhelmed and debris overpassed them. (e) Detected plastic discharges at the Motagua River mouth on a Planet image (3/9/2018). (f) Same as (e) but on 6 September 2018. (g) Detected plastic debris in Motagua River mouth on Landsat-8 data (18/9/2018). Julio R Guzman Perdomo acquired the photos (b), (c) and (d) of this figure.

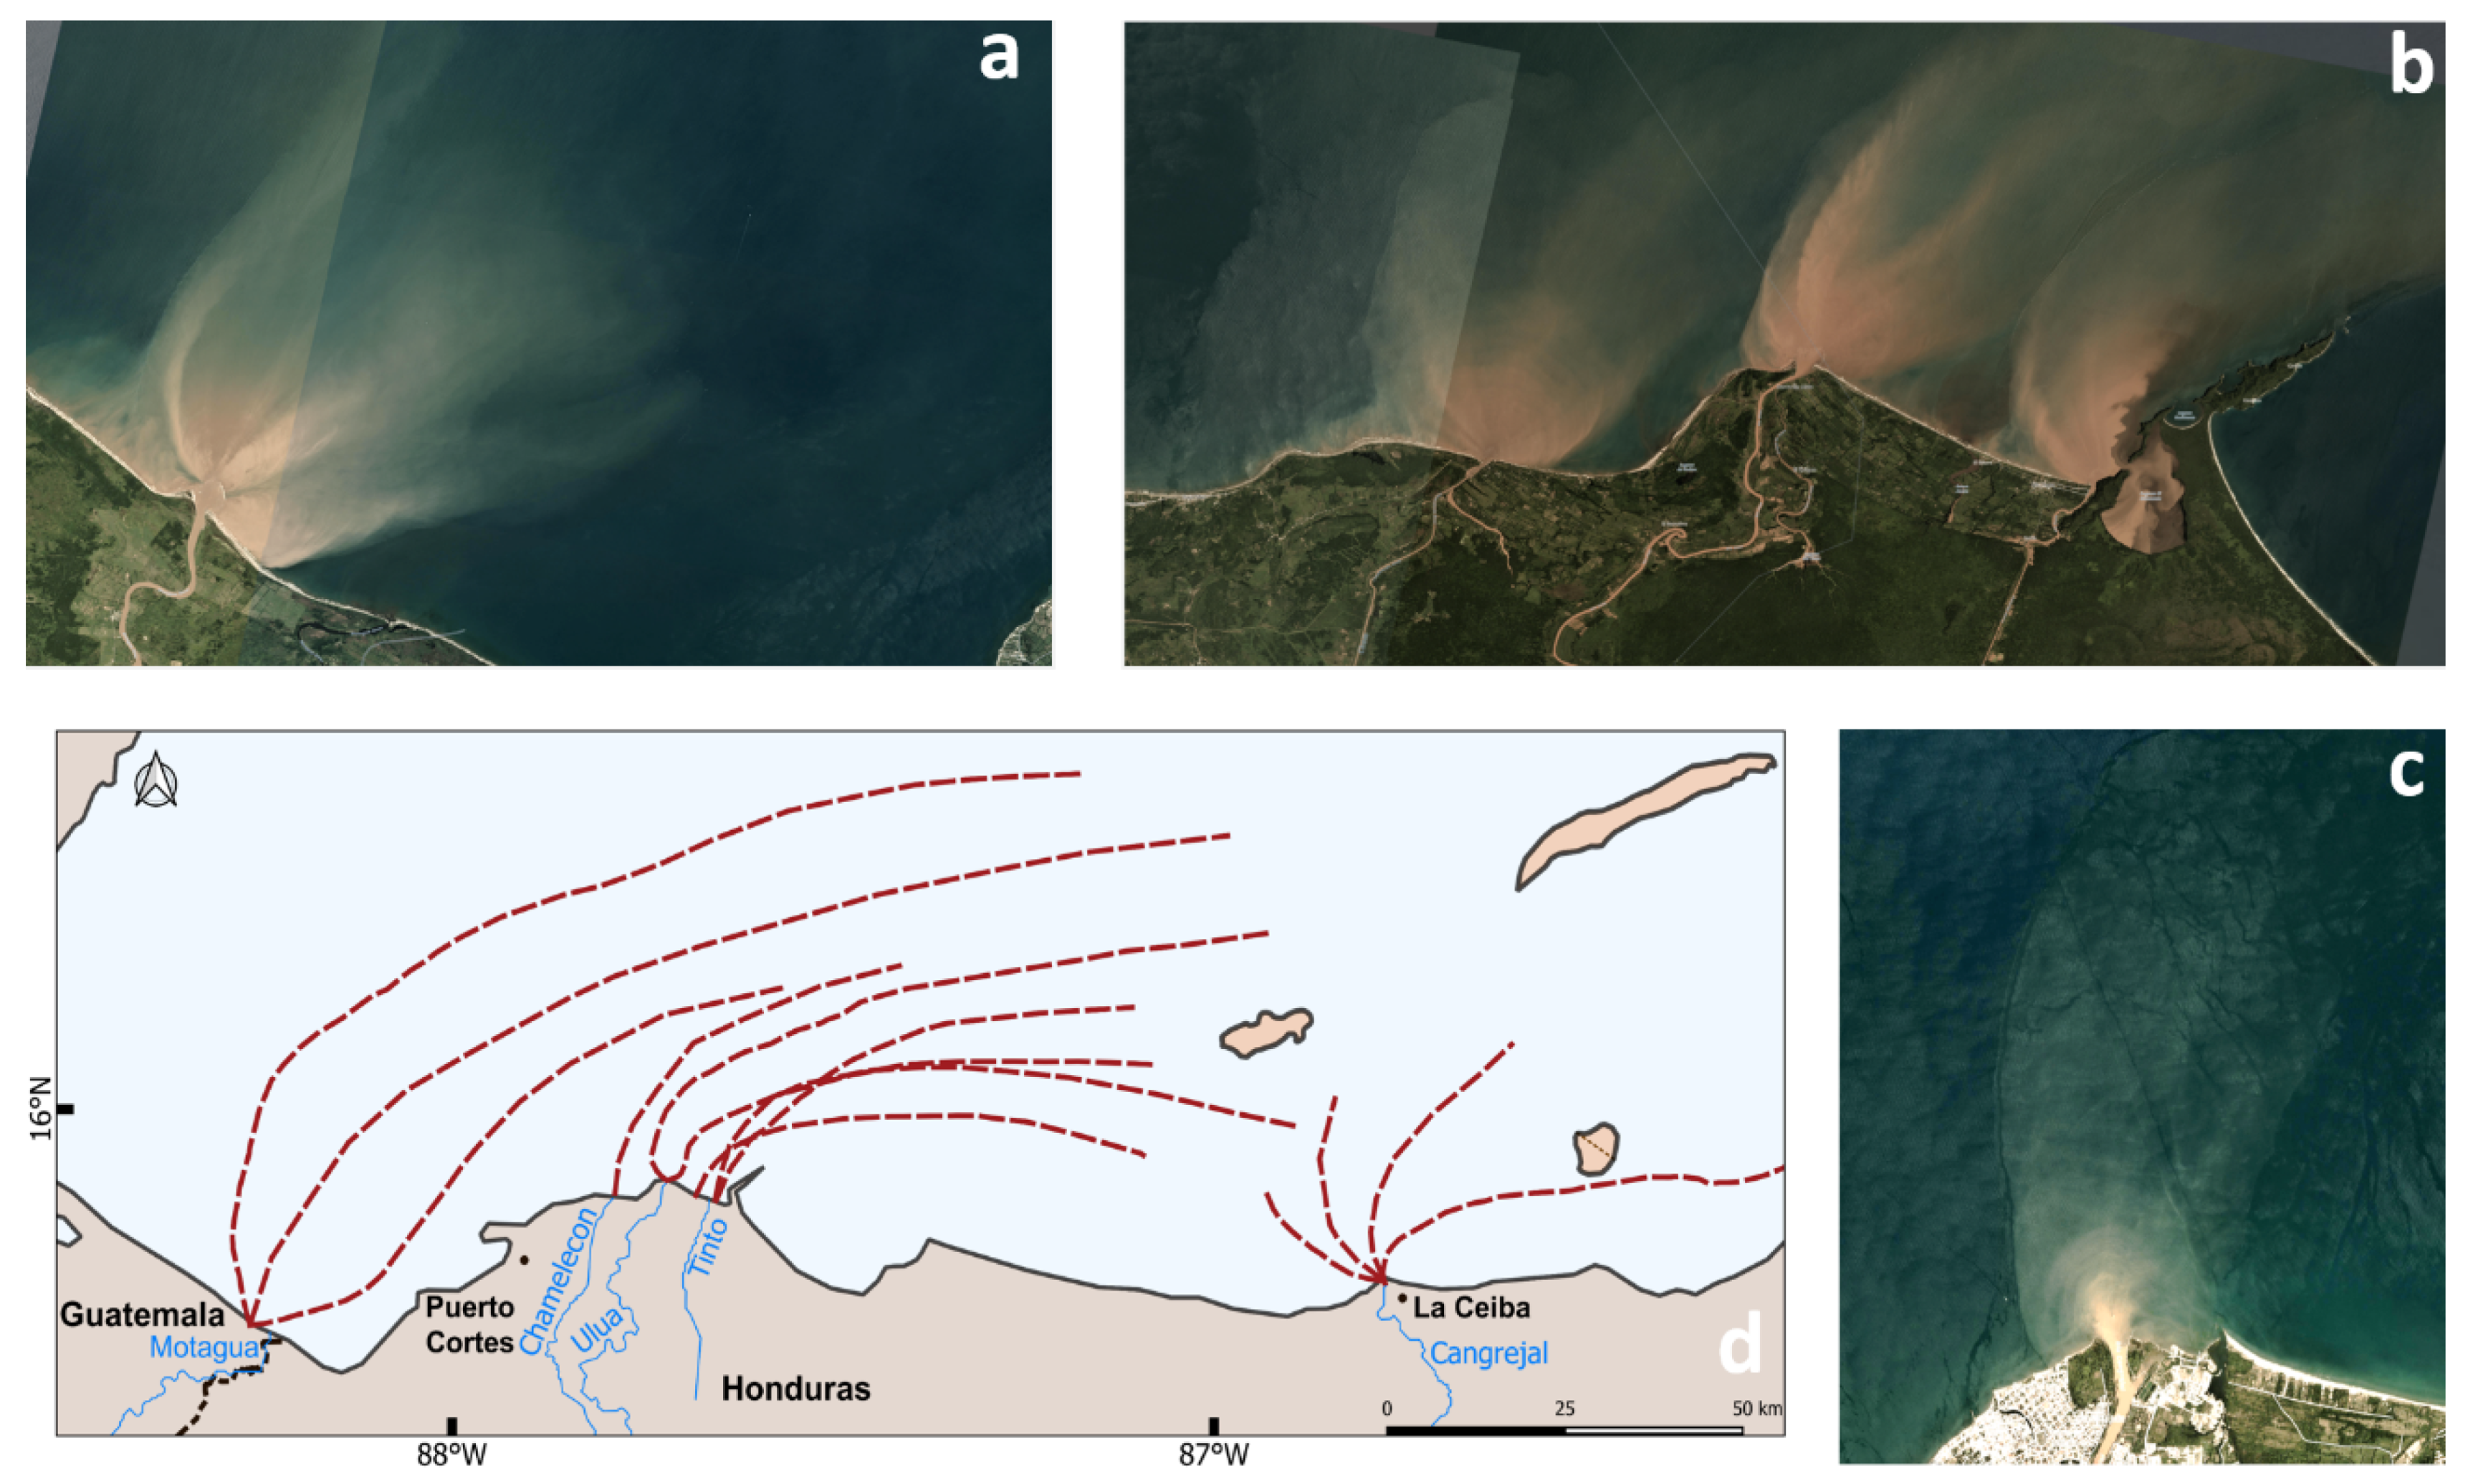
Figure 6.
Plastic debris source, corresponding river discharges and estimated debris trajectories based on multitemporal satellite detections in the Bay Islands and Gulf of Honduras. (a) Motagua River discharges as recorded during the 27th of September 2017. (b) Detected discharges of Chamelecon, Ulua and Tinto rivers on the 27th of September 2017. (c) Detected Cangrejal River discharge on the 20th of September 2017. (d) Estimated litter travelling trajectories (red dashed lines) based on the multitemporal detections. Plastic pathways followed, in general, a SW–NE direction similar to currents direction acquired from Copernicus Marine Environment Monitoring Service (CMEMS).


Table 1.
The detected 20 plastic debris events for the years 2014 to 2019 based on satellite and in situ data.
Table 1.
The detected 20 plastic debris events for the years 2014 to 2019 based on satellite and in situ data.
| Detected Events (Date) | Satellite Data & Acquisition Dates (day/month), * Clouds >25% | Validation | ||
|---|---|---|---|---|
| Landsat-8 (L8) | Sentinel-2 (S2) | Planet (P) | ||
| September 2014 | 20/9, 29/9 | - | - | in situ (30/9) |
| November 2015 | 3/11, 10/11 | 29/11 | 24/11 | in situ (29/11) |
| January 2016 | 22/1 | 15/1 | 26/1 | photo-interpretation |
| February 2016 | 23/2 | 14/2* | 16/2 | photo-interpretation |
| September 2016 | 25/9 * | 4/9, 11/9, 24/9 | 29/9 | photo-interpretation |
| October 2016 | 4/10, 20/10 | 14/10 | 28/9, 8/10 | in situ (22/10) |
| November 2016 | 5/11 * | 3/11 | 9/11* | in situ (3/11) |
| January 2017 | 15/1 * | 12/1, 25/1, 31/1 | 29/1 | photo-interpretation |
| February 2017 | 25/2 | 21/2 | 14/2, 27/2 | photo-interpretation |
| March 2017 | 13/3 | 23/3 | 6/3, 22/3, 26/3 | photo-interpretation |
| August 2017 | 20/8 * | 10/8, 15/8, 30/8 | 25/8, 26/8 | photo-interpretation |
| October 2017 | 21/9, 28/9 | 11/10, 14/10, 9/10 | 27/9, 7–8/10, 15–17/10 | in situ (17/10) |
| January 2018 | 11/1 | 22/1, 24/1 | 7/1, 8/1 | photo-interpretation |
| February 2018 | 12/2 * | 16/2, 26/2 | 11/2, 24/2, 25/2 | in situ (8/2) |
| March 2018 | 16/3 | 8/3, 18/3 | 13/3, 17/3 | in situ (8/3) |
| September 2018 | 15/9, 24/9 | 14,9 19/9 | 13/9, 19/9 | photo-interpretation |
| October 2018 | 26/10, 17/10 | 14/10, 24/10, 29/10 | 21-22/10 | in situ (19/10) |
| November 2018 | 27/11 | 13/11, 23/11, 28/11 | 24/11 | photo-interpretation |
| December 2018 | 20/12 | 13/12, 28/12 | 14/12, 19–22/12, 25/12 | photo-interpretation |
| September 2019 | 18/9 | 4/9, 9/9 | 3/9, 6/9 | in situ (28/8) |
Table 2.
The detected 20 plastic debris events in Bay Islands for the years 2014 to 2019. The detected area, weight, sources, travelling trajectories, wind and currents conditions are also presented for each event.
Table 2.
The detected 20 plastic debris events in Bay Islands for the years 2014 to 2019. The detected area, weight, sources, travelling trajectories, wind and currents conditions are also presented for each event.
| YEAR | MONTH | Detected Source/ River Discharges | Detected Area Km2 | Estimated Weight (Actual) tonnes | Detected Debris Direction | Travel Distance days/Km | Estimated Speed m/s | Wind Direction | Wind Speed m/s | Currents Direction | Currents Velocity m/s |
|---|---|---|---|---|---|---|---|---|---|---|---|
| 2014 | September | Ulua, Motagua | 0.026 | 130 | SE–NW | 1d/7km | 0.08 | ESE | 1.3 | SE–NW | 0.09 |
| 2015 | November | Cangrejal, Motagua | 0.028 | 140 | NE–SW | 5d/11km | 0.02 | ENE | 4.9 | SW–NE | 0.06 |
| 2016 | January | Limon, Motagua, Chamelecon, Aguan | 0.052 | 260 | SW–NE | 4d/50km | 0.14 | NNW | 5.2 | SW–NE | 0.22 |
| February | Chapagua, Tinto, Ulua, Aguan | 0.019 | 95 | SE–NW | 7d/82km | 0.14 | ENE | 5.6 | SE–NW | 0.26 | |
| September | Motagua, Lean, Chamelecon, Sico | 0.047 | 235 | SW–NE | 5d/15km | 0.04 | E | 5 | SW–NE | 0.06 | |
| October | Aguan, Cangrejal, Ulua, Tinto, Balfate | 0.055 | 275 | SW–NE | 12d/65km | 0.06 | NE | 2.5 | SW–NE | 0.07 | |
| November | Motagua, Cuero, San Juan | 0.061 | 305 | – | - | - | NE | 5 | SW–NE | 0.1 | |
| 2017 | January | Ulua, Tinto, Lean, Motagua, Cuero | 0.112 | 560 | – | - | - | E | 5.3 | E–W | 0.12 |
| February | Motagua | 0.026 | 130 | – | - | - | SE | 4.4 | SW–NE | 0.08 | |
| March | Aguan, Sico, Limon | 0.085 | 425 | SE–NW | 7d/38km | 0.06 | ENE | 5.9 | SE–NW | 0.12 | |
| August | Ulua, Tinto, Cuero, Motagua | 0.131 | 655 | SW–NE | 11d/105km | 0.11 | E | 4.1 | SW–NE | 0.13 | |
| October | Motagua, Ulua, Tinto, Cangrejal, Chamelecon | 0.14 | 700 | SW–NE | 2d/8km | 0.04 | ESE | 3 | SW–NE | 0.1 | |
| 2018 | January | Motagua, Ulua, Aguan, Sico | 0.133 | 665 | SW–NE | 4d/15km | 0.04 | NNW | 3.8 | SW–NE | 0.1 |
| February | Motagua, Ulua, Tinto, Aguan | 0.035 | 175 | – | - | - | E | 6.3 | SE–NW | 0.15 | |
| March | Lean, Ulua, Cangrejal | 0.024 | 120 | – | - | - | E | 5.3 | SE–NW | 0.14 | |
| September | Motagua, Ulua, Tinto, Chamelecon, Cangrejal | 0.138 | 690 | SW–NE | 5d/21km | 0.05 | E | 5.6 | SW–NE | 0.06 | |
| October | Motagua, Ulua, Tinto, Chamelecon, Lean, Cuero, Cangrejal | 0.154 | 770 | SW–NE | 6d/38km | 0.07 | ENE | 2.7 | SW–NE | 0.08 | |
| November | Aguan, Motagua, Lean | 0.135 | 675 | SE–NW | 1d/9km | 0.1 | ENE | 3.6 | SE–NW | 0.12 | |
| December | Cangrejal, Cuero, Motagua, Aguan, Tinto | 0.149 | 745 | – | - | - | NNW | 5.6 | W–E | 0.12 | |
| 2019 | September | Motagua, Tinto, Ulua | 0.053 | 265 | - | - | - | ΝΕ | 2.3 | S–N | 0.08 |
© 2020 by the authors. Licensee MDPI, Basel, Switzerland. This article is an open access article distributed under the terms and conditions of the Creative Commons Attribution (CC BY) license (http://creativecommons.org/licenses/by/4.0/).
Share and Cite
MDPI and ACS Style
Kikaki, A.; Karantzalos, K.; Power, C.A.; Raitsos, D.E. Remotely Sensing the Source and Transport of Marine Plastic Debris in Bay Islands of Honduras (Caribbean Sea). Remote Sens. 2020, 12, 1727. https://doi.org/10.3390/rs12111727
AMA Style
Kikaki A, Karantzalos K, Power CA, Raitsos DE. Remotely Sensing the Source and Transport of Marine Plastic Debris in Bay Islands of Honduras (Caribbean Sea). Remote Sensing. 2020; 12(11):1727. https://doi.org/10.3390/rs12111727
Chicago/Turabian StyleKikaki, Aikaterini, Konstantinos Karantzalos, Caroline A. Power, and Dionysios E. Raitsos. 2020. "Remotely Sensing the Source and Transport of Marine Plastic Debris in Bay Islands of Honduras (Caribbean Sea)" Remote Sensing 12, no. 11: 1727. https://doi.org/10.3390/rs12111727
Note that from the first issue of 2016, this journal uses article numbers instead of page numbers. See further details here.