Validating GEV Model for Reflection Symmetry-Based Ocean Ship Detection with Gaofen-3 Dual-Polarimetric Data


1
School of Automation, Northwestern Polytechnical Universtiy, Xi’an 710129, China
2
Huawei Technologies Co. Ltd., Shenzhen 518129, China
3
School of Electronics and Information, Northwestern Polytechnical Universtiy, Xi’an 710129, China
4
School of Electronic Engineering, Xidian Universtiy, Xi’an 710071, China
*
Author to whom correspondence should be addressed.
Remote Sens. 2020, 12(7), 1148; https://doi.org/10.3390/rs12071148
Submission received: 3 March 2020
/
Revised: 31 March 2020
/
Accepted: 1 April 2020
/
Published: 3 April 2020
(This article belongs to the Special Issue Signal Processing of Polarimetric SAR: Detection and Parameter Extraction)
Abstract
:The spaceborne synthetic aperture radar (SAR) is quite powerful in worldwide ocean observation, especially for ship monitoring, as a hot topic in ocean surveillance. The launched Gaofen-3 (GF3) satellite of China can provide C-band and multi-polarization SAR data, and one of its scientific applications is ocean ship detection. Compared with the single polarization system, polarimetric systems can be used for more effective ship detection. In this paper, a generalized extreme value (GEV)-based constant false alarm rate (CFAR) detector is proposed for ship detection in the ocean by using the reflection symmetry metric of dual-polarization. The reflection symmetry property shows big differences between the metallic targets at sea and the sea surface. In addition, the GEV statistical model is employed for reflection symmetry statistical distribution, which fits the reflection symmetry probability density function (pdf) well. Five dual-polarimetric GF3 stripmap ocean data sets are introduced in the paper, to show the contrast in enhancement by using reflection symmetry and to investigate the GEV model fit to the reflection symmetry metric. Additionally, with the detection experiments on the real GF3 datasets, the effectiveness and efficiency of the GEV model for reflection symmetry and the model-based ocean ship detector are verified.
1. Introduction
Detection of ships in the ocean is a traditional task and one of the key applications for the earth obsevation remote sensing activities. The synthetic aperture radar (SAR) technique provides the possibility to monitor the global environment and security, owing to its all-day and all-weather capabilities over wide regions. In addition, ship detection with SAR data has gained intensive attention for various potential remote sensing applications, including marine surveillance, vessel traffic services and military operations. Herein, the world-wide-developed satellite SAR systems supplies more opportunities to realize ocean ship detection, as the launched new advanced SAR systems can provide more complete information of target scattering characterization, such as the polarimetric SAR systems (e.g., TerraSAR-X, ALOS-PALSAR, Radarsat-2, Sentinel-1, ComoSky-Med and so on) [1,2,3,4]. Comparing to the traditional single-channel SAR systems, the polarimetric SAR systems can describe the target under HH, HV and VV polarizations, and then more abundant information can be utilized for effective ship detection [5,6,7,8,9,10,11]. Polarimetric scattering characteristic parameters, such as the polarimetric entropy [7], polarimetric cross entropy (PCE) [8], the degree of polarization [9,10] and eigenvalue from polarimetric decomposition [11,12], have been developed for targets observation or target detection at sea.
In the recent years, many researches focus on the utilization of dual-polarimetric SAR data instead of quad-polarimetric SAR data for ocean targets observation or detection, as dual-polarimetric mode is often fixed for its larger swath widths compared to quad-polarimetric mode under the same resolution. Herein, the extensive use of TerraSAR-X dual-polarimetric SAR data has been explored for ocean surveillance, including ocean target investigation, coastline/shoreline extraction, sea ice analysis and other marine surveillance activities [3,13,14,15,16,17,18,19]. Meanwhile, dual-polarimetric data from Radarsat-2 are also widely utilized for oil spill observation, ocean wind retrieval, and ocean target detection, as well as dual-polarimetric data from other satellite SAR systems [4,20,21,22,23,24]. In these ocean surveillance researches, more information contained in the dual-polarization data are utilized. Under HH/VV co-polarization state, the co-polarized phase difference is modelled and used for oil spill observation with multi-look complex L- and C-band data sets [13], while the co-polarization difference, co-polarization ratio and nonpolarized components are extracted from HH/VV data for assessing various ocean surface phenomena using Radarsat-2 data [16]. Under compact/hybrid polarization state, the automatic ocean surveillance with the large area coverage is discussed by using the relative phase derived from the compact linear polarization [23], while the degree of polarization quantity is used for both ship and oil spill detection under different polarizations in hybrid/compact and linear dual-pol SAR imagery from Radarsat-2 and ALOS PALSAR [10].
As the co- and cross-polarization HH/HV or VH/VV is the overused dual-polarization state in the satellite SAR systems, exploring HH/HV or VH/VV data attracts intensive attentions on ocean targets, especially for the man-made target observation or detection at sea [1,2,3,19,20,21,22]. Among these researches, many polarimetric scattering characteristic parameters are considered for ship detection, including the polarimetric entropy [1,2,19], phase difference [21] and reflection symmetry [1,3,20,22]. Herein, reflection symmetry, as an important symmetry property characterizing the natural background scenarios, was first exploited for metallic target observation at sea by Migliaccio [3]. In [3], the metallic targets at sea has been studied by analyzing the coherent dual-polarimetric SAR data, based on the reflection symmetry property, which is obtained from the correlation between co-polarized and cross-polarized channel. In practice, the correlation is small enough to be negligible for the sea surface, while a large correlation is observed for man-made metallic targets. Additionally, this is consistent with the reflection symmetry property, which is quite different for sea surface with and without man-made metallic targets. When metallic targets are present, the correlation modulus is the natural norm to reveal the presence of man-made metallic targets at sea by using single-look complex (SLC) dual-polarimetric HH/HV or VH/VV SAR data. The ability of the reflection symmetry in metallic target observation at sea has been verified by comparing it with PCE-based constant false alarm rate (CFAR) in [3] on SLC data from Radarsat-2 and ALOS-PALSAR. And then many experiments have been done and studied on other dual-polarimetric SAR data on L-, C-, and X-bands [1,18]. In [1], an empirical relation is given to set an empirical threshold for ship detection with TerraSAR-X data, meanwhile the entropy approach from dual-polarimetric model is also analyzed. Benefitting from the property of reflection symmetry, other relative work focusing on the statistical distribution of the reflection symmetry metric is studied further [20,22] and tested on Radarsat-2 and ALOS-PALSAR data.
The Gaofen-3 (GF3) satellite, launched in 2016, was the first Chinese C-band polarimetric SAR, with high spatial resolution, multi-polarization imaging capability. And its remote sensing product can be applied in maritime surveillance, resource investigation, water environment monitoring, disaster prediction and so on [25,26,27,28,29]. GF3 is able to run in twelve different modes and one is the dual-polarization mode. Aiming at ocean ship detection with dual-polarimetric GF3 data sets, the reflection symmetry is investigated and analyzed with the generalized extreme value (GEV) distribution [30] model. Then, a new GEV model-based CFAR detector is constructed and applied on the reflection symmetry metric for ocean ship detection. As a versatile model often used in risk analysis to describe the rare meteorological events such as extreme floods and very high or low temperatures and others, the GEV model can fit the long-tails phenomenon properly compared to the generalized Gaussian, gamma and K distribution [24,31,32,33], considering the ship with the sea spike event model. Then the rest of the paper is organized as follows: In Section 2, the reflection symmetry metric is introduced and discussed with a real data set from GF3, and then the GEV distribution model is applied to the reflection symmetry distribution and investigated on the other two data sets, in which there are more ship targets in the wide ocean scene. Based on these, a GEV model-based CFAR detector on reflection symmetry is proposed for ocean ship detection. In Section 3, the different GF3 ocean data sets under dual-polarimetric stripmap mode are introduced. The experiments on these data sets validate the practicability and efficiency of both the GEV model for reflection symmetry and the proposed ship detection method. Conclusions are summarized in Section 4.
2. Theory and Methodology
In this section, the polarimetric reflection symmetry metric was firstly recalled for dual-polarimetric data, and then the GEV model was introduced for the statistical analysis of the reflection symmetry. Finally the GEV model-based CFAR detector was proposed in detail. Meanwhile, the real ocean data sets were employed for explaining the relative theory.
2.1. Reflection Symmetry
Under the reciprocity assumption, a covariance matrix in Equation (1) from the complex scattering vector using linear basis can be used to explain the polarimetric characteristics of scatters.
where is the generic scattering coefficient with X, Y . H and V are the horizontal and vertical polarization bases, respectively. , and are the ensemble average, modulus and complex conjugate operators, respectively.
In Equation (1), the non-coherent parameters are selected for analysis. It is known that the naturally-distributed scenario generally satisfies the reflection symmetry, hence the correlation between co- and cross-polarized scattering amplitudes vanishes. Thus, the reflection symmetry metric can be achieved as
The modulus in Equation (2) is the natural norm to measure the departure from the reflection symmetry case. When tends to 0, the observed scene is characterized by the symmetry property, while for larger values, departure from reflection symmetry is achieved [2,3]. Additionally, the departure from reflection symmetry can be equivalently measured by using either the HH-HV correlation or the VH-VV correlation.
Compared with man-made metallic targets, such as ships, sea surface as a natural distributed scenario follows the reflection symmetry property. In practice, the uncorrelated relationship is expected between the co- and cross-polarized scattering complex amplitudes, viz. in Equation (2) is expected close to 0. While dealing with the metallic targets consisting of planes and dihedral structures are expected to be completely different from natural targets in terms of symmetry properties, viz. the reflection symmetry is not expected to be satisfied. Thus, significantly larger than the sea surface is expected [3]. Therefore, the simple evaluation of the HH-HV or VV-VH correlation provides information about the presence of man-made metallic targets over the sea surface, and has been considered for target observation at sea, such as ship detection.
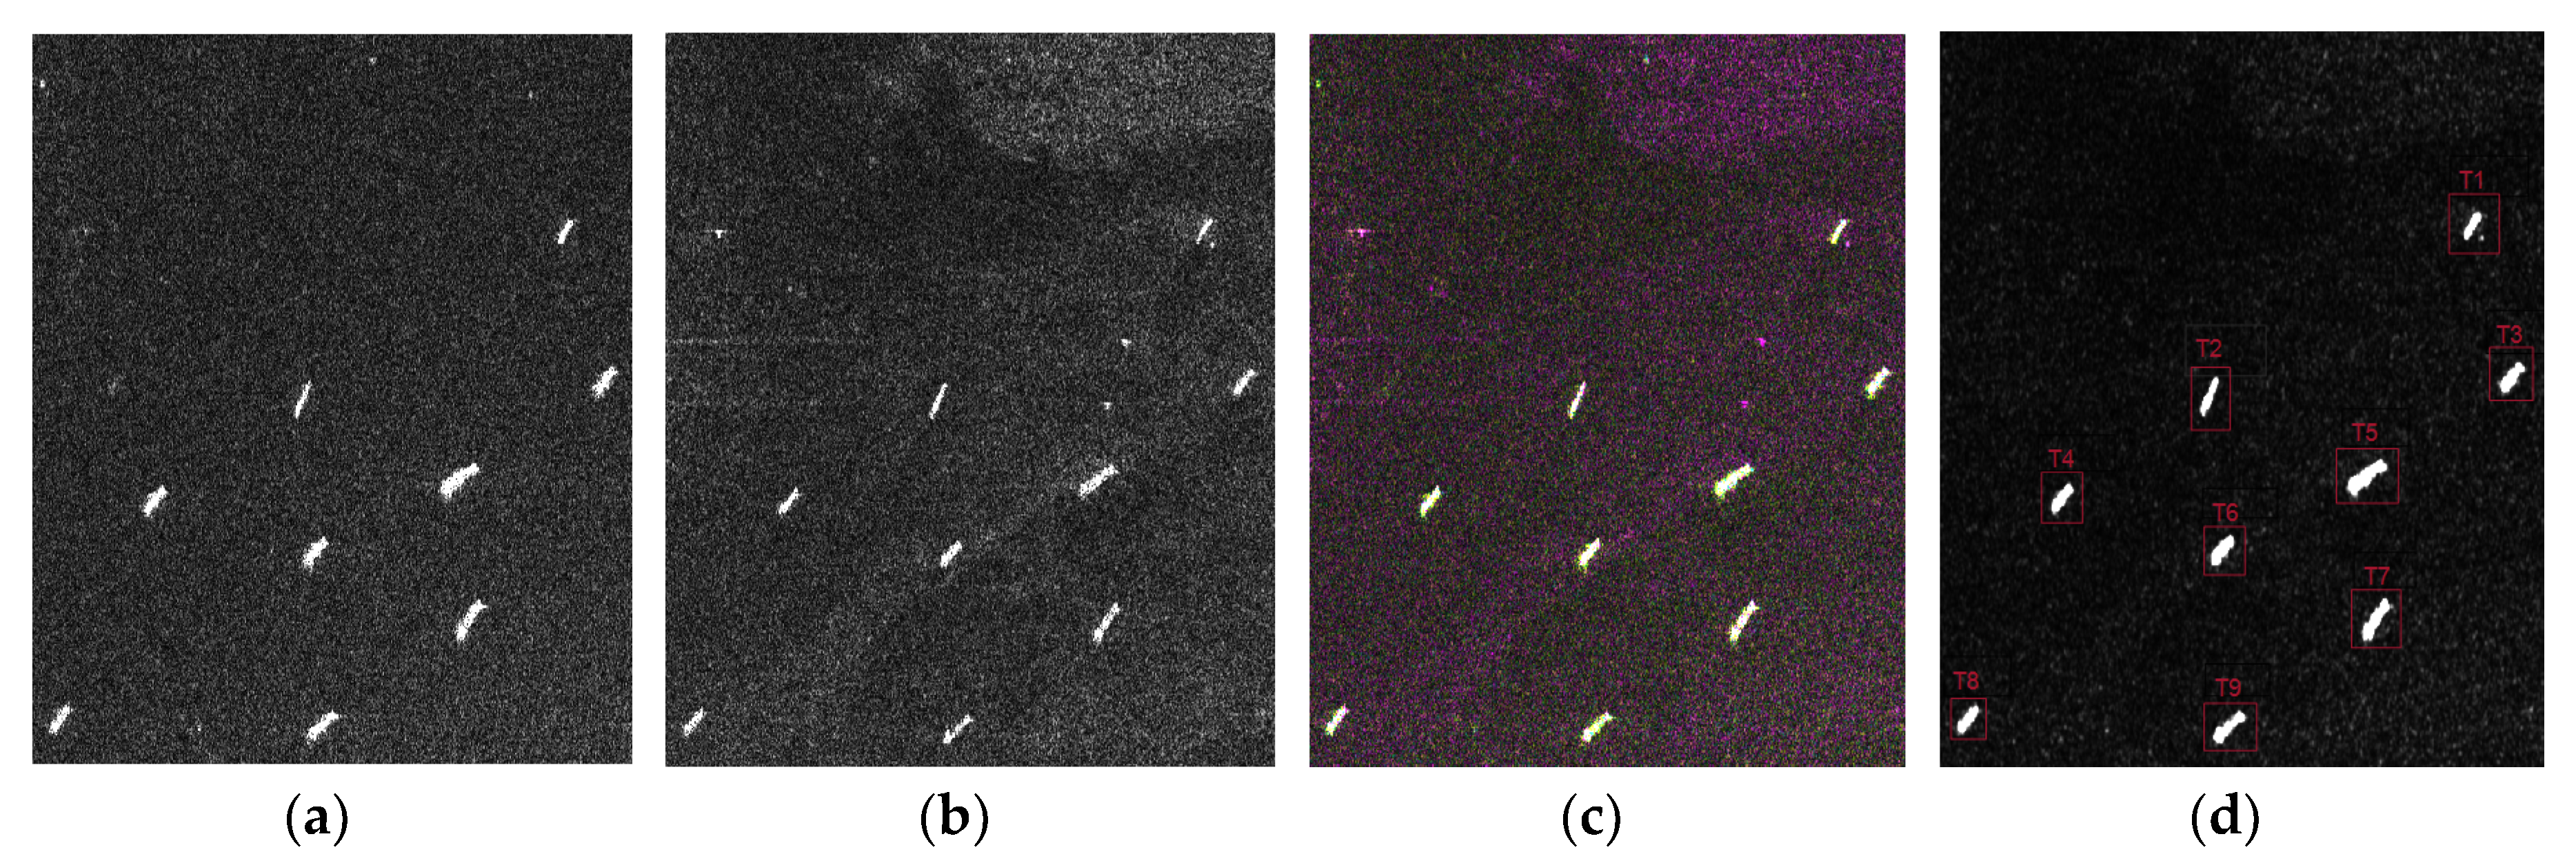
To show the contrast enhancement of reflection symmetry between targets and the sea clutter, a real data set from GF3 with VH/VV polarizations is illustrated in Figure 1. Figure 1a,b are the VH amplitude image and VV amplitude image in size of 900 780 pixels. Figure 1c is the pseudo-color image composed by ,,. Figure 1c is the image of reflection symmetry. In Figure 1, nine ship targets can be obviously observed. From the vision view, the contrast between these ship targets and the ocean clutter is enhanced in Figure 1c. The signal-to-clutter ratio (SCR) of the nine targets are also illustrated in Table 1, and the SCRs are increased in γ, which shows the performance of reflection symmetry in enhancing the contrast between targets and clutter. In Figure 1 the consequence of the SCRs is γ > VH > VV.
2.2. GEV Model
In Section 2.1, it was pointed out that the reflection symmetry metric can be utilized for ocean man-made metallic target observation, including the ships over the sea surface. Then, based on this metric, the further ship detector could be constructed considering the statistical distribution of the reflection symmetry metric.
For the convenience of statistical analysis, the reflection symmetry metric can be normalized as
The value of the normalized reflection symmetry metric lies in the interval [0,1]. As mentioned above, the normalized reflection symmetry metric will be close to 0 for the sea surface, while it will be expected to be 1 for the metallic targets at sea surface. Therefore, like a sea spike event [34], the presence of ships at sea leads to long-tails in the statistical distribution while describing the normalized reflection symmetry metric statistical distribution of the ocean surface. It has been pointed out that the traditional statistical distribution model including the generalized Gaussian and Gamma distribution cannot fit the long-tails phenomenon well [35,36,37]. The generalized Gamma and K-distribution can just describe the right long-tail like distribution, but for the left long-tail phenomenon they mismatched. Meanwhile, K-distribution is applied for describing the multiplicative noise model, which is suitable for homogenous region and weak texture areas.
GEV distribution is a family of continuous extremum probability distributions, and has the characteristics of finite distribution and stability. The normalized reflection symmetry metric takes values between zero and one, so the heavy-tailed class distribution such as the GEV distribution may be a good choice to depict the normalized reflection symmetry image. The GEV model conforms to the following probability density function (PDF)
and
where is the normalized reflection symmetry, and , and are the shape, scale and location parameters, respectively. These parameters can be estimated by using the maximum likelihood estimation (MLE) method [34].
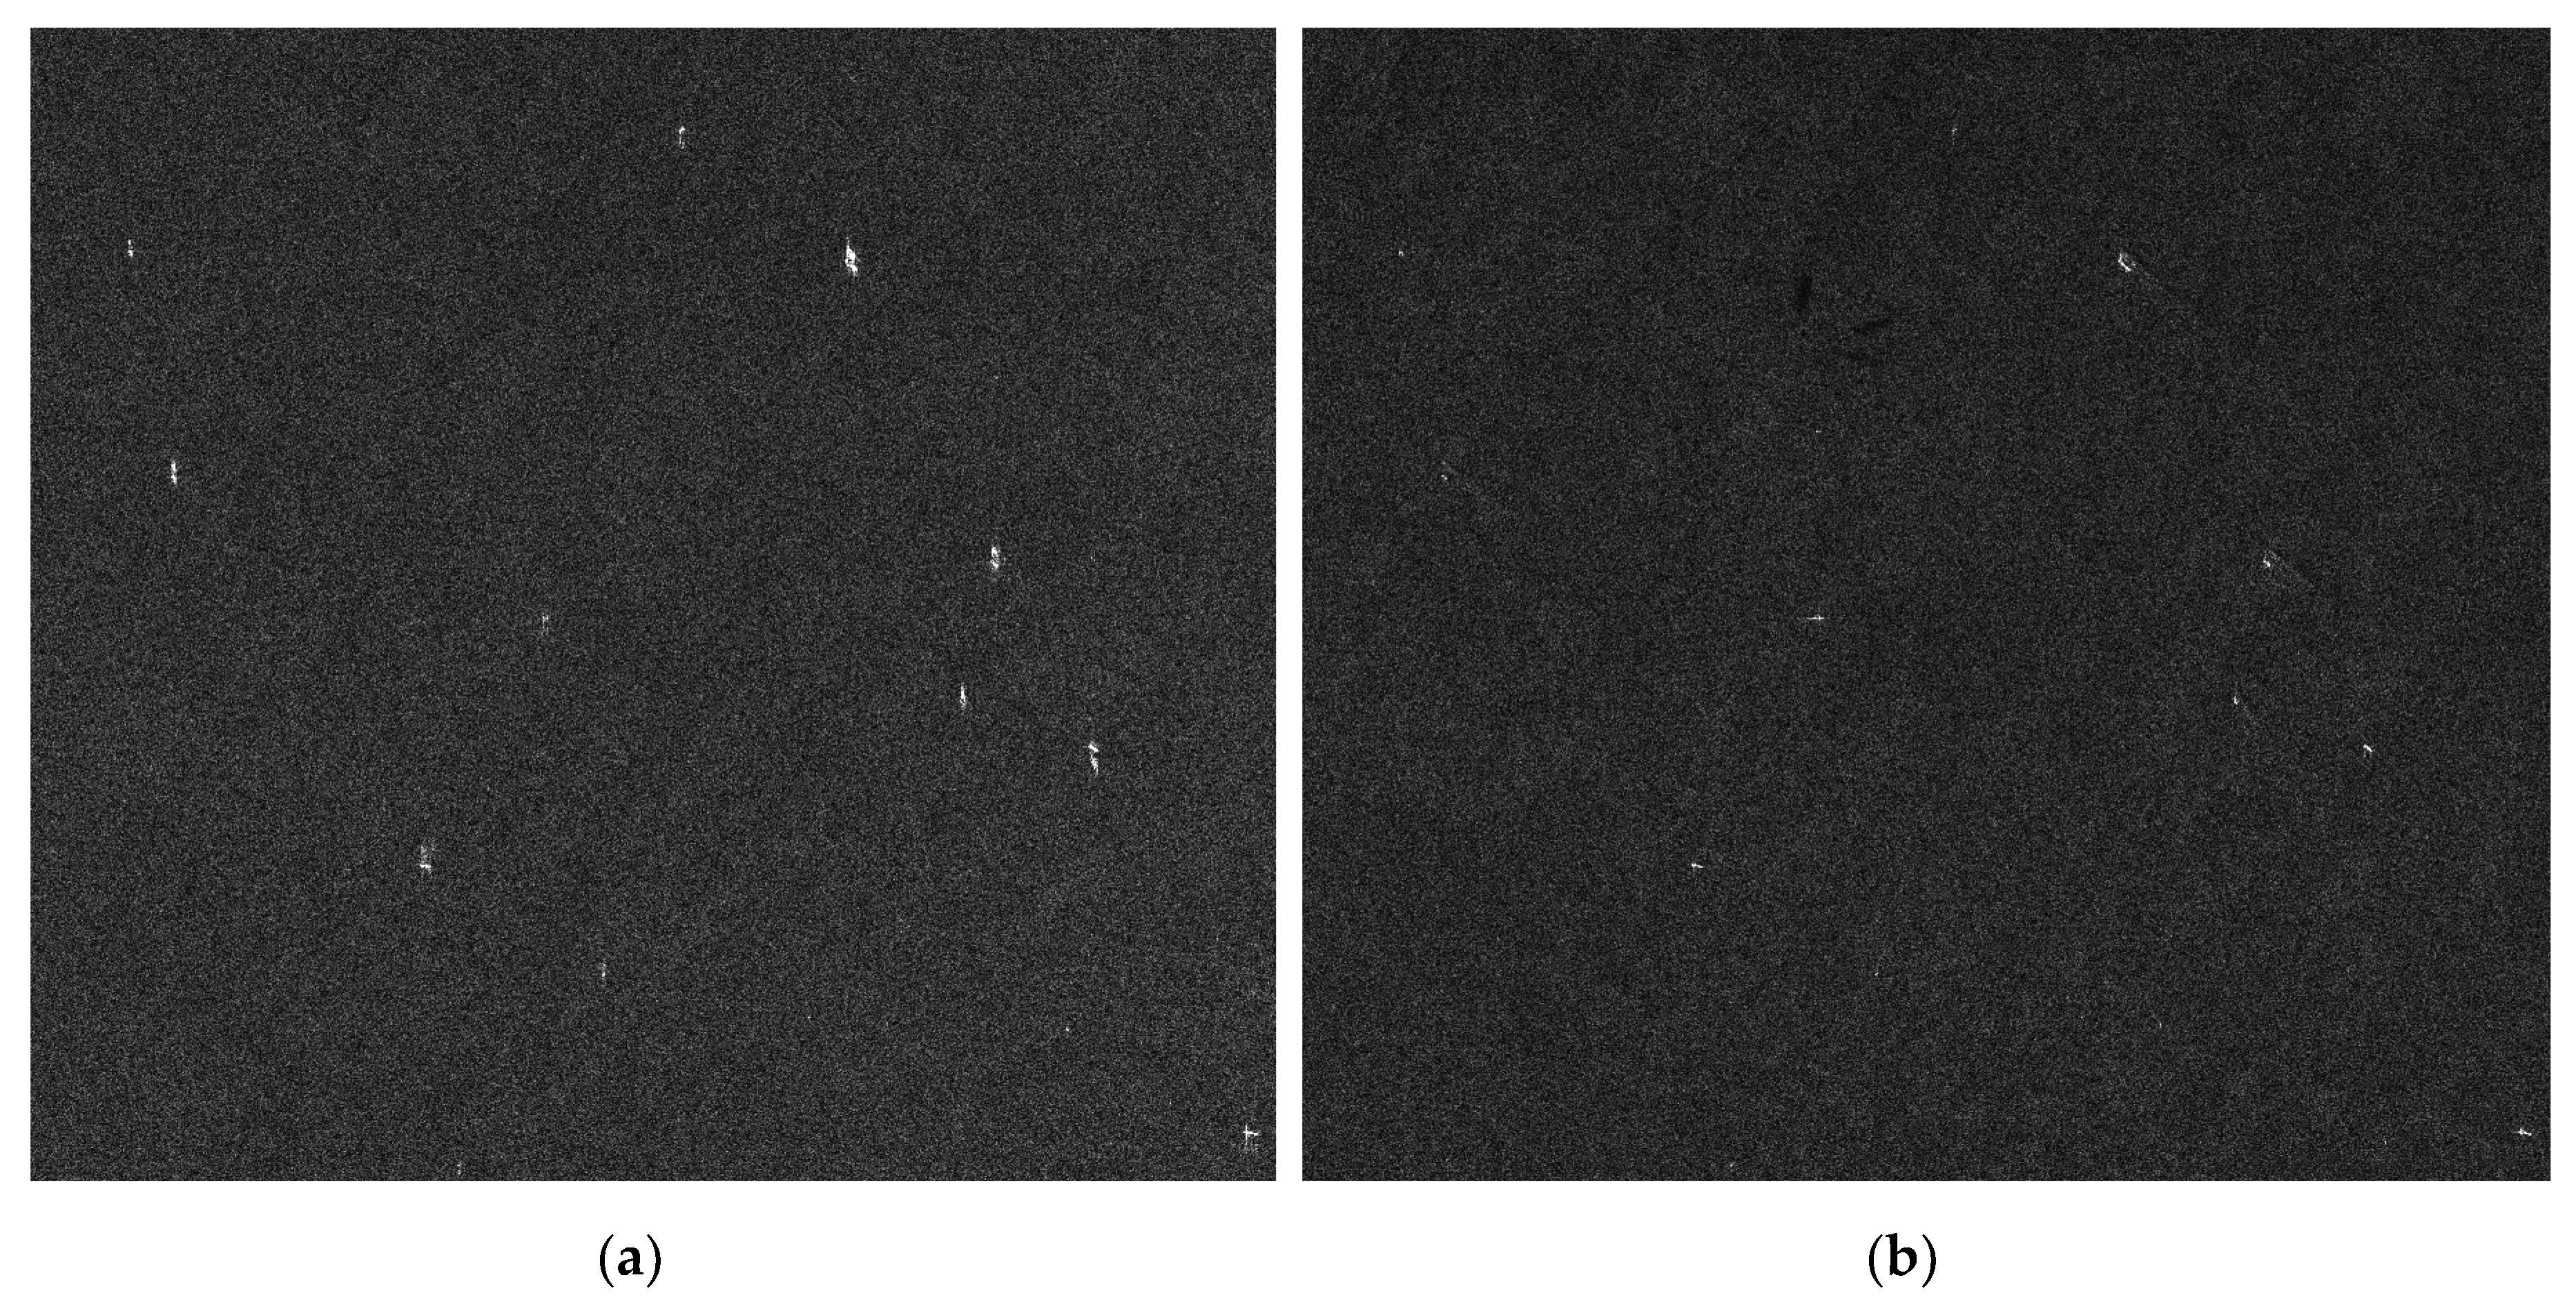
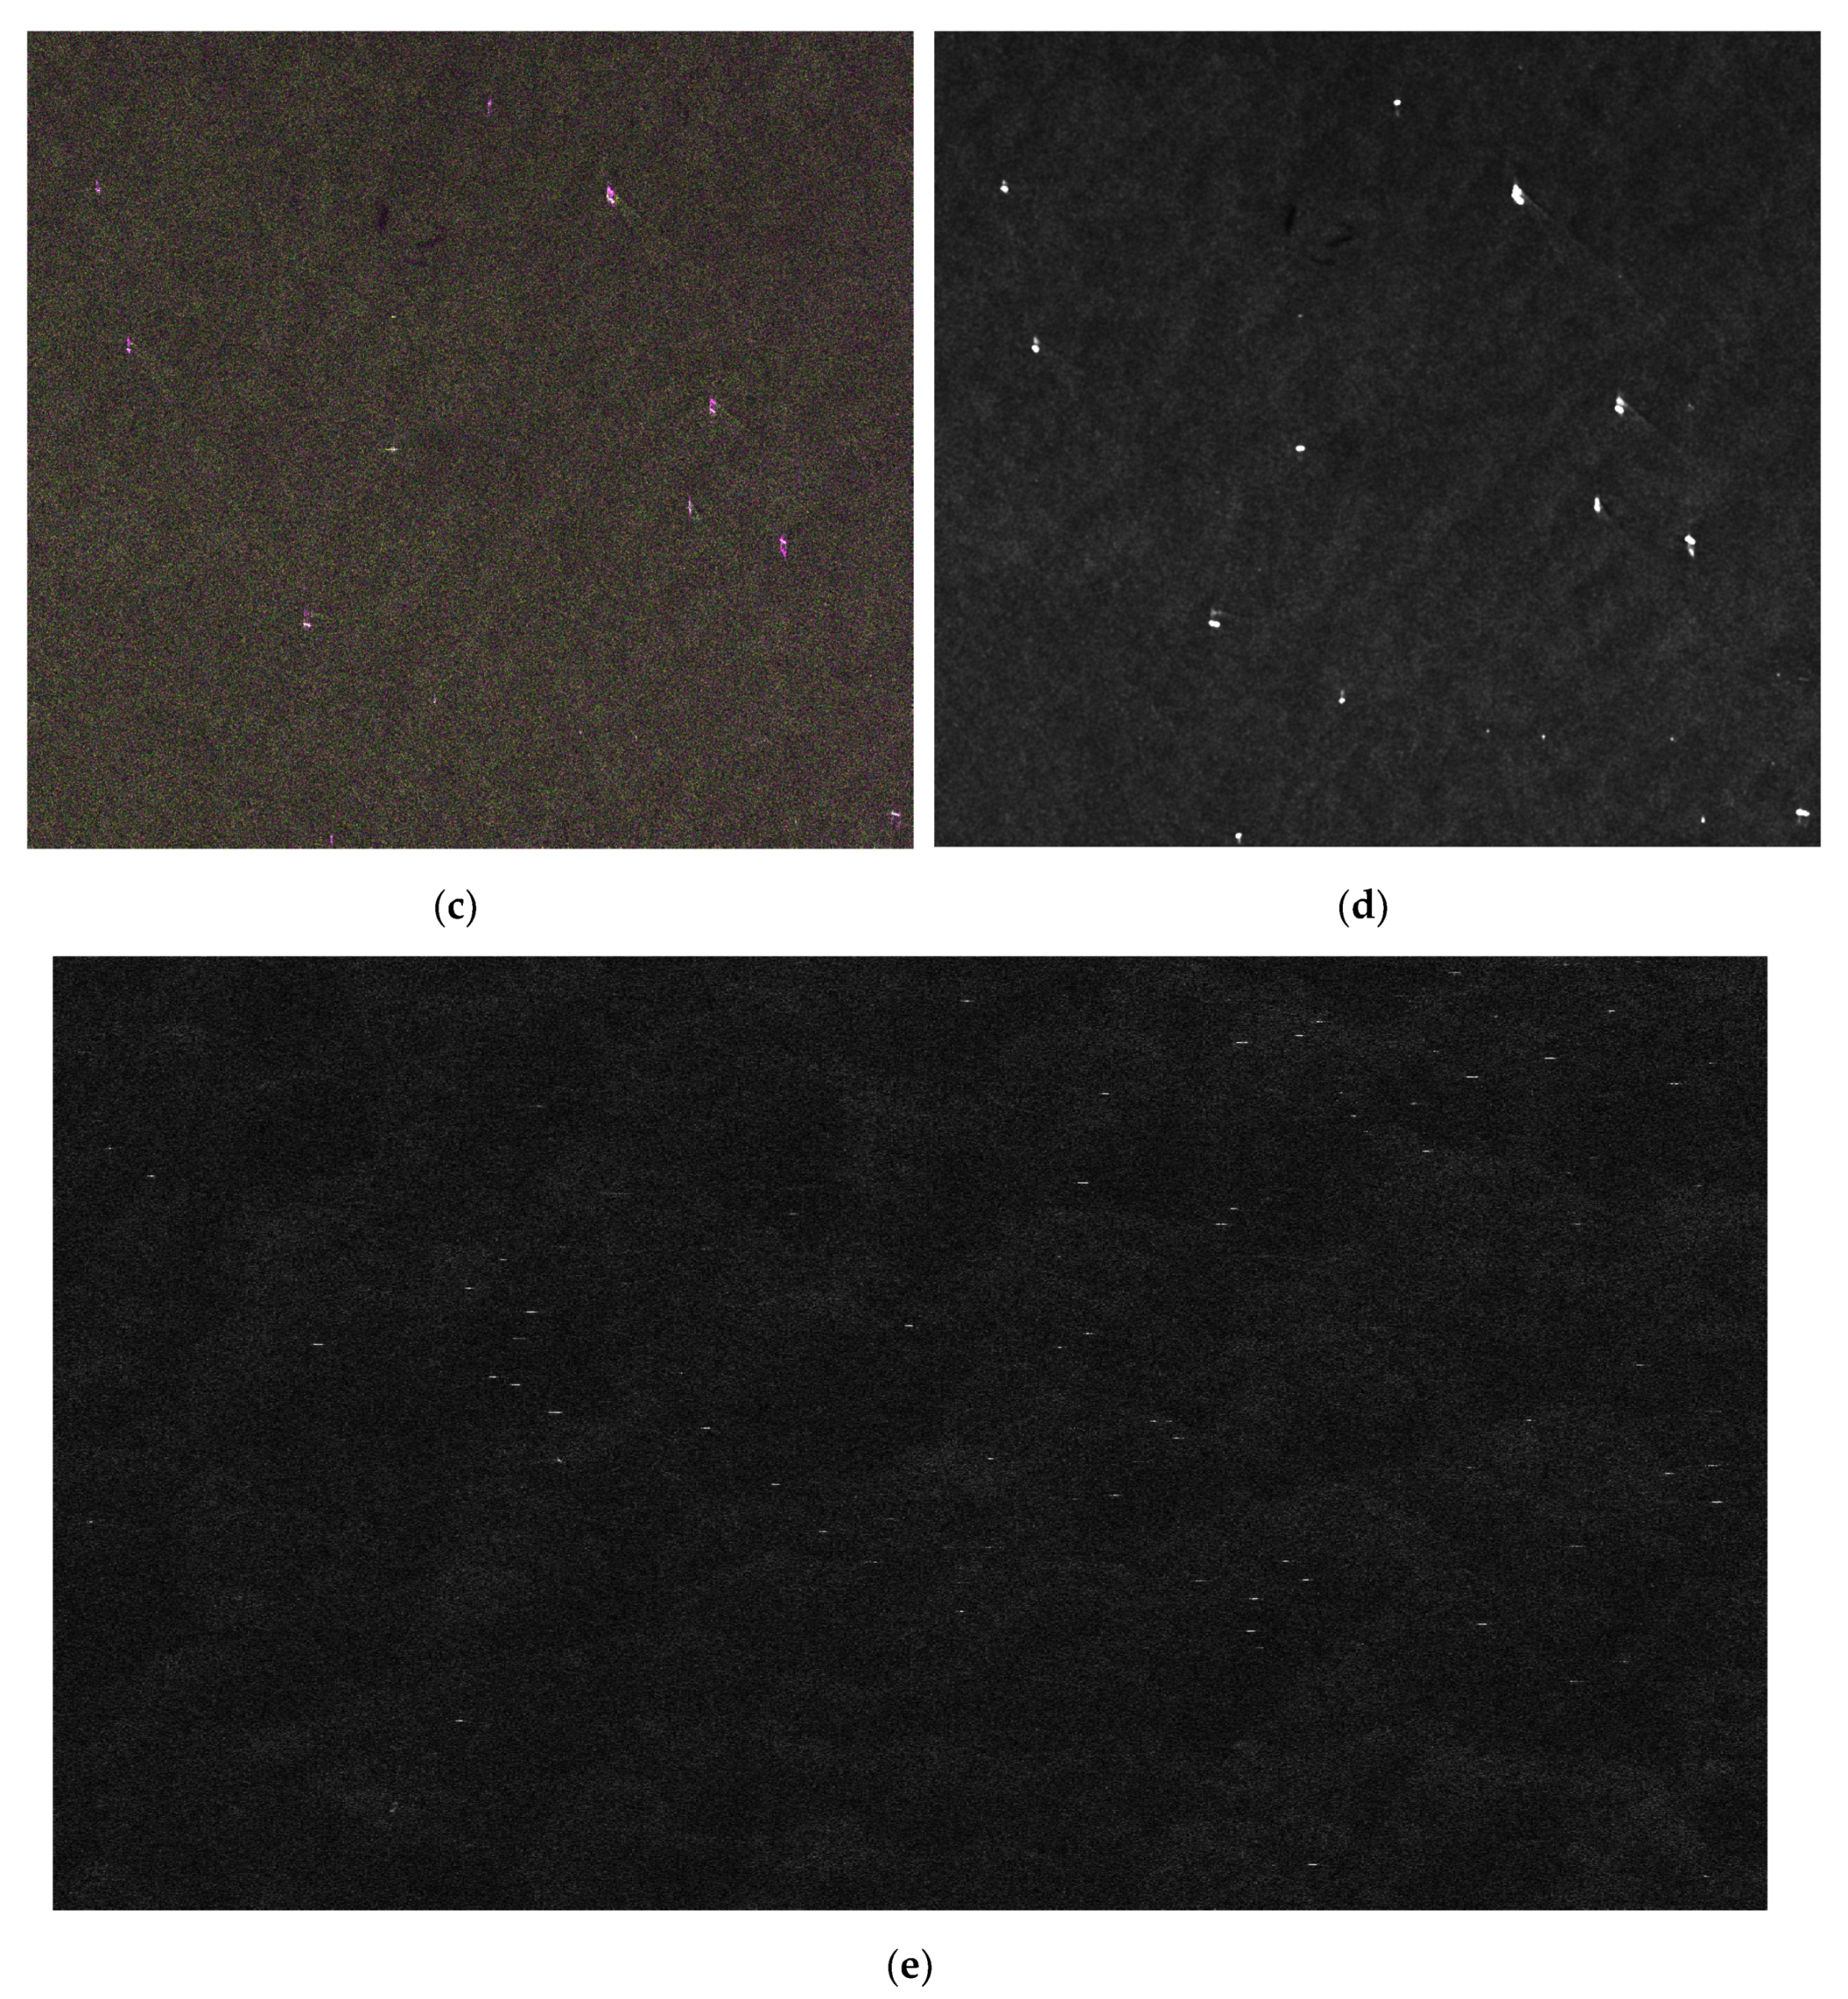
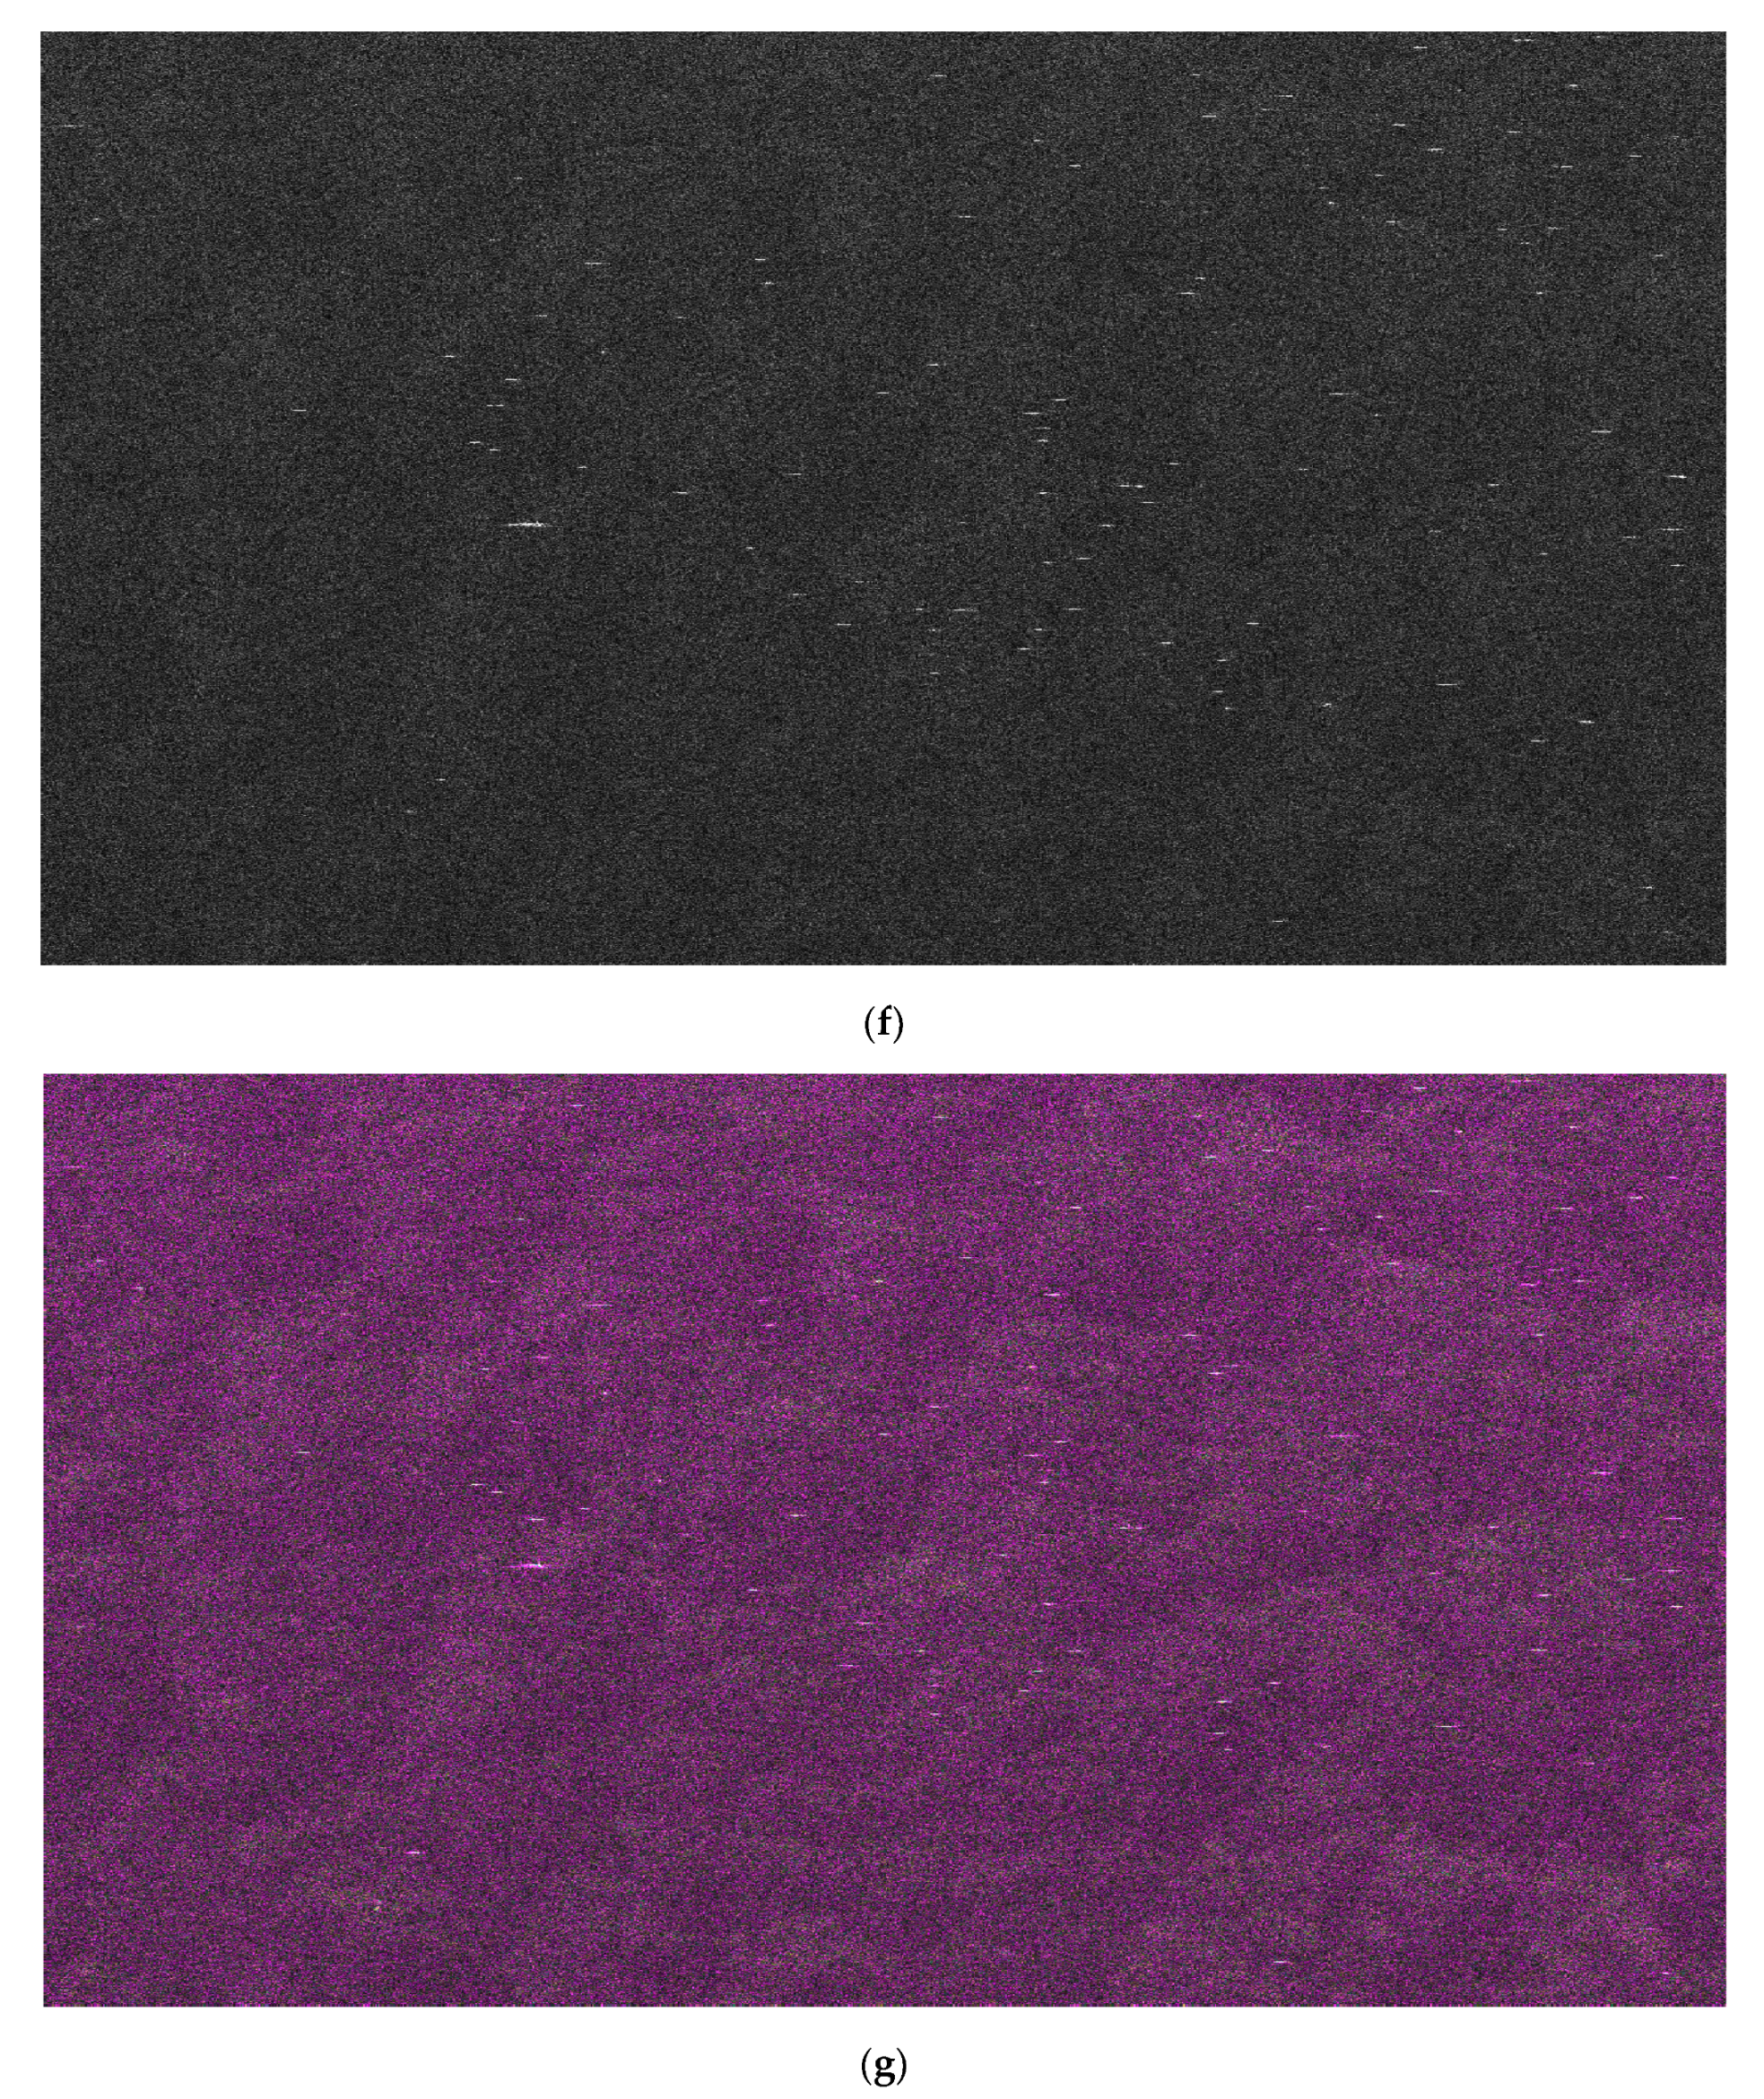
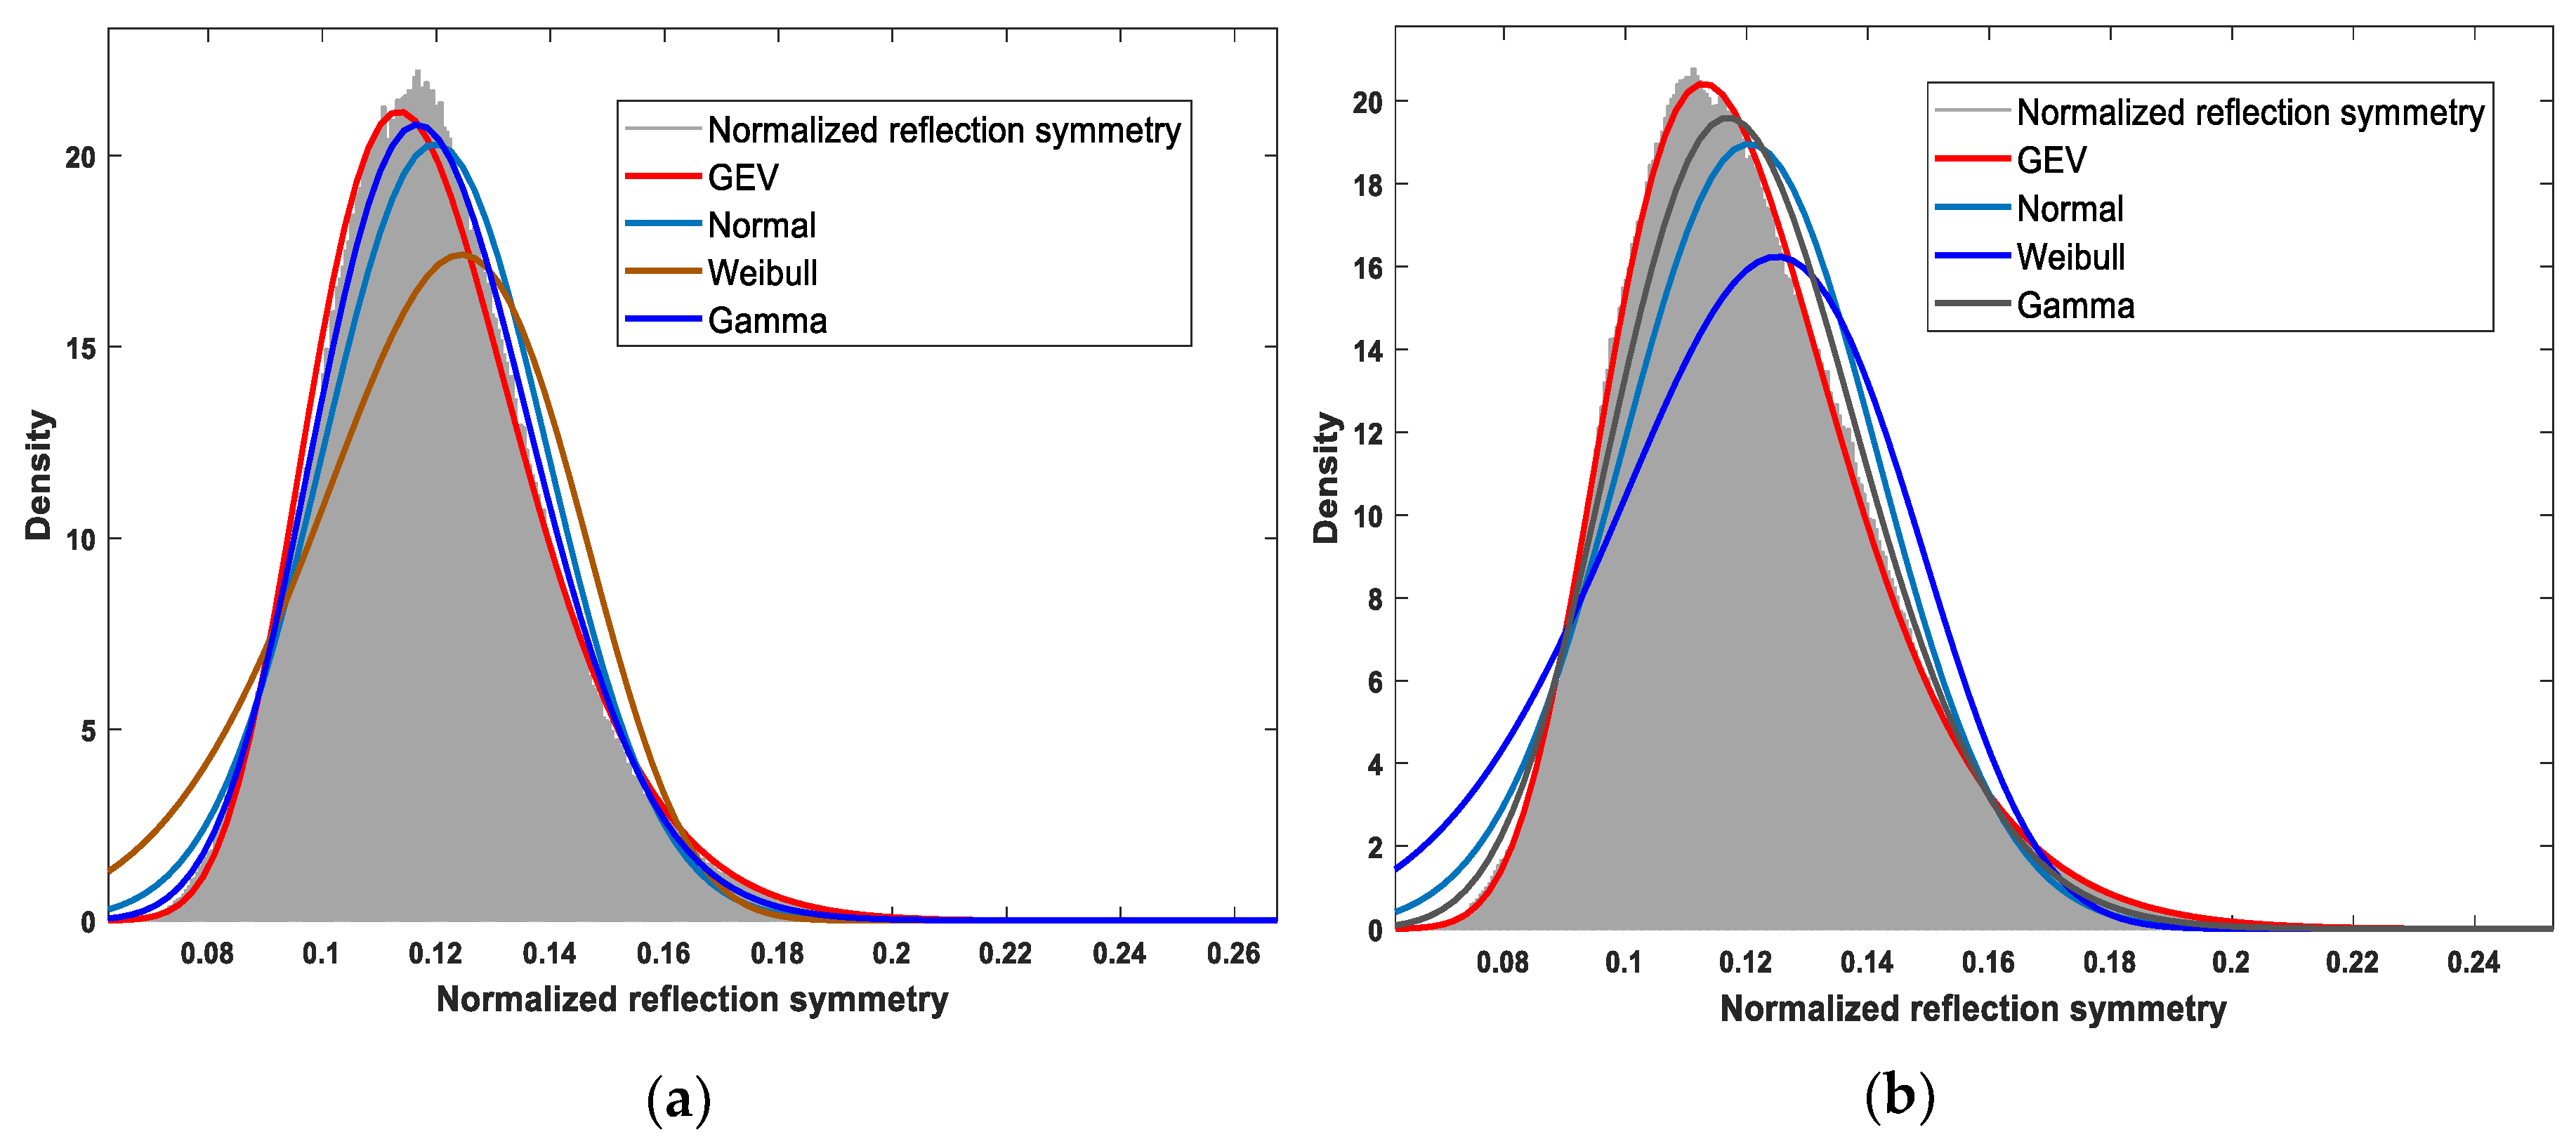
By the fitting of sea clutter in the wide ocean scene in Figure 2, several statistical distributions are adopted as shown in Figure 3. In Figure 2, there are two GF3 data sets under stripmap mode. The pseudo color images composed by co- and cross-polarization are also illustrated, as they are better for the vision view of targets in the ocean scene. Figure 2a–d is the HH amplitude, HV amplitude, composed pseudo color and the reflection symmetry image of data set 1 in the size of 6000 6500 pixels. Figure 2e–h is the VH amplitude, VV amplitude, composed pseudo color and the reflection symmetry image of data set 2 in the size of 5000 9000 pixels. It can be observed that in data set 2 there are many more ship targets on the sea. In Figure 3, it seems that GEV fits the long-tails phenomenon better than others. It has already been verified that GEV model can properly describe the stochastic processes when the extreme events happen, and has already been successfully utilized in many researches about target analysis in SAR imagery [35,36,37]. For further numerical assessment, the Wasserstein distance which is the commonly used distance measurement between any two statistical distributions, is introduced to evaluate the fit of different statistical distribution in Figure 3a,b. The numerical assessment results are listed in Table 2, and the Wasserstein distance of GEV fit is the smallest for both of the two data sets, which also implies the GEV fit is prior to other statistical distribution.
2.3. GEV Model-Based CFAR Detector
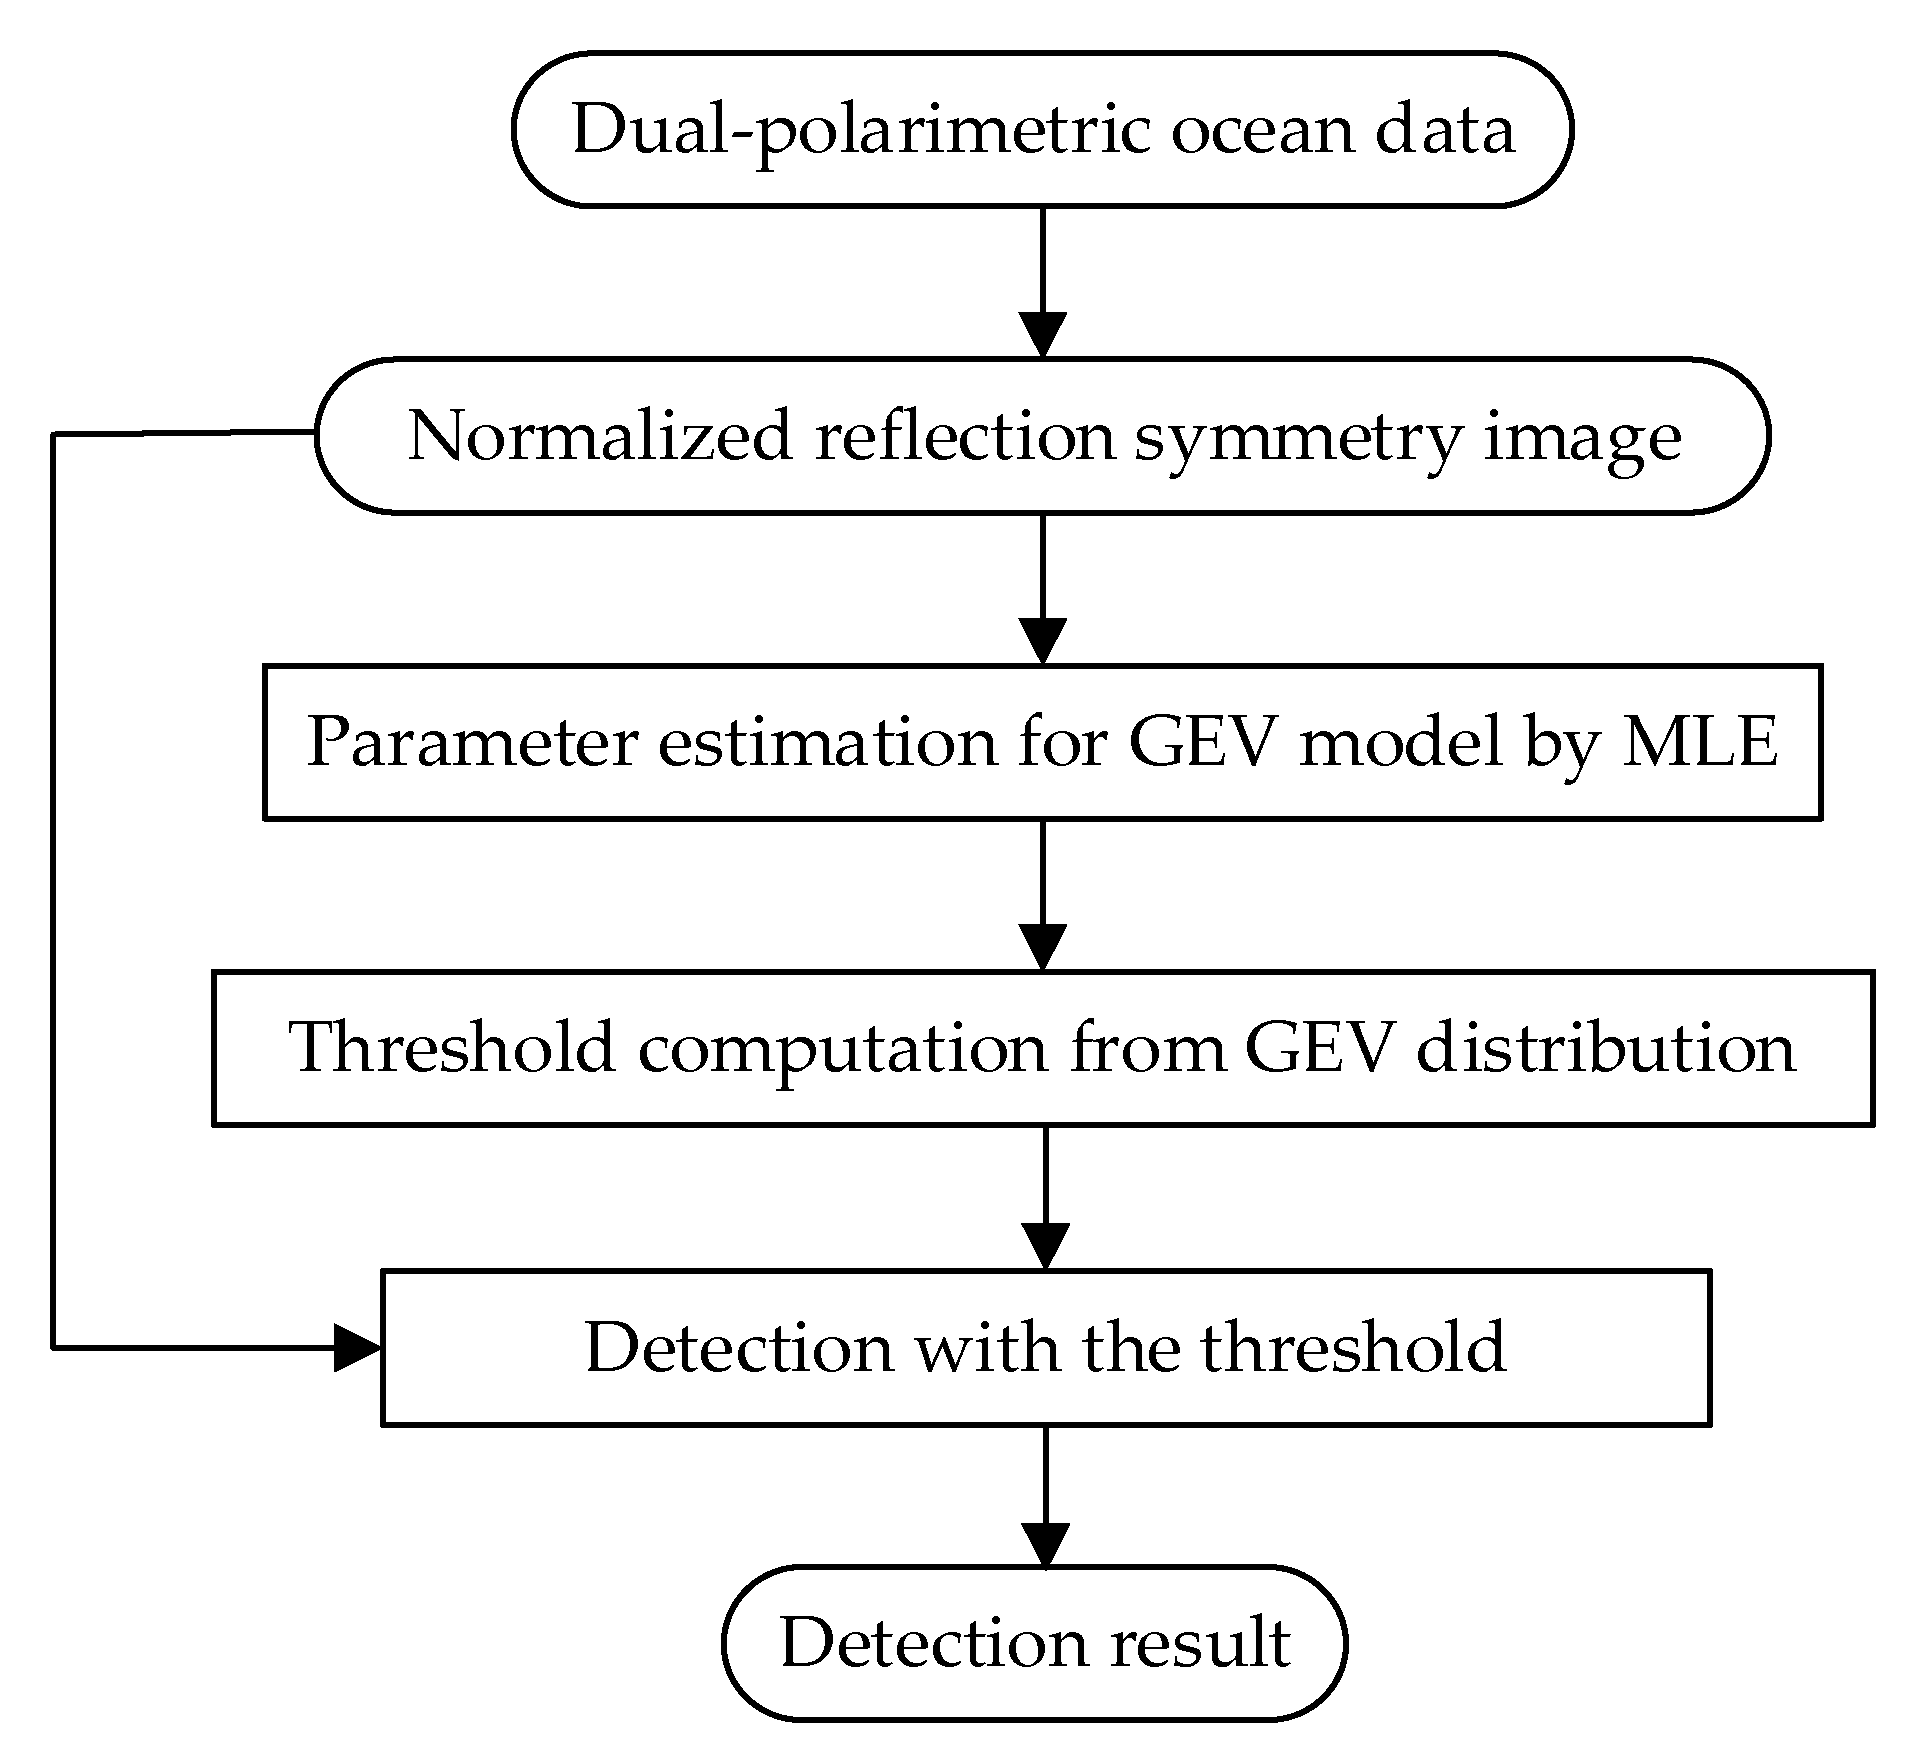
For the normalized reflection symmetry image, the parameters of , and for the best-fitted GEV distribution can be obtained by MLE. Hence, instead of the manually determined empirical value, the CFAR method is employed to the GEV distribution to automatically estimate the threshold value to realize the ship detection. The procedure of the proposed reflection symmetry GEV model-based CFAR algorithm is summarized in Figure 4.
Given the distribution model of ocean clutter within the normalized reflection symmetry metric in Equation (4), it can be proved that the relationship between the false alarm and the detection threshold can be derived from the numerical integration of the GEV distribution
where is the false alarm rate and T is the threshold.
Taking these parameters of the GEV PDF into (6), the adaptive threshold T can be achieved as
3. Experiments and Validation
In this section, the ship detection was first tested on the data sets mentioned in Section 2.2. And then the other two GF-3 dual-polarimetric data sets were utilized in the experiments, under the low sea sate and the high-sea state, respectively. The effectiveness of the reflection symmetry metric and the universality of GEV distribution model were investigated and demonstrated.
3.1. Experiments on Data Sets 1 and 2
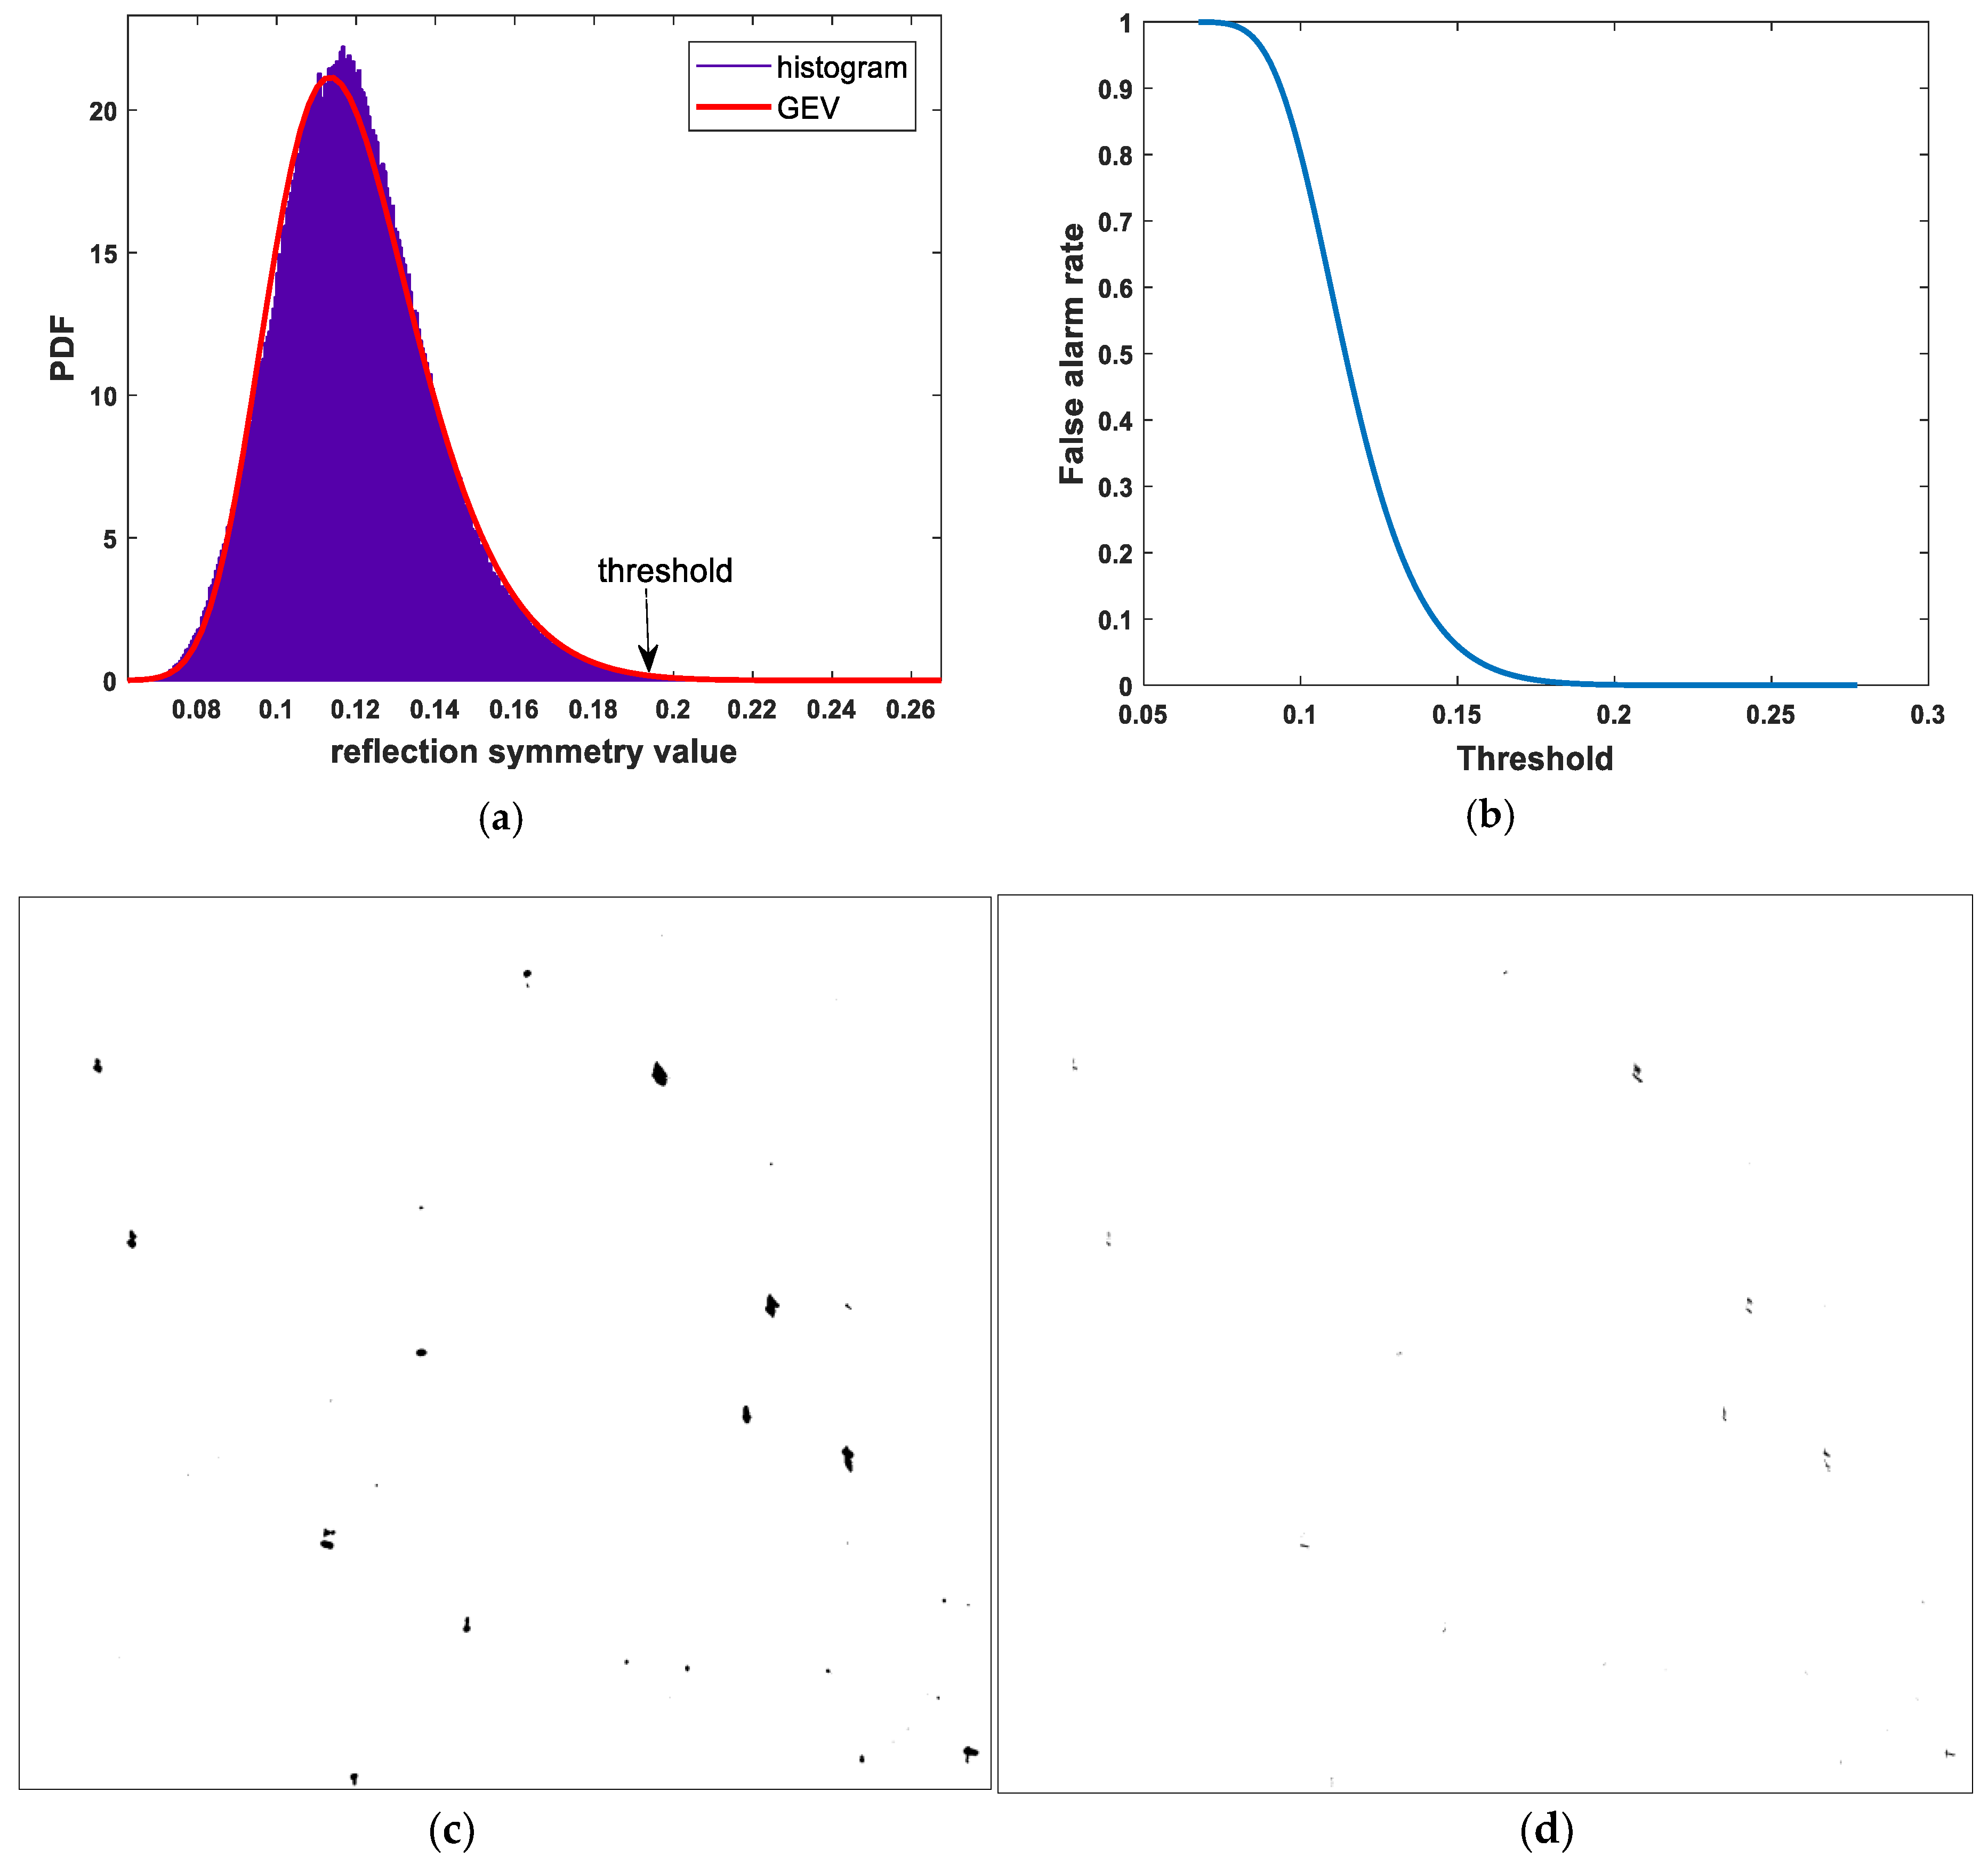
As mentioned in Section 2.1, data set 1 is in HH/HV polarizations under stripmap mode, and the resolution is about 7.1 m. Figure 5a shows the PDF of the normalized reflection symmetry of data set 1. MLE produces the best-fitted distribution with the parameters , and . By setting = 1 10−9, the threshold indicated in Figure 5a was obtained as T = 0.193. The curve in Figure 5b shows the relationship between false alarm rate and threshold. The corresponding detection result is obtained in Figure 5c. According to the detection result in Figure 5c, the estimated mean SCR of the targets in this ocean scene are 8.10dB for HH amplitude in Figure 2a, 10.56 dB for HV amplitude in Figure 2b and 39.37 dB for the reflection symmetry in Figure 2d. It is obvious that the reflection symmetry greatly enhances the contrast between targets and ocean clutter.
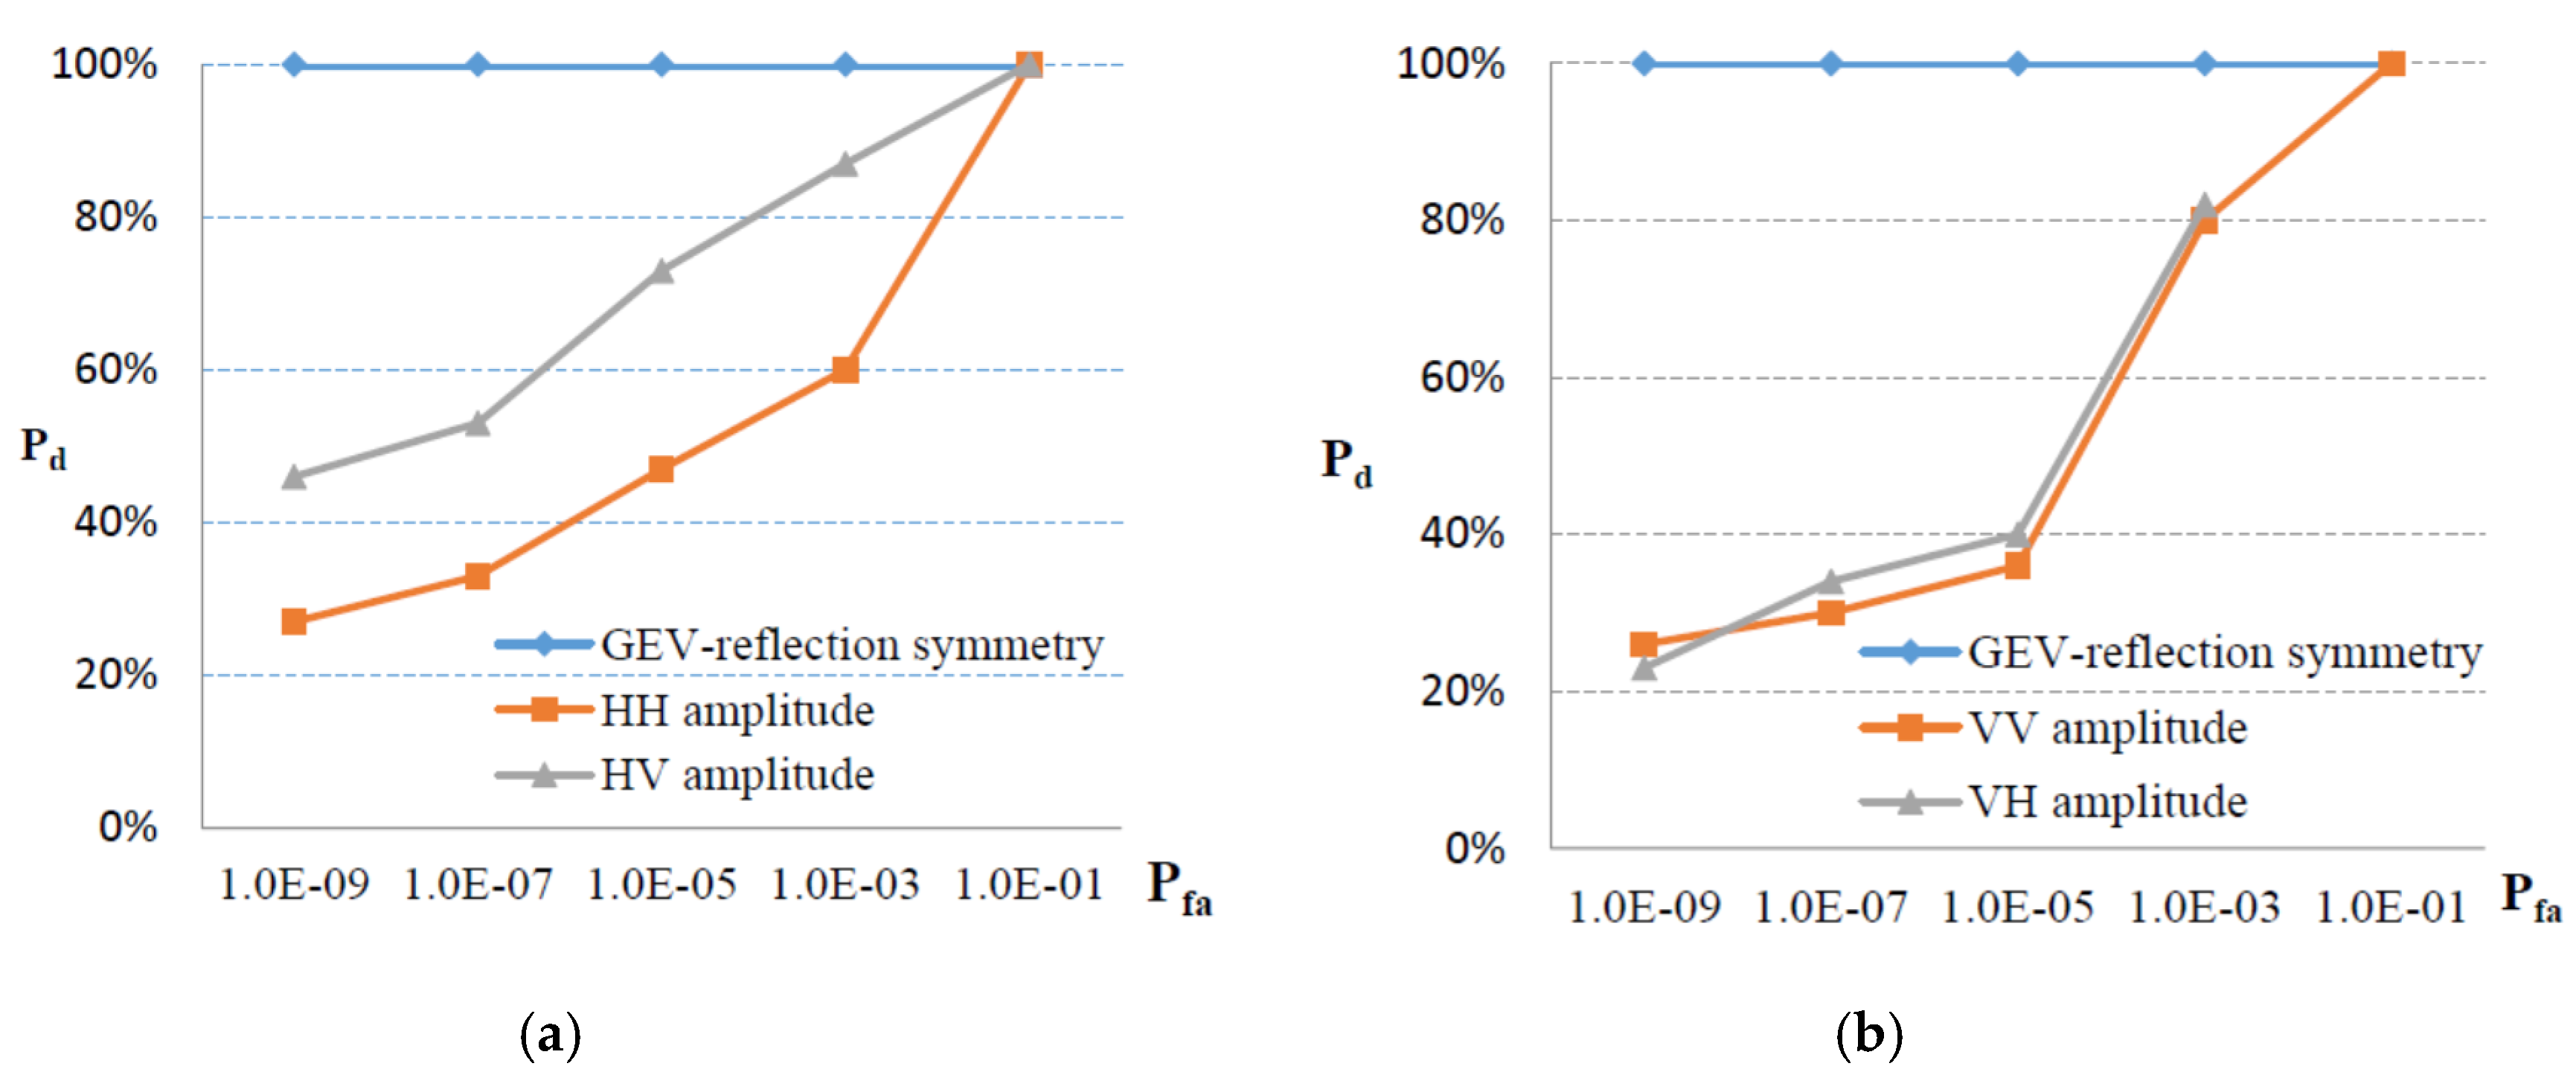
For comparison, the CFAR detection results on the single polarization images are also supplied. Since there is quite few detected targets in the HH co-polarization image by setting = 1 10−9, only the detection result using the HV cross-polarization amplitude image is illustrated in Figure 5d. Besides, the detection results involving different false alarm rates are compared for the reflection symmetry, HH and HV images in the form of the receiving operating characteristic (ROC) curves as Figure 6a. The detection rates are compared, while . It can be found that the reflection symmetry can reach better detection rates Pd with different false alarm rates . The detection rates degrade rapidly, while the false alarm rate decreases by using HH and HV for ship detection. Meanwhile, as the contrast between target and sea clutter in the cross-polarization HV image is higher than it is in the co-polarization HH image, in Figure 6a, HV shows superiority to HH in ship detection.
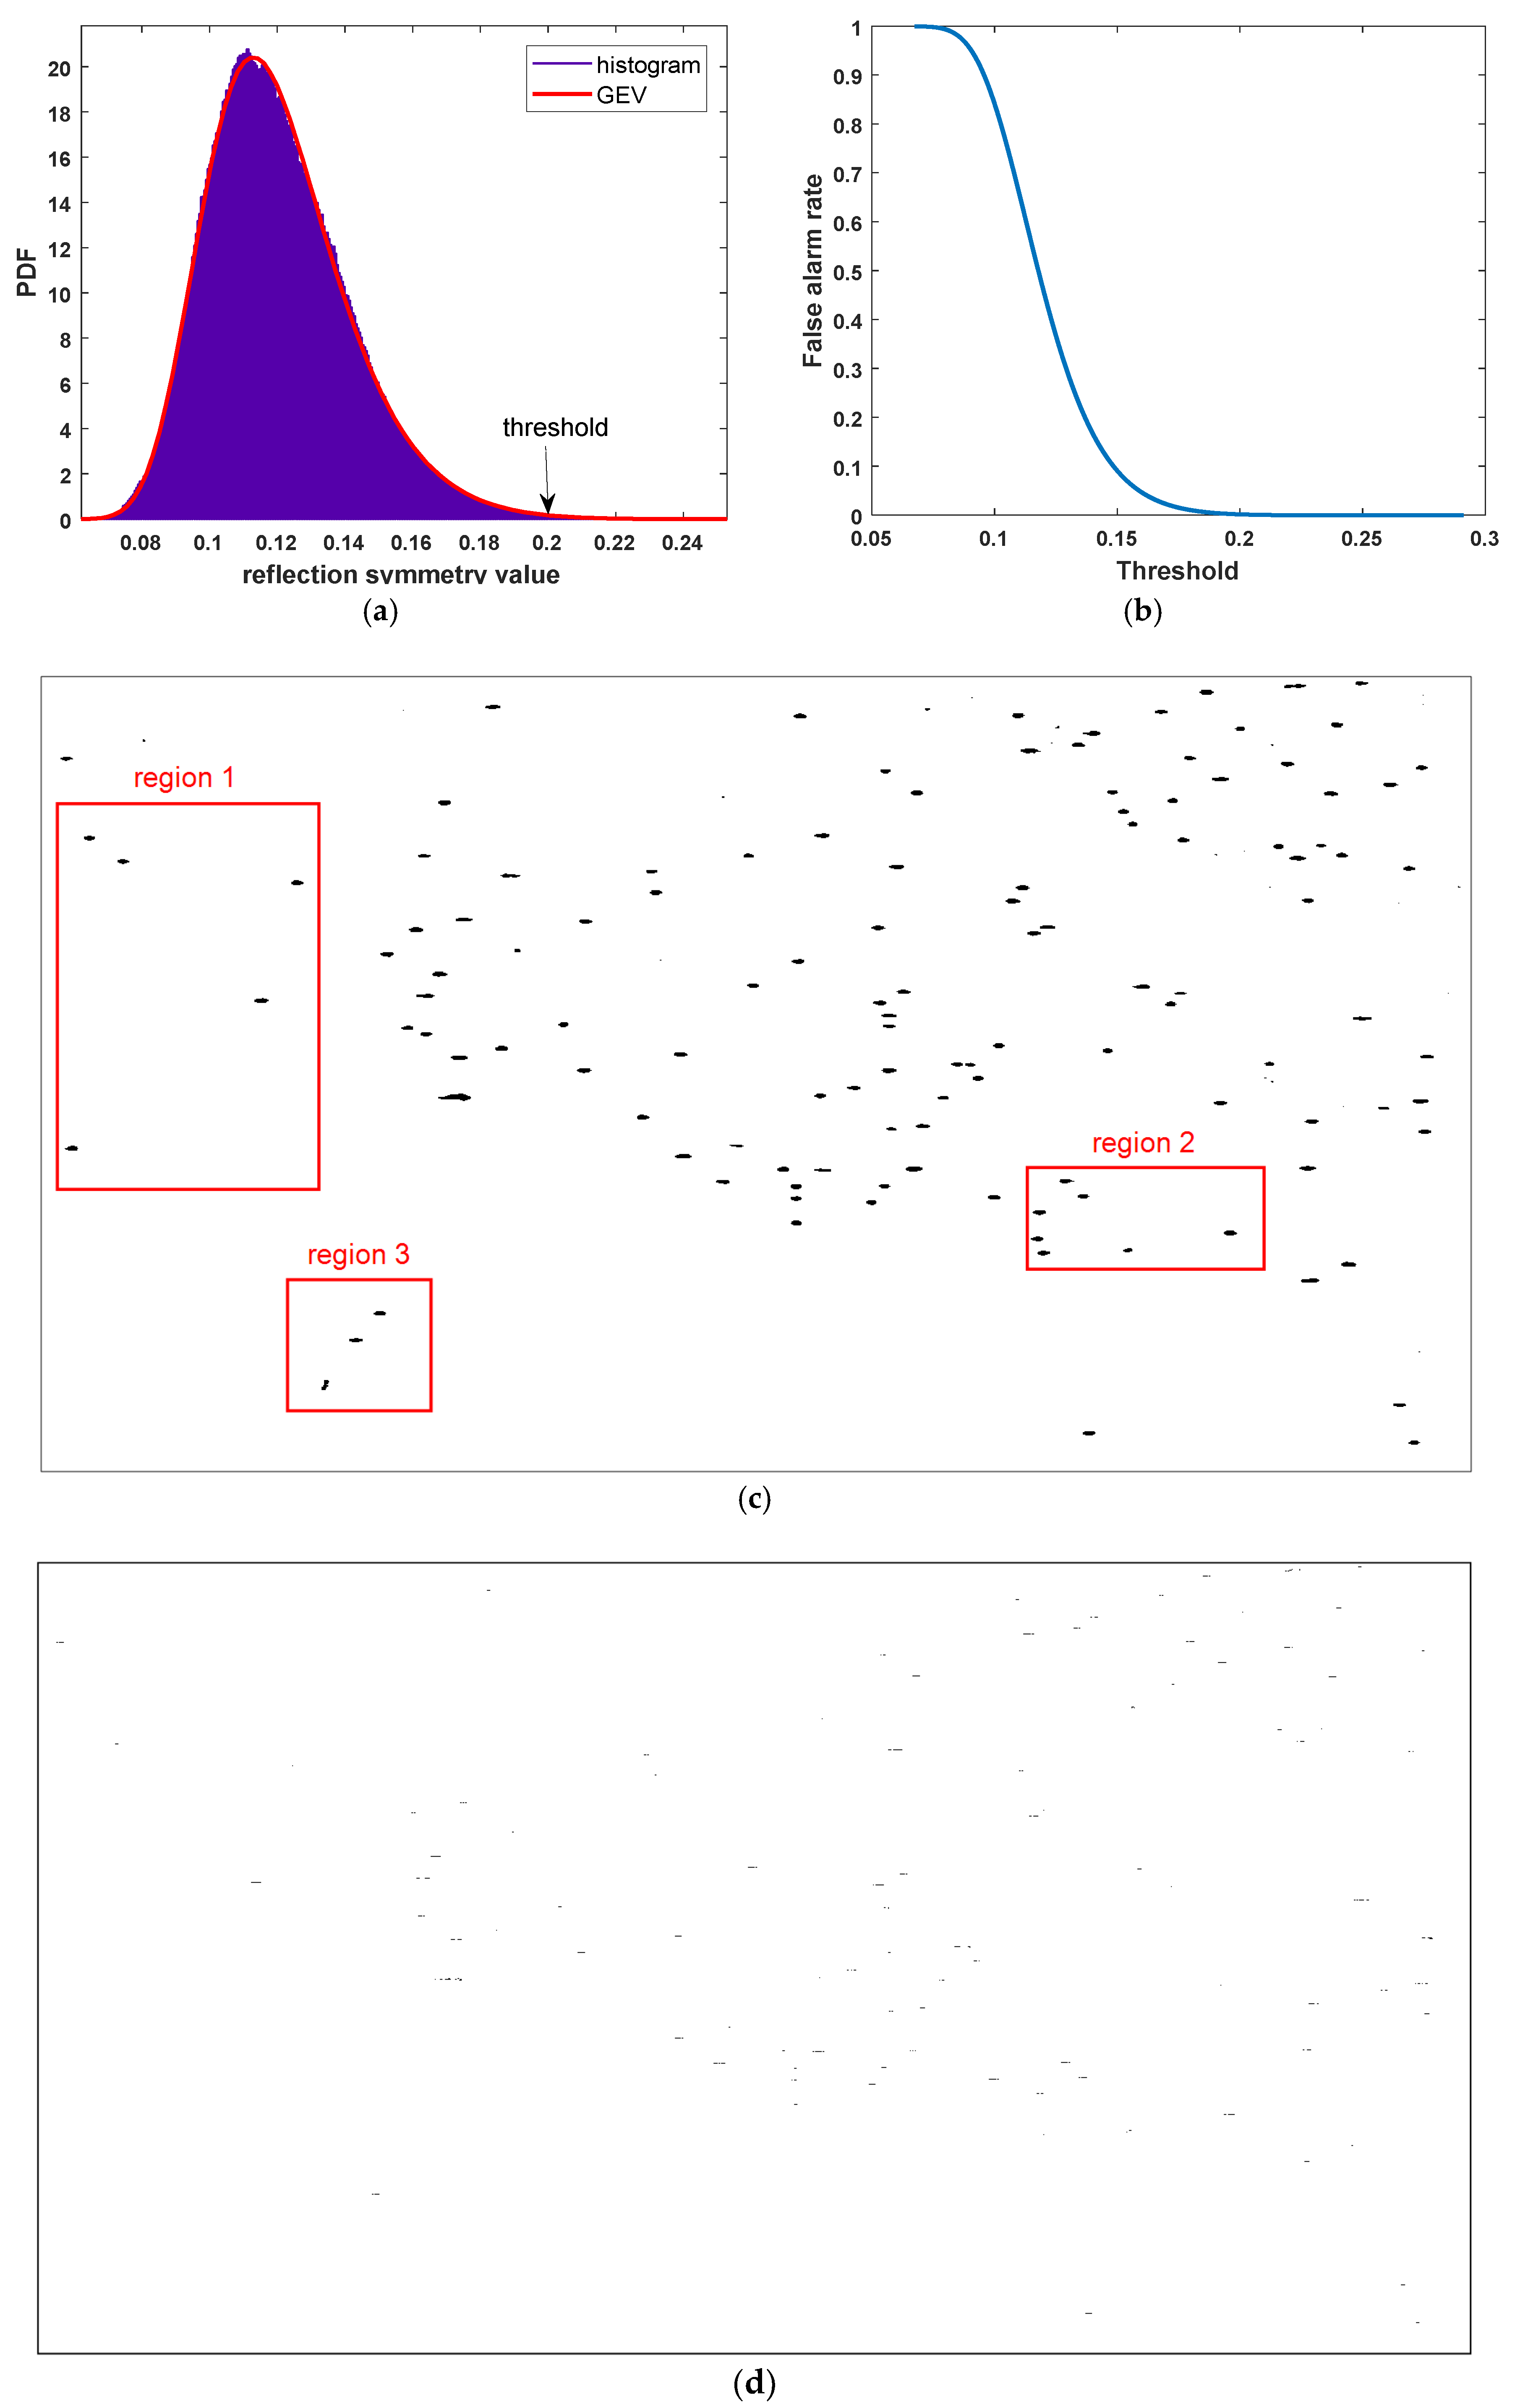
Data set 2, in Figure 2 in Section 2.2, is in VH/VV polarization under stripmap mode with the resolution at nearly 4.8m. Figure 7a shows the PDF of the normalized reflection symmetry of data set 2. By using MLE, the parameters in Equation (4) for the best-fitted GEV distribution are estimated as , and . By setting = 1 10−9, the threshold indicated in Figure 7a was achieved as T = 0.212. The curve in Figure 7b shows the relationship between false alarm rate and threshold. The corresponding detection result is obtained in Figure 7c. Considering many ship targets in the ocean scene in data set 2, the mean SCRs of the targets in three marked regions are estimated according to the detection result in Figure 7c. The mean SCR in region 1 are 6.6 dB for VH amplitude in Figure 2e, 6.2 dB for VV amplitude in Figure 2f and 22.8 dB for the reflection symmetry in Figure 2h. The mean SCRs in region 2 are 5.6 dB for VH amplitude, 6.2 dB for VV amplitude and 23.4 dB for the reflection symmetry. In region 3 the mean SCRs are 6.0 dB, 6.4 dB and 20.3 dB, respectively. It can be observed that the SCRs are greatly improved by using reflection symmetry. Hence, some submerged targets by the sea clutter in the three regions in Figure 2e,f can be observed in Figure 2h. Meanwhile, it can be found that the mean SCR of VH amplitude is close to it for VV amplitude.
The cross-pol VH CFAR detection result is as Figure 7d. Still the false alarm rate are all set as 1 10−9 in Figure 7. Obviously, with the same false alarm rate, all the ship targets can be detected by using the reflection symmetry, as the contrast between the targets and the ocean clutter is greatly enhanced. However, only a few targets are detected by using the co-pol and cross-pol images with the same false alarm rate = 1 10−9. For further investigation, the detection results are compared in the form of ROC, as the curves illustrated in Figure 6b. Setting different false alarm rates from 1 10−9 to 1 10−1, the corresponding detected rates Pd are obtained as shown in Figure 6b. In Figure 6b, the proposed detection method keeps the 100% detection rates from = 110−9 to = 1 10−1. But VH and VV detection rate Pd drops quickly with the decreasing of false alarm rate . In Figure 6b, the VV CFAR detection rate is quite close to the VH CFAR detection, which is in accordance to the SCR estimations, viz. the SCRs for VH and VV are not quite different.
3.2. Experiment on Low-Sea State Data
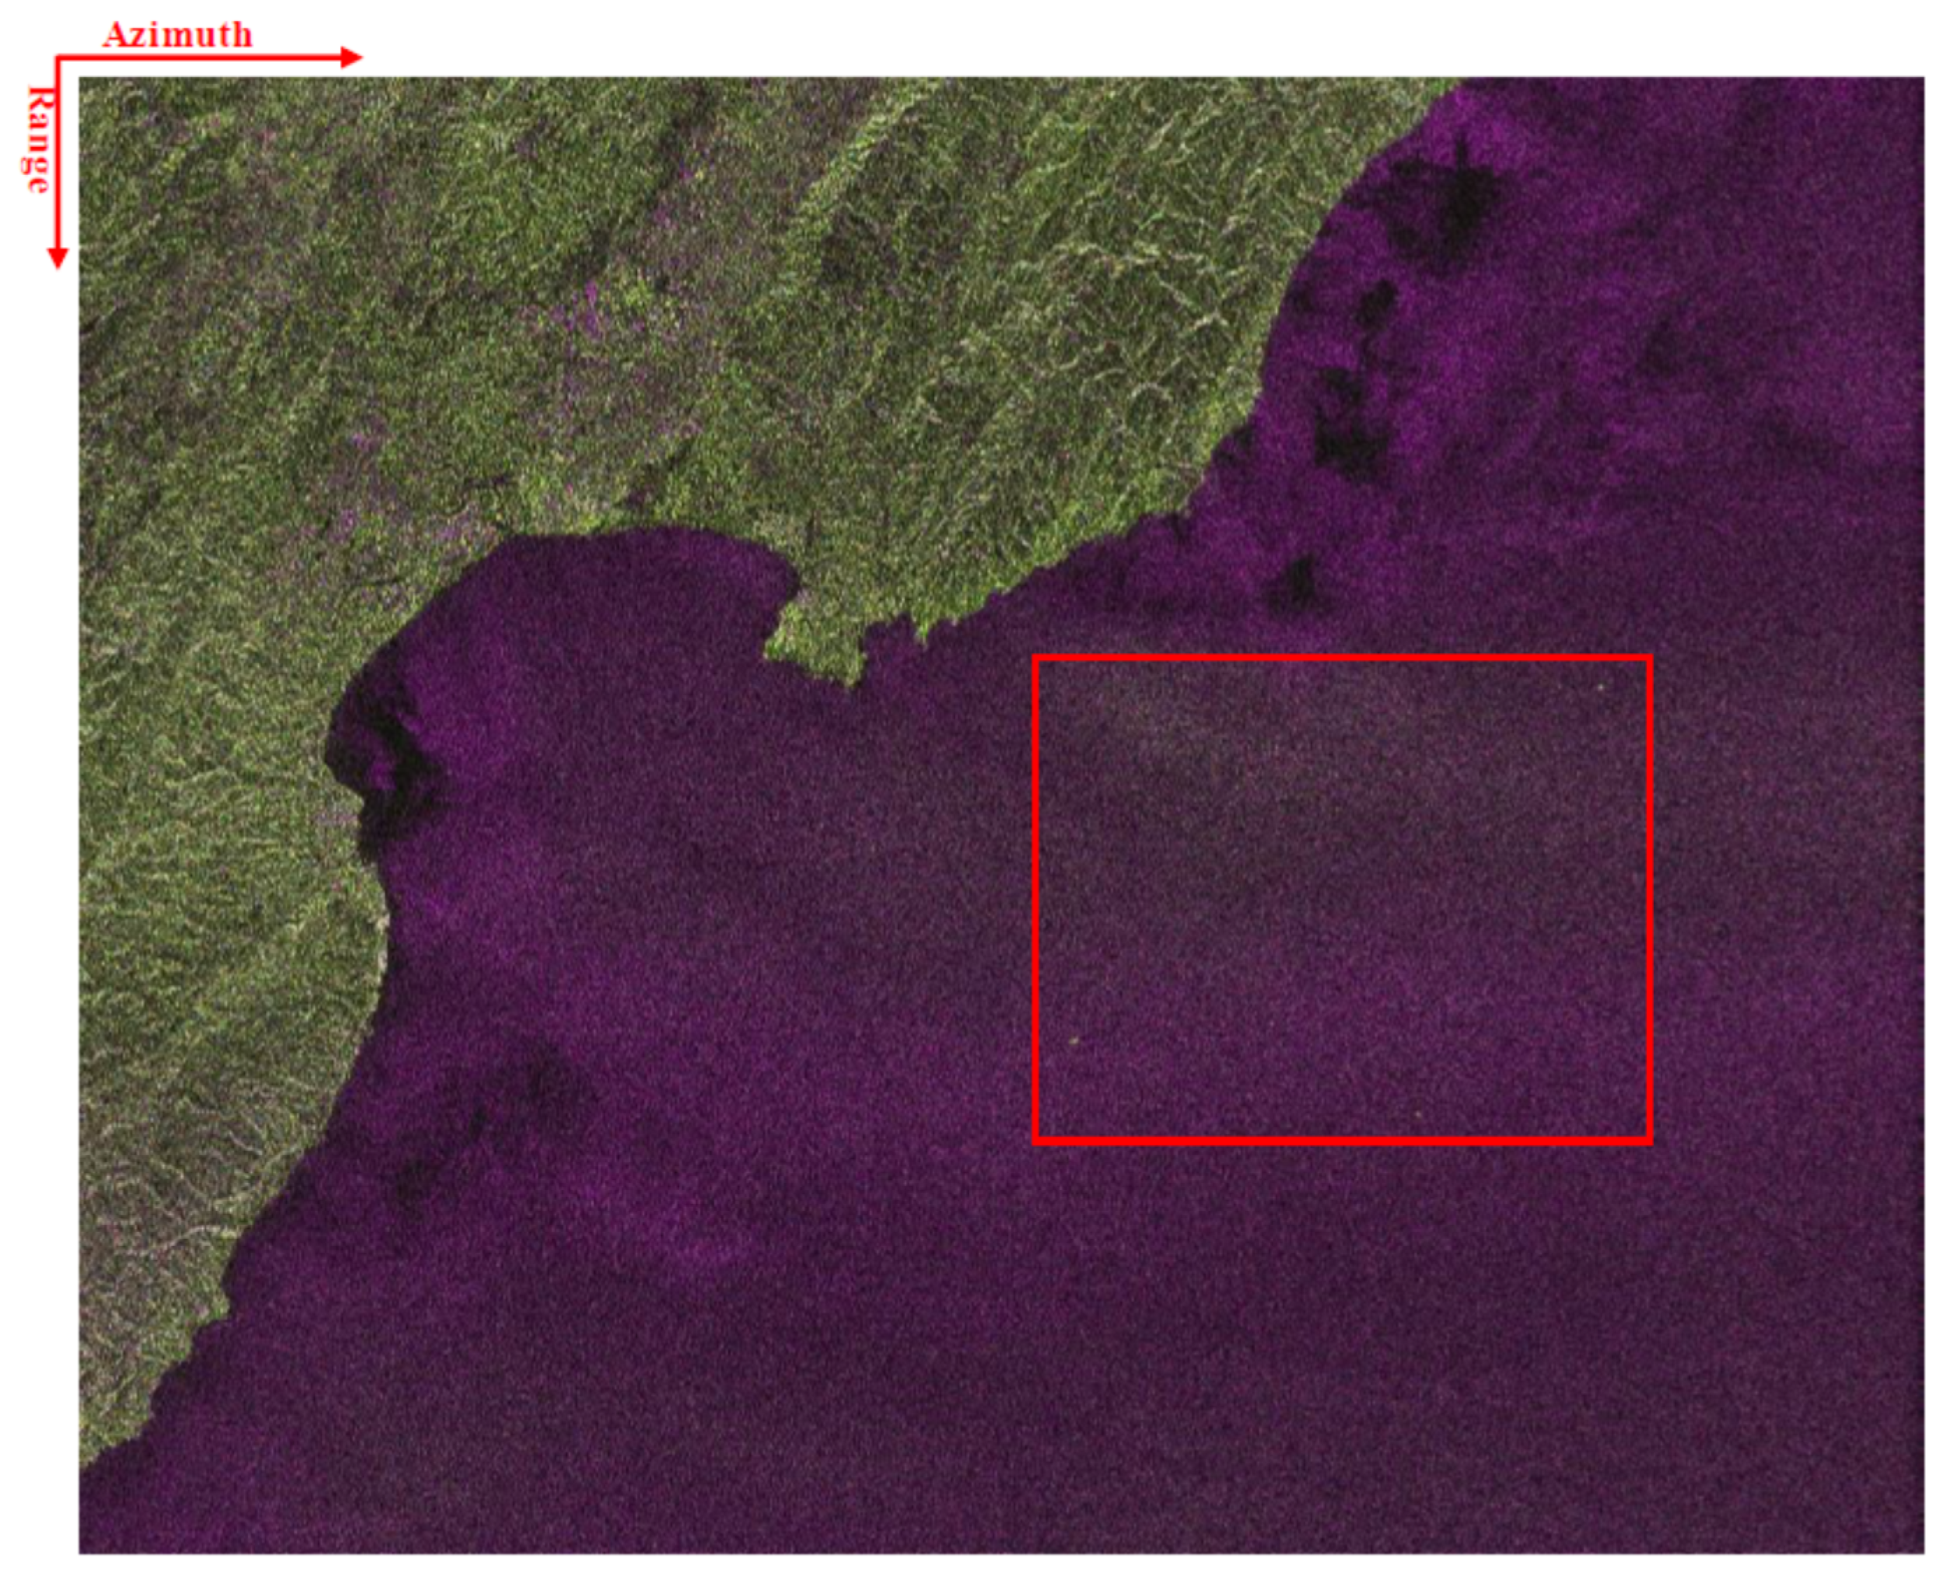
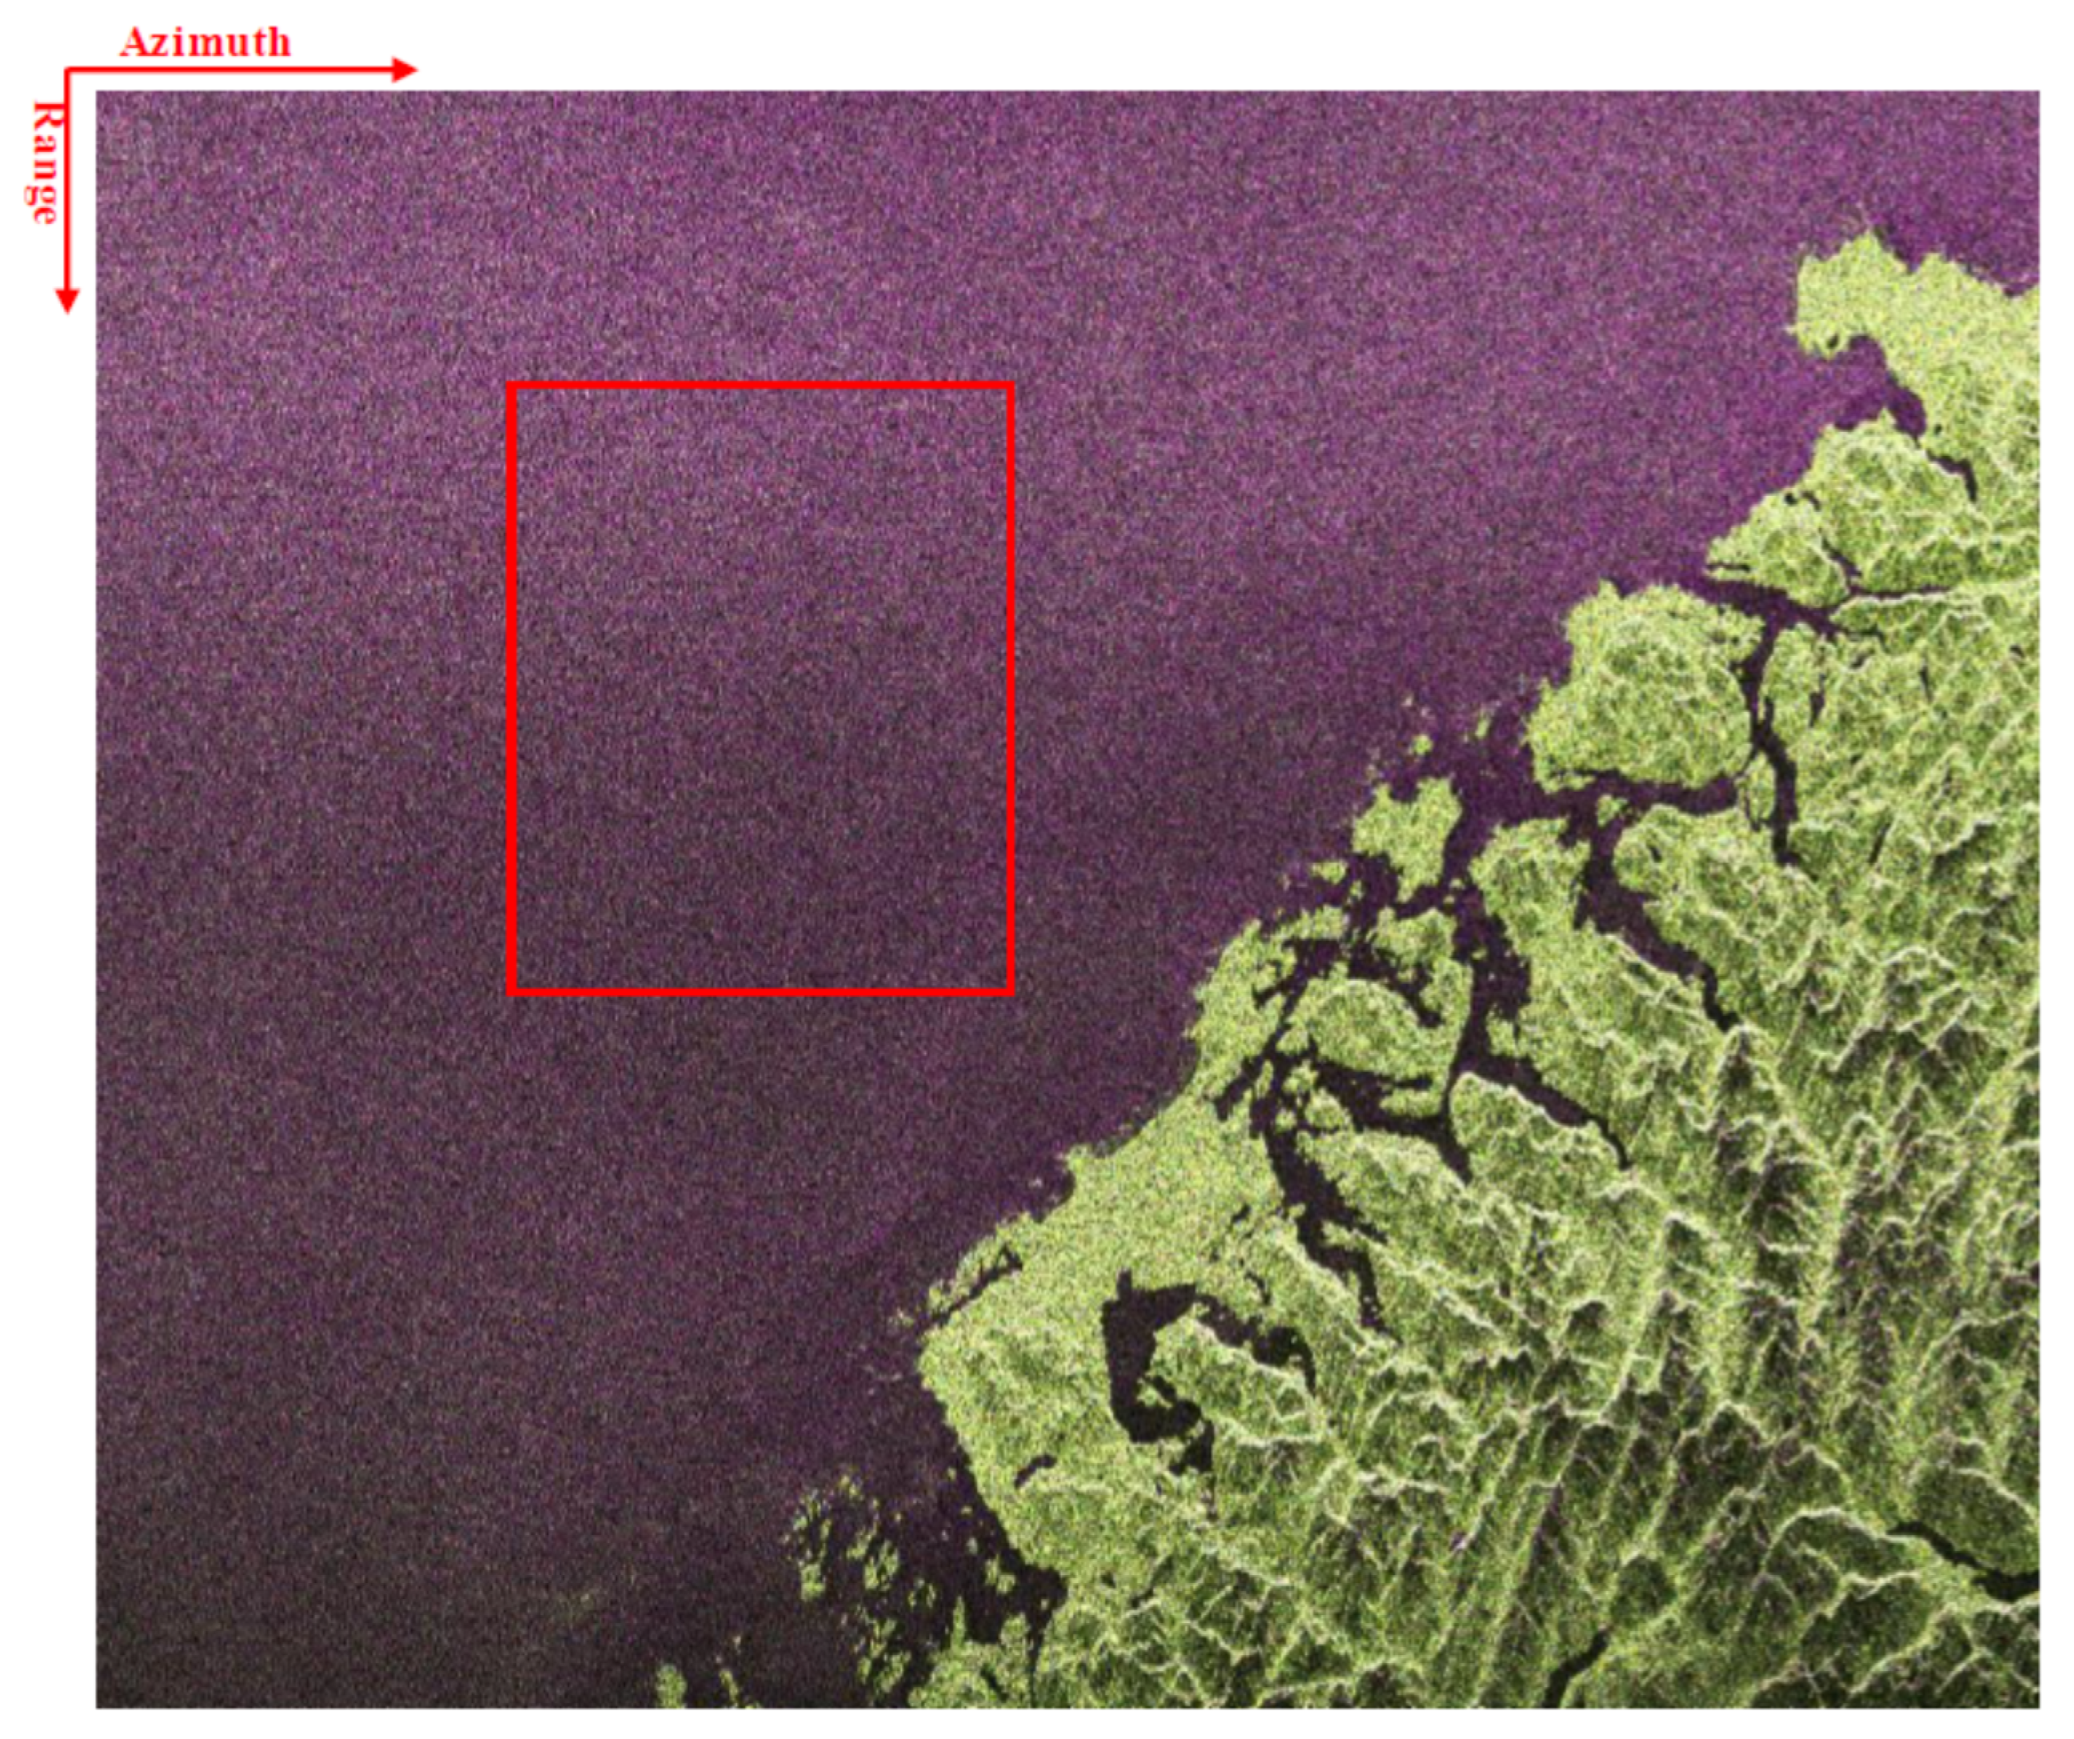
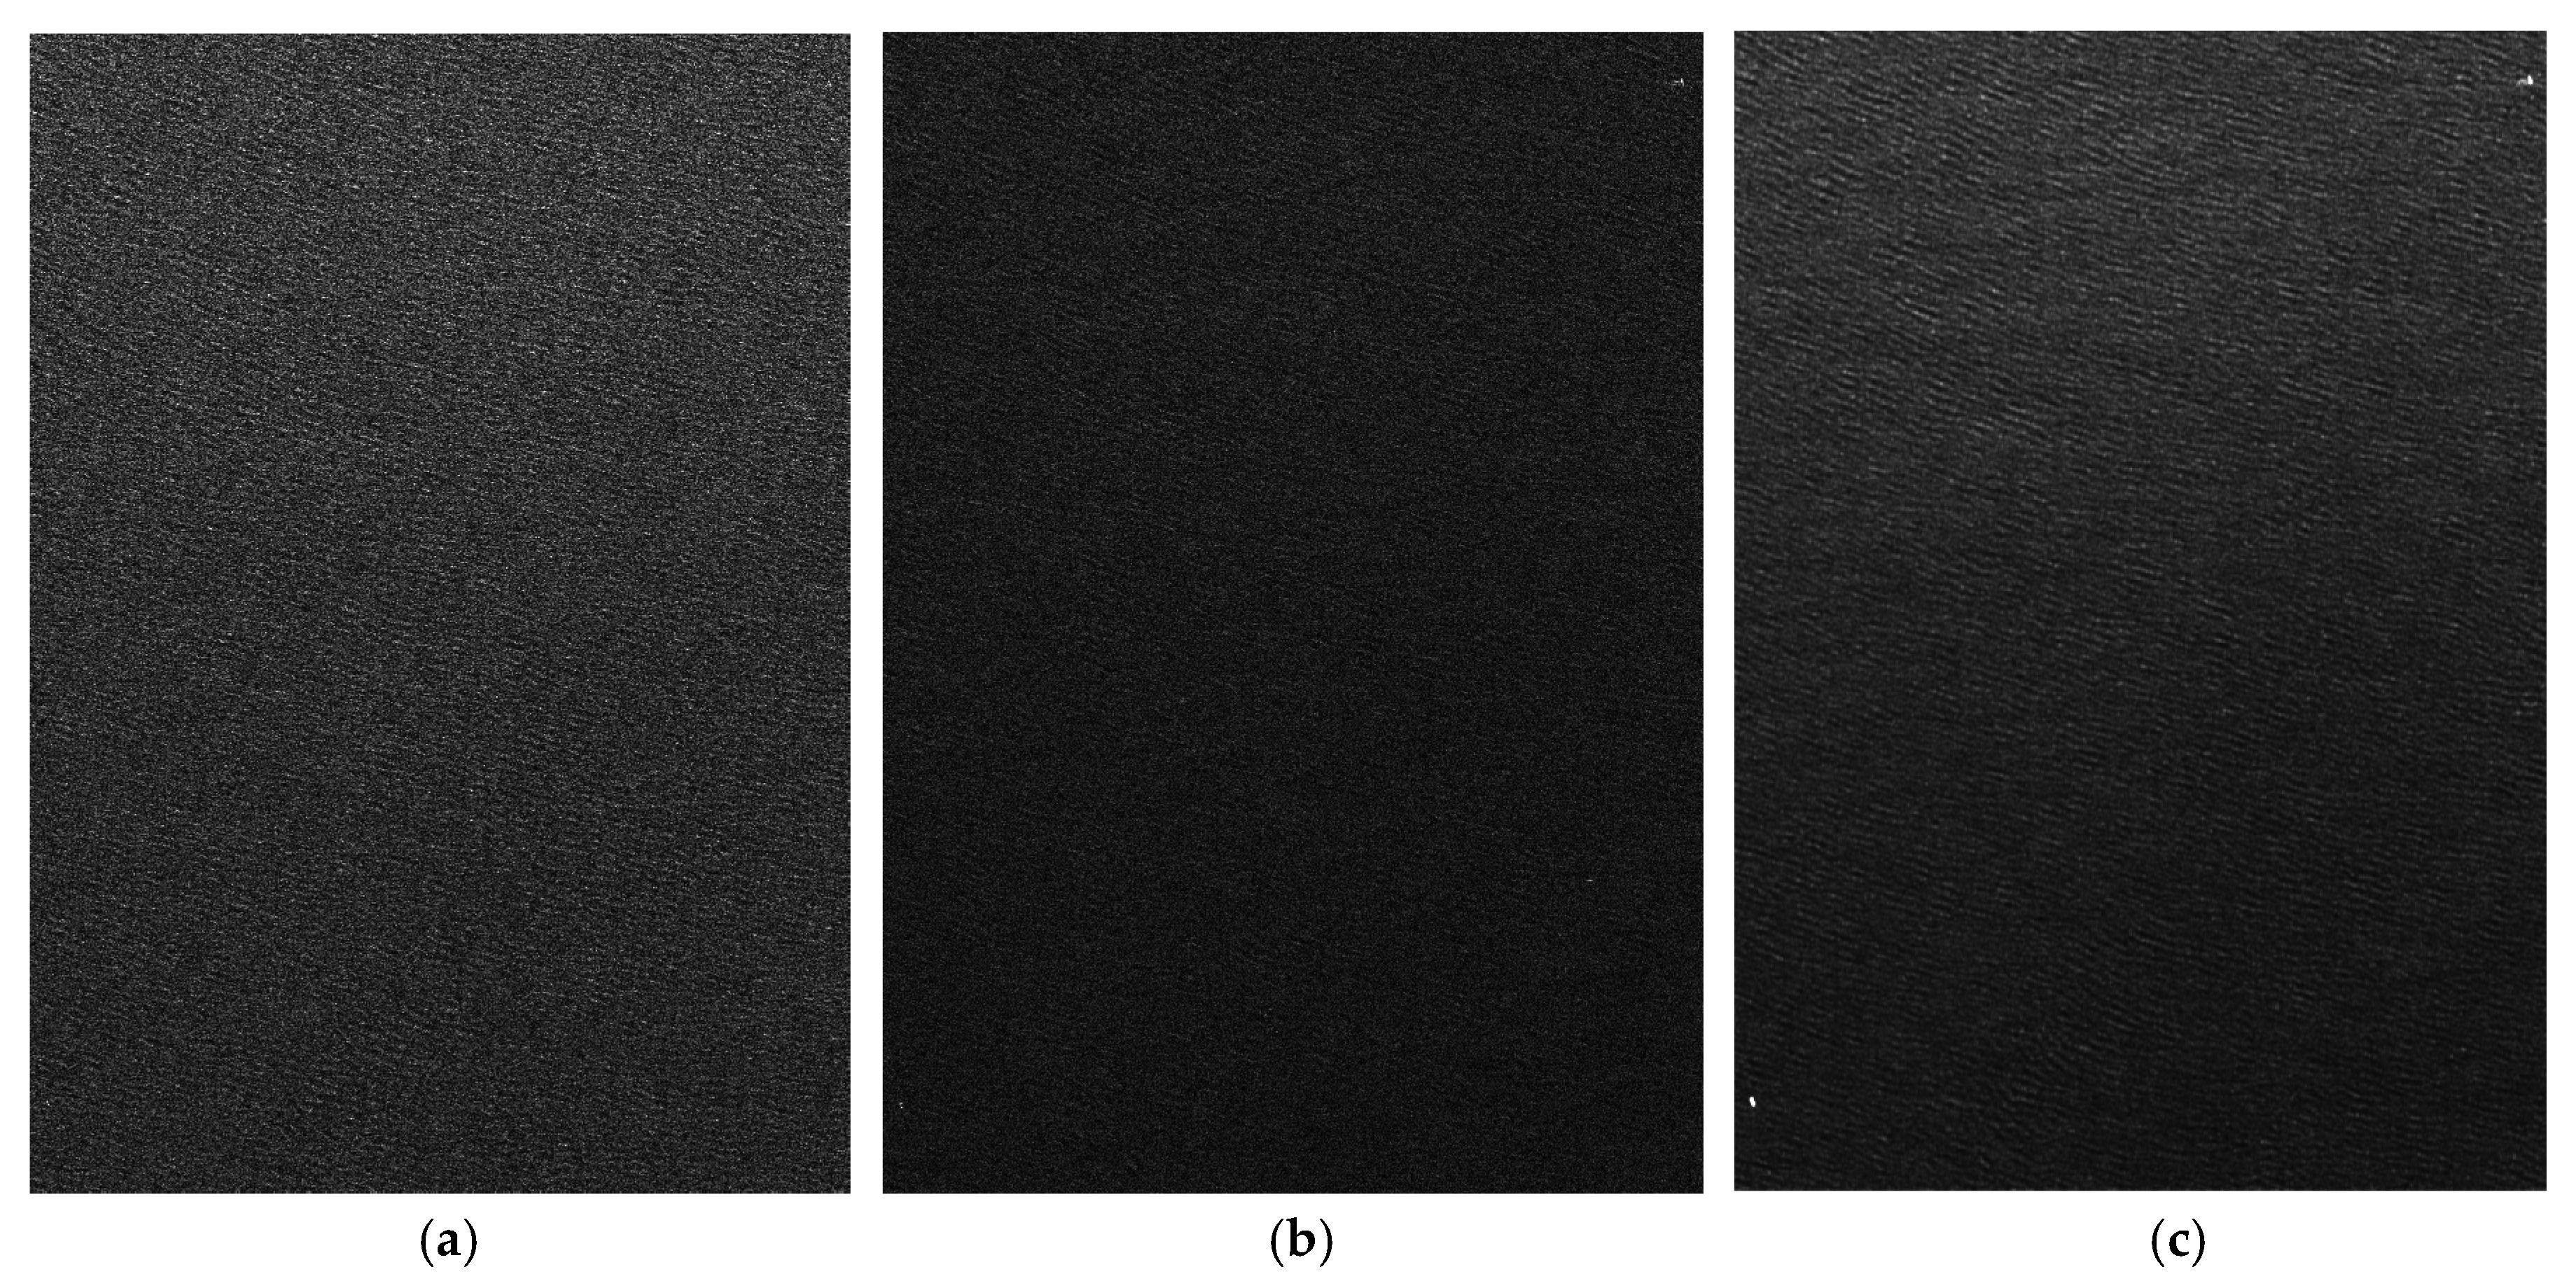
Figure 8 is the pseudo color image of the Pacific Ocean near the state of California, USA. The pseudo color image is composed by two polarization VH and VV data. More detailed parameters are listed in Table 3. From Figure 8, the ships can be observed in the ocean in the pseudo color image. The region with ocean ships is marked with the red rectangle in Figure 8. In addition, this region is enlarged in Figure 9. The enlarged ocean region has 7000 9000 pixels. Figure 9 illustrates the VH amplitude, VV amplitude, reflection symmetry metric image, polarimetric entropy, polarimetric scattering angle and the GEV model-based detection result. To be noticed, the PCE for dual-polarimetric ocean data is tested to be not suitable when applying it to both the low- and high-sea state data.
In Figure 9, the contrast between the targets and the sea surface of the VH amplitude is much higher than that of the VV amplitude. Three targets can be identified in the image of VH amplitude, while the targets are completely covered by the sea clutter in the image of VV amplitude. On the whole, the reflection symmetry metric increases the contrast between the sea clutter and the target, making the target easier to identify. The SCR of traditional polarimetric entropy and polarimetric scattering angle are both lower than that of the VH amplitude. Meanwhile, for the VH/VV dual polarimetric data, the polarimetric scattering angle seems much more reliable than the polarimetric entropy for identifying targets on the ocean surface comparing Figure 9d,e, which implies that the polarimetric scattering angle can be explored for target observations at sea under the low-sea state in future research.
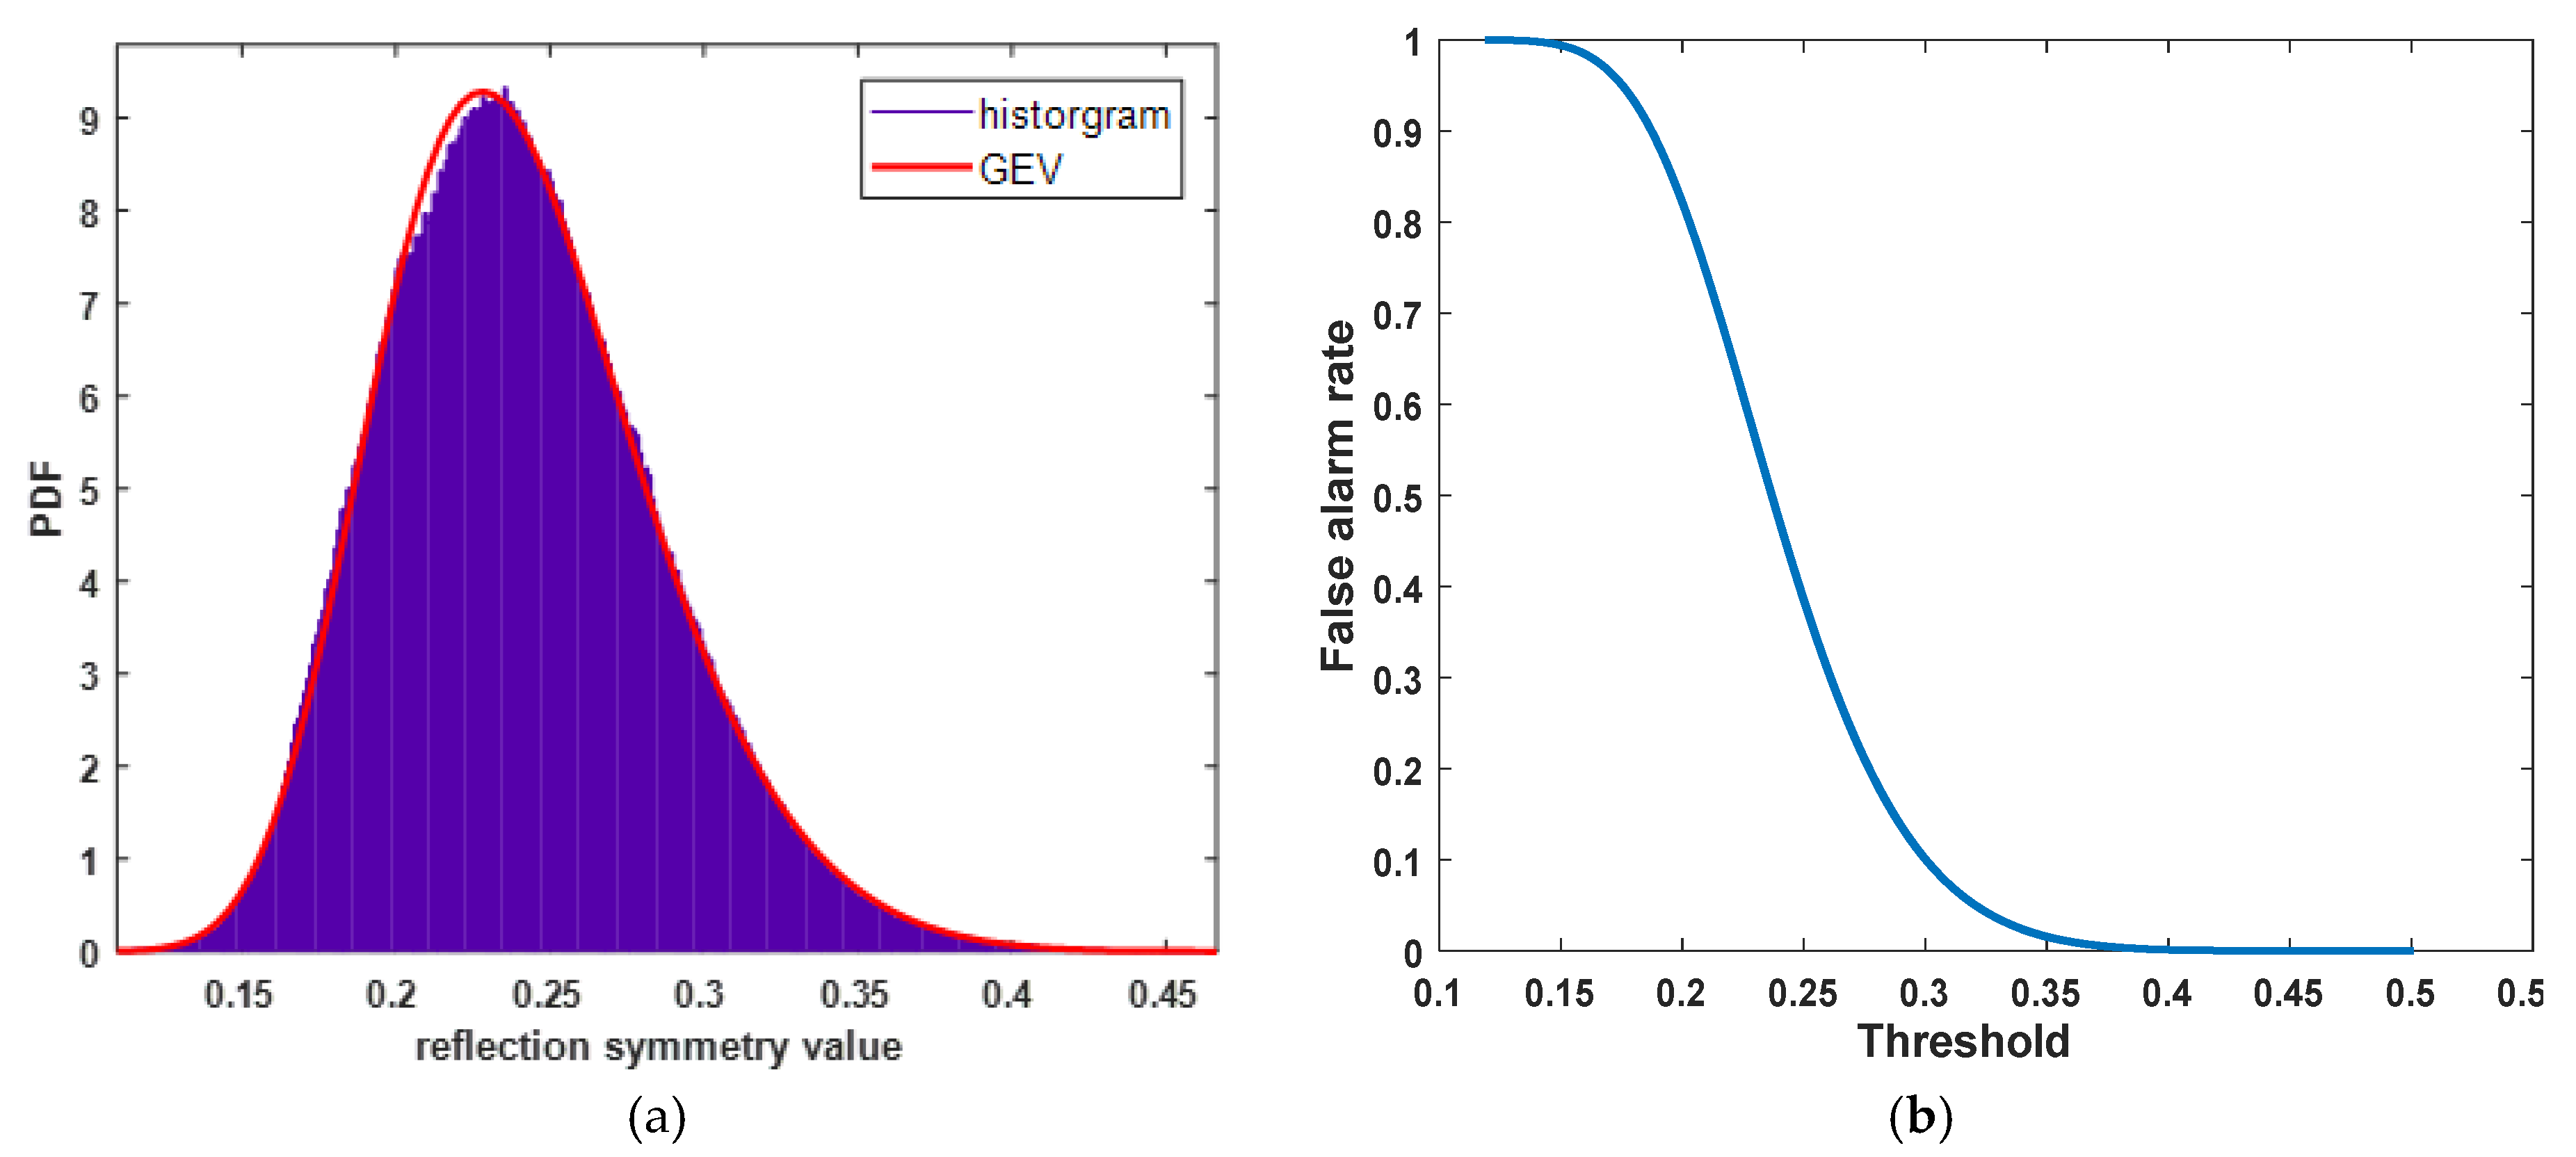
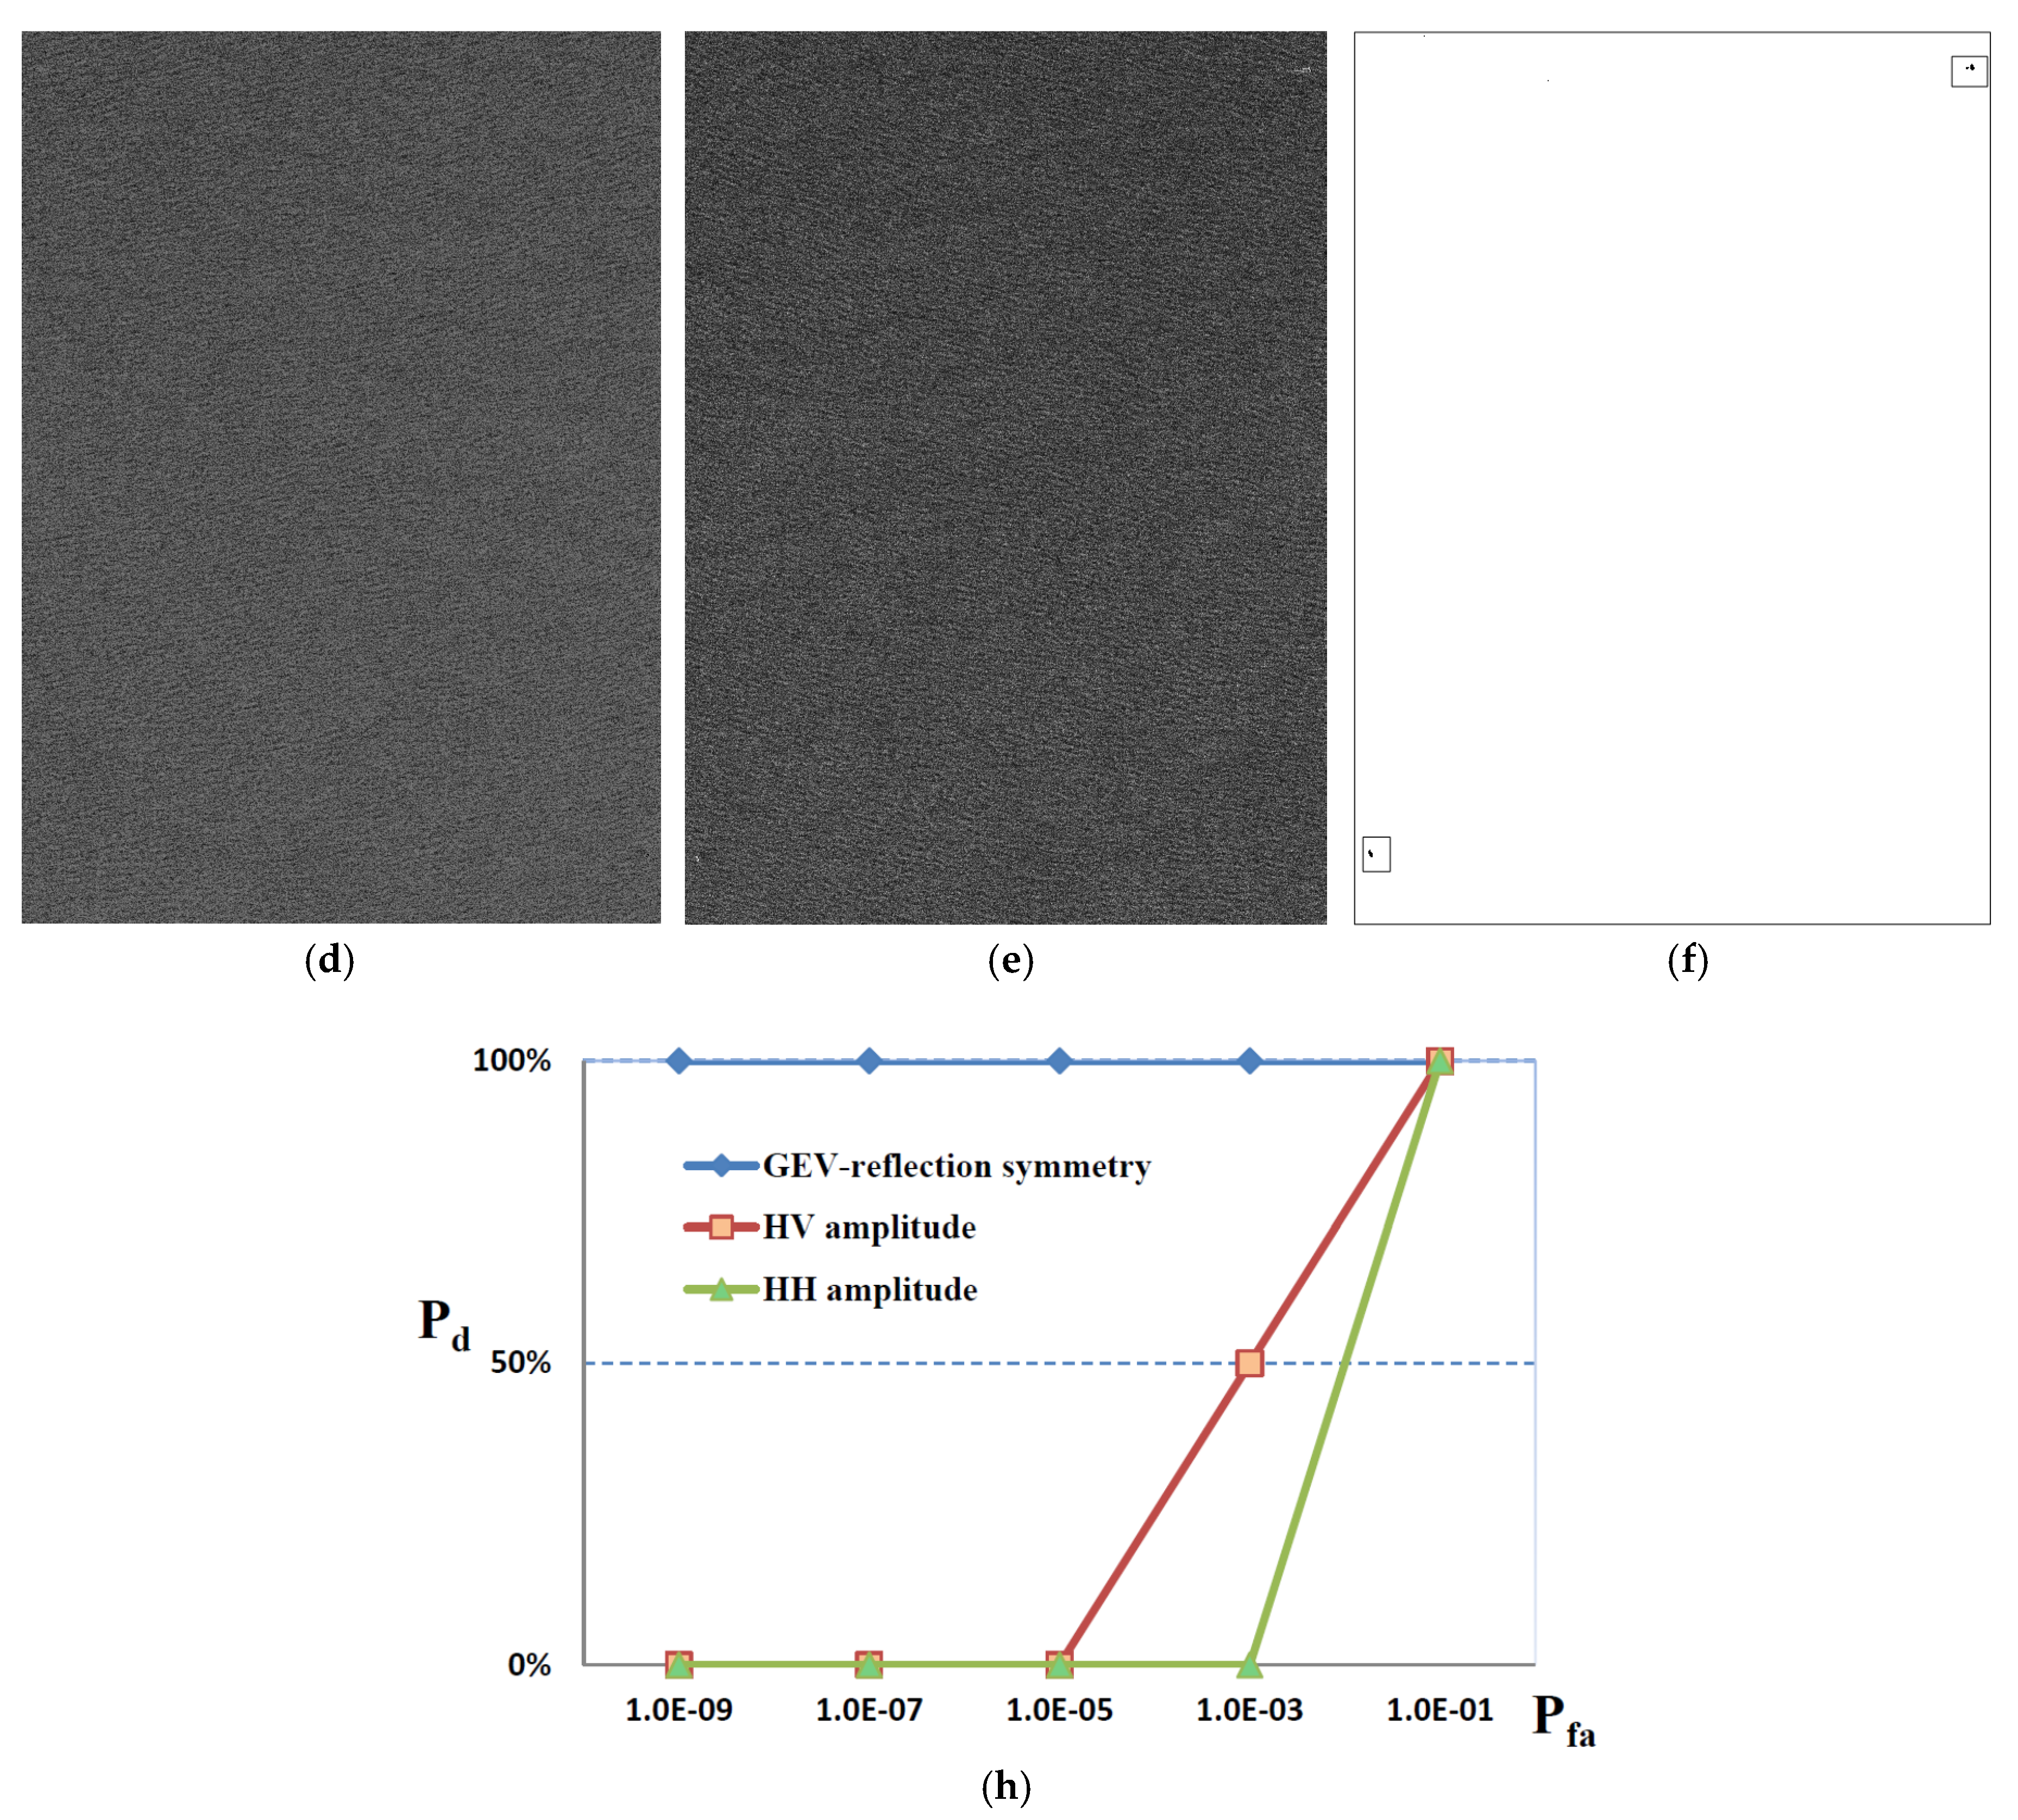
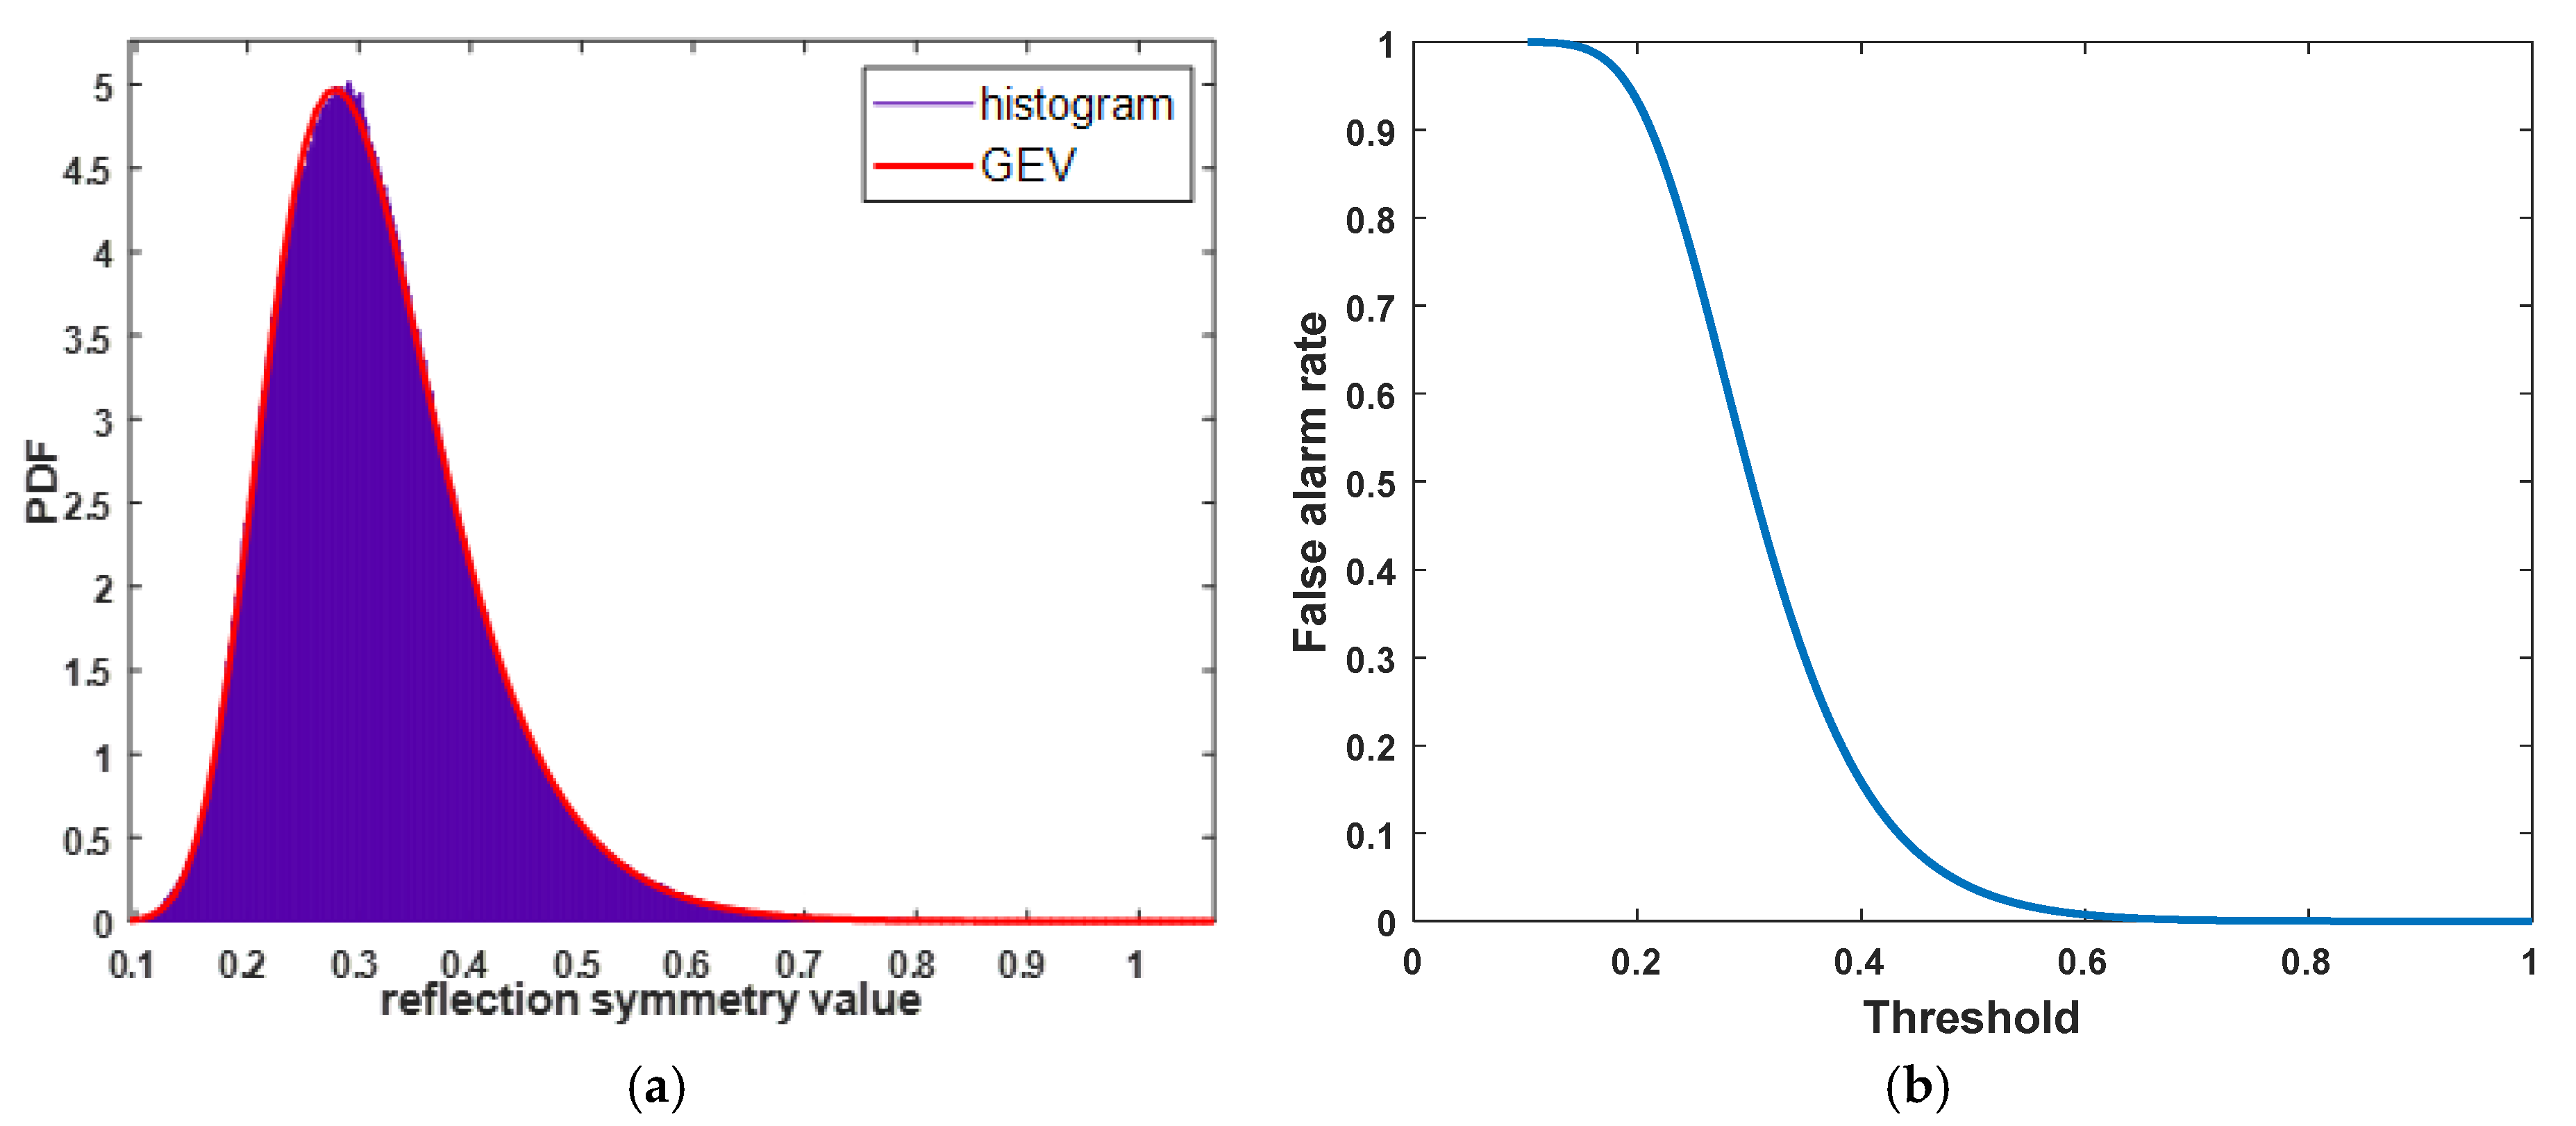
Figure 10a gives the PDF of the normalized reflection symmetry metric of Figure 9c, and the MLE yields to the best-fitted GEV distribution with , and . It is obvious that the GEV distribution fits the PDF well. By setting = 0.0005, the threshold was obtained as T = 0.3716, and the corresponding detection result is shown in Figure 9f with the three detected ship targets. In addition, the curve in Figure 10b is the relationship between false alarm rate and threshold. The detection result is still compared with the VH and VV CFAR detection results in the form of ROC curves in Figure 9g by using the false alarm from 1 10−9 to 1 10−1. Benefitting from the contrast enhancement by using reflection symmetry, all of the three ship targets can be detected under different false alarm values. Additionally, by using the VV amplitude, none of the targets are detected even when the false alarm was set as 1 10−3, which implies a low SCR for VV polarization.
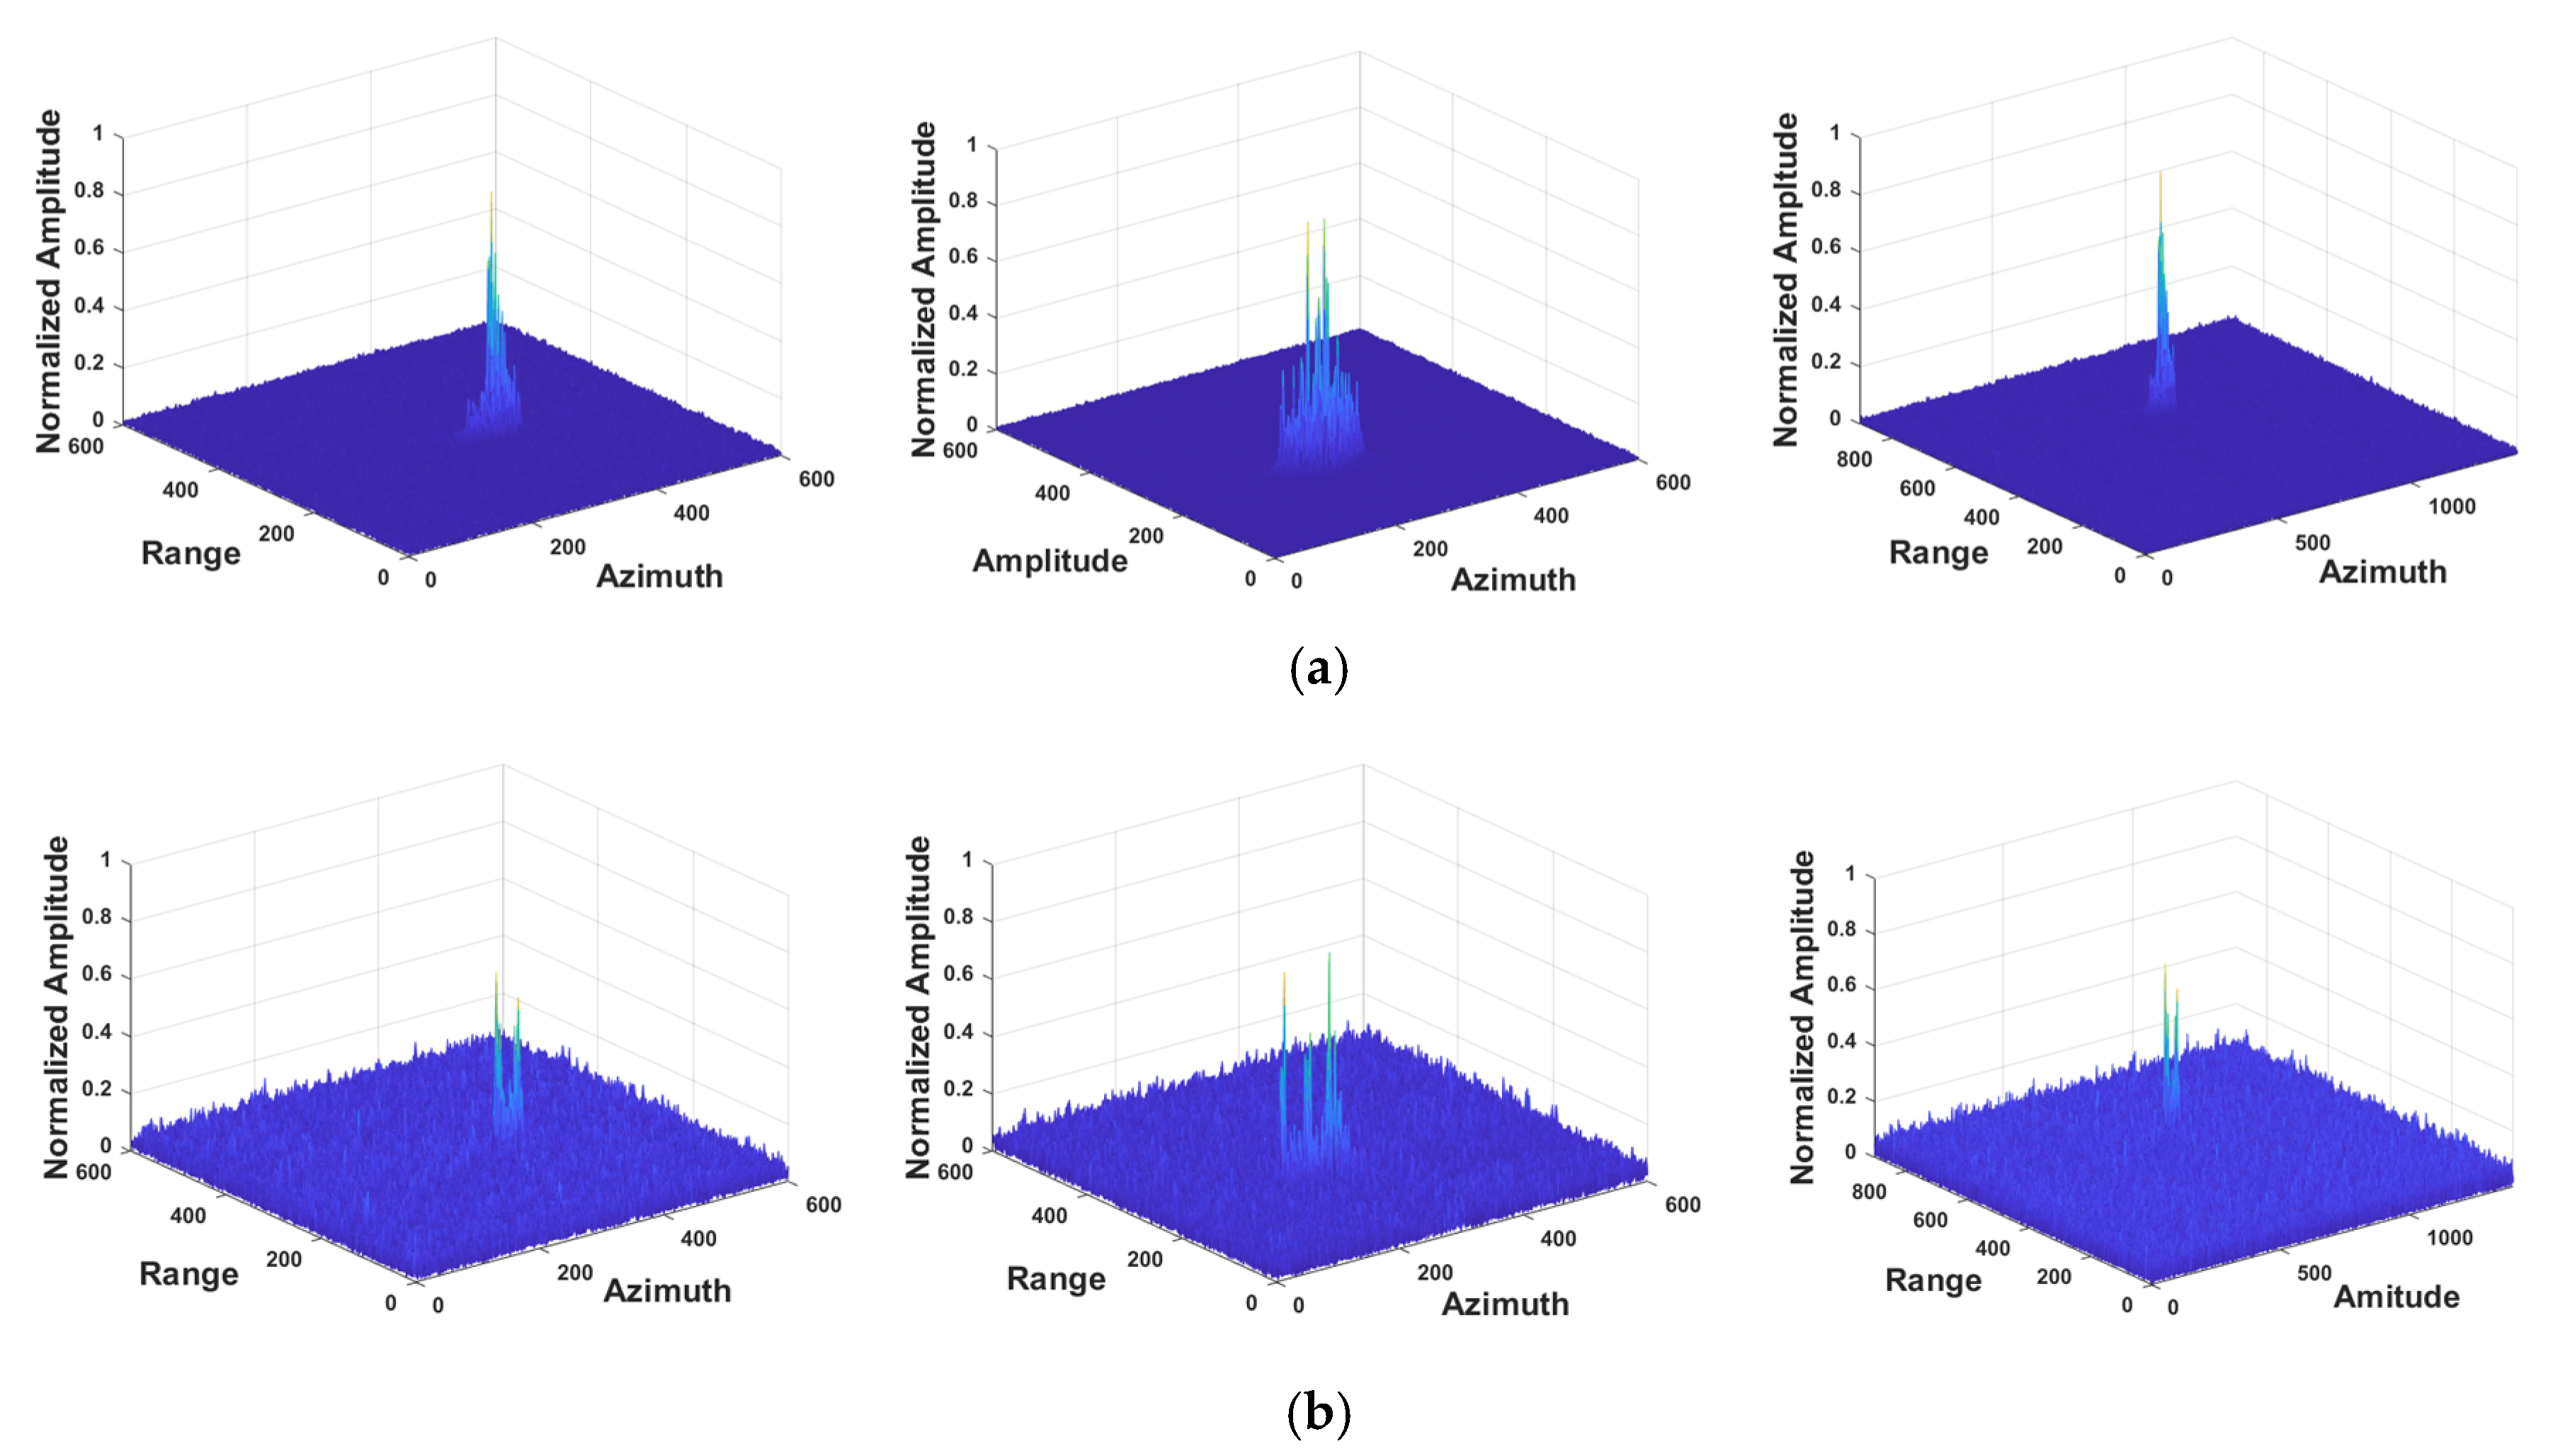
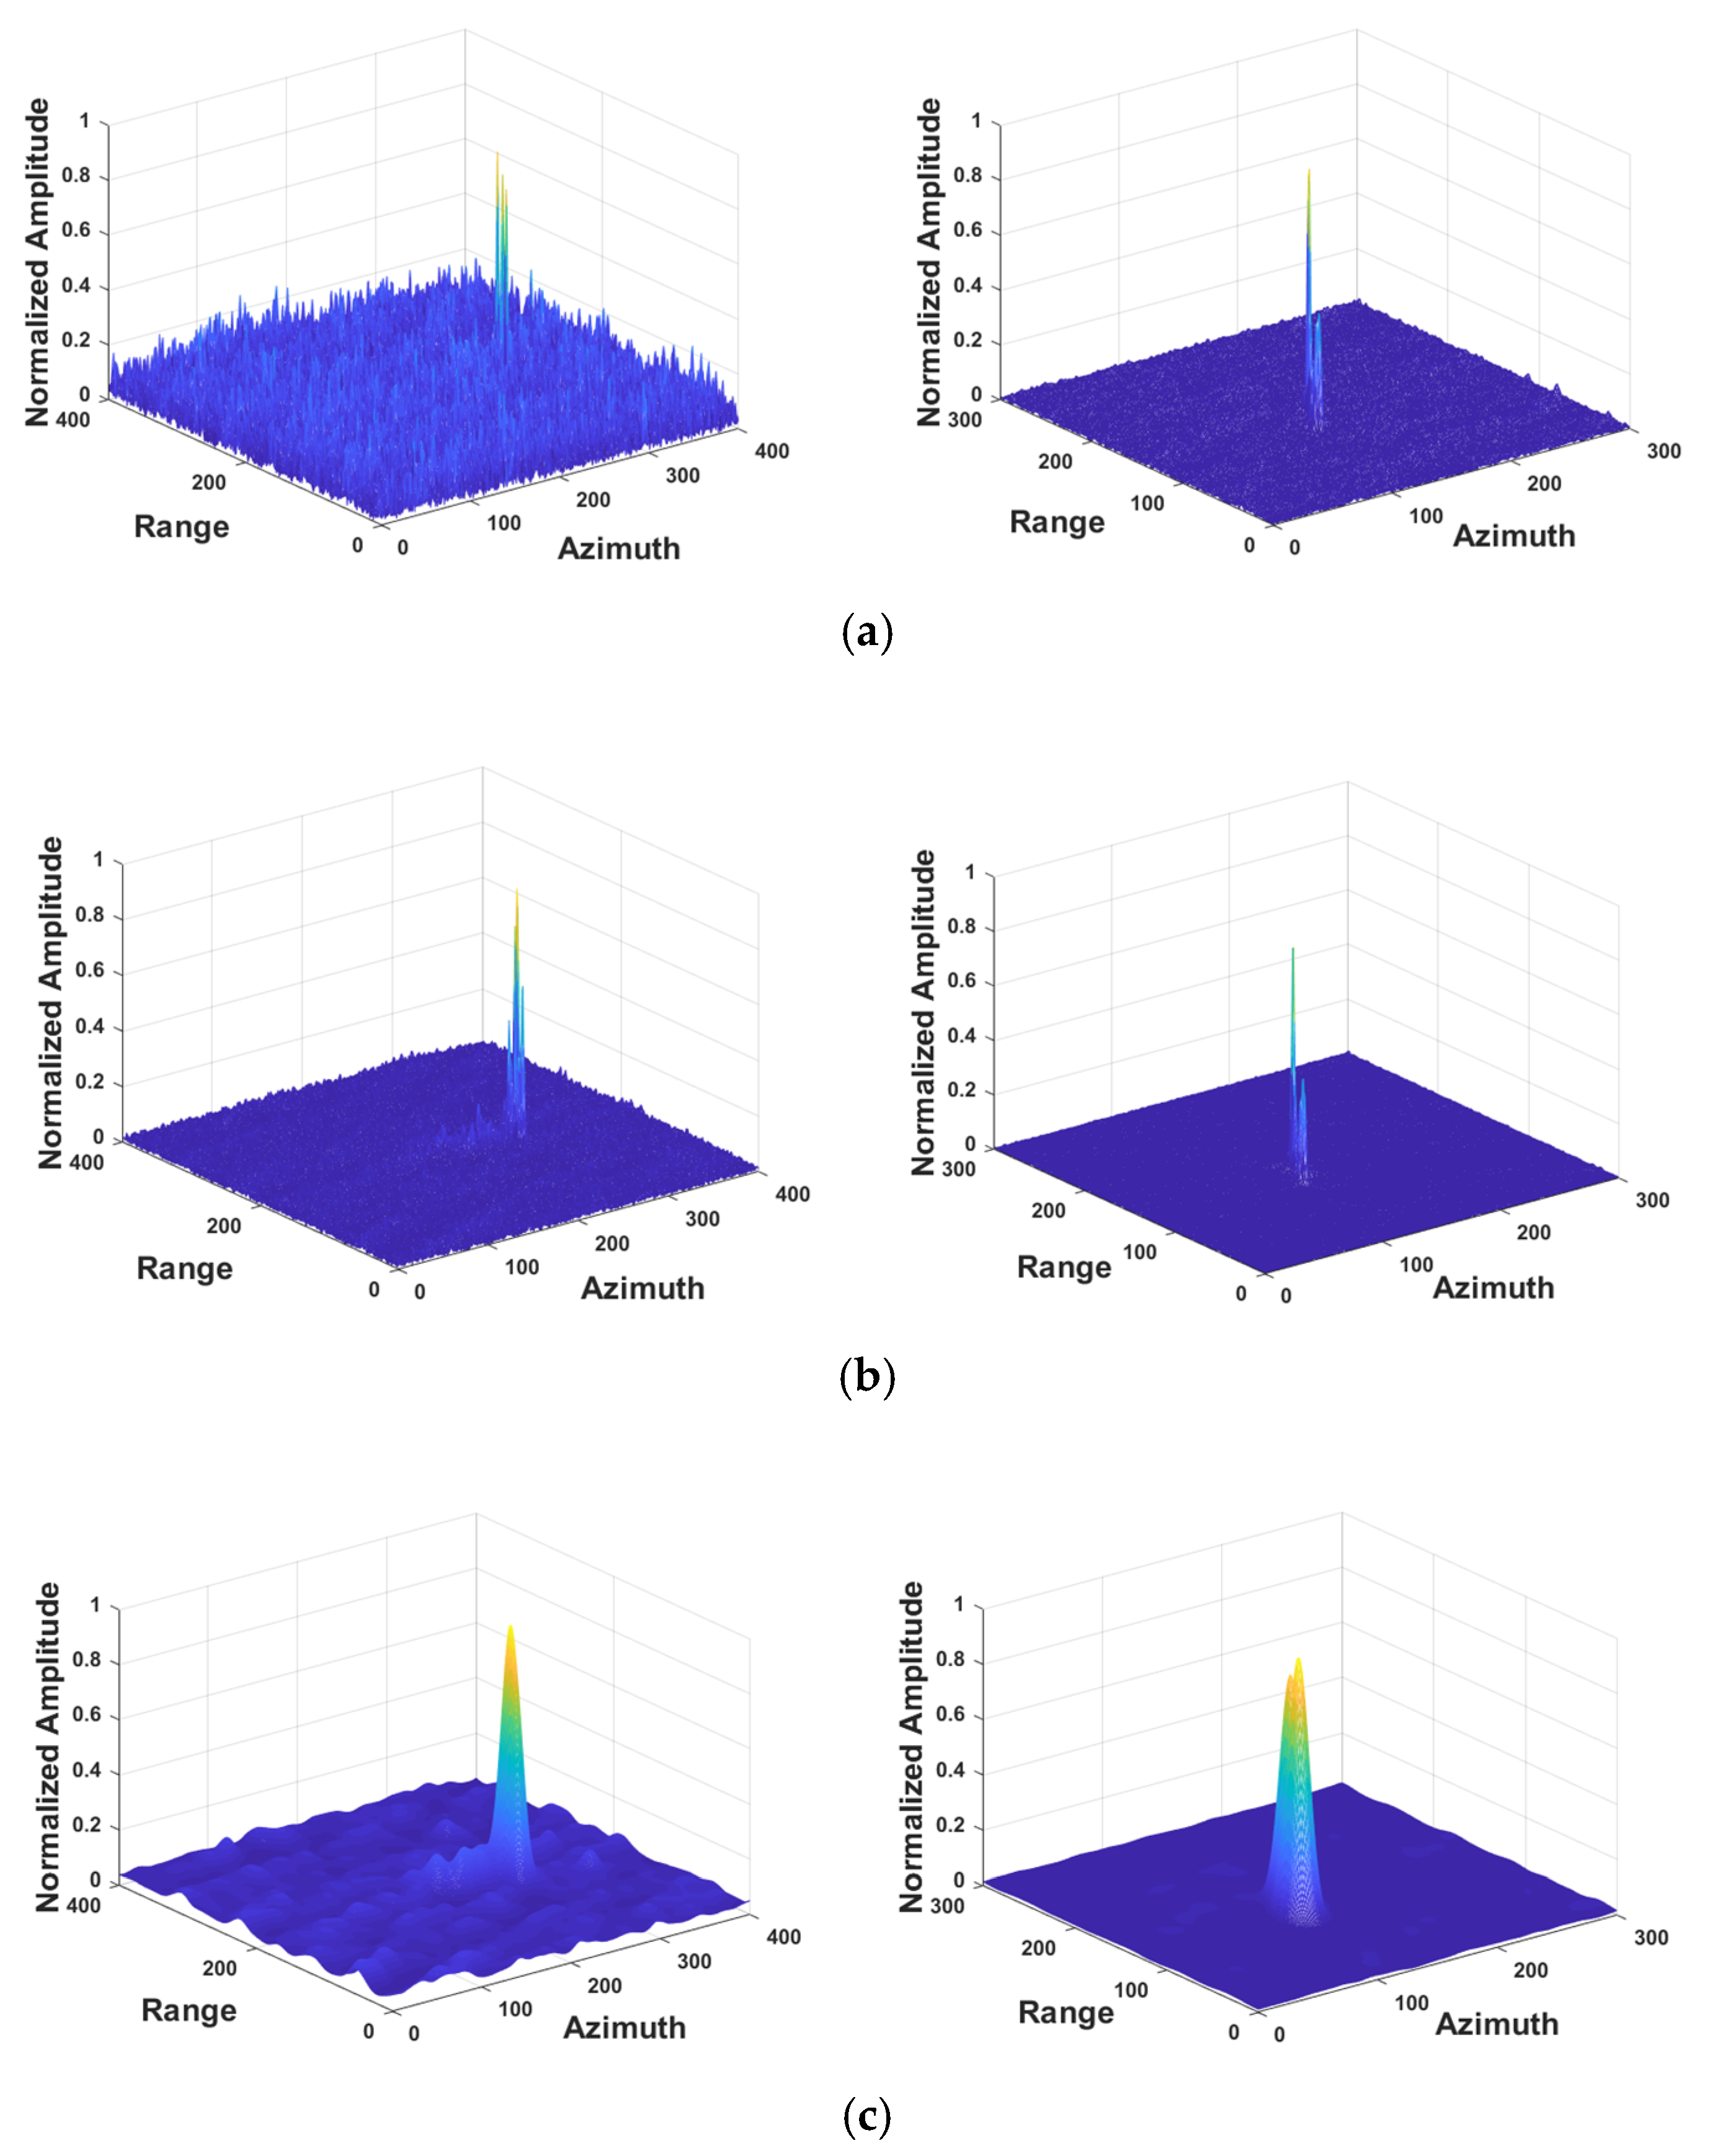
For details, the normalized amplitude of the three detected targets in VH, VV and reflection symmetry metric are illustrated in Figure 11a–c, respectively. In Figure 11, the three sub-figures in one column relate to one ship target. The ocean clutter around the targets are deeply suppressed in the reflection symmetry metric image of Figure 11c, especially comparing to the sea clutter in VV amplitude image. Meanwhile, the target energy become concentrated due to the averaging operation during the reflection symmetry computation. It is also observed that under the low-sea state the sea clutter become quite flat in the reflection symmetry image. Hence, it becomes much easier to detect the ship target at sea by using the reflection symmetry metric. Table 4 gives the SCRs of the three targets in VH, VV, reflection symmetry metric, polarimetric entropy and polarimetric scattering angle image. Comparing these SCRs, the consequence should be γ > VH > α > VV > H, which is consistent with the observation results in Figure 9.
3.3. Experiment on High-Sea State Data
Figure 12 is the pseudo color image of the Pacific Ocean near the Flores Island of British Columbia Canada. The pseudo color image is composed by two polarization HH and HV data. More detailed parameters are listed in Table 5. The region with ocean ships is marked with the red rectangle in Figure 8. The enlarged ocean region has 7500 5400 pixels. Figure 13 illustrates the HH amplitude, HV amplitude, reflection symmetry metric image, polarimetric entropy, polarimetric scattering angle and the GEV model-based detection result.
In Figure 13a,b, visually it is quite difficult to identify any targets at sea from either the co-polarization HH or the cross-polarization HV under the high-sea state. However, the ship targets are visible in the reflection symmetry metric image in Figure 13c. Comparing to the original single-look complex HH and HV amplitude, the reflection symmetry metric is obviously better in ocean target detection. The polarimetric entropy and polarimetric scattering angle from the dual-polarimetric data are also supplied as Figure 13d,e, respectively. Under the high-sea state, no target can be intuitively viewed neither in the polarimetric entropy image nor in the scattering angle image.
Figure 14a gives the PDF of the normalized reflection symmetry metric of Figure 13c, and the MLE yields to the best-fitted GEV distribution with , and . The GEV statistical model is well fitted to the histogram of the normalized reflection symmetry metric image. By setting = 0.005, we get the threshold T = 0.6233 and the corresponding detection result is as shown in Figure 13f. In addition, the curve in Figure 14b is the relationship between false alarm rate and threshold. Figure 13g illustrates the detection result comparison in forms of ROC curves by using the false alarm from 1 10−9 to 1 10−1. The GEV-based CFAR detector on reflection symmetry keeps good detection rate as before. Additionally, only when the false alarm is 1 10−1, both of the two ship targets can be detected by using the HV/VV amplitude, which reveals that the SCRs for both HV and VV polarization are low.
Still, details of the two detected targets are given in Figure 15 in the three-dimensional plane with their normalized amplitude of the two detected targets in HH, HV and reflection symmetry metric, respectively. In Figure 15, the three sub-figures in one column relate to one ship target. From the 3D amplitude image, it is observed that the sea clutter in the co-polarization HH is stronger, in other words, the contrast between the target and the sea clutter is much more obvious than in the cross-polarization HV. Meanwhile, the sea clutter around the second ship target in HV polarization is quite low, which implies that the HV amplitude can be explored for target detection at sea under high-sea state in the future research. Another interesting observation is that under the high-sea state the ocean waves become obvious around the first target in Figure 15c, and this phenomenon can also be found in the reflection symmetry image in Figure 13c. This reveals that the averaging operation during computing the reflection symmetry can be regarded as a simple filtering operation, and also implies that the reflection symmetry can be taken for ocean wave analysis for high-sea state. Table 6 gives the SCRs of the two ship targets in HH, HV, reflection symmetry metric, polarimetric entropy and polarimetric scattering angle image. Comparing these SCRs, the consequence should be γ > HV > α > HH > H, which indicates the reflection symmetry metric is prior to HV polarization in target observation.
3.4. Discussion
From all the experiments with the five GF3 stripmap data sets, the contrast enhancement by using reflection symmetry was investigated, and the fit of the GEV model for ocean clutter in the reflection symmetry image was also been tested. Finally, the GEV-model-based ship detector was carried on the reflection symmetry image by using the real GF3 data sets. From the analysis of these real data set results, we could find:
(1) The SCRs of the targets at sea were greatly improved by using the reflection symmetry. The mean SCRs of the five explored data sets were 5.55, 8.10, 6.07, 1.36 and 1.49 dB for the co-polarization, respectively. The mean SCRs for cross-polarization were 8.45, 10.56, 6.3, 6.85 and 4.89 dB, respectively. Additionally, for the reflection symmetry the mean SCRs increased to 13.56, 39.37, 22.17, 18.3 and 9.21 dB, respectively. For both low- and high-sea states, the reflection symmetry showed its priority to the co- and cross-polarization in enhancing the contrast between targets and sea clutter. This could also be observed from the reflection symmetry image, as the targets at sea become quite obvious and some submerged targets by the sea clutter are visible;
(2) The polarimetric entropy and the polarimetric scattering angle from the dual-polarimetric decomposition were illustrated and compared, and the polarimetric scattering angle showed higher SCR than the polarimetric entropy under both low- and high-sea states, which implies that the polarimetric scattering angle is more suitable for target observation at sea than the polarimetric entropy. Meanwhile, although the SCR of the polarimetric scattering angle is lower than the cross-polarization, it is still higher than the co-polarization;
(3) It is proved that the GEV model can fit the statistical distribution of sea clutter well in the normalized reflection symmetry image. With different GF3 data sets, the GEV model was compared with several classical statistical distributions. From both the model fit observation and the numerical assessment by using the common Wasserstein distance, the priority of the GEV model in fitting the sea clutter in the normalized reflection symmetry image was validated. Meanwhile, in the experiments with other two data sets, the GEV model was also taken, and the relative parameters for the best-fitted GEV distribution were estimated with the MLE;
(4) By taking the MLE-estimated results into the GEV distribution model, the relationship between the false alarm and the detection threshold for the CFAR method could be achieved. Then, applying the GEV-based CFAR detector to the normalized reflection symmetry, the ship detector was carried on. The detection results by using the GEV-based CFAR detector on reflection symmetry was much better than the detection results from the co-polarization, cross-polarization and reflection symmetry, which was verified by the detection rate analysis in the form of ROC curves, while the false alarm was set as 1 × 10⁻⁹, 1 × 10⁻⁷, 1 × 10⁻⁵, 1 × 10⁻³ and 1 × 10⁻¹. No matter if under the low- or high-sea states, the proposed method kept a good performance.
Still, there are some other issues that should be noticed and further studied in the following research:
(1) While applying the proposed method to the very large ocean scene, including some land near the sea, the effect of land clutter should be eliminated. Therefore, the sea–land segmentation should be carried on at first;
(2) Although the method is tested on the real data sets, the polarimetric distortion between co-and cross-polarizations introduced by the system itself was not considered. Hence the effect of polarimetric calibration on the ship detection will be further studied;
(3) The azimuth ambiguity existing in the ocean imaging was not considered, which would lead to more false alarms during ship detection. From above, more work will be followed in the next research stage.
4. Conclusions
In this paper, the reflection symmetry metric, namely the correlation between co- and cross-polarization for dual-polarimetric ocean data, was analyzed for ship detection in the sea surface with the GEV statistical distribution model, which was firstly considered for ocean target detection. Nowadays, the dual-polarimetric mode is a universal polarimetric mode in the satellite SAR systems, including the Chinese GF3, so the proposed method was experimented on the dual-polarimetric GF3 ocean data under stripmap mode.
The reflection symmetric property reveals the natural characteristics of the sea clutter and metallic targets, so the reflection symmetry metric was explored for ship detection, as it enlarges the contrast between the targets and the sea clutter. The contribution of this paper is mainly on constructing a GEV model-based CFAR detector by using the reflection symmetry metric. The normalized reflection symmetry metric was constructed in order to introduce the GEV distribution for its statistical distribution. Comparing to other usual distribution models, including the generalized Gamma and K-distribution, it was demonstrated that the GEV distribution can better match the long-tails phenomenon in the histogram of the normalized reflection symmetry metric. According to the parameters estimated by using MLE, the GEV-based CFAR detector was formed to detect the ship targets at sea from the reflection symmetry metric. Experiments on the dual-polarimetric stripmap GF3 ocean data sets under different sea states validated the effectiveness of the proposed method. Meanwhile, the GEV distribution model was verified to be suitable for ocean SAR data, which will be further explored for other parameters extracted from the polarimetric data. Corresponding to the discussion in the experiments, other relative researches will be studied in future work while applying the method to large ocean scenes with the real dual-polarimetric data sets.
Author Contributions
R.G. contributed to the conceptualization of the work; R.G. and J.C. proposed and designed the experiments; J.C. performed the experiments and analyzed the data; R.G. contributed to data preparation, result analysis and paper writing; G.J. contributed to data acquisition; S.Z. and M.X. gave some suggestions to the work. All authors have read and agreed to the published version of the manuscript.
Funding
This research was funded by the National Natural Science Foundation of China under grant 61701410, and also by the Natural Science Basic Research Plan in Shaanxi Province of China under Grant 2019JQ-418.
Conflicts of Interest
The authors declare no conflict of interest.
References
- Velotto, D.; Bentes, C.; Tings, B.; Lehner, S. First comparison of Sentinel-1 and TerraSAR-X data in the framework of maritime targets detection: South Italy case. IEEE J. Ocean. Eng. 2016, 41, 993–1006. [Google Scholar] [CrossRef]
- Brusch, S.; Lehner, S.; Fritz, T.; Soccorsi, M.; Soloviev, A. Ship surveillance with TerraSAR-X. IEEE Trans. Geosci. Remote Sens. 2011, 49, 1092–1103. [Google Scholar] [CrossRef]
- Nunziata, F.; Migliaccio, M.; Brown, C.E. Reflection symmetry for polarimetric observation of man-made metallic targets at sea. IEEE J. Ocean. Eng. 2012, 37, 384–394. [Google Scholar] [CrossRef]
- Nunziata, F.; Migliaccio, M.; Li, X.; Ding, X. Coastline extraction using dual-polarimetric Cosmo-SkyMed PingPong mode SAR data. IEEE Geosci. Remote Sens. Lett. 2014, 11, 104–108. [Google Scholar] [CrossRef]
- Marino, A.; Hajnsek, I. Statistical tests for a ship detector based on the polarimetric notch filter. IEEE Trans. Geosci. Remote Sens. 2015, 53, 4578–4595. [Google Scholar] [CrossRef] [Green Version]
- Marino, A.; Sugimoto, M.; Ouchi, K.; Hajnsek, I. Validating a notch filter for detection of targets at sea with ALOS-PALSAR data: Tokyo Bay. IEEE J. Sel. Top. Appl. Earth Obs. Remote Sens. 2014, 7, 4907–4918. [Google Scholar] [CrossRef] [Green Version]
- Touzi, R.; Charbonneau, F.; Hawkins, R.K. Ship-sea contrast optimization when using polarimetric SARs. In Proceedings of the 2001 IEEE International Geoscience and Remote Sensing Symposium (IGARSS 2001), Sydney, Australia, 9–13 July 2001; pp. 426–428. [Google Scholar]
- Chen, J.; Chen, Y.; Yang, J. Ship detection using polarization cross-entropy. IEEE Geosci. Remote Sens. Lett. 2009, 6, 723–727. [Google Scholar] [CrossRef]
- Touzi, R.; Hurley, J.; Vachon, P.W. Optimization of degree of polarization for enhanced ship detection using polarimetric Radarsat-2. IEEE Trans. Geosci. Remote Sens. 2015, 53, 5403–5424. [Google Scholar] [CrossRef]
- Shirvany, R.; Chabert, M.; Tourneret, J.Y. Ship and oil-spill detection using the degree of polarization in linear and hybrid/compact dual-pol SAR. IEEE J. Sel. Top. Appl. Earth Obs. Remote Sens. 2012, 5, 885–892. [Google Scholar] [CrossRef] [Green Version]
- Guo, R.; Zhang, L.; Li, J.; Xing, M. A novel strategy of nonnegative-matrix-factorization-based polarimetric ship detection. IEEE Geosci. Remote Sens. Lett. 2011, 8, 1085–1089. [Google Scholar] [CrossRef]
- Sugimoto, M.; Ouchi, K.; Yang, C.S. On the eigenvalue analysis using HH-VV dual-polarization SAR data and its application in monitoring of coastal oceans. In Proceedings of the SPIE, Ocean Sensing and Monitoring, Baltimore, MD, USA, 30 April–1 May 2013. [Google Scholar]
- Migliaccio, M.; Nunziata, F.; Gambardella, A. On the co-polarized phase difference for oil spill observation. Int. J. Remote Sens. 2009, 30, 1587–1602. [Google Scholar] [CrossRef]
- Shen, H.; Perrie, W.; He, Y.; Liu, G. Wind speed retrieval from VH dual-polarization Radarsat-2 SAR images. IEEE Geosci. Remote Sens. 2014, 52, 5820–5826. [Google Scholar] [CrossRef]
- Kudryavtsev, V.N.; Chapron, B.; Myasoedov, A.G.; Collard, F.; Johannessen, J.A. On dual co-polarized SAR measurements of the ocean surface. IEEE Geosci. Remote Sens. 2013, 10, 761–765. [Google Scholar] [CrossRef]
- Geldsetzer, T.; Yackel, J.J. Sea ice type and open water discrimination using dual co-polarized C-band SAR. Can. J. Remote Sens. 2009, 35, 73–84. [Google Scholar] [CrossRef]
- Atteia, G.E.; Collins, M.J. On the use of compact polarimetry SAR for ship detection. ISPRS J. Photogramm. Remote Sens. 2013, 80, 1–9. [Google Scholar] [CrossRef]
- Marino, A.; Velotto, D.; Nunziata, F. Offshore metallic platforms observation using dual-polarimetric TS-X/TD-X satellite imagery: A case study in the Gulf of Mexico. IEEE J. Sel. Top. Appl. Earth Obs. Remote Sens. 2017, 10, 4376–4386. [Google Scholar] [CrossRef] [Green Version]
- Pelich, R.; Lopez-Martinez, C.; Chini, M.; Hostache, R.; Matgen, P.; Ries, P.; Eiden, G. Exploring dual-polarimetric descriptors for Sentinel-1 based ship detection. In Proceedings of the 2018 IEEE International Geoscience and Remote Sensing Symposium (IGARSS 2018), Valencia, Spain, 22–27 July 2018. [Google Scholar]
- Gao, G.; Shi, G.; Li, G.; Cheng, J. Performance comparison between reflection symmetry metric and product of multilook amplitudes for ship detection in dual-polarization SAR images. IEEE J. Sel. Top. Appl. Earth Obs. Remote Sens. 2017, 10, 5026–5038. [Google Scholar] [CrossRef]
- Cao, C.; Zhang, J.; Meng, J.; Zhang, X.; Mao, X. Analysis of ship detection performance with full-, compact- and dual-polarimetric SAR. Remote Sens. 2019, 11, 2160. [Google Scholar] [CrossRef] [Green Version]
- Gao, G.; Wang, X.; Niu, M. Statistical modeling of the reflection symmetry metric for sea clutter in dual-polarimetric SAR data. IEEE J. Ocean. Eng. 2016, 41, 339–345. [Google Scholar]
- Li, H.; Perrie, W.; He, Y.; Lehner, S. Target detection on the ocean with the relative phase of compact polarimetry SAR. IEEE Trans. Geosci. Remote Sens. 2013, 51, 3299–3305. [Google Scholar] [CrossRef]
- Ferrara, G.; Migliaccio, M.; Nunziata, F.; Sorrentino, A. Generalized-K (GK)-based observation of metallic objects at sea in full-resolution synthetic aperture radar (SAR) data: A multipolarization study. IEEE J. Ocean. Eng. 2011, 36, 195–204. [Google Scholar] [CrossRef]
- Sun, J.; Yu, W.; Deng, Y. The SAR payload design and performance for the GF-3 mission. Sensors 2017, 17, 2419. [Google Scholar] [CrossRef] [PubMed] [Green Version]
- Han, B.; Ding, C.; Zhong, L.; Liu, J.; Qiu, X.; Hu, Y.; Lei, B. The GF-3 SAR data processor. Sensors 2018, 18, 835. [Google Scholar] [CrossRef] [PubMed] [Green Version]
- Yin, J.; Yang, J.; Zhang, Q. Assessment of GF-3 polarimetric SAR data for physical scattering mechanism analysis and terrain classification. Sensors 2017, 18, 2785. [Google Scholar] [CrossRef] [Green Version]
- Zhang, T.; Li, X.; Feng, Q.; Ren, Y.; Shi, Y. Retrieval of sea surface wind speeds from Gaofen-3 full polarimetric data. Remote Sens. 2019, 11, 813. [Google Scholar] [CrossRef] [Green Version]
- Ma, M.; Chen, J.; Liu, W.; Yang, W. Ship classification and detection based on CNN using GF-3 SAR images. Remote Sens. 2018, 10, 2043. [Google Scholar] [CrossRef] [Green Version]
- Prescott, P.; Walden, A.T. Maximum likelihood estimation of the parameters of the generalized extremevalue distribution. Biometrika 1980, 67, 723–724. [Google Scholar] [CrossRef]
- Moser, G.; Zerubia, J.; Serpico, S. SAR amplitude probability density function estimation based on a generalized Gaussian model. IEEE Trans. Image Process. 2006, 15, 1429–1442. [Google Scholar] [CrossRef] [Green Version]
- Li, H.; Hong, W.; Wu, Y.; Fan, P. On the empirical-statistical modeling of SAR images with generalized gamma distribuition. IEEE J. Sel. Top. Appl. Earth Obs. Remote Sens. 2011, 5, 386–397. [Google Scholar]
- Xu, Q.; Chen, Q.; Yang, S.; Liu, X. Superpixel-based classification using K distribution and spatial context for polarimetric SAR images. Remote Sens. 2016, 8, 619. [Google Scholar] [CrossRef] [Green Version]
- Ding, H.; Huang, Y.; Liu, N. Model of sea spike events with generalized extreme value distribution. In Proceedings of the European Radar Conference, Paris, France, 9–11 September 2015; pp. 113–116. [Google Scholar]
- Li, Z.; Heygester, G.; Notholt, J. The topography comparison between the year 1999 and 2006 of German tidal flat wadden sea analyzing SAR images with waterline method. In Proceedings of the 2013 IEEE International Geoscience and Remote Sensing Symposium (IGARSS 2013), Melbourne, Australia, 21–26 July 2013; pp. 2443–2446. [Google Scholar]
- Won, E.-S.; Ouchi, K.; Yang, C.-S. Extraction of underwater laver cultivation nets by SAR polarimetric entropy. IEEE Geosci. Remote Sens. Lett. 2013, 10, 231–235. [Google Scholar]
- She, X.; Qiu, X.; Lei, B.; Zhang, W.; Lu, X. A classification method based on polarimetric entropy and GEV mixture model for intertidal area of PolSAR image. J. Radars 2017, 6, 554–563. [Google Scholar]
Figure 1.
(a) VH amplitude; (b) VV amplitude; (c) pseudo color; (d) reflection symmetry.

Figure 2.
Data set 1: (a) HH amplitude; (b) HV amplitude; (c) pseudo color composed by , , ; (d) reflection symmetry. Data set 2: (e) VH amplitude; (f) VV amplitude; (g) pseudo color composed by , , ; (h) reflection symmetry.
Figure 2.
Data set 1: (a) HH amplitude; (b) HV amplitude; (c) pseudo color composed by , , ; (d) reflection symmetry. Data set 2: (e) VH amplitude; (f) VV amplitude; (g) pseudo color composed by , , ; (h) reflection symmetry.


Figure 3.
Probability density function (PDF) of normalized reflection symmetry and the fitted statistical distributions. (a) Data set 1; (b) data set 2.
Figure 3.
Probability density function (PDF) of normalized reflection symmetry and the fitted statistical distributions. (a) Data set 1; (b) data set 2.

Figure 4.
Generalized extreme value (GEV)-based constant false alarm rate (CFAR) detector for ocean ship using the normalized reflection symmetry image.
Figure 4.
Generalized extreme value (GEV)-based constant false alarm rate (CFAR) detector for ocean ship using the normalized reflection symmetry image.

Figure 5.
Data set 1. (a) PDF of normalized reflection symmetry and the fitted statistical distributions; (b) curve shows the relationship between false alarm rate and threshold; (c) GEV-based CFAR detection result on the reflection symmetry; (d) CFAR detection result on HV image.
Figure 5.
Data set 1. (a) PDF of normalized reflection symmetry and the fitted statistical distributions; (b) curve shows the relationship between false alarm rate and threshold; (c) GEV-based CFAR detection result on the reflection symmetry; (d) CFAR detection result on HV image.

Figure 6.
Detection results comparison with receiving operating characteristic (ROC) curves (a) data set 1; (b) data set 2.
Figure 6.
Detection results comparison with receiving operating characteristic (ROC) curves (a) data set 1; (b) data set 2.

Figure 7.
Data set 2: (a) PDF of normalized reflection symmetry and the fitted statistical distributions; (b) curve shows the relationship between false alarm rate and threshold; (c) GEV-based CFAR detection result on the reflection symmetry; (d) CFAR detection result on the VH image.
Figure 7.
Data set 2: (a) PDF of normalized reflection symmetry and the fitted statistical distributions; (b) curve shows the relationship between false alarm rate and threshold; (c) GEV-based CFAR detection result on the reflection symmetry; (d) CFAR detection result on the VH image.

Figure 8.
Pseudo-colored RGB image of GF3 ocean data under the low-sea state with , and .

Figure 9.
(a) VH amplitude; (b) VV amplitude; (c) reflection symmetry metric; (d) polarimetric entropy; (e) polarimetric scattering angle; (f) detection result; (h) detection results comparison with ROC curves.
Figure 9.
(a) VH amplitude; (b) VV amplitude; (c) reflection symmetry metric; (d) polarimetric entropy; (e) polarimetric scattering angle; (f) detection result; (h) detection results comparison with ROC curves.

Figure 10.
(a) Histogram of the reflection symmetry metric of Figure 4c and the GEV distribution curve; (b) curve shows the relationship between false alarm rate and threshold.
Figure 10.
(a) Histogram of the reflection symmetry metric of Figure 4c and the GEV distribution curve; (b) curve shows the relationship between false alarm rate and threshold.

Figure 11.
Normalized amplitude of the three detected targets (a) VH amplitude; (b) VV amplitude; (c) reflection symmetry metric.
Figure 11.
Normalized amplitude of the three detected targets (a) VH amplitude; (b) VV amplitude; (c) reflection symmetry metric.


Figure 12.
Pseudo-colored RGB image of GF3 ocean data under the high-sea state with , and .

Figure 13.
(a) VH amplitude; (b) HH amplitude; (c) reflection symmetry metric; (d) polarimetric entropy; (e) polarimetric scattering angle; (f) detection result; (h) detection results comparison with ROC curves.
Figure 13.
(a) VH amplitude; (b) HH amplitude; (c) reflection symmetry metric; (d) polarimetric entropy; (e) polarimetric scattering angle; (f) detection result; (h) detection results comparison with ROC curves.


Figure 14.
(a) Histogram of the reflection symmetry metric of Figure 8c and the fitted GEV distribution curve; (b) curve shows the relationship between false alarm rate and threshold.
Figure 14.
(a) Histogram of the reflection symmetry metric of Figure 8c and the fitted GEV distribution curve; (b) curve shows the relationship between false alarm rate and threshold.

Figure 15.
Normalized amplitude of the two detected targets: (a) HH amplitude; (b) HV amplitude; (c) reflection symmetry metric.
Figure 15.
Normalized amplitude of the two detected targets: (a) HH amplitude; (b) HV amplitude; (c) reflection symmetry metric.


Table 1.
Signal-to-clutter ratios (SCRs) (unit: dB) of the nine ship targets in Figure 1.
Table 1.
Signal-to-clutter ratios (SCRs) (unit: dB) of the nine ship targets in Figure 1.
| T1 | T2 | T3 | T4 | T5 | T6 | T7 | T8 | T9 | Mean | |
|---|---|---|---|---|---|---|---|---|---|---|
| VH | 8.17 | 8.39 | 11.37 | 11.95 | 8.68 | 11.75 | 9.00 | 10.26 | 8.45 | 9.78 |
| VV | 5.67 | 5.65 | 8.54 | 9.01 | 6.03 | 8.85 | 7.01 | 7.72 | 5.55 | 7.11 |
| γ | 14.60 | 14.37 | 16.40 | 17.69 | 12.11 | 17.14 | 15.07 | 16.56 | 13.56 | 15.28 |
Table 2.
Wasserstein distance for distribution fitting.
| GEV | Normal | Gamma | Weibull | |
|---|---|---|---|---|
| Data set 1 | 0.00007 | 0.00174 | 0.00076 | 0.00375 |
| Data set 2 | 0.00019 | 0.00231 | 0.00118 | 0.00459 |
Table 3.
Detailed parameter of the low-sea state data.
| Parameter | Value |
|---|---|
| Polarizations | VH/VV |
| Observing mode | Wide fine stripmap |
| Resolution (range azimuth) | 6.4 6.7 m |
| Latitude | 35°12’ — 37°38’ |
| Longitude | 120°40’ — 123°42’ |
| R/G/B | VV-VH/VH/VV |
| Coverage (range azimuth) | 129.5 176.4 km |
Table 4.
SCRs (unit: dB) of the three detected ship targets in different polarimetric parameter images.
Table 4.
SCRs (unit: dB) of the three detected ship targets in different polarimetric parameter images.
| VH | VV | γ | H | α | |
|---|---|---|---|---|---|
| T1 | 5.30 | 1.38 | 24.4 | 0.12 | 1.46 |
| T2 | 7.85 | 1.18 | 15.1 | 1.22 | 3.67 |
| T3 | 7.39 | 1.53 | 15.4 | 2.25 | 4.72 |
| Mean | 6.85 | 1.36 | 18.3 | 1.97 | 3.28 |
Table 5.
Detailed parameter of the high-sea state data.
| Parameter | Value |
|---|---|
| Polarizations | HH/HV |
| Observing mode | Wide fine stripmap |
| Resolution | 6.4 6.7 m |
| Latitude | 48°05’—49°47’ |
| Longitude | 125°15’—127°25’ |
| R/G/B | HH-HV/HV/HH |
| Coverage | 117.2 145.6 km |
Table 6.
SCRs (unit: dB) of the two detected ship targets in different polarimetric parameter images.
Table 6.
SCRs (unit: dB) of the two detected ship targets in different polarimetric parameter images.
| HH | HV | γ | H | α | |
|---|---|---|---|---|---|
| T1 | 1.64 | 6.69 | 10.96 | 0.93 | 3.32 |
| T2 | 1.34 | 3.08 | 7.45 | 0.03 | 0.42 |
| Mean | 1.49 | 4.89 | 9.21 | 0.48 | 1.87 |
© 2020 by the authors. Licensee MDPI, Basel, Switzerland. This article is an open access article distributed under the terms and conditions of the Creative Commons Attribution (CC BY) license (http://creativecommons.org/licenses/by/4.0/).
Share and Cite
MDPI and ACS Style
Guo, R.; Cui, J.; Jing, G.; Zhang, S.; Xing, M. Validating GEV Model for Reflection Symmetry-Based Ocean Ship Detection with Gaofen-3 Dual-Polarimetric Data. Remote Sens. 2020, 12, 1148. https://doi.org/10.3390/rs12071148
AMA Style
Guo R, Cui J, Jing G, Zhang S, Xing M. Validating GEV Model for Reflection Symmetry-Based Ocean Ship Detection with Gaofen-3 Dual-Polarimetric Data. Remote Sensing. 2020; 12(7):1148. https://doi.org/10.3390/rs12071148
Chicago/Turabian StyleGuo, Rui, Jingyu Cui, Guobin Jing, Shuangxi Zhang, and Mengdao Xing. 2020. "Validating GEV Model for Reflection Symmetry-Based Ocean Ship Detection with Gaofen-3 Dual-Polarimetric Data" Remote Sensing 12, no. 7: 1148. https://doi.org/10.3390/rs12071148
Note that from the first issue of 2016, this journal uses article numbers instead of page numbers. See further details here.