Blood Glucose Level Monitoring Using an FMCW Millimeter-Wave Radar Sensor


1
Centre for Intelligent Antenna and Radio Systems (CIARS), University of Waterloo, Waterloo, ON N2L 3G1, Canada
2
Department of Electrical and Computer Engineering, University of Waterloo, Waterloo, ON N2L 3G1, Canada
3
Schlegel-University of Waterloo Research Institute for Aging, Waterloo, ON N2J 0E2 Canada
4
Department of Mechanical and Mechatronics Engineering, University of Waterloo, Waterloo, ON N2L 3G1, Canada
*
Author to whom correspondence should be addressed.
Remote Sens. 2020, 12(3), 385; https://doi.org/10.3390/rs12030385
Submission received: 31 October 2019
/
Revised: 9 January 2020
/
Accepted: 21 January 2020
/
Published: 25 January 2020
(This article belongs to the Special Issue Radar Remote Sensing on Life Activities)
Abstract
:In this article, a novel sensing approach is presented for glucose level monitoring where a robust low-power millimeter(mm)-wave radar system is used to differentiate between blood samples of disparate glucose concentrations in the range 0.5 to 3.5 mg/mL. The proposed radar sensing mechanism shows greater capabilities for remote detection of blood glucose inside test tubes through detecting minute changes in their dielectric properties. In particular, the reflected mm-waves that represent unique signatures for the internal synthesis and composition of the tested blood samples, are collected from the multi-channels of the radar and analyzed using signal processing techniques to identify different glucose concentrations and correlate them to the reflected mm-wave readings. The mm-wave spectrum is chosen for glucose sensing in this study after a set of preliminary experiments that investigated the dielectric permittivity behavior of glucose-loaded solutions across different frequency bands. In this regard, a newly-developed commercial coaxial probe kit (DAK-TL) is used to characterize the electromagnetic properties of glucose-loaded samples in a broad range of frequencies from 300 MHz to 67 GHz using two different 50 Ω open-coaxial probes. This would help to determine the portion of the frequency spectrum that is more sensitive to slight variations in glucose concentrations as indicated by the amount of change in the dielectric constant and loss tangent parameters due to the different concentrations under test. The mm-wave frequency range 50 to 67 GHz has shown to be promising for acquiring both high sensitivity and sufficient penetration depth for the most interaction between the glucose molecules and electromagnetic waves. The processed results have indicated the reliability of using mm-wave radars in identifying changes in blood glucose levels while monitoring trends among those variations. Particularly, blood samples of higher glucose concentrations are correlated with reflected mm-wave signals of greater energy. The proposed system could likely be adapted in the future as a portable non-invasive continuous blood glucose level monitoring for daily use by diabetics.

1. Introduction
Humankind is suffering from a lot of illnesses and epidemics. One of the most common diseases increasingly prevalent among human beings is diabetes. Over 400 million people worldwide suffer from diabetes and the number is growing rapidly at an unpredictable rate year-by-year according to the International Diabetes Federation (IDF) report [1]. A considerable 8.5% of the world population in 2014 lived with diabetes according to the World Health Organization (WHO) report [2]. While in Canada, for instance, 5 million people are expected to be with diabetes by 2025 (about 15% of the population). Diabetes is directly caused by the malfunction of proper hormone insulin production by the pancreas, thereby affecting the body-cells absorbance of glucose from the bloodstream as caloric energy due to insulin shortage and resistance. Generally, diabetes is classified into two categories: Type-1 (insulin-dependent), where the insulin excreted by the pancreas is not enough, and Type-2 (noninsulin-dependent), where the produced hormone insulin is not properly utilized by the biological system of the body. Diabetes generally happens due to some genetic factors or excessive eating habits. It is detected based on the glucose level that cannot be physiologically controlled within the natural range for a diabetic patient and therefore call for regular inspections. Typical glucose levels in humans’ blood for Type-2 diabetes widespread among 90% of infected diabetics normally vary in the range from 72 to 140 mg/dL before having a meal and should be less than 180 mg/dL within 1–2 h after a meal [3]. With a frequent check of blood glucose levels, diabetics could prematurely meet their glycemic targets and therefore avert being susceptible to any serious health complications like heart disease, stroke, coma, kidney failure, blindness, etc. [4]. Furthermore, hyperglycemia (>230 mg/dL) or hypoglycemia (<65 mg/dL) become avoidable situations if the glucose level is continuously monitored and controlled as necessary through remedies [5,6]. This is also reflected by the WHO 2016 report that counts the promoted monitoring of diabetes, by continuous glucose monitoring (CGM), amongst the very limited avenues to protect diabetics beside the scaled-up prevention and strengthened care [2]. To meet the glycemic targets, patients of Type-1 should check up their blood glucose level in accordance with the insulin intake (four times a day), while Type-2 patients should check twice a day as recommended by the Canadian Diabetes Association [6].
Since the last decade, diabetics have been enormously dependent on point-of-care self-monitoring devices (POCD) such as glucometers, to roughly check their blood glucose levels. These devices are classified as invasive or sometimes minimally-invasive methods that estimate the glucose from an extracted blood sample from the fingertip then analyze it on a strip of test paper. The glucose concentration is then induced by an electrical signal after a set of chemical reactions where different principles are applied such as enzymatic glucose-oxidase, glucose-molecules binding, glucose spectral properties, color reflectance, etc. Apparently, such a finger-pricking procedure is painful, invasive, risky for infection, and costly to the users. Therefore, a clear demand for a non-invasive pain-free biosensor for glucose monitoring is established [7]. To meet that demand and cope with these discomforts and limitations, researchers have conducted thorough investigations over the last decade on alternative, non-invasive glucose detection (NGD) methods that are employed by the medical equipment manufacturing companies to develop a variety of noninvasive blood glucose monitoring devices. Table 1 summarizes some of these devices alongside their respective manufacturers, merits, and demerits. NGD devices are developed using various techniques including the optical techniques that use the light at different wavelengths to identify glucose concentrations through some optical parameters, such as optical coherence tomography (OCT), light scattering, fluorescence measurements, photoplethysmography (PPG) near-infrared (NIR), photoacoustic and Raman spectroscopy [8,9,10]. However, the optical measurements at short wavelengths commonly require bulky and costly instruments with the tendency to have large errors in the skin or interstitial fluids that are not compliant. The absorbance spectroscopy techniques, such as red/near-infrared [11,12,13] and mid-infrared [14] spectroscopy, use the scattering of light on biological tissue to detect optical signatures of glucose in blood. These techniques also have some shortages of being expensive to implement, sensitive to changes in physiological parameters such as body temperature and blood pressure, and to the environmental variations in pressure, temperature, and humidity. The electrochemical methods have also been proposed [15,16] for sensing the glucose level obliquely by measuring external bodily fluids such as breath condensation [17], saliva [18], sweat [19], and tears [20] and correlating their content to glucose in the bloodstream. Improved sensitivity is scored, yet these non-invasive methods are criticized for being too susceptible to metabolic changes, low-correlated with blood glucose levels due to the lag between the physical glucose changes in sweat, ISF, and blood. Seemingly, the proposed designs are still in their infancy to judge their applicability.
Out of the many investigated non-invasive methods, the radiofrequency (RF)/microwave sensing techniques have shown to be promising due to the ability of intact penetration of electromagnetic (EM) waves in biological tissues. Such techniques rely on the fact that the glucose level in a person’s blood affects the EM properties of the blood (dielectric constant and loss tangent) [21], and therefore seek for a promising correlation between the measured electromagnetic (EM) properties of blood and its glucose content. In this context, a variety of methods have been developed to measure the dielectric properties of blood glucose in superficial vessels using split-ring resonators [22], microstrip patch antennas [23], vector network analyzers (PNA) [24], and waveguides [25]. A popular method for measuring the complex permittivity for liquids is through using an open-ended coaxial probe as a near-field sensor by placing the material under test (MUT) right at the opening and measuring the reflection coefficient S11 which is then related to the dielectric properties through a complex mathematical model [26,27]. Such probes can be used for measurements in a convenient laboratory setup but are not suitable candidates for non-invasive sensing due to their high cost, massive bulky nature, and limited penetration depth that depends on the probe diameter [28]. They also become quite inaccurate in measurements for any asymmetries in the MUT surface [26,29]. The most accurate and precise methods among those dielectric characterization techniques are the resonant methods that employ various type of microwave resonators including the classical box, transmission-line, circular/ring, etc. [30,31]. Nevertheless, this method is found to be more suitable for characterizing the materials of low loss over a narrowband, yet the harmonic resonance frequencies could be of a great use for wideband characterization. All these RF systems have demonstrated success in glucose detection, but they are not immediately viable for at-home use by diabetic patients due to restrictions on these systems that rely on expensive RF tools. This makes the systems impractical for large-scale deployment. Some state-of-the-art techniques recently proposed for NGD are listed in Table 2.
Radar systems have been increasingly used over recent years for a variety of applications. For instance, radars for automotive, ground, and weather applications are commonly employed at different scales with variable lighting, peripheral, and environmental conditions. The low-cost hardware items of small-size modules have recently become available have been allowed for some introductory explorations in [53,54,55,56]. Human computer interface (HCI) has also shown to be a potential area for radars to detect the human’s hand gesture at a micro-scale (finger motion recognition) [57,58], enhance reality interactions [59], activity discernment [60], liquid identification [61] and to distinguish between various materials and objects by analyzing the characteristics of the reflected radio waves [62]. Smart lighting products that detect incoming motions for automatic lighting have recently replaced the conventional passive infrared sensors (PIR) with radar systems that are cost-effective, highly sensitive, and of better sensing resolution with a wider range. Radars have also demonstrated success in the health scope for a variety of applications such as sleep monitoring [63], sensing the respiratory and heart rates [64], emotion tracking [65], gas detection [66], and many other aspects of radar capabilities are still under exploration.
Continuing these efforts in radars health applications, a compact low-cost integrated sensing system that utilizes mm-wave radars is proposed to remotely detect glucose concentration levels for diabetes patients. In particular, motivated by the results of our prior study in [67] that succeeded in differentiating the amount of sugar in three different drinks (coke, diet coke, and zero coke) using the reflection data from one channel of a 4-port microwave network analyzer N5227A PNA-67GHz from Keysight technologies; in this study, radar sensing and signal processing were employed for the purpose of identifying the glucose levels in synthetic blood samples of various glucose concentrations typical to the diabetes condition. An integrated mm-wave radar system is used as a sensing platform for tracking different glucose concentration levels in “fake blood” samples. In this system, a two-transmitter (Tx) and four-receiver (Rx) high-resolution radar working in the 57 to 64 GHz frequency range (bandwidth of 7 GHz and center frequency of 60 GHz) [57], is utilized to experiment the detection of glucose levels in blood-mimicking material “fake blood” samples [68] by analyzing the raw data of the reflected radio waves. To do so, synthetic “fake blood” samples were first prepared at assorted glucose concentrations from 0.5 to 3.5 mg/mL at 0.5 mg/mL increment. The prepared blood samples were loaded at a specific volume inside clinical test tubes, then placed onto a 3D printed fixture device that is particularly developed to retain the sample tube position at a consistent distance relative to the radar sensor. The blood samples under test were illuminated with frequency-modulated continuous electromagnetic waves at very high frequencies and the raw data of reflected mm-waves were collected simultaneously from the four radar channels. The collected raw data is then analyzed using conventional signal processing techniques to identify the corresponding glucose concentrations in blood.
The next sections in this paper are organized as follows: Section 2 discusses the investigative experiments that motivate the use of the mm-wave spectrum for glucose sensing. Section 3 presents the proposed low-cost glucose sensor, its principle of work and the in-lab experimental approach for radar sensing. The measurement results of the different radar experiments are presented in Section 4 alongside the signal processing analysis. Section 5 presents a comprehensive discussion for the research findings, while Section 6 concludes the paper and outlines the future work.
2. Why mm-Wave Sensing?
Prior to exploring the radar usage for detecting glucose and identifying its level of concentration, we first answer a fundamental question, why the choice of using an mm-wave system is favored for glucose detection? To answer this question, we first aimed at studying the dielectric complex permittivity behavior of glucose-loaded samples across the microwave spectrum from 300 KHz to 67 GHz using a dielectric assessment kit (DAK-TL) that features the open-ended coaxial probe technique for dielectric characterization. This is done to suggest the portion of the spectrum where the glucose-loaded specimens could be detected at high sensitivity. To do this, the dielectric properties (dielectric constant and loss tangent) of assorted glucose-water solutions prepared at similar concentrations to normal diabetics (70–120 mg/dl, in steps of 10 mg/dL) were measured over the frequency spectrum from 300 MHz up to 67 GHz using a commercial coaxial probe kit (DAK-TL) connected to a Keysight PNA instrument. The objective was to determine whether varying the amount of dissolved glucose in the liquid solution (e.g., aqueous solutions) affects their dielectric EM properties, and to what extent. Furthermore, we aimed at determining the portion of the frequency spectrum that is most responsive to slight variations in glucose concentrations, and to identify the amount of change in dielectric constant and loss tangent due to different concentrations of interest. Another factor that advocates the use of mm-wave radar for glucose detection in this study is the outcome of a recent clinical experiment where clinical blood samples drawn from seven distinct participants before and after consuming 75mg of glucose (i.e., 14 samples in total) were analyzed using a PNA in the frequency range (50–67 GHz) [67]. These motivational studies are explained in detail in the following subsections.
2.1. Spectroscopy Dielectric Measurements of Glucose Using DAK-TL
Generally speaking, liquids of high-water contents (e.g., blood, aqueous solutions, etc.) are dispersive media whose electromagnetic properties depend on frequency. Therefore, providing an accurate mathematical model is necessary to describe this frequency dependency. The dielectric constant of tissues having high water content as a function of frequency can be characterized by the Debye relaxation model [69], which describes the reorientation of molecules that could involve translational and rotational diffusion, hydrogen bond arrangement, and structural rearrangement.
A few research studies have focused on extracting the permittivity measurements for liquid samples of relatively high glucose concentrations at higher frequency ranges. In [24] a waveguide transmission probe was clamped onto the ear of a live anesthetic rat in order to observe the EM properties continuously on PNA. The authors noted a correlation between blood glucose concentrations and the properties the mm-wave transmitted in the Ka band (27–40 GHz) as demonstrated by the considerable changes in the absorption and reflection properties during the 0.5 mL intraperitoneal (IP) injection of glucose and insulin into the rat under experiment. Different sensing techniques of both reflection and transmission modes were used in [70] to collect the permittivity measurements for aqueous glucose solutions in a frequency range up to 40 GHz for higher glucose concentrations from 0.15 wt% up to 0.5 wt%. The study in [71] considered the 50–75 GHz band for measurements of reflection coefficients using saline solutions of high concentrations (0.5 wt% and 3 wt%). A correlation between these concentrations and reflected coefficients is not sufficiently strong even for the high glucose concentrations. Another study [72] over the frequency range (28–93 GHz) used the mm-wave spectroscopy in reflection mode to detect sugar in watery solutions, blood imitators (physiological solution: 0.9% NaCl in water), and blood while checking the sensitivity of their dielectric properties to glucose content at concentration levels ranging from 0.5 to 5% wt. The authors in [3] were able to demonstrate a clear linear correlation between transmitted EM energy in the mm-wave band (50–75 GHz) and the glucose concentrations in watery and salty solutions. Two open-ended V-band waveguides (WR-15) connected to a PNA were used to measure the dielectric properties, reflection (S11) and transmission (S21) coefficients. The tested samples have different types of glucose concentrations in a clinically relevant range between 0.025 wt% and 5 wt%. Transmission data achieved better results compared to reflection one especially in the 59–64 GHz and 69–73 GHz frequency ranges. A recent study in [73] proposed an mm-wave sensing system that consists of a pair of 60 GHz microstrip patch antennas placed across the interrogated blood sample. Measurements of the transmission coefficients were shown to be highly affected by changes in the permittivity along the signal path due to variations in glucose concentrations.
Following up on the aforementioned efforts, in this study, we investigated which frequency band could be of the most sensitivity to glucose level changes in the tested specimens while understanding their dielectric behavior as reflected by the corresponding spectroscopy measurements. For this purpose, the updated software version of the DAK-TL (2.4.1.144) system was used to measure the EM dielectric properties of water-based glucose-loaded samples of concentrations (70–120 mg/dL) in four distinct frequency bands. These concentrations of interest are related to the clinical relevance of Type-2 diabetes. Aqueous glucose solutions were utilized to approximate the actual blood samples at disparate glucose concentrations while ensuring the stability and repeatability of the dielectric measurements. This approximation is valid since water contributes a high percentage (≈50%) of the entire volume of human blood that contains other vital constituent components at different proportions (e.g., glucose, Na, Ca, K, Cl, etc.) [74].
First, aqueous glucose solutions were prepared precisely using a micropipette device in a laboratory with disparate glucose content at the following concentrations: 0.7, 0.8, 0.9, 1.0, 1.1, and 1.2 mg/mL. The dilution equation C1V1 = C2V2 is used to calculate the volume V1 added from the stock/standard glucose solution of C1 = 10 mg/mL, to achieve the desired concentrations for the prepared samples of volume V2 = 20 mL. The basic system setup that interconnects the DAK-TL, PNA and PC is shown in Figure 1. After matching the Probe beam to the physical setup of the frequency of interest, the DAK-TL base system is connected to one port of the PNA via coaxial cable, while connected to the PC via USB. This testing fixture is fully automated and software controlled. The PNA is connected to a PC using LAN/Ethernet cable. PNA intermediate frequency (IF) Bandwidth is set to 100 Hz to achieve measurements at a convenient speed with reduced noise, PNA output source power (O/P) = 0 dBm for both probes DAK 3.5/1.2E, and the averaging reset is for 3 PNA traces to reduce the noise in and the error of the reported result. To achieve precise reproducible measurements, the DAK-TL system was calibrated by the standard Open-Short-Load method using distilled water at 20 °C before starting the liquid measurements. Liquid calibration should be handled carefully because it is sensitive to cable movement and temperature where the dielectric parameters of liquids can vary up to 2% per 1 °C temperature change. Therefore, MUT temperature was measured and entered into the software, then a precise volume of 10 mL was poured on a metallic petri-dish and placed on the sample platform which brings it in touch with the probe for measurement. The probe is perfectly immersed inside the MUT at a depth of 4 mm to have good contact with no bubble underneath. These settings for the sample volume and probe depth were decided upon studying the DAK-TL accuracy in measurements at different volumes of a tested liquid sample to conclude the lowest volume of liquid that can be used for stable precise measurements. In particular, the dielectric properties of standard distilled water were measured in different frequency bands at different volumes of 10, 5, 2, and 1 mL. By comparing the collected measurements at each volume against the reference target data provided in the DAK-TL database, it is noticed that the 10 mL volume is relatively very close in measurement to the exact data of distilled water while other volumes are slightly off. Similarly, the influence of the exact touching point between the sensing probe and the tested sample was investigated. Considering that the probe can go to different distances between 0 to 10 mm (at zero distance the probe becomes in touch with the sample platform while at 10 mm distance the probe is fully off), measurements have shown that more accurate results would be achieved if a sample of volume 10 mL, for example, is tested at a probe distant of 4 mm that would yield a sufficient contact compared to the 3 mm case where the probe immerses deeper inside the liquid.
The dielectric measurements were performed on four distinct frequency intervals: 300 MHz–10 GHz using the DAK 3.5-TL probe beam at 50 MHz resolution (195 points) while the DAK 1.2E-TL was used for measurements at the other three intervals 6–30 GHz (200 MHz resolution, 121 points), 30–50 GHz (200 MHz resolution, 101 points), and 50–67 GHz (200 MHz resolution, 85 points). Calibration was performed and repeated multiple times until a good match was achieved between the measured and target data for di-ionized water. In each experiment, a 10 mL volume from each glucose concentration sample is placed into the petri-dish and tested in each frequency band. The extracted dielectric values from measurements in the first three spectrums (300 MHz–10 GHz), (6–30 GHz), and (30–50 GHz) shown in Figure 2a–c, respectively, have shown some variations that are not entirely linear. Clearly, as the frequency increases the dielectric constant decreases while the loss tangent increases. However, their trend with varying glucose levels is very hard to trace and sometimes this trend is missing. Obviously, neither of these spectrums are adequate to differentiate between the glucose concentrations of interest. Measurements in the high-frequency band (50–67 GHz) were collected using an alternative long coaxial cable to achieve stable and repeatable measurements. A twenty-minute period is allowed for cable stabilization then the Open-Short-Load calibration was performed while activating the noise filter in the software to achieve smooth measurements. The extracted dielectric constant and loss tangent measurements of the glucose-water solutions of 0.7–1.2 mg/mL concentrations are plotted in Figure 2d. The collected measurements show that the concentrations of interest are better distinguishable in this high-frequency range [29]. As the frequency increases in this interval ϵr’ of glucose samples gradually decrease while the loss tangent tends to increase in a nearly linear pattern before starting to decay after 60 GHz. Interestingly, with an increased level of glucose content in water, the real part of the relative permittivity slightly increases while the loss tangent decreases accordingly (implicit decrease of the imaginary part of permittivity and conductivity).
Following this study, the mm-wave frequency range has shown to be promising for glucose sensing where higher sensitivity to the dielectric constant and loss tangents of glucose samples can be obtained as a result of the stronger interaction between the glucose molecules and EM waves in this spectrum. Therefore, the question becomes whether the radar sensing approach might be able to differentiate between these minute changes in dielectric properties of different glucose concentrations.
2.2. PNA Scattering Analysis for Clinical Blood Samples in the Frequency Range (50–67 GHz)
In this study, we used the 75 mg glucose consumption standard adopted by the diabetes check tests [75] to analyze the blood samples of the respective participants using a Keysight N5227A PNA-67GHz fitted with two V-band adapters connected to WR-15 waveguides. The blood samples were first tested using a standard glucometer device to use its readings as a reference for comparison. The glucometer measurements for all participants are shown in Figure 3a pre and postprandial tests with a one-hour time gap. Various behavioral responses to glucose consumption (i.e., rising and dropping variations in glucose level) are attributed to physiological differences amongst the participants. Next, blood samples of all subjects were tested in the PNA configuration setup by sweeping across the frequencies 50–67 GHz and the corresponding transmission scattering coefficients (S21) were recorded as shown in Figure 3b. The PNA transmission results were observed to be reliably consistent and aligned with the glucometer readings for glucose level variations in certain frequency bands 55–57 GHz and 59–61 GHz that are highlighted in light green and red rectangles, respectively, as depicted in Figure 3b. For instance, the pre-prandial glucometer reading for subject 3 of about 0.99 mg/mL has descended to 0.90 mg/mL after consuming the glucose dosage. However, a totally different behavior was noticed in the glucose level variations of subject 6 whose pre-prandial measured glucometer reading of about 0.87 mg/mL jumped to 1.2 mg/mL post the glucose consumption. These trends in glucose levels variations for subjects 3 and 6 were plainly exhibited in the PNA transmission responses in the 55–57 GHz frequency band as shown in Figure 3b. All the participants in this experiment gave their informed consent for inclusion before they participated in the study. The study was conducted in accordance with the Declaration of Helsinki, and the protocol was approved by the Clinical Research Ethics Committee of project number 31235 on 27 August 2018.
In view of the above experiments, it is noted that the blood glucose samples of various concentrations are better distinguishable across some frequencies in the mm-wave band. Therefore, the use of a wideband mm-wave multi-channel radar system would probably be promising for identifying the glucose concentrations present in the blood samples under test.
3. Proposed Low-Cost Sensor
3.1. Working Principle of the Proposed Radar System
In radar systems, a transmitting antenna sends an electromagnetic-wave signal towards a target of certain properties. Parts of the transmitted signal are absorbed, scattered and reflected back towards the radar receiver, which receives a tiny portion of the transmitted signal for further analysis and estimation of the target location, speed, as well as other properties. Among the different kinds of radars such as Doppler, impulse, etc., Frequency-Modulated Continuous-Wave (FMCW) type has shown to be promising for materials and objects recognition and characterization [62]. In FMCW radars, the signal is transmitted continuously. This signal, called “chirp”, has a frequency which varies linearly from a minimum up to a maximum frequency over the duration of one chirp. These chirps are continuously transmitted. The received signal is then amplified, filtered to reduce noise, and then correlated with the transmitted signal to generate what is called a beat signal that contains all necessary information about the target. The time delay between the transmitted and received chirps results in a frequency difference between the two signals. The resultant beat signal can be spectrally analyzed to extract the range and velocity of the target. Generally, the range resolution for FMCW radars is given by c/2BW, where c is the speed of light and BW is the transmitted signal bandwidth.
In view of the above information, the proposed sensing system in this study utilizes a mono-static, multi-channel FMCW radar chip operating in the 57–64 GHz frequency range (center frequency of 60 GHz) [54,57]. The radar has two transmitters and four receivers (2-Tx/4-Rx) enclosed in a compact (8 × 11 mm) hardware chip as shown in Figure 4. The four receivers are arranged in a 2 × 2 matrix pattern as depicted in Figure 4c. This multi-channel configuration will enable greater capabilities for sensing minute changes in target’s attributes, for example, detection of movement changes in gesture recognition applications [57,58]. The transceiver chip is co-developed by Infineon using Silicon-Germanium (SiGe) process technology that realizes a high level of physical miniaturization by direct placement of patch array antenna into package (AiP). More details about the hardware architecture of the radar chip can be found in [76].
One interesting property of this mm-wave radar is the high-resolution capability that enables resolving the illuminated target, of relatively greater thickness than the radar range resolution, into more than a single range bin at a frequency peak. Consequently, the resultant beat signal becomes quite sensitive to any tiny changes in the characteristics of the detected target such as physical state, thickness, height, material properties, radar-cross section, etc. Such enriched information in the beat signal can be used as remarkable signatures to recognize and classify the surrounding objects and materials, whereas here in this study this feature is exploited to enable novel glucose levels detection.
The framework of the mm-wave radar employed in this study uses a high temporal resolution rather than the conventional high spatial resolution adopted by the classical radars. In this technique, the radar measures the target responses to the FMCW signals radiated periodically at extremely high frame rates. In particular, a synthesizer generates a modulated electromagnetic wave STx, as defined in Equation (1), whose frequency sweeps linearly from 57 to 64 GHz. This FMCW chirp is radiated periodically at a high frequency denoted as RRF (radar repetition frequency) that varies between (1–10 KHz) toward a target of certain properties
where fmin is the start frequency, k is the chirp slope, u(t) is the complex envelope over one period of the modulation scheme, and RRI is the radar repetition interval that defines the chirp duration between the starting point of each modulated waveform to the next. With part of the transmitted energy being scattered by the target, a reflected signal SRx, defined in (2), is received by the radar receiving antennas during each RRI at frequency RRF = 1/RRI, then filtered and sampled using a 12-bit analog-to-digital converter (ADC) at 1.79 Msamples/s [57].
where σ represents the combined effects of radar cross section and propagation loss, τ is the round-trip time for the transmitted EM signal (τ = 2D/c), where D is the distance to the target, and c is the speed of light in vacuum (3 × 10⁸ m/s).
These reflected responses are analyzed to extract fine variations in the temporal signal that are attributed to the target adaptive status such as orientation, motion, composition, etc. In this regard, two distinct time scales are used to analyze the reflected mm-wave signals, one is the slow time Tslow = t defined by the repetition interval of the radar (i.e., chirp duration) and used to collect the reflected signals at the corresponding radar repetition frequency RRF that varies in the range 1 to 10 KHz as mentioned earlier. The second time scale is the fast time Tfast = T by which the transmitted signal is varying over one RRI or modulation period, and that will be used for sampling the corresponding received signal at the ADC. Given the considerably high radar repetition frequency RRF, the properties of a moving target can be assumed to be constant over one RRI. Therefore, the reflected signals collected every Tslow would represent the instantaneous features of the target such as range, orientation, and reflectivity, that can be elicited by processing as function of the fast time t. However, the dynamic features of the target (e.g., velocity, change in physical state, or geometry) can be extracted by looking into the collection of the reflected signals over multiple RRIs and analyzing as function of the slow time T.
3.2. Radar Experimental Approach for Glucose Detection
The glucose detection approach investigated in this study exploits the SOLI radar sensor capabilities whereby the characteristics of the object(s) placed in the vicinity of the sensor, right on top or at a definite distance, can be explored by looking into the reflected signals as collected by the radar receiving antennas. These signals represent a rich store of information that describe various attributes (thickness, volume, range, density, surface properties, internal synthesis, etc.) respecting the object(s) on target of the radar transmitted EM waves. In the case under study, there are liquid samples of the homogenous composition of synthetic blood but with different amounts of dissolved glucose. In other words, all the samples have a similar shape, volume, placement, and almost the same composition except for the concentrations of the dissolved glucose that have tiny variations from one sample to another. This variation in glucose levels modifies the dielectric properties of the sample in place, thereby making it possible for the radar signals to capture the unique signature of each blood sample of respective glucose concentration. By recording the multi-channel raw radar signals that are unique to various glucose samples, and analyzing them using signal processing algorithms we were able to differentiate between the blood samples of 0.5, 1.0, 1.5, 2.0, 2.5, 3.0, and 3.5 mg/mL. No feature extraction or machine learning module is applied in this analysis, however, the supervised learning approach inherent in SOLI could also be used to train, classify, and accurately correlate the collected raw signals to their respective level of glucose concentrations.
A set of seven samples of synthetic blood at different glucose concentrations 0.5, 1.0, 1.5, 2.0, 2.5, 3.0, and 3.5 mg/mL, were prepared in the test tubes and labelled accordingly. This is done by mixing the synthetic blood samples with different proportions of the glucose standard solution (CAROLINA) of 10 mg/mL as determined by the dilution equation while using a micropipette device for harvesting the exact volume precisely. All the prepared blood glucose samples were measured using a commercial glucometer device to ensure the accuracy of the prepared glucose concentrations as shown in Table 3.
The experimental setup for testing the blood glucose samples is shown in Figure 5 where the Soli radar and tested sample tube were placed at their respective locations in the designed fixture that would help to mitigate any placement error in the sample tube position during the experiment. The fixture will also enable the sample tube to be in perpendicular alignment with the incoming mm-wave, thereby avoiding any complex bending of the mm-wave signal due to oblique incidence. Note that in this setup, all the transmitting and receiving antennas (2-Tx and 4-Rx) were placed on one side facing the blood sample under test as shown in Figure 5b. A metallic plate was used to improve the quality of the collected measurements by excluding the noisy reflections from the surrounding environment. The radar system was connected to the PC interface whereby the radiation operation was controlled for starting and ending each measurement trial, and further to gather and process the raw data reflected by the blood glucose sample under test. In each trial, the radar shined an mm-wave signal from one side in the designed fixture towards a blood sample and received the reflected backscattered signal. A signal processing module is applied in the connected PC to analyze the characteristics of the received signals to identify the glucose level of concentration in the specific blood sample on target.
4. Results
As mentioned earlier, the glucose-loaded blood samples in test tubes were tested in the 3D fixture setup that was developed to mitigate any placement errors. Each blood sample of a specific concentration was tested three times in order to prove the repeatability of the radar measurements. In this repeatability routine, all the measurements were completed once for all different concentrations 0.5–3.5 mg/mL in one round then repeated twice following the same course. This was done to compensate for the uncertainty which occurs due to the position change in test tubes when they were replaced in the consecutive measurements for each glucose concentration. This position change becomes quite sensitive in such an mm-wave regime, and therefore, we need to ensure that only the glucose concentrations have a substantial impact and dependency on the millimeter-wavelength of the radar. In each trial of this repeatability routine, the raw data of the reflected signals were collected and measured by the radar antennas on all four receiving channels. Each channel has a total of 64 samples (bins) of the raw data of the reflected signal amplitudes that would be analyzed and processed to extract the glucose concentration in each tested blood sample. It is worth mentioning that, the phase responses in this radar sensing experiment were not directly useful due to wrapping multiple times (around 2 π) inside the blood sample, thereby the measured values carry no unique information about the blood sample under test. A glucometer device was used as a reference to ensure the accuracy of the collected measurements, and the magnitudes of the radar reflected signals were shown to have a similar tendency to the reference glucometer readings. Figure 6 shows the raw measured data for each glucose concentration sample as collected in channel 1. The same measurements are plotted in Figure 7 when channel 2 was used. These visuals clearly confirm the very good repeatability of all concentration measurements tested on channels 1 and 2 as demonstrated by the three repetitive trials. Repeatability measurements of relatively higher variations in comparison, e.g., 2.5 mg/mL in channel 1 and 3.5 mg/mL in channel 2, might be attributed to minor shifts in positioning the test tubes inside the 3D sample holder. In addition, the labels of the test tubes might also contribute to these variations when these labels were directly facing the radar mm-wave radiations of very fine resolution.
Next, we calculated the averages of the absolute reflected magnitudes for each glucose sample in each of the three trials collected in channels 1 and 2. Figure 8 depicts the variations in the averages of the absolute reflected magnitudes of each of the three repeated tests and the corresponding error in each concentration readings. The reflected signals in channel 1 were of relatively higher magnitudes than their peers collected in channel 2 especially for the smaller concentrations 0.5, 1.0, and 1.5 mg/mL. The repeatability error in each glucose readings was in the range of ±1.18 unit/sample point max. A reasonable level of repeatability was also achieved on the readings of the other two channels (channels 3 and 4).
In what follows, the raw data collected for each tested blood sample of a specific concentration is analyzed. In this analysis, we rely on the data collected by channel 1 and 2 only which were shown to be more stable in terms of the data repeatability and glucose sample distinguishability. For each channel, the average of the three repeatability data sets of each glucose sample was calculated using
where is the averaged scattering signal for a given blood sample of concentration C, is the raw data collected for blood sample of concentration C at trial n, and N is the total number of trial repetitions that were fixed to three trials in this experimental study. Next, to process the average data of a given channel we applied the sample gating signal processing to [77] extract the data points of the respective channel using
where is the sample gated signal for channel , is the applied gated window of unit values in the sample range of interest, and zeros otherwise. In this case, is applied in the range of and , for processing the data from channel 1 and 2, respectively. The sample gated signals and for the average measured data for each tested concentration C = 0.5, 1.0, 2.0, 2.5, 2.5, 3.0, and 3.5 mg/mL are plotted in Figure 9a,b, respectively.
In what follows, signal processing algorithms are applied to analyze the radar measured raw data in channels 1 and 2. This will allow for identifying the different glucose concentrations and correlate them to the reflected mm-wave readings. In this regard, the Fourier transform is applied to reveal the interaction between the amplitudes of the backscattered signals and the glucose concentrations in the tested blood samples. Specifically, the discrete Fourier transform (DFT) algorithm is applied to each gated signal of 64-radar bin points for ch = 1 and 2, C = 0.5, 1.0, 2.0, 2.5, 2.5, 3.0, and 3.5 mg/mL as given by Equation (5). Each gated signal of limited data points (i.e., 64) is zero-padded to increase the length of the gated signal to N = 256 and therefore an improved quality is acquired for the processed DFT data in the transformed frequency-domain.
where N is the total number of points for the processed gated signal applied to compute the DFT using Fast Fourier Transform (FFT) algorithm. The resulted spectrums shown in Figure 10a,b are symmetric since the input signals are real-valued. The double-sided Fourier transform is rearranged by shifting the zero-frequency component to the center of the spectrum as depicted in the small plot windows enclosed in Figure 10a,b for channels 1 and 2, respectively. It is observed that the magnitudes of the Fourier transform of the backscattering signals of the blood glucose samples are directly proportional to the glucose concentrations dissolved in the respective specimens. In other words, blood samples of higher glucose concentrations would have a modulus of larger magnitudes compared to lower levels of glucose concentrations. This is also evident by the average power spectral density (PSD) that is estimated for each gated signal vector of a particular glucose concentration using the periodogram figure of merit as given in Equation (6) [78].
where w is the normalized frequencies in the range −π < w < π for a DC-centered PSD estimate. The units of the PSD estimate are in squared magnitude units of the time series data per unit frequency. A rectangular window is used to estimate the PSD in decibels for each real-valued . Figure 10c,d show the centered two-sided PSD estimate for each real-valued gated signal that corresponds to each glucose sample. The PSD has a length of 256 and is computed over the interval (‒π, π] rad/sample.
Lastly, all glucose concentrations in channels 1 and 2 are compared in Figure 10e,f, respectively, in terms of the energy density that is noticed to be increasing as the glucose concentration levels increase. In this regard, the finite energy for each glucose-specific gated signal is calculated as in Equation (7) by accumulating over all the N sample points, where is the sampled energy density spectrum for the gated signal . The raw data collected in channel 2 has shown to be more stable compared to those of channel 1. Therefore, the energy densities computed for channel 1 data are noticed to be nearly saturated towards the higher glucose concentrations with (4.046, 4.075, 4.094) × 106 Volts2 for the 2.5, 3.0, and 3.5 mg/mL, respectively. This would yield a non-linear correlation relation between the glucose concentration and the resulted energy density. However, the glucose concentrations tend to be more distinguishable when the radar raw data from channel 1 is processed using the DFT as depicted from the transform magnitudes in Figure 10a. The variance of the energy density from the three measurement trials is also computed and indicated as error bars in Figure 10e,f.
5. Discussion
With dielectric permittivity measurements carried out in distinct investigated frequency bands, the mm-wave range has shown to be promising for sensing the glucose-loaded solutions for many reasons: non-ionizing nature, good penetration depths inside the liquid tissues, and the good resolution feature for their relatively small wavelength compared to EM radiations at lower microwave frequencies. Though, measurements in such high frequencies are very challenging due to the strict tolerances in manufacturing the RF measuring devices that often require very high accuracy. In addition, the literature is not well-established with measurements that address the EM behavior of glucose liquid materials in much higher frequencies in contrast to the lower frequency range up to 10 GHz [3]. In the DAK-TL measurements for glucose solutions at the mm-wave high-frequency range, it was noticed that with an increased concentration of glucose content in watery solutions, the real part of the relative permittivity (i.e., dielectric constant) slightly increases while the loss tangent decreases accordingly (implicit decrease of the imaginary part of relative permittivity and conductivity). This outcome conforms with the results reported in [3,79,80], however, it contradicts the conclusion reported in [70,71] that studied these measurements using a simple scheme that indicated a decreasing trend among the dielectric constants extracted from the measured reflection coefficient at the minimum resonant frequency for the reflected mm-wave signal. On the other hand, by comparing the collected dielectric measurements at lower frequency bands to those in the literature we find that some researchers were able to achieve trend among glucose concentrations in such low frequencies but for higher concentrations than those considered in this study. The study in [81] tested the glucose-water concentrations of 1 mg/mL to 5 mg/mL with 1 mg/mL steps and obtained measurements for real and imaginary parts of the complex permittivity in the frequency band 1–8 GHz. The variations in the collected data were not fully linear, however, a trend was observed at some frequencies posing a decrease in the dielectric constant and increase in the loss factor for an increased glucose level. The same trend was noticed when applying the parameters proposed by [82] for their Cole–Cole model for glucose-dependent dielectric properties of blood plasma to the concentrations 1–5 mg/mL of glucose in water, however, these changes in real and imaginary parts of permittivity between different glucose levels were quite small in terms of ±0.02. Interestingly, another opposite trend was observed among these concentrations when applied to the Debye coefficients proposed by the authors in [70,83] resulting in an increased dielectric constant and decreased loss factor over the frequency spectrum for increasing glucose levels. When compared against the dielectric properties in lower-frequency bands, it is observed that the difference in dielectric constant and loss tangent between different glucose concentrations is increasing beyond 50 GHz. This basically implies that it would be difficult to detect the tiny differences between the dielectric properties of the respective glucose samples in the lower microwave ranges of frequency. Seemingly, 50–67 GHz is a promising region of noticeable complex permittivity contrast between different glucose concentrations.
In view of the above findings, we decided to use a millimeter-wave system operating in the frequency range 57–64 GHz for the goal of accurate detection of the glucose levels relevant to the diabetes condition. Since the mm-wave sensor relies on the reflection data from the blood sample in target, then a small penetration depth of few millimeters would be sufficient to capture the variations in the dielectric properties of the dissolved blood glucose [84]. This is demonstrated by the radar measurements that show a correlation between the IF signal amplitude and the loss property of the blood glucose sample. The theory behind the correlation of the minute changes in the complex permittivity and the amplitude of the IF signal for material and subject identification were explained in [67,84,85]. These papers detail the methodology for understanding the correlation between the average amplitude of the output IF signal and the dielectric parameters of the MUT. The radar experiments have also shown that by adding a 3D printed fixture device, we can greatly expand the interaction between the lossy glucose samples and the electromagnetic wave which, as a consequence, improves the glucose sensing accuracy and repeatability. Additionally, the influences of the instrumental and environmental factors were minimized by holding the glucose-sensing experimentation in a controlled environment where both the heat and temperature were controlled and monitored. Since the reflected magnitudes of the mm-waves are enormously dependent on the dielectric properties of the tested glucose samples, and those properties are known to be a function of the sample temperature, therefore, all the blood samples were stored in the same temperature condition of 22 ± 1 °C. All the radar experiments were performed in the same room environment of 22 ± 1 °C regulated temperature. A metal sheet is also installed behind the radar and used as a heat sink to dissipate any overheating might occur for the radar device. The effectiveness of these applied solutions is reflected in the strong repeatability of the collected raw data from the radar sensor. In the analysis of the radar raw data, averaging is used for processing the data sets of the three measurement trials collected for each blood glucose sample. This would help to increase the strength of the reflected mm-wave signals relative to all sources of noise in the experiment environment including the minor displacements of the test tubes. Additionally, the gating is employed to extract the raw data collected in specific radar channels that are shown to be more stable than others. The radar results are shown to be essentially consistent with the dielectric spectroscopy collected via the DAK-TL system. It is noticed that in the experimented radar setup where a high reflecting surface was employed behind the blood samples, the mm-wave signals were reflected with greater energy for blood samples of higher glucose concentrations, a phenomenon that can be explained by the fact that incident mm-wave signals encountered less absorption and attenuation inside higher-concentrated samples compared to the those of lower glucose content. This is also evident by the DAK-TL mm-wave (50–67 GHz) measurements that showed a decrease in the loss tangent when the amount of glucose dissolved in the aqueous solution is increased.
This work is an initial step toward the goal of modeling human blood for continuous monitoring using a wearable radar device. We plan to investigate the suitability of adopting the sensor system by connecting flexible antennas to measure authentic healthy and diabetic blood samples. This is done by linking the blood samples to simulated human tissue-equivalent phantoms to explore how different skin layers and interstitial fluid concentrations will affect the system’s sensitivity to glucose variations. Such a proposed sensing system, that to our knowledge does not yet exist, will allow real-time glucose-level monitoring for diabetic patients, thereby leading to better management of diabetes and earlier warning of adverse events such as strokes, diabetic coma, and heart attacks. Moreover, integrating machine learning and signal processing in the proposed system will be beneficial in a critical care situation where the patient’s data can be analyzed in real-time, and hence provide the physicians greater insights to aid in clinical assessments and diagnoses that are more accurate.
6. Conclusions
Towards the purpose of developing a non-invasive glucose monitoring sensor for diabetics, in this paper, the dielectric properties of binary glucose-water samples of small concentrations like blood glucose levels of diabetics were first investigated through measurements using a commercial coaxial kit in the broad band 300 MHz–67 GHz. The mm-wave range 50–67 GHz has shown to be promising for differentiating between glucose samples as demonstrated by the noticeable trend among various concentrations and the amount of change in dielectric constant and loss tangent due to varying glucose level. Using this finding, an integrated low-cost mm-wave radar is proposed as a sensing platform for a novel remote glucose level detection. To verify the concept, synthetic blood samples were identified according to the glucose concentration dissolved in each. The mm-wave radar exhibited a sensitive detection capability with high sensitivity to the small disparities in blood glucose concentrations as demonstrated by the scattered raw data collected via the radar receiving channels. Signal processing of the radar raw data has shown that blood samples of higher glucose concentrations resulted in reflected signals of greater energy, which allows for the identification of various glucose concentrations via the correlation with the reflected mm-wave readings. We believe that these preliminary results represent a fundamental finding that paves the way towards direct sensing of blood inside the human body.
Author Contributions
Conceptualization, G.S.; methodology, A.E.O., S.S.-N., and G.S.; formal analysis, A.E.O. and G.S.; investigation, A.E.O. and G.S.; resources, S.S.-N., R.H., and G.S.; data curation, A.E.O.; writing—original draft preparation, A.E.O.; writing—review and editing, S.S.-N. and G.S.; supervision, S.S.-N. and G.S.; funding acquisition, S.S.-N. and G.S. All authors have read and agreed to the published version of the manuscript.
Funding
This research was funded by NSERC, NSERC CREATE grant for training in Global Biomedical Technology Research and Innovation, Schlegel-UW Research Institute of Aging (UW-RIA), and by Google’s Advanced Technology and Projects group (ATAP).
Acknowledgments
This research was conducted with the approval of the Clinical Research Ethics Committee in the University of Waterloo (project number 31235). The authors would like to thank all the volunteers who donated their blood samples for some experiments in this research.
Conflicts of Interest
On behalf of all authors, the corresponding author states that there is no conflict of interest.
References
- Whiting, D.; Guariguata, L.; Weil, C.; Shaw, J.; IDF, J. Diabetes Atlas: Global estimates of the prevalence of diabetes for 2011 and 2030. Diabetes Res. Clin. Pract. 2011, 94, 311–321. [Google Scholar] [CrossRef] [PubMed]
- WHO. World Health Day 2016: WHO calls for global action to halt rise in and improve care for people with diabetes. In Technical Report 2016; World Health Org.: Geneva, Switzerland, 2016. [Google Scholar]
- Cano-Garcia, H.; Kosmas, P.; Sotiriou, I.; Papadopoulos-Kelidis, I.; Parini, C.; Gouzouasis, I.; Palikaras, G.; Kallos, E. Detection of glucose variability in saline solutions from transmission and reflection measurements using V-band waveguides. Meas. Sci. Technol. 2015, 26, 125701–125710. [Google Scholar] [CrossRef]
- American Diabetes Association. Diagnosis and classification of diabetes mellitus. Diabetes Care 2014, 37, S81–S90. [Google Scholar] [CrossRef] [PubMed] [Green Version]
- Holt, R.; Cockram, C.; Flyvbjerg, A.; Goldstein, B. Textbook of Diabetes; John Wiley & Sons: New York, NY, USA, 2011. [Google Scholar]
- Canadian Diabetes Association: Diabetes Self-Care. Available online: https://www.diabetes.ca/advocacy---policies/our-policy-positions/diabetes-self-care-in-public-places (accessed on 12 January 2019).
- Cunningham, D.; Stenken, J. In Vivo Glucose Sensing; John Wiley & Sons: Hoboken, NJ, USA, 2009. [Google Scholar]
- Sieg, A.; Guy, R.H.; Delgado-Charro, M.B. Noninvasive and minimally invasive methods for transdermal glucose monitoring. Diabetes Technol. Ther. 2005, 7, 174–197. [Google Scholar] [CrossRef] [PubMed]
- Weiss, R.; Yegorchikov, Y.; Shusterman, A.; Raz, I. Noninvasive continuous glucose monitoring using photoacoustic technology—Results from the first 62 subjects. Diabetes Technol. Ther. 2007, 9, 68–74. [Google Scholar] [CrossRef] [PubMed]
- Garg, S.; Zisser, H.; Schwartz, S.; Bailey, T.; Kaplan, R.; Ellis, S.; Jovanovic, L. Improvement in glycemic excursions with a transcutaneous, real-time continuous glucose sensor: A randomized controlled trial. Diabetes Care 2006, 29, 44–50. [Google Scholar] [CrossRef]
- Amir, O.; Weinstein, D.; Zilberman, S.; Less, M.; Perl-Treves, D.; Primack, H.; Weinstein, A.; Gabis, E.; Fikhte, B.; Karasik, A. Continuous Noninvasive Glucose Monitoring Technology Based on “Occlusion Spectroscopy”. J. Diabetes Sci. Technol. 2007, 1, 463–469. [Google Scholar] [CrossRef] [Green Version]
- Hotmartua, R.; Pangestu, P.W.; Zakaria, H.; Irawan, Y.S. Noninvasive Blood Glucose Detection Using Near Infrared Sensor. In Proceedings of the International Conference on Electrical Engineering and Informatics (ICEEI), Denpasar, Indonesia, 10–11 August 2015; pp. 687–692. [Google Scholar]
- Yadav, J.; Rani, A.; Singh, V.; Murari, B.M. Near-Infrared LED Based Non-Invasive Blood Glucose Sensor. In Proceedings of the International Conference on Signal Processing and Integrated Networks (SPIN), Noida, India, 20–21 February 2014; pp. 591–594. [Google Scholar]
- Vashist, S.K. Non-invasive glucose monitoring technology in diabetes management: A review. Anal. Chim. Acta 2012, 750, 16–27. [Google Scholar] [CrossRef]
- Glennon, T.; O’Quigley, C.; McCaul, M.; Matzeu, G.; Beirne, S.; Wallace, G.G.; Stroiescu, F.; O’Mahoney, N.; White, P.; Diamond, D. ‘SWEATCH’: A wearable platform for harvesting and analyzing sweat sodium content. Electroanalysis 2016, 28, 1283–1289. [Google Scholar] [CrossRef]
- Heikenfeld, J. Non-invasive analyte access and sensing through eccrine sweat: Challenges and outlook circa. Electroanalysis 2016, 28, 1242–1249. [Google Scholar] [CrossRef]
- Guo, D.; Zhang, D.; Zhang, L.; Lu, G. Non-invasive blood glucose monitoring for diabetics by means of breath signal analysis. Sens. Actuators B Chem. 2012, 173, 106–113. [Google Scholar] [CrossRef]
- Malik, S.; Gupta, S.; Khadgawat, R.; Anand, S. A Novel Non-Invasive Blood Glucose Monitoring Approach Using Saliva. In Proceedings of the IEEE International Conference on Signal Processing, Informatics, Communication and Energy Systems (SPICES), Kozhikode, India, 19–21 February 2015. [Google Scholar]
- Gao, W.; Emaminejad, S.; Nyein, H.Y.; Challa, S.; Chen, K.; Peck, A.; Javey, A. Fully integrated wearable sensor arrays for multiplexed in situ perspiration analysis. Nature 2016, 529, 509–514. [Google Scholar] [CrossRef] [PubMed] [Green Version]
- Zhang, J.; Hodge, W.; Hutnick, C.; Wang, X. Noninvasive Diagnostic Devices for Diabetes through Measuring Tear Glucose. J. Diabetes Sci. Technol. 2011, 5, 166–172. [Google Scholar] [CrossRef] [PubMed] [Green Version]
- Choi, H.; Naylon, J.; Luzio, S.; Beutler, J.; Birchall, J.; Martin, C.; Porch, A. Design and In Vitro Interference Test of Microwave Noninvasive Blood Glucose Monitoring Sensor. IEEE Trans. Microw. Theory Tech. 2015, 63, 3016–3025. [Google Scholar] [CrossRef] [PubMed] [Green Version]
- Kim, J.; Hovsepyan, A.; Babajanyan, A.; Lee, K.; Friedman, B. Microwave dielectric resonator biosensor for aqueous glucose solution. Rev. Sci. Instrum. 2008, 79, 086107–086109. [Google Scholar] [CrossRef] [PubMed]
- Cano-Garcia, H.; Gouzouasis, I.; Sotiriou, I.; Saha, S.; Palikaras, G.; Kosmas, P.; Kallos, E. Reflection and Transmission Measurements Using 60 GHz Patch Antennas in the Presence of Animal Tissue for Non-Invasive Glucose Sensing. In Proceedings of the 10th European Conference on Antennas and Propagation (EuCAP), Davos, Switzerland, 10–15 April 2016; pp. 1–3. [Google Scholar]
- Siegel, P.H.; Lee, Y.; Pikov, V. Millimeter-Wave Non-Invasive Monitoring of Glucose in Anesthetized Rats. In Proceedings of the International Conference on Infrared, Millimeter, and Terahertz Waves (IRMMW-THz), Tucson, AZ, USA, 14–19 September 2014; pp. 1–2. [Google Scholar]
- Hofmann, M.; Bloss, M.; Weigel, R.; Fischer, G.; Kissinger, D. Non-Invasive Glucose Monitoring Using Open Electromagnetic Waveguides. In Proceedings of the 42nd European Microwave Conference, Amsterdam, The Netherlands, 29 October–1 November 2012; pp. 546–549. [Google Scholar]
- Baker-Jarvis, J.; Janezic, M.D.; Domich, P.D.; Geyer, R. Analysis of an Open-Ended Coaxial Probe with Lift-Off for Nondestructive Testing. IEEE Trans. Instrum. Meas. 1994, 43, 711–718. [Google Scholar] [CrossRef] [Green Version]
- Bakhtiari, S.; Ganchev, S.I.; Zoughi, R. Analysis of radiation from an open-ended coaxial line into stratified dielectrics. IEEE Trans. Microw. Theory Tech. 1994, 42, 1261–1267. [Google Scholar] [CrossRef]
- Meaney, P.M.; Gregory, A.P.; Seppälä, J.; Lahtinen, T. Open-Ended Coaxial Dielectric Probe Effective Penetration Depth Determination. IEEE Trans. Microw. Theory Tech. 2016, 64, 915–923. [Google Scholar] [CrossRef] [Green Version]
- Omer, A.E.; Shaker, G.; Safavi-Naeini, S.; Shubair, R.M. EM Measurements of Glucose-Aqueous Solutions. In Proceedings of the 2019 IEEE International Symposium on Antennas and Propagation and USNC-URSI Radio Science Meeting, Atlanta, GA, USA, 7–12 July 2019; pp. 103–104. [Google Scholar]
- Shimin, D. A New Method for Measuring Dielectric Constant Using the Resonant Frequency of a Patch Antenna. IEEE Trans. Microw. Theory Tech. 1986, 34, 923–931. [Google Scholar] [CrossRef]
- Bernard, P.A.; Gautray, J.M. Measurement of dielectric constant using a microstrip ring resonator. IEEE Trans. Microw. Theory Tech. 1991, 39, 592–595. [Google Scholar] [CrossRef]
- Noviosense. Available online: http://noviosense.com/ (accessed on 22 September 2019).
- Novartis. Available online: http://www.novartis.com/ (accessed on 22 September 2019).
- QuickLLC. Available online: http://www.iquickitsalivaanalyzer.com/ (accessed on 22 September 2019).
- Cnoga Medical. Available online: http://cnogacare.co/portfolioitem/combo-glucometer/ (accessed on 22 September 2019).
- Glucosense Diagnostic Ltd. Available online: http://www.glucosense.net/ (accessed on 22 September 2019).
- Grove Instruments. Available online: http://www.groveinstruments.com/ (accessed on 22 September 2019).
- Harman-Boehm, I.; Gal, A.; Raykhman, A.M.; Naidis, E.; Mayzel, Y. Noninvasive glucose monitoring: Increasing accuracy by combination of multi-technology and multi-sensors. J. Diabetes Sci. Technol. 2010, 4, 583–595. [Google Scholar] [CrossRef] [PubMed] [Green Version]
- Gouzouasis, I.; Cano-Garcia, H.; Sotiriou, I.; Saha, S.C.; Palikaras, G.; Kosmas, P.; Kallos, E. Detection of Varying Glucose Concentrations in Water Solutions Using a Prototype Biomedical Device for Millimeter-Wave Non-Invasive Glucose Sensing. In Proceedings of the 10th European Conference on Antennas and Propagation (EuCAP), Davos, Switzerland, 10–15 April 2016; pp. 1–4. [Google Scholar]
- Glucowise. Available online: http://www.gluco-wise.com/ (accessed on 22 September 2019).
- Amrane, S.; Azami, N.; Elboulqe, Y. Optimized Algorithm of Dermis Detection for Glucose Blood Monitoring Based on Optical Coherence Tomography. In Proceedings of the 10th International Conference on Intelligent Systems: Theories and Applications (SITA), Rabat, Morocco, 20–21 October 2015; pp. 1–5. [Google Scholar]
- Wadamori, N. Behavior of Long-Period Measurements Using a Small-Sized Photoacoustic Cell for Aqueous Glucose Monitoring. In Proceedings of the 37th Annual International Conference of the IEEE Engineering in Medicine and Biology Society (EMBC), Milan, Italy, 25–29 August 2015; pp. 1267–1270. [Google Scholar]
- Ramasahayam, S.; Arora, L.; Chowdhury, S.R.; Anumukonda, M. FPGA Based System for Blood Glucose Sensing Using Photoplethysmography and Online Motion Artifact Correction Using Adaline. In Proceedings of the 2015 9th International Conference on Sensing Technology (ICST), Auckland, New Zealand, 8–10 December 2015; pp. 22–27. [Google Scholar]
- Asaduzzaman, A.; Samadarsinee, S.; Chidella, K.K. Simulating Multi Sensor Noninvasive Blood Glucose Monitoring Systems. In Proceedings of the SoutheastCon 2016, Norfolk, VA, USA, 30 March–3 April 2016; pp. 1–7. [Google Scholar]
- Pai, P.P.; Sanki, P.K.; De, A.; Banerjee, S. Nir Photoacoustic Spectroscopy for Non-Invasive Glucose Measurement. In Proceedings of the 37th Annual International Conference of the IEEE Engineering in Medicine and Biology Society (EMBC), Milan, Italy, 25–29 August 2015; pp. 7978–7981. [Google Scholar]
- Li, X.; Li, C. Research on Non-Invasive Glucose Concentration Measurement by NIR Transmission. In Proceedings of the IEEE International Conference on Computer and Communications (ICCC), Chengdu, China, 10–11 October 2015; pp. 223–228. [Google Scholar]
- Ling, S.H.; San, P.P.; Nguyen, H.T. Non-invasive hypoglycemia monitoring system using extreme learning machine for type 1 diabetes. ISA Trans. 2016, 64, 440–446. [Google Scholar] [CrossRef] [PubMed]
- Shao, J.; Yang, F.; Xia, F.; Zhang, Q.; Chen, Y. A Novel Miniature Spiral Sensor for Non-Invasive Blood Glucose Monitoring. In Proceedings of the 10th European Conference on Antennas and Propagation (EuCAP), Davos, Switzerland, 10–15 April 2016; pp. 1–2. [Google Scholar]
- Adhyapak, A.; Sidley, M.; Venkataraman, J. Analytical Model for Real Time, Noninvasive Estimation of Blood Glucose Level. In Proceedings of the 36th Annual International Conference of the IEEE Engineering in Medicine and Biology Society, Chicago, IL, USA, 26–30 August 2014; pp. 5020–5023. [Google Scholar]
- Baghbani, R.; Rad, M.A.; Pourziad, A. Microwave sensor for noninvasive glucose measurements design and implementation of a novel linear. IET Wirel. Sens. Syst. 2015, 5, 51–57. [Google Scholar] [CrossRef]
- Yilmaz, T.; Foster, R.; Hao, Y. Broadband tissue mimicking phantoms and a patch resonator for evaluating noninvasive monitoring of blood glucose levels. IEEE Trans. Antennas Propag. 2014, 62, 3064–3075. [Google Scholar] [CrossRef]
- Deshmukh, V.V.; Ghongade, R.B. Measurement of Dielectric Properties of Aqueous Glucose Using Planar Ring Resonator. In Proceedings of the International Conference on Microelectronics, Computing and Communications (MicroCom), Durgapur, India, 23–25 January 2016; pp. 1–5. [Google Scholar]
- XeThru: Single-Chip Radar Sensors with Sub-Mm Resolution. Available online: https://www.xethru.com/ (accessed on 23 September 2019).
- Project Soli—Google ATAP. Available online: https://atap.google.com/soli/ (accessed on 23 September 2019).
- Walabot Sensor Radio Frequency Technology for Advanced Detection. Available online: https://walabot.com/ (accessed on 23 September 2019).
- Yeo, H.-S.; Quigley, A. Radar Sensing in Human-computer Interaction. Interactions 2017, 25, 70–73. [Google Scholar] [CrossRef] [Green Version]
- Lien, J.; Gillian, N.; Karagozler, M.E.; Amihood, P.; Schwesig, C.; Olson, E.; Raja, H.; Poupyrev, I. Soli: Ubiquitous Gesture Sensing with Millimeter Wave Radar. ACM Trans. Graph. 2016, 35, 142–161. [Google Scholar] [CrossRef] [Green Version]
- Wang, S.; Song, J.; Lien, J.; Poupyrev, I.; Hilliges, O. Interacting with Soli: Exploring Fine-Grained Dynamic Gesture Recognition in the Radio-Frequency Spectrum. In Proceedings of the 29th Annual Symposium on User Interface Software and Technology (UIST ’16), Tokyo, Japan, 16–19 October 2016; pp. 851–860. [Google Scholar]
- Ens, B.; Quigley, A.; Yeo, H.-S.; Irani, P.; Piumsomboon, T.; Billinghurst, M. Exploring Mixed-Scale Gesture Interaction. In Proceedings of the SIGGRAPH Asia 2017 Posters (SA ’17), Bangkok, Thailand, 27–30 November 2017. [Google Scholar]
- Avrahami, D.; Patel, M.; Yamaura, Y.; Kratz, S. Below the Surface: Unobtrusive Activity Recognition for Work Surfaces Using RF-radar Sensing. In Proceedings of the 23rd International Conference on Intelligent User Interfaces (IUI ’18), Tokyo, Japan, 7–11 March 2018; pp. 439–451. [Google Scholar]
- Dhekne, A.; Gowda, M.; Zhao, Y.; Hassanieh, H.; Choudhury, R.R. LiquID: A Wireless Liquid IDentifier. In Proceedings of the 16th Annual International Conference on Mobile Systems, Applications, and Services (MobiSys ’18), Munich, Germany, 10–15 June 2018; pp. 442–454. [Google Scholar]
- Yeo, H.-S.; Flamich, G.; Schrempf, P.; Harris-Birtill, D.; Quigley, A. RadarCat: Radar Categorization for Input & Interaction. In Proceedings of the 29th Annual Symposium on User Interface Software and Technology (UIST ’16), Tokyo, Japan, 16–19 October 2016; pp. 833–841. [Google Scholar]
- Rahman, T.; Adams, A.; Ravichandran, R.V.; Zhang, M.; Patel, S.N.; Kientz, J.A.; Choudhury, T. DoppleSleep: A Contactless Unobtrusive Sleep Sensing System Using Short-Range Doppler Radar. In Proceedings of the 2015 ACM International Joint Conference on Pervasive and Ubiquitous Computing (UbiComp ’15), Osaka, Japan, 7–11 September 2015; pp. 39–50. [Google Scholar]
- Adib, F.; Mao, H.; Kabelac, Z.; Katabi, D.; Miller, R.C. Smart Homes That Monitor Breathing and Heart Rate. In Proceedings of the 33rd Annual ACM Conference on Human Factors in Computing Systems (CHI ’15), Seoul, Republic of Korea, 18–23 April 2015; pp. 837–846. [Google Scholar]
- Zhao, M.; Li, T.; Abu Alsheikh, M.; Tian, Y.; Zhao, H.; Torralba, A.; Katabi, D. Through-Wall Human Pose Estimation Using Radio Signals. In Proceedings of the 2018 IEEE/CVF Conference on Computer Vision and Pattern Recognition (CVPR), Salt Lake City, UT, USA, 18–22 June 2018; pp. 7356–7365. [Google Scholar]
- Liu, S.; Shaker, G.; Safavi-Naeini, S.; Chong, J.M. Low-cost Gas Sensors Utilizing Mm-Wave Radars. In Proceedings of the 2017 IEEE International Symposium on Antennas and Propagation & USNC/URSI National Radio Science Meeting, San Diego, CA, USA, 9–15 July 2017; pp. 1853–1854. [Google Scholar]
- Shaker, G.; Smith, K.; Omer, A.E.; Liu, S.; Csech, C.; Wadhwa, U.; Safavi-Naeini, S.; Hughson, R. Non-Invasive Monitoring of Glucose Level Changes Utilizing a mm-Wave Radar System. Int. J. Mob. Hum. Comput. Interact. 2018, 10, 10–29. [Google Scholar] [CrossRef]
- Scientific American, “Fake Blood Made Scientific”. Available online: https://www.scientificamerican.com/article/fake-blood-made-scientific (accessed on 19 January 2018).
- Yaws, K.; Mixon, D.; Roach, W. Electromagnetic Properties of Tissue in the Optical Region. In Proceedings of the Biomedical Optics (BiOS), San Jose, CA, USA, 28 May 2004. [Google Scholar]
- Hofmann, M.; Fischer, G.; Weigel, R.; Kissinger, D. Microwave-based noninvasive concentration measurements for biomedical applications. IEEE Trans. Microw. Theory Tech. 2013, 61, 2195–2204. [Google Scholar] [CrossRef]
- Meriakri, V.V.; Chigrai, E.E.; Nikitin, I.P.; Parkhomenko, M.P. Dielectric Properties of Water Solutions with Small Content of Glucose in the Millimeter-Wave Band and the Determination of Glucose in Blood. In Proceedings of the International Kharkov Symposium Physics and Engrg. of Millimeter and Sub-Millimeter Waves (MSMW), Kharkov, Ukraine, 25–30 June 2007; pp. 873–875. [Google Scholar]
- Meriakri, V.V.; Chigrai, E.E.; Kim, D.; Nikitin, I.P.; Pangonis, L.I.; Parkhomenko, M.P.; Won, J.H. Dielectric properties of glucose solutions in the millimetre-wave range and control of glucose content in blood. Meas. Sci. Technol. 2007, 18, 977–982. [Google Scholar] [CrossRef]
- Saha, S.; Cano-Garcia, H.; Sotiriou, I.; Lipscombe, O.; Gouzouasis, I.; Koutsoupidou, M.; Palikaras, G.; MacKenzie, R.; Reeve, T.; Kosmas, P.; et al. A Glucose Sensing System Based on Transmission Measurements at Millimetre Waves using Micro strip Patch Antennas. Sci. Rep. 2017, 7, 6855–6865. [Google Scholar] [CrossRef] [Green Version]
- Brady, A.; McCabe, C.; McCann, M. Fundamentals of Medical Surgical Nursing; John Wiley & Sons: Hoboken, NJ, USA, 2013. [Google Scholar]
- Ekoé, J.; Punthakee, Z.; Ransom, T.; Prebtani, A.; Goldenberg, R. Screening for Type1 and Type2 Diabetes. Can. J. Diabetes 2013, 37, S12–S15. [Google Scholar] [CrossRef] [PubMed] [Green Version]
- Nasr, I.; Jungmaier, R.; Baheti, A.; Noppeney, D.; Bal, J.S.; Wojnowski, M.; Karagozler, E.; Raja, H.; Lien, J.; Poupyrev, I.; et al. A Highly Integrated 60 GHz 6-Channel Transceiver with Antenna in Package for Smart Sensing and Short-Range Communications. IEEE J. Solid State Circuits 2016, 51, 2066–2076. [Google Scholar] [CrossRef]
- Heinzel, G.; Rüdiger, A.; Schilling, R. Spectrum and Spectral Density Estimation by the Discrete Fourier transform (DFT), Including a Comprehensive List of Window Functions and Some New at-Top Windows; Technical Report; Albert-Einstein-Institut: Hannover, Germany, 2002. [Google Scholar]
- Omer, A.E.; Shaker, G.; Safavi-Naeini, S.; Murray, K.; Hughson, R. Glucose Levels Detection Using mm-Wave Radar. IEEE Sens. Lett. 2018, 2, 1–4. [Google Scholar] [CrossRef]
- Zhadobov, M.; Augustine, R.; Sauleau, R.; Alekseev, S.; Di Paola, A.; Le Quément, C.; Mahamoud, Y.S.; Le Dréan, Y. Complex permittivity of representative biological solutions in the 2–67 GHz range. Bioelectromagnetics 2012, 33, 346–355. [Google Scholar] [CrossRef] [PubMed]
- Nikawa, Y.; Someya, D. Application of Millimeter Waves to Measure Blood Sugar Level. In Proceedings of the 2001 Asia-Pacific Microwave Conference (Cat. No.01TH8577), Taipei, Taiwan, 3–6 December 2001; pp. 1303–1306. [Google Scholar]
- Turgul, V.; Kale, I. On the Accuracy of Complex Permittivity Model of Glucose/Water Solutions for Non-Invasive Microwave Blood Glucose Sensing. In Proceedings of the 2015 E-Health and Bioengineering Conference (EHB), Iasi, Romania, 19–21 November 2015; pp. 1–4. [Google Scholar]
- Karacolak, T.; Moreland, E.C.; Topsakal, E. Cole-Cole model for glucose-dependent dielectric properties of blood plasma for continuous glucose monitoring. Microw. Opt. Technol. Lett. 2013, 55, 1160–1164. [Google Scholar] [CrossRef]
- Hofmann, M.; Trenz, F.; Weigel, R.; Fischer, G.; Kissinger, D. A Microwave Sensing System for Aqueous Concentration Measurements Based on a Microwave Reflectometer. In Proceedings of the 2012 IEEE/MTT-S International Microwave Symposium Digest, Montreal, QC, Canada, 17–22 June 2012; pp. 1–3. [Google Scholar]
- Diederichs, K.; Qiu, A.; Shaker, G. Wireless Biometric Individual Identification Utilizing Millimeter Waves. IEEE Sens. Lett. 2017, 1, 1–4. [Google Scholar] [CrossRef]
- Yeo, H.-S.; Minami, R.; Rodriguez, K.; Shaker, G.; Quigley, A. Exploring Tangible Interactions with Radar Sensing. Proc. ACM Interact. Mob. Wearable Ubiquitous Technol. 2018, 2, 1–25. [Google Scholar] [CrossRef] [Green Version]
Figure 1.
DAK-TL system setup for dielectric measurements of glucose solutions.

Figure 2.
Dielectric measurements (dielectric constant and loss tangent) of glucose-loaded solutions at different frequency bands: (a) 300 MHz–10 GHz; (b) 6–30 GHz; (c) 30–50 GHz; (d) 50–67 GHz.
Figure 2.
Dielectric measurements (dielectric constant and loss tangent) of glucose-loaded solutions at different frequency bands: (a) 300 MHz–10 GHz; (b) 6–30 GHz; (c) 30–50 GHz; (d) 50–67 GHz.

Figure 3.
Comparative analysis for the clinical blood samples using PNA and glucometer: (a) Glucometer readings for the seven participants pre and post glucose consumption; (b) PNA measurements of the transmission coefficients for pre and post blood samples of two patients. Shaded windows show the frequency regions where both the PNA and glucometer patterns are consistent.

Figure 4.
Soli FMCW radar system: (a) Radar integrated system in package and 8mm X 10 mm radar transceiver chip; (b) Soli connection with PC for simple experimental setup for object identification; (c) The radar chip with antennas-in-chip, Tx/Rx positions and hardware architecture (adapted from [57]).

Figure 5.
The radar experimental setup for glucose detection in blood test tubes: (a) Soli connection to PC; (b) The experiments setup showing the integrated system that employed mm-wave radar to detect changes in dielectric properties of samples with different glucose levels. PC interface where the collected raw data were monitored and processed using DSP algorithms for accurate identification.

Figure 6.
Raw data collected via radar channel 1 for glucose concentrations 0.5–3.5 mg/mL. Each subfigure shows the three measurement trials for each blood glucose concentration sample.
Figure 6.
Raw data collected via radar channel 1 for glucose concentrations 0.5–3.5 mg/mL. Each subfigure shows the three measurement trials for each blood glucose concentration sample.

Figure 7.
Raw data collected via radar channel 2 for glucose concentrations 0.5–3.5 mg/mL. Each subfigure shows the three measurement trials for each blood glucose concentration sample.
Figure 7.
Raw data collected via radar channel 2 for glucose concentrations 0.5–3.5 mg/mL. Each subfigure shows the three measurement trials for each blood glucose concentration sample.

Figure 8.
Averages of absolute magnitudes in the three trials and corresponding error.

Figure 9.
Average raw data in the three trials for each concentration across each radar channel: (a) channel 1; (b) channel 2.
Figure 9.
Average raw data in the three trials for each concentration across each radar channel: (a) channel 1; (b) channel 2.

Figure 10.
Raw data analysis (a) DFT result for data in channel 1 (enclosed plot is for the spectrum when shifted to the center); (b) DFT result for data in channel 2 (enclosed plot is for the spectrum when shifted to the center); (c) power spectral density estimation for data in channel 1; (d) power spectral density estimation for data in channel 2; (e) resultant energy for glucose concentrations in channel 1; (f) resultant energy for glucose concentrations in channel 2.


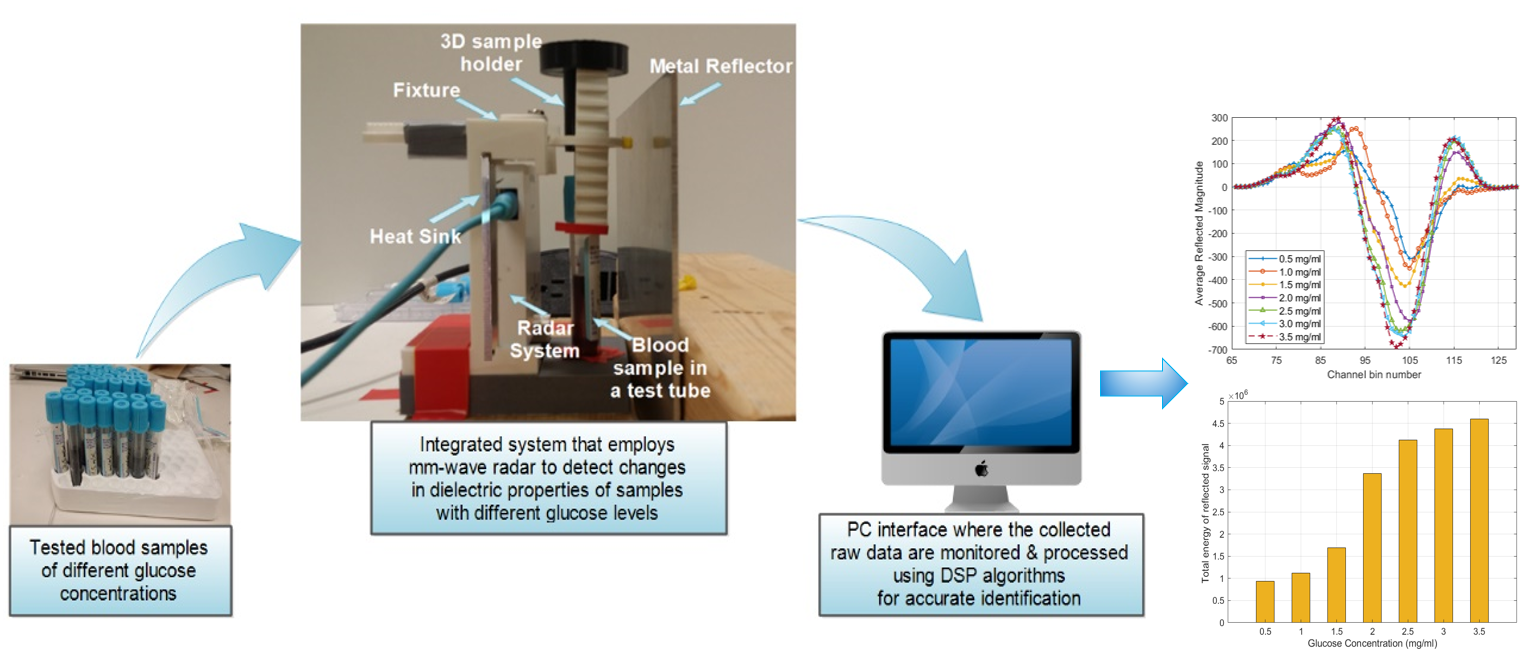
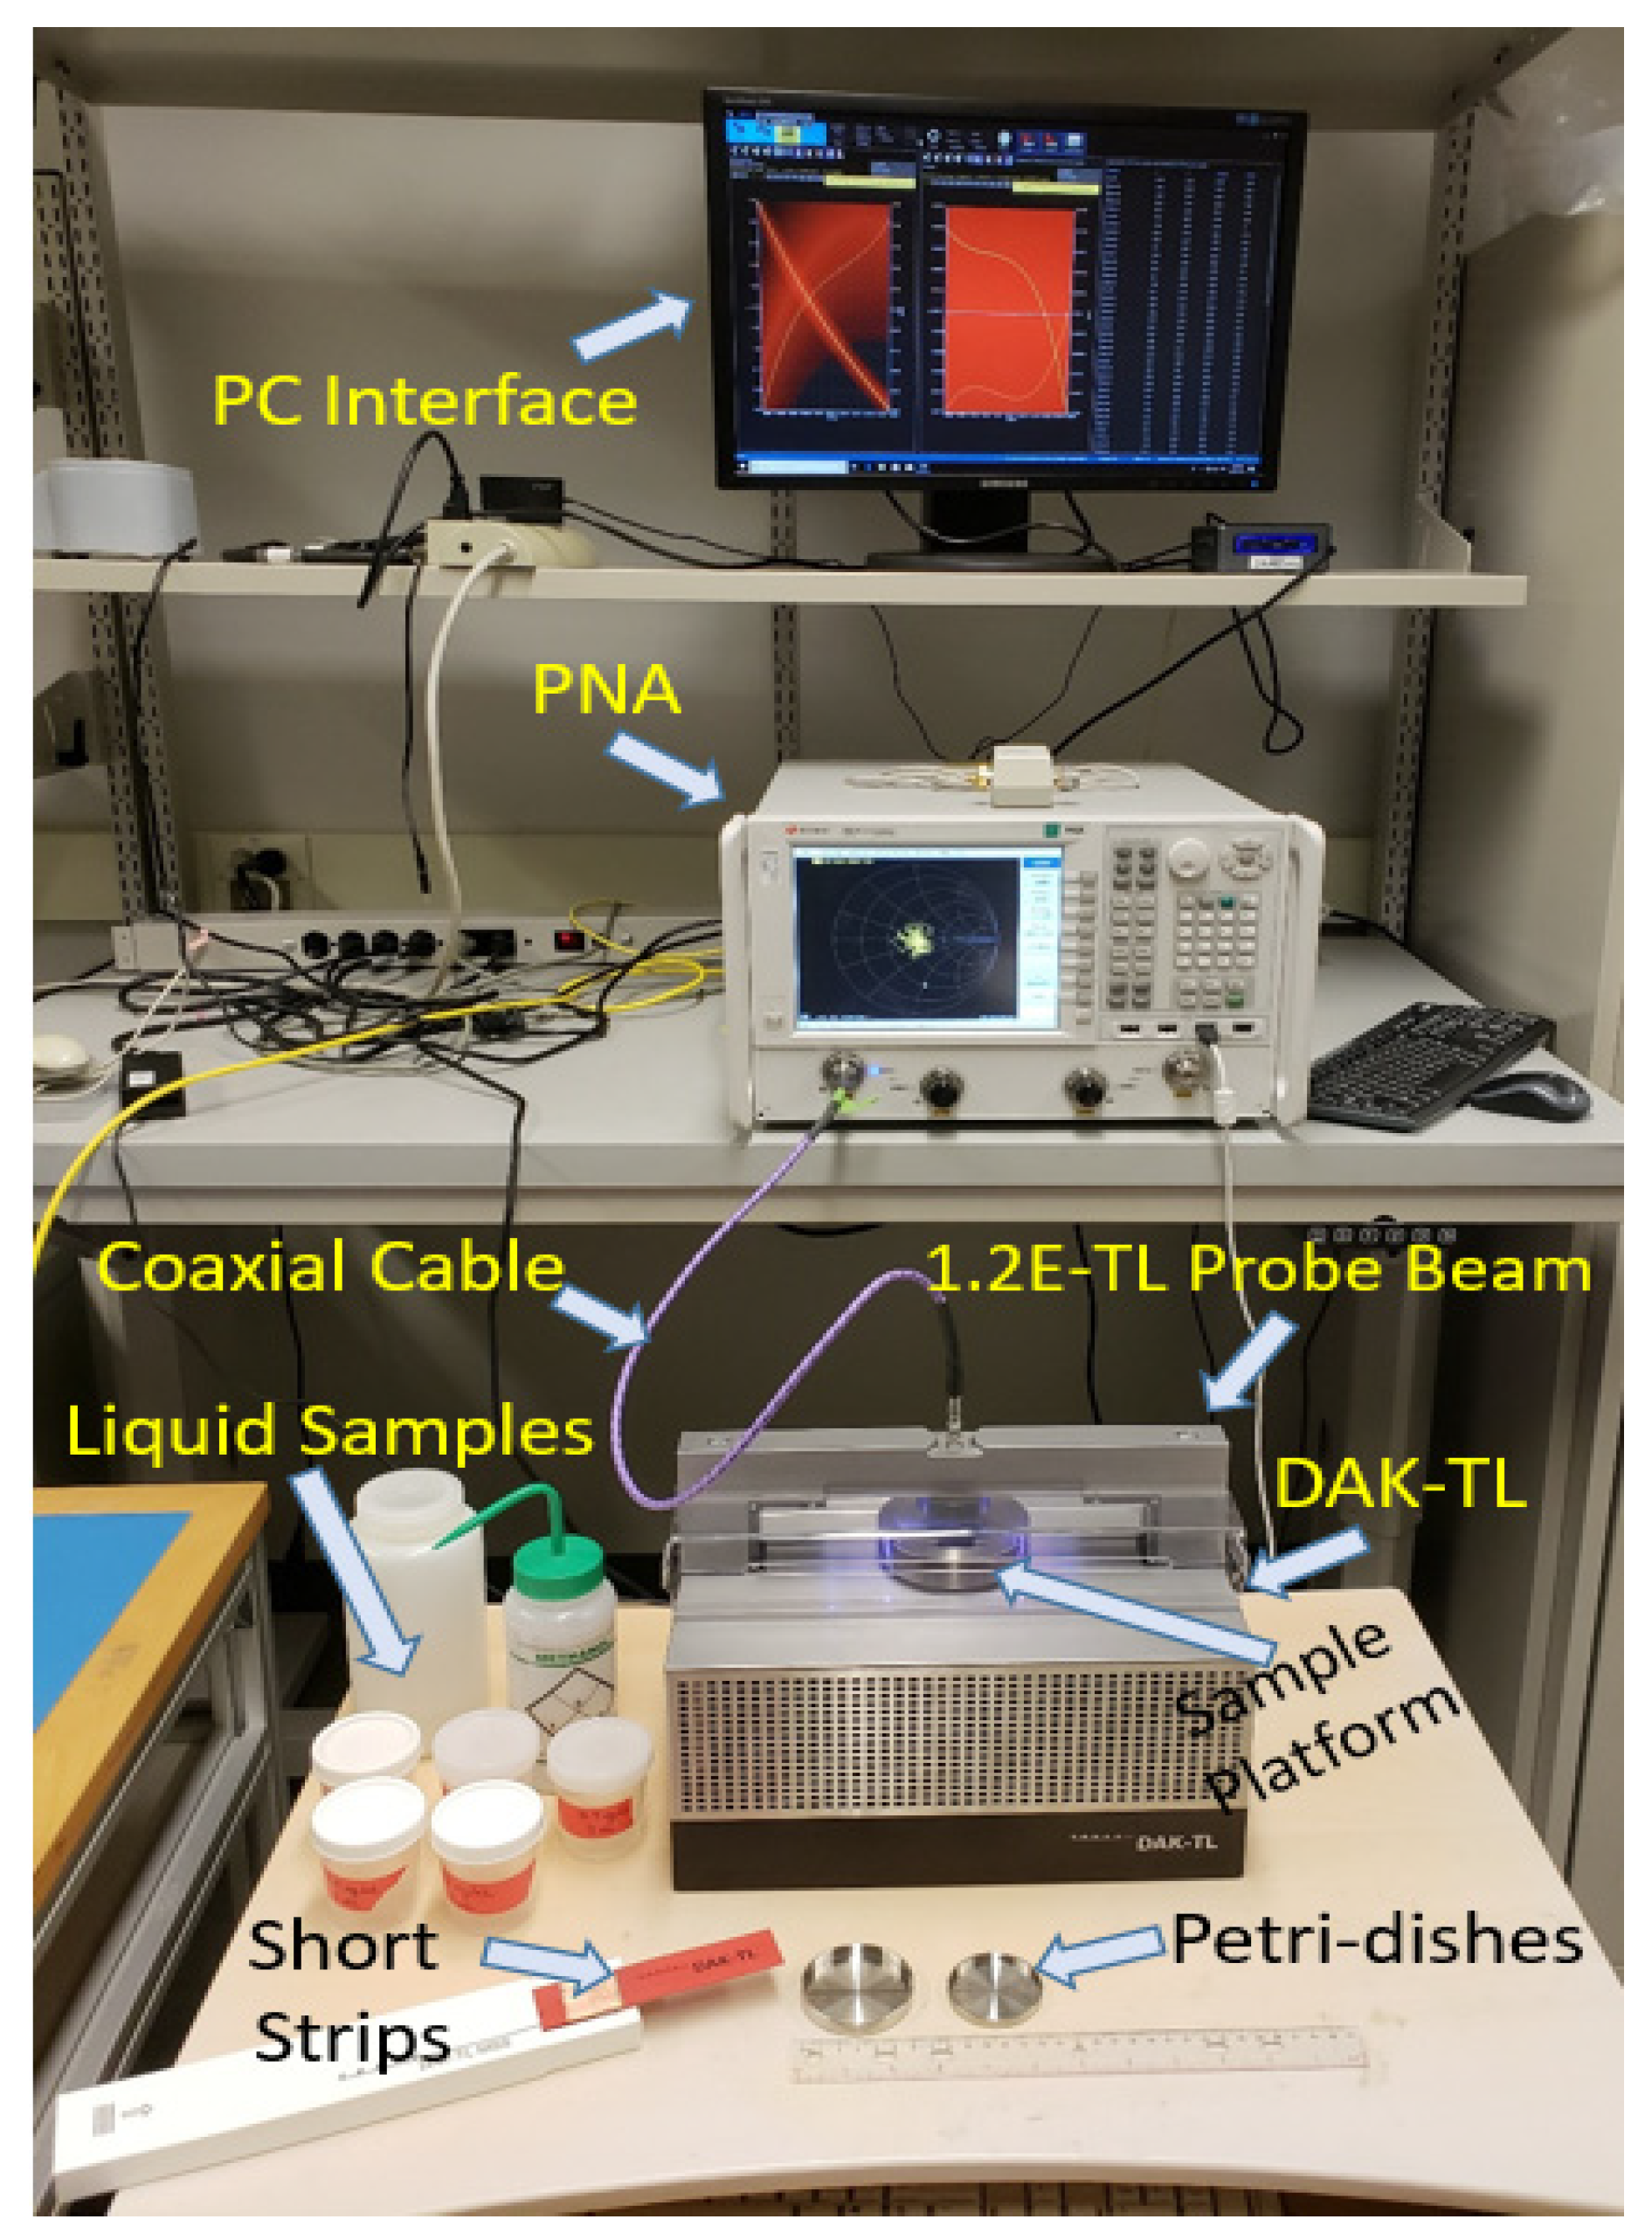
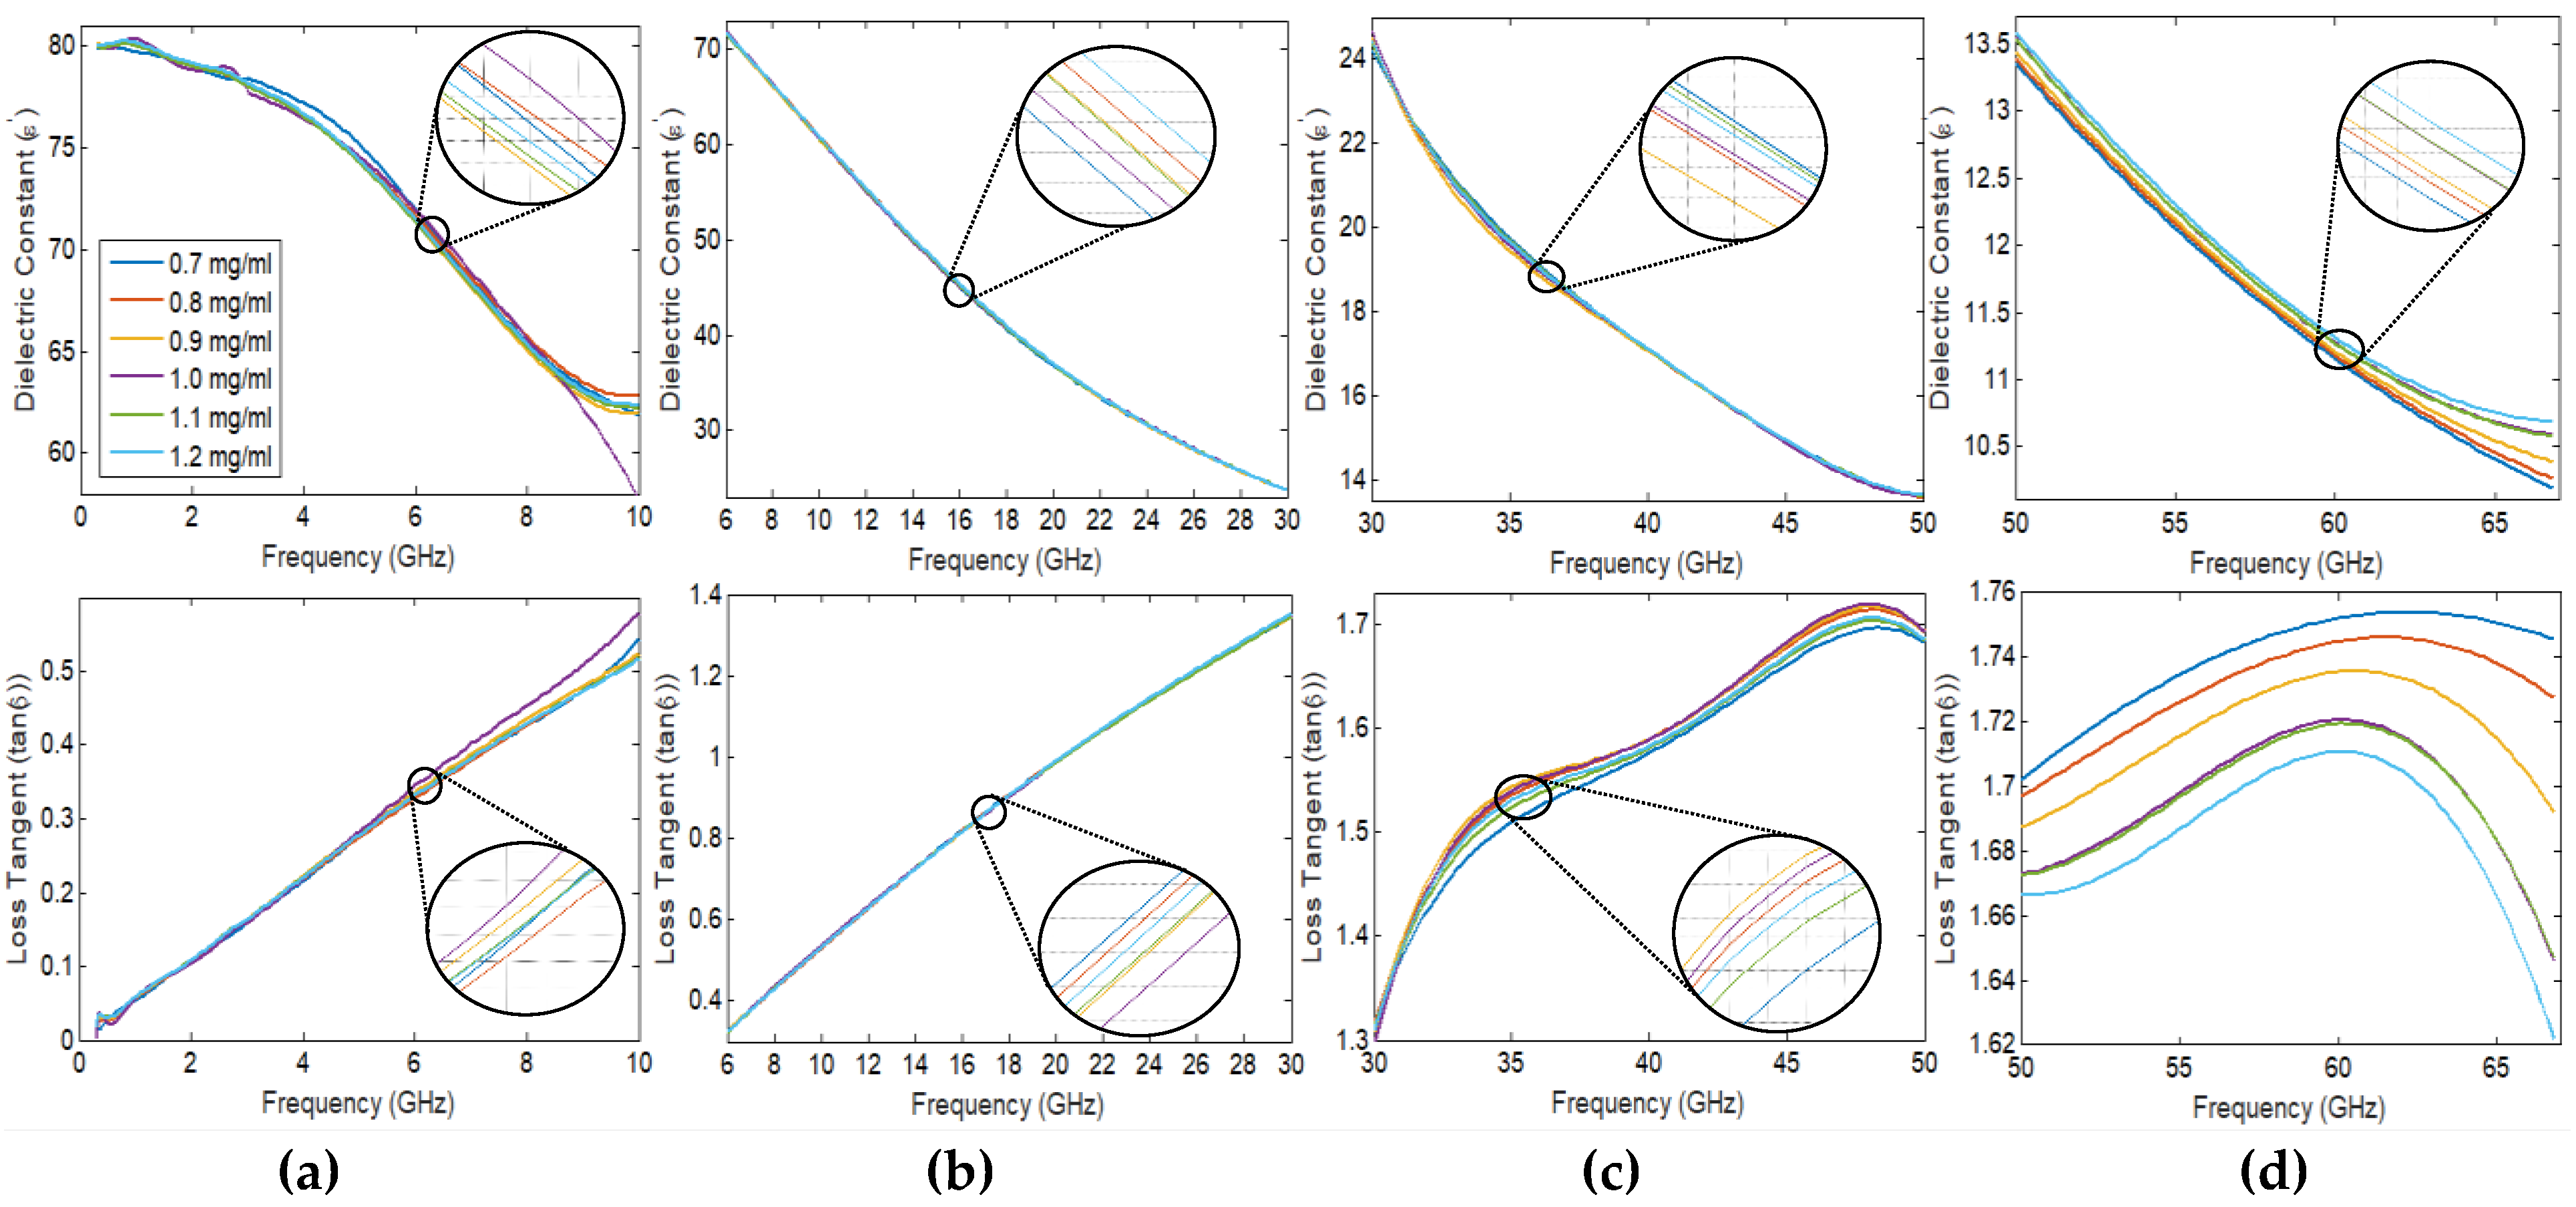
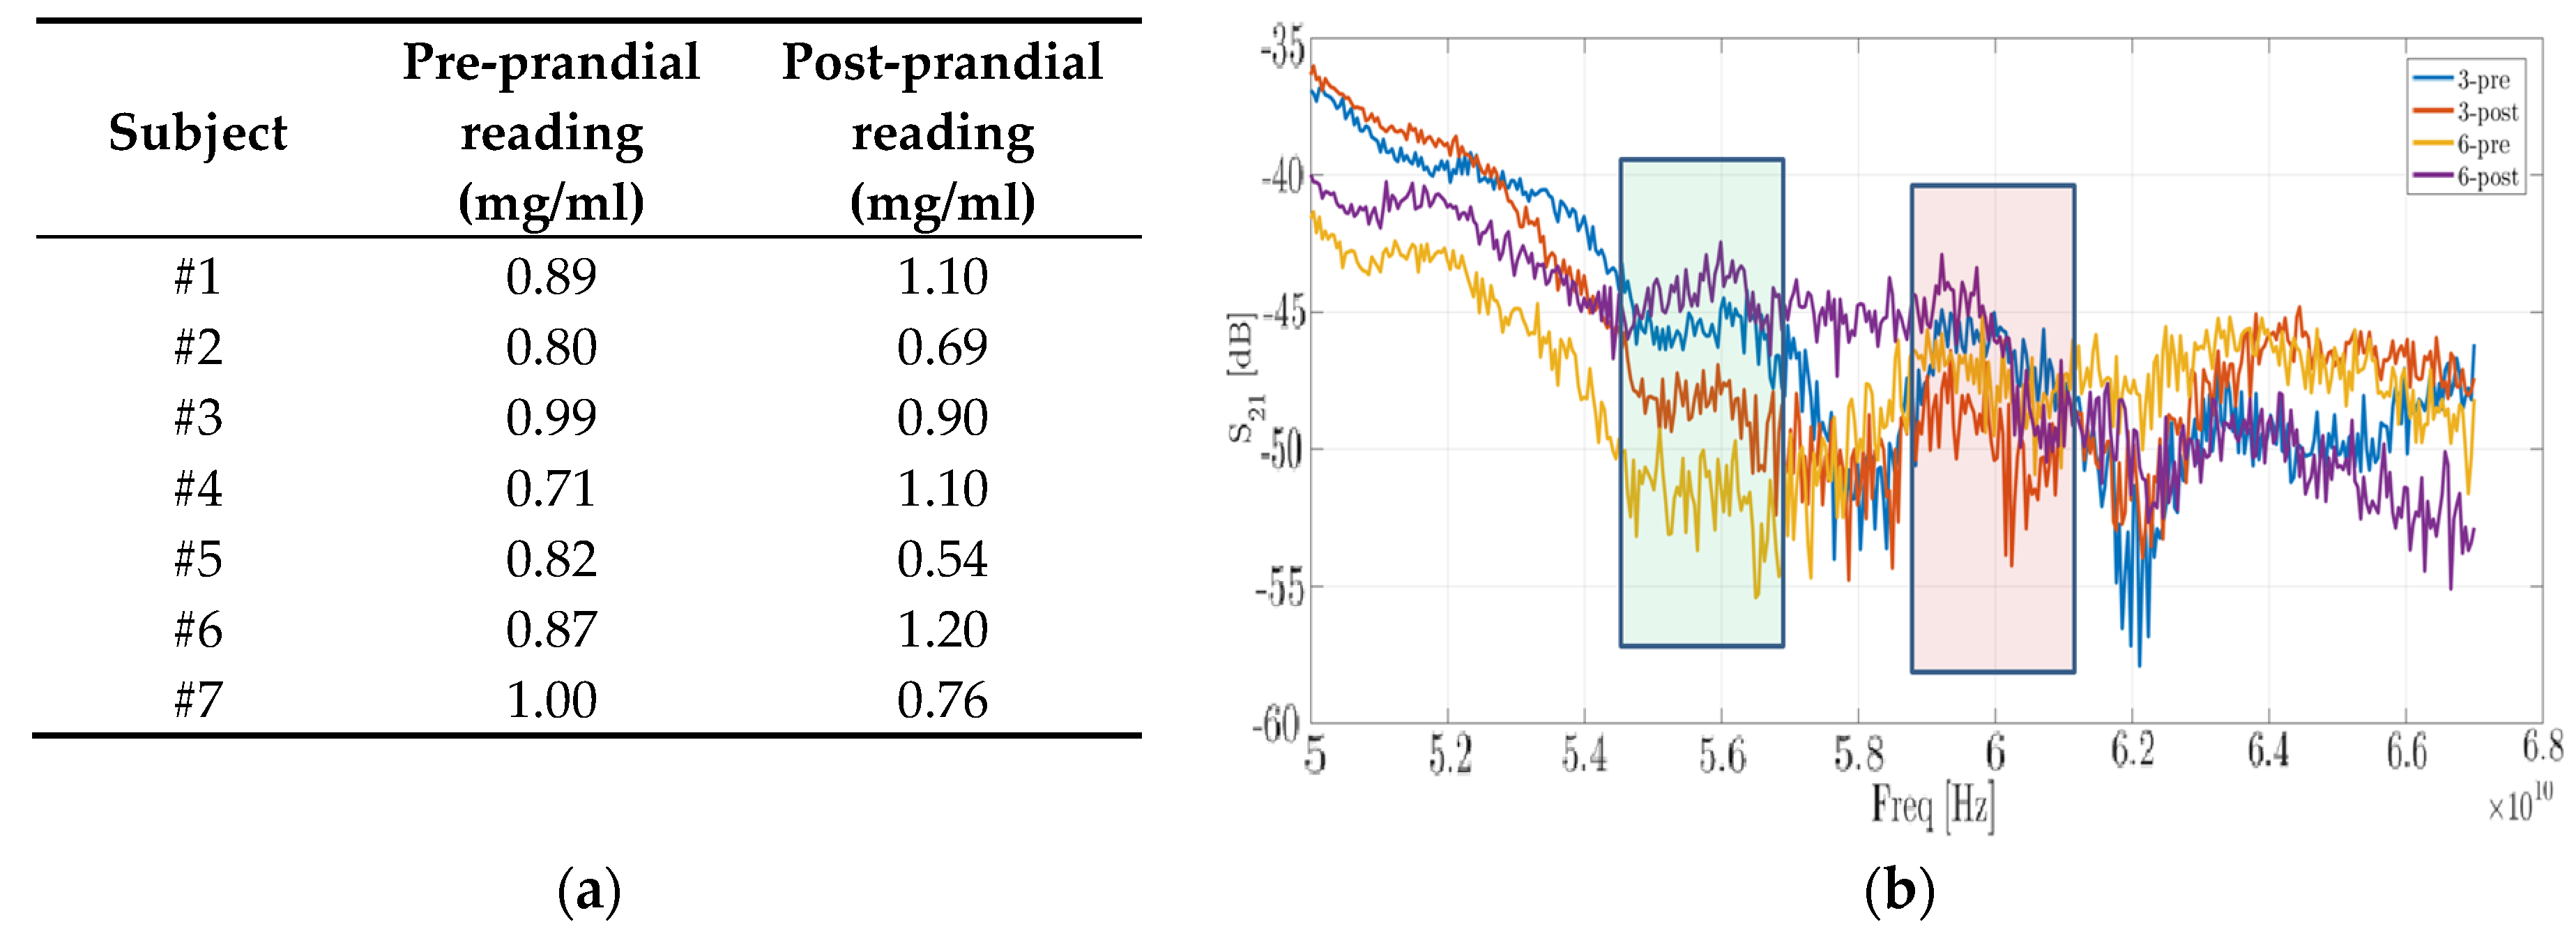
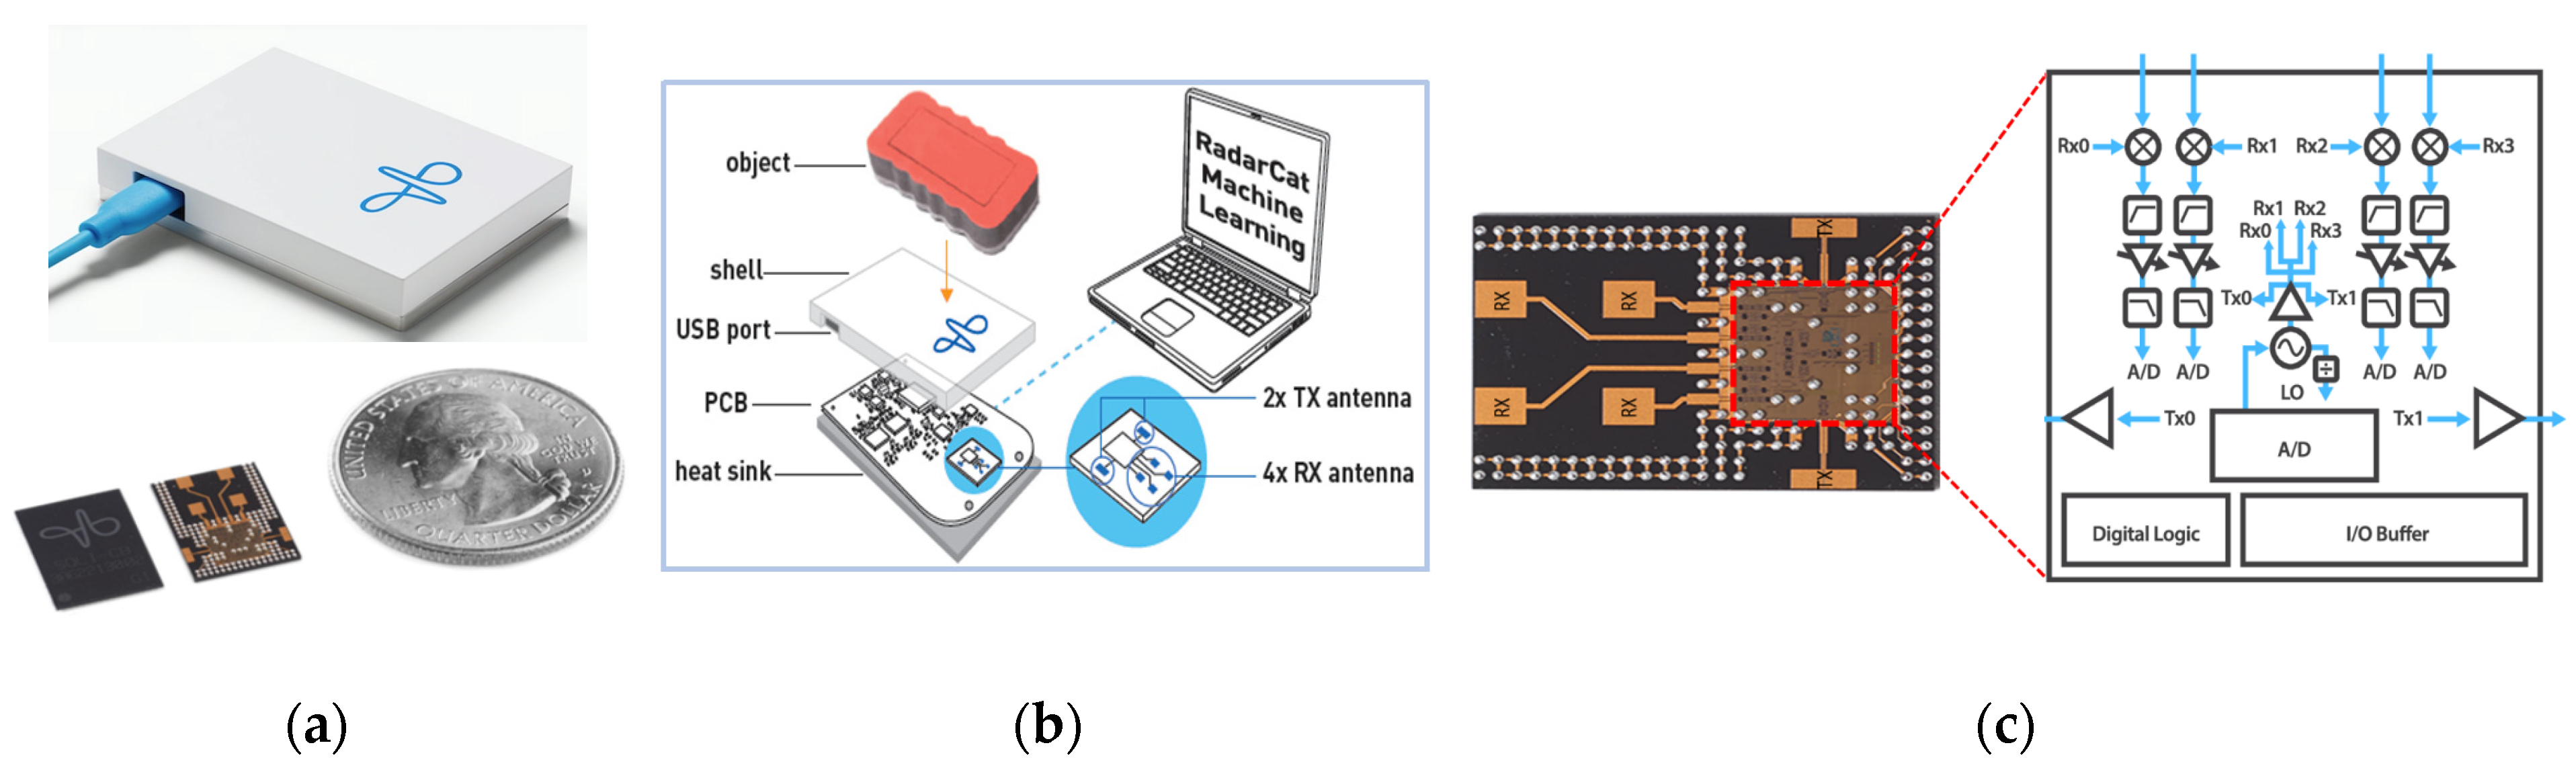
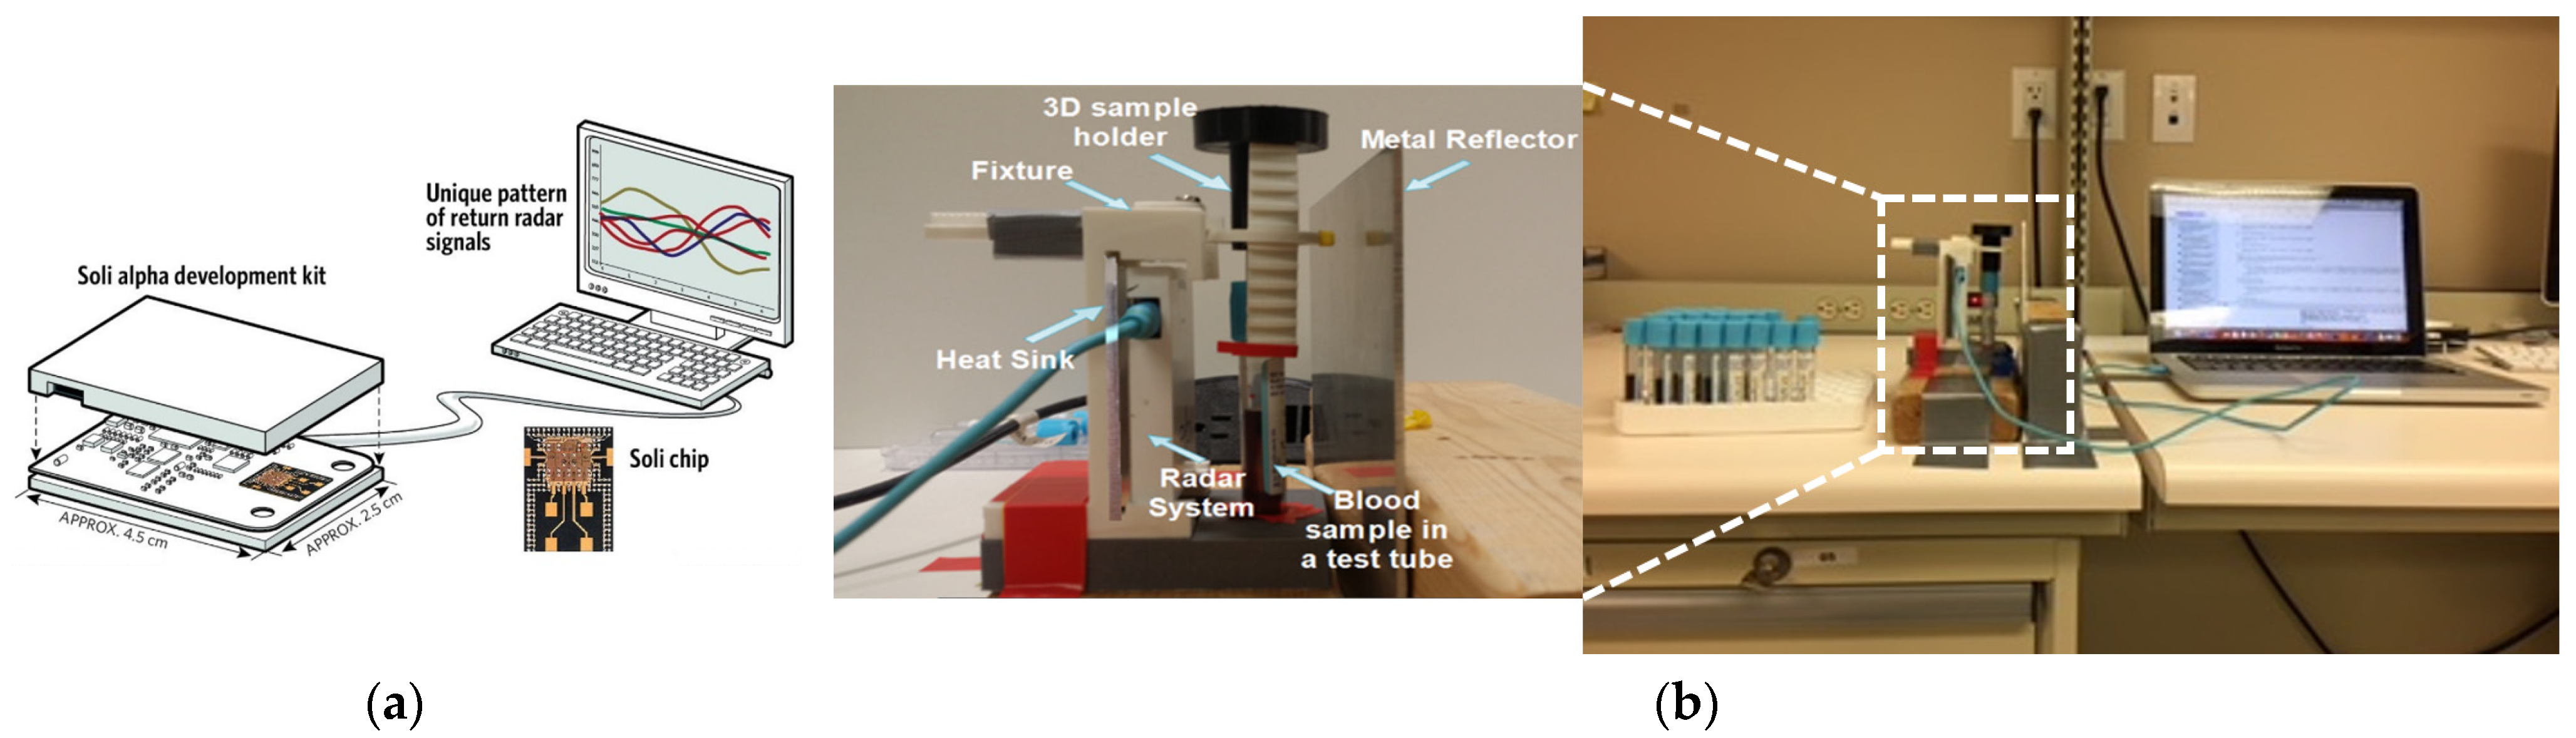
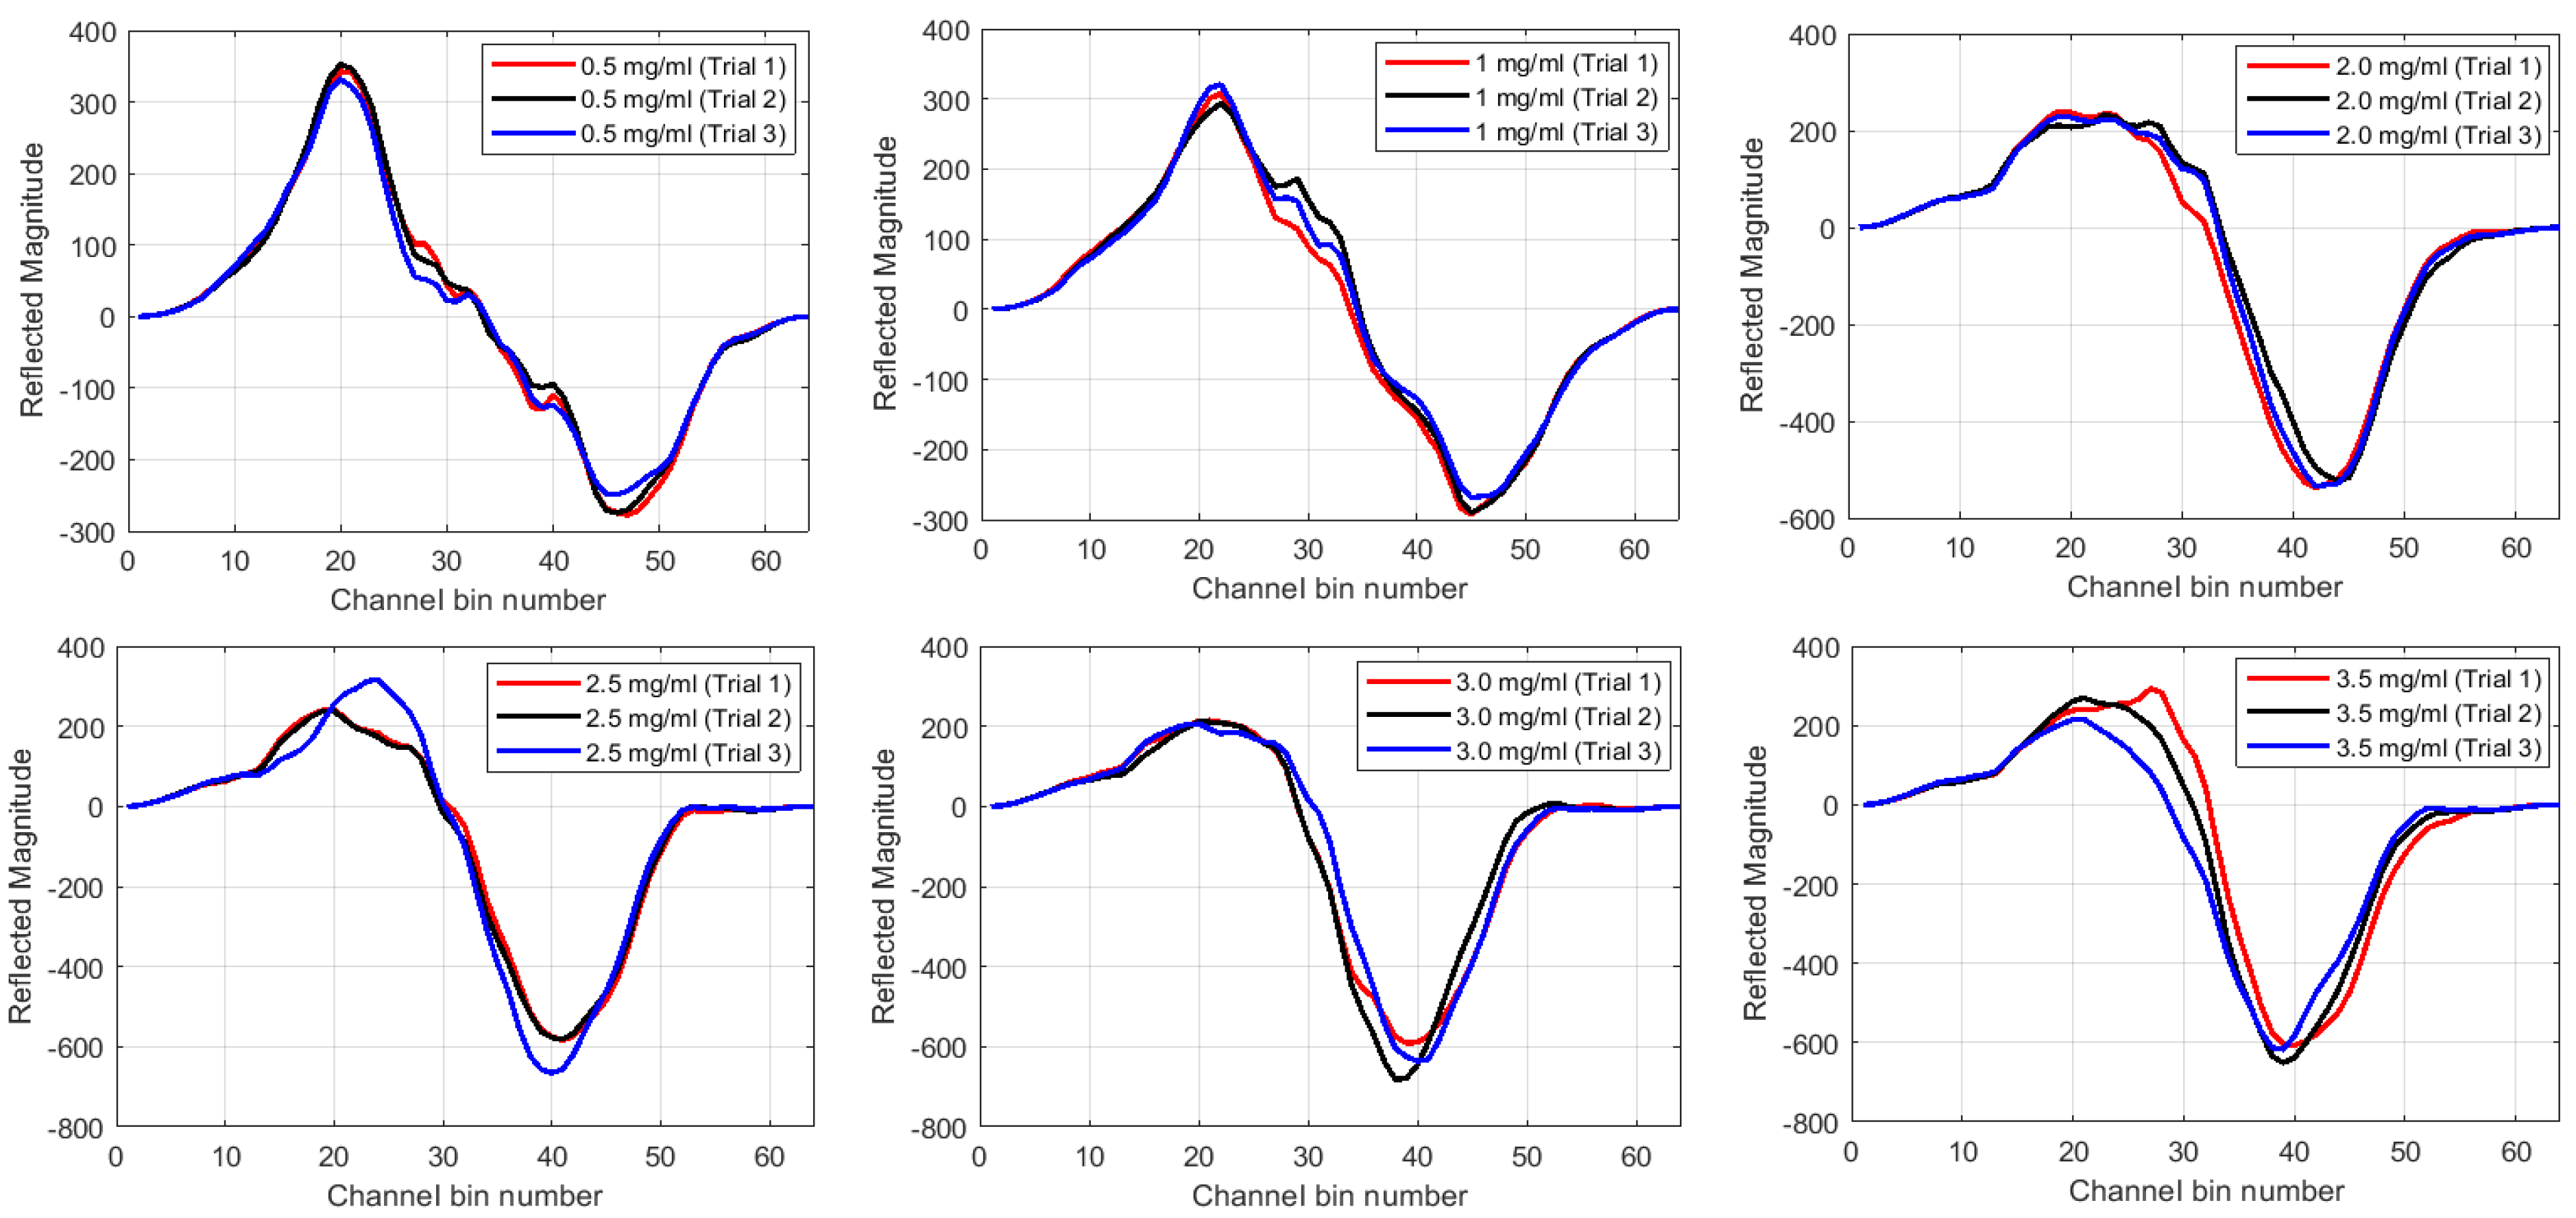
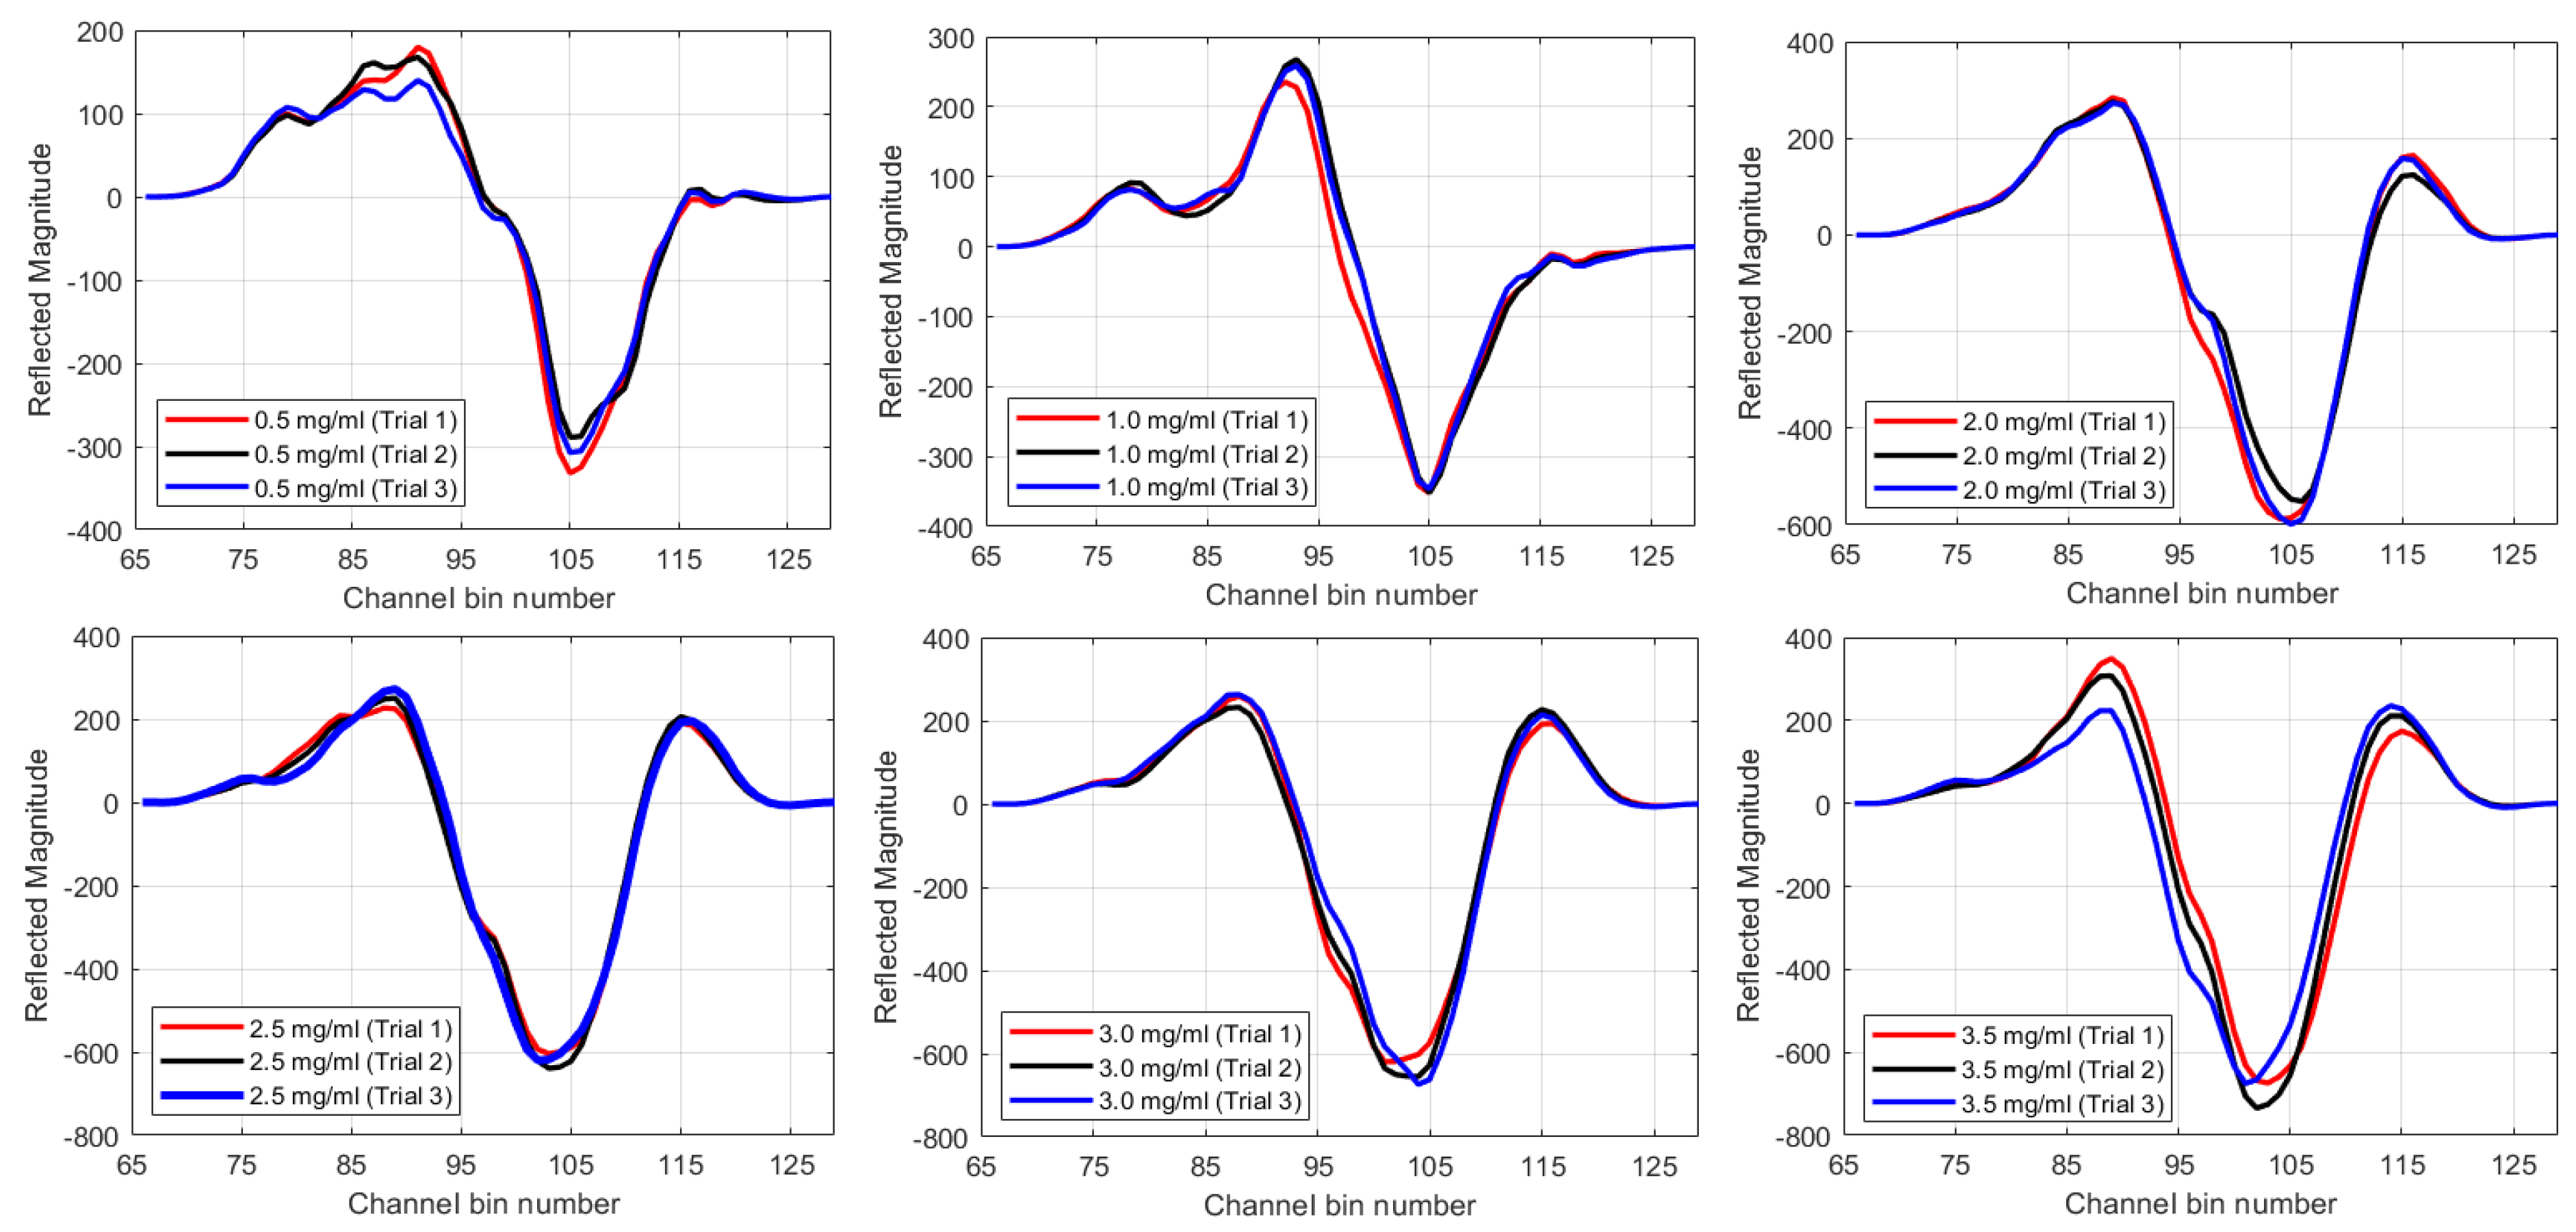
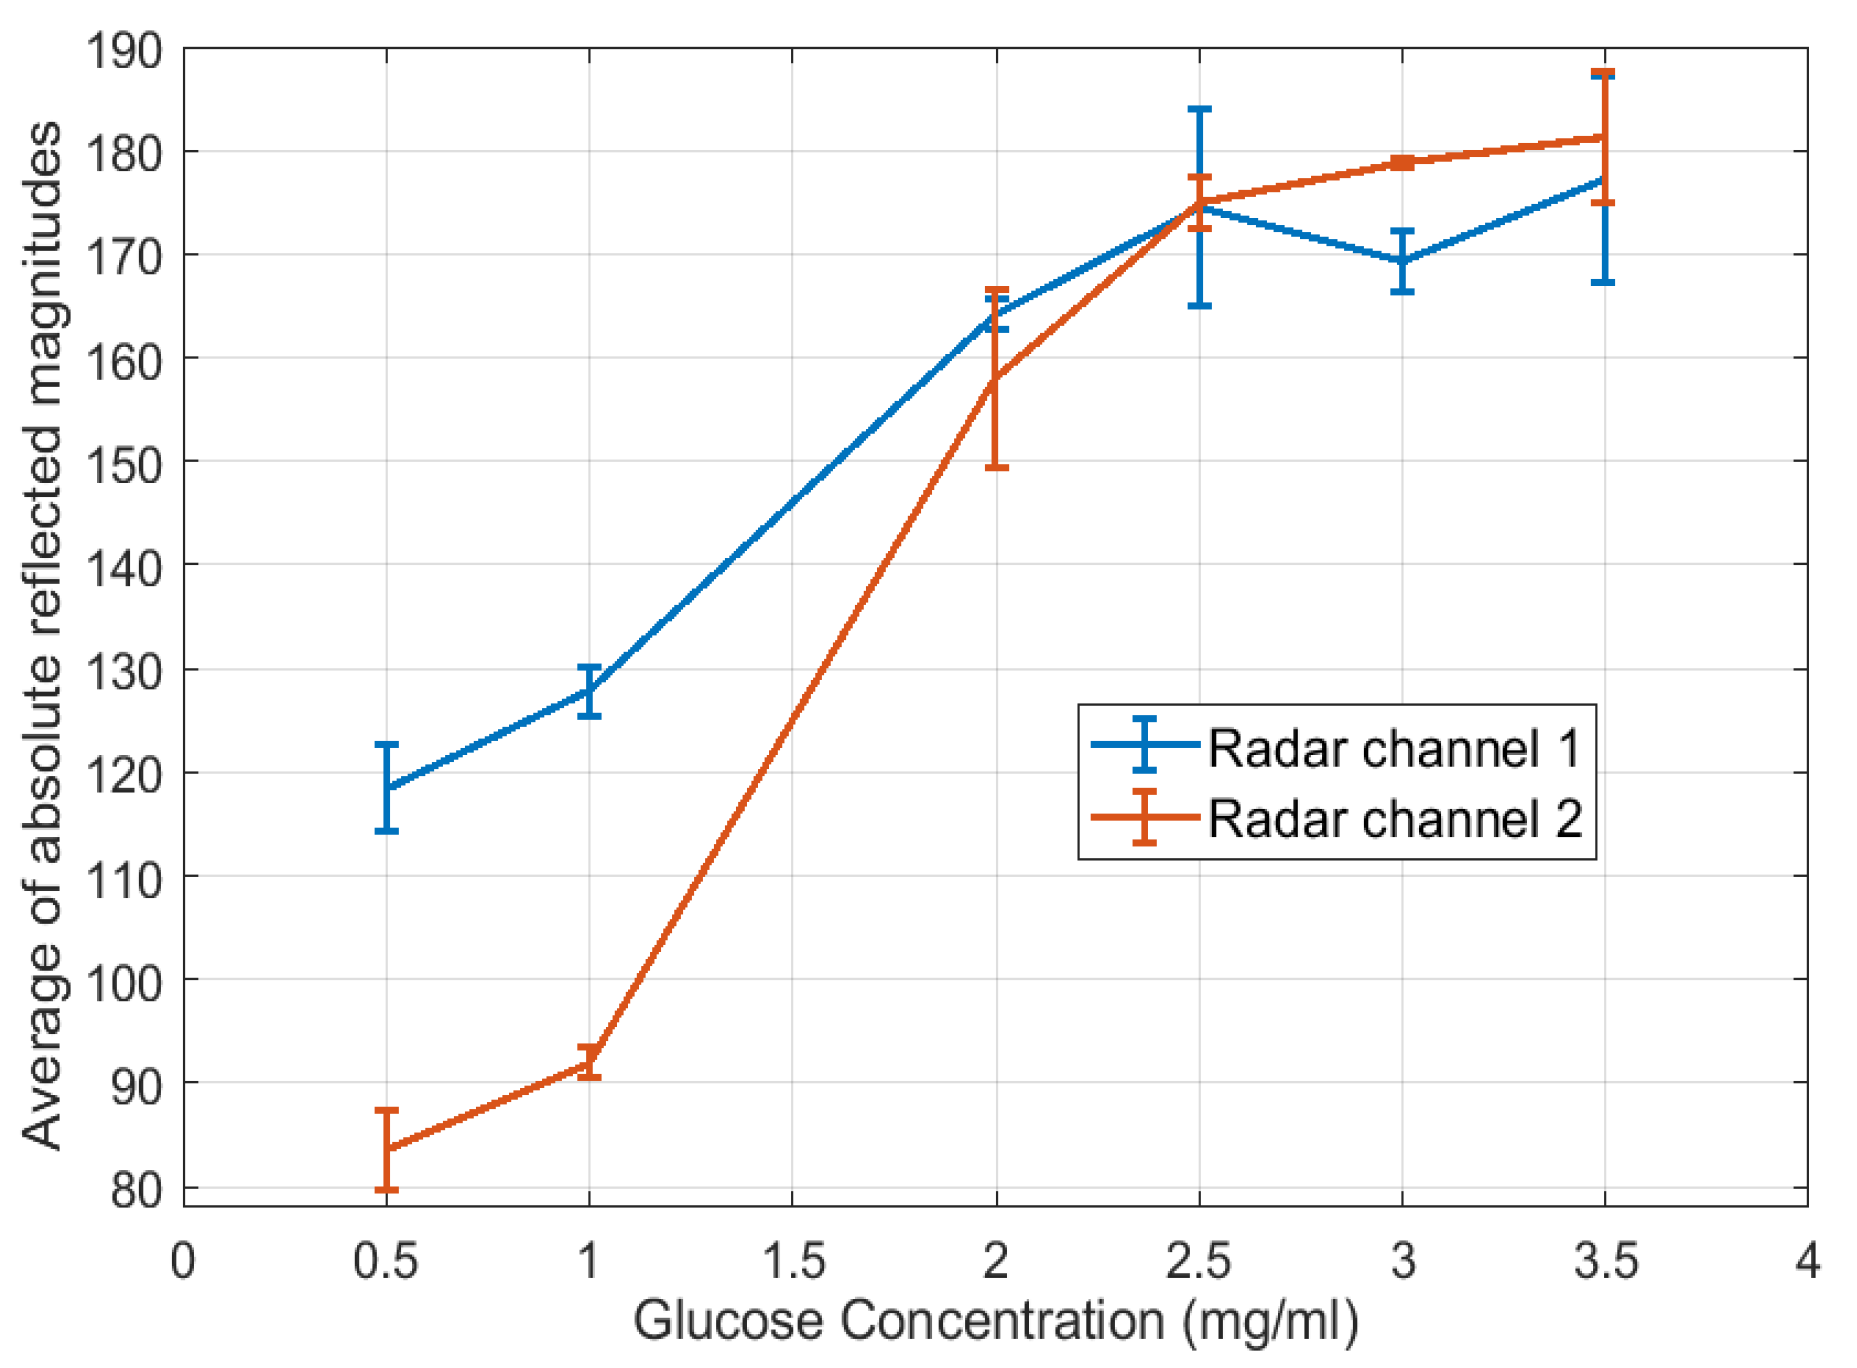
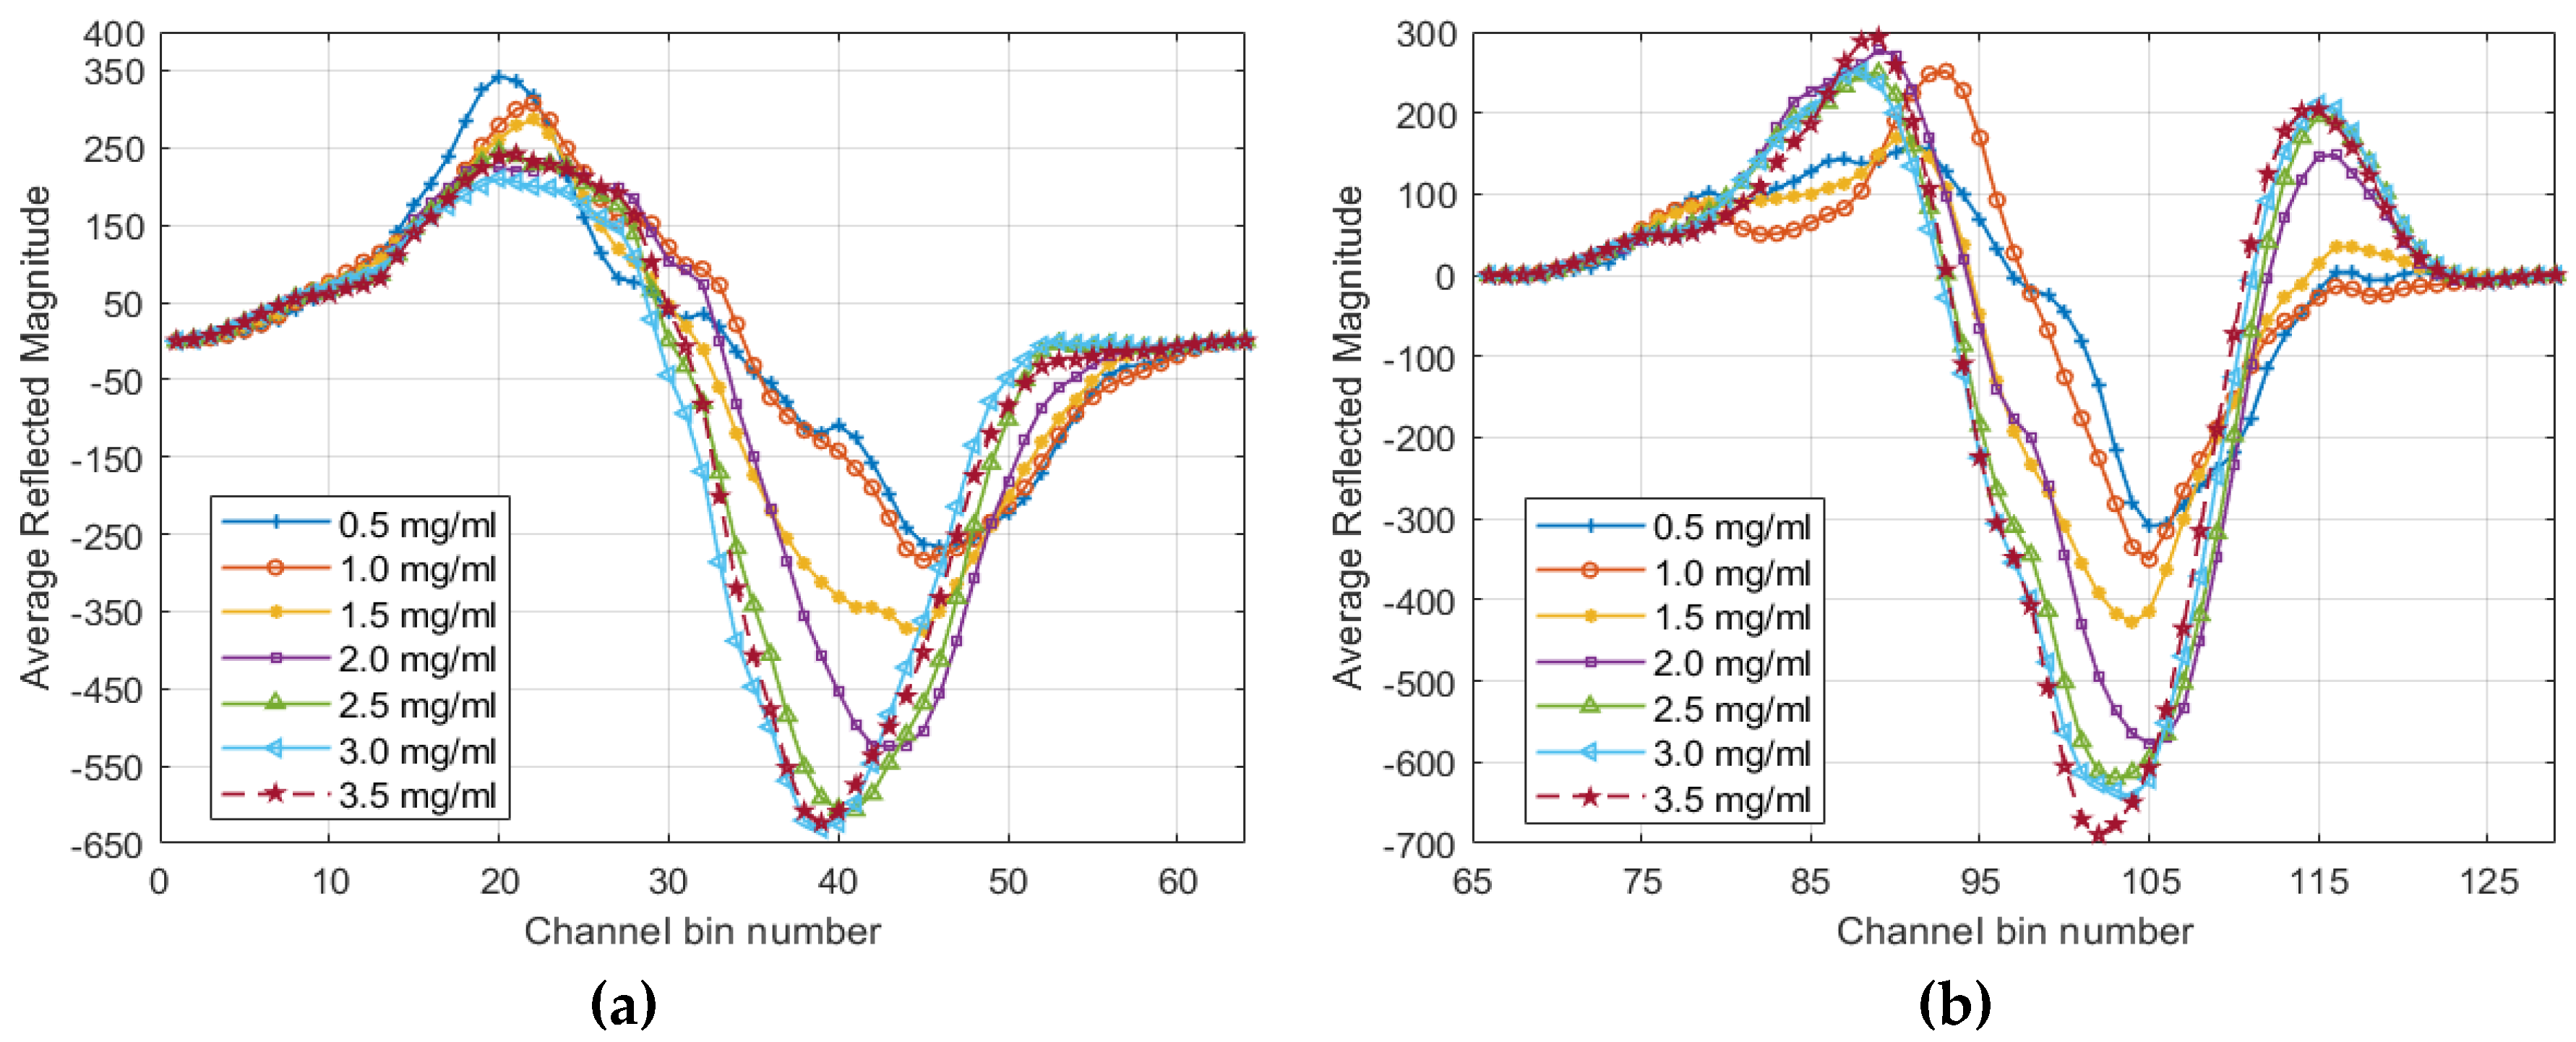
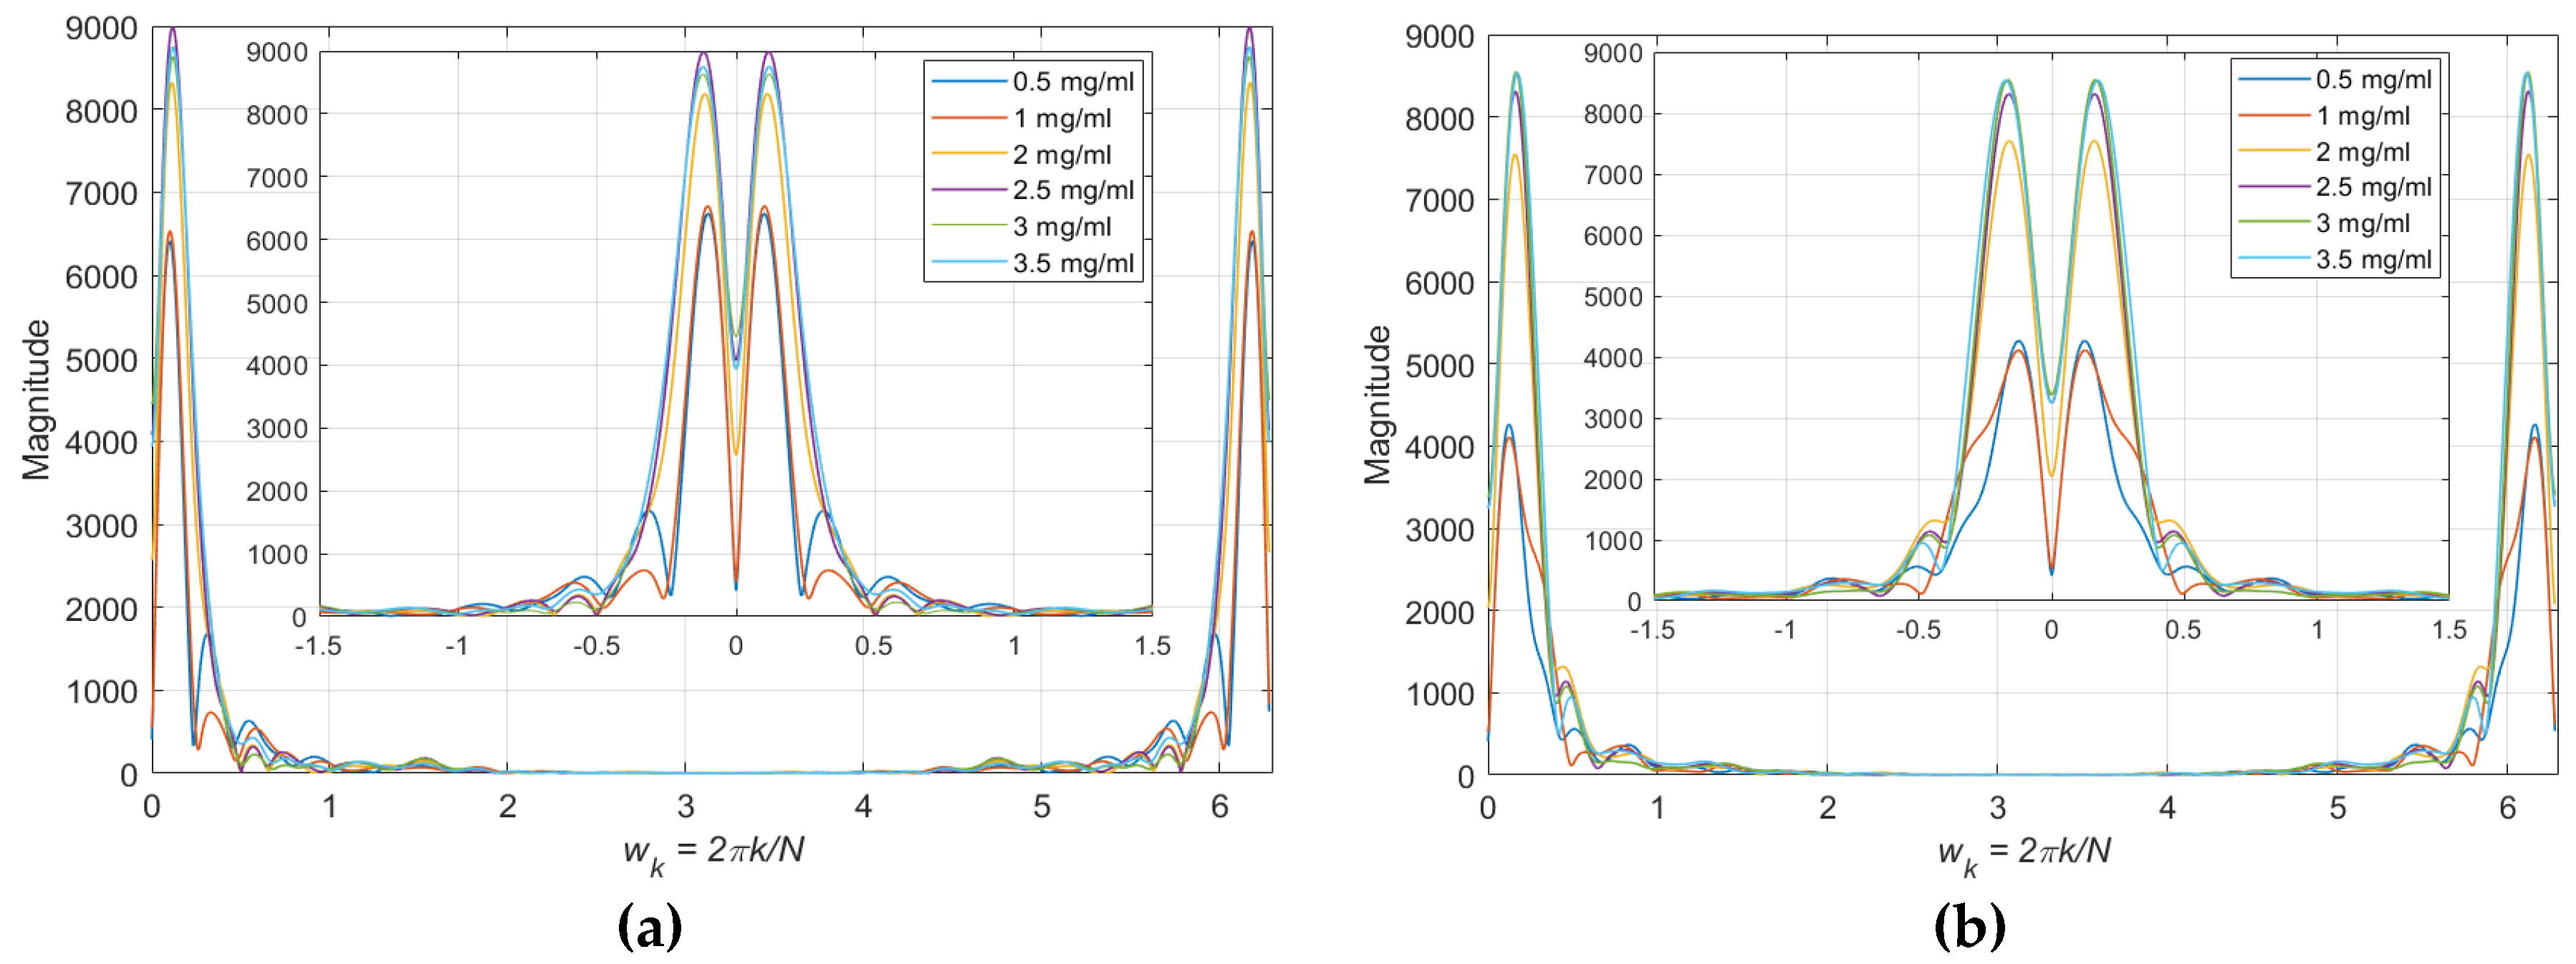
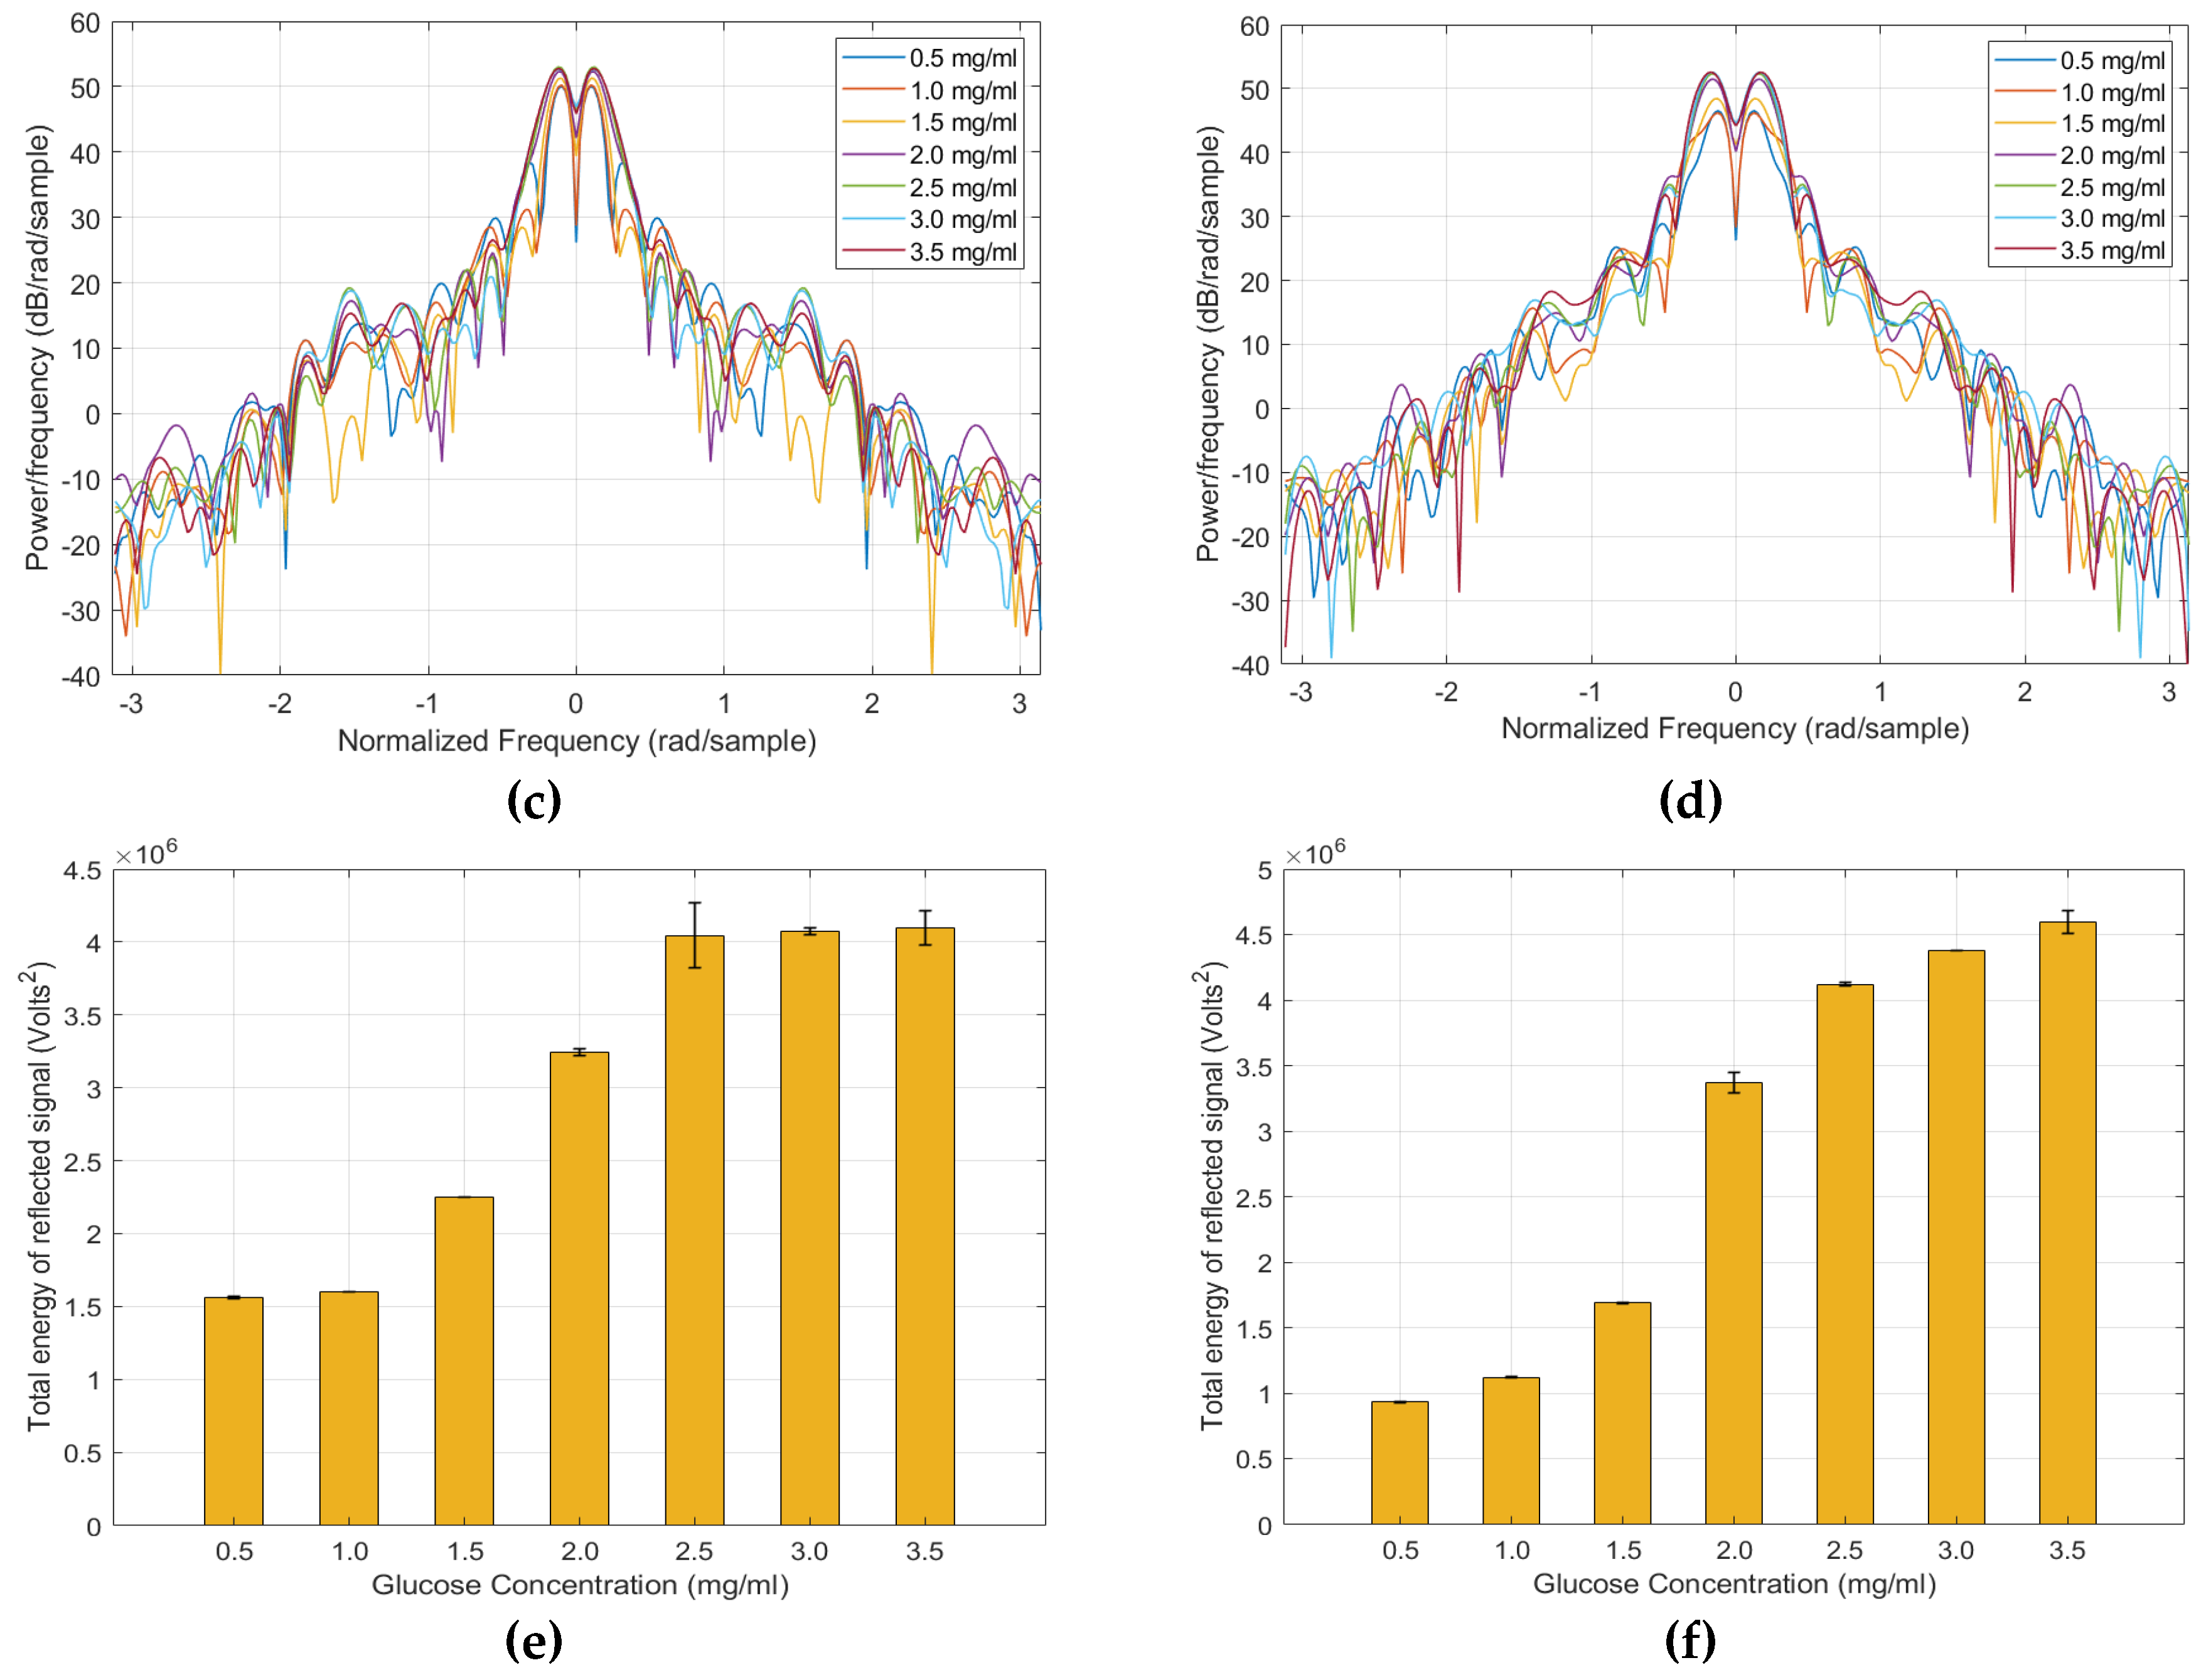
Table 1.
In market devices for non-invasive blood glucose monitoring.
| Device/Company | Technique | Placement | Needs | Attributes |
|---|---|---|---|---|
| NovioSense (Noviosense BV) [32] | Electrochemical enzymatic-based tear analysis | Lower eye lid (inferior conjunctival fornix) | Continuous monitoring provided a sample | Compact, painless, flexible, wireless power, smartphone connected for data analysis |
| Smart Contact Lens (Novartis & Google) [33] | Electrochemical enzymatic-based tear analysis | Eye | Continuous monitoring provided a sample | Painless, power efficient, portable, low relief, hazardous when overheated, withdrawn from market! |
| iQuicklt Saliva Analyzer (Quick LLC) [34] | Saliva analysis | Saliva of the mouth | Intermittent monitoring provided a sample | Portable, convenient to use, accurate, time efficient (real-time readings), under development and clinical trials |
| TensorTip Combo Glucometer (Cnoga Medical) [35] | Photometric and photography-based techniques | Fingertip | Intermittent monitoring without a sample | Convenient to use, accurate when calibrated on individual-basis, smartphone compatible, battery operated (rechargeable), cost-effective, certified! |
| Glucosense (Glucosense Diagnostic Ltd.) [36] | Low-powered laser sensors that use photonic technology (infrared light) | Fingertip | Intermittent monitoring without a sample | Convenient to use, portable, affordable, power-efficient, time efficient (30 s), under development! |
| Groves’s Device (Groves Instrument Inc) [37] | NIR spectroscopy | Fingertip or earlobe | Intermittent monitoring without a sample | Fast processed readings, time-efficient (20 s), compact, portable, uses capillary-level blood, less accurate due lacking subjective calibration |
| GlucoTrack (Integrity Applications) [38] | Thermal, ultrasonic, and microwave EM technology | Earlobe | Intermittent monitoring without a sample | Affordable, convenient to use, high accuracy due earlobe placement, unit-connected for results processing/display, complex processing, FDA approved! |
| GlucoWise (MediWise) [39,40] | RF/Microwave | Amid fingers (thumb and forefinger) | Intermittent monitoring without a sample | Convenient to use, affordable, accurate, Bluetooth-based data transmission, compact, integrable with insulin pumps, uses capillary-level blood, time-efficient, fast readings (10 s), hurtful due localized energy usage, under development! |
Table 2.
Some state-of-the-art techniques for non-invasive glucose detection.
| Ref | Technique | Main Items | Sensing Parameter | Pros | Cons |
|---|---|---|---|---|---|
| [41] | OCT | Light source + coupler + interferometer | OCT slope | - Good resolution images with high SNR | - Affected by pressure and temperature - Compromise between resolution and penetration depth -Time consuming for glucose estimation |
| [42] | Optical/thermal spectroscopy + photoacoustic | Microphone + laser diode | Change in optical absorption coefficient and pressure | - Compact size - Improved sensitivity | - Affected by pressure and temperature |
| [43] | NIR + PPG + ANN | Photo diode + LED | Difference in optical density | - Reduced cost - Fast FPGA implementation -Good accuracy | - PPG is affected by noise, motion, fatty tissues - Increased complex processing -Time consuming -Filtering overhead |
| [44] | Photoacoustic + NIR + MEMS | IR + ultrasonic micro-electro-micro mechanical (MEMS) sensors | Acoustic pressure and absorption | - Compact size - Efficient power - Accurate and sensitive - Deep penetration in ear lobe area | - Affected by pressure, temperature, and humidity - Performance dependency on surface |
| [45] | NIR + photoacoustic | Piezoelectric sensor + pulsed laser diode (PLD) | Change in pressure (Photoacoustic amplitude) | - Good sensitivity - Limited scattering - User friendly | - Nonuniform absorption Affected by pressure and temperature -Time consuming -Power inefficient |
| [46] | NIR | Thermal/laser sensors + spectroscope | Change in power output of the transmitted light beam | - Not expensive - Harmless | - Data limitation - Less accurate |
| [47] | ECG + ML | Compumedics ECG leads | Heart rate and QT interval | - Fast processing - Converged computation - Detecting hypoglycemia and hyperglycemia | - ECG signal parameters possibly affected by abnormal heart condition (e.g., arrhythmia) |
| [48] | RF/Microwave | Microstrip patch antenna (spiral) | Shift in resonance frequency | - Compact size - Affordable cost - High Q-factor | - Affected by noises in atmosphere - Not validated for glucose sensing using real measurements - Loss parameters not considered in simulation |
| [49] | RF/Microwave | PNA + antenna + Cole-Cole model | Shift in resonant frequency | - Good correlation with glucometer when calibrated | - Affected by environmental changes (sweat, temperature, pressure, etc.) - Subject-based calibration |
| [50] | RF/Microwave | Microstrip patch antenna (triangular) | Shift in resonance frequency | - Cost effective - Miniaturized size - Linear | - Not demonstrated for different glucose levels detection |
| [51] | RF/Microwave | Patch resonator | Changes in input impedance | - Miniaturized size - Good sensitivity - Tested on wideband tissue mimicking phantom | - Large error margin - Phantom simulated with non-dispersive dielectric properties |
| [39] | Millimeter-wave Antenna | Two patch antennas (Glucowise) | Changes in transmission coefficient S21 | - Portable - Less susceptible by interference | - Possible harmful effects due localized energy |
| [52] | RF/Microwave | Planar ring resonator | Shift in resonant frequency | - Compact size - Accurate (Resonant-based) | - Affected by environment status - Low sensitivity - Tested on impractical glucose ranges |
Table 3.
Concentration verification of the prepared synthetic blood samples using a glucometer device.
Table 3.
Concentration verification of the prepared synthetic blood samples using a glucometer device.
| Targeted concentration for the prepared sample (mg/mL) | 0.5 | 1.0 | 1.5 | 2.0 | 2.5 | 3.0 | 3.5 |
| Measured concentration using glucometer (mg/mL) | 0.5 | 1.06 | 1.63 | 2.16 | 2.79 | 3.15 | 3.32 |
© 2020 by the authors. Licensee MDPI, Basel, Switzerland. This article is an open access article distributed under the terms and conditions of the Creative Commons Attribution (CC BY) license (http://creativecommons.org/licenses/by/4.0/).
Share and Cite
MDPI and ACS Style
Omer, A.E.; Safavi-Naeini, S.; Hughson, R.; Shaker, G. Blood Glucose Level Monitoring Using an FMCW Millimeter-Wave Radar Sensor. Remote Sens. 2020, 12, 385. https://doi.org/10.3390/rs12030385
AMA Style
Omer AE, Safavi-Naeini S, Hughson R, Shaker G. Blood Glucose Level Monitoring Using an FMCW Millimeter-Wave Radar Sensor. Remote Sensing. 2020; 12(3):385. https://doi.org/10.3390/rs12030385
Chicago/Turabian StyleOmer, Ala Eldin, Safieddin Safavi-Naeini, Richard Hughson, and George Shaker. 2020. "Blood Glucose Level Monitoring Using an FMCW Millimeter-Wave Radar Sensor" Remote Sensing 12, no. 3: 385. https://doi.org/10.3390/rs12030385
Note that from the first issue of 2016, this journal uses article numbers instead of page numbers. See further details here.