UAV-Based High Throughput Phenotyping in Citrus Utilizing Multispectral Imaging and Artificial Intelligence


Agricultural and Biological Engineering department, Southwest Florida Research and Education Center, University of Florida, IFAS, 2685 SR 29 North, Immokalee, FL 34142, USA
*
Author to whom correspondence should be addressed.
Remote Sens. 2019, 11(4), 410; https://doi.org/10.3390/rs11040410
Submission received: 18 January 2019
/
Revised: 12 February 2019
/
Accepted: 15 February 2019
/
Published: 17 February 2019
(This article belongs to the Special Issue Advanced Imaging for Plant Phenotyping)
Abstract
:Traditional plant breeding evaluation methods are time-consuming, labor-intensive, and costly. Accurate and rapid phenotypic trait data acquisition and analysis can improve genomic selection and accelerate cultivar development. In this work, a technique for data acquisition and image processing was developed utilizing small unmanned aerial vehicles (UAVs), multispectral imaging, and deep learning convolutional neural networks to evaluate phenotypic characteristics on citrus crops. This low-cost and automated high-throughput phenotyping technique utilizes artificial intelligence (AI) and machine learning (ML) to: (i) detect, count, and geolocate trees and tree gaps; (ii) categorize trees based on their canopy size; (iii) develop individual tree health indices; and (iv) evaluate citrus varieties and rootstocks. The proposed remote sensing technique was able to detect and count citrus trees in a grove of 4,931 trees, with precision and recall of 99.9% and 99.7%, respectively, estimate their canopy size with overall accuracy of 85.5%, and detect, count, and geolocate tree gaps with a precision and recall of 100% and 94.6%, respectively. This UAV-based technique provides a consistent, more direct, cost-effective, and rapid method to evaluate phenotypic characteristics of citrus varieties and rootstocks.

1. Introduction
Over the last decades, enormous efforts of plants genetics research focused on developing crop varieties with enhanced traits such as high yield, environmental stress tolerance, and disease resistance [1,2]. Current breeding methods require many years to develop, select, and release new cultivars [3]. New breeding methods, such as genomic selection, incorporate genomics, statistical, and computational tools, allow the acceleration of cultivar (and rootstock) development [4,5,6]. A key requirement for implementing these new breeding methods is the creation of a large and genetically diverse training population [7]. Hence, large-scale experiments in plant phenotyping are critical because the accurate and rapid acquisition of phenotypic data is important for exploring the correlation between genomic and phenotypic information. Traditional sensing technologies for evaluation of the field’s phenotypes rely on manual sampling and are often very labor-intensive and time-consuming, especially when covering large areas [8,9]. Additionally, field surveys for weed and disease detection to create plant inventory and assess plant health status are also expensive, labor-intensive and time-consuming [10,11,12]. Small unmanned aerial vehicles (UAVs) equipped with various sensors recently became flexible and cost-effective solutions for fast, precise, and nondestructive high-throughput phenotyping [13,14].
UAVs allow growers to constantly monitor crop health status, estimate plant water needs, and even detect diseases [15,16,17]. They represent a low-cost method for image acquisition in high-resolution settings and are increasingly studied for agricultural applications. Nebiker et al. [18] reported one of the first successful application of UAVs combined with a low-cost multispectral camera for remote sensing to assess health of grapevine crops. Hunt et al. [19] analyzed UAV multispectral imagery for crop monitoring and they found a good correlation between leaf area index and the green normalized difference vegetation index (green NDVI). In order to achieve high spatial resolution of image data, the overlaps of the UAV images, and, hence, the flight path planning, must be critically selected [20]. Matese et al. [21] mapped the vigor of vineyards using the NDVI index from a high-resolution multispectral camera. Furthermore, UAVs were utilized to create plant inventories. Malek et al. [22] achieved promising results in detecting palm trees used an extreme learning machine classifier in UAV images.
In citrus, multispectral imagery from UAVs were recently utilized to identify tree stresses and diseases. Garcia-Ruiz et al. [23] and Sankaran et al. [24] analyzed multispectral features of Huanglongbing (HLB) infected citrus trees for classification. Romero-Trigueros et al. [25] analyzed correlations of citrus physiology stresses and gas exchange status using multispectral UAV images. Csillik et al. [26] proposed a methodology to detect citrus and other crops trees from UAV images using a simple deep learning convolutional neural network (CNN).
Deep learning algorithms (artificial intelligence based) are increasingly used in remote sensing applications [27,28,29]. These methods achieved dramatic improvements in many domains and attracted considerable interest of both academic and industrial communities [30]. Deep convolutional neural networks (CNNs) are the most widely used deep learning approach for image recognition. These networks require large amount of data to create hierarchical features to provide semantic information at the output [11,31,32]. With the increasing access to large amounts of aerial images from UAVs and satellites, CNNs can play an important role in processing all these data to obtain valuable information.
However, the adoption of these technologies for specialty crop growers is low [33]. The main reasons are based on two fronts. First, the data processing and analysis, in order to generate accurate and useful information, can be very complex and time-consuming. Second, the commercially available software provides critical, but limited, practical information for specialty crops. For specialty crops, commercial software to identify issues and make practical recommendations is limited [33].
Since labor shortage is a major issue, a UAV-based scouting system (with the appropriate software/tools) can simplify the surveying procedure, reduce labor cost, decrease data collection time, and produce critical and practical information. This study presents UAV-based phenotyping techniques that can be used to cost-effectively survey agricultural fields. These tools and techniques utilize artificial intelligence (AI) to: (i) Detect, count, and geolocate citrus trees and tree gaps; (ii) categorize trees based on their canopy size (plant inventory); (iii) develop individual tree health status maps (health index maps); and (iv) evaluate citrus varieties and rootstocks. To the best of the authors’ knowledge, we are the first to develop UAV-based high-throughput phenotyping techniques for citrus.
2. Materials and Methods
2.1. Study Area
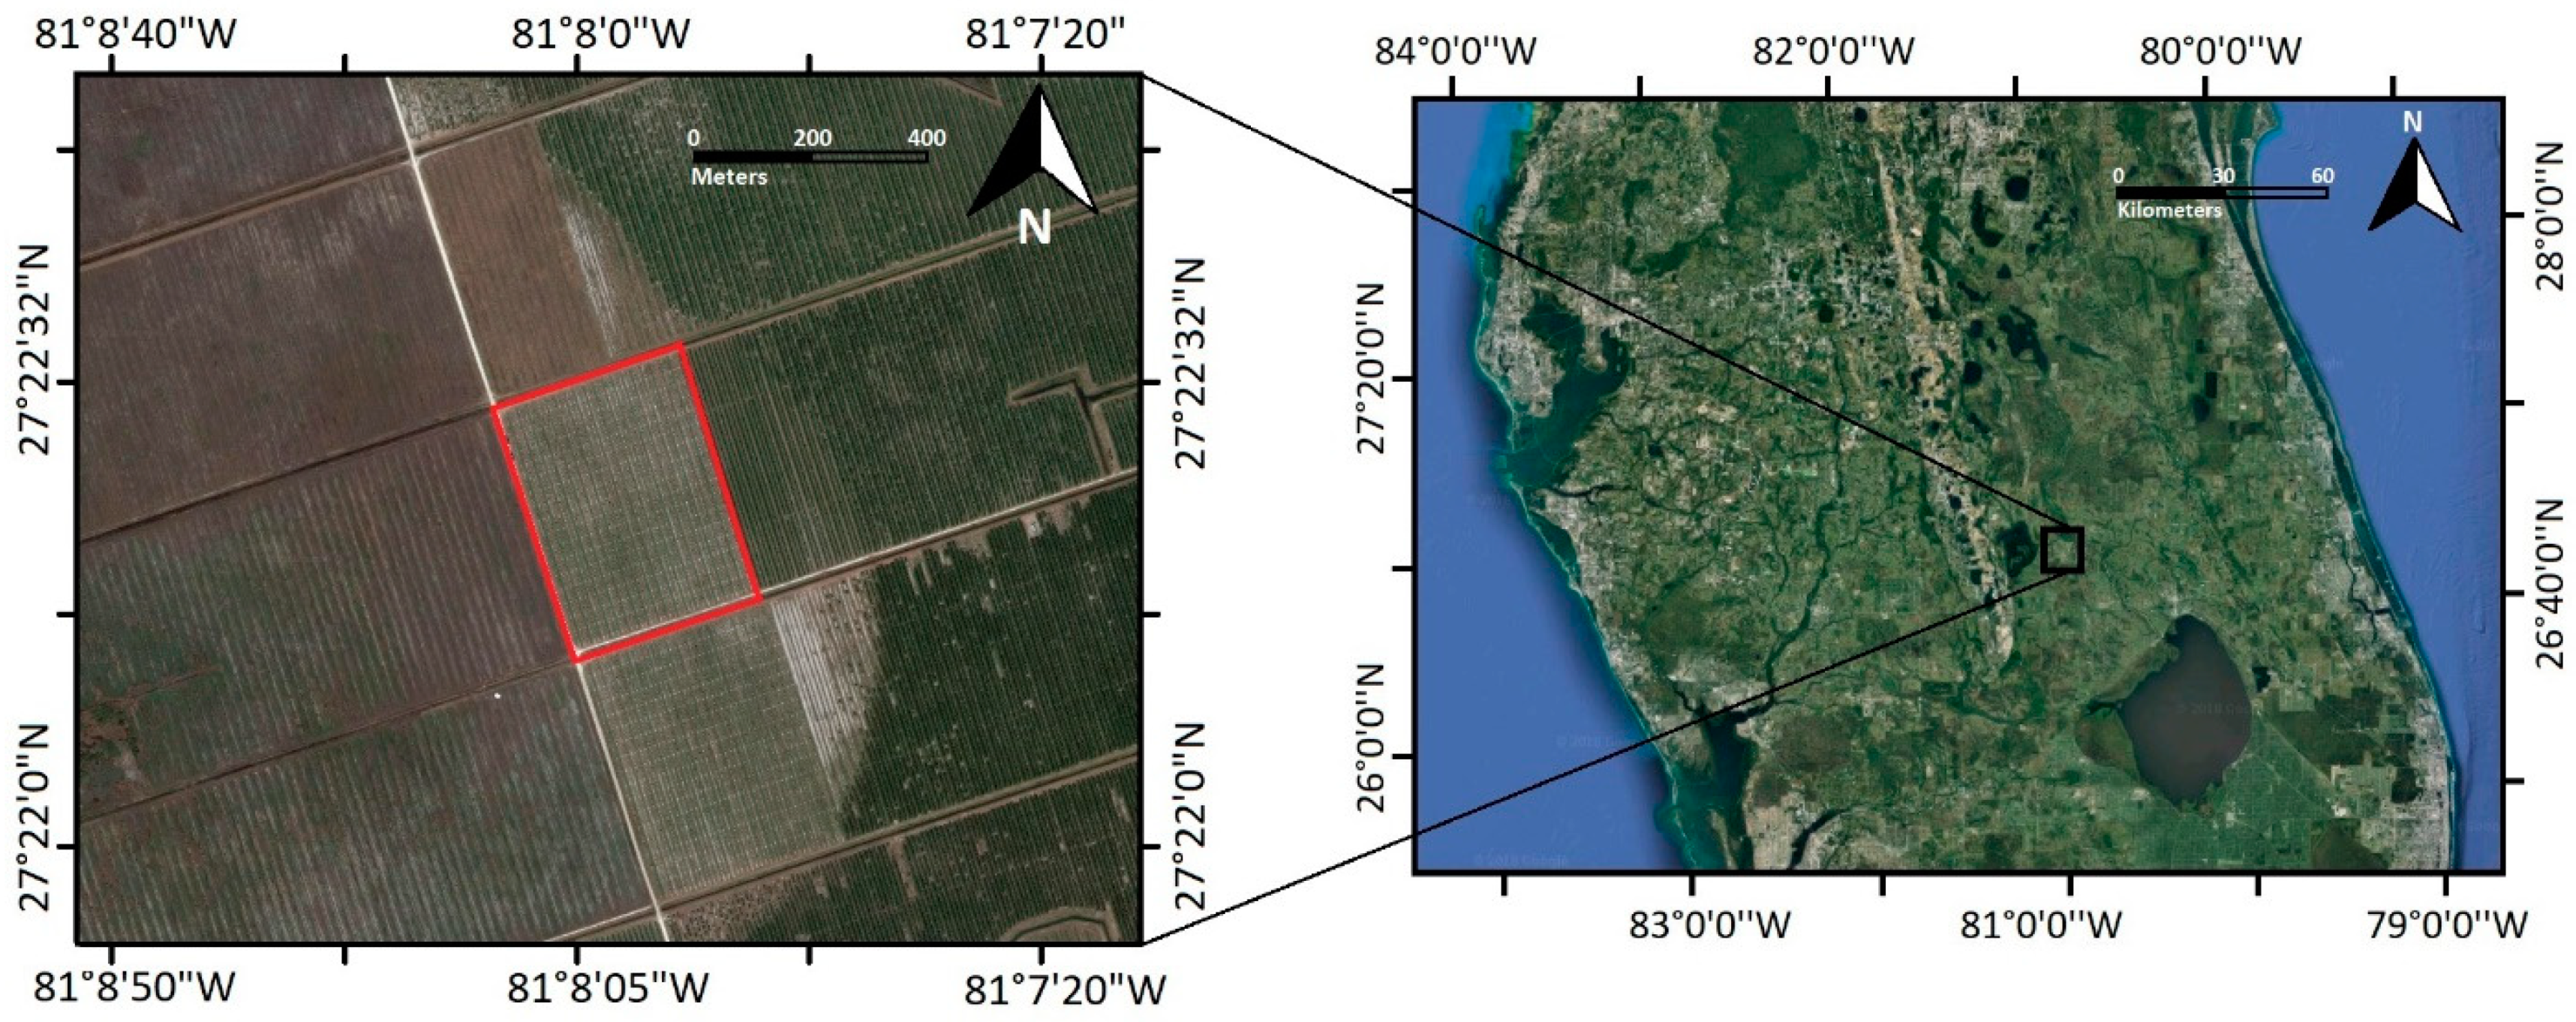
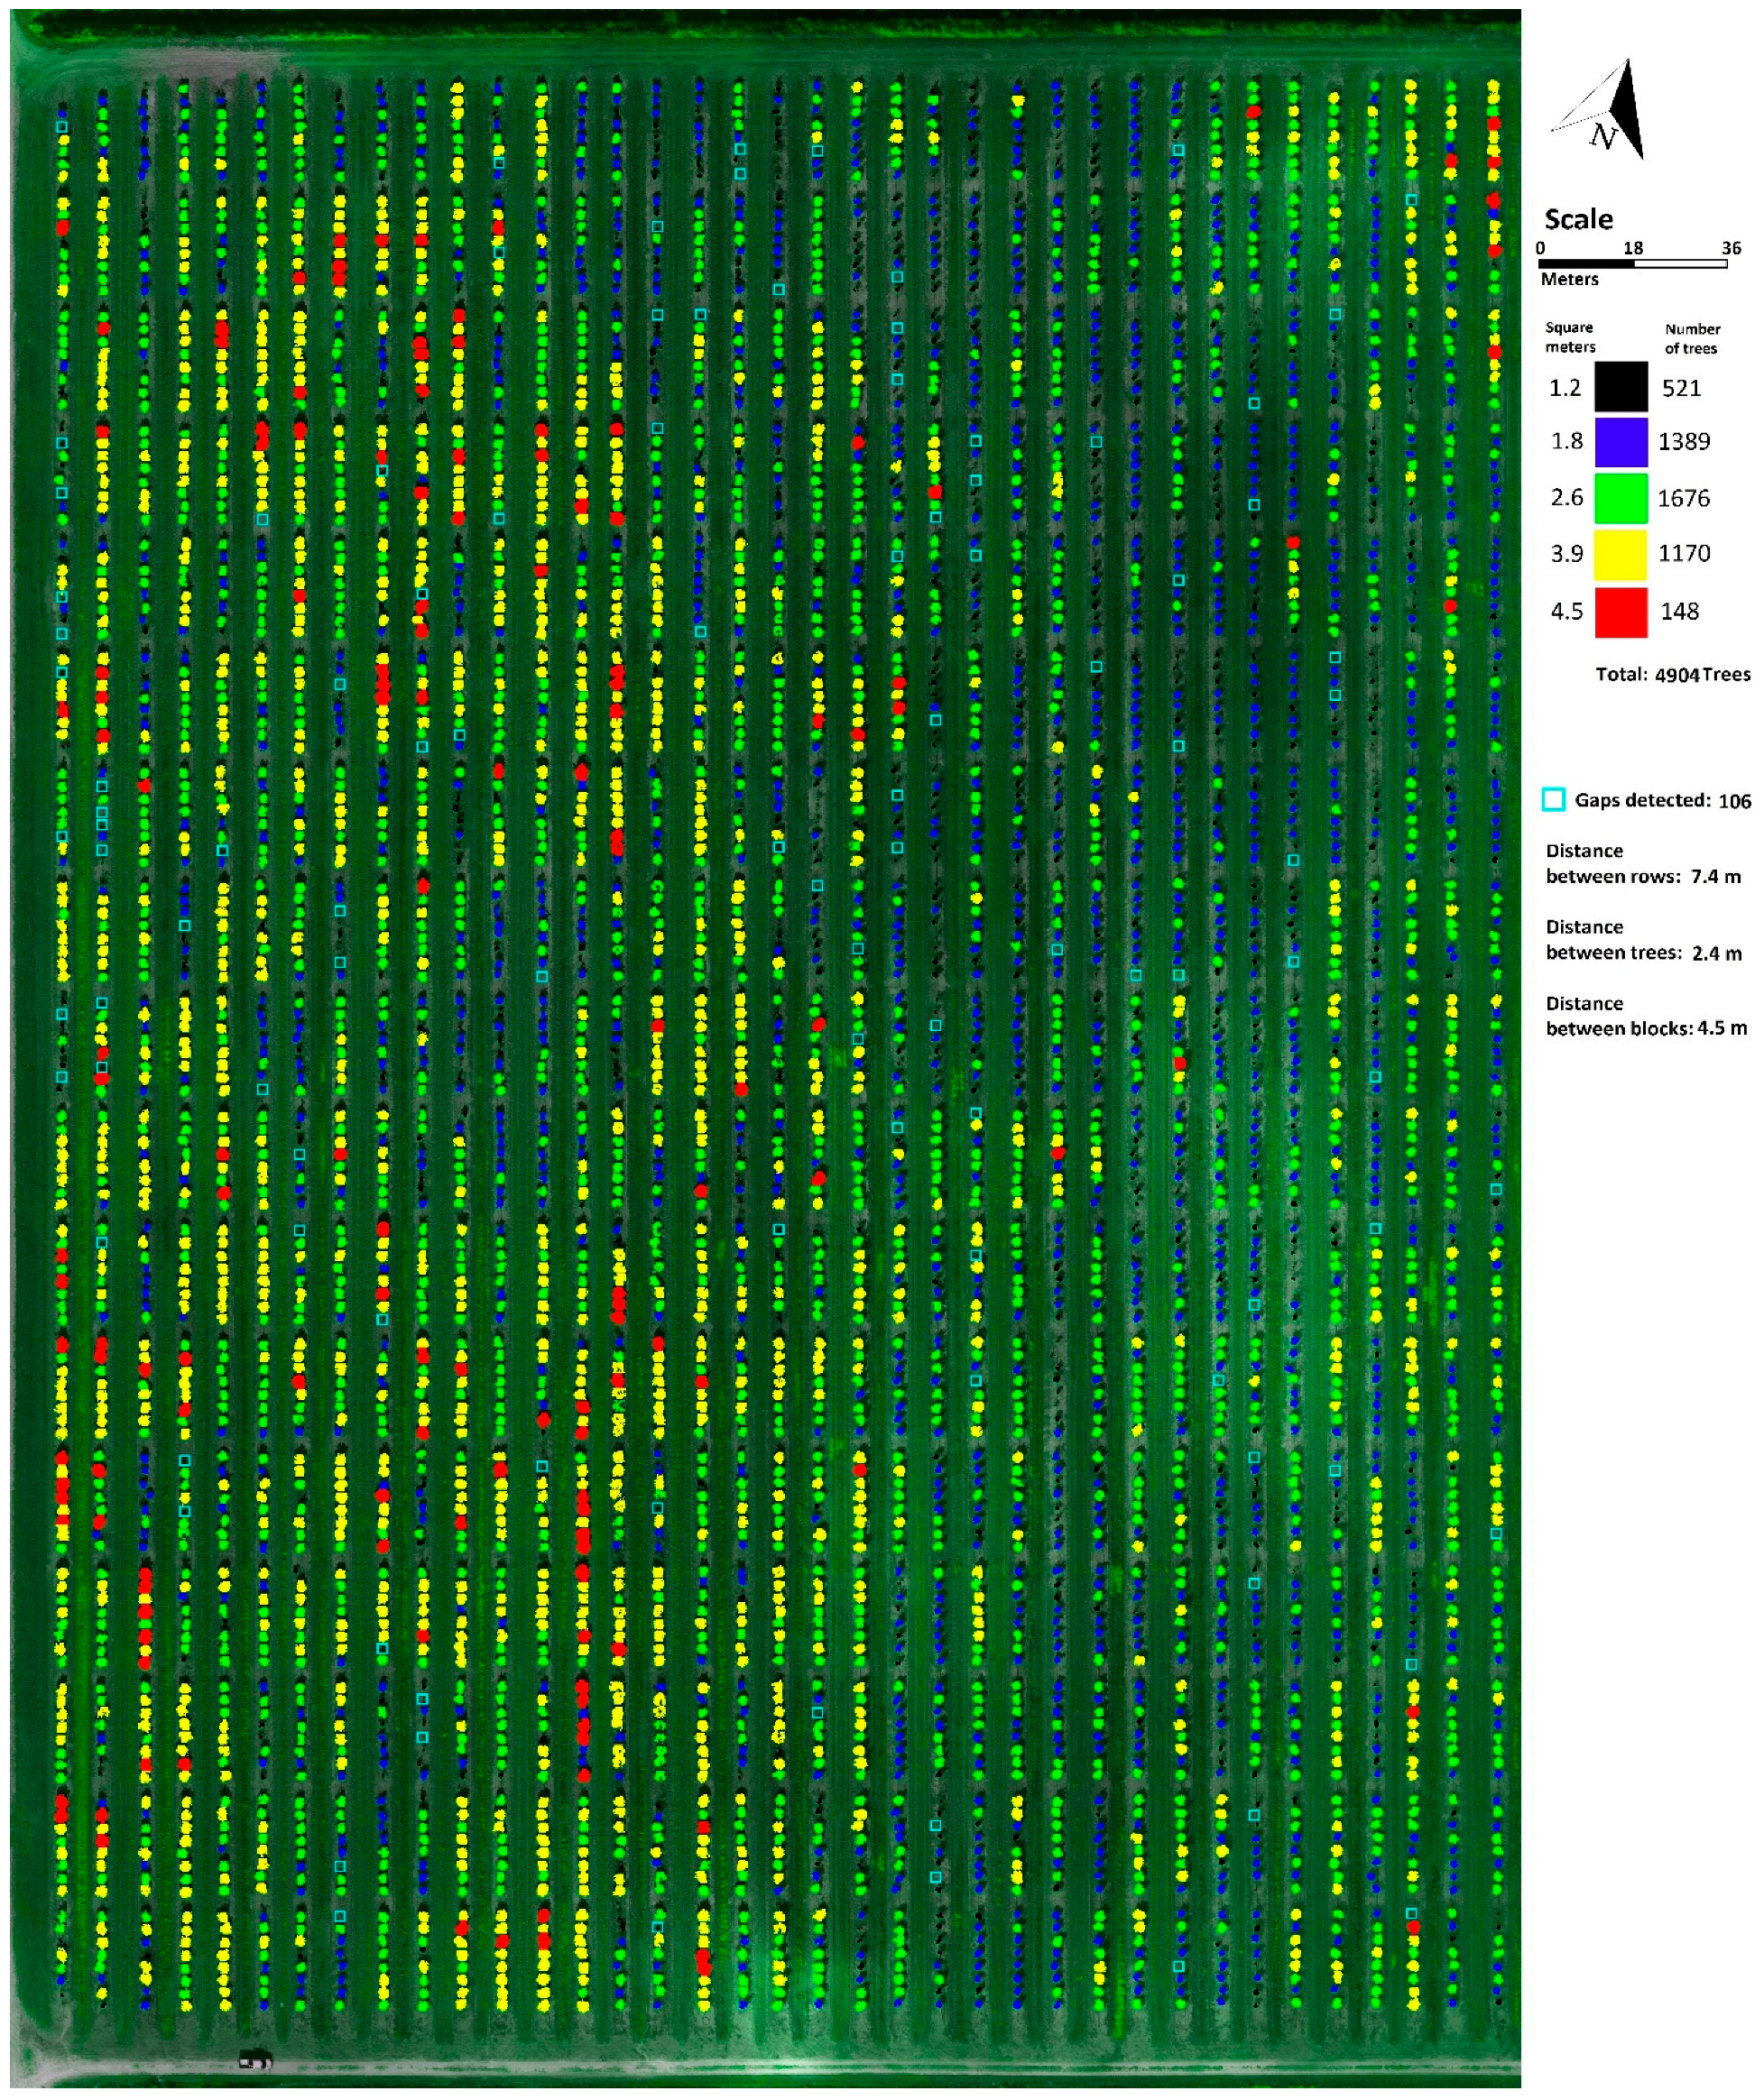
The study area is located at Highlands County, Florida (27.373321 N, −81.135209 W) and covers 14 acres of Hamlin citrus variety on a flat terrain (Figure 1). There are 50 different rootstocks varieties, planted in 2015, being studied at this site. The trees have an average height of 1.7 m and are divided in 37 rows and in blocks of eight trees, with a spacing between rows of 7.4 m and spacing of trees within a row of 2.4 m. The grove contains 4931 citrus trees and 112 missing trees (gaps).
2.2. Tree Detection and Analysis Process
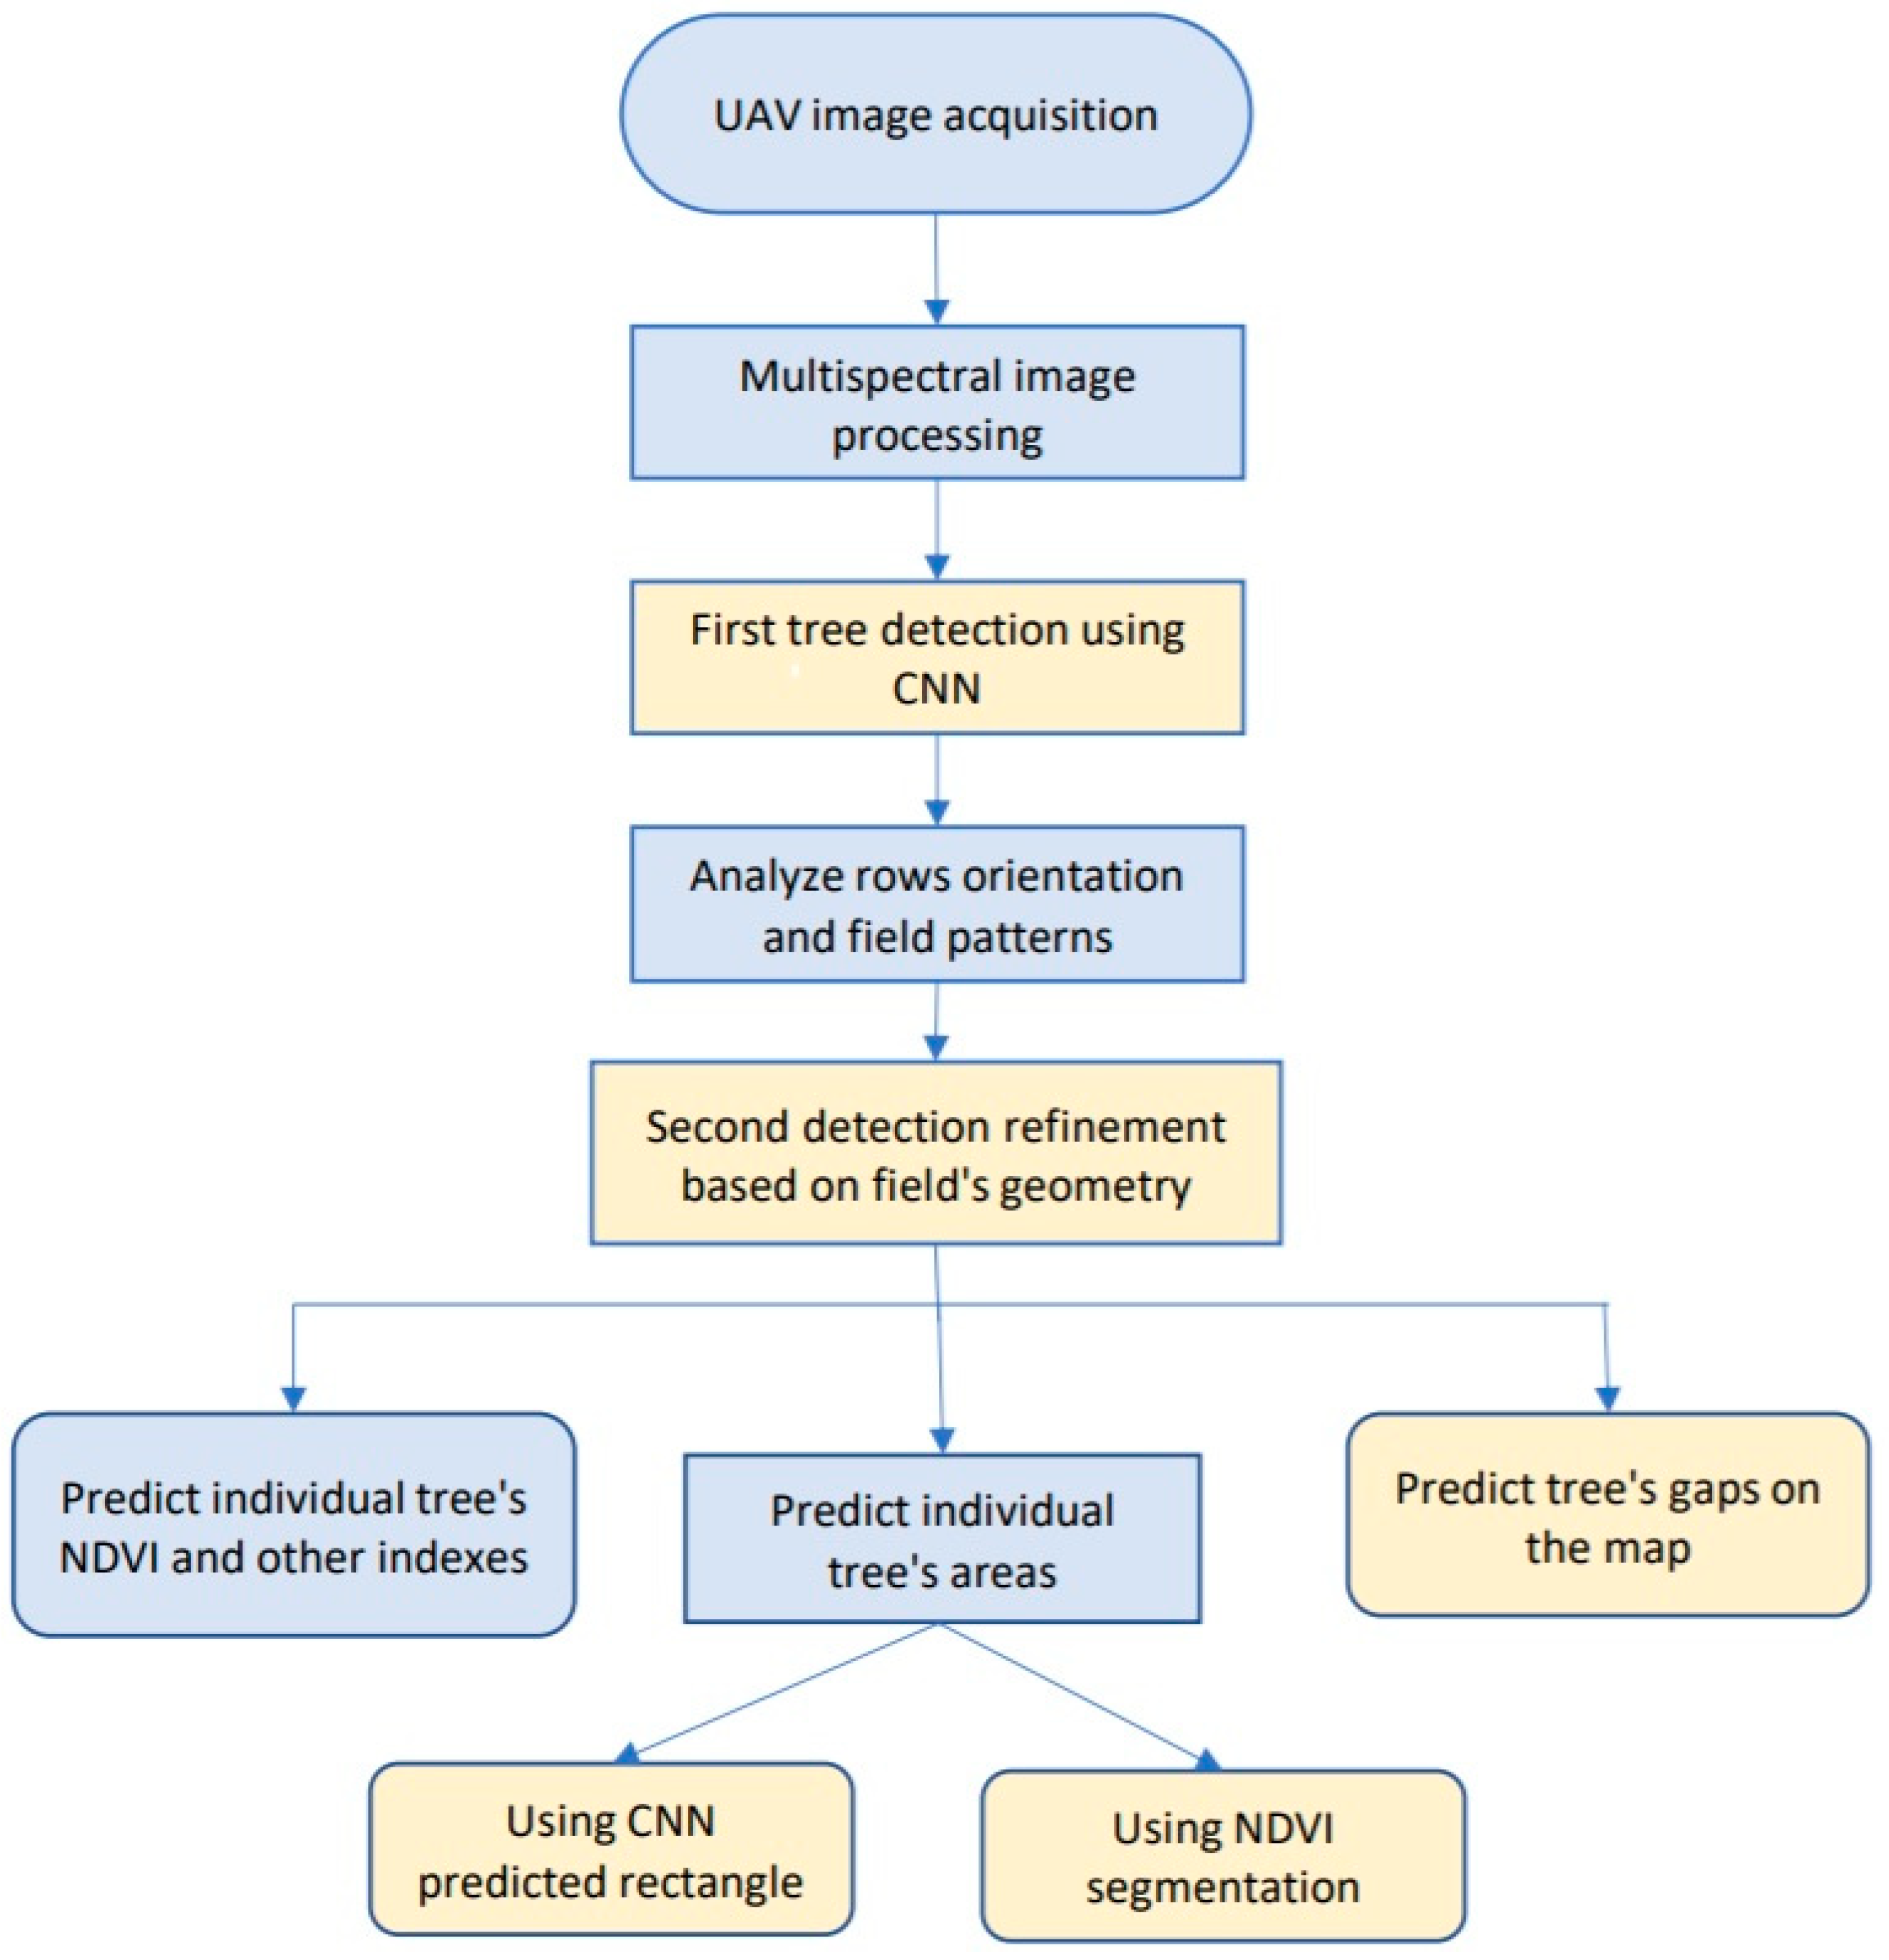
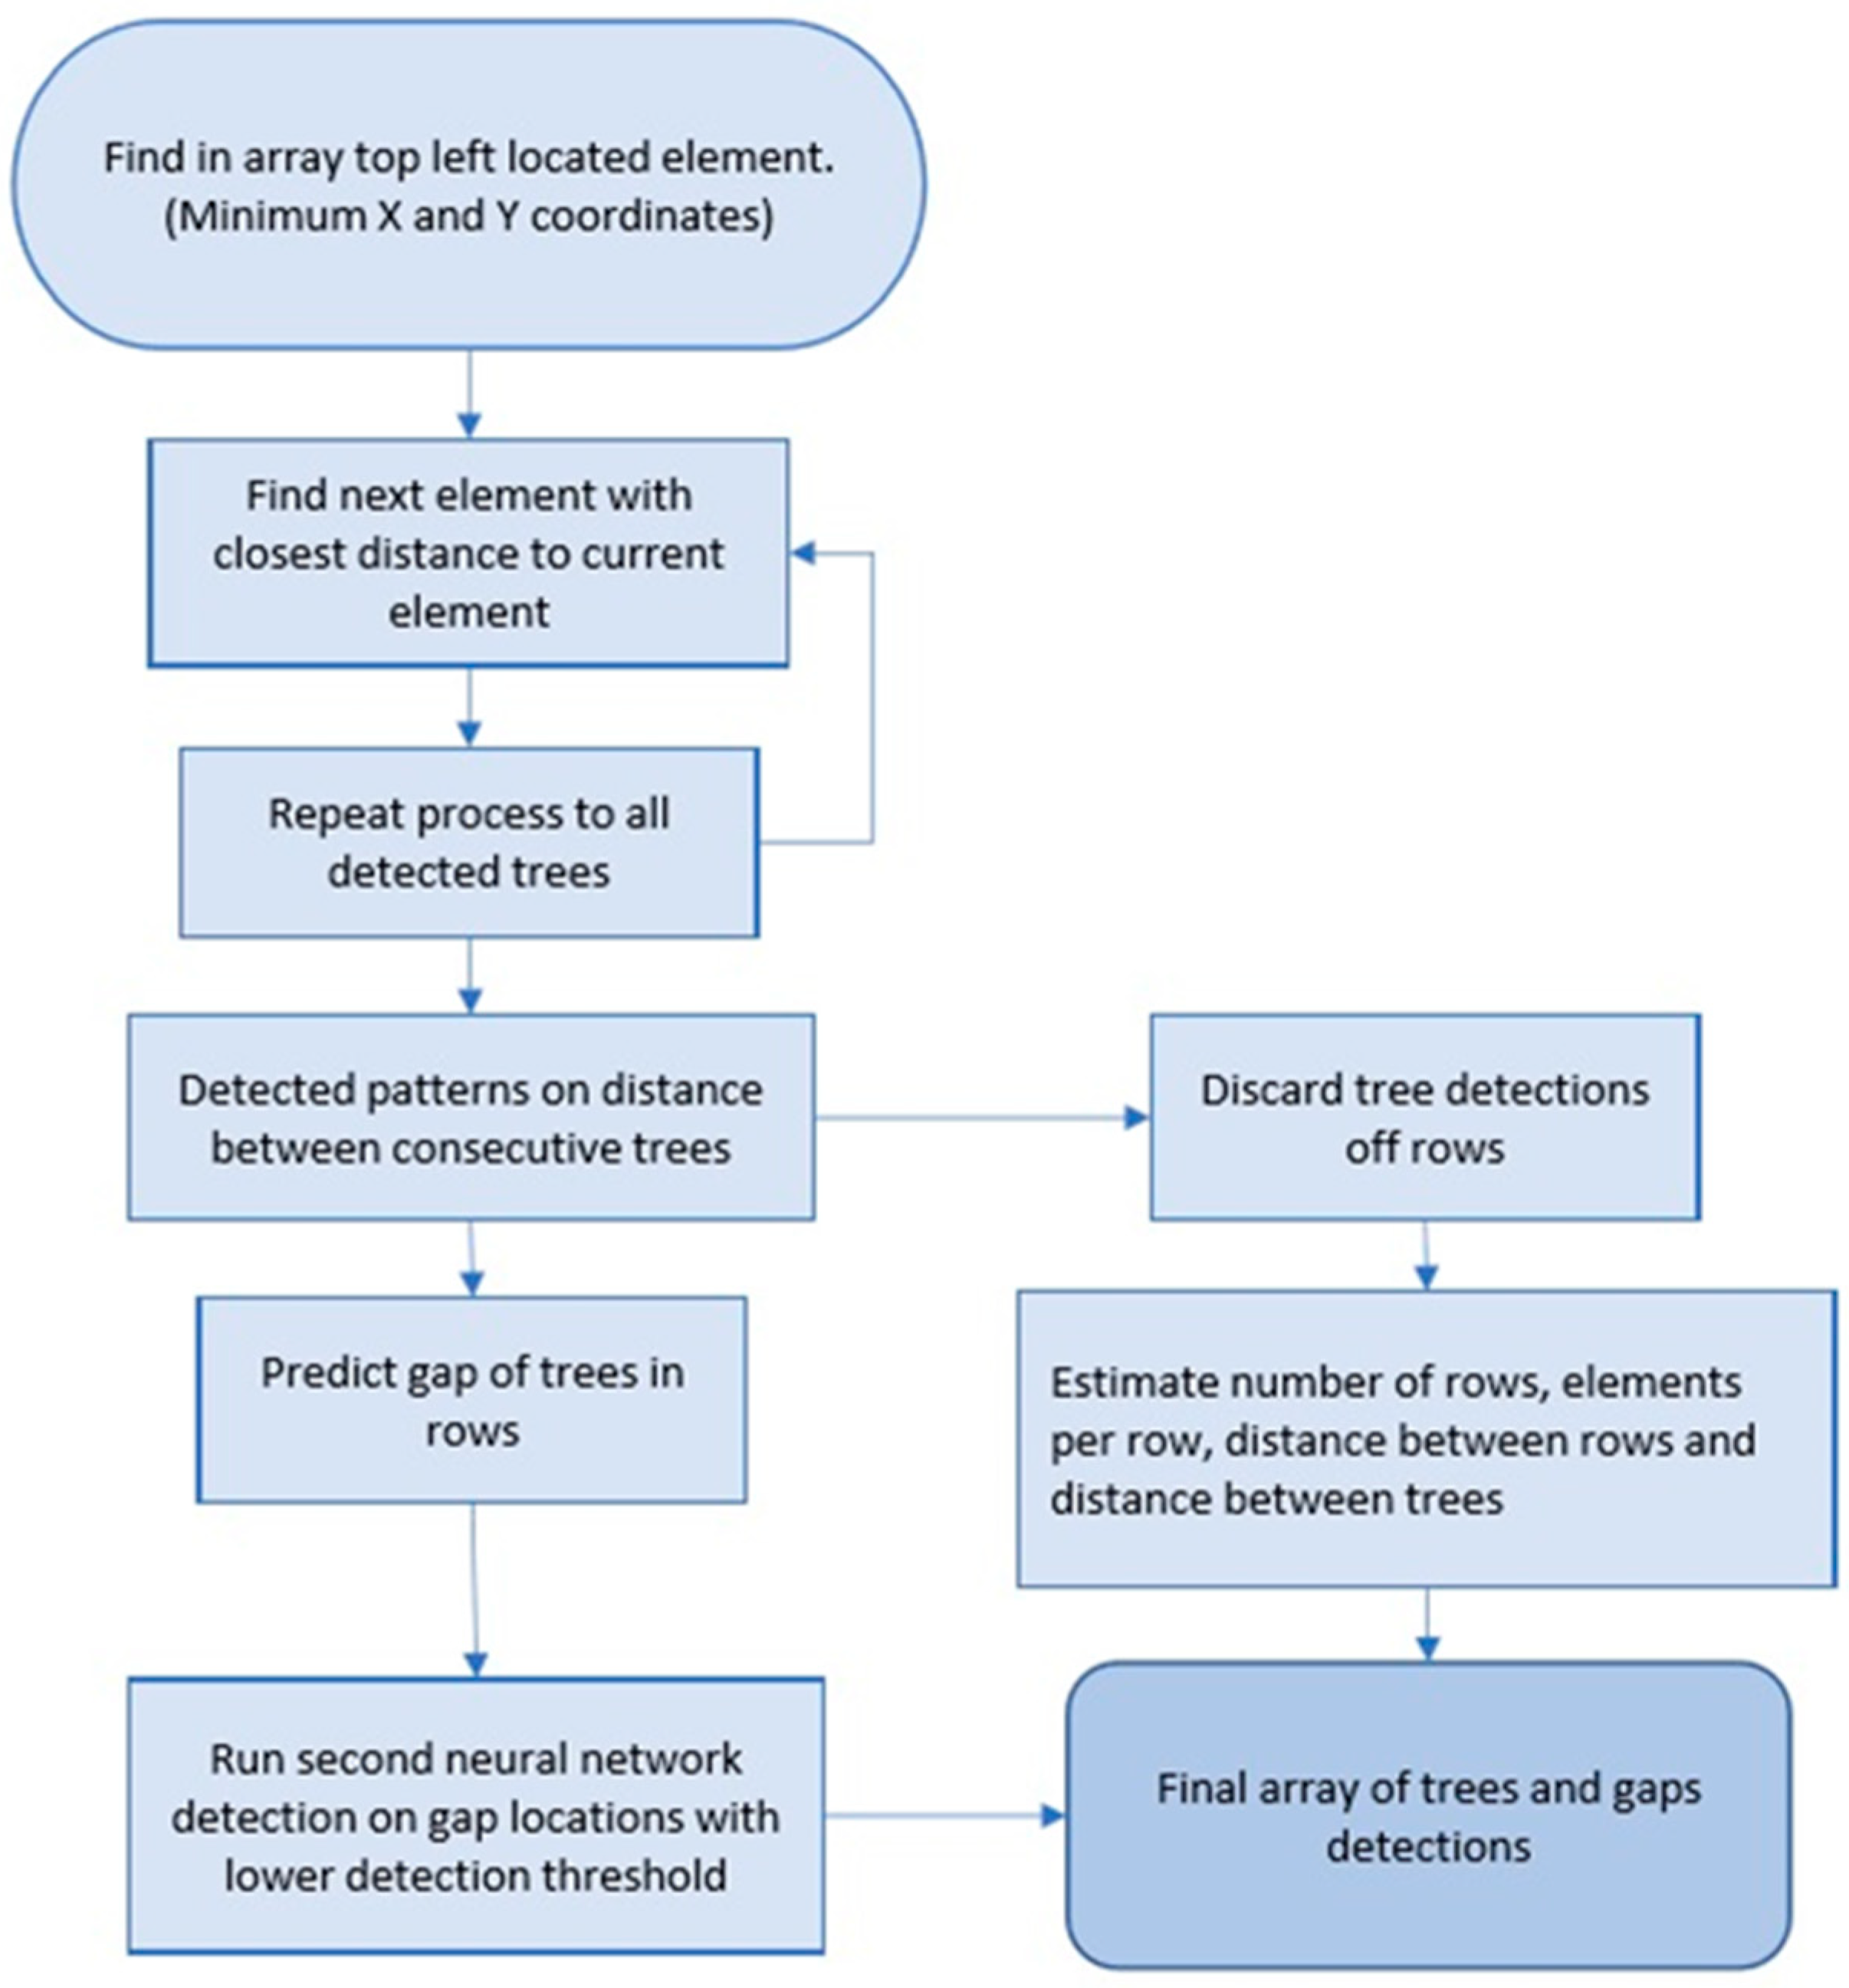
An automated method to detect individual citrus trees on large multispectral maps is developed in this technique. The process comprises multispectral image processing, deep learning convolutional neural-networks (DL-CNN), and array operations to detect and analyze individual tree phenotypic characteristics (e.g., canopy area, normalized difference vegetation index—NDVI, etc.). Figure 2 presents the workflow of the proposed process. Below we analyze each processing step.
2.2.1. UAV Imagery Acquisition
A hexacopter UAV (DJI Matrice 600, DJI, Shenzhen, China) was used for image acquisition on December 2018 between 11:00 a.m. and 12:00 p.m. to reduce the effects of shadows on images. A multispectral camera (RedEdge-M, MicaSense, Seattle, WA, USA) was attached under the UAV. The camera has five imaging sensors: (i) Blue: 465–485 nm, (ii) green: 550–570 nm, (iii) red: 663–673 nm, (iv) red edge: 712–722 nm and (v) near-infrared: 820–860 nm. The sensor’s size is 4.8 mm × 3.6 mm (horizontal × vertical) with a resolution of 1280 pixels × 960 pixels (1.2 megapixels). The camera’s lenses have focal length of 5.4 mm resulting in a horizontal field-of-view (FOV) of 47.9 degrees, vertical FOV of 36.9 degrees, and diagonal FOV of 58.1 degrees. For flight planning and mission control, Pix4D Mapper software was used with 75% images overlap (forlap and sidelap). Data were collected at 75 m (250 ft) above the ground with a speed of 4 m/s and the flight time was 31 min. The flight mission performed 18 stripes (16 m between then) with orientations parallel to the rows (18.6° counter clockwise from north). A calibrated reflection panel (CRP) designed specifically for this multispectral camera was utilized before and after the flight mission to provide radiometric calibration in order to compensate for sensor sensitivity, lighting, and atmospheric conditions.
2.2.2. Photogrammetric and Multispectral Image Processing
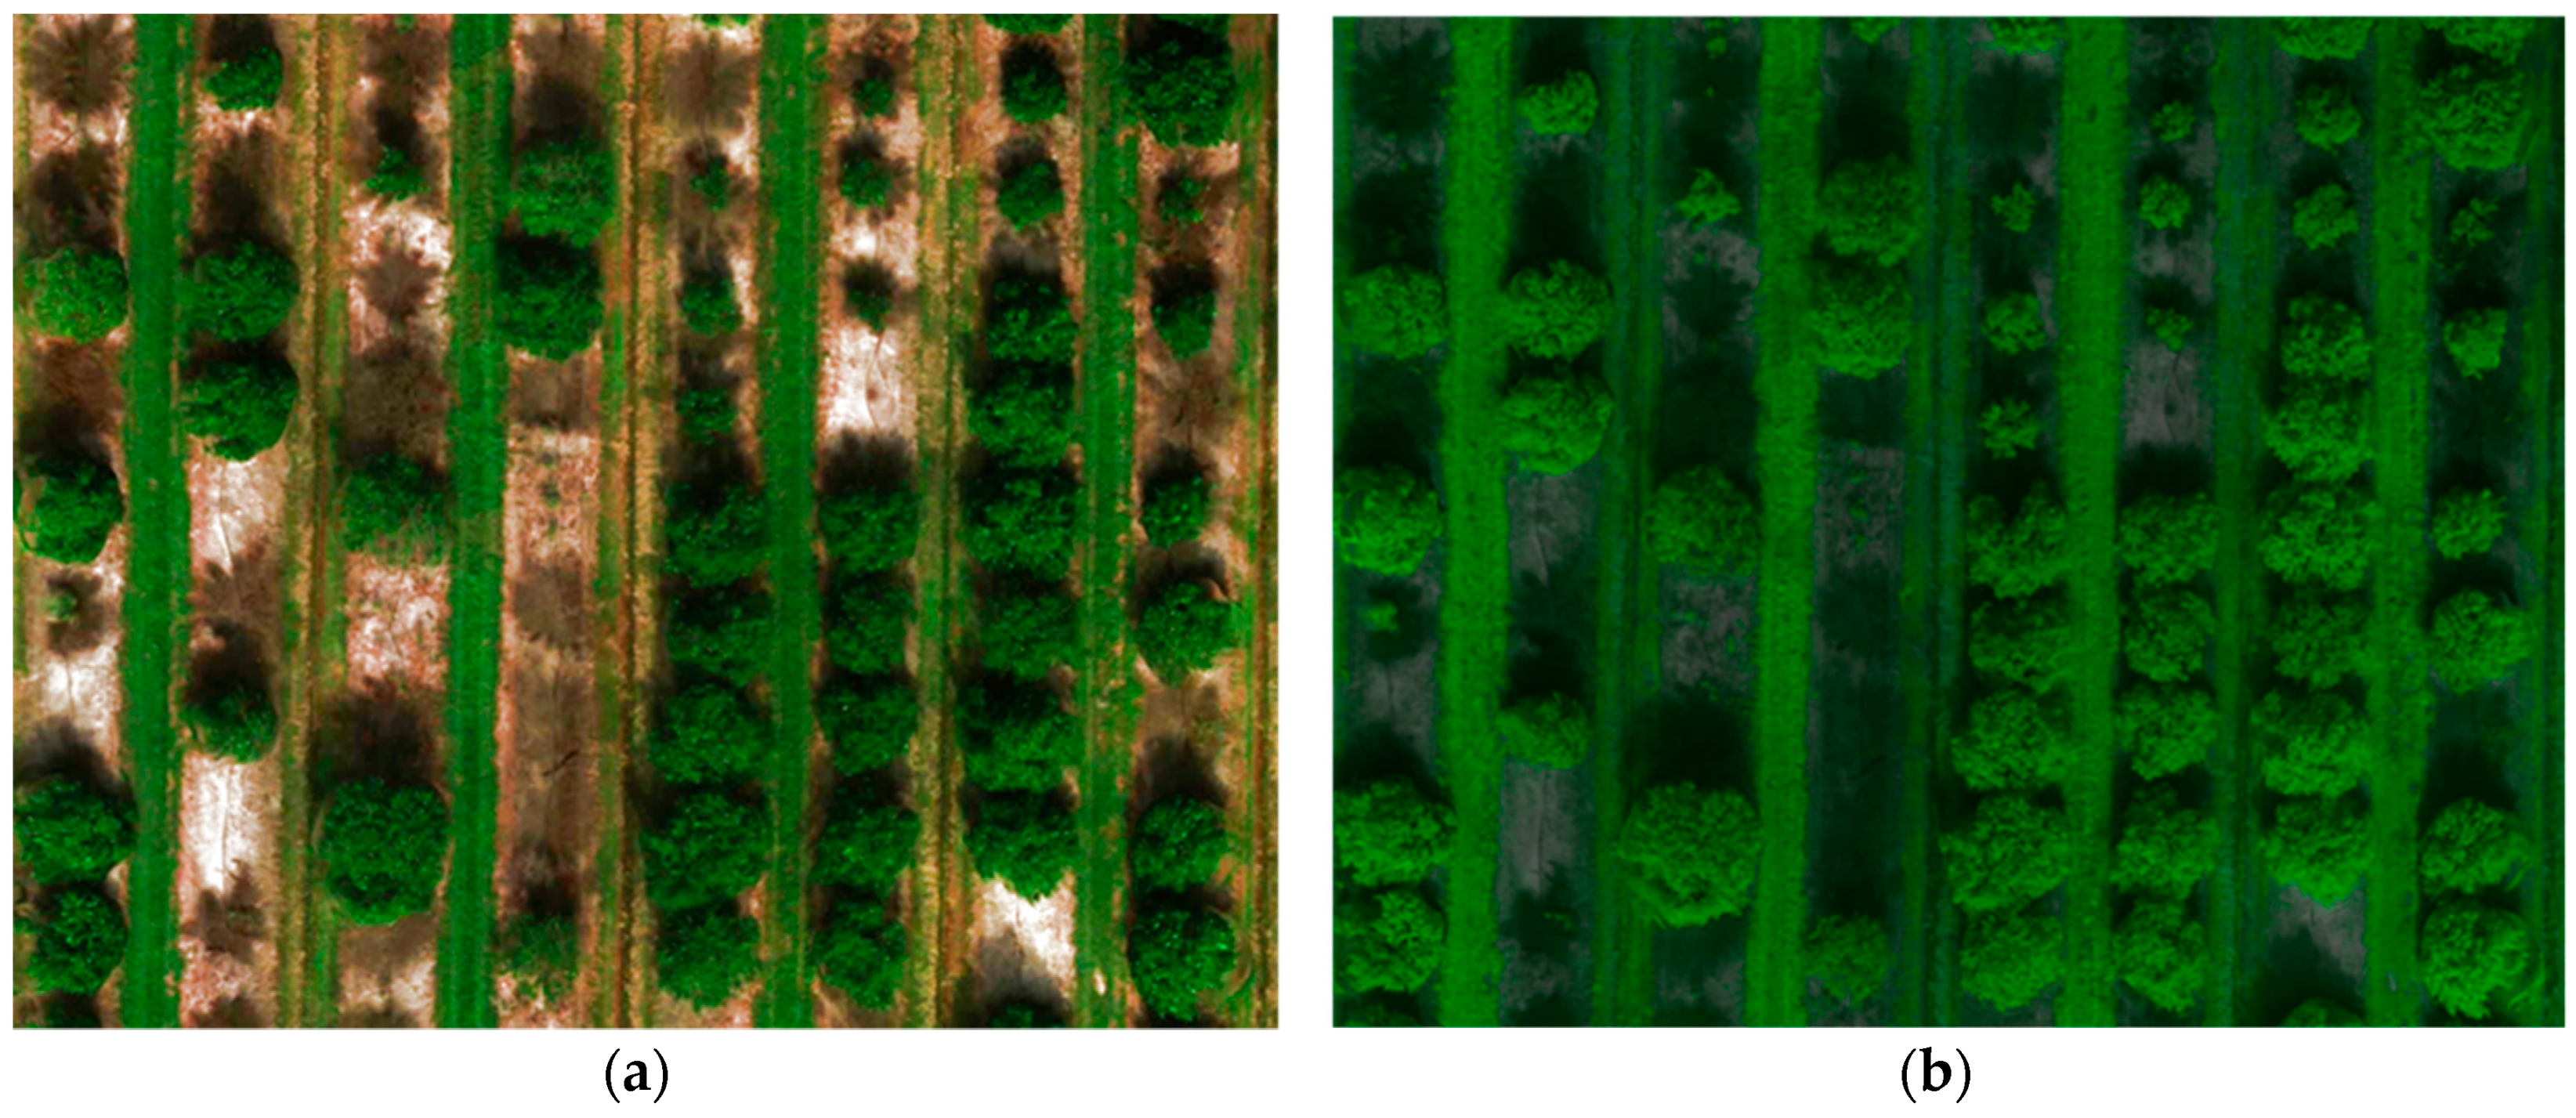
Data were processed using the Pix4D Mapper software to stitch the collected UAV images into aerial maps. In this step, a map with size 5570 pixels × 7700 pixels (full-resolution) was generated for each of the following bands: Blue (B), green (G), red (R) and near-infrared (N). The ground resolution of the map was 5 cm. Then, the bands were combined using a python script to create: (i) An RGB map, and (ii) an RNB map, by using the near-infrared channel as the green channel representation. The RNB map, containing the near-infrared channel, shows a visually better contrast between the trees and surroundings and so it can, in theory, give a better detection rate than the RGB map. The RNB maps were also be used to calculate a Normalized Difference Vegetation Index (NDVI) for each tree (as an example). Figure 3a,b show an example of generated RGB and RNB maps, respectively.
2.2.3. First Tree Detection using Convolutional Neural Networks
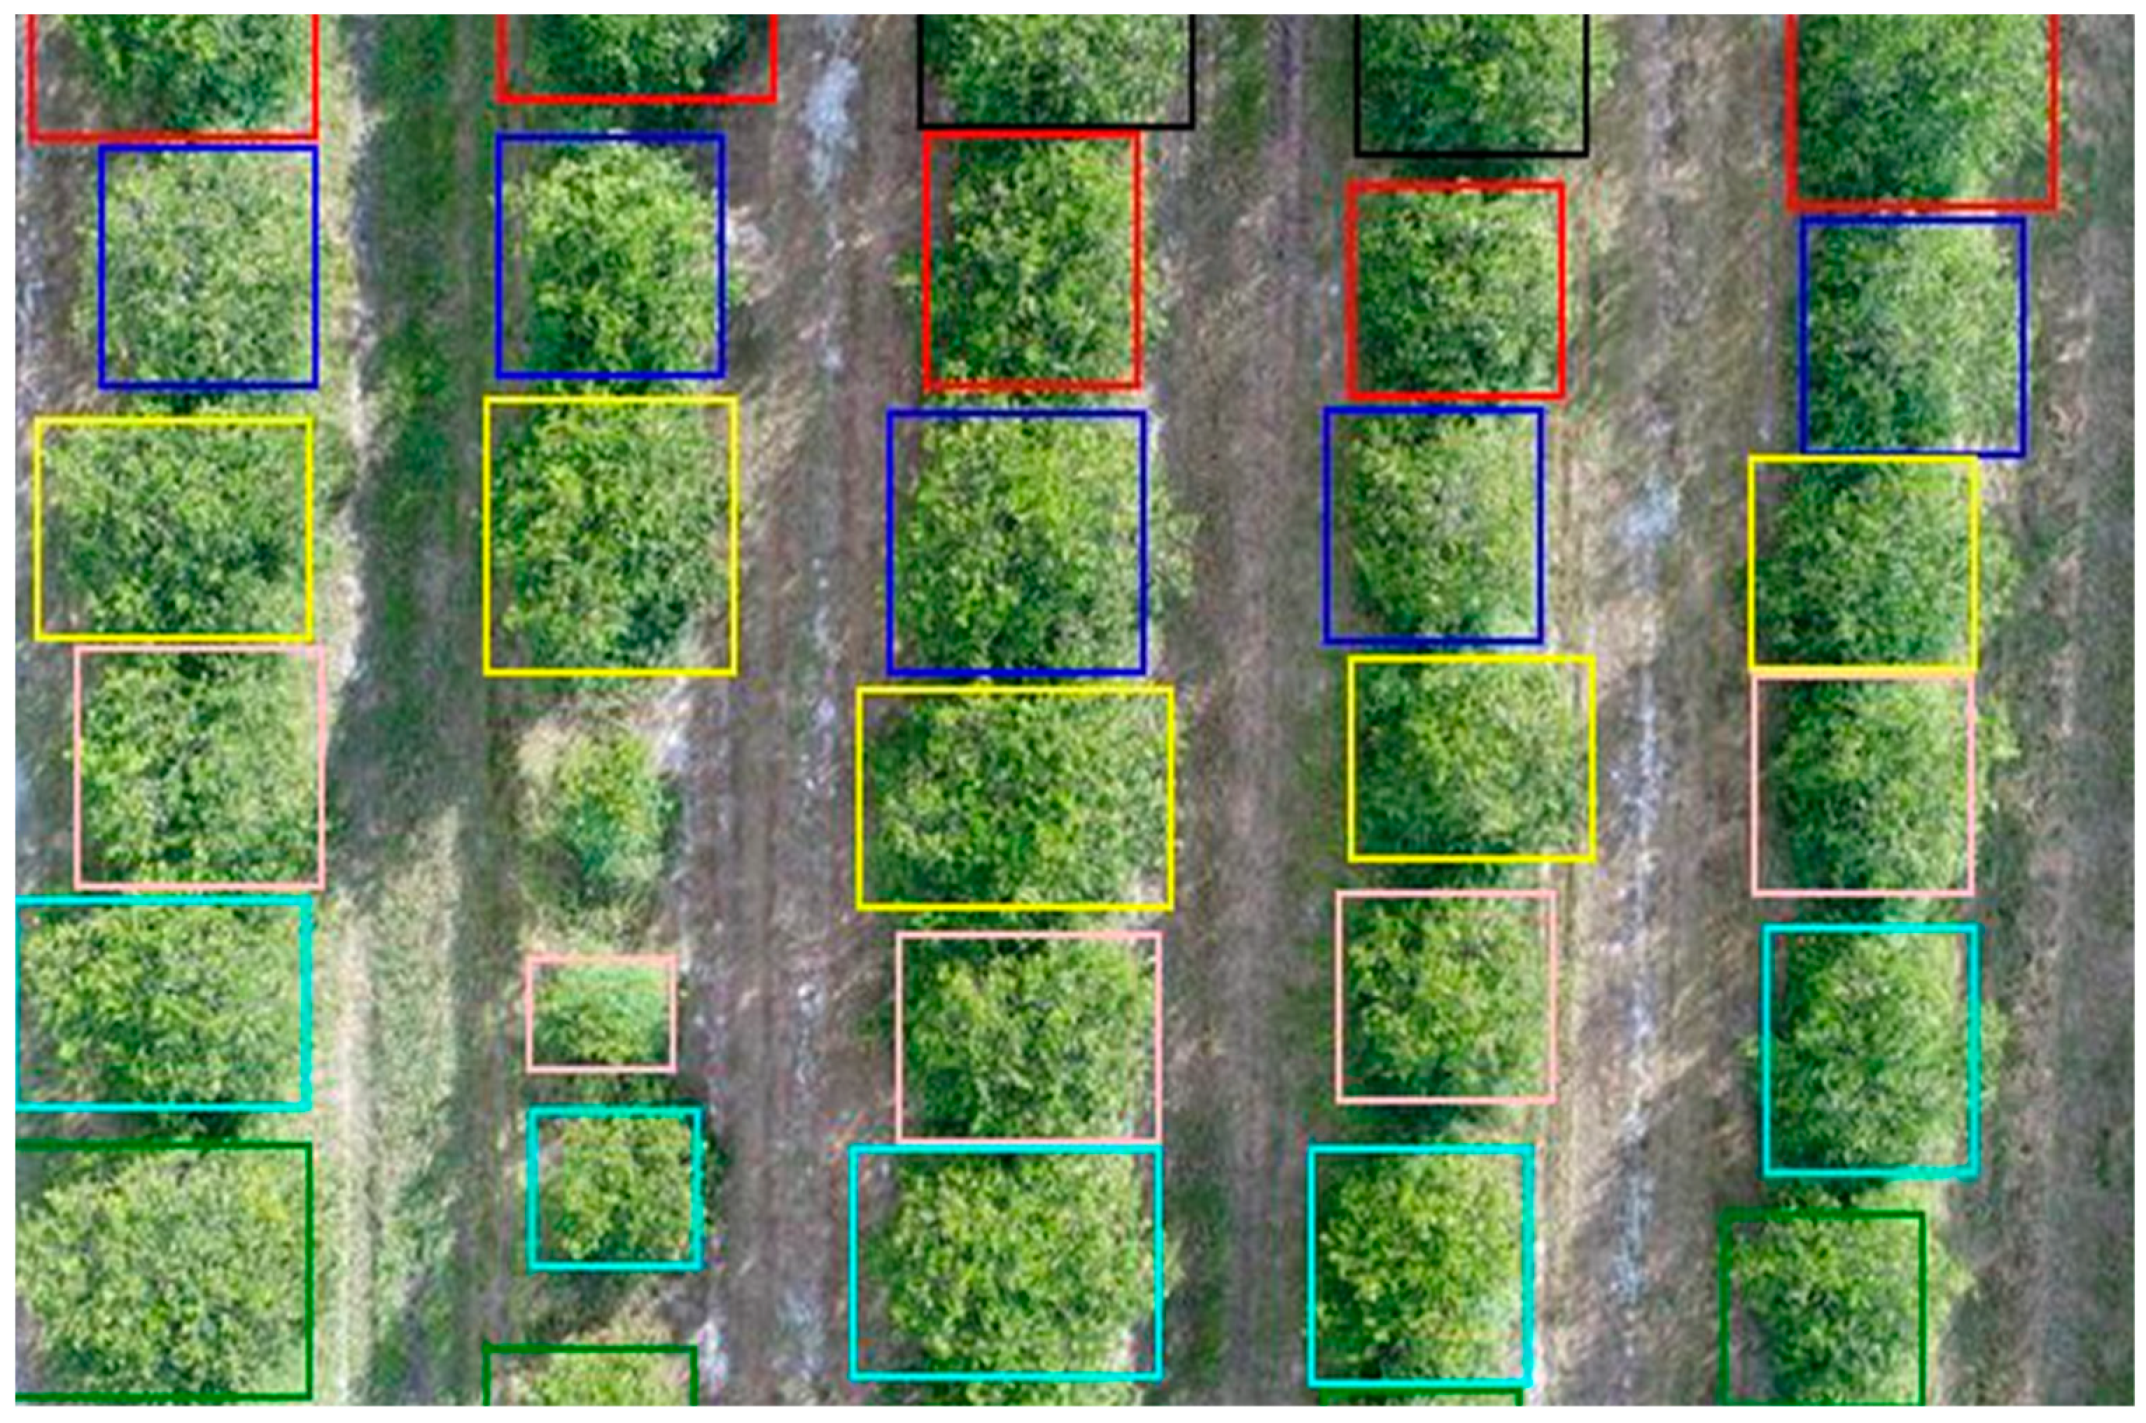
A deep learning convolutional neural network was trained using YOLOv3 (You Only Look Once), a state-of-the-art object detection system [34]. YOLOv3 is a single-stage method for object detection consisting of 106 fully connected neural network layers. The training set of images were obtained on citrus trees from the grooves at the Southwest Florida Research and Education Center (SWFREC) located in Immokalee, Florida, USA. Approximately 400 images of trees from RGB and RNB maps with resolutions of 850 pixels × 600 pixels were used with different light and angle conditions. Figure 4 presents an example of a training image set containing around 30 labeled trees. The entire training set contained approximately 15,000 individual trees labeled. The network was trained for 10,000 iterations using a learning rate of 0.001.
After the network was trained, an algorithm was developed in C to run the YOLO neural networks on the RNB map and return the detected tree’s locations. The RNB map was found to be more consistent for tree detection comparing to an RGB map, as it reduces shadow effects and light variances effects on the images. A detection threshold of 0.01 was utilized after trial-and-error tests.
2.2.4. Recognize Map Dimensions, Properties, and Second CNN Tree Detection
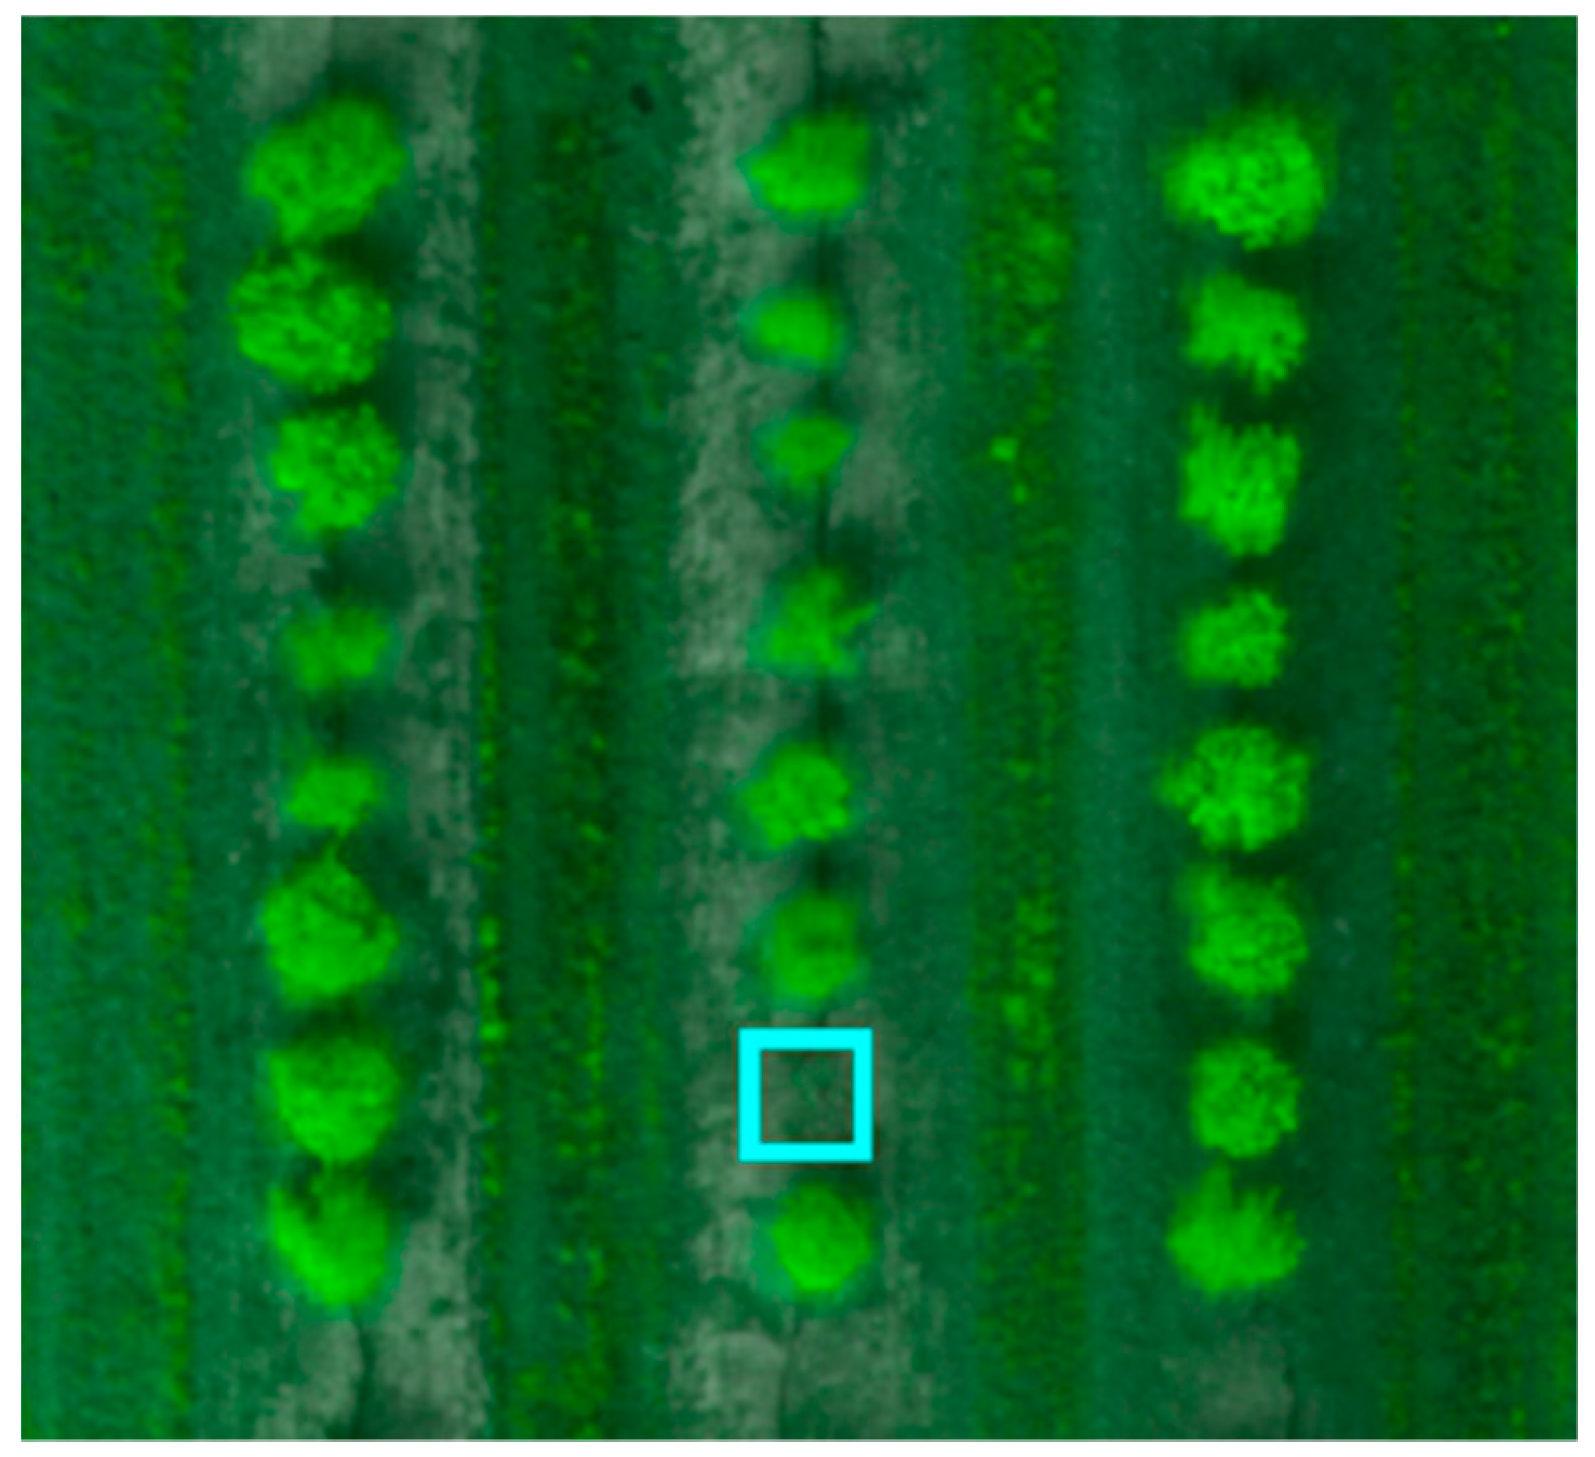
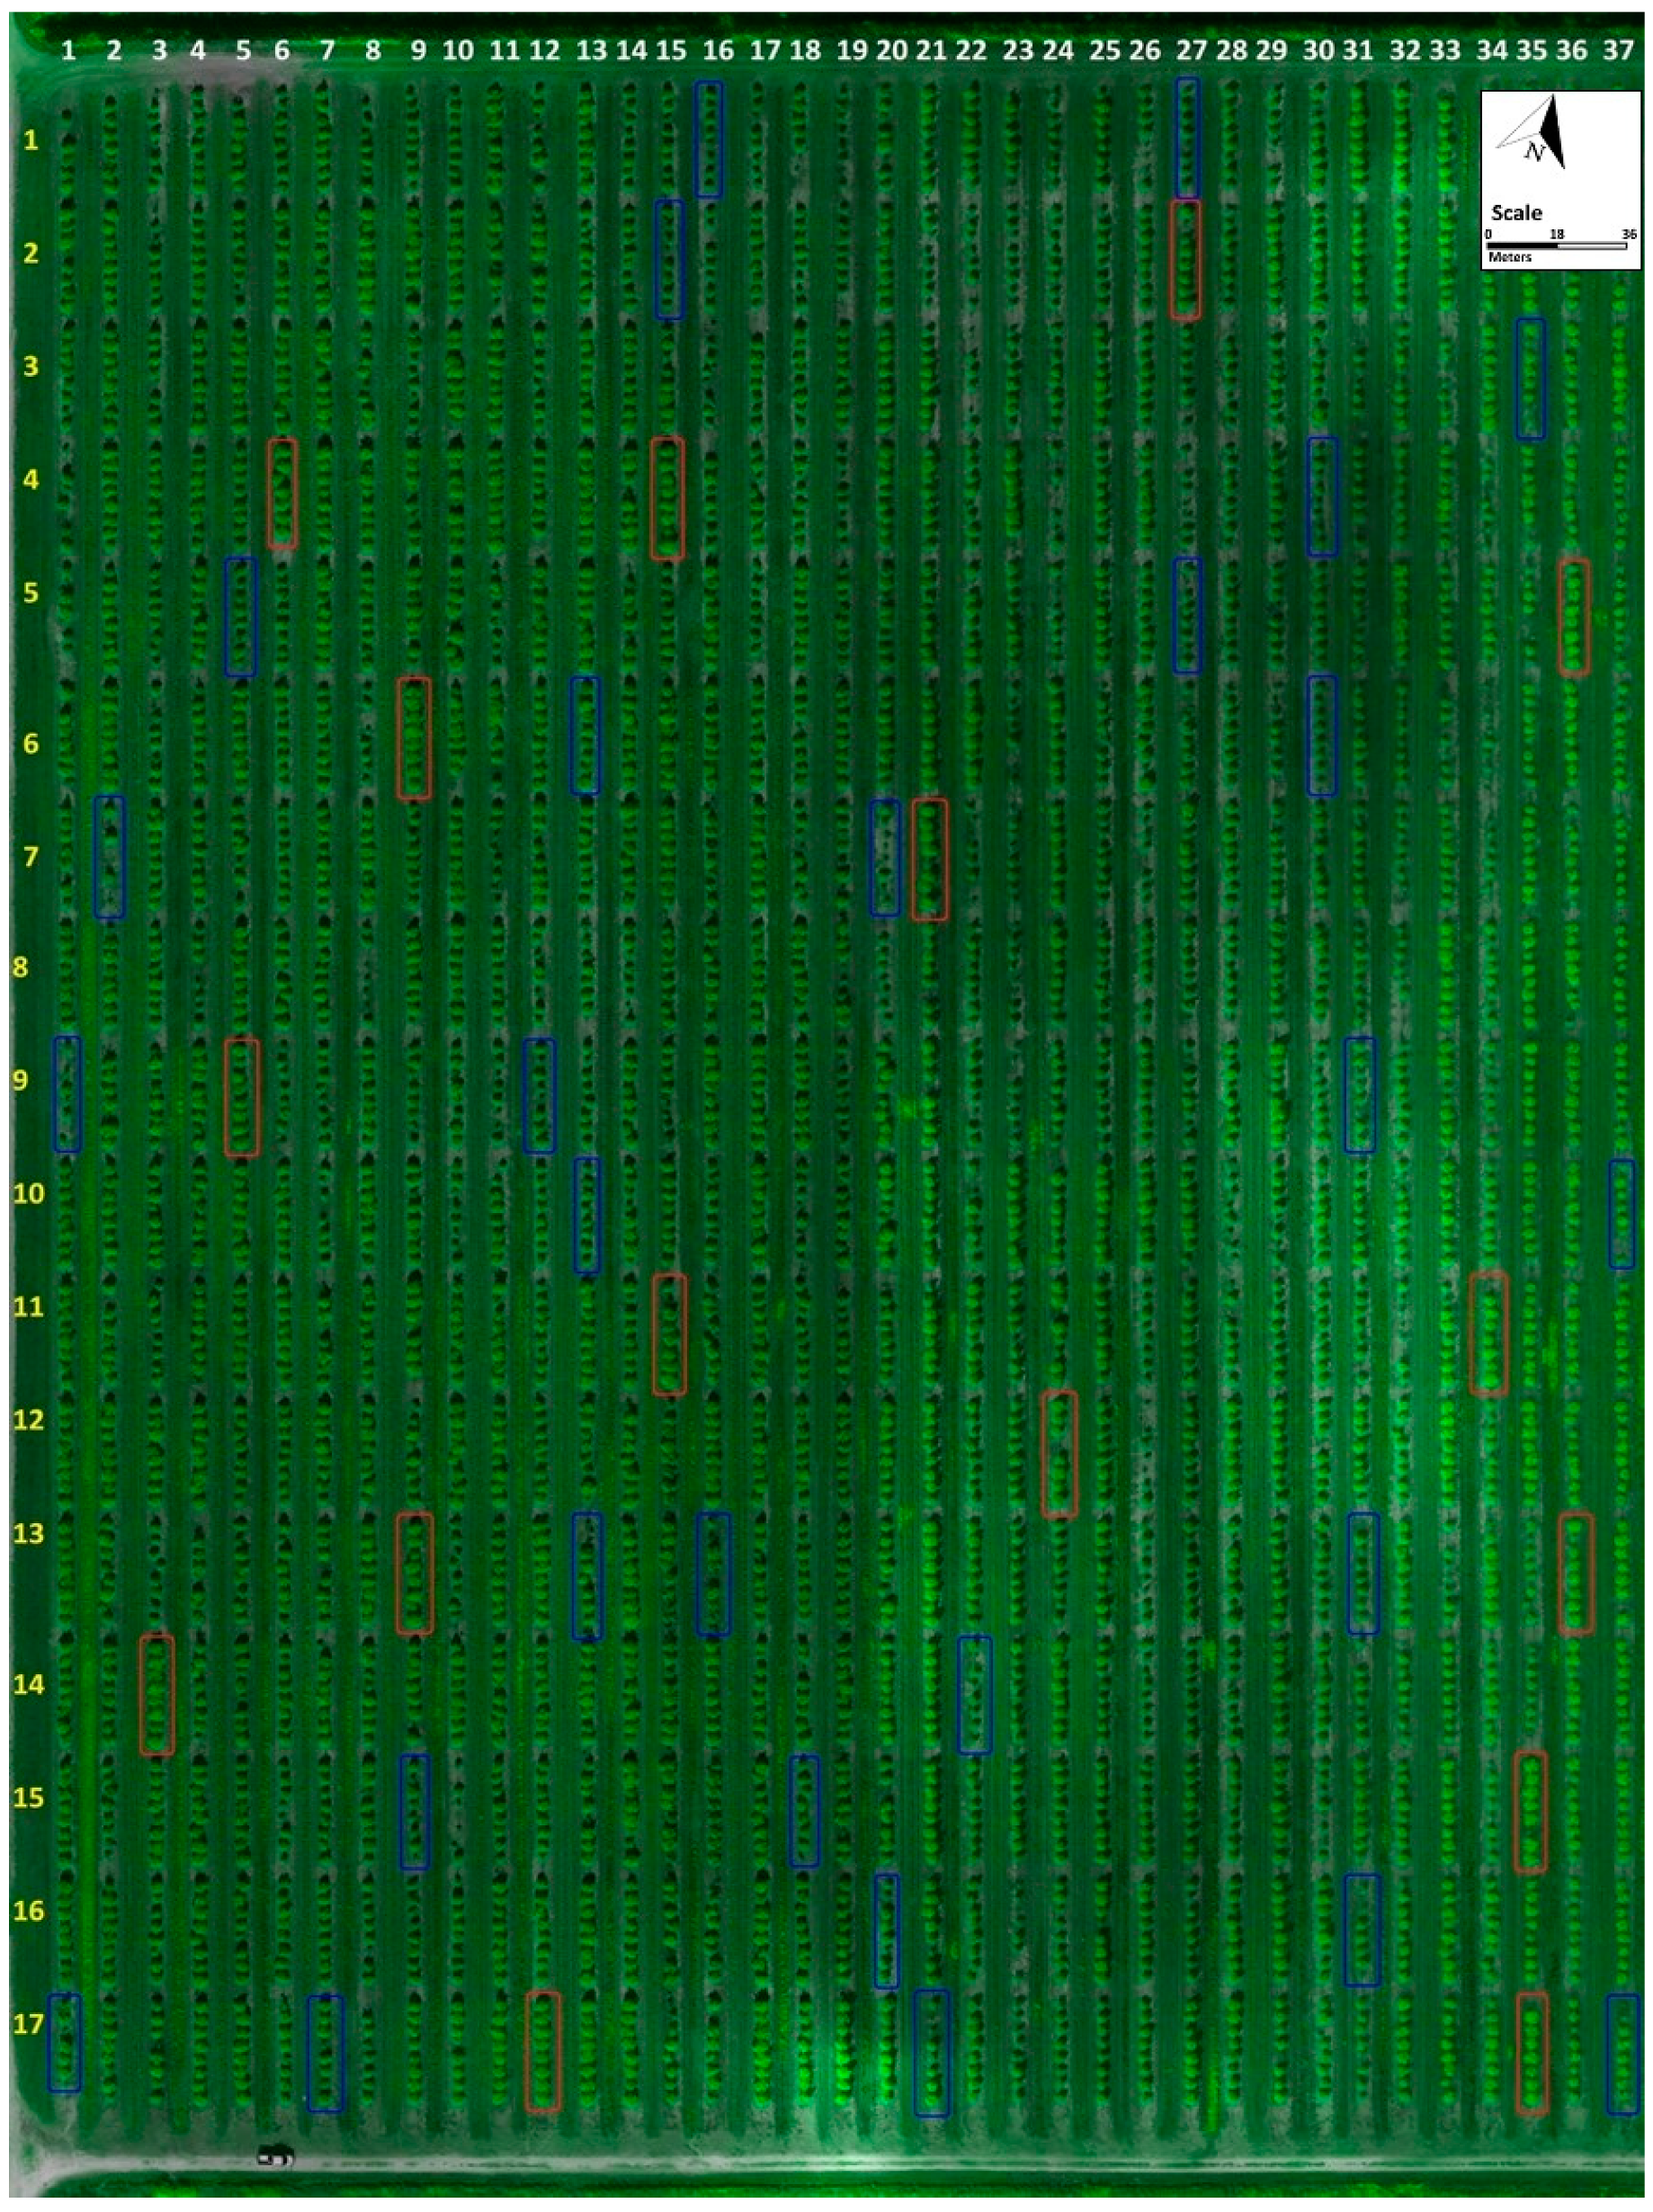
In order to recognize tree patterns on the map (e.g., rows orientation), an algorithm was developed to process the output results of the neural networks detection. By performing array operations, the distance between consecutive trees were analyzed and compared to recognize rows orientation and to estimate distances between trees and distance between rows (tree spacing). Figure 5 illustrates the workflow of the processing steps used in this array operation. After recognizing patterns, the algorithm also predicts false positive trees, detections that do not follow a row pattern (or in between rows) and discards such locations. Finally, the algorithm predicts (detects) tree gaps in rows by analyzing the distance between trees in a row and comparing it with the average distance between trees. Figure 6 presents an example of a detected tree gap region.
The detected gap regions will either be true positive gaps, meaning there is no tree in that location, or a false positive gap, meaning there is a tree on the location that was not detected by the neural network (false negative tree detection). The gap regions were selected and isolated to be analyzed again by the neural network on a lower detection threshold, since these locations likely contain trees. A threshold of 0.001 was set after trial-and-error tests. This process helps to reduce tree false detections on maps.
2.2.5. Calculate Individual Tree’s Canopy Area and NDVI
The Normalized Difference Vegetation Index (NDVI) was shown to be a great indicator of vegetation cover and vegetation biomass, hence, it was chosen as an example of an individual tree index generated by the proposed algorithm (technique). Analyzing individual pixel NDVI value inside the predicted tree locations, the algorithm can differentiate between canopy and soil pixels inside the “tree detected area” (e.g., rectangular in Figure 7). NDVI is calculated using red and near-infrared channels. Figure 7 shows calculated NDVI values and detected tree’s locations (as a rectangle).
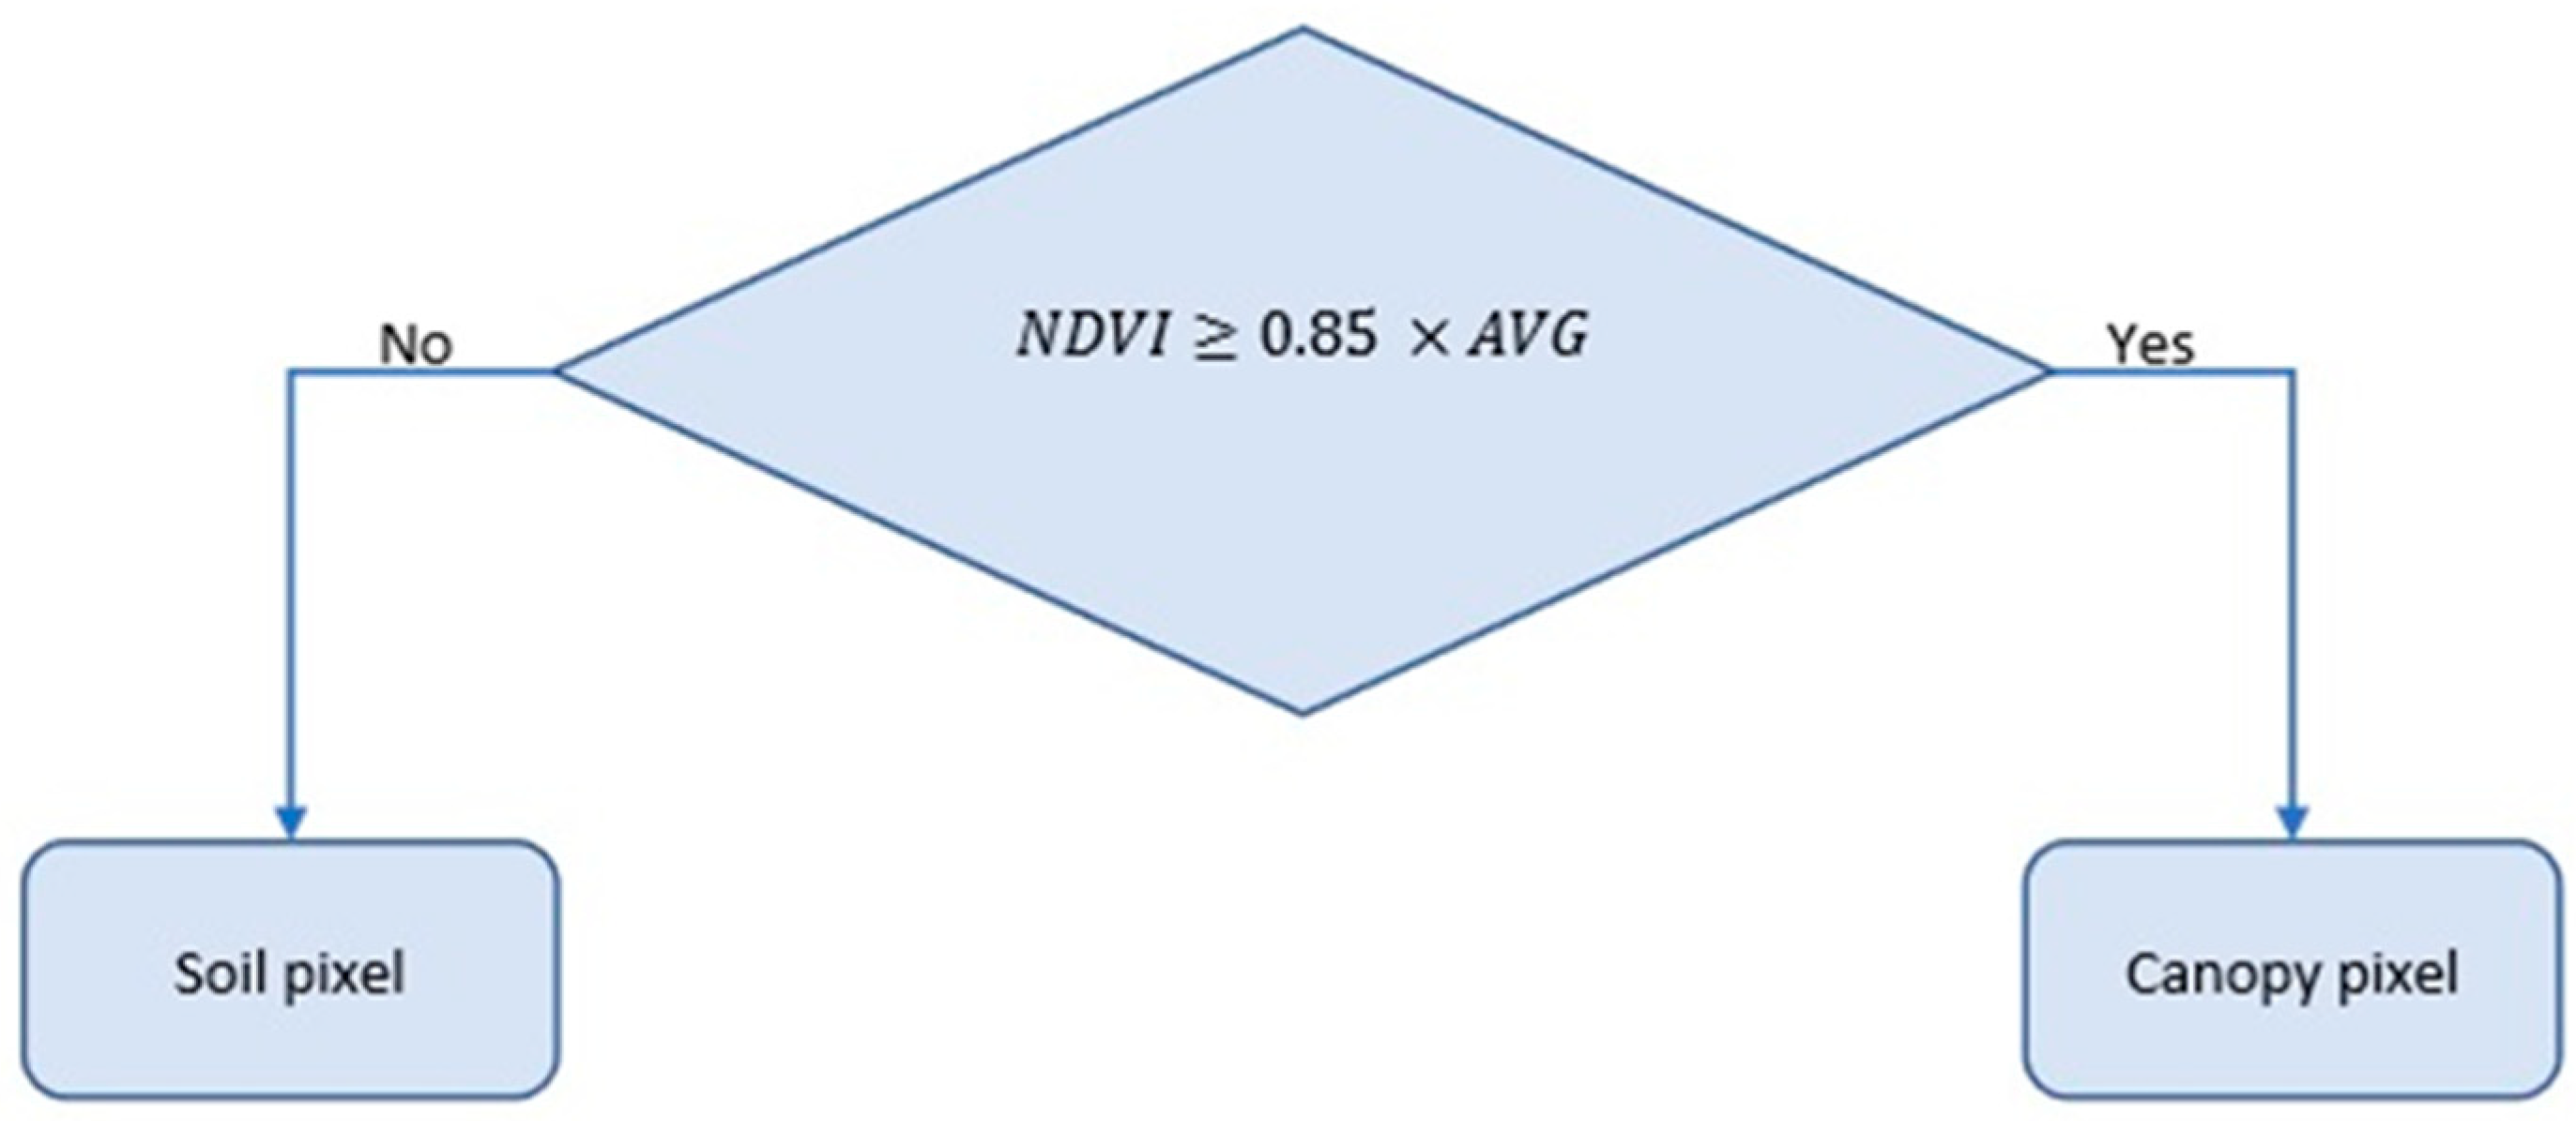
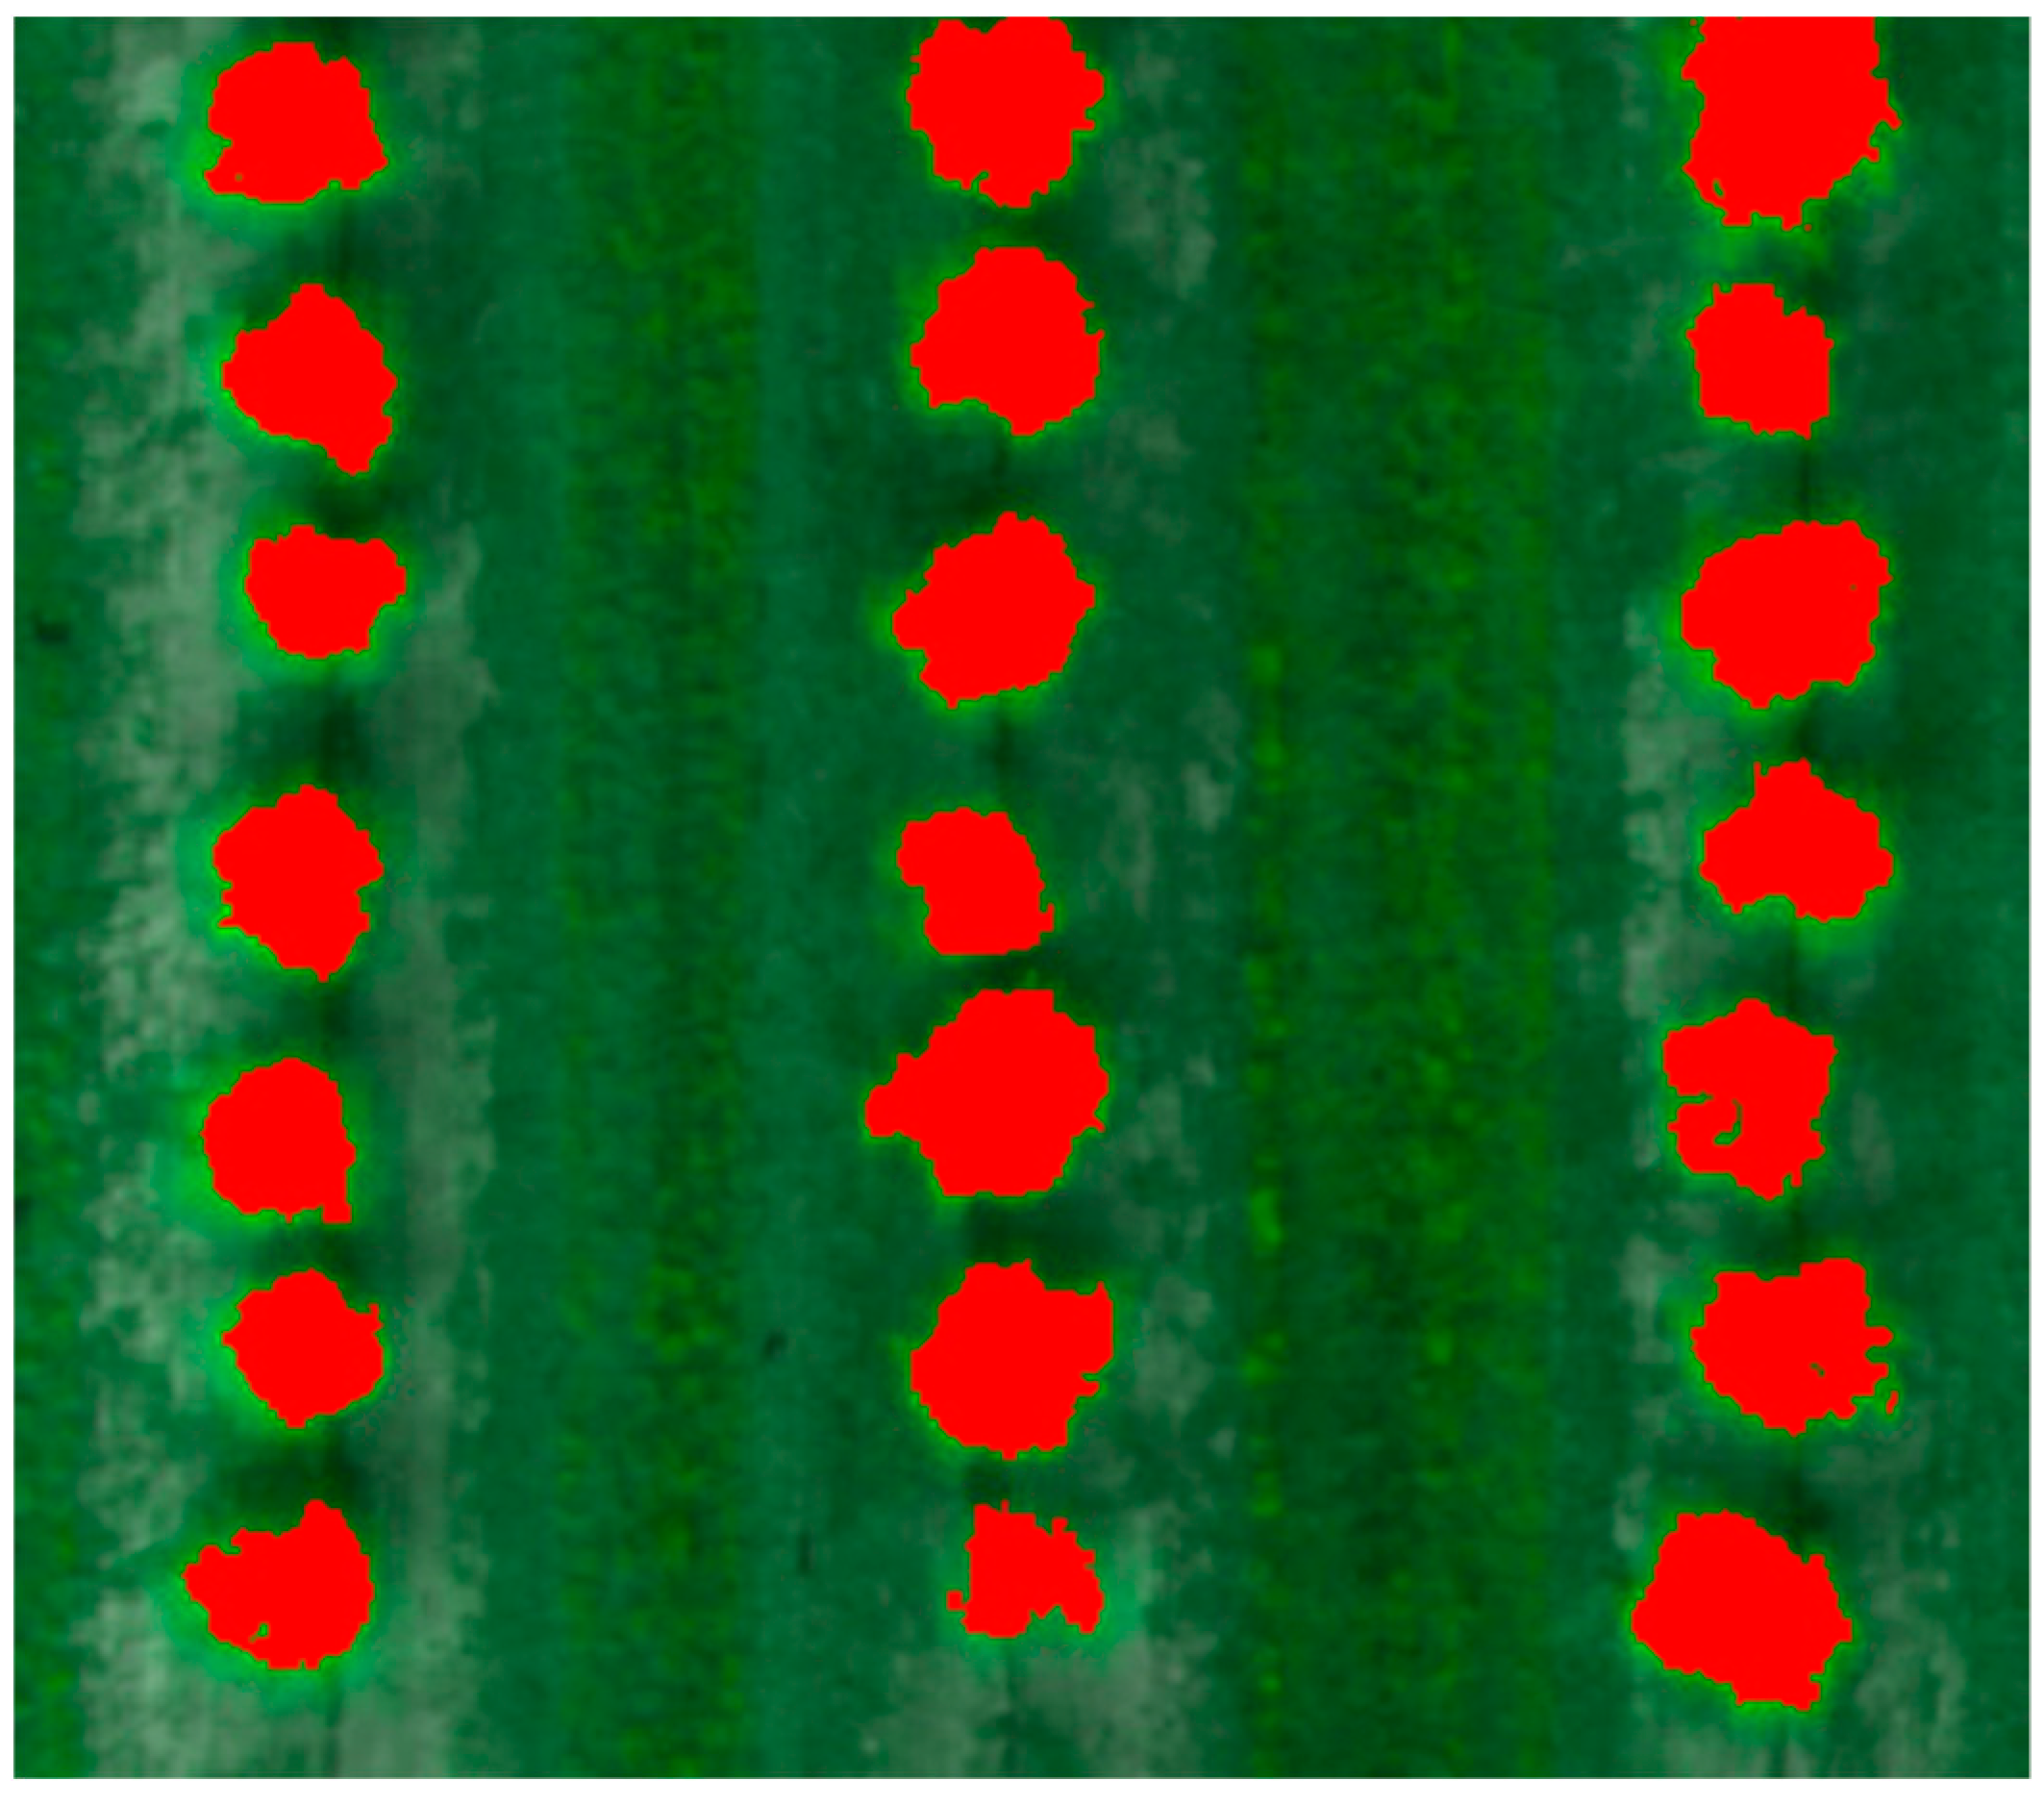
An image segmentation process was developed to distinguish canopy pixels from soil pixels. First, the average NDVI value (Avg) for a selected region (n pixels) was calculated according to Equation (1). Then, individual pixels were compared to the obtained region average value for classification into “soil” or “tree canopy”. An empirical threshold of 0.85 was applied to the segmentation. Figure 8 presents a workflow representation of NDVI image segmentation method and Figure 9 shows an example of the obtained canopy area using this method.
3. Evaluation Metrics
3.1. Tree and Tree Gap Detection
To evaluate the performance of the proposed technique and process, an experiment was conducted on the selected study area. A ground truth tree map was developed by manually examining every visually observable tree on all the 37 rows of the maps. A total of 4931 trees were located. Tree gaps were also manually located on maps (total of 112 tree gaps). Every detected tree and gap were compared to the ground-truth in terms of true positives (TP) (correct object detection), false positives (FP) (incorrectly detected object; a commission error), false negatives (FN) (an object is missed; an omission error), and common evaluation statistics for binary classification. Precision (P), recall (R), and F-score (F) were then calculated for both tree and gap detections. Precision describes the correctness of detected target and how well the system dealt with false positives (Equation (2)); recall describes the detection sensitivity, how well the algorithm dealt with false negatives (Equation (3)); and F-score is the harmonic mean of both precision and recall, an overall accuracy considering both terms (Equation (4)). The three metrics (P, R, and F) were calculated for the detection in two cases: (i) After the first convolutional neural network detection, and (ii) after the second detection refinement, to better analyze the accuracy of each step of the process.
P = TP/(TP + FP),
R = TP/(TP + FN),
F = (2 × P × R)/(P + R).
3.2. Tree Canopy Area Estimation
Tree canopy area estimation was evaluated by manually measuring canopy dimensions in the field and comparing with the proposed technique’s detected area. Manual measurements were taken on 20 different trees (randomly chosen) using a measuring tape to get two dimensions of the tree canopy (as a rectangle). A calibration board of 0.61 × 0.91 m (2 × 3 ft) was placed on the field before flying the UAV to calculate the pixel size on the maps. The algorithm’s detected canopy areas were analyzed by counting the pixels on two different cases: (i) The rectangle regions of trees detected by the neural-network (before the NDVI-based image segmentation process; e.g., Figure 7), and (ii) after the NDVI-based image segmentation process, resulting in a nonrectangular shaped region (e.g., Figure 9). It is important to note that the ground truth measurement only takes two dimensions into considerations, while the algorithm’s NDVI image segmentation can take any shape into consideration, thus being, in theory, more precise than the ground-truth measurements. Other methods to manually measure canopy area in different shapes were impractical for this study.
3.3. Statistical Indices Comparison Between Two Citrus Rootstocks
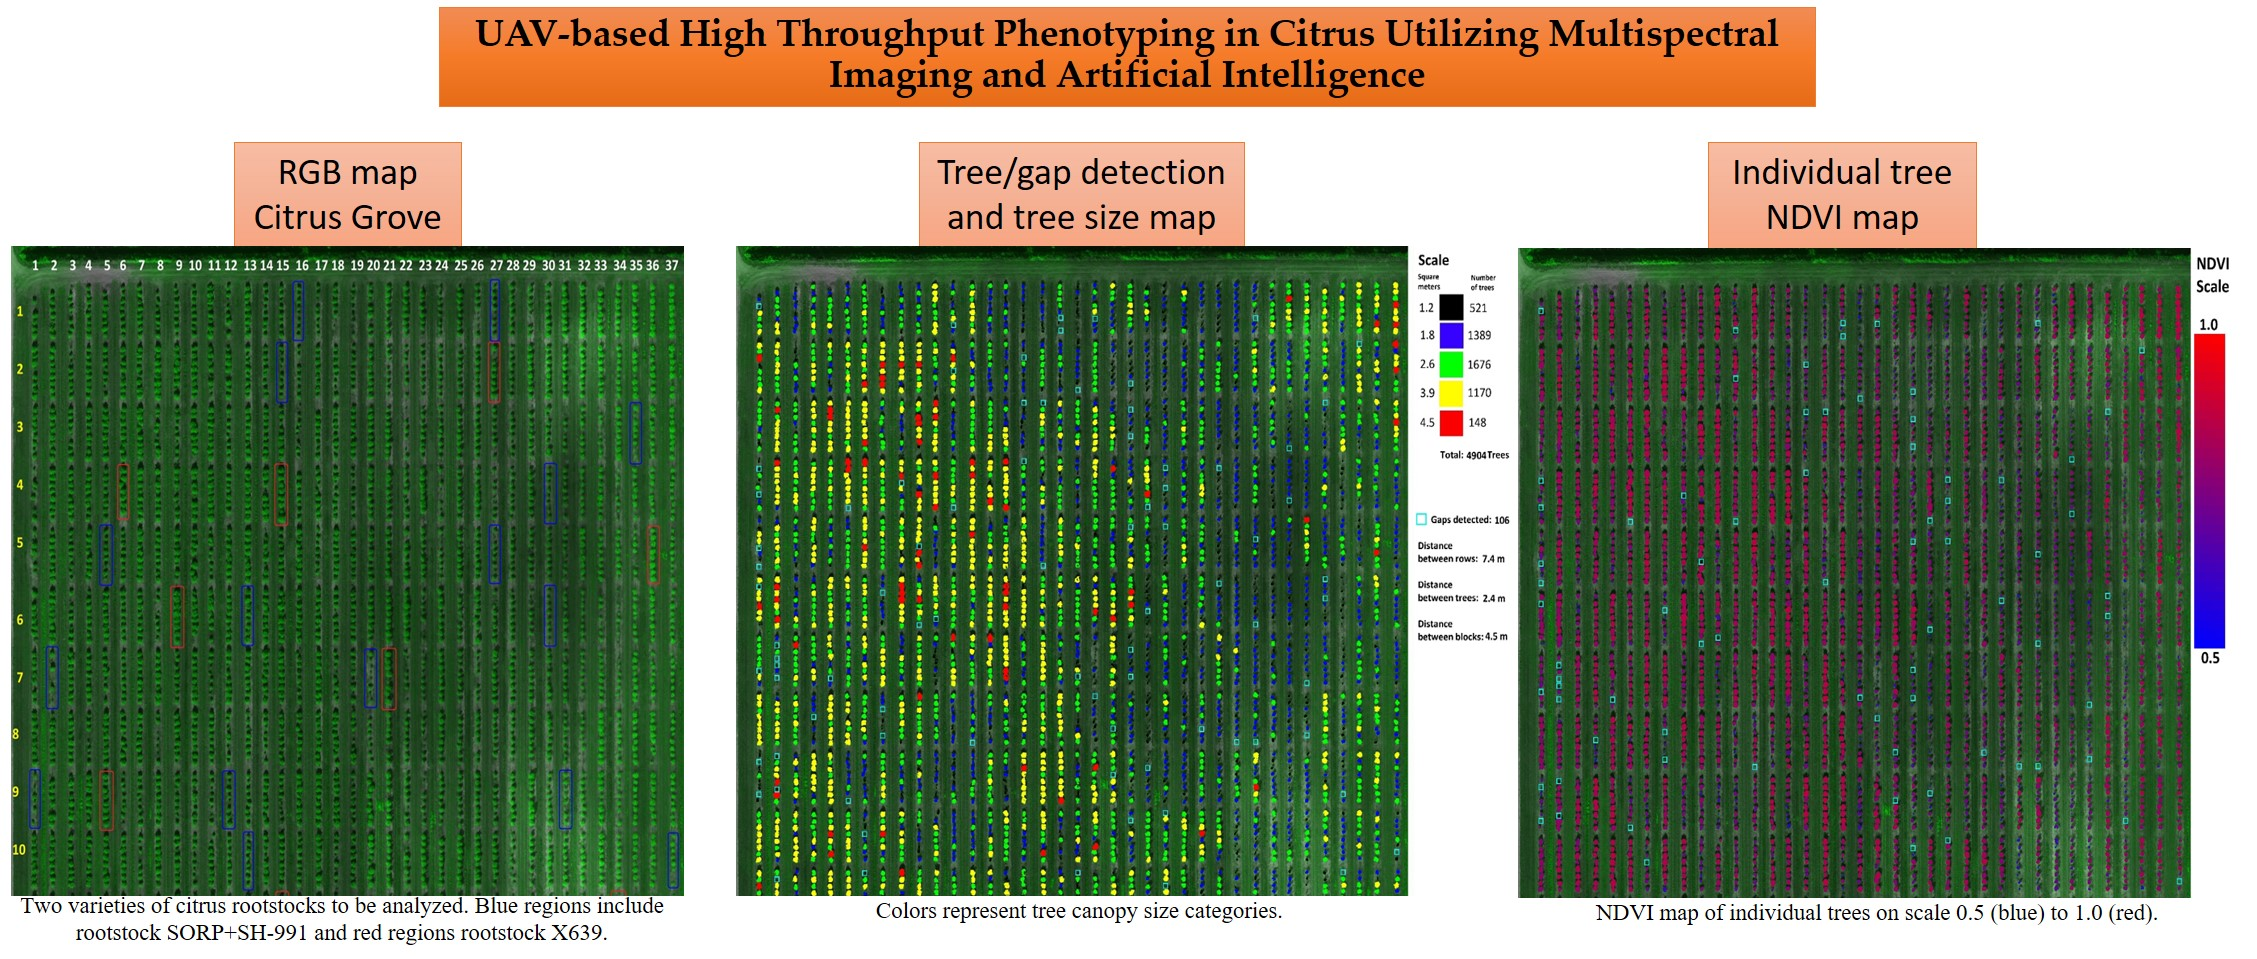
In order to evaluate the performance of this automated technique and to analyze and compare data from two different citrus tree rootstocks in a map, a statistical analysis was conducted. The analyzed rootstocks were: (i) SORP+SH-991, and (ii) X639. The regions of each tree rootstock were located and their positions were marked on the map. The regions were divided into blocks of the same rootstock (Figure 10). Blue regions consist of 28 blocks of trees of rootstock SORP+SH-991 and red regions consists of 15 blocks of trees of rootstock X639. Statistical data for individual trees in both regions were generated by the developed algorithm in terms of: (i) Canopy area, (ii) NDVI, and (iii) NIR/Red index.
4. Results
4.1. Tree Detections
A generated tree detection map is presented in Figure 11. This map includes number of detected trees and their canopy size, tree gaps, as well as field analytics (e.g., distance between rows, distance between trees, and distance between blocks of trees). The results for tree detection on the RNB map after the first convolutional neural network detection and after the second detection refinement are shown in Table 1. Tree gap detections are shown in Table 2.
The first image detection technique on the RNB map using CNN correctly identified 4823 trees, while it incorrectly identified 66 trees and missed 93 trees. The incorrectly identified trees were mostly weed patches that resembled trees canopies coloration on the maps. The majority of missed trees were trees with a small canopy, making its classification more difficult. After performing the refinement process, all the metrics achieved an improvement. False positive detections dropped 92% (from 66 to 5) as the algorithm filtered detections in between rows (Figure 12). False negative trees reduced by 82% (from 93 to 17) as a second CNN detection was performed on selected regions with a high probability of containing a tree (Figure 13). Figure 12 and Figure 13 present examples of misidentified trees being correctly identified after the refinement process (the colors represent canopy area in different size categories). After the whole process, an impressive precision and recall of 99.9% and 99.7% were achieved, respectively. Gap detections performed 100% in precision, as no incorrect gap was identified, and 94.6% of recall, missing six gaps to be identified.
By combining a CNN image classification with a refinement algorithm based on trees position in rows (using the field’s geometry), the detection accuracy was improved significantly (from 98.4% to 99.8%). The proposed region-based CNN algorithm depends on tree canopies having discrete gaps between them.
4.2. Canopy Area Estimation
The tree canopy area was calculated for 20 randomly selected trees by using: (i) Tree detection as a rectangle shape, and (ii) detection after NDVI-based image segmentation technique (both techniques shown in Figure 14). The pixel resolution was calculated to be 5 cm per pixel, using the calibration board as reference. The area results are compared to the manually measured areas in Table 3. As expected, the image segmentation areas are smaller than the rectangle shape areas, but the shape area represents a more realistic canopy shape based on its NDVI values.
The obtained results show a correlation error of 14.5% for the rectangle-shaped canopy area technique and 20.4% for the canopy shape using the NDVI-based image segmentation technique. Standard deviation was 12.7% and 9.4%, respectively. As previously discussed, the NDVI-based image segmentation area does not represent a good correlation to the ground truth measured areas (rectangle shaped), however, it is proposed as a new method to assess canopy area for different shapes of trees using the difference of NDVI between canopy and ground soil.
4.3. Indivudual Plant Indices
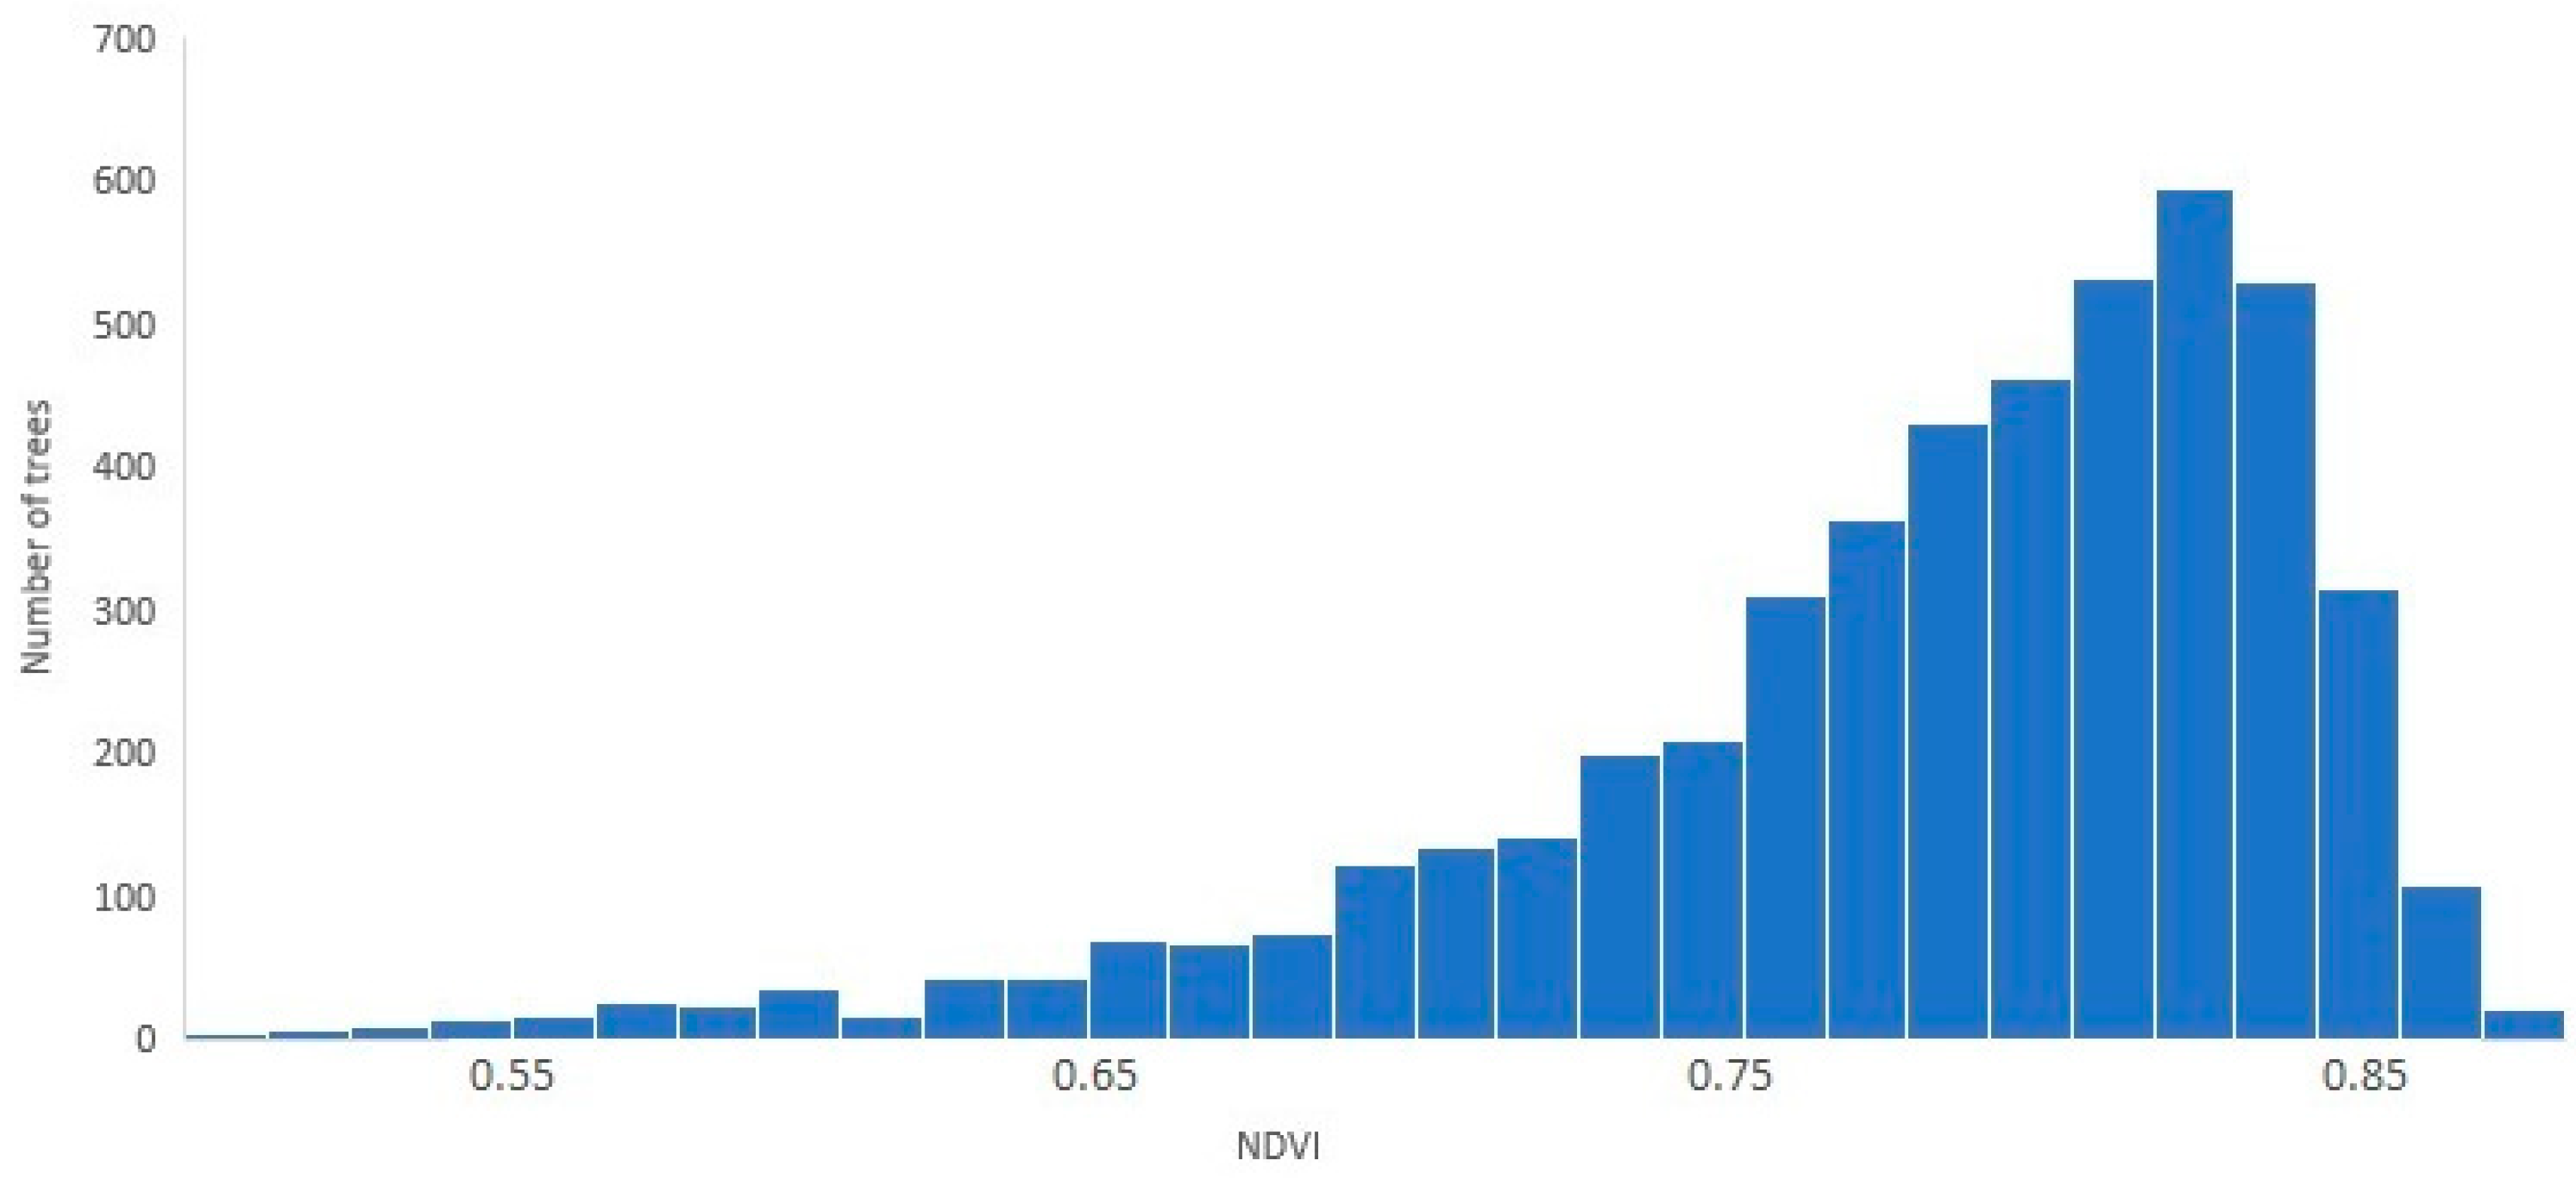
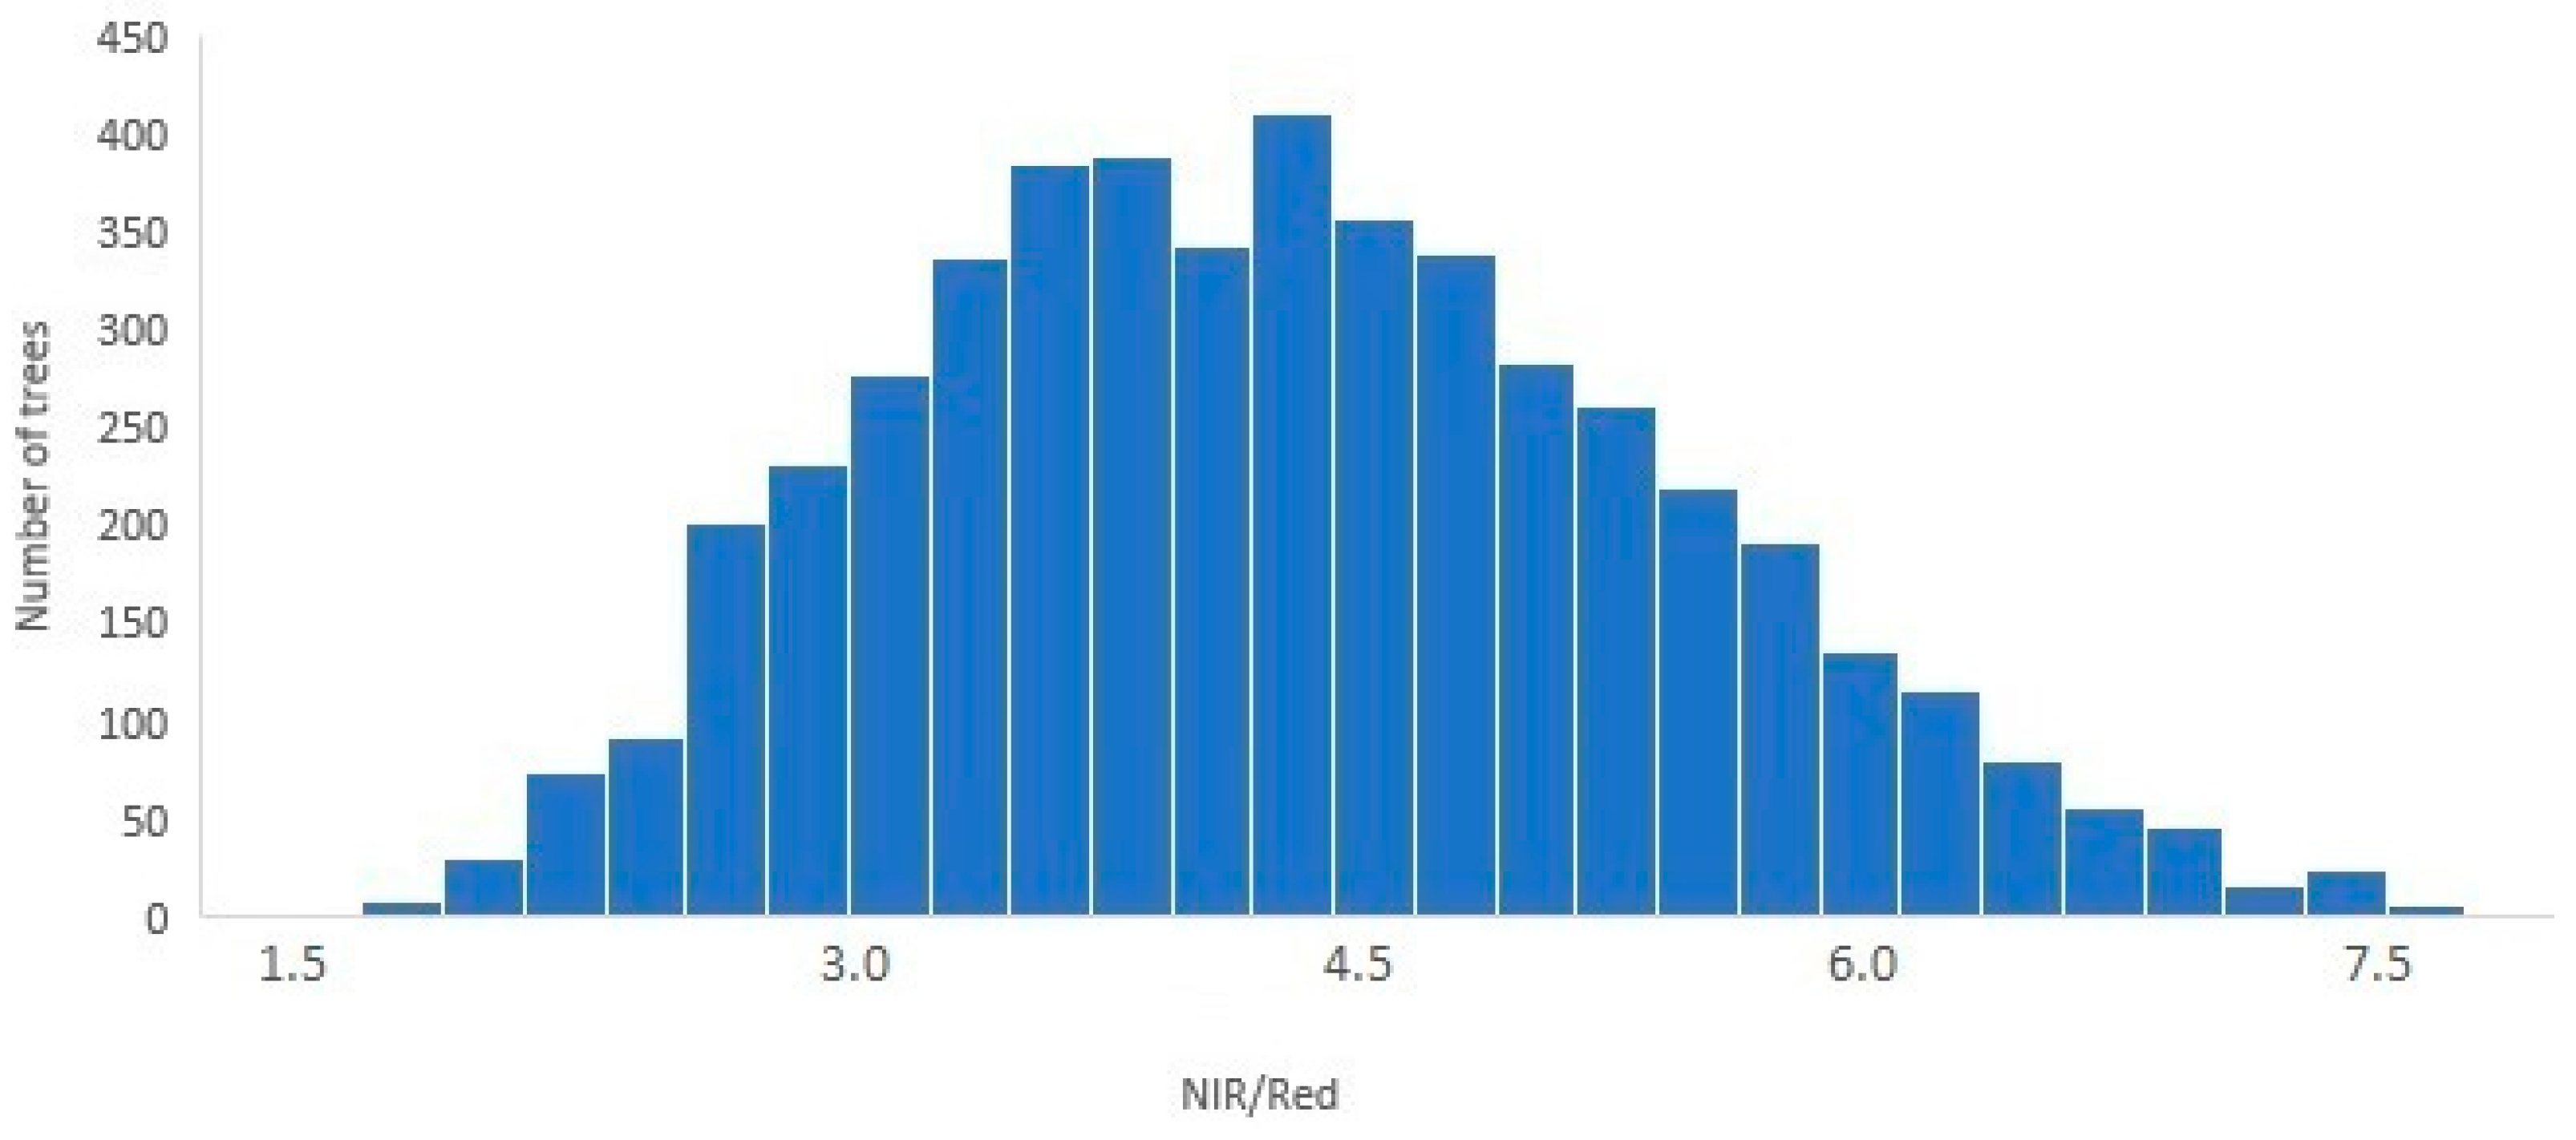
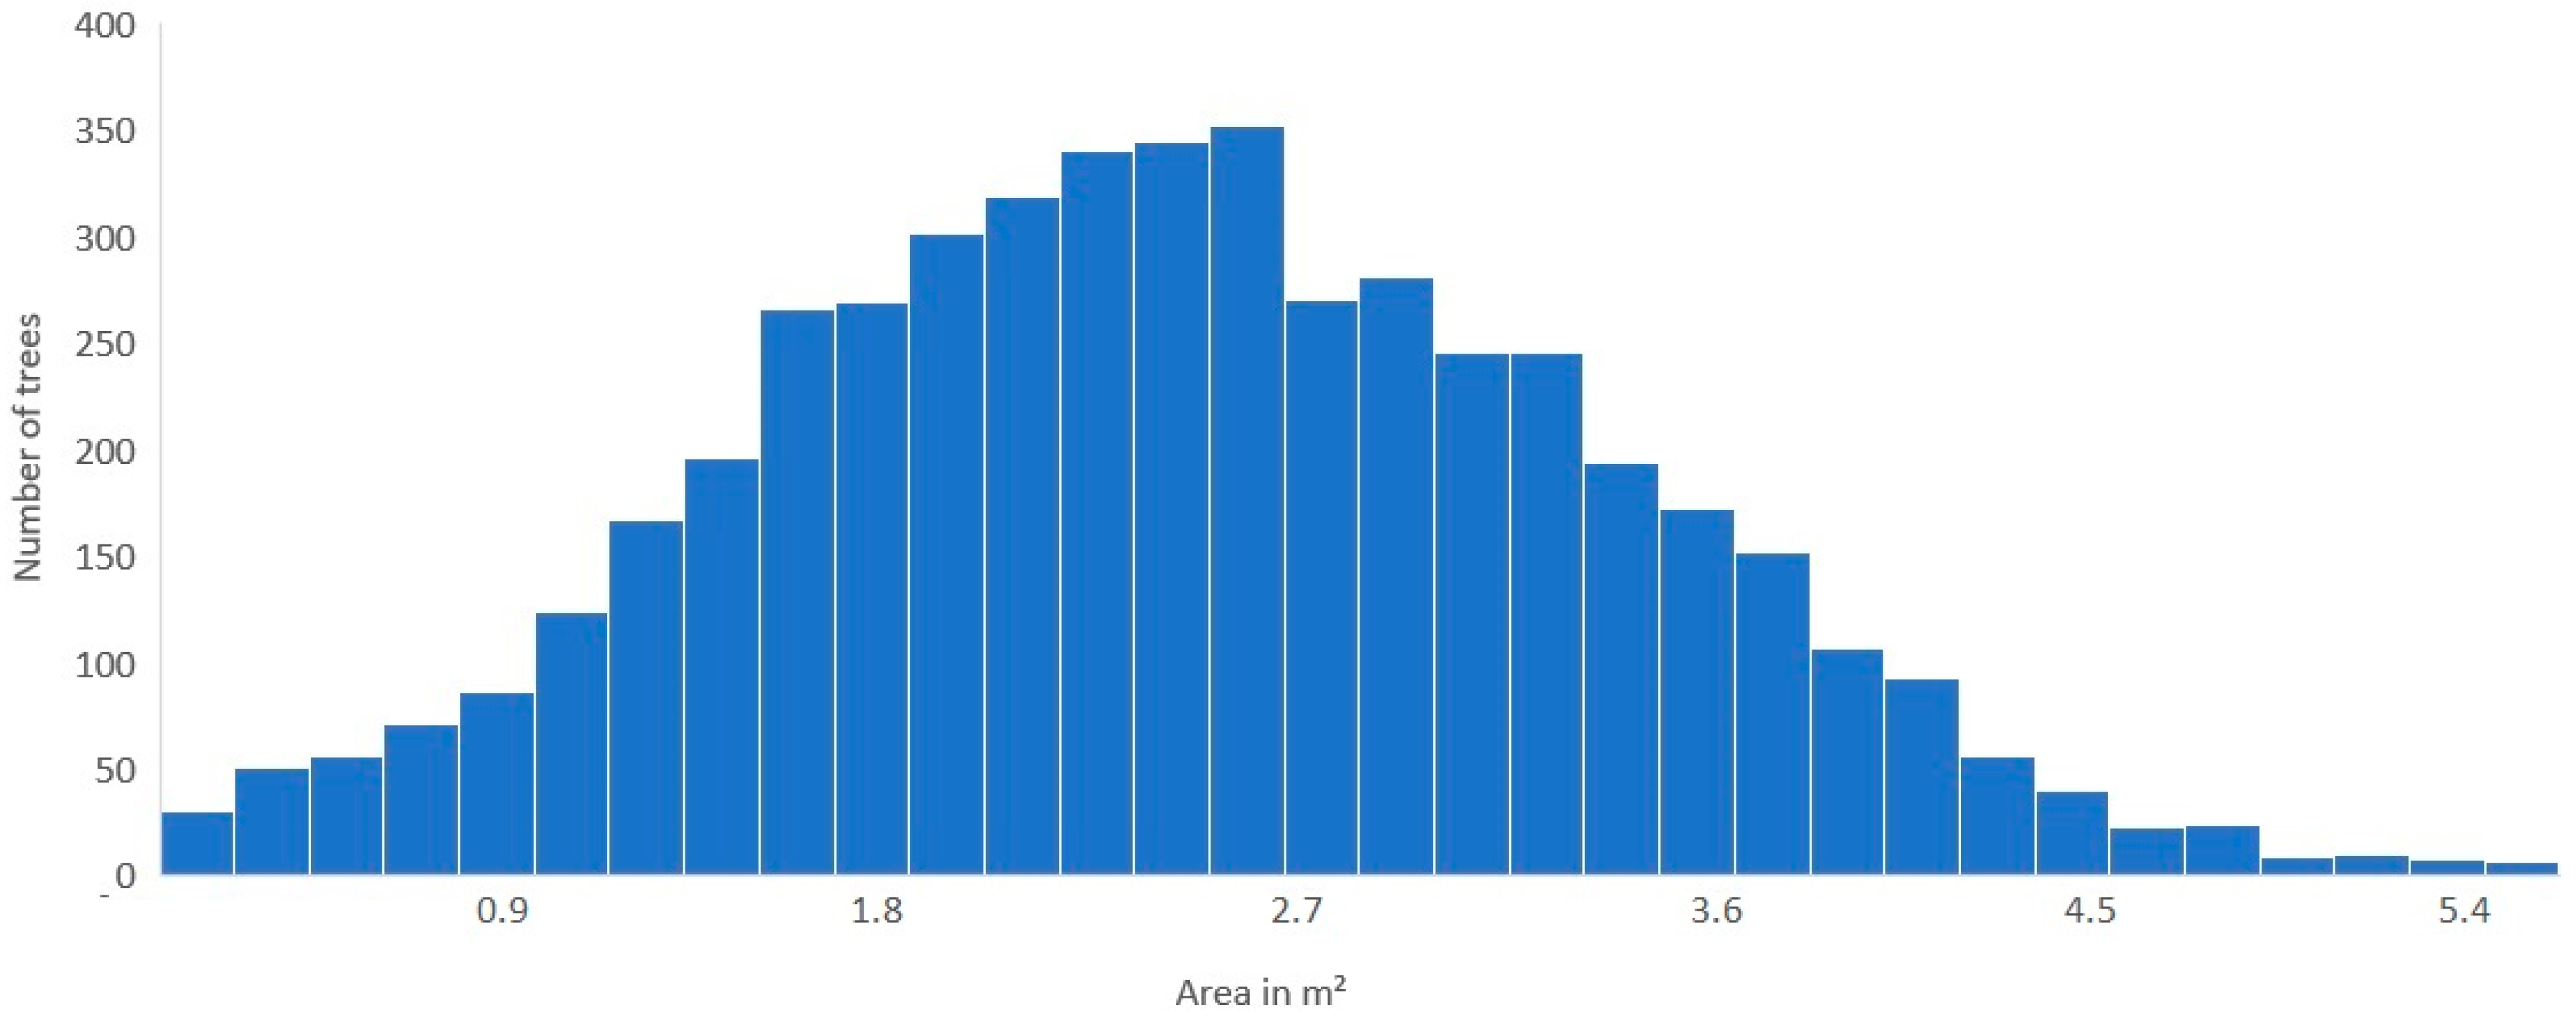
The automated algorithm also generated other multispectral maps to further analyze the study area and the citrus rootstocks. The colors on the maps below represent indices varying from blue (lower) to red (higher). The NDVI index is shown in Figure 15 (as an example). Figure 16 and Figure 17 show the respective distribution of NDVI and NIR/Red indices. The tree size distribution, using the NDVI-based image segmentation technique, is presented in Figure 18. These maps and analytics provide valuable information to efficiently and precisely evaluate citrus varieties, rootstocks, and management practices.
4.4. Plant Indices Comparison for Two Citrus Rootstocks
In this section, two different citrus rootstocks were compared as an example to demonstrate the capabilities of the developed UAV-based high throughput technique. For each rootstock (several tree blocks, Figure 10), individual tree canopy area, NDVI, and NIR/Red indices were calculated. The results are presented for each block of the analyzed rootstocks in Table 4. Each block consists of eight trees. All indices clearly show better phenotypic characteristics of rootstock X639 in comparison to rootstock SORP+SH-991. The average canopy area of rootstock X639 was 125% larger (1.54 m2 for SORP+SH-991 and 3.47 m2 for X639), has 14% higher NDVI (0.72 for SORP+SH-991 and 0.82 for X639) and 47% higher NIR/Red index (3.38 for SORP+SH-991 and 4.97 for X639). It is out of the scope of this study to analyze the rootstock phenotypic characteristics and their correlation to genotypes. This UAV-based high throughput technique can be used to compare and evaluate crop varieties (including rootstocks) providing a valuable tool to the specialty crop industry.
5. Discussion
The proposed remote sensing technique was able to detect and count trees with impressive accuracy. The overall detection accuracy was improved significantly (from 98.4% to 99.8%) by combining a CNN image classification with a refinement algorithm based on trees position in rows (using the field’s geometry). Previous studies used different techniques to detect and classify individual trees. Mohan et al. [35] used a local-maxima based algorithm on UAV data to detect trees in an open canopy mixed conifer forest and achieved an F-score of 86%. Nevalainen et al. [36] analyzed the possibility to detect individual trees in boreal forests using UAV-based hyperspectral imaging and reported a 93% accuracy on 4151 reference trees. Csillik et al. [26] reported an overall accuracy of 96% on detecting citrus trees using a simple convolutional neural network and a refinement algorithm based on super-pixels. Using UAV-based LiDAR (Light Detection and Ranging) data, Wallace et al. [37] reported an accuracy of 98% on detecting Eucalyptus globulus trees.
Comparing the obtained results (99.8%) with previous studied technique highlights the viability and impressive performance of utilizing a region-based CNN detection algorithm (YOLOv3, in this case), along with refinement algorithms on UAV high-resolution multispectral imagery. In this study, the refinement algorithm was based on structural patterns of trees (e.g., planted in rows) and would not perform well on natural environments, as there are no uniform patterns. Other refinement methods and sensing systems could be utilized (e.g., based on LiDAR data) to possibly achieve better accuracies on false positive tree detection. The proposed technique is based on the low-cost multispectral sensing system, comparing to the high-cost hyperspectral and LIDAR technologies utilized in previous studies. It has to be noted that the performance of the proposed region-based CNN algorithm depends on tree canopies having a minimum distance between them, as closely packed trees (e.g., in vineyards) will show a much less consistent individual tree pattern and, thus, the detection might not perform well.
Furthermore, this UAV-based technique was able to detect and geolocate tree gaps with high accuracy (precision of 100% and recall of 94.6%). This information is very critical to field managers (and nurseries) to make timely decision on replanting new trees (e.g., number of new trees needed and their location in the field). The proposed technique has a great potential to provide individual tree analysis (for other plants too) over large areas and to compare phenotypic characteristics on different sets of plants. To the best of the authors’ knowledge, the proposed high-throughput techniques is the first to provide a direct tool to evaluate individual trees and their phenotypic characteristics (e.g., estimate tree canopy size, develop tree health, and stress indices, etc.).
CNN plant detection on aerial images depends on the plant size and shape, flight height, camera resolution, and the availability of sufficient training data. The analyzed citrus trees proved to be very suitable for CNN detection with the utilized image resolution and the training data set. Further studies will be conducted on different trees (e.g., apple, peach, vineyards) by adjusting the multispectral resolution and the amount of training data to achieve similar detection results. Based on the results of this study, we conclude (and demonstrate) that the proposed UAV-based technique provides a consistent, more direct, cost-effective and rapid method to evaluate phenotypic characteristics of different citrus varieties and rootstocks.
6. Conclusions
Precise and efficient crop management depends on methods to delineate and evaluate individual trees in orchards. A UAV-based high throughput phenotyping technique was developed and evaluated to automate individual citrus tree monitoring and assessment using high-resolution multispectral imaging. This technique comprised a machine vision algorithm (AI-based) that uses deep learning to effectively detect individual citrus trees on aerial maps. Machine learning methods for classification and segmentation in remote sensing is an important research topic due to their ability to correctly solve common remote sensing problems given sufficient training. An image segmentation method was also developed based on tree canopy NDVI values to delineate canopy area in different shapes. The method performed well on a relatively large (14 acres) and complex (different tree sizes) study area, with an overall accuracy of 99.8% (99.9% precision and 99.7% recall). Tree gaps on the grove were also detected with an accuracy of 94.2% (100% precision and 89.1% recall). The proposed technique estimated individual tree canopy area with 85.5% accuracy, comparing to manual measurements done in 20 trees. However, we believe that the estimated tree canopy size values by the algorithm are more accurate and consistent comparing to the manual methods that calculate tree canopy size as a rectangle (measuring both tree sides). As UAV-based image acquisition for agricultural applications is increasing globally, such techniques can play a critical role on processing and analyzing the developed maps and present valuable information to field managers and researchers.
Author Contributions
Conceptualization, Y.A.; methodology, Y.A. and V.P.; software, V.P.; validation, Y.A. and V.P.; formal analysis, Y.A. and V.P.; investigation, Y.A. and V.P.; resources, Y.A.; data curation, Y.A. and V.P.; writing—original draft preparation, Y.A. and V.P.; writing—review and editing, Y.A.; visualization, V.P.; supervision, Y.A.; project administration, Y.A.
Funding
This research received no external funding.
Acknowledgments
The authors thank Ute Albrecht, Sri Charan Kakarla and Leon De Morais Nunes for their support and assistance in conducting this study.
Conflicts of Interest
The authors declare no conflict of interest.
References
- Cuenca, J.; Aleza, P.; Vicent, A.; Brunel, D.; Ollitrault, P.; Navarro, L. Genetically based location from triploid populations and gene ontology of a 3.3-Mb genome region linked to Alternaria brown spot resistance in citrus reveal clusters of resistance genes. PLoS ONE 2013, 8, e767553. [Google Scholar] [CrossRef] [PubMed]
- Rambla, J.; Gonzalez-Mas, M.C.; Pons, C.; Bernet, G.; Asins, M.J.; Granell, A. Fruit volatile profiles of two citrus hybrids are dramatically different from their parents. J. Agric. Food Chem. 2014, 62, 11312–11322. [Google Scholar] [CrossRef] [PubMed]
- Sahin-Çevik, M.; Moore, G.A. Quantitative trait loci analysis of morphological traits in citrus. Plant Biotechnol. 2012, Rep 6, 47–57. [Google Scholar] [CrossRef]
- Vardi, A.; Levin, I.; Carmi, N. Induction of seedlessness in citrus: From classical techniques to emerging biotechnological approaches. J Am. Soc. Hortic. Sci. 2008, 133, 117–126. [Google Scholar] [CrossRef]
- Zheng, Q.M.; Tang, Z.; Xu, Q.; Deng, X.X. Isolation, phylogenetic relationship and expression profiling of sugar transporter genes in sweet orange (Citrus sinensis) plant cell tissue and organ. Culture 2014, 119, 609–624. [Google Scholar]
- Albrecht, U.; Fiehn, O.; Bowman, K.D. Metabolic variations in different citrus rootstock cultivars associated with different responses to Huanglongbing. Plant Physiol. Biochem. 2016, 107, 33–44. [Google Scholar] [CrossRef] [PubMed]
- Aleza, P.; Juarez, J.; Hernandez, M.; Ollitrault, P.; Navarro, L. Implementation of extensive citrus triploid breeding programs based on 4x × 2x sexual hybridisations. Tree Genet. Genomes 2012, 8, 1293–1306. [Google Scholar] [CrossRef]
- Mahlein, A.K. Plant disease detection by imaging sensors—parallels and specific demands for precision agriculture and plant phenotyping. Plant Dis. 2016, 100, 241–251. [Google Scholar] [CrossRef] [PubMed]
- Shakoor, N.; Lee, S.; Mockler, T.C. High throughput phenotyping to accelerate crop breeding and monitoring of diseases in the field. Curr. Opin. Plant Biol. 2017, 38, 184–192. [Google Scholar] [CrossRef] [PubMed]
- Luvisi, A.; Ampatzidis, Y.; Bellis, L.D. Plant pathology and information technology: Opportunity and uncertainty in pest management. Sustainability 2016, 8, 831. [Google Scholar] [CrossRef]
- Cruz, A.C.; Luvisi, A.; De Bellis, L.; Ampatzidis, Y. X-FIDO: An Effective Application for Detecting Olive Quick Decline Syndrome with Novel Deep Learning Methods. Front. Plant Sci. 2017, 8, 1741. [Google Scholar] [CrossRef] [PubMed]
- Cruz, A.; Ampatzidis, Y.; Pierro, R.; Materazzi, A.; Panattoni, A.; De Bellis, L.; Luvisi, A. Detection of Grapevine Yellows Symptoms in Vitis vinifera L. with Artificial Intelligence. Comput. Electron. Agric. 2019, 157, 63–76. [Google Scholar] [CrossRef]
- Pajares, G. Overview and current status of remote sensing applications based on unmanned aerial vehicles (UAVs). Photogramm. Eng. Remote Sens. 2015, 81, 281–330. [Google Scholar] [CrossRef]
- Singh, A.; Ganapathysubramanian, B.; Singh, A.K.; Sarkar, S. Machine Learning for High-Throughput Stress Phenotyping in Plants. Trends Plant Sci. 2016, 21, 110–124. [Google Scholar] [CrossRef] [PubMed]
- Abdullahi, H.S.; Mahieddine, F.; Sheriff, R.E. Technology impact on agricultural productivity: A review of precision agriculture using unmanned aerial vehicles. In Proceedings of the International Conference on Wireless and Satellite Systems, Bradford, UK, 6–7 July 2015; pp. 388–400. [Google Scholar]
- Abdulridha, J.; Ampatzidis, Y.; Ehsani, R.; de Castro, A. Evaluating the Performance of Spectral Features and Multivariate Analysis Tools to Detect Laurel Wilt Disease and Nutritional Deficiency in Avocado. Comput. Electron. Agric. 2018, 155, 203–2011. [Google Scholar] [CrossRef]
- Abdulridha, J.; Ehsani, R.; Abd-Elrahman, A.; Ampatzidis, Y. A Remote Sensing technique for detecting laurel wilt disease in avocado in presence of other biotic and abiotic stresses. Comput. Electron. Agric. 2019, 156, 549–557. [Google Scholar] [CrossRef]
- Nebiker, S.; Annen, A.; Scherrer, M.; Oesch, D. A light-weight multispectral sensor for micro UAV—Opportunities for very high resolution airborne remote sensing. In International Archives of the Photogrammetry. Remote Sens. Spat. Inf. Sci. 2008, 37, B1. [Google Scholar]
- Hunt, E.R., Jr.; Hively, W.D.; Fujikawa, S.J.; Linden, D.S.; Daughtry, C.S.T.; McCarty, G.W. Acquisition of nir-green-blue digital photographs from Unmanned Aircraft for crop monitoring. Remote Sens. 2010, 2, 290–305. [Google Scholar] [CrossRef]
- Xiang, H.; Tian, L. Development of a low-cost agricultural remote sensing system based on an autonomous unmanned aerial vehicle (UAV). Biosyst. Eng. 2011, 108, 174–190. [Google Scholar] [CrossRef]
- Matese, A.; Capraro, F.; Primicerio, J.; Gualato, G.; Di Gennaro, S.F.; Agati, G. Mapping of vine vigor by UAV and anthocyanin content by a non-destructive fluorescence technique. Precis. Agric. 2013, 13, 201–208. [Google Scholar]
- Malek, S.; Bazi, Y.; Alajlan, N.; AlHichri, H.; Melgani, F. Efficient Framework for Palm Tree Detection in UAV Images. IEEE J-STARS 2014, 7, 4692–4703. [Google Scholar] [CrossRef]
- Garcia-Ruiz, F.; Sankaran, S.; Maja, J.M.; Lee, W.S.; Rasmussen, J.; Ehsani, R. Comparison of two aerial imaging platforms for identification of Huanglongbing-infected citrus trees. Comput. Electron. Agric. 2013, 91, 106–115. [Google Scholar] [CrossRef]
- Sankaran, S.; Maja, J.M.; Buchanon, S.; Ehsani, R. Huanglongbing (citrus greening) detection using visible, near infrared and thermal imaging techniques. Sensors 2013, 13, 2117–2130. [Google Scholar] [CrossRef] [PubMed]
- Romero-Trigueros, C.; Nortes, P.A.; Alarcón, J.J.; Hunink, J.E.; Parra, M.; Contreras, S.; Nicolás, E. Effects of saline reclaimed waters and deficit irrigation on Citrus physiology assessed by UAV remote sensing. Agric. Water Manag. 2017, 183, 60–69. [Google Scholar] [CrossRef]
- Csillik, O.; Cherbini, J.; Johnson, R.; Lyons, A.; Kelly, M. Identification of Citrus Trees from Unmanned Aerial Vehicle Imagery Using Convolutional Neural Networks. Drones 2018, 2, 39. [Google Scholar] [CrossRef]
- Kussul, N.; Lavreniuk, M.; Skakun, S.; Shelestov, A. Deep Learning Classification of Land Cover and Crop Types Using Remote Sensing Data. IEEE Geosci. Remote Sens. Lett. 2017, 14, 778–782. [Google Scholar] [CrossRef]
- Ampatzidis, Y.; Bellis, L.D.; Luvisi, A. iPathology: Robotic applications and management of plants and plant diseases. Sustainability 2017, 9, 1010. [Google Scholar] [CrossRef]
- Partel, V.; Kakarla, S.C.; Ampatzidis, Y. Development and Evaluation of a Low-Cost and Smart Technology for Precision Weed Management Utilizing Artificial Intelligence. Comput. Electron. Agric. 2019, 157, 339–350. [Google Scholar] [CrossRef]
- LeCun, Y.; Bengio, Y.; Hinton, G. Deep learning. Nature 2015, 521, 436. [Google Scholar] [CrossRef]
- Krizhevsky, A.; Sutskever, I.; Hinton, G.E. Imagenet classification with deep convolutional neural networks. In Advances in Neural Information Processing Systems; MIT Press: Cambridge, MA, USA, 2012; pp. 1097–1105. [Google Scholar]
- Simonyan, K.; Zisserman, A. Very deep convolutional networks for large-scale image recognition. arXiv, 2015; arXiv:1409.1556. [Google Scholar]
- Ghatrehsamani, S.; Wade, T.; Ampatzidis, Y. The adoption of precision agriculture technologies by Florida growers: A comparison of 2005 and 2018 survey data. In Proceedings of the XXX International Horticultural Congress, II International Symposium on Mechanization, Precision Horticulture, and Robotics, Istanbul, Turkey, 12–16 August 2018. [Google Scholar]
- Redmon, J.; Farhadi, A. Yolov3: An incremental improvement. arXiv, 2018; arXiv:1804.02767. [Google Scholar]
- Mohan, M.; Silva, C.A.; Klauberg, C.; Jat, P.; Catts, G.; Cardil, A.; Hudak, A.T.; Dia, M. Individual tree detection from unmanned aerial vehicle (UAV) derived canopy height model in an open canopy mixed conifer forest. Forests 2017, 8, 340. [Google Scholar] [CrossRef]
- Nevalainen, O.; Honkavaara, E.; Tuominen, S.; Viljanen, N.; Hakala, T.; Yu, X.; Hyyppä, J.; Saari, H.; Pölönen, I.; Imai, N.N.; et al. Individual tree detection and classification with UAV-based photogrammetric point clouds and hyperspectral imaging. Remote Sens. 2017, 9, 185. [Google Scholar] [CrossRef]
- Wallace, L.; Lucieer, A.; Watson, C.S. Evaluating tree detection and segmentation routines on very high resolution UAV LiDAR data. IEEE Trans. Geosci. Remote Sens. 2014, 52, 7619–7628. [Google Scholar] [CrossRef]
Figure 1.
Study area in red rectangle (14 acres).

Figure 2.
Workflow of the individual tree detection process. Yellow steps were evaluated using ground-truth measurements.
Figure 2.
Workflow of the individual tree detection process. Yellow steps were evaluated using ground-truth measurements.

Figure 3.
Example of UAV generated citrus map: (a) RGB map; (b) RNB map.

Figure 4.
Example of an image used on the training set to detect citrus trees (colors represent different training sets).
Figure 4.
Example of an image used on the training set to detect citrus trees (colors represent different training sets).

Figure 5.
Workflow of array operations to analyze tree’s detections.

Figure 6.
Example of predicted (detected) tree gap region on an RNB map.

Figure 7.
Normalized Difference Vegetation Index (NDVI) map and trees detections (as a rectangle).

Figure 8.
Representation of image segmentation for canopy and soil area.

Figure 9.
Canopy area estimation using NDVI-based image segmentation method.

Figure 10.
Two varieties of citrus rootstocks to be analyzed. Blue regions include rootstock SORP+SH-991 and red regions rootstock X639.
Figure 10.
Two varieties of citrus rootstocks to be analyzed. Blue regions include rootstock SORP+SH-991 and red regions rootstock X639.

Figure 11.
Tree and gap detection map with canopy size categories and other field analytics.

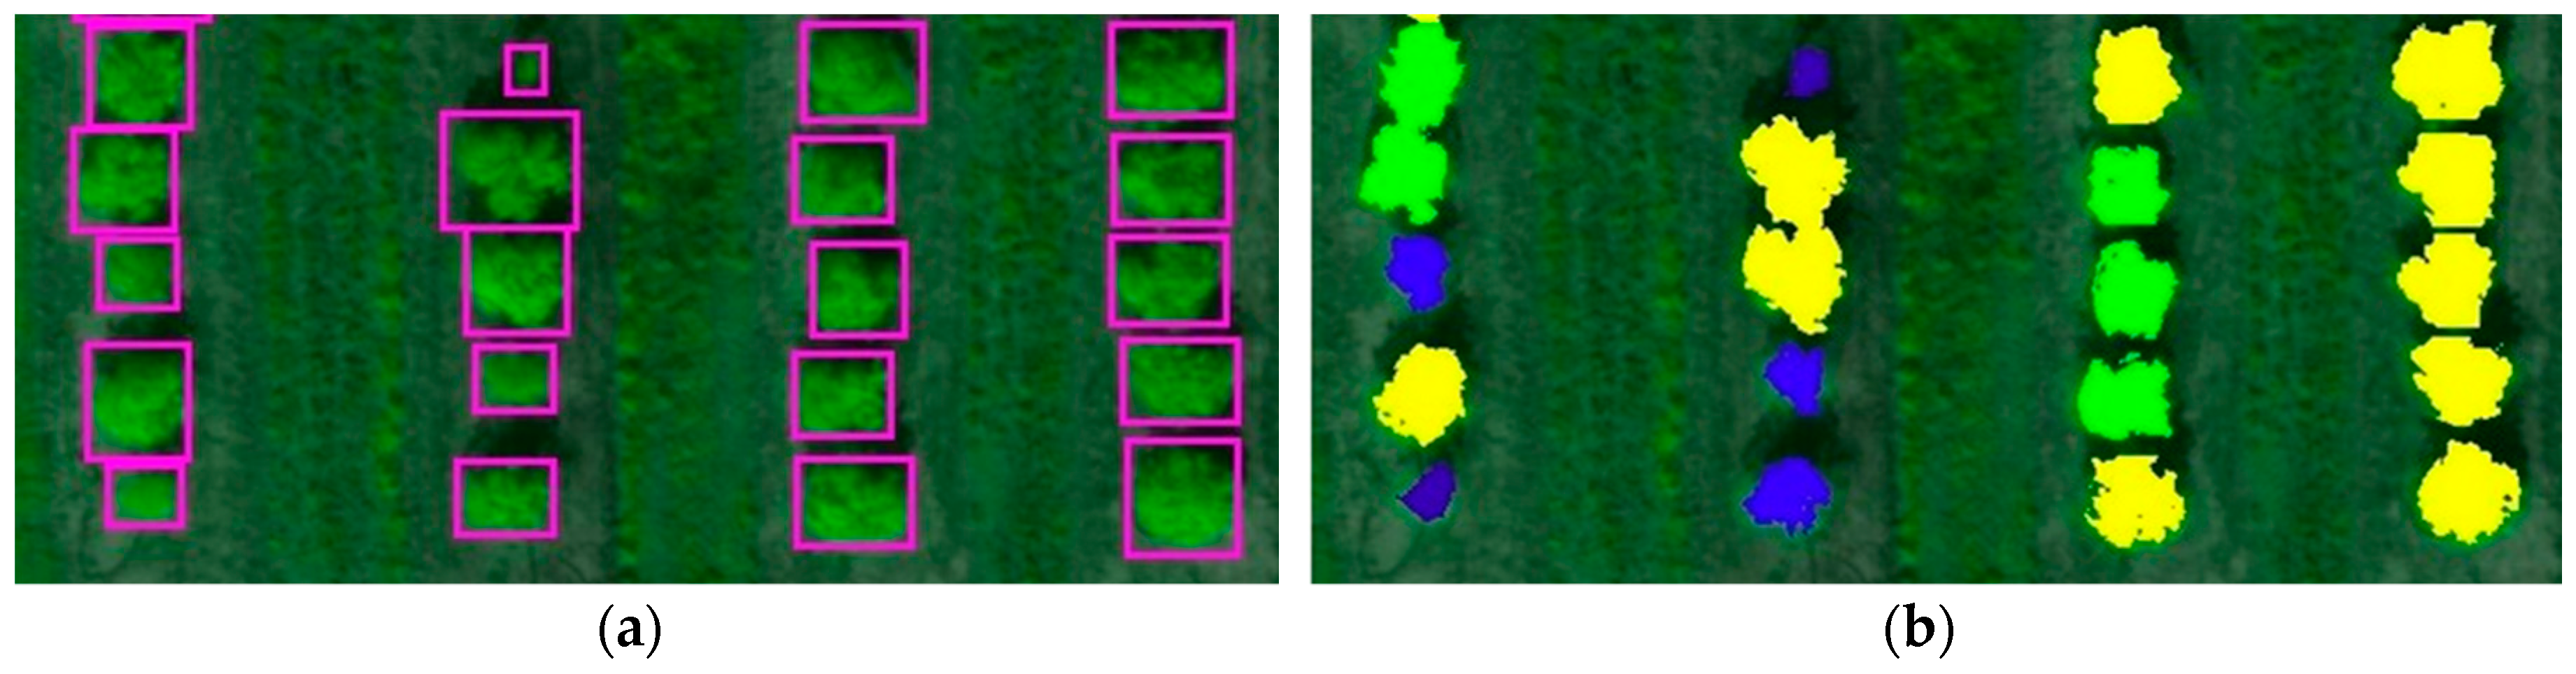
Figure 12.
False positive tree being correctly identified as non-tree in refinement process: (a) False positive tree detected by the first CNN process; (b) the refinement process accurately identifies the false positive tree. Colors represent different size categories.
Figure 12.
False positive tree being correctly identified as non-tree in refinement process: (a) False positive tree detected by the first CNN process; (b) the refinement process accurately identifies the false positive tree. Colors represent different size categories.

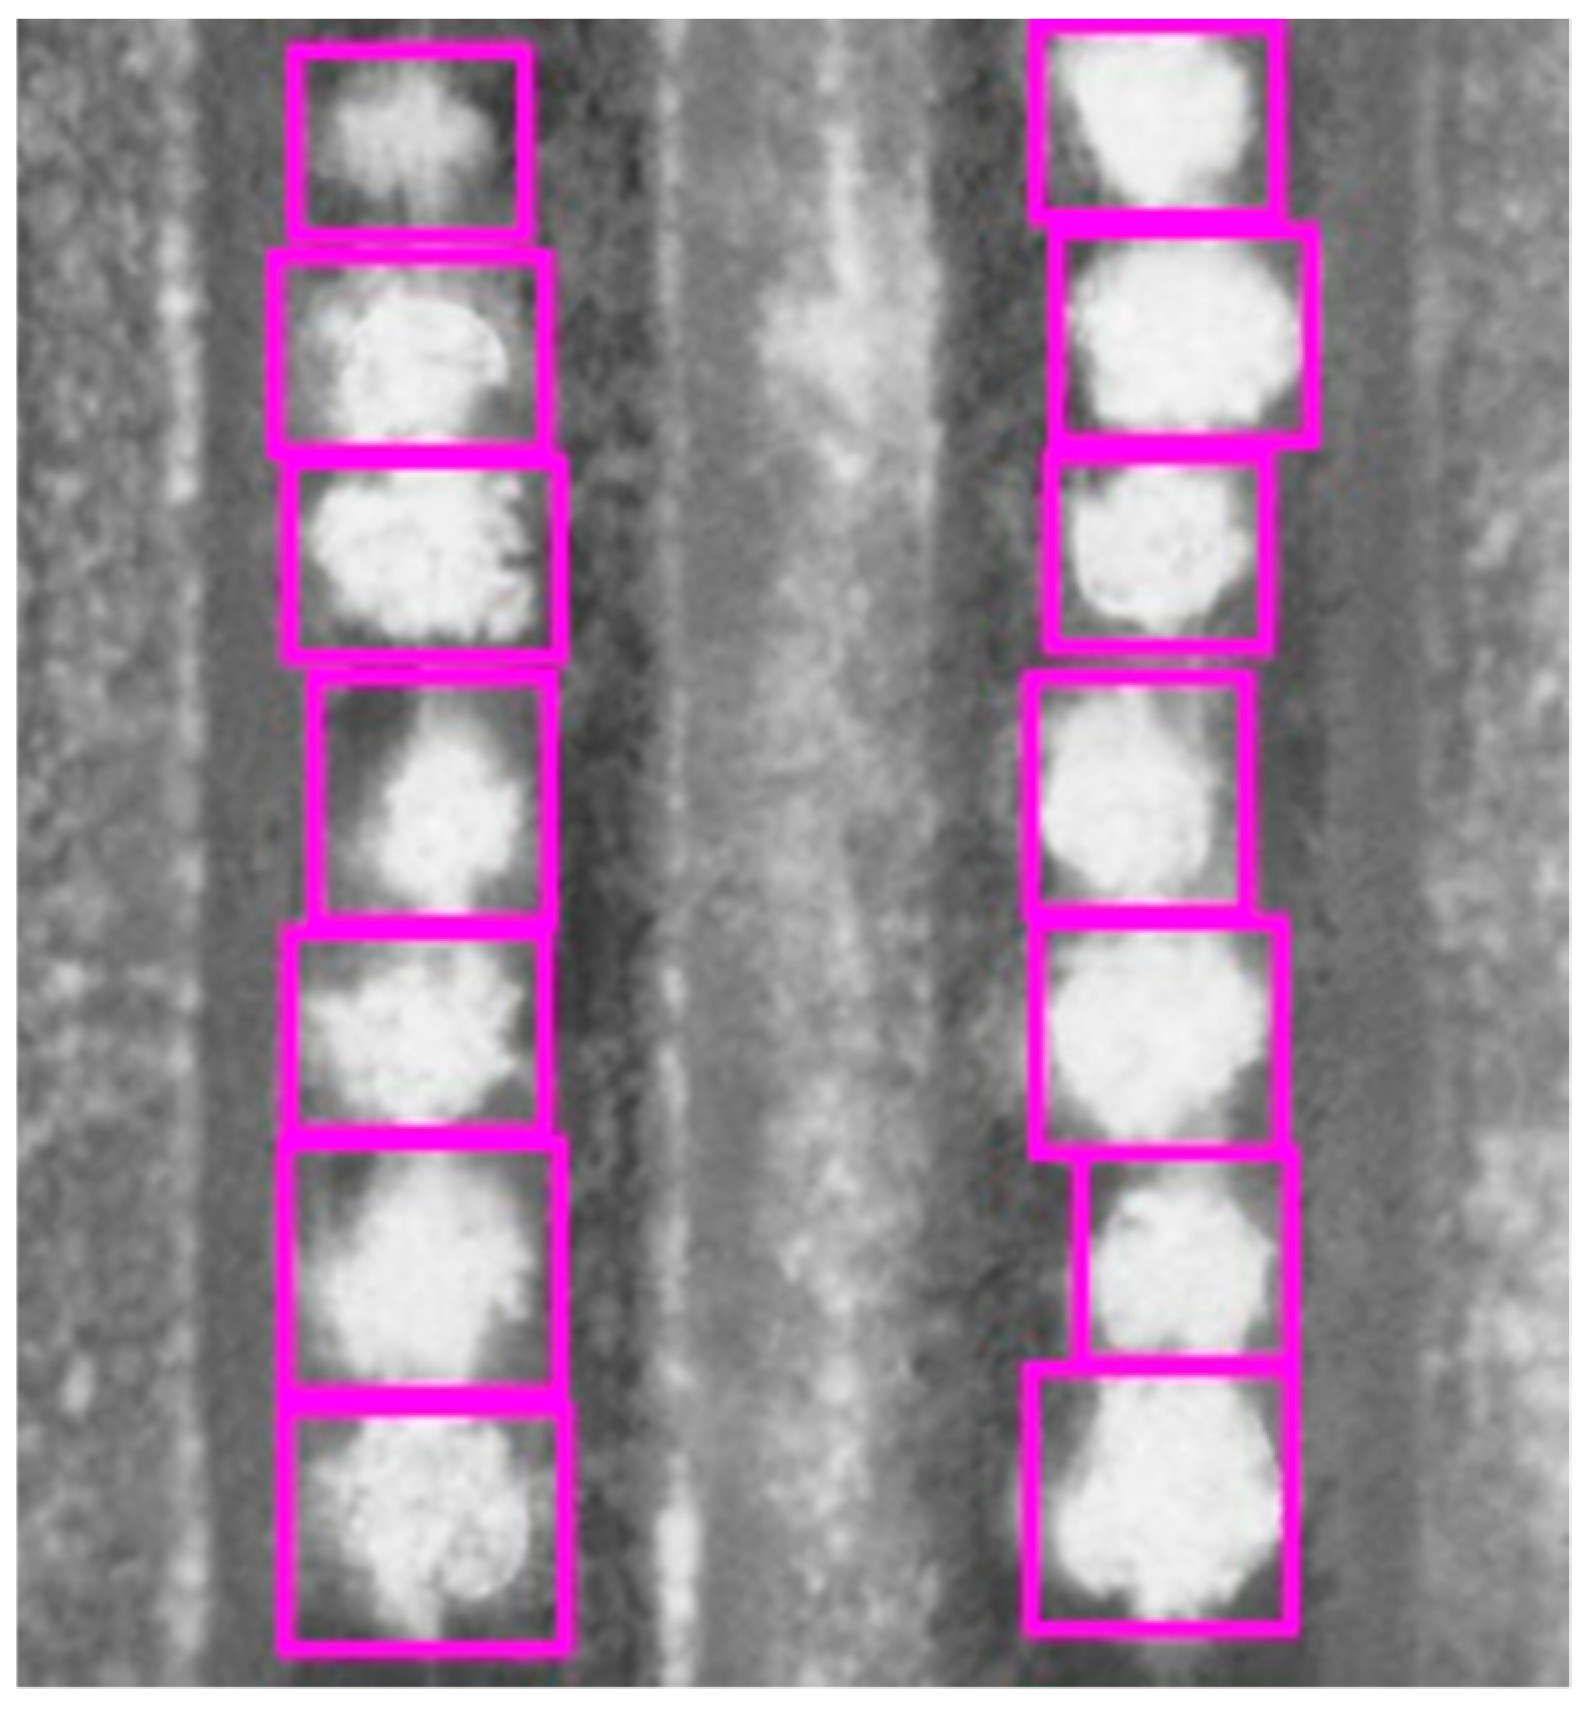
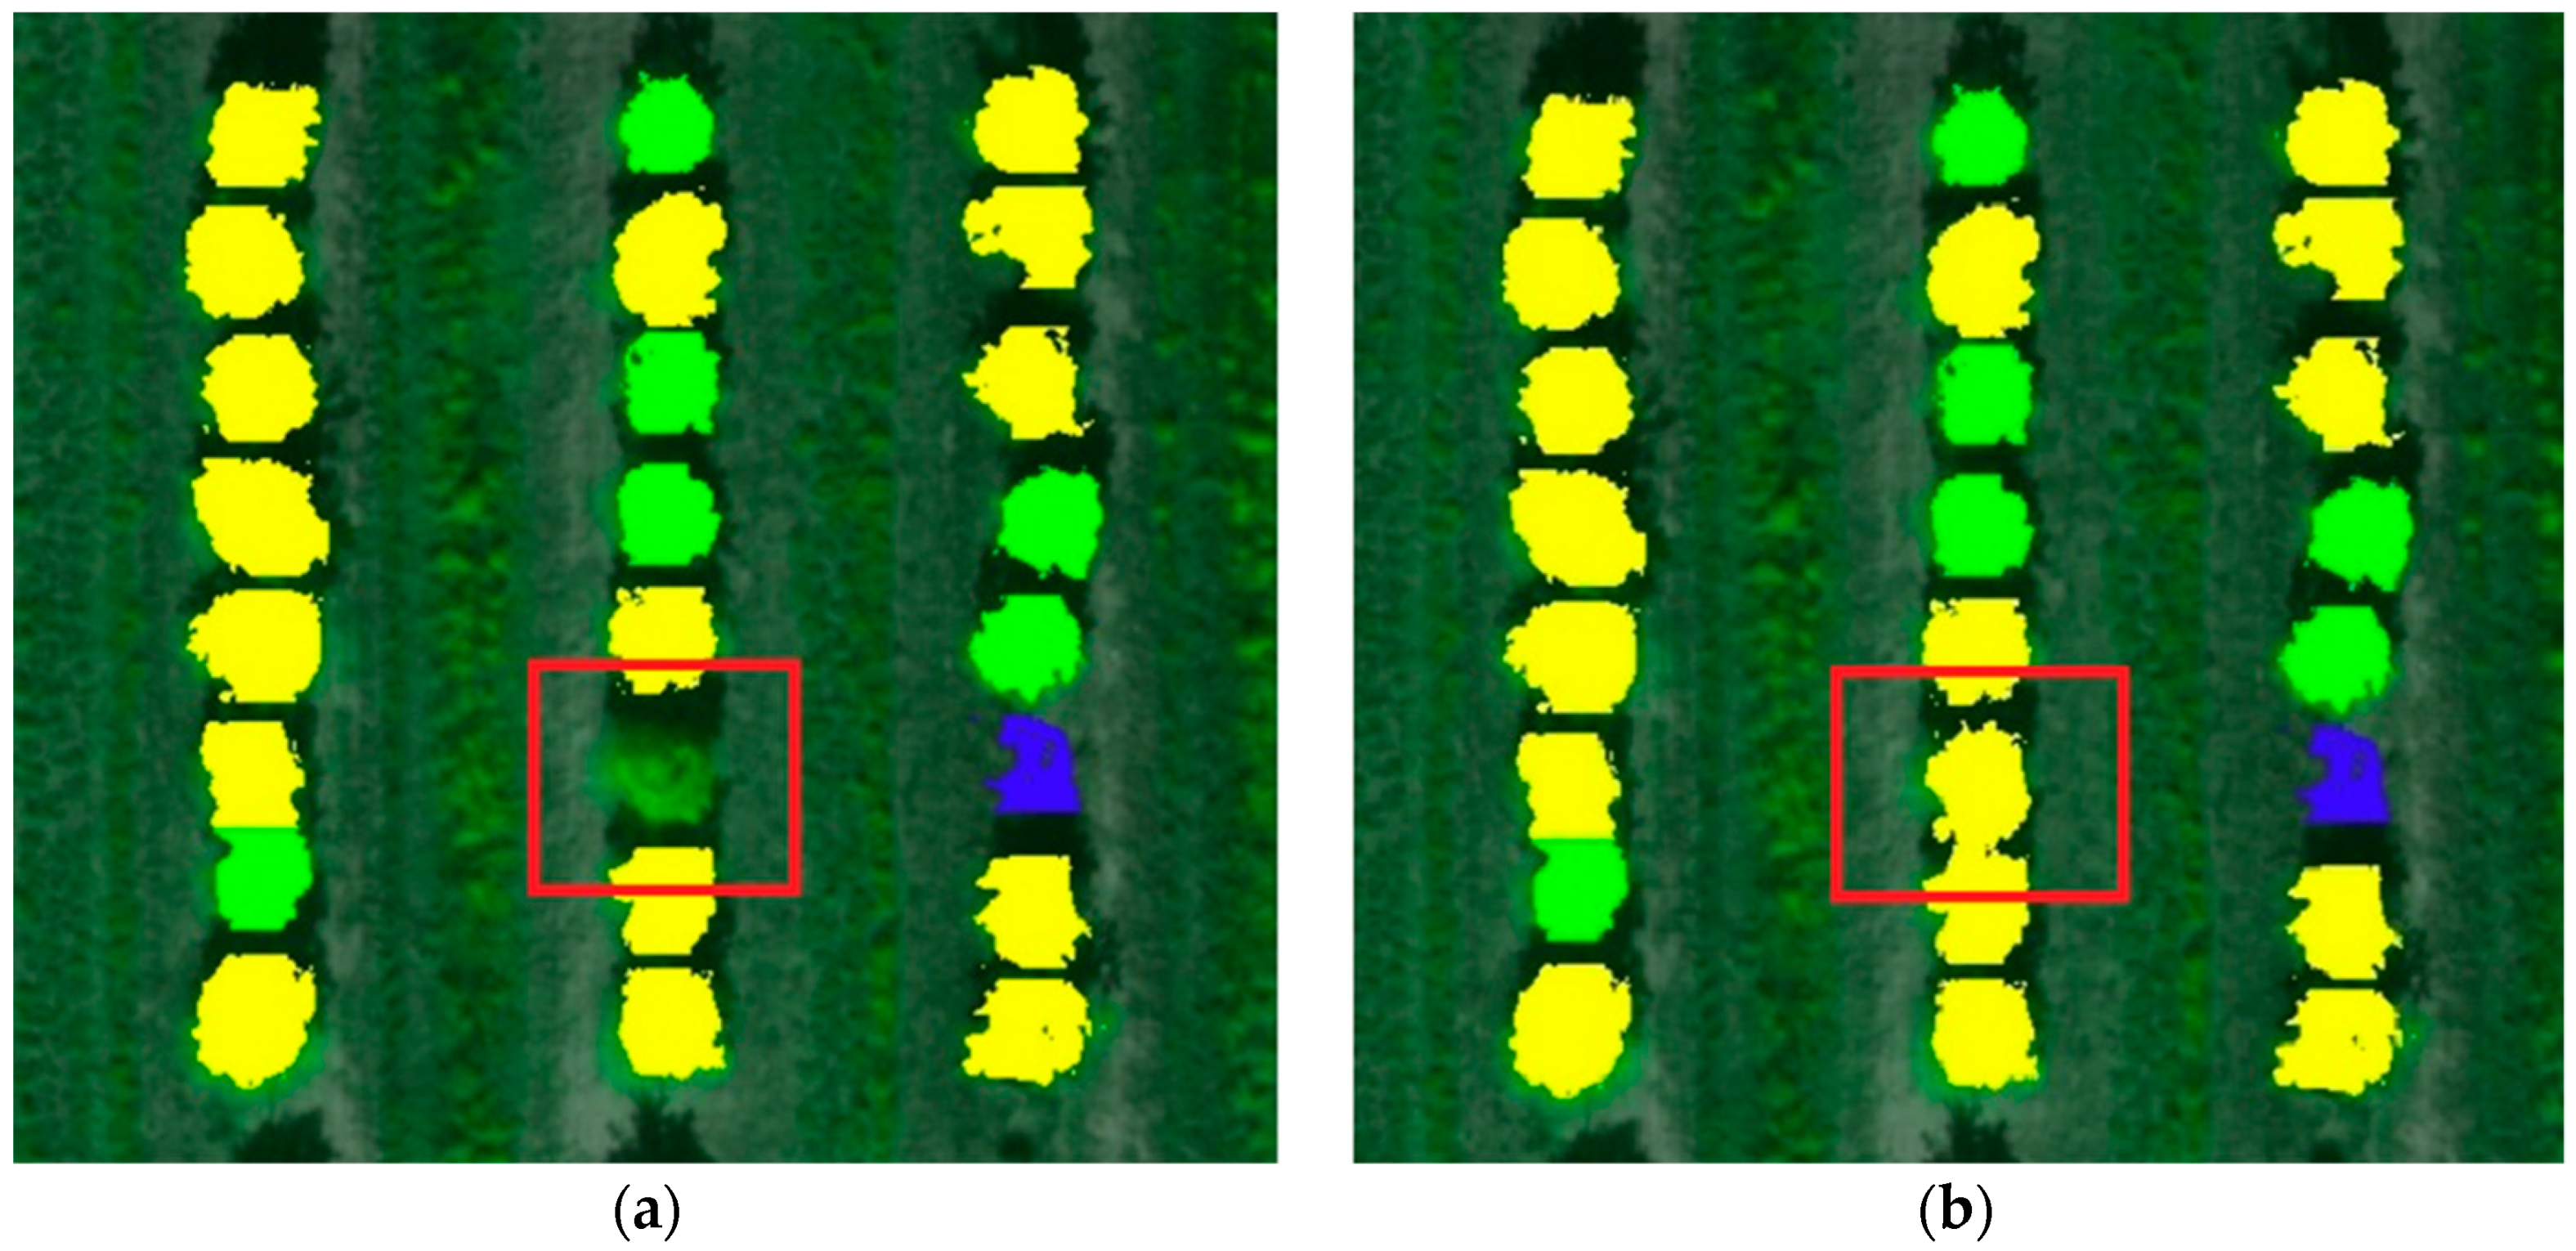
Figure 13.
False negative tree being correctly identified in refinement process: (a) Before the refinement process (first CNN detection); (b) after refinement process. Colors represent different size categories.
Figure 13.
False negative tree being correctly identified in refinement process: (a) Before the refinement process (first CNN detection); (b) after refinement process. Colors represent different size categories.

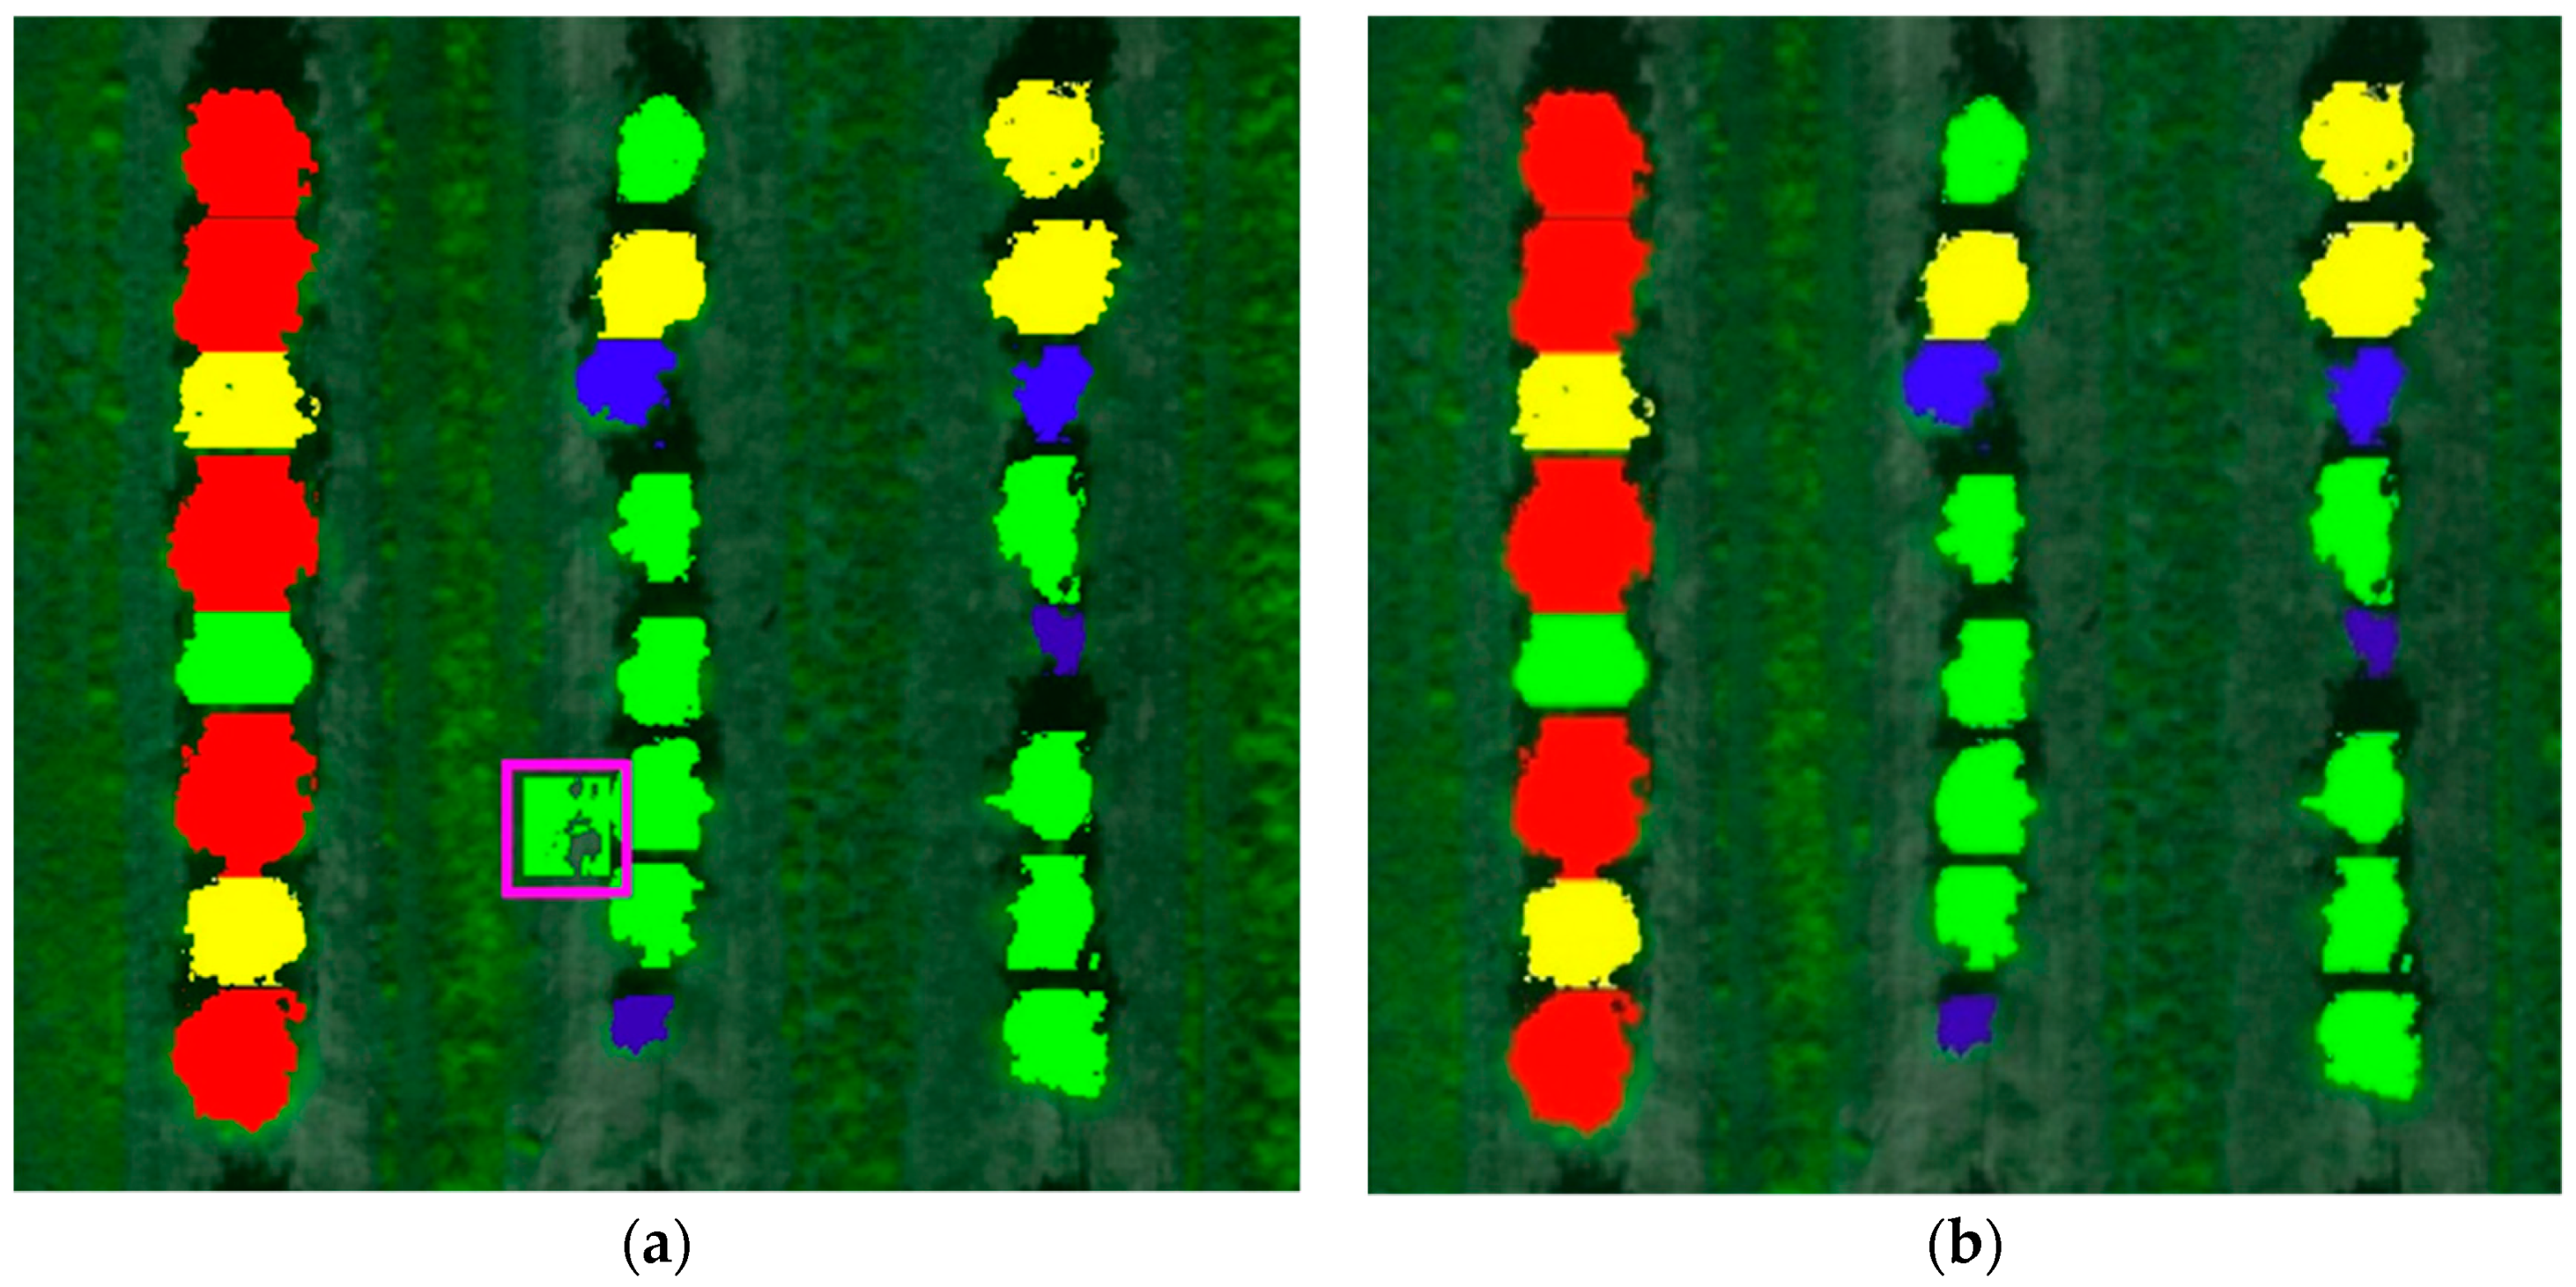
Figure 14.
Tree canopy area calculation using: (a) Rectangle shape technique, and (b) NDVI-based image segmentation shape technique (colors represent different size categories).
Figure 14.
Tree canopy area calculation using: (a) Rectangle shape technique, and (b) NDVI-based image segmentation shape technique (colors represent different size categories).

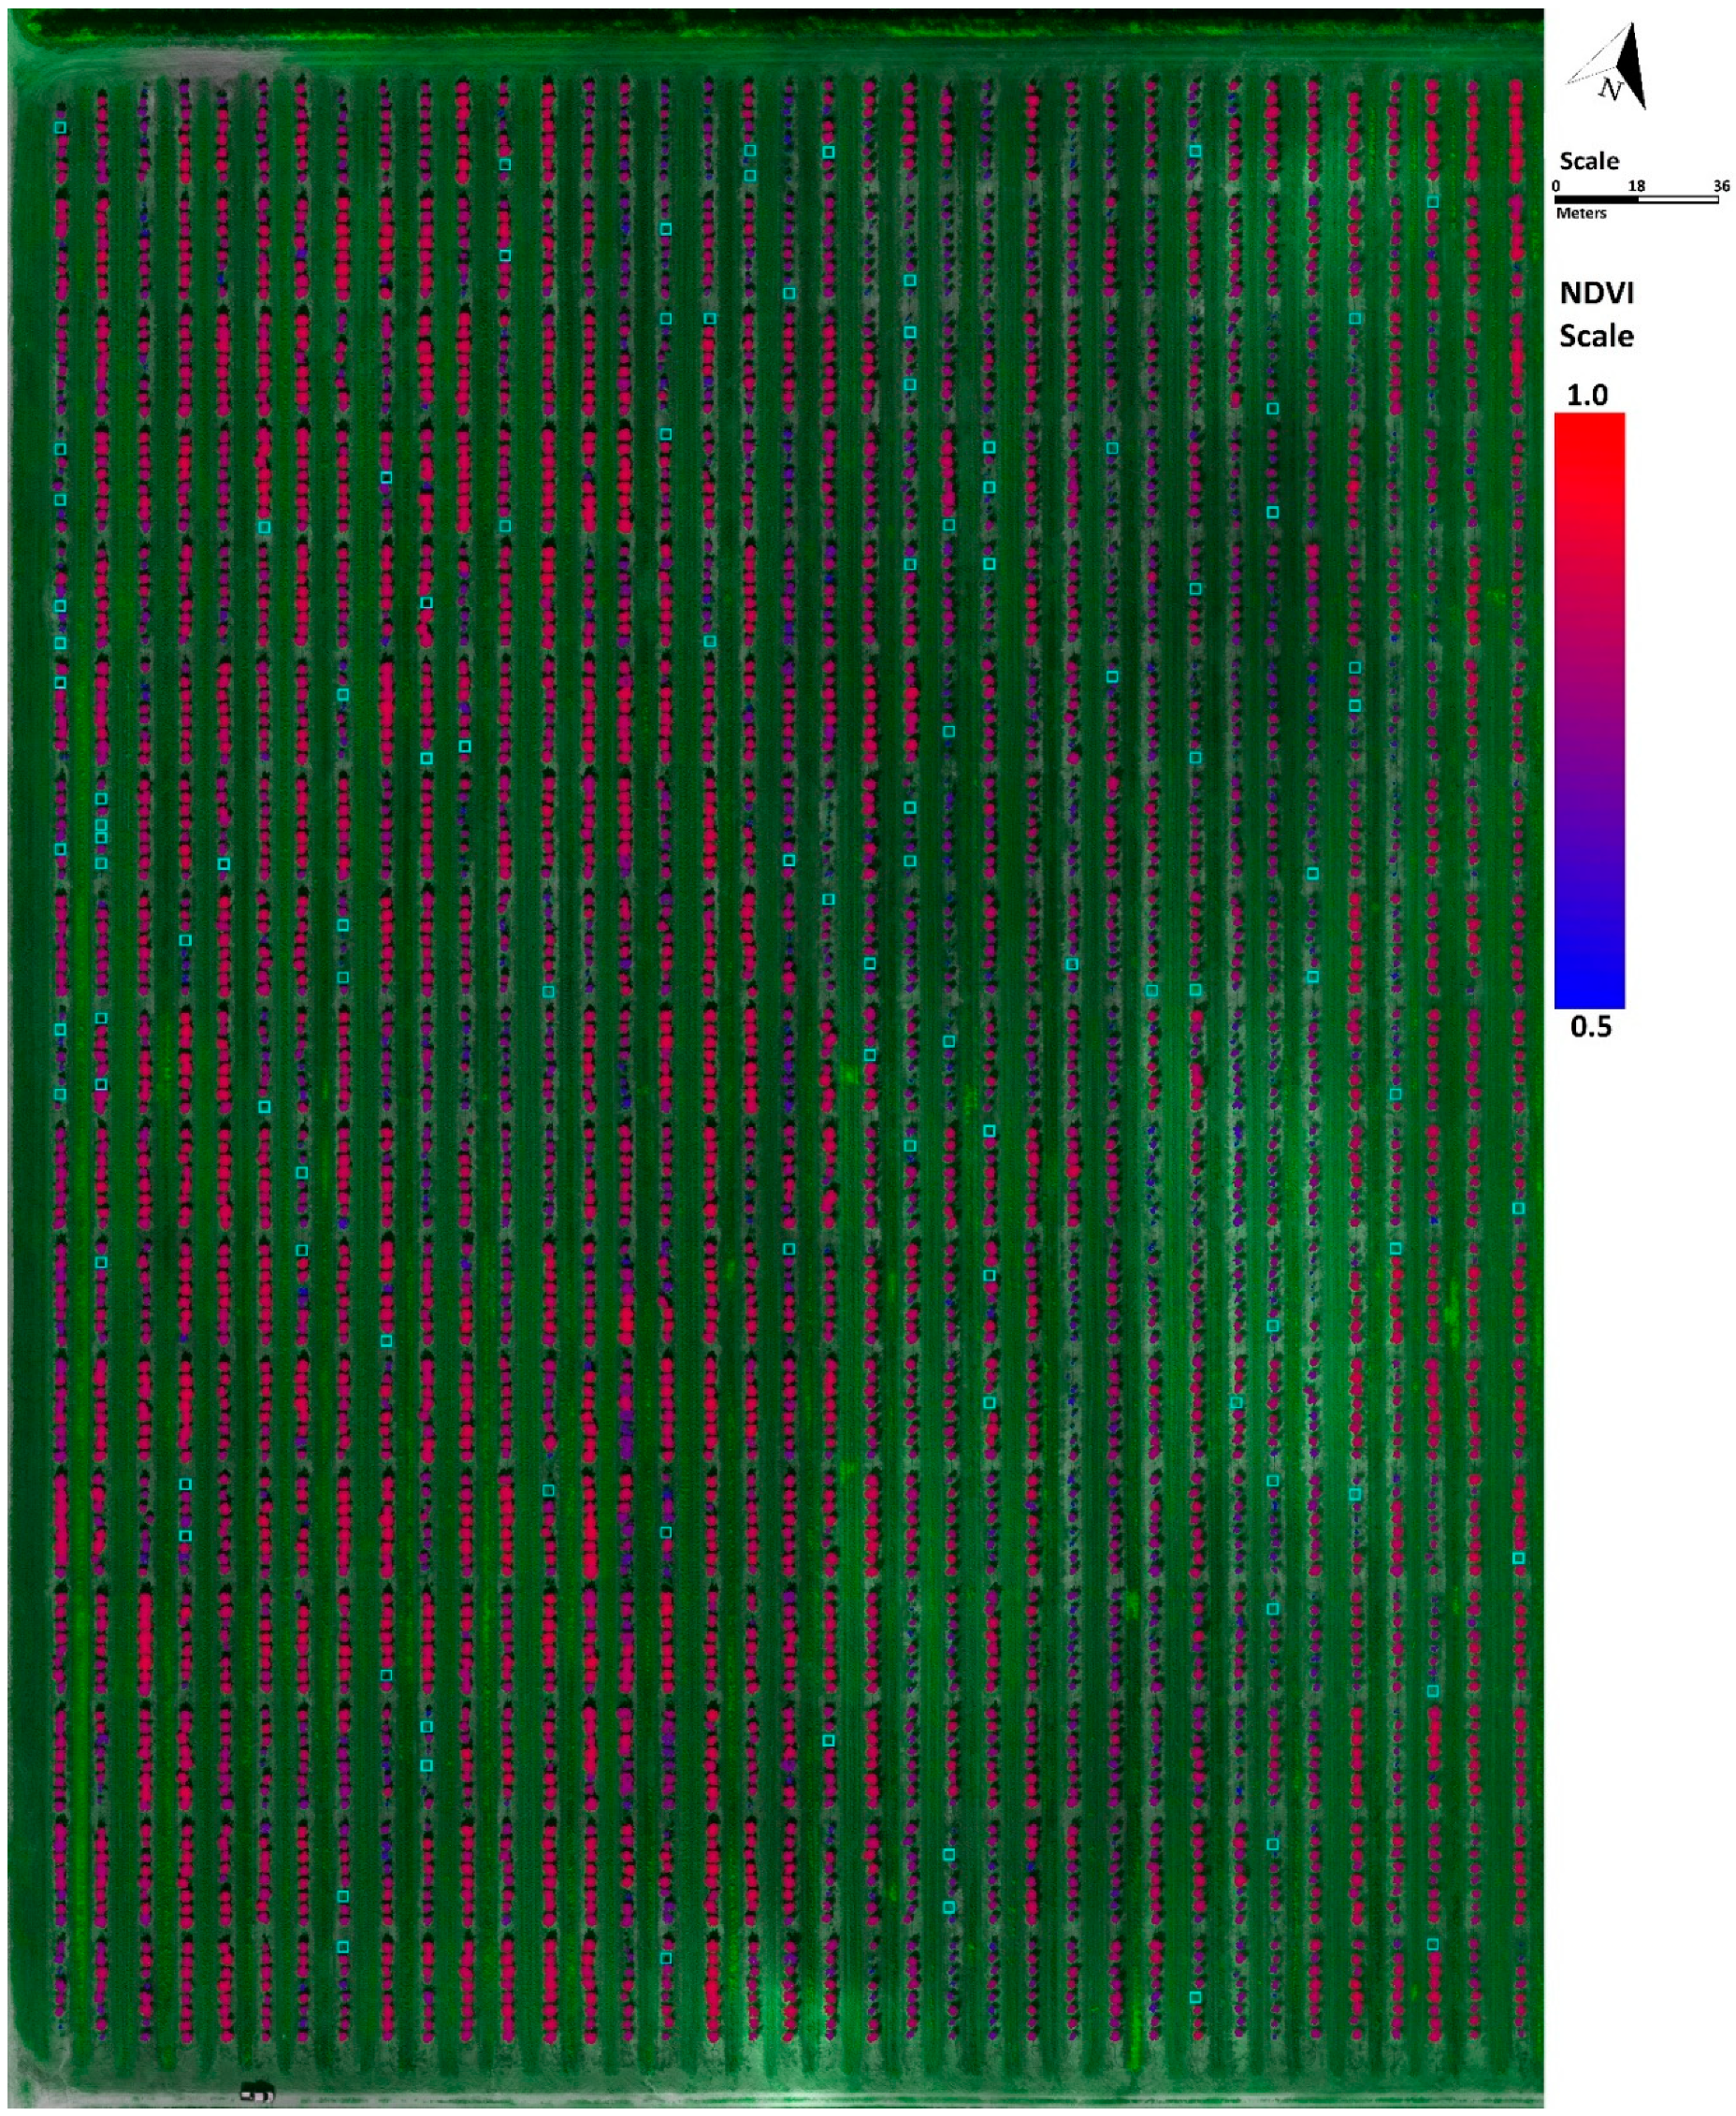
Figure 15.
NDVI map of individual trees on scale 0.5 (blue) to 1.0 (red).

Figure 16.
Individual tree NDVI distribution in the entire citrus grove.

Figure 17.
Individual tree NIR/Red distribution in the entire citrus grove.

Figure 18.
Individual tree area distribution (using NDVI-based image segmentation shape) in the entire citrus grove.
Figure 18.
Individual tree area distribution (using NDVI-based image segmentation shape) in the entire citrus grove.


Table 1.
Tree detection results using a first convolutional neural network (CNN) detection and after the second refinement detection.
Table 1.
Tree detection results using a first convolutional neural network (CNN) detection and after the second refinement detection.
| Number of Detections | TP | FP | FN | Ground Truth | Precision | Recall | F-Score | |
|---|---|---|---|---|---|---|---|---|
| First CNN detection | 4889 | 4823 | 66 | 93 | 4916 | 98.7% | 98.1% | 98.4% |
| After second detection refinement | 4904 | 4899 | 5 | 17 | 99.9% | 99.7% | 99.8% |
Table 2.
Results for tree gap detections.
| Number of Detections | TP | FP | FN | Ground Truth | Precision | Recall | F-Score | |
|---|---|---|---|---|---|---|---|---|
| Gaps detection | 106 | 106 | 0 | 6 | 112 | 100% | 94.6% | 97.3% |
Table 3.
Comparison of manually measured and calculated by the algorithm tree canopy area.
| Trees | Ground-Truth Measured Area (m2) | Rectangle Area (m2) | NDVI-Based Image Segmentation Area (m2) | Rectangle Area Error (%) | NDVI-Based Image Segmentation Area Error (%) |
|---|---|---|---|---|---|
| 1 | 2.05 | 2.62 | 1.35 | 27.7% | 34.4% |
| 2 | 5.03 | 6.29 | 4.26 | 25.2% | 15.3% |
| 3 | 3.44 | 3.07 | 2.31 | 10.8% | 32.8% |
| 4 | 4.94 | 5.58 | 4.06 | 13.0% | 17.6% |
| 5 | 4.77 | 5.58 | 4.22 | 17.1% | 11.5% |
| 6 | 4.13 | 4.06 | 2.88 | 1.5% | 30.1% |
| 7 | 2.13 | 2.88 | 1.89 | 35.3% | 11.3% |
| 8 | 6.32 | 5.94 | 5.23 | 5.9% | 17.1% |
| 9 | 5.80 | 8.19 | 5.25 | 41.2% | 9.4% |
| 10 | 1.60 | 1.02 | 0.98 | 36.2% | 38.9% |
| 11 | 6.44 | 5.50 | 4.36 | 14.5% | 32.3% |
| 12 | 4.49 | 4.43 | 4.15 | 1.4% | 7.5% |
| 13 | 4.54 | 4.55 | 4.04 | 0.2% | 11.2% |
| 14 | 4.21 | 4.53 | 3.48 | 7.6% | 17.4% |
| 15 | 6.44 | 6.13 | 4.46 | 4.7% | 30.7% |
| 16 | 5.82 | 6.84 | 4.86 | 17.5% | 16.6% |
| 17 | 5.58 | 5.20 | 4.37 | 6.9% | 21.8% |
| 18 | 5.48 | 5.50 | 4.47 | 0.3% | 18.6% |
| 19 | 5.61 | 5.37 | 4.90 | 4.4% | 12.7% |
| 20 | 7.23 | 5.85 | 5.71 | 19.0% | 21.0% |
| Average Error | 14.5% | 20.4% | |||
| Standard Deviation | 12.7% | 9.4% | |||
Table 4.
Phenotypic results for two different citrus rootstocks in the study area.
| Rootstock SORP+SH-991 | Rootstock X639 | |||||||
|---|---|---|---|---|---|---|---|---|
| Blocks | Area in m2 | NDVI | NIR/Red | Blocks | Area in m2 | NDVI | NIR/Red | |
| 1 | 1.27 | 0.70 | 2.81 | 1 | 4.14 | 0.84 | 5.65 | |
| 2 | 1.13 | 0.69 | 3.07 | 2 | 3.47 | 0.83 | 5.24 | |
| 3 | 1.54 | 0.69 | 2.95 | 3 | 3.25 | 0.81 | 4.75 | |
| 4 | 1.53 | 0.72 | 3.64 | 4 | 4.59 | 0.85 | 4.62 | |
| 5 | 1.01 | 0.72 | 3.19 | 5 | 3.67 | 0.84 | 4.26 | |
| 6 | 0.99 | 0.68 | 2.56 | 6 | 2.56 | 0.81 | 4.24 | |
| 7 | 1.01 | 0.70 | 2.87 | 7 | 2.88 | 0.81 | 4.82 | |
| 8 | 1.90 | 0.75 | 3.78 | 8 | 3.57 | 0.79 | 5.22 | |
| 9 | 2.86 | 0.80 | 4.33 | 9 | 3.34 | 0.83 | 5.55 | |
| 10 | 1.65 | 0.70 | 3.24 | 10 | 3.04 | 0.78 | 4.79 | |
| 11 | 0.75 | 0.63 | 2.36 | 11 | 4.25 | 0.84 | 5.11 | |
| 12 | 1.18 | 0.68 | 2.70 | 12 | 2.86 | 0.83 | 4.82 | |
| 13 | 1.65 | 0.72 | 3.25 | 13 | 4.24 | 0.84 | 4.96 | |
| 14 | 1.15 | 0.70 | 2.88 | 14 | 3.93 | 0.85 | 6.22 | |
| 15 | 1.47 | 0.78 | 3.78 | 15 | 2.23 | 0.77 | 4.35 | |
| 16 | 1.75 | 0.76 | 3.58 | |||||
| 17 | 2.85 | 0.81 | 5.39 | Average | 3.47 | 0.82 | 4.97 | |
| 18 | 2.30 | 0.72 | 3.57 | Standard Deviation | 0.68 | 0.03 | 0.55 | |
| 19 | 1.32 | 0.69 | 3.19 | |||||
| 20 | 1.04 | 0.69 | 3.05 | |||||
| 21 | 1.84 | 0.77 | 3.76 | |||||
| 22 | 1.43 | 0.71 | 3.25 | |||||
| 23 | 1.63 | 0.73 | 3.46 | |||||
| 24 | 1.17 | 0.70 | 3.30 | |||||
| 25 | 1.55 | 0.75 | 4.29 | |||||
| 26 | 1.40 | 0.72 | 3.68 | |||||
| 27 | 1.88 | 0.76 | 3.65 | |||||
| 28 | 1.97 | 0.71 | 3.00 | |||||
| Average | 1.54 | 0.72 | 3.38 | |||||
| Standard Deviation | 0.51 | 0.04 | 0.62 | |||||
© 2019 by the authors. Licensee MDPI, Basel, Switzerland. This article is an open access article distributed under the terms and conditions of the Creative Commons Attribution (CC BY) license (http://creativecommons.org/licenses/by/4.0/).
Share and Cite
MDPI and ACS Style
Ampatzidis, Y.; Partel, V. UAV-Based High Throughput Phenotyping in Citrus Utilizing Multispectral Imaging and Artificial Intelligence. Remote Sens. 2019, 11, 410. https://doi.org/10.3390/rs11040410
AMA Style
Ampatzidis Y, Partel V. UAV-Based High Throughput Phenotyping in Citrus Utilizing Multispectral Imaging and Artificial Intelligence. Remote Sensing. 2019; 11(4):410. https://doi.org/10.3390/rs11040410
Chicago/Turabian StyleAmpatzidis, Yiannis, and Victor Partel. 2019. "UAV-Based High Throughput Phenotyping in Citrus Utilizing Multispectral Imaging and Artificial Intelligence" Remote Sensing 11, no. 4: 410. https://doi.org/10.3390/rs11040410
Note that from the first issue of 2016, this journal uses article numbers instead of page numbers. See further details here.