Financial Bubbles: A Study of Co-Explosivity in the Cryptocurrency Market


1
Department of Economics and Management, University of Pavia, 27100 Pavia, Italy
2
Department of Economics and Statistics, University of Siena, 53100 Siena, Italy
*
Author to whom correspondence should be addressed.
Risks 2020, 8(2), 34; https://doi.org/10.3390/risks8020034
Submission received: 7 February 2020
/
Revised: 3 April 2020
/
Accepted: 6 April 2020
/
Published: 9 April 2020
(This article belongs to the Special Issue Financial Networks in Fintech Risk Management)
Abstract
:Cryptocurrencies have recently captured the interest of the econometric literature, with several works trying to address the existence of bubbles in the price dynamics of Bitcoins and other cryptoassets. Extremely rapid price accelerations, often referred to as explosive behaviors, followed by drastic drops pose high risks to investors. From a risk management perspective, testing the explosiveness of individual cryptocurrency time series is not the only crucial issue. Investigating co-explosivity in the cryptoassets, i.e., whether explosivity in one cryptocurrency leads to explosivity in other cryptocurrencies, allows indeed to take into account possible shock propagation channels and improve the prediction of market collapses. To this aim, our paper investigates the relationships between the explosive behaviors of cryptocurrencies through a unit root testing approach.
1. Introduction
Cryptocurrencies are digital financial assets, which are increasingly attracting the attention of investors. The lack of an intrinsic value and the substantial changes in their price gave rise to a debate in the financial literature. As Giudici et al. (2019b) pointed out, part of the on-going discussion focuses on the unclear way in which cryptocurrencies may be classified: if as commodities, money or derivatives; some attention is also brought to legal and political issues.
The absence of a fundamental approach to evaluate cryptocurrencies is another open problem. The unclear fundamental value leads indeed to a higher degree of uncertainty among investors, encouraging herding behavior (Devenow and Welch 1996; Trueman 1994). Figà-Talamanca and Patacca (2019) focused on the role of information to reduce uncertainty, showing that the intensity of the internet search for cryptocurrency-related keywords significantly affects volatility.
From an econometric point of view, one of the main research questions related to cryptocurrencies concerns the possible presence of bubbles in their price.
An asset bubble is defined in literature as an extreme price acceleration that cannot be driven by the underlying fundamental economic variables (Case and Shiller 2003; Dreger and Zhang 2013). The end of this phase, often referred to as bubble burst, leads to drastic price drops, causing severe losses to investors. For example, the Bitcoin price, after one year of sharp increases, crashed at the end of 2017 with a loss of nearly 65% with respect to the peak on 5 February 2018.
Several recent works provided empirical evidence of the presence of bubbles in the cryptocurrency prices (Cheung at al. 2015; Corbet et al. 2018b; Fry and Cheah 2016). From a methodological viewpoint, most of them resorted to the right-tailed unit root testing approach of Phillips et al. (2011) and its extensions. Indeed, the extremely rapid price increase, to which the definition of financial bubble refers to, can be described by an exponential growth, whose occurrence can be detected through the cited tests. Using quite common terminology (see, e.g., Steenkamp (2018) and Bouri et al. (2019)) we employ the term “explosiveness”, or “explosivity”, to indicate an exponential growth of asset prices.
As (Hassani et al. 2019) pointed out, the integration of cryptocurrencies and blockchain technology could reduce the risk of bubbling, with advantages for investors and market operators. This technology allows real-time big data sharing and analytics in a secured network, supporting the creation of a safe and efficient environment for both risk management and strategic decision making. Thus, big data analytics can improve the operational efficiency and the profitability for investors, and prevent significant losses arising from price volatility. Concerning this issue, (Li and Wang 2017) suggested that relevant information based on transaction records on blockchain, together with real-time monitoring of users, activities, prices and computational power, will provide better predictions of market volatility over time. Again, the key is to use big data analytics to perform statistically reliable forecasts that support the decision making of investors and the assessment of potential risks. The implementation of these statistical techniques may also help retail investors.
Another recent and relevant stream of the literature has investigated interconnectedness in the cryptocurrency market. In particular, Corbet et al. (2018a) applied the Diebold and Yilmaz (2014) methodology to study volatility transmission between cryptoassets, finding high correlations and evidence of a spillover between Bitcoin and Ripple, and Yi et al. (2018) studied co-movements in a set of cryptocurrencies using a LASSO-VAR approach. The VAR methodology was also applied by Giudici and Pagnottoni (2019a) and Giudici and Pagnottoni (2019b) to study spillovers in the Bitcoin exchanges, while Giudici and Abu Hashish (2019) used a network VAR model to investigate interconnectedness in the cryptocurrency market. The network methodology to study correlation between cryptocurrencies was also recently applied by Giudici and Polinesi (2019) and Chen et al. (2020).
The interdependence between cryptoassets also affects financial risk at the portfolio level. In particular, Brière et al. (2015) investigated whether Bitcoins are able to offer any diversification benefits. By considering the exchange rates of Bitcoin against USD for the period from 23 July 2010 to 27 December 2013, the authors showed that the inclusion of even a small proportion of cryptocurrency may notably improve the risk–return trade-off of well-diversified portfolios. Eisl et al. (2015) provided very similar results in a conditional value-at-risk framework. They found that despite the fact that “an investment in Bitcoin increases the CVaR of a portfolio, this additional risk is overcompensated by high returns leading to better risk–return ratios”. These findings encourage the analysis of correlation effects not only between cryptocurrencies and other financial instruments, but also inside the cryptocurrency market, to highlight possible diversification benefits.
In this work, we combined bubble identification with the analysis of the co-movements of cryptocurrencies. To our knowledge, addressing the issue of co-explosivity in the cryptocurrency market based on bubble tests is still nearly unexplored. Recently, Bouri et al. (2019) applied the Phillips et al. (2015) testing methodology to a set of cryptocurrencies and modeled the probability of a bubble occurrence in each of them as explained by the presence of bubbles in the others through logistic regression.
We contributed to the existing literature by investigating interdependencies in the price behavior of different cryptoassets, showing how the relationships change depending on the price phases (from stationary to explosive).
Furthermore, we investigated whether bubble bursts, which pose high risks to investors, tend to occur together. In particular, we modeled the probability of a bubble burst of each cryptocurrency, conditional on the occurrence of bubble collapses in other cryptocurrencies on the market.
2. Methodology
2.1. Testing for Bubbles
Phillips et al. (2011) proposed a recursive test to verify the null hypothesis of unit root against the alternative hypothesis of explosive behavior.
Specifically, they defined the supremum augmented Dickey–Fuller (SADF) test, based on the following recursive regression:
where is the asset price, , and are estimated through ordinary least squares (OLS) and J is the maximum number of lags, which is chosen based on some model selection procedure or information criterion.
When , the price grows exponentially. The SADF test statistic, used to test the null hypothesis of unit root () against the presence of a bubble (), is calculated by the repeating regression of Equation (1) on a rolling window expanding from to :
where is a given fraction of the total sample.
The hypothesis of no explosive behavior is then rejected if the SADF value overcomes the right-side critical value corresponding to the considered significance level; see (Phillips et al. 2011) for details about the asymptotic distribution of the SADF statistic.
This testing procedure itself does not provide any information about the starting and ending date of the bubble, which is often of interest in operational research.
To this aim, the same authors proposed a methodology called the backward supremum augmented Dickey–Fuller (BSADF), which performs a SADF test on a backward expanding window where the end point of each window is fixed by and the starting point varies from 0 to :
This method (Phillips et al. 2015) was shown to improve the identification accuracy in time series including one or more collapsing bubbles.
Following this approach, the start and the end of explosive phases are determined as follows:
where is the critical value of the SADF statistic at the level of significance, while is a time threshold, expressed as a fraction of the total sample size, below which an explosive behavior is not defined as a bubble (for example, one could decide that explosive periods lasting less than three days are not considered as bubbles).
In our empirical study (see Section 3 for detailed results), we applied the BSADF test to several cryptocurrency time series1. In particular, we detected the presence of a bubble in t when the corresponding value for the BSADF statistic exceeds the critical value. The time series of critical values were obtained through a Monte Carlo simulation exercise based on 1000 replications.
2.2. Co-Explosivity
After identifying price explosivity in each cryptocurrency time series through the methodology described in Section 2.1, we investigated the correlation of cryptoassets during bubble periods.
In particular, we aimed at verifying whether interdependence among cryptocurrencies increases during financial bubbles, and whether the found correlation is positive. This latter aspect is indeed relevant for investment decisions, as a negative correlation would offer diversification benefits, while a positive correlation would increase portfolio risk.
Our approach is based on a regression analysis on the calculated BSADF statistic. This way, we can assess the extent to which the explosivity of a cryptoasset is influenced by explosive behaviors of the others.
Specifically, to take into account both the presence of potential bubbles and co-explosivity, for each of the considered cryptocurrencies we calculated the time series of ratios between the BSADF statistic and the corresponding critical value at a significance level:
for each cryptoasset.
We then estimate a quantile regression model:
where is the -th quantile of the sample distribution of , X is a vector containing for and is the vector of coefficients to be estimated.
Thus, we are able to assess dependency of the i-th asset on the other four for different levels of explosivity, from stationarity (lowest quantiles) to bubble evidence (highest quantiles). In particular, quantiles for which the calculated ratio exceeds 1 correspond to price explosivity phases.
2.3. Probability of Bubble Burst
The purpose of the methodology described in Section 2.2 was to analyze whether the prices of different cryptoassets tend to explode simultaneously.
Though, the risks related to bubbles spread during their bursts—that is when the exponential growth phase ends and a rapid drop in the price starts, causing severe losses. We then performed further analysis to investigate whether bubble bursts in the cryptocurrency market occur contemporaneously.
Specifically, we estimated a series of logistic regressions to model the probability of having a bubble burst in the considered cryptocurrencies as a function of the occurrence of bubble bursts in others. Thus, in each regression, the dependent variable is a binary variable taking value 1 if a bubble burst is observed in that trading day, 0 otherwise, and the explanatory variables are the correspondent binary variables for the other four cryptoassets. In our modeling framework, a bubble burst is observed when the value of the BSADF statistic was above the critical value at the previous day, indicating that the null hypothesis of unit root was refused in favor of the alternative of an explosive behavior, and the current value of the BSADF statistic is below the critical value again.
Specifically, we estimate the following model:
for , where is the probability that a bubble in the price of the i-th asset bursts in t, is a constant term and each is a dummy variable taking value 1 if is below the critical value in t and was above the critical value in , that is a bubble burst in the price of asset j occurs in t.
Note that this analysis is similar to the one performed by Bouri et al. (2019), who studied the probability of bubble occurrence through a logistic approach. We instead investigated the probability that a bubble bursts, conditional on the behavior of the other cryptocurrencies.
3. Application
3.1. Data
We focused on five cryptocurrencies ouf ot the 10 largest capitalization cryptocurrencies at the writing date, for which a daily price time series of two years starting from 2017 is available: Bitcoin, Ethereum, Ripple, Litecoin and Stellar. Indeed, many potential bubbles were observed in the cryptocurrency market in the period 2017–2018. The data were downloaded from CoinMarketCap2.
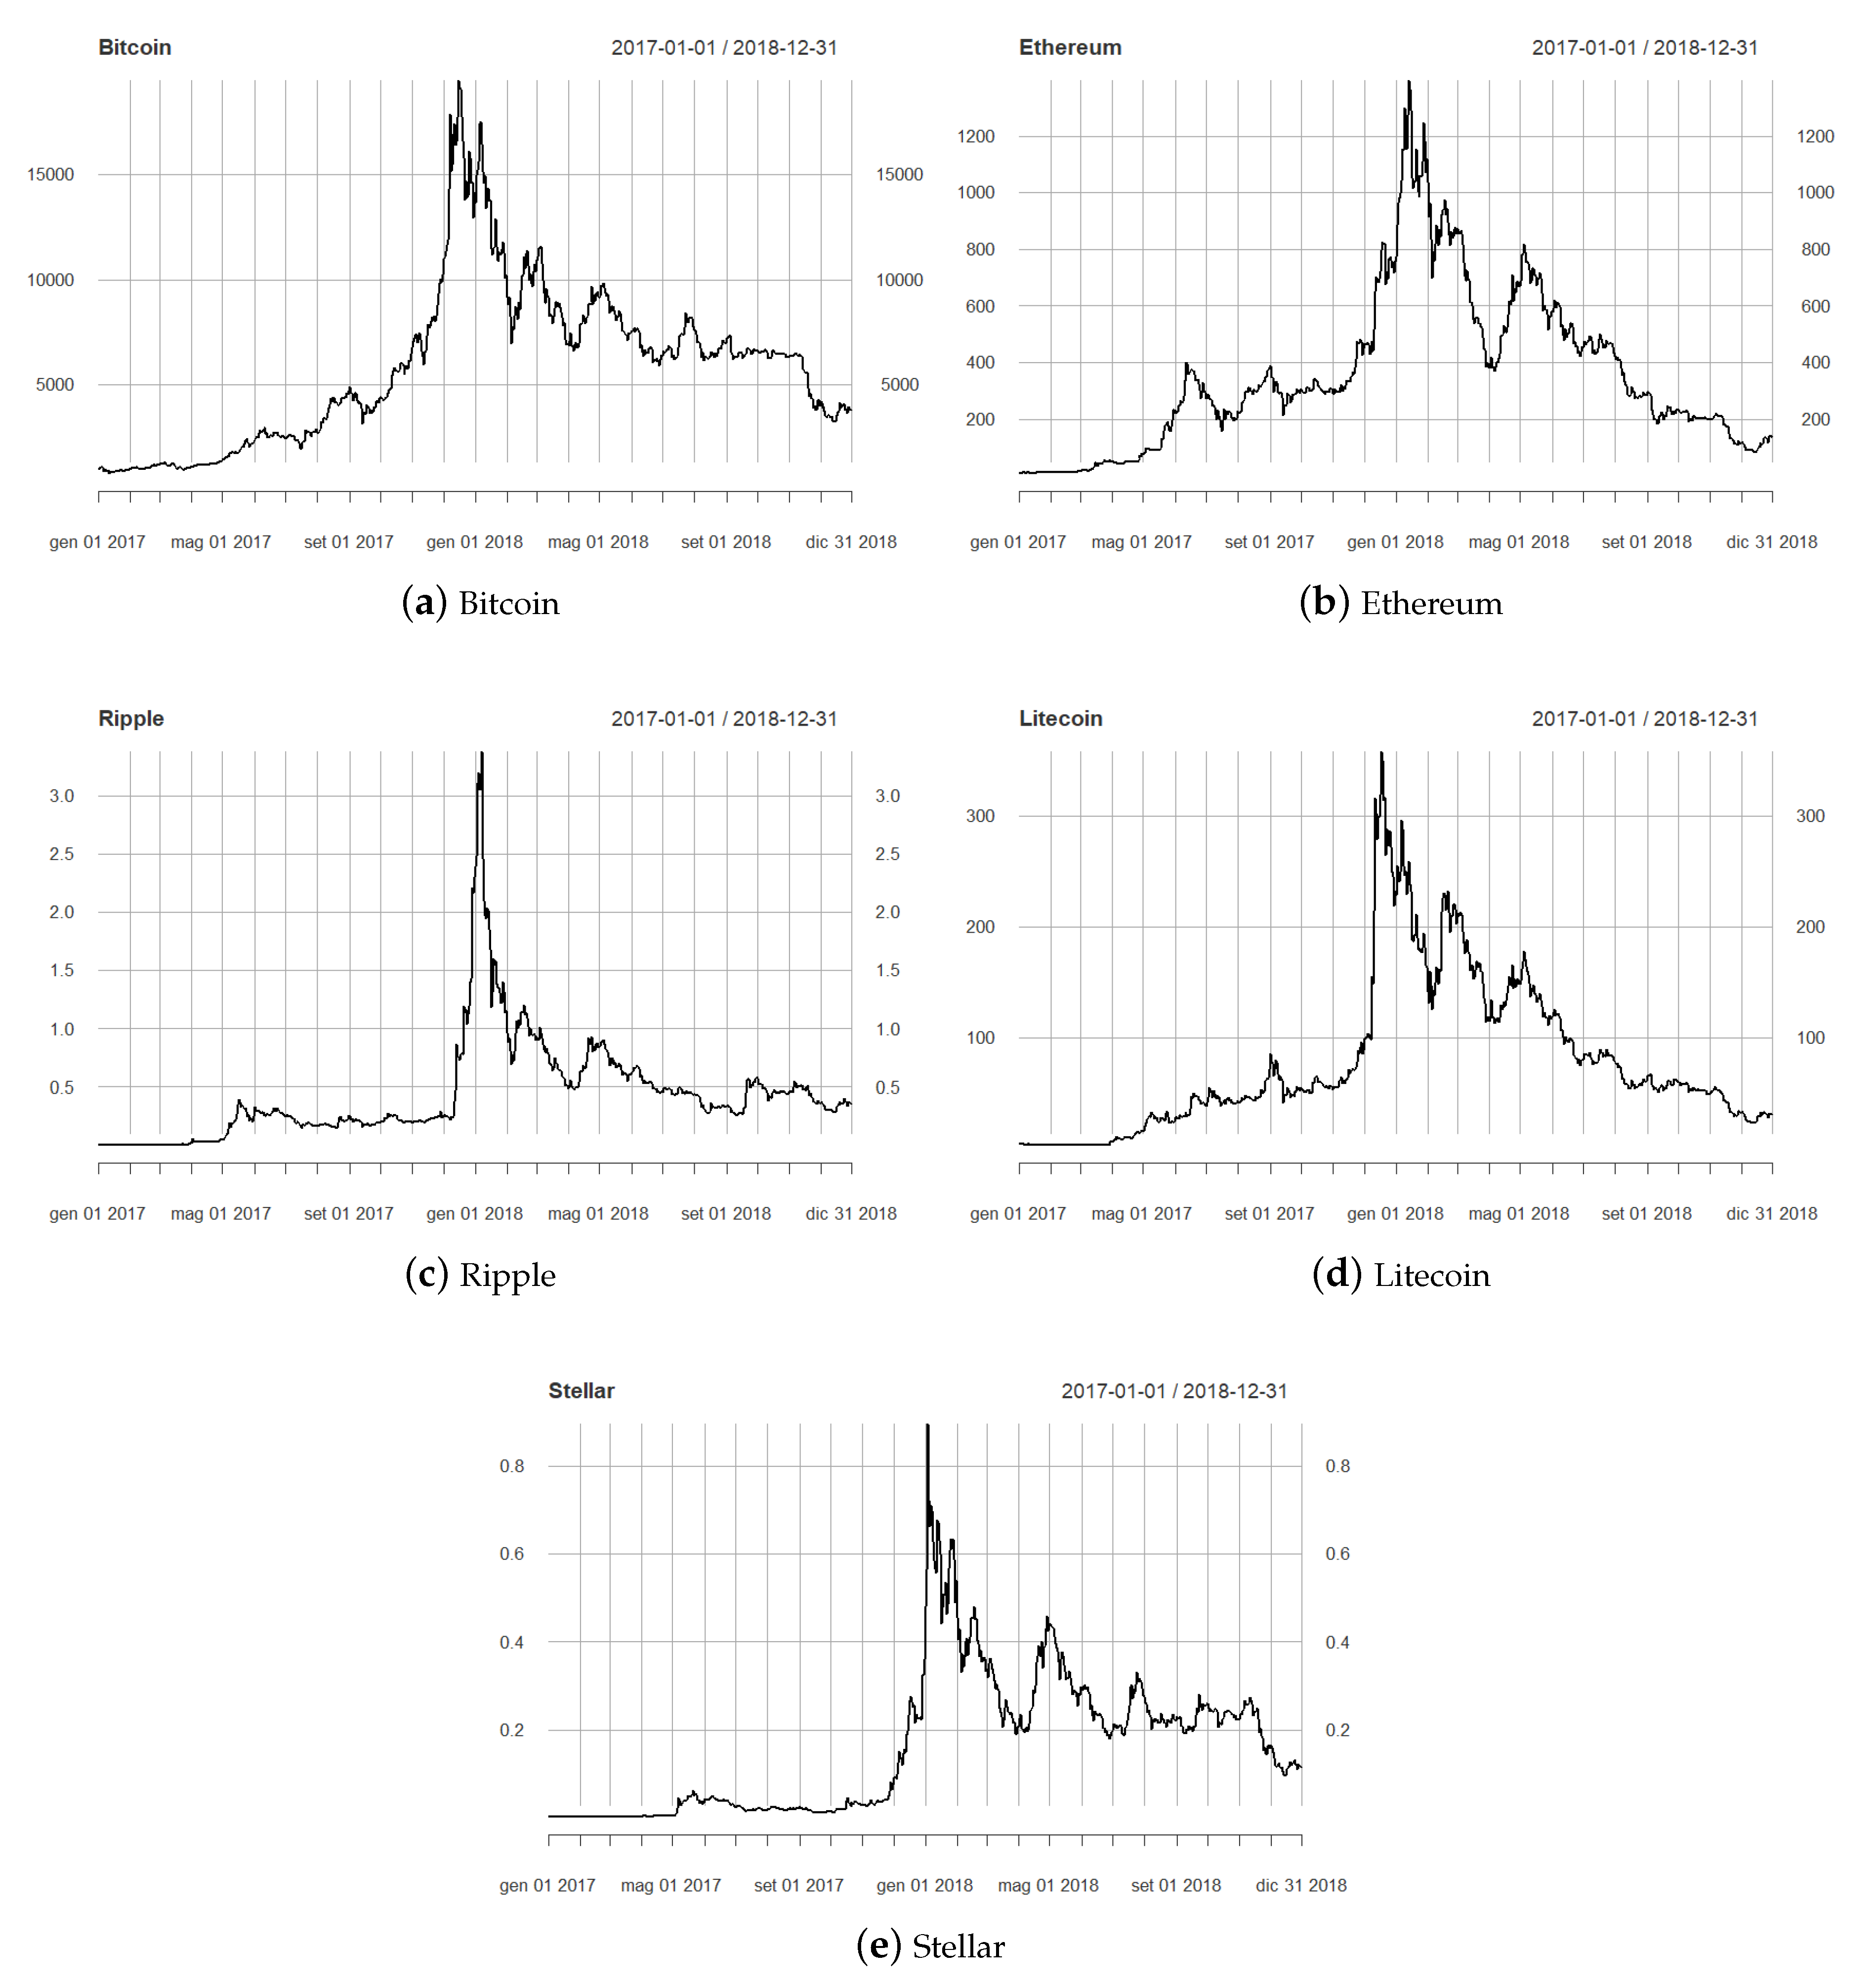
It can be seen in Figure 1 that the price of all the considered assets exhibited a rapid increase in mid-2017. Further, 2018 is characterized by multiple potential bubbles, with a high peak at the beginning of the year.
3.2. Results
By applying the right-tailed unit root test described in Section 2.1, we found evidence of bubbles in all the five cryptocurrencies.
It can be seen that in several cases the null hypothesis of unit root was rejected in favor of the alternative of explosive behavior. In particular, the middle and the end of 2017 and early 2018 were the three sub-periods characterized by the strongest evidence of bubbles.
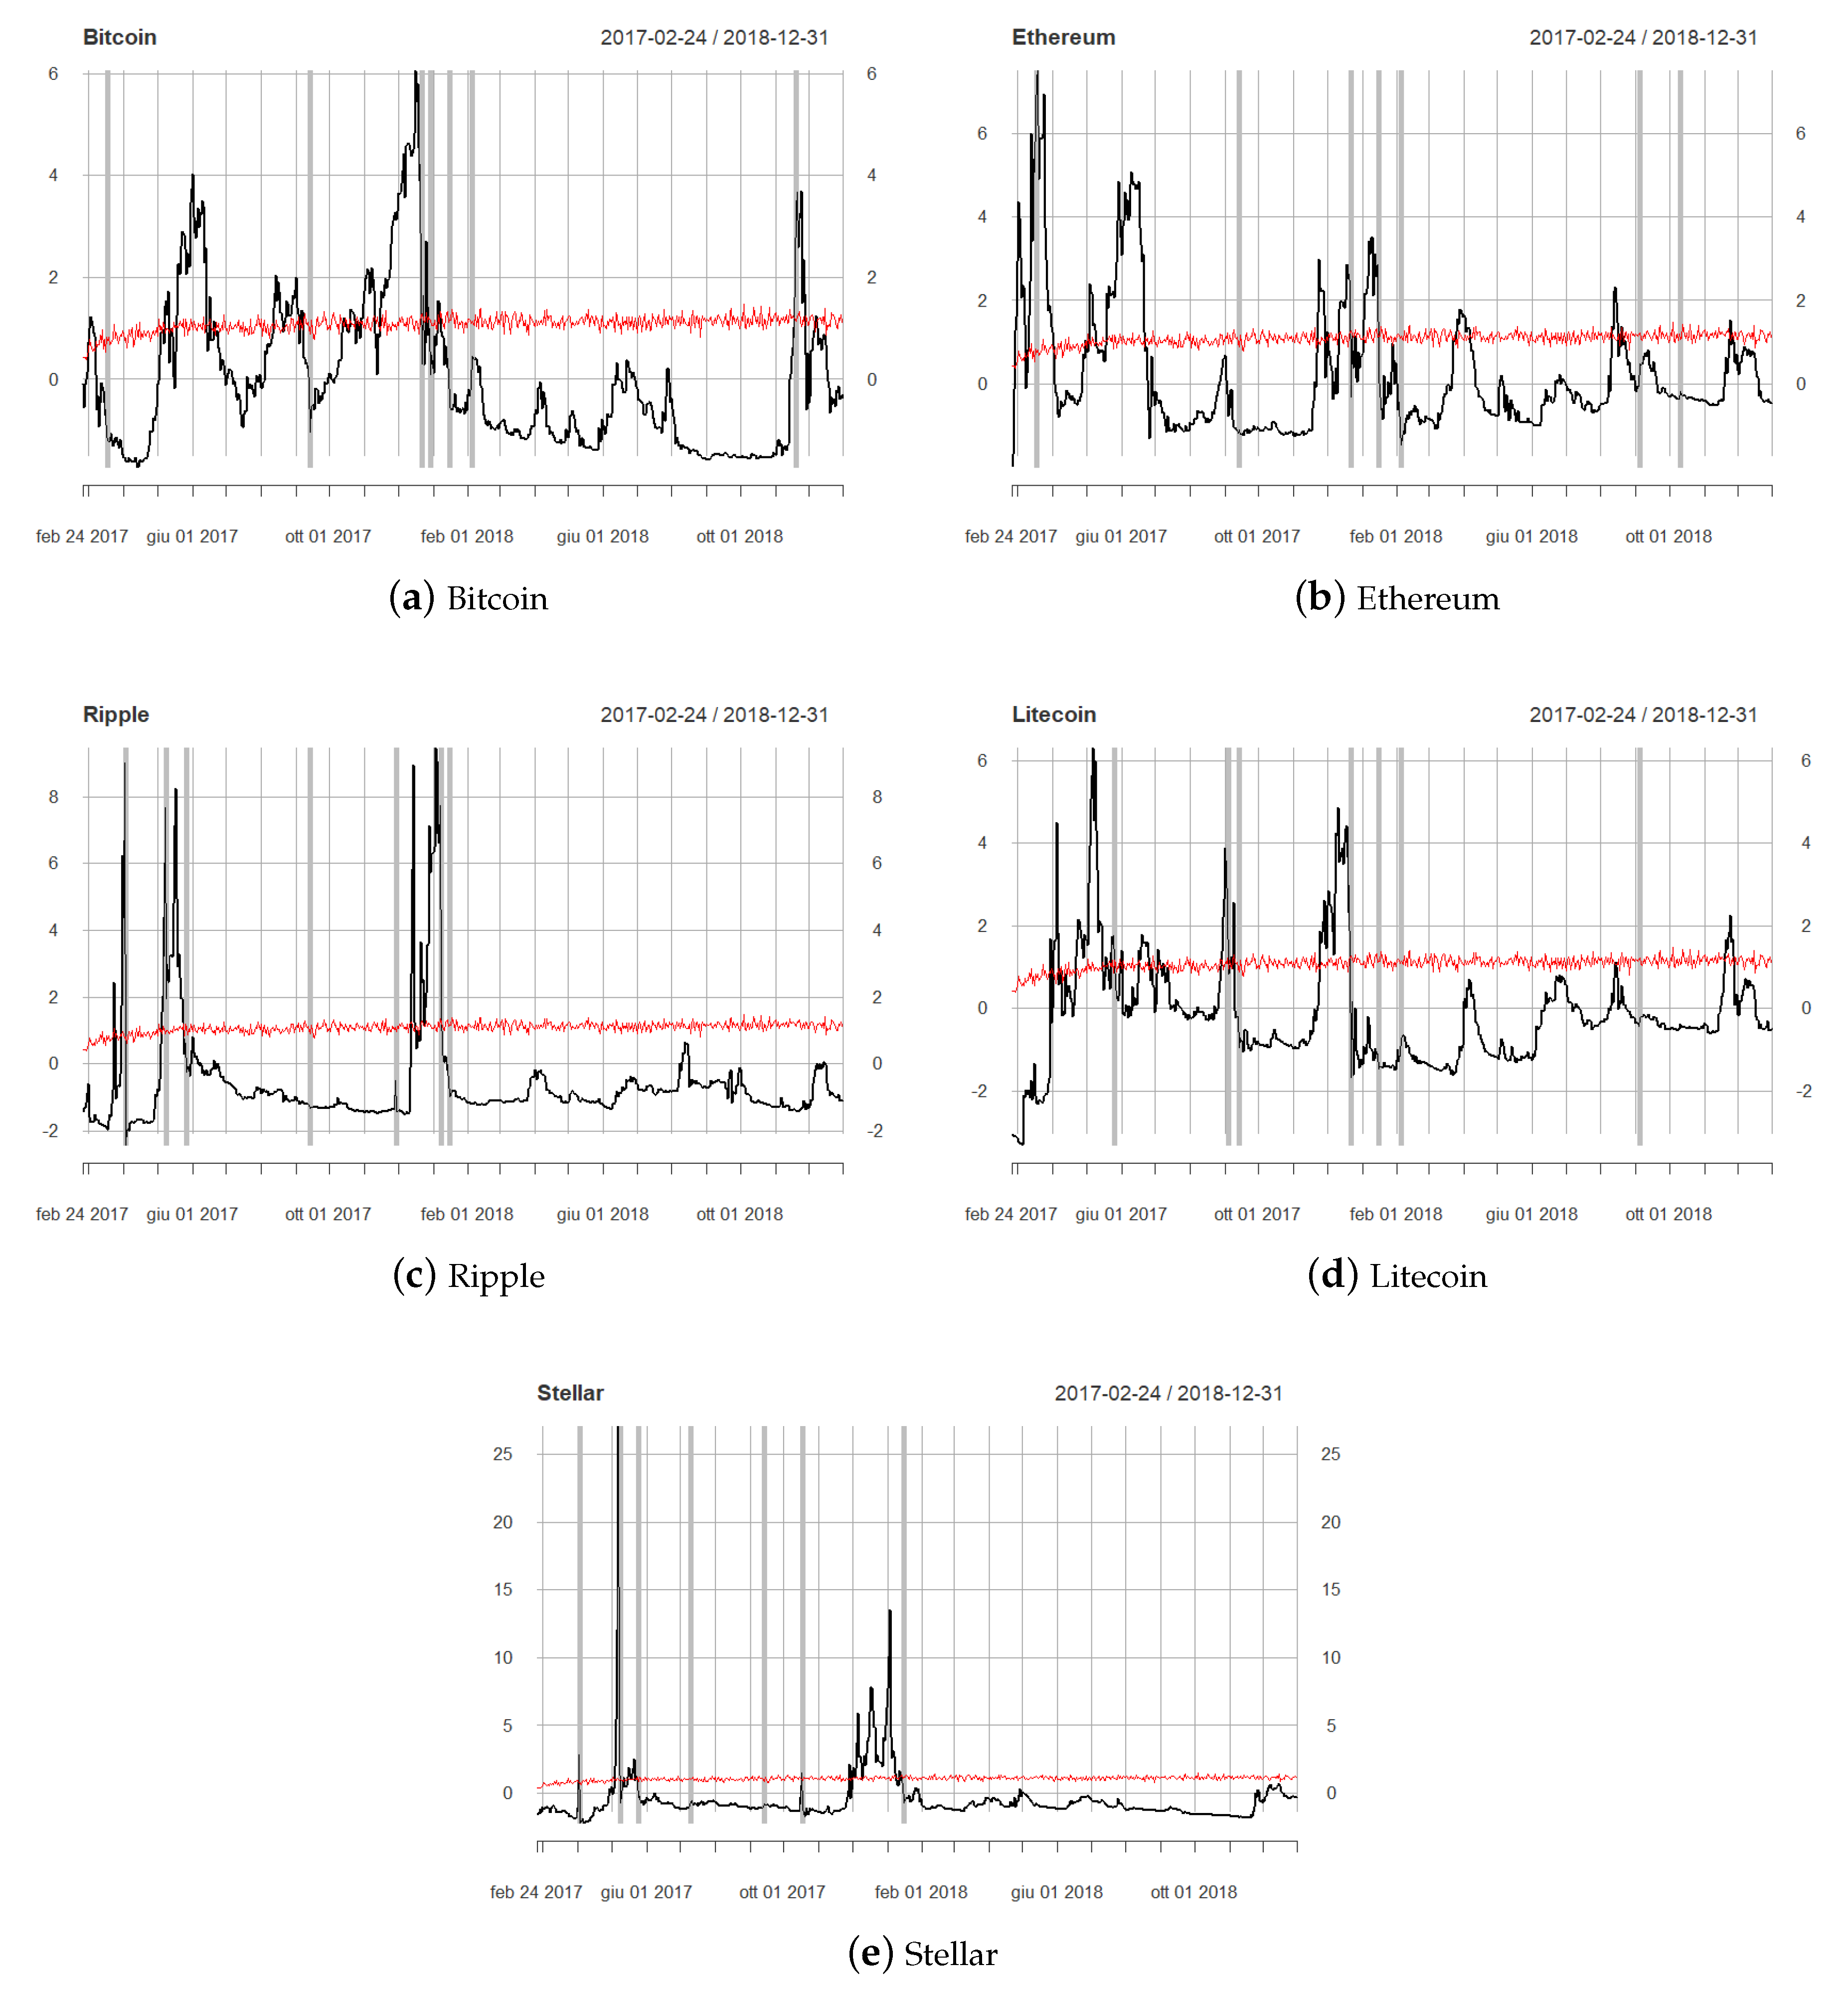
Specifically, during the considered time period, Ethereum and Ripple were the first to show explosivity in March 2017, while later in the year, from April to June, all the five cryptoassets showed explosive dynamics. The creation of the Enterprise Ethereum Alliance (EEA) in March 2017, announced by blockchain startups, research labs and global companies, is one of the factors that can explain this trend. Furthermore, since the beginning of 2017, the total amount raised by ICOs passed $300 million, which means an increase of nearly 200% in less than six months. Many ICOs initiatives are based on the Ethereum Blockchain due to its smart contracts capabilities, and this contributed to the large growth of Ethereum price. Bitcoin explosivity emerged again in August and September 2017, when bubble episodes also appeared in Litecoin. This period coincides with the hard fork of Bitcoin, which forked into two derivative digital currencies, the Bitcoin chain (BTC) and the Bitcoin Cash (BCH). Another bubble phase emerged in Bitcoin in late October toward the end of December 2017. In particular, the Bitcoin price reached the level of $10,000 on 28 November 2017, and $20,000 on 17 December 2017. In the last quarter of 2017, also the other cryptoassets showed explosivity. A lower number of bubble episodes was observed in the following year, 2018, which started with a sharp drop of prices in the cryptocurrency market. An explosive behavior of Ethereum, apparently not followed by the other cryptoassets, can be noticed between August and September. A sharp peak in the price of Ethereum was indeed observed on 13 September 2018, with a daily return close to 14%. Bitcoin came back to an explosive phase in December 2018, with a rapid growth which followed the negative performance of the first half of the month. Litecoin also showed a short bubble period at the end of 2018, rapidly recovering from the drop in price observed in the first part of December.
It can also be noticed that, for all the five cryptocurrencies, the most extreme negative returns (gray lines in Figure 2) took place right after the end of the detected bubble periods, encouraging the study of the explosive price dynamics in order to mitigate market risk. In particular, all the cryptocurrencies showed multiple extreme losses at the beginning of 2018, after the end of the bubble period occurred in late 2017, except for Stellar, for which only one tail return was observed in January 2018. Highly negative returns of Stellar, as well as Ripple and Litecoin, can instead be seen in May and June 2017, following the bubble periods that occurred in March and April 2017. Other severe losses in all the cryptocurrencies followed the bubble period of August–September 2017, probably triggered by the fork of Bitcoin.
Table 1 reports the count of days per quarter in which the BSADF statistic overcomes the critical value, supporting evidence of an explosive price behavior, for each cryptocurrency. In general, the second and the fourth quarter of 2017 were the periods characterized by the largest number of bubble episodes in the cryptocurrency market. It can be noticed that, among the considered cryptoassets, Bitcoin is the one showing the highest number of explosivity days (136), closely followed by Ethereum (131). However, the distribution of bubble episodes of the two assets over the period was not so similar: for Bitcoin, the last quarter of 2017 was the sub-period showing the highest number of explosivity days, which was instead the second quarter of the same year for Ethereum. The latter shows a quite large number of explosivity days (31) in the first quarter of 2017, when only six bubble episodes were identified in the Bitcoin dynamics. During the 2017–2018 period, 96 bubble times were reported for Litecoin, with a high concentration in the second quarter of 2017. Over the 49 explosivity days of Ripple, 22 were observed in the second quarter of 2017, while the last quarter of 2017 was the period showing the highest number of explosivity episodes in the price dynamics of Stellar.
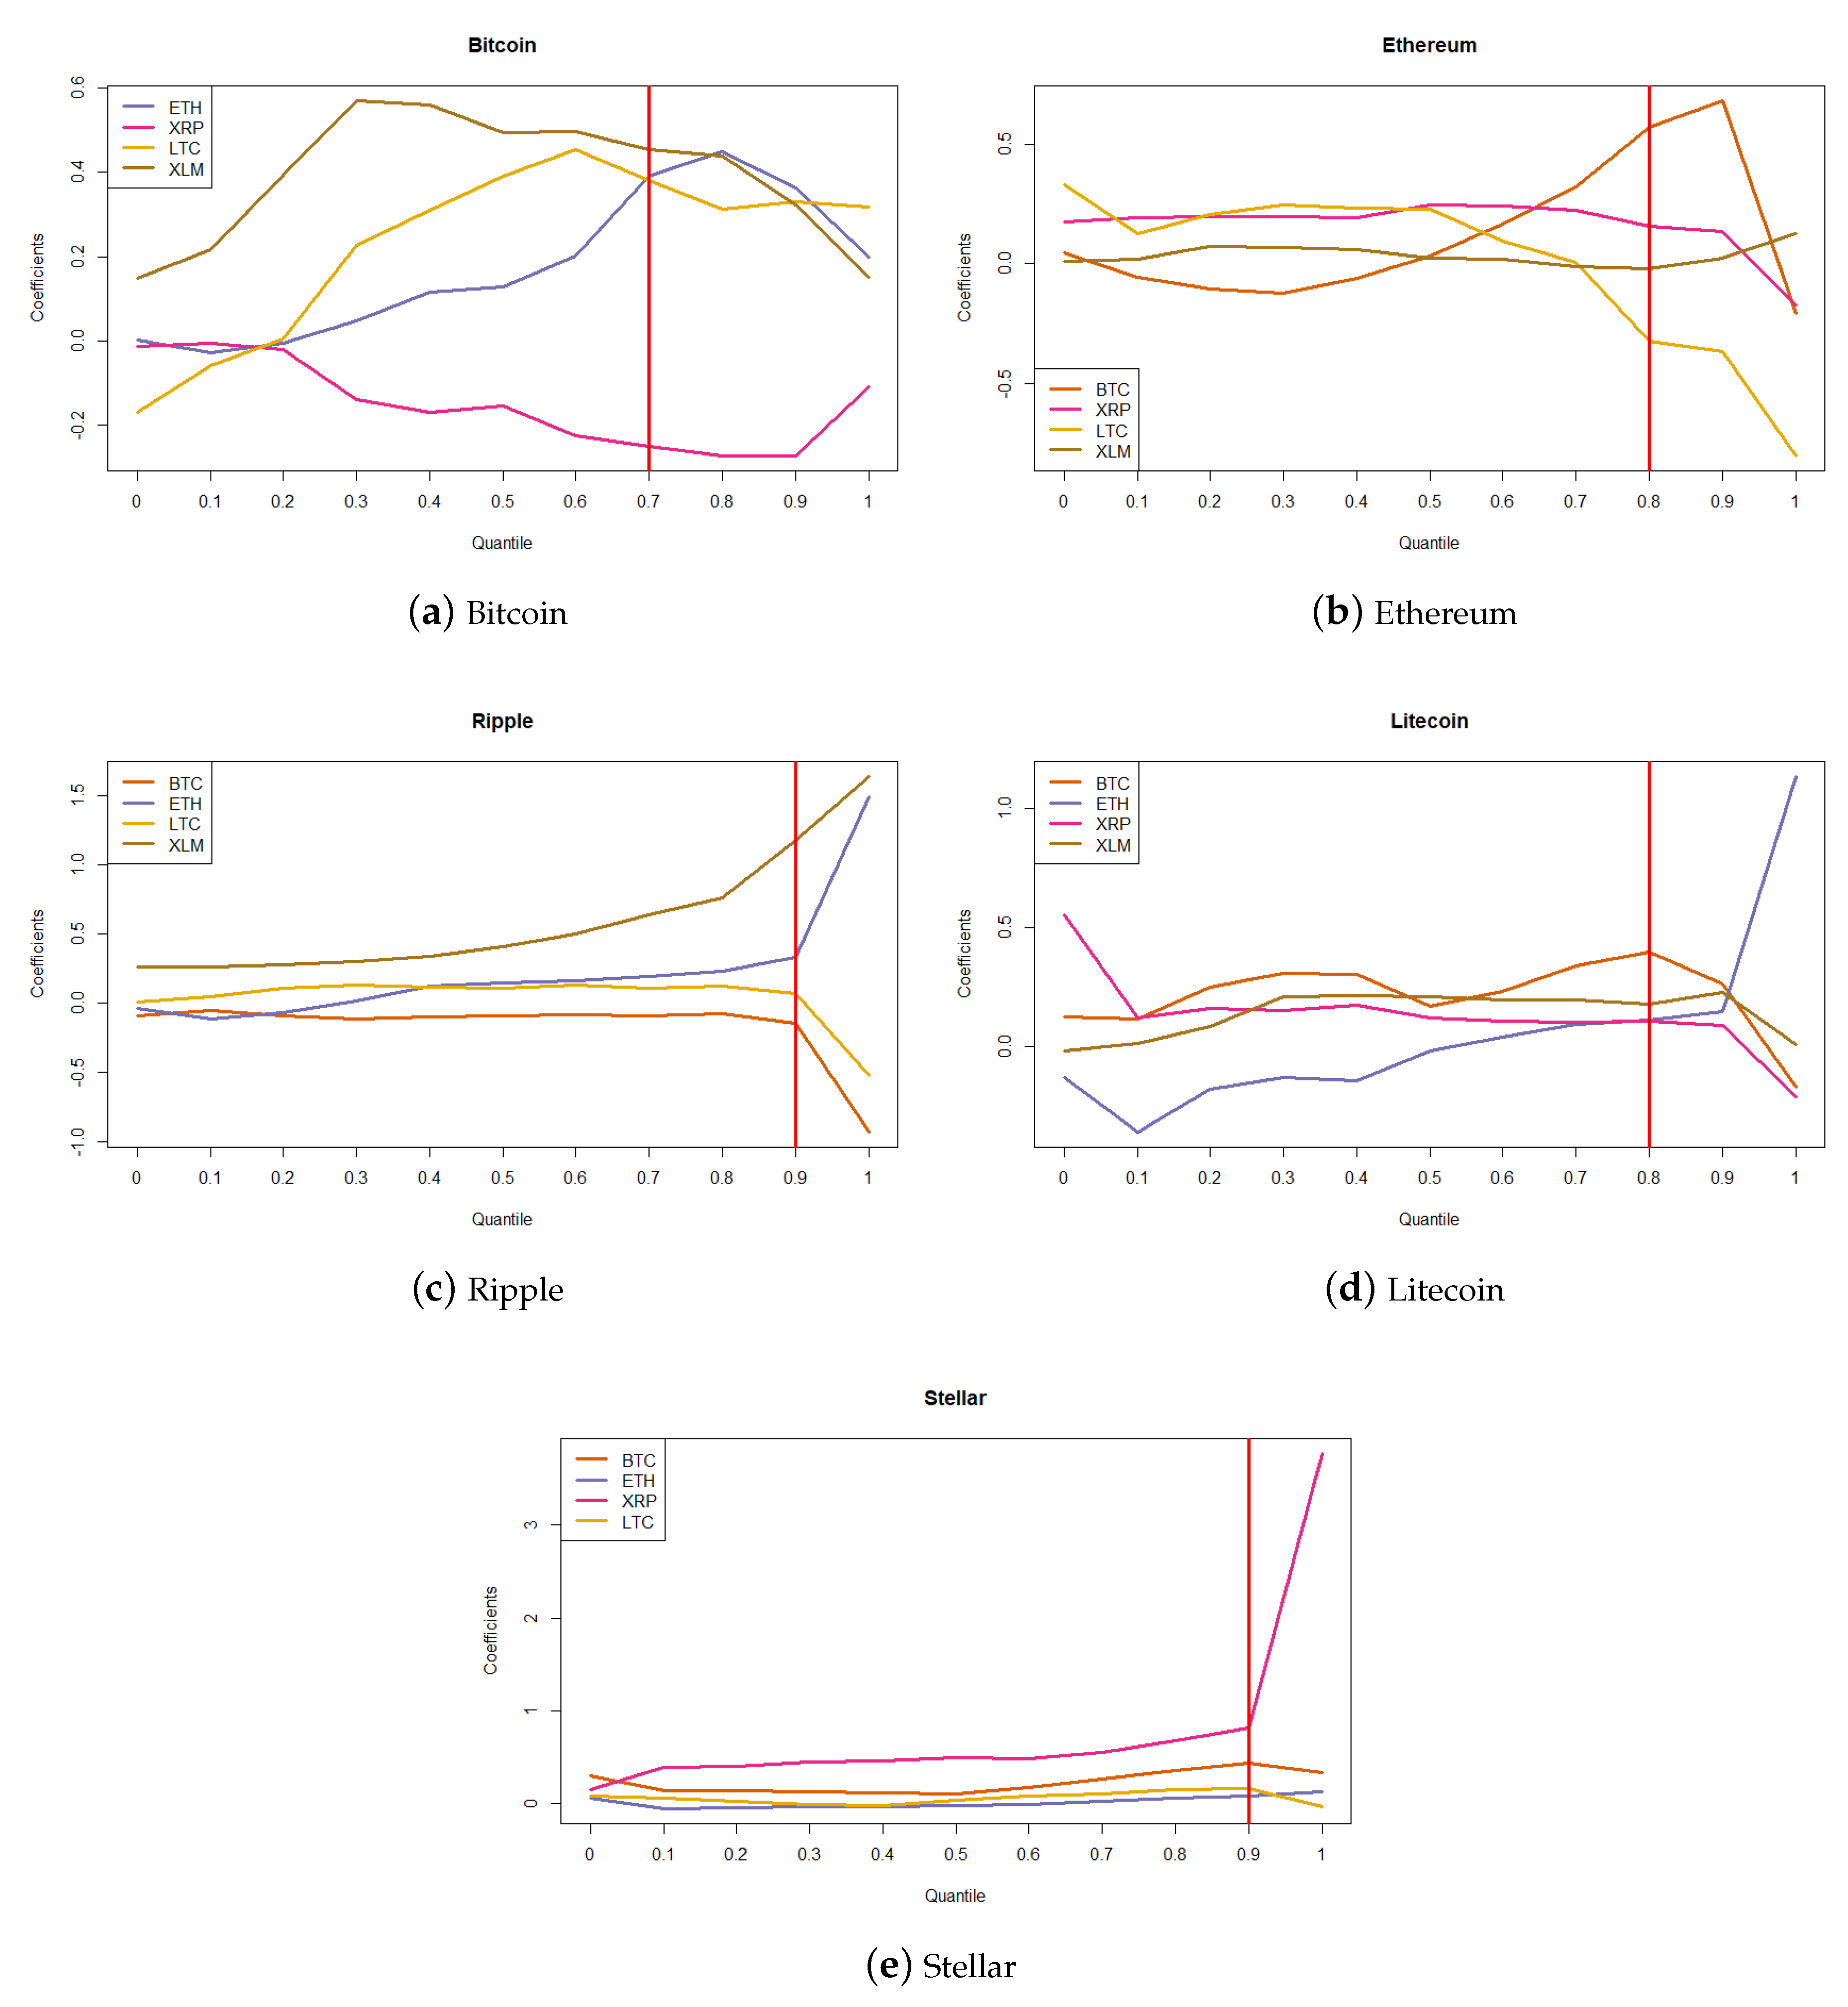
Figure 3 plots the estimated coefficients of the quantile model (seen in Equation (7)) for each cryptocurrency.
In each regression, the dependent variable is the ratio between the BSADF statistic and its critical value for a given asset, and the predictors are the same ratio for the other four. Thus, each plot depicts how the relationships between cryptoassets change depending on the phases of price behavior (from stationary or unit root to explosive). It can be noticed that during bubble periods (in all the plots, the red line marks the quantile from which the BSADF statistic indicates an explosive phase), Ethereum has an increasing positive impact on Ripple and Litecoin, whereas its effect on Bitcoin decreases after the 0.8 quantile. Another positive relationship is found between Ripple and Stellar, whose mutual effects increase during explosive phases. Some negative dependencies can also be noticed. In particular, Ripple has a negative impact on Bitcoin over all the price distribution and its effect on Ethereum and Litecoin becomes negative during explosive periods. Furthermore, not all the estimated effects increase in magnitude during bubbles. Indeed, the coefficients expressing dependence on Bitcoin and Litecoin decrease during explosive phases.
Table 2, Table 3, Table 4, Table 5 and Table 6, reporting the parameter estimates for each regression, confirm these findings and show that most effects between cryptoassets are statistically significant. In particular, the coefficients associated to the effect of Ethereum on all other cryptos, except for Stellar, decisively increase, moving from 50th to 90th percentile. Both the positive impact of Ripple on Stellar and the negative (and mutual) one of Ripple on Bitcoin show a sensitive increase in magnitude when considering the tail of the price explosivity distribution.
The performed quantile regression analysis does not give any indication about how co-explosivity on the cryptocurrency market changed during the analyzed period.
To take this aspect into account, we performed a rolling regression exercise. Specifically, for each rolling window (with a size of 30 days) starting from 24 February 2017 (the first date in which the BSADF statistic is available) we estimated the following regression model:
for , where is the ratio between the BSADF statistic and the corresponding critical value for the i-th cryptocurrency, each is the analogous ratio for the asset j, is a constant term and is a normally distributed error component.
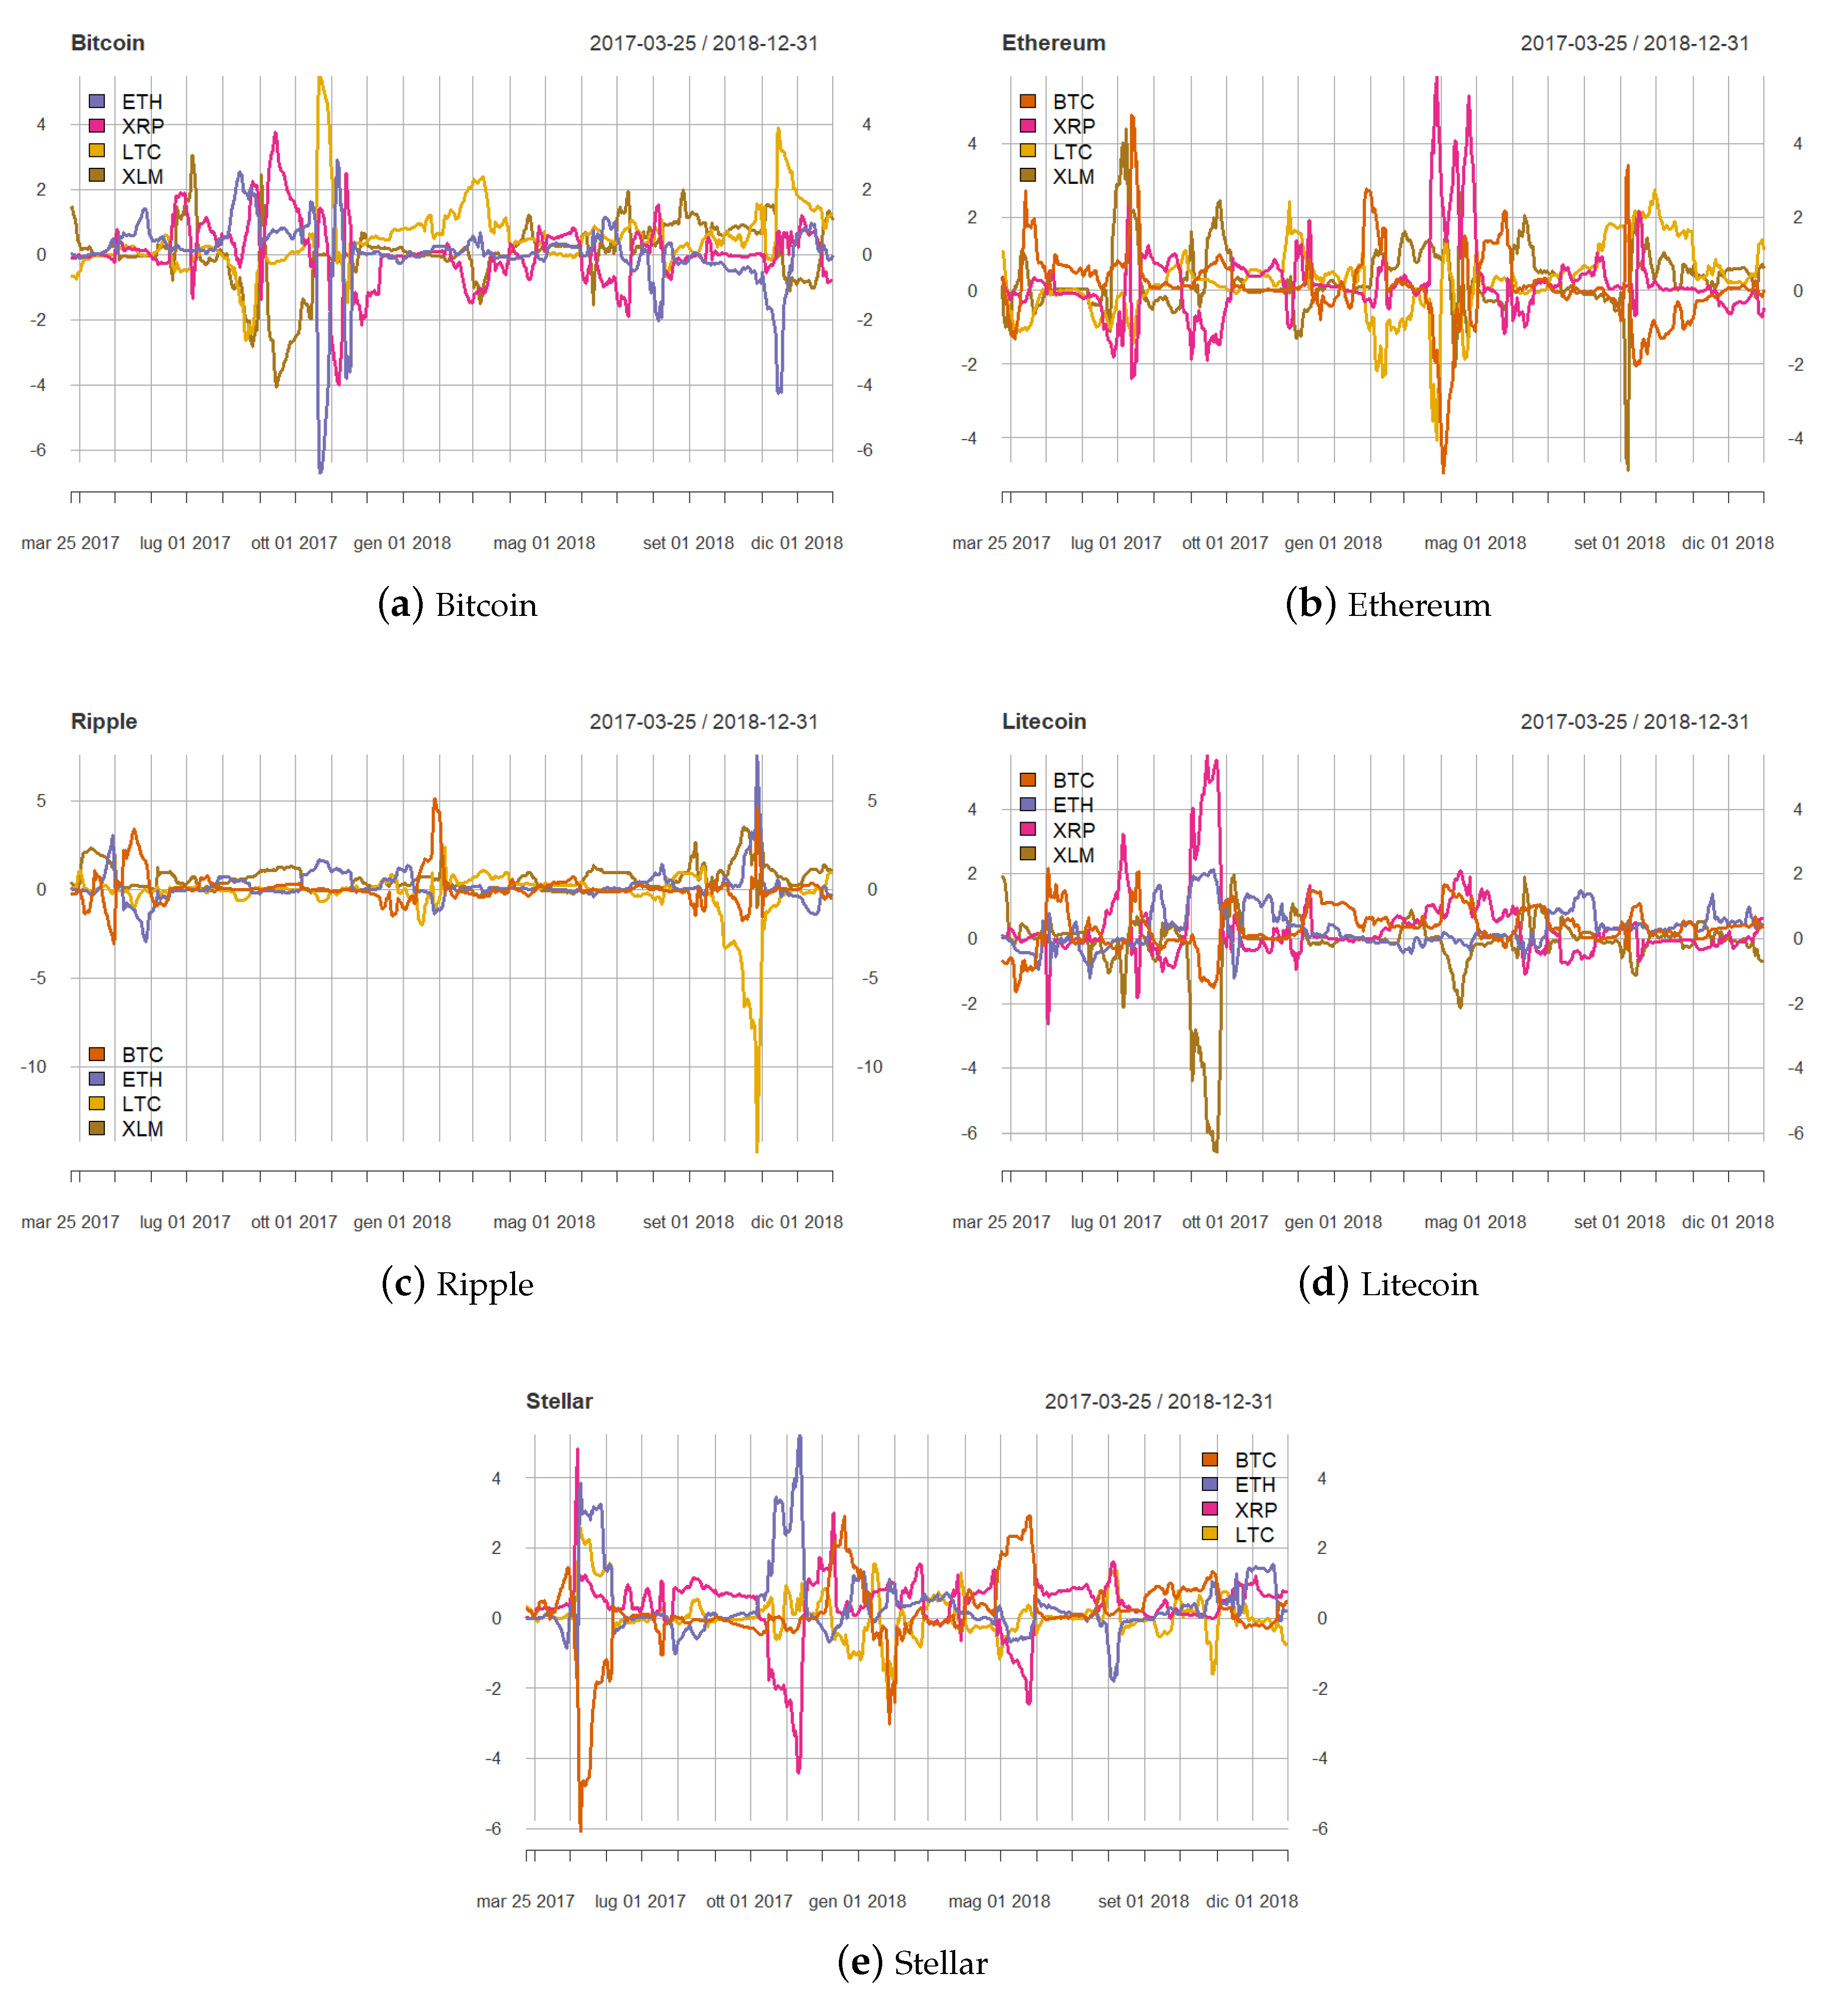
Figure 4 shows the estimated rolling coefficients.
Looking at Figure 4, the first consideration is that the estimated co-explosivity effects show high increases in magnitude during the detected bubble phases, but they are not all positive. The third and the last quarter of 2017 are the periods characterized by highest interdependence. Bitcoin is largely influenced by the other cryptocurrencies’ explosivity, especially by Litecoin and Ripple, in the last months of 2017, while the effect of Ethereum on Bitcoin is unstable, with negative peaks in November 2017 and November 2018. The negative dependence of Bitcoin on Ripple seems isolated to the end of 2017. In converse, dependence of the other cryptoassets on Bitcoin does not show a drastic increase during the explosive phase of late 2017. An increasing impact of Bitcoin on Ethereum and Litecoin is instead observed in the period August–September 2017, when a bubble phase in Bitcoin occurred following the cited hard fork. The high influence of Ethereum on the other assets’ explosivity, found in the previous analysis, is confirmed, and increases during the explosive phase of late 2017. The coefficients expressing dependence on Ripple are unstable and show sharp peaks in September 2017 (Bitcoin and Litecoin) and May–July 2018 (Ethereum). Some negative rolling coefficients can also be seen. Indeed, the estimated impact of Bitcoin and Litecoin on Ethereum becomes negative when the latter shows a short bubble period in spring 2018. Other negative coefficients during bubble periods are associated to the impact of Bitcoin on Stellar, and of Stellar on Litecoin.
To get a further insight of the extent to which co-explosivity in cryptocurrencies affects the risk of financial losses, we show the results obtained by estimating the model defined in Equation (8), where the dependent variable is a dummy taking value 1 when a bubble bursts in a given cryptocurrency and the predictors are analogous dummy variables based on the occurrence of bubble bursts in the other cryptoassets. The coefficients of the estimated logistic regressions are reported in Table 7.
It can be seen from Table 7 that in several cases the impact, always positive signed, of a bubble burst on the other cryptocurrencies’ probability of bubble burst is significant. In particular, the probability of bubble burst in Bitcoin increases with the occurrence of a bubble burst in Ethereum, and this relationship is found to be mutual, as the one with Litecoin. The positive dependence between Ripple and Stellar is significant, confirming the previous findings. The probability of bubble burst of Stellar also increases with the presence of a bubble burst in Ethereum, which is in converse affected by the collapse of bubbles in Stellar.
Overall, these results show that in several cases a bubble burst in an asset increases the probability of bubble burst in other assets in the cryptocurrency market, while no negative effects of a bubble burst on the probability of bubble burst of other cryptocurrencies are found.
4. Discussion
In this work, we tested the presence of bubbles in the five cryptocurrencies with largest capitalization and studied their co-movements in different phases of their price behavior, to verify possible co-explosivity effects.
First of all, our results show that several explosive periods occurred not only in Bitcoin, but also in other cryptoassets, reaching a similar conclusion to Bouri et al. (2019).
Our empirical study also confirms the presence of high interdependence in the cryptocurrency market found in other recent works, such as Corbet et al. (2018a) and Yi et al. (2018). While these studies focus on volatility spillover effects, we found significant relationships between the explosive behaviors of cryptocurrencies.
Based on our findings, the cryptocurrency that influences the others the most is Ethereum, whose positive-signed effects rapidly increase during bubble periods. Bitcoin is significant in explaining the other cryptocurrency price dynamics, but we found no strong evidence of an increase of its effect during explosive phases. Partly in contrast with what was found by Bouri et al. (2019), Bitcoin was found to be quite highly affected by other cryptoassets, and shows a negative link with Ripple. The negative mutual effect of Bitcoin on Ripple increases in magnitude during bubble periods. A possible explanation of these results is related to the different nature of the analyzed cryptocurrencies. While Bitcoin and Litecoin are actually pure financial assets, i.e., objects of speculative activity, Ethereum is the main technology for the creation of smart contracts, and this explains its centrality among service-based crypto instruments. Ripple and Stellar, which turned out to be strongly positive correlated, share the feature of being services platforms.
Overall, our findings show that the price dynamics of cryptocurrencies are highly interdependent, although the correlation is not always positive and not always increases during bubble periods. From a portfolio diversification perspective, a high interdependence may lead to an increasing risk exposure.
Furthermore, we performed a rolling regression analysis, showing that not all bubble periods in the cryptocurrency market were characterized by the same evidence of co-explosivity. In particular, the impact on Bitcoin on the other cryptoassets is not homogeneous over the analyzed sample and shows a peak following the fork of 1 August 2017, while in the bubble period of late 2017 the most central cryptoassets are Ethereum and Ripple.
Finally, we modeled the probability of a bubble burst of each cryptocurrency, using the occurrence of bubble bursts in the remaining cryptocurrencies as explanatory variables. We found that in several cases a bubble burst in an asset increases the probability of bubble burst in other assets in the cryptocurrency market. In particular, the interdependence between Ripple and Stellar is confirmed, as well as the fact that Bitcoin seems not more central than the other cryptoassets in bubble burst propagation. We did not find any significant negative effect on the probability of bubble burst, meaning that, in the analyzed sample, there is no evidence of potential advantages from diversification during the periods of bubble collapses, as they tend to occur simultaneously.
It is worth mentioning that our study is based on a unit root testing methodology which is known to be sensitive to misclassification of the data generating process in the null hypothesis, due to changes in trend and in the shock persistence. Further robustness checks should go in this direction.
Future research could investigate lagged effects in the cryptocurrency dynamics and the role of exogenous variables, such as volume and prices on other markets, in explaining explosive price behaviors.
Author Contributions
A.A. and A.C. contributed equally to this work. All authors have read and agreed to the published version of the manuscript.
Funding
This research receives no external funding.
Conflicts of Interest
The authors declare no conflict of interest.
References
- Bouri, Elie, Shahzad Jawad Hussain Shahzadb, and David Roubaud. 2019. Co-explosivity in the cryptocurrency market. Finance Research Letters 29: 178–83. [Google Scholar] [CrossRef]
- Brière, Marie, Kim Oosterlinck, and Ariane Szafarz. 2015. Virtual currency, tangible return: Portfolio diversification with bitcoin. Journal of Asset Management 16: 365–73. [Google Scholar] [CrossRef]
- Case, Karl E., and Robert J. Shiller. 2003. Is There a Bubble in the Housing Market? Brookings Papers on Economic Activity 2: 299–362. [Google Scholar] [CrossRef] [Green Version]
- Chen, Ying, Paolo Giudici, Branka Hadji Misheva, and Simon Trimborn. 2020. Lead behaviour in bitcoin markets. Risks 8: 4. [Google Scholar] [CrossRef] [Green Version]
- Cheung, Adrian, Eduardo Roca, and Jen-Je Su. 2015. Crypto-currency bubbles: An application of the Phillips–Shi–Yu (2013) methodology on Mt. Gox bitcoin prices. Applied Economics 47: 2348–58. [Google Scholar] [CrossRef] [Green Version]
- Corbet, Shaen, Andrew Meegan, Charles Larkin, Brian Lucey, and Larisa Yarovaya. 2018a. Exploring the dynamic relationships between cryptocurrencies and other financial assets. Finance Research Letters 165: 28–34. [Google Scholar]
- Corbet, Shaen, Brian Lucey, and Larisa Yarovaya. 2018b. Datestamping the Bitcoin and Ethereum bubbles. Finance Research Letters 26: 81–88. [Google Scholar] [CrossRef] [Green Version]
- Devenow, Andrea, and Ivo Welch. 1996. Rational herding in financial economics. European Economic Review 40: 603–15. [Google Scholar] [CrossRef]
- Diebold, Francis X., and Kamil Yılmaz. 2014. On the Network Topology of Variance Decompositions: Measuring the Connectedness of Financial Firms. Journal of Econometrics 182: 119–34. [Google Scholar] [CrossRef] [Green Version]
- Dreger, Dreger, and Yanqun Zhang. 2013. Is there a Bubble in the Chinese Housing Market? Urban Policy and Research 31: 27–39. [Google Scholar] [CrossRef] [Green Version]
- Eisl, Alexander, Stephan M. Gasser, and Karl Weinmayer. 2015. Caveat Emptor: Does Bitcoin Improve Portfolio Diversification? SSRN Electronic Journal. [Google Scholar] [CrossRef] [Green Version]
- Figà-Talamanca, Gianna, and Marco Patacca. 2019. Disentangling the relationship between Bitcoin and market attention measures. Journal of Industrial and Business Economics. [Google Scholar] [CrossRef]
- Fry, John, and Eng-Tuck Cheah. 2016. Negative bubbles and shocks in cryptocurrency markets. International Review of Financial Analysis 47: 343–52. [Google Scholar] [CrossRef]
- Giudici, Giancarlo, Alistair Milne, and Dmitri Vinogradov. 2019. Cryptocurrencies: Market analysis and perspectives. Journal of Industrial and Business Economics. [Google Scholar] [CrossRef] [Green Version]
- Giudici, Paolo, and Gloria Polinesi. 2019. Crypto price discovery through correlation networks. Annals of Operations Research. [Google Scholar] [CrossRef]
- Giudici, Paolo, and Iman Abu-Hashish. 2019. What determines bitcoin exchange prices? A network VAR approach. Finance Research Letters 28: 309–18. [Google Scholar] [CrossRef]
- Giudici, Paolo, and Paolo Pagnottoni. 2019a. High Frequency Price Change Spillovers in Bitcoin Markets. Risks 7: 111. [Google Scholar] [CrossRef] [Green Version]
- Giudici, Paolo, and Paolo Pagnottoni. 2019b. Vector error correction models to measure connectedness of Bitcoin exchange markets. Applied Stochastic Models in Business and Industry 36: 95–109. [Google Scholar] [CrossRef] [Green Version]
- Hassani, Hossein, Xu Huang, and Emmanuel Sirimal Silva. 2019. Blockchain and Cryptocurrency. In Fusing Big Data, Blockchain and Cryptocurrency. Cham: Palgrave Pivot. [Google Scholar]
- Li, Xin, and Chong Alex Wang. 2017. The technology and economic determinants of cryptocurrency exchange rates: The case of Bitcoin. Decision Support Systems 95: 49–60. [Google Scholar] [CrossRef]
- Phillips, Peter C. B., Yangru Wu, and Jun Yu. 2011. Explosive behavior in the 1990s NASDAQ: When did exuberance escalate asset values? International Economic Review 52: 201–26. [Google Scholar] [CrossRef] [Green Version]
- Phillips, Peter C. B., Shuping Shi, and Jun Yu. 2015. Testing for multiple bubbles: Historical episodes of exuberance and collapse in the S&P 500. International Economic Review 56: 1043–78. [Google Scholar]
- Steenkamp, Daan. 2018. Explosiveness in G11 currencies. Economic Modelling 68: 388–408. [Google Scholar] [CrossRef]
- Trueman, Brett. 1994. Analyst Forecasts and Herding Behavior. The Review of Financial Studies 7: 97–124. [Google Scholar] [CrossRef]
- Yi, Shuyue, Zishuang Xu, and Gang-Jin Wang. 2018. Volatility connectedness in the cryptocurrency market: Is Bitcoin a dominant cryptocurrency? International Review of Financial Analysis 60: 98–114. [Google Scholar] [CrossRef]
| 1. | The BSADF statistic was calculated using the MultipleBubbles R package. The number of lags in the recursive ADF regression was selected through the Bayesian information criteria (BIC). |
| 2. | |
| 3. | Note that the first available value refers to 24 February 2017, that is the end of a 55 day time window, starting from the first observation in the dataset. |
Figure 1.
Daily price time series of the five analyzed cryptocurrencies in the period from January 2017 to December 2018.
Figure 1.
Daily price time series of the five analyzed cryptocurrencies in the period from January 2017 to December 2018.

Figure 2.
Backward supremum augmented Dickey–Fuller (BSADF) statistic (black) and corresponding critical values (red) for each of the five analyzed cryptocurrencies in the 2017–2018 period; the gray lines mark the dates in which the return was lower than the first percentile of the sample distribution of returns.

Figure 3.
Estimated interdependencies in the cryptocurrency market: each subplot depicts the estimated coefficients of a quantile regression model where the dependent variable is the ratio between the BSADF statistic and the corresponding critical values for a given cryptocurrency, and the independent variables are the same ratio for the other four (BTC = Bitcoin; ETH = Ethereum; XRP = Ripple; LTC = Litecoin; XLM = Stellar). The red line marks the quantile from which the BSADF statistic indicates the presence of a bubble.

Figure 4.
Estimated coefficients of linear regressions where the dependent variable is the ratio between the BSADF statistic and its critical value for a given cryptocurrency, and the explanatory variables are the same ratio for the other four; the analysis was performed using rolling windows with a size of 30 days. (BTC = Bitcoin; ETH = Ethereum; XRP = Ripple; LTC = Litecoin; XLM = Stellar).


Table 1.
Number of days per quarter characterized by explosive price behavior according to the BSADF test for the five analyzed cryptocurrencies (BTC = Bitcoin; ETH = Ethereum; XRP = Ripple; LTC = Litecoin; XLM = Stellar).
Table 1.
Number of days per quarter characterized by explosive price behavior according to the BSADF test for the five analyzed cryptocurrencies (BTC = Bitcoin; ETH = Ethereum; XRP = Ripple; LTC = Litecoin; XLM = Stellar).
| Period | BTC | ETH | XRP | LTC | XLM | Total |
|---|---|---|---|---|---|---|
| 2017 Q1 | 6 | 31 | 4 | 1 | 0 | 36 |
| 2017 Q2 | 35 | 44 | 22 | 45 | 15 | 161 |
| 2017 Q3 | 24 | 0 | 0 | 13 | 0 | 37 |
| 2017 Q4 | 58 | 18 | 15 | 27 | 33 | 151 |
| 2018 Q1 | 2 | 23 | 8 | 0 | 10 | 43 |
| 2018 Q2 | 0 | 6 | 0 | 0 | 0 | 6 |
| 2018 Q3 | 0 | 8 | 0 | 1 | 0 | 9 |
| 2018 Q4 | 11 | 1 | 0 | 9 | 0 | 21 |
| Total | 136 | 131 | 49 | 96 | 58 | 470 |
Table 2.
Bitcoin: results of quantile regression on the BSADF statistic (ETH = Ethereum; XRP = Ripple; LTC = Litecoin; XLM = Stellar). In all tables, *, ** and *** denote 10%, 5% and 1% significance, respectively.
Table 2.
Bitcoin: results of quantile regression on the BSADF statistic (ETH = Ethereum; XRP = Ripple; LTC = Litecoin; XLM = Stellar). In all tables, *, ** and *** denote 10%, 5% and 1% significance, respectively.
| Estimate | Std. Error | Estimate | Std. Error | Estimate | Std. Error | |
|---|---|---|---|---|---|---|
| (Intercept) | −1.111 *** | 0.019 | −0.004 | 0.051 | 1.656 *** | 0.065 |
| ETH | −0.027 *** | 0.011 | 0.130 *** | 0.029 | 0.365 *** | 0.037 |
| XRP | −0.005 | 0.014 | −0.155 *** | 0.037 | −0.272 *** | 0.048 |
| LTC | −0.057 *** | 0.013 | 0.391 *** | 0.035 | 0.331 *** | 0.045 |
| XLM | 0.217 *** | 0.013 | 0.495 *** | 0.034 | 0.323 *** | 0.044 |
Table 3.
Ethereum: results of quantile regression on the BSADF statistic (BTC = Bitcoin; XRP = Ripple; LTC = Litecoin; XLM = Stellar).
Table 3.
Ethereum: results of quantile regression on the BSADF statistic (BTC = Bitcoin; XRP = Ripple; LTC = Litecoin; XLM = Stellar).
| Estimate | Std. Error | Estimate | Std. Error | Estimate | Std. Error | |
|---|---|---|---|---|---|---|
| (Intercept) | −0.674 *** | 0.017 | 0.024 | 1.921 *** | 0.180 | |
| BTC | −0.055 *** | 0.013 | 0.033 * | 0.019 | 0.685 *** | 0.136 |
| XRP | 0.193 *** | 0.013 | 0.248 *** | 0.018 | 0.138 | 0.133 |
| LTC | 0.128 *** | 0.013 | 0.230 *** | 0.018 | −0.369 *** | 0.129 |
| XLM | 0.019 | 0.012 | 0.017 | 0.023 | 0.127 | |
Table 4.
Ripple: results of quantile regression on the BSADF statistic (BTC = Bitcoin; ETH = Ethereum; LTC = Litecoin; XLM = Stellar).
Table 4.
Ripple: results of quantile regression on the BSADF statistic (BTC = Bitcoin; ETH = Ethereum; LTC = Litecoin; XLM = Stellar).
| Estimate | Std. Error | Estimate | Std. Error | Estimate | Std. Error | |
|---|---|---|---|---|---|---|
| (Intercept) | −1.149 *** | 0.036 | −0.472 *** | 0.012 | 0.868 *** | 0.031 |
| BTC | −0.051 * | 0.028 | −0.092 *** | 0.009 | −0.147 *** | 0.024 |
| ETH | −0.115 *** | 0.021 | 0.144 *** | 0.007 | 0.329 *** | 0.018 |
| LTC | 0.048 * | 0.027 | 0.109 *** | 0.009 | 0.068 *** | 0.022 |
| XLM | 0.265 *** | 0.022 | 0.408 *** | 0.007 | 1.173 *** | 0.018 |
Table 5.
Litecoin: results of quantile regression on the BSADF statistic (BTC = Bitcoin; ETH = Ethereum; XRP = Ripple; XLM = Stellar).
Table 5.
Litecoin: results of quantile regression on the BSADF statistic (BTC = Bitcoin; ETH = Ethereum; XRP = Ripple; XLM = Stellar).
| Estimate | Std. Error | Estimate | Std. Error | Estimate | Std. Error | |
|---|---|---|---|---|---|---|
| (Intercept) | −1.198 *** | 0.040 | 0.069 *** | 0.033 | 1.225 *** | 0.084 |
| BTC | 0.116 *** | 0.029 | 0.171 *** | 0.024 | 0.263 *** | 0.062 |
| ETH | −0.358 *** | 0.023 | 0.019 | 0.149 *** | 0.048 | |
| XRP | 0.122 *** | 0.029 | 0.119 *** | 0.024 | 0.062 | |
| XLM | 0.012 | 0.027 | 0.208 *** | 0.022 | 0.228 *** | 0.057 |
Table 6.
Stellar: results of quantile regression on the BSADF statistic (BTC = Bitcoin; ETH = Ethereum; XRP = Ripple; LTC = Litecoin).
Table 6.
Stellar: results of quantile regression on the BSADF statistic (BTC = Bitcoin; ETH = Ethereum; XRP = Ripple; LTC = Litecoin).
| Estimate | Std. Error | Estimate | Std. Error | Estimate | Std. Error | |
|---|---|---|---|---|---|---|
| (Intercept) | −1.006 | 0.018 | −0.403 | 0.030 | 0.777 | 0.034 |
| BTC | 0.143 | 0.013 | 0.111 | 0.023 | 0.434 | 0.026 |
| ETH | −0.056 *** | 0.010 | 0.018 | 0.078 | 0.020 | |
| XRP | 0.390 | 0.011 | 0.500 *** | 0.019 | 0.813 *** | 0.021 |
| LTC | 0.060 *** | 0.013 | 0.035 * | 0.021 | 0.169 *** | 0.024 |
Table 7.
Estimated coefficients of logistic regressions where the dependent variable (rows) is a binary variable that takes the value of 1 when a bubble bursts, and 0 otherwise; each regressor (columns) is a binary variables taking value 1 if a bubble burst is observed in another cryptocurrency (BTC = Bitcoin; ETH = Ethereum; XRP = Ripple; LTC = Litecoin; XLM = Stellar).
| BTC | ETH | XRP | LTC | XLM | |
|---|---|---|---|---|---|
| BTC | - | 2.320 ** | −1.397 | 2.687 *** | −1.496 |
| ETH | 2.337 ** | - | 1.121 | 0.169 | 2.426 * |
| XRP | −1.437 | 1.113 | - | −1.408 | 3.543 *** |
| LTC | 2.687 *** | 0.162 | −1.308 | - | −1.330 |
| XLM | −1.532 | 2.407 * | 3.543 *** | −1.446 | - |
© 2020 by the authors. Licensee MDPI, Basel, Switzerland. This article is an open access article distributed under the terms and conditions of the Creative Commons Attribution (CC BY) license (http://creativecommons.org/licenses/by/4.0/).
Share and Cite
MDPI and ACS Style
Agosto, A.; Cafferata, A. Financial Bubbles: A Study of Co-Explosivity in the Cryptocurrency Market. Risks 2020, 8, 34. https://doi.org/10.3390/risks8020034
AMA Style
Agosto A, Cafferata A. Financial Bubbles: A Study of Co-Explosivity in the Cryptocurrency Market. Risks. 2020; 8(2):34. https://doi.org/10.3390/risks8020034
Chicago/Turabian StyleAgosto, Arianna, and Alessia Cafferata. 2020. "Financial Bubbles: A Study of Co-Explosivity in the Cryptocurrency Market" Risks 8, no. 2: 34. https://doi.org/10.3390/risks8020034
Note that from the first issue of 2016, this journal uses article numbers instead of page numbers. See further details here.