
Co-Movement and Performance Comparison of Conventional and Islamic Stock Indices during the Pre- and Post-COVID-19 Pandemic Era

Department of Business Administration, National Chung Cheng University, Chiayi 621301, Taiwan
*
Author to whom correspondence should be addressed.
Risks 2023, 11(8), 146; https://doi.org/10.3390/risks11080146
Submission received: 5 June 2023
/
Revised: 2 August 2023
/
Accepted: 4 August 2023
/
Published: 9 August 2023
Abstract
:This study conducts a comparative analysis of the performance of Islamic and conventional indices in both developed and developing countries and territories, considering the pre- and post-COVID-19 pandemic periods. The research employs performance index tools and time–frequency wavelet-based analysis to assess how the COVID-19 pandemic affected the performance, volatility, and co-movement of Islamic and conventional stock indices. The findings reveal that Islamic stock indices are more resilient and tend to outperform conventional stocks during crisis periods in both developed and developing countries and territories, and this trend holds true in the long and short term across most countries. The analysis of wavelet coherence indicates a strong co-movement and coherence between Islamic and conventional indices. Furthermore, the study reveals that in developing countries and territories, the co-movement is characterized by weak coherence and high volatility compared to developed countries and territories. The study highlights the significance of Islamic indices as safe havens for investors during times of crisis, suggesting that including Islamic equities in investment portfolios can potentially yield higher returns compared to conventional indices. This research holds practical value for individual traders involved in the online trading of global stock indices, aiding them in constructing and designing internationally diversified portfolios. Unlike previous studies that focused on specific countries and territories and indices, this study offers a comprehensive examination of the behavior of Islamic and conventional indices across major global markets during both crisis and noncrisis periods. The results contribute significantly to the existing literature and offer valuable insights for investors.
Keywords:
Islamic stock indices; COVID-19; market performance; financial crisis; investment analysisJEL Classification:
G11; G14; G151. Introduction
Islamic finance encompasses financial activities such as Islamic banking, Islamic insurance (Takaful), and Sharia-compliant credit, all adhering strictly to Islamic law (Sharia law)1. The term also includes Sharia-compliant investments and broader capital and equity markets. While these practices have historical roots, formal institutional Islamic finance only emerged in the twentieth century. S&P Global Ratings predicts that the global Islamic finance industry will grow from 10% to 12% during 2021–2022. This growth can be attributed to the rapid expansion of Sukuk issuances, particularly those exceeding maturities, which have contributed to the increase in Islamic banking assets in certain Gulf Cooperation Council (GCC) countries, Malaysia, and Turkey. Remarkably, Islamic finance experienced significant expansion in 2020, with total assets increasing by 10.6%, despite the severe economic impact of the COVID-19 pandemic and the decline in oil prices.
The Islamic finance industry consists of over 1400 institutions spread across 80 countries and territories. Its fundamental principle is profit-and-loss sharing, ensuring that returns are tied to proper risk sharing. Unlike conventional financial systems, which rely on interest rates and the time value of money, Islamic finance operates on an asset-based system that prioritizes profit generation. Notably, Islamic financial instruments undergo Shariah (Islamic law) screening2, setting them apart from conventional counterparts. The FTSE Shariah screening process can differentiate Islamic financial firms or Shariah firms from conventional ones.
As mentioned earlier, Islamic financial assets encompass various instruments, with banks and equities being particularly dynamic elements. However, the Islamic equity market holds special significance within the realm of Islamic finance. To ensure compliance with Shariah law, Islamic equity investments are subject to Shariah-compliant screening procedures. The primary screening method is qualitative in nature, focusing on adherence to Islamic investment principles. This involves excluding stocks of companies involved in activities such as alcohol, tobacco, pork, gambling, interest-based finance, and non-Shariah-compatible entertainment. By doing so, it determines whether a specific firm is considered halal (i.e., permissible) or haram (i.e., prohibited) for investment (Derigs and Marzban 2008). The second screening method is quantitative, utilizing financial ratios to identify and eliminate companies that generate a significant portion of their revenues from non-Shariah-compliant activities, such as interest-based borrowing and lending or holding a large proportion of assets in liquid form. As a result, this process filters firms under heavy debt, leading to a smaller but more stable universe of Sharia-compliant investment opportunities (Hussein and Omran 2005).
Previous research on Islamic equity markets often centered around comparative analyses between Islamic and conventional equities, driven by the decoupling hypothesis (Dharani et al. 2019; Jawadi et al. 2020; Umar 2017; Umar and Gubareva 2020). This hypothesis suggests that Islamic equity investments may demonstrate distinct behaviors and characteristics compared to conventional investments, further underscoring the unique nature of the Islamic equity market.
Islamic finance operates on a central principle of profit-and-loss sharing, which means that any returns earned must be tied to actual risk sharing. This sets it apart from conventional financial systems that primarily rely on interest rates and the time value of money. In Islamic finance, the focus is on an asset-based system that emphasizes profit sharing instead of interest income, thus promoting investments in the real economy. The growth of the Islamic finance industry received a significant boost because of the relatively moderate impact of the 2008 Global Financial Crisis (GFC) on Islamic finance assets (Kayed and Hassan 2011). This was attributed to factors like the cautious use of risky asset classes and the prohibition of speculative practices within the industry. As a result, Islamic financial assets performed better during the 2008 GFC compared to their conventional counterparts (Ho et al. 2014; Shahzad et al. 2017).
After the 2008 Global Financial Crisis, the COVID-19 pandemic was the biggest crisis that affected the whole economic system of the world, and the aftershocks were more severe than the Global Financial Crisis3. The COVID-19 pandemic, first noted in early 2020, has led to turbulence in global financial markets. American stock markets experienced circuit breakers twice in one week, and markets in other major countries and territories were affected as well. Many studies concluded that stock market turbulence due to the COVID-19 pandemic was the same or more severe than during the 2008 financial crisis. In late February and early March 2020, financial markets experienced a period of risk aversion characterized by a significant surge in volatility. During this time, stock markets witnessed a rapid decline, with their market value plummeting by approximately 30% within a few weeks. The sell-off was even more rapid than what was observed during the global financial crisis of 2008. The COVID-19 pandemic had a strong negative impact on stock markets, prompting a need for assessment by both investors and academia. However, after the announcement of bailout programs, some level of market recovery was observed (Rahman et al. 2020).
Amid the recent pandemic crisis, investors and policymakers are actively seeking safe havens to find refuge and protection in the financial markets. Safe havens are assets that exhibit little to no correlation, or even a negative correlation, with other assets or portfolios during specific periods, especially in times of crisis (Baur and McDermott 2010; Baur and Lucey 2010). To mitigate the risk of losses during times of high uncertainty, equity investors often turn to traditional safe-haven assets like gold (Baur and McDermott 2010; Baur and Lucey 2010) and cryptocurrencies (Feng et al. 2018). However, empirical evidence shows that even these well-known safe havens, such as gold and cryptocurrencies, did not entirely shield investors from the impacts of the COVID-19 pandemic (Conlon and McGee 2020; Conlon et al. 2020). Despite their reputation, they faced challenges during this crisis. Interestingly, research during the Global Financial Crisis (GFC) indicated that Islamic stocks performed favorably as a safe haven compared to conventional stocks (Hkiri et al. 2017; Aloui et al. 2018), highlighting the potential resilience of Islamic stocks for investors during periods of market turmoil.
This study investigated differences in the performance and volatility between conventional and Islamic stock indices worldwide. First, this study adds to the literature in several ways: it is the first study to use a wavelet-based model for examining both Islamic and conventional stock indices worldwide during the COVID-19 period (crisis) and pre-COVID-19 (pre-crises) period; previous studies, as mentioned above, either performed short-term studies during crises or only conducted investigations during prosperous times. Second, this study is the first to examine and compare the performance and volatility of Islamic and conventional stock indices in developed and developing countries and territories. Previous studies focused on large indices, such as the Dow Jones, Dow Jones Islamic, S&P 500, and FTSE Islamic, while we examined country-by-country indices and divided them into developed and developing countries to obtain more insight into the indices in each country and region separately, which can be a good addition to the literature on investment. The results tell us more about the behavior of Islamic stock indices in different economies which, in turn, can help investors and portfolio managers in designing their global portfolios.
2. Literature Review
In this section, we review previous research that focused on comparing the performance and co-movements of Islamic and conventional stock indices, with a particular emphasis on the period following the 2008 Global Financial Crisis (GFC). Several authors have conducted studies aimed at assessing the performance of Islamic and conventional stocks, leading to diverse outcomes. For instance, Narayan and Bannigidadmath (2015), Aloui et al. (2018), Milly and Sultan (2012), Abdullah et al. (2007), Azad et al. (2018), and Ebrahim et al. (2016) have put forth arguments suggesting that Islamic stocks have shown better performance than their conventional counterparts during various timeframes. Additionally, researchers have explored the concept of decoupling and co-movements between Islamic and financial indices. As an example, Hkiri et al. (2017) examined the hypothesis of decoupling Islamic and conventional stock indices during different crisis periods experienced in diverse regions, including Asia, Russia, Argentina, Brazil, and the United States. Their findings demonstrate the existence of a contagion effect, indicating that Islamic indices tend to decouple from their conventional counterparts during periods of financial turmoil. On the other hand, some studies argue that Islamic equity funds do not underperform in comparison to that of their conventional counterparts (Kraeussl and Hayat 2011), while Albaity and Ahmad (2008) argue that Islamic equity indices have no significant edge in return over conventional ones.
Some studies argue that because of crises, the volatility in the market increases, and there exist chances for integration and decoupling between Islamic and conventional stock indices. But there are different views on this. In 2016, Majdoub et al. found strong cointegration between Islamic and conventional stock markets in France, Indonesia, the UK, and the US but not in the UK. They also observed significant correlations in developed countries. In 2018, Cevik and Bugan revealed a nonlinear relationship between these markets, with conventional markets impacting Islamic ones during bear and bull market periods. In summary, Majdoub et al. (2016) identified long-term relationships in specific countries, while Cevik and Bugan (2018) emphasized the nonlinear and market-dependent nature of the Islamic–conventional stock market relationship. However, the study found that conventional stock markets affect Islamic stock markets during bearish and bullish market. Jebran et al. (2017) and Majdoub et al. (2016) argued that the two markets (conventional and Islamic) are co-integrated, and that Islamic indices receive spillover effects from conventional indices. More recent studies, on the other hand, including by Abu-Alkheil et al. (2017), Hkiri et al. (2017), and Saadaoui et al. (2017), found evidence of the decoupling of Islamic stocks from their conventional counterparts, especially during periods of market instability. Hoque et al. (2016), on the other hand, argue that as the Islamic index is a part or subset of the main index, therefore, the news, which has a positive or negative impact on the market, will have the same impact on both Islamic and conventional indices.
Several recent studies have used the wavelet coherence approach, which is novel in the field of economics. For example, Dewandaru et al. (2014) identified multiscale relationships between Islamic and conventional stock markets, which intensify during crises. Rivzi et al. (2015), using the same approach, found evidence of a fundamental contagion effect in Asia and a pure contagion effect between Asia and the US in early 2000.
The recent literature delves into how the COVID-19 pandemic impacts both Islamic and conventional stock indices. Baker et al. (2020) assert that its effect surpasses that of previous outbreaks like the Spanish flu. However, there are conflicting findings. For instance, Sharif et al. (2020) discover a potent impact when combined with oil volatility shocks. Yan et al. (2020) investigate various industries’ responses to the outbreak, observing short-term panic selloffs but anticipating long-term market corrections. Liu et al. (2020) contend that the Asian stock market swiftly reacted to the pandemic, with a partial recovery in the later stage of the outbreak. Sansa (2020) focuses on the impact of COVID-19 on Chinese and US markets during March 2020, revealing a significant positive association between confirmed COVID-19 cases and both countries’ markets. Furthermore, Ngwakwe (2020) examines the COVID-19 impact on Chinese, European, and US markets using a paired t-test of mean stock prices during the pandemic period (−50, +50 days). The results indicated an increase in mean stock values for the Chinese stock index, surpassing normal levels. In contrast, the Dow Jones Industrial experienced a significant decrease during the pandemic period. However, no differences in mean stock values before and during the pandemic were observed for the S&P 500 and Euronext 100 indices.
Overall, the recent literature highlights the complex and multifaceted influence of the COVID-19 pandemic on global stock markets, with varying short-term and long-term effects observed across different regions and industries.
Yarovaya et al. (2021) studied the resilience property of Islamic equity funds during the COVID-19 pandemic. The study found that Islamic funds outperformed their conventional counterparts during the peak months of the COVID-19 pandemic and, thus, proved to be more resilient to COVID-19 shocks. While analyzing the relationship between COVID-19 and stock prices, Ramelli and Wagner (2020) suggest that high levels of corporate debt and liquidity problems are the main drivers of volatility in the stock market. As we know Islamic stocks have lower leverage because of Shariah screening requirements, they are still expected to be more immune to market risks during turbulent periods compared to their conventional counterparts. Interestingly, Pagano et al. (2020) found that more resilient companies greatly outperformed less resilient companies. They define pandemic resilience as robust social distancing that relies on technologies and/or organizational structures. The cumulative return for resilient firms’ differential from 2014 to 2019 was of the same magnitude as during the pandemic. Hasan et al. (2021) examined the performance of the Dow Jones and FTSE indices (conventional and Islamic) during the first 10 months of COVID-19 and found there was high co-movement and decoupling between the two types of indices, and they also claim that Islamic stocks did not provide any shelter to investors against risk during the financial crisis. Saleem et al. (2023) examined the hedging risk characteristics of gold and Sharia complaints during the COVID-19 pandemic and found that gold and Sharia-compliant stocks can hedge risk during periods of market recession.
Yarovaya et al. (2021) studied Islamic equity funds’ resilience during the COVID-19 pandemic and found that they outperformed conventional funds during the peak months, indicating greater resilience. Ramelli and Wagner (2020) attributed stock market volatility during the pandemic to high corporate debt and liquidity issues. Islamic stocks, with lower leverage due to Shariah requirements, were found to be more immune to market risks during turbulent times. Pagano et al. (2020) discovered that companies demonstrating pandemic resilience also performed better overall. Resilience was defined as implementing robust social distancing measures using technology and organizational structures. The cumulative return for resilient firms in the years leading up to the pandemic was comparable to their performance during the pandemic. Hasan et al. (2021) analyzed the performance of the Dow Jones and FTSE indices (both conventional and Islamic) during the first 10 months of the pandemic. They found a high degree of co-movement and decoupling between the two types of indices. However, they argued that Islamic stocks did not provide significant protection to investors during the financial crisis. Saleem et al. (2023) investigated the hedging risk characteristics of gold and Sharia-compliant stocks during the pandemic and found evidence that both could effectively hedge risk during market recession. Hasan et al. (2023) examined the different asset classes during crisis periods and found that gold and Islamic stock can better hedge various uncertainty factors than Bitcoin and crude oil, depending on the market conditions.
Following the existing literature, we fulfill this gap by comparing and evaluating the performance of conventional and Islamic stock indices worldwide, covering major stock indices of the world. This study investigated whether there is any difference between the performance of both indices before and after the outbreak of the COIVD-19 pandemic. All of the previous studies mentioned in the literature focused on either crises or prosperous periods and examined short-term periods. We examined both crises, pre-crises, and post-crises periods. We divided the countries and territories into two groups, developed and developing countries and territories, and examined their performance using performance index ratios and a time–frequency wavelet-based model to evaluate, in detail, the co-movement and coherence between conventional and Islamic indices. Using wavelets, we determined the difference in the coherence and co-movements between Islamic and conventional indices in developed and developing countries and territories.
This study is the first to examine worldwide stock markets during pre- and post-pandemic times. Also, it is the first to use performance index tools and wavelet methodology to examine all of the major stock indices worldwide.
3. Data
This study used daily stock returns starting from 1 January 2019 to 31 December 2021. Our data comprised three periods: first, a pre-pandemic period, which was from 1 January to 31 December 2019, and the second and third periods were the pandemic era, which were the years 2020 and 2021. The study collected data from the “Eikon Data Stream”. There are 32 countries and territories and 34 indices in our data. The countries and territories are divided into two groups: developed and developing. Each country or territory has two indices: one conventional and one Islamic. We chose two conventional indices from the US and China. We chose the main index of each country and then the local Islamic index. If there was no local Islamic stock index, then we chose the FTSE Islamic index for that country.
A detailed list of countries and their indices is provided in Table 1A,B.
4. Methodology
First, we calculated the log return values for stocks daily.
Then, we used performance index ratios to examine the performance and wavelet coherence analysis to examine the co-movement and interdependency of both Islamic and financial indices. We followed Al-Yahyaee et al. (2020) in applying the performance index tools.
4.1. Performance Index Tools
4.1.1. Sharpe Ratio
To evaluate the risk-adjusted return of Islamic indices in comparison to their conventional counterparts, we conducted Sharpe ratio tests for both indices. The first performance measurement tool is the Sharpe ratio (1966). This ratio measures the average risk premium (the difference between the asset’s return, and the risk-free rate ) relative to the asset’s total risk, σ
While Ri,t is the stock index return, Rf,t is the risk-free rate, and σ is the index risk or standard deviation of the index.
4.1.2. Alpha Ratio
In 1986, Jensen applied this model to develop the alpha of the Jensen model, expressed as follows:
The index calculates the Jensen alpha (α) adjusted for the i.i.d. error (εi,t) and the market risk premium (RM,t − Rf,t).
The alpha ratio measures the amount that the investment has returned compared to the market index or other broad benchmarks it is compared against.
4.1.3. Omega Ratio
The third performance measurement tool is the omega ratio. Keating and Shadwick (2002) developed an omega performance ratio (Ω), defined as a weighted risk-return ratio for a given expected return level that helps us identify the chances of winning compared to losing (the higher, the better).
Ri,t is the daily stock index return, and Ri is the mean return value.
4.1.4. Treynor Ratio
Our fourth performance measurement tool is the Treynor ratio. The Treynor ratio (TR), developed by Treynor in 1965, is a ratio based on the capital asset pricing model (CAPM) that measures the average risk premium per unit of non-diversifiable risk, represented by beta.
where , Ri,t is the stock index return, RM,t is the market return, Rf,t is the risk-free rate, and σ2 is the variance of the index.
4.2. Wavelet Coherence Analysis
Wavelet coherence is a two-variable approach utilized to examine how different time series are related and evolve across both time and frequency. Wavelet coherence, a bi-variate analysis, gained immense popularity in finance and economics. It examines the relationship among time series in a continuous time–frequency space. Unlike wavelet correlation, it effectively identifies regions of high co-movement across time and frequency. Initially introduced by Torrence and Compo (1998), it has been widely adopted in various fields, such as medicine, astrophysics, and geophysics. In 2008, Aguiar-Conraria et al. (2008) applied this methodology to economics, studying the impact of interest rate changes on macroeconomic variables. Subsequently, Rua and Nunes (2009) successfully used wavelet coherence to explore inter-linkages among financial markets. The method’s versatility and efficacy have made it a valuable tool in understanding complex relationships across different domains. Other recent studies have also used wavelet models in the field of economics and finance; for example, Gradojevic et al. (2020) applied a wavelet-based approach to predict arbitrage opportunities in the forex market, and Torun et al. (2020) examined the linkage between spot and future prices. Also, Torun et al. (2022) investigated the relationship between economic growth and carbon emissions using US data by employing a wavelet-based model.
This paper adopted a wavelet-based bivariate time series methodology as proposed by Saadaoui et al. (2017) using continuous wavelet power spectra and coherence.
For the wavelet coherency approach, we followed the studies by Grinsted et al. (2004) and Aguiar-Conraria and Soares (2011), who applied wavelet coherency in the form of continuous wavelet transform on the return series of the captured co-movement in the time–frequency space. The continuous wavelet transforms of the time series xt concerning is a function of two variables given by the following convolution:
In the given equation, the bar represents the complex conjugate. The parameter determines the time position or translation influencing where the wavelet is located. The scale parameter, denoted by s, controls the wavelet’s width, and is a normalization factor ensuring the comparability of the wavelet transforms across scales and time series.
We can define the wavelet coherency of the two given time series, x(t) and y(t), as follows:
where R2(, s) ranges between 0 and 1 and can be conceptualized as a localized correlation coefficient between x() and y() in the time–frequency domain, and a high (low) value indicates a strong (weak) co-movement, while S is a smoothing operator. The statistical significance level of R2(,s) can be estimated based on a Monte Carlo simulation of a stochastic Gaussian process (Maraun and Kurths 2004). By examining the contour plot of the measure, we can detect time–frequency regions where the two time-series move in same direction, allowing for the assessment of the time- and frequency-varying co-movement features. The equation’s definition resembles the traditional correlation coefficient, making wavelet coherence akin to a localized correlation coefficient in the frequency–time space (Tiwari et al. 2014). A value close to one indicates significant similarity between the time series, while a coherence near zero implies no relationship.
The wavelet techniques used in this context have proved their efficiency in many complex studies related to economics and physics, such as by Huang et al. (2016) and Fernandez-Macho (2012). The wavelet coherence and the wavelet cross-spectrum are used to investigate the co-movement of the time series, instead of focusing on univariate time series. These methods can be seen as estimates of the covariance and correlations across different times and frequencies (Liu et al. 1994).
Time–frequency wavelet-based analysis is a method of analyzing data that uses wavelets to decompose the data into different frequency components. This method is used to identify data patterns and analyze the relationships among different frequency components.
Wavelet coherence analysis is a method of analyzing the relationship between two different signals. This method uses wavelets to decompose the signals into different frequency components and then compares the components to determine the degree of coherence between the two signals. Co-movement is the degree to which two different stocks or indices move in the same direction. It is used to measure the correlation between two different stocks or indices.
The usefulness of wavelet analysis is that it can handle a variety of nonstationary signals with flexibility. In the realm of economic variables, wavelets operate within limited time intervals, displaying non homogeneity over time but retaining localization in both time and scale. These characteristics yield two important advantages in wavelet time-scale analysis. Firstly, by incorporating nonstationary components in the base scale, there is no requirement for detrending or differencing the data. Secondly, the nonparametric nature of wavelets enables capturing potential nonlinear relationships while preserving intricate details (Schleicher 2002).
We employed the “R” programming language as a powerful tool to analyze and process the data. The “R” programming language allowed us to perform intricate data manipulation, visualization, and statistical modeling with ease and precision, and “R” programming has recently become very popular for conducting wavelet-based studies, while for the performance index tools we used simple Excel software.
5. Results
First, we evaluated the performance of both Islamic and conventional indices using descriptive characteristics and the differences in the performance index ratios. Table 2A–F show the descriptive characteristics of both the Islamic and conventional indices before and after the COVID-19 pandemic, including the three years from 2019 to 2021. Next, we determined the means and standard deviation of the differences between the Islamic and conventional indices, and the countries and territories are grouped into developed and developing countries and territories. Table 3A,B show the data on the developed and developing countries and territories separated into years by column for each year for every country. The MDF (mean difference) and SDF (standard deviation difference) are provided are provided. The mean difference was obtained by subtracting the Islamic index value from the conventional one.
Conventional Mean − Islamic Means = +/− (Performance Value)
If the value is positive, this means the conventional index is performing better, and if negative means, the Islamic index is performing better. The results show that the mean difference for both developed and developing countries and territories had more positive values in 2019, while in 2020 and 2021 the mean difference values were changing to negative in the majority of countries and territories. If we look at the columns for 2019, we can observe more positive mean difference values compared to 2020, which means that before COVID-19 conventional indices performed better, and after the COVID outbreak the indices were affected, but the Islamic indices performed better than its counterparts.
If we see the mean difference values for the overall period 2019–2021 and 2019 in both the developed and developing countries and territories, there is a mixed performance by countries and territories. Half of the countries and territories have positive values and half have negative values. This means that in some countries and territories Islamic indices performed well, while in some countries and territories conventional indices performed better. Also, we can say that in the long run, the performance of Islamic and conventional indices is mixed in different countries and territories, as well as in normal periods. Next, we can observe that for values in the year 2020, the results are different for the mean difference values. In both the developed and developing countries and territories, the majority of countries and territories have negative values in 2020. This means that during 2020, which was a COVID year, Islamic indices performed very well in the majority of countries and territories in both developed and developing groups. After, we can see that in the year 2021, this was a time when COVID-19 was receding slowly, and many stock indices were returning to normal. The results from our data show that the indices were recovering in 2021. Our results are very interesting, because if we look at the developed countries and territories group, the majority of countries and territories (indices) have positive MDF values, except for indices in five countries or territories, while in the developing countries, except for six, the rest of the countries (indices) still have negative values for MDF. This means that in developing countries and territories, Islamic indices recovered quickly after being hit by COVID-19, but the conventional indices did not. However, in developed countries and territories, the conventional indices recovered quickly compared to Islamic indices. Finally, for the US we have interesting results. The FTSE Islamic index performed better than the S&P 500, while the Nasdaq 100 outperformed the Islamic index, which is the FTSE-100 (US) in our data sample.
We can also compare the long- and short-term results from our data. The first columns of the tables show the results for the whole period (2019–2021). In the developed countries and territories, ten countries and territories out of sixteen (16) show a better performance for the Islamic indices; on the other hand, in developing countries and territories, nine (9) out of sixteen (16) countries show better performances for Islamic indices. This means that, overall, the Islamic indices outperformed the conventional ones.
According to the country-based results, Hong Kong, the Netherlands, Sweden, and the UK in the developed countries and territories had better results for the Islamic indices in the majority of periods (two or more than two periods), while in the developing countries and territories, Egypt, India, Malaysia, Mexico, Pakistan, Saudi Arabia, South Africa, Taiwan, Thailand, and Turkey, the Islamic indices performed better in the majority of periods.
From the results in Table 3A,B, the Islamic indices outperformed the conventional indices during the crisis period. Meanwhile, after the crisis, the conventional indices recovered quickly in the developed countries and territories; however, in the developing countries and territories, the Islamic indices still dominated the conventional ones in 2021, which we can call the end of the pandemic or after the crisis period. Also, the results from the overall data period show that the Islamic indices performed better than the conventional ones, but on a country basis, the results are mixed.
5.1. Performance Index Results
5.1.1. Sharpe Ratio Results
Table 4A,B provide the performance index ratios, such as the Sharpe, alpha Jensen, omega, and Treynor ratios, for both the Islamic and conventional equity index pairs in different countries and territories. These ratios represent the differences between the performance of the conventional and Islamic indices.
The Sharpe ratio difference is calculated as the conventional Sharpe ratio minus the Islamic Sharpe ratio. The same calculation applies to other performance ratios in each country. A positive value indicates that the conventional index performs better, while a negative value suggests that the Islamic ratio is higher.
According to the 2019 Sharpe ratio results, the indices show a mixed performance in developed countries and territories, with half of the indices showing positive values and the other half showing negative values. In developed countries and territories, the majority of conventional indices demonstrated better performance, while in developing countries and territories, Islamic indices performed better in most countries and territories. However, in 2020 and 2021, the majority of Sharpe ratio difference values are negative, indicating that Islamic indices outperformed conventional ones during and after the crisis period in both developed and developing countries and territories.
The Sharpe ratio reflects the risk-adjusted returns and the risk premium for the associated risk taken. This means that during the COVID-19 period and the subsequent year, Islamic stocks provided better returns compared to conventional indices. Before the COVID-19 pandemic, better returns on Islamic indices were primarily observed in developing countries and territories. However, during the crisis and post-crisis periods, Islamic indices had the advantage in a majority of countries and territories, although this dominancy drop in 2021. Nonetheless, Islamic indices still dominated in developing countries and territories compared to developed countries and territories during that period. This indicates that Islamic indices offered superior returns in most countries and territories during and after the crisis, while conventional indices were slower to recover.
In summary, these findings suggest that Islamic indices outperformed conventional ones in terms of risk-adjusted returns and resilience to shocks, particularly during and after the COVID-19 crisis. Conventional indices took longer to recover, while Islamic indices demonstrated better performance in the majority of countries and territories.
5.1.2. Jensen Alpha Results
The Jensen alpha difference between conventional and Islamic indices was calculated by subtracting the Islamic Jensen value from the conventional Jensen value using the formula: Jensen alpha difference = (conventional alpha − Islamic alpha). The alpha ratio measures the security return relative to the overall market and, in this case, we compared the performance of both conventional and Islamic indices.
According to the results presented in Table 4A,B, the alpha values for the Islamic indices consistently outperformed conventional indices in both the pre- and post-COVID periods. This indicates that in the majority of countries and territories, the returns of the Islamic indices were superior to the overall market. However, it is important to note that the performances varied across countries and territories, as well as periods.
Before the COVID-19 pandemic, some countries and territories showed better performances by conventional indices, while others demonstrated stronger performances by Islamic indices. This pattern persisted during and after the COVID-19 period as well. The performances of both types of indices were not consistent and exhibited changes throughout all three periods. Notably, certain countries and territories, such as New Zealand, Singapore, South Korea, Spain, Sweden, Switzerland, the UK, the US S&P, Egypt, Mexico, Pakistan, Qatar, Russia, Taiwan, and Thailand, consistently exhibited results where the alpha returns of Islamic indices surpassed those of conventional indices in both pre- and post-COVID-19 periods.
Interestingly, among the three US indices, the US Nasdaq-100 outperformed the Islamic FTSE-100 index, while the Islamic FTSE-100 performed better than the S&P 500. These findings highlight the intriguing performance dynamics among the US indices.
In summary, these results indicate that the performances of the conventional and Islamic indices varied across countries and territories, as well as periods. While Islamic indices generally outperformed conventional indices in terms of alpha returns, the specific performance patterns differed among countries and territories and were subject to changes during the pre- and post-COVID-19 periods.
5.1.3. Omega Ratio Results
Looking at the omega ratio values in Table 4A,B, we can see mixed results for 2019, 2020, and 2021. In 2019, which we call a pre-COVID-19 period, omega had mixed positive and negative values, which means the performances of both the conventional and Islamic indices were mixed. If we count the countries and territories, the number of countries and territories with a better performance by Islamic indices was higher than conventional ones in the developed group in comparison to the developing group. But in developing countries and territories, there were fewer countries and territories where Islamic indices performed well in 2019. However, in 2020, during the COVID-19 period, we can observe an increase in negative values, which means the number of countries where Islamic indices performed well increased, especially in developing countries and territories, as the number is higher in comparison to developed countries and territories. After, in 2021, the results shifted and, again, the conventional indices had better results, because the omega values become positive but not all of them. On the other hand, in developing countries and territories, half of the indices had negative values, which means the Islamic indices in developing countries and territories still had better returns, but in developed countries and territories, the number dropped, and less than half of the countries and territories had better results for Islamic indices.
This means that in developed countries and territories, the Islamic indices outperformed conventional ones by more than half in both the pre-crisis and crisis periods. Meanwhile, in developing countries and territories, Islamic indices were dominant during the crises and post-crisis periods, but before the crisis, the conventional indices performed well. However, in the post-crisis period (2021), the conventional indices were providing returns only in developed countries and territories. This means the winning benchmark in developing countries and territories during and after the COVID-19 period lies with Islamic indices, while before COVID-19 the winning benchmark lies with conventional indices in developing countries and territories. On the other hand, in developed countries and territories, the winning benchmark lies with Islamic indices during crises and pre-crisis periods, while after COVID-19 or crisis period, the winning benchmark shifted to the conventional indices.
5.1.4. Treynor Ratio Results
The Treynor ratio, also known as the reward-to-volatility ratio, is a performance metric for determining how much excess return was generated for each unit of risk taken on by a portfolio. We calculated the Treynor ratio difference by subtracting the Islamic Treynor ratio from the conventional one.
Treynor Ratio Difference = (Conventional Treynor − Islamic Treynor)
Table 4A,B report the results for the Treynor ratio in the last column of each table. From the values in the table, we can clearly understand that in 2019, before the COVID-19 pandemic, there were mixed performances by the conventional and Islamic indices in both developed and developing countries and territories. However, later during the pandemic period, in 2020, there were more negative values than positive in both developed and developing countries and territories, which means Islamic indices took the lead and performed better than conventional indices. Then, in 2021, the results changed, and the majority of developed countries and territories had positive indices, which means conventional indices dominated Islamic ones, while in developing countries and territories a high number of negative values remained, which means Islamic indices dominated in this group. From the results, we can conclude that Islamic indices outperformed conventional ones during the crises periods and after the crisis period, or the take-off period, but only in developing countries and territories. But in normal conditions, conventional indices dominated Islamic ones.
5.2. BI-Wavelet Analysis
Figure A1, Figure A2, Figure A3, Figure A4, Figure A5, Figure A6, Figure A7, Figure A8, Figure A9, Figure A10, Figure A11, Figure A12, Figure A13, Figure A14, Figure A15, Figure A16, Figure A17, Figure A18, Figure A19, Figure A20, Figure A21, Figure A22, Figure A23, Figure A24, Figure A25, Figure A26, Figure A27, Figure A28, Figure A29, Figure A30, Figure A31, Figure A32, Figure A33 and Figure A34 (in Appendix A) report the wavelet coherence plots for each pair of assets. The wavelet model examines the co-movement or coherence between conventional and Islamic stock indices in different countries by employing wavelet coherence analysis. The model is capable of identifying an asset’s hedging or safe-haven attributes, as demonstrated in a study by Goodell and Goutte (2020). This method helps reveal how these two types of indices move in relation to each other and identifies their hedging or safe-haven characteristics. The analysis is represented in Figure A1, Figure A2, Figure A3, Figure A4, Figure A5, Figure A6, Figure A7, Figure A8, Figure A9, Figure A10, Figure A11, Figure A12, Figure A13, Figure A14, Figure A15, Figure A16, Figure A17, Figure A18, Figure A19, Figure A20, Figure A21, Figure A22, Figure A23, Figure A24, Figure A25, Figure A26, Figure A27, Figure A28, Figure A29, Figure A30, Figure A31, Figure A32, Figure A33 and Figure A34 in Appendix A, with each figure corresponding to a specific country’s pair of conventional and Islamic stock indices. Wavelet coherence plots exhibit the co-movement evolution through wavelet squared coherency and wavelet phase difference. The horizontal axis signifies the time (year), while the vertical axis represents the frequency in converted time units (days). The analysis differentiates between short and long periods. Days 1 to 32 is a short period, and more than 32 days is considered a long period. The wavelet coherency is visualized as a contour plot, with colors ranging from blue (low coherency) to red (high coherency), indicating the degree of co-movement between the two indices. Strong local correlation is represented by high coherency. To assess the statistical significance, a Monte Carlo simulation is utilized, and the coherency plots include a dense grey line that designates the statistically significant area at the 5% level. The wavelet coherence analysis offers valuable insights into the dynamics and potential interdependencies between conventional and Islamic stock indices, facilitating a better understanding of their relationship.
The wavelet coherence plots display arrows indicating the phase difference between the two indices, providing insights into their lead–lag relationship in the time–frequency space, reflecting market dynamics. The first index shown (conventional) represents the first series, while the other (Islamic) represents the second series (conventional vs. Islamic). The interpretation of the arrows is as follows:
(→) Both variables are in phase, showing a cyclical effect on each other;
(↗) Islamic equity returns lead the relationship;
(↘) Islamic equity returns lag behind the relationship;
(←) Variables are out of phase, indicating an anticyclical effect;
(↖) Islamic equity returns lag behind;
(↙) Islamic equity returns lead the relationship.
When the arrow points at zero, it suggests that both variables co-move with the stated frequency, indicating a simultaneous relationship between the conventional and Islamic indices at that specific time–frequency.
The phase difference between the two indices is indicated by arrows, which reveals information on the lead–lag relationship (market dynamic) in the time–frequency space. The name of the index shown, first (conventional) is the first series, and the other is the second (Islamic) (conventional vs. Islamic) and interpreted as below. (→) = Both the variables are in phase (cyclical effect on each other); (↗) = Islamic equity returns are leading; (↘) = Islamic equity returns are lagging; (←) = variables are out of phase (anticyclical effect); (↖) = Islamic equity returns are lagging;(↙); and Islamic equity returns are leading. A value of zero suggests that both variables co-move with a stated frequency.
5.2.1. Wavelet Coherence Analysis
The overall results show that there was strong coherence between the conventional and Islamic indices in both the developed and developing countries and territories, and for the majority of the time, they had a medium or strong form of coherency, except at a few points during the periods. In the developed countries and territories, Canada, Hong Kong, the Netherlands, Singapore, Spain, and the US-Nasdaq vs. FTSE-100 showed the presence of weak coherence between both indices, especially in the first quarter of 2020 and the first and second quarters of 2021. The remaining countries and territories showed a bit of stable movement. The color change depicts the level of coherency between both indices. In both developed and developing countries and territories, it was witnessed that in the short-term or early periods, the coherency color was mixed, while around the middle region and the bottom, or we can say in the long run, there was the presence of high coherency between the conventional and Islamic indices.
For the developing countries and territories’ results, except for Qatar, Russia, Saudi Arabia, Taiwan, Thailand, and Turkey, the remaining countries and territories showed a mix of weak and strong coherence. The years 2020 and 2021 showed weak coherence, while in the year 2019, there can be seen strong coherence between both conventional and Islamic indices. The weak coherence spread to the middle of the year and the second quarters in the majority of the developing countries and territories, while in the developed countries and territories, this spread did not extended that much. This means that in developed countries and territories, there was high connectedness between the conventional and Islamic indices, while in developing countries and territories, the connection and coherency were not that strong, which can provide arbitrageurs opportunities for investors. Despite this, we can see that most of the stronger and finest coherences spread over longer periods at medium-to-high frequencies. Again, the coherency appeared to be periodic and did not spread throughout the entire time distribution of the data span.
There was an interesting result observed in the US, where we tested the S&P-500 and Nasdaq-100 with FTSE-100 (US). The S&P-500 and FTSE-100 comparison shows very strong coherence with a weak frequency band. While in the Nasdaq and FTSE-100 comparison, we can observe completely different results. There was mixed coherence, and none of the periods showed a coherent relationship between both series. In 2020 and 2021, there were many upward and downward arrows present on the graph at various points, which indicates the presence of high-volatility frequency bands. There was also mixed coherence among both indices compared to the year 2020 and the S&P-500 results. We also witnessed some countries and territories with very strong coherence between both stock indices: France, Germany, Saudi Arabia, South Korea, UK, S&P-500, and FTSE (US). Such coherence shows that in these countries and territories, there are very fewer arbitrageurs opportunities.
The weak coherency, which was the result of different performances by both Islamic and conventional indices, shows resilience, which can be observed by the direction of the arrows.
5.2.2. Wavelets Co-Movement Analysis
At first glance, all of the plots show that there were generally high co-movements across the markets, as the majority of arrows are directed towards the right-hand side. Australia, Canada, Hong Kong, the Netherlands, Germany, Italy, Singapore, Spain, and the US-Nasdaq vs. FTSE-100 show that there was turbulence in the phase frequency between both Islamic and conventional indices. Throughout the entire study period, the conventional and Islamic indices display a strong interconnectedness characterized by a cyclic effect with an in-phase relationship. However, specific periods, notably the first quarter of 2019, the first and second quarters of 2020, and the first to the third quarter of 2021, exhibit more diverse and mixed lead/lag relationships between these two indices. During these intervals, certain arrows point upward (indicating an in-phase relationship), while others point downward (reflecting an anti-phase or out-phase relationship). These findings imply that the lead–lag dynamics between the Conventional and Islamic indices are not consistently stable and undergo fluctuations during these particular time segments. In the last quarter of 2019 and 2020, the frequency phase is normal and there are few upward or downward arrows. In the US the degree of volatility for co-movement between the S&P 500 and the Islamic Index is very weak as compared to Nasdaq 100 and FTSE. In the Nasdaq and FTSE comparison, we can see semi-strong or weak coherence and a little bit of volatile in-phase and out-phase movement with high frequency, But in S&P and FTSE comparison the coherence is very strong and the degree of volatility in co-movement is very weak.
Also, regarding the cyclical effect and in-phase relationship, some arrows are pointing upward while some are pointing downward. Which shows a weak coherence among the indices. This type of coherence is greater for developing countries and territories as compared to developed countries and territories. The colored parts exhibit this pattern in both developed and developing countries and territories.
The directional arrows in this study depict significant co-movements between conventional and Islamic indices in both developed and developing countries and territories. Most arrows point to the right in both categories. However, an interesting phenomenon emerges when observing the years 2020 and 2021.
During the initial days of 2020, the arrows start moving upward, and this upward trend continues until the end of 2021. This pattern is prevalent in nearly all developing countries and territories, with a few exceptions where it occurs for a shorter period. In developed countries and territories, the same pattern is evident mainly in the initial quarter of 2020 and for a brief period in 2021. These observations suggest that, during crisis periods, Islamic indices tend to lead equity return movements in developing countries and territories. However, in the years 2019 and some parts of 2021, conventional indices take the lead. Examining the graphs closely reveals stable arrow movements on the left-hand side and the bottom, while the middle and right-hand side areas in 2020 and 2021 display turbulent wave-like patterns. These fluctuations indicate higher volatility and the presence of arbitrageurs’ opportunities. Notably, the majority of arrows point upward in the middle and right-hand side of the graphs, particularly in developing countries and territories, signifying that Islamic indices dominated the market during these periods. Additionally, these findings suggest that Islamic indices demonstrated greater resilience during crisis periods compared to conventional indices.
Our study noted no/weak coherency in short-term scales over the whole time–frequency bands for both developed and developing countries and territories, while at the inception of the pandemic, significant lead/lag relationship and cyclic/anticyclic effects were observed in short- and long-run frequency bands. Starting from mid-2020 and for the whole of 2021, weak coherence and in-phase cyclical effects were observed. The phase volatility was higher in developing countries and territories, while in developed countries and territories, the phase volatility was weaker. As a result, the arrows changed directions continuously in high-frequency periods, while in low-frequency periods the arrows pointing to the right side.
Concluding the above analysis, we can say that there was the presence of high co-movements and strong coherence between conventional and Islamic indices across different countries and territories. There was high coherence present in developed countries and territories, while in developing countries and territories the coherence was mixed and significantly affected by crises, especially in 2020 and 2021, as well as in short frequency bands. The results exhibit that there was strong connectedness with the cyclic effect (in-phase relationship) during the entire period and frequency bands, while at some points there was an opposite trend, where there was an out-phase relationship between both the conventional and Islamic indices. During the crisis periods, there was volatility present in the phase movement of both stock indices, which means crises significantly affected the stock movement and were led by Islamic indices (upward arrows).
Our results support previous studies, such as by Dewandaru et al. (2014); Saadaoui et al. (2017); Yarovaya et al. (2021); and Hasan et al. (2023), in terms of the best performance by Islamic stock indices, while it does not support Kraeussl and Hayat (2011); Albaity and Ahmad (2008); and Hasan et al. (2021).
Detailed images of wavelet examination are provided in Appendix A.
6. Conclusions
This study used performance index tools and a time-wavelet analysis approach to evaluate the performances of conventional and Islamic stock indices. The study analyzed and compared the performances of conventional and Islamic stock indices before and after the COVID-19 pandemic using performance index ratios, and it also examined the co-movement and coherency between them using a time–frequency wavelet-based model.
The performance index tools showed that Islamic indices outperformed the conventional ones in the majority of countries and territories both in the long (i.e., whole period) and short-run (i.e., yearly). In developed countries and territories, the performance was mixed in 2019 and 2021. In some countries and territories, conventional indices showed better performances, while some Islamic indices exhibited better returns for stocks. There was also a difference in performances for developed and developing countries and territories. In developing countries and territories, Islamic indices dominated conventional indices for a short time, especially during crisis periods. In 2019 and 2021, there were mixed performances by Islamic and conventional indices, but in 2020 Islamic indices dominated over conventional ones. On the other hand, developing countries and territories showed that Islamic indices were dominant over conventional ones not only during the crisis periods but also after the crisis periods (i.e., 2021), which we called the take-off period. In the developing group, we can see that conventional indices were dominant over Islamic ones in 2019, but after, in 2020 and 2021, Islamic indices took the lead. However, in developed countries and territories, the lead of Islamic indices fell early compared to developing countries and territories, while in developing countries and territories, the dominant role of Islamic indices continued until the end of 2021 in the majority of countries and territories.
In developing countries and territories, such as Australia, France, Poland, the Netherlands, Singapore, South Korea, and the US (against the S&P), the Islamic indices performed well in the overall period. Meanwhile, in the developing group (i.e., China, Chile, Egypt, Mexico, Pakistan, Russia, Saudi Arabia, Qatar, Thailand, and the UAE), the majority of Islamic indices outperformed conventional ones based on maximum index performance indicators output over three years.
Annually during the pre-crisis period (i.e., 2019), Canada, France, Germany, Hong Kong, the UK, China, India, Russia, Saudi Arabia, South Africa, Turkey, UAE, and in the US against Nasdaq only, the conventional indices outperformed Islamic ones, while in the remaining countries and territories, Islamic stock indices performed better in comparison to conventional ones. In the crisis period, in 2020, in developed countries and territories group, Islamic indices outperformed conventional ones in France, Hong Kong, Italy, Japan, the Netherlands, New Zealand, Poland, South Korea, Spain, Switzerland, and against the US S&P. In the same way, in the developing group, Brazil, Egypt, Mexico, Pakistan, Qatar, Russia, Saudi Arabia, Taiwan, Thailand, and the UAE, the Islamic indices performed better compared to conventional ones. After, in 2021, only in Hong Kong, Japan, the Netherlands, and Switzerland did Islamic indices perform better; meanwhile, in the developing group, Egypt, Mexico, Russia, Saudi Arabia, South Africa, and the UAE had better returns for Islamic indices.
We can clearly see that the number of countries where Islamic indices performed better decreased in 2021, while in 2020 that number was high. This means that during the crisis period, Islamic indices outperformed conventional indices. The Islamic indices still performed better in many countries in 2021; this was a time when people were getting used to COVID-19, and the markets were returning to normal. But this number was still smaller compared to 2019, where conventional indices were dominant.
The wavelet-based study showed almost similar results. The wavelet graphs exhibit coherence and co-movement between the Islamic and conventional indices. The results show a strong coherence between conventional and Islamic indices but not throughout all periods. Also, there were in-phase and out-phase co-movements between both Islamic and conventional indices. The coherence was high in the long-frequency bands, as well as in the pre-COVID-19 period, while during short-frequency bands, or the start of the years and after the pandemic, there was mixed coherence, and this pattern was more visible in developing countries and territories compared to developed countries and territories. The study also shows that there was a co-movement between conventional and Islamic indices. The co-movement volatility was stable in 2019 for almost the whole year, while in 2020 and 2021, the movement of the arrows was highly volatile. This means the crises affected the co-movements of the stock indices. The co-movement during the crisis periods was led by Islamic indices, as we can see many arrows were directed in an upward direction, which means Islamic indices were performing better than conventional indices. But during the pre-COVID period, as well as over the long-frequency bands, which means at the end of the year, especially in 2019 and 2020, we can see that the co-movement was stable compared to 2021 and at the beginning of the three years. Also, at some points, we can see out-of-phase movement by stocks, which is very rare.
The wavelet coherence analysis reveals significant findings regarding the relationship between Islamic and conventional stock market indices in different countries. Specifically, when considering the developing group, which includes France, Germany, South Korea, and the US S&P, a strong coherence is observed between both types of indices. However, in the remaining developing countries, the coherence was generally weak. In contrast, within the developing group, with the exception of Taiwan, Qatar, and Saudi Arabia, the majority of countries showed weak coherence and co-movement between Islamic and conventional indices. Only three countries exhibited a strong coherence between these indices. Notably, the strong coherence between Islamic and conventional indices was more prevalent in the developed group compared to the developing group. This finding suggests that investors in developing countries may have higher probabilities of finding safe havens or hedging opportunities compared to those in developed countries.
In summary, the analysis highlights the varying degrees of coherence and co-movement between Islamic and conventional indices in different countries. It underscores the potential attractiveness of developing countries as safe havens or hedging options for investors, particularly when compared to the opportunities available in developed countries.
Concluding the discussion, we can say that Islamic stock indices outperformed conventional indices during the crisis periods, and Islamic indices were more resilient than conventional indices, particularly in developing countries and territories. Islamic indices dominated conventional ones in developing countries and territories, while in developed countries and territories the performances were mixed before and after the COVID-19 pandemic, but during COVID-19’s peak period, Islamic indices still performed better. We can also argue that conventional indices will dominate Islamic ones over the long run, but not in all countries and territories, because in some countries and territories, Islamic indices outperform conventional ones over the long run as well. Hence, overall Islamic indices are performing better than conventional indices.
7. Implications
The present study not only adds to the literature in the field of investment and finance, but it will also help investors to construct profitable portfolios and avoid unnecessary risks, especially in a time of crisis where every investor wants to save money and protect their assets from being affected by extraordinary risks.
The most important implication of this study is that Islamic indices can provide safe havens for investors in times of crisis. And investors can include Islamic equities in their portfolios to obtain higher returns compared to conventional indices. The safe-haven characteristics of Islamic stocks may be due to a few possibilities: First, Islamic stocks adhere to the principles of Sharia, the Islamic law. These stocks are screened and chosen based on ethical and moral criteria, avoiding industries such as alcohol, gambling, tobacco, and others considered haram (i.e., forbidden) in Islam. This focus on ethical investments can provide a level of stability and resilience during times of market volatility. Second, Islamic laws prohibit the payment and receipt of interest (riba). As a result, Islamic companies tend to have lower levels of debt compared to conventional counterparts, which can make them more financially stable during economic downturns and less susceptible to interest rate fluctuations. Third, Islamic finance encourages investments in tangible assets and businesses with real economic value. This asset-backed nature can provide a degree of security, as the underlying assets often have intrinsic worth and can serve as a buffer against market downturns. Fourth, Islamic investing principles discourage speculative and short-term trading practices. Instead, they promote a long-term investment horizon and a focus on the fundamental strength of the companies. This approach can help investors avoid the pitfalls of short-term volatility and focus on the underlying performance of the businesses they invest in.
The result of this study can help individual traders who invest using online platforms in different stock indices around the world. In such cases, they can use the results of this study to construct and design their portfolios in different countries and territories, specifically keeping in mind developing and developed countries and territories’ environments. Our study proves that there is a clear difference in the performance of stock indices in these two types of countries and territories.
Author Contributions
Methodology, M.A.; Writing—original draft, M.A.; Supervision, M.-C.C. All authors have read and agreed to the published version of the manuscript.
Funding
This research received no external funding.
Data Availability Statement
The data is available on request.
Conflicts of Interest
The authors declare no conflict of interest.
Appendix A. Wavelet Analysis
Figure A1, Figure A2, Figure A3, Figure A4, Figure A5, Figure A6, Figure A7, Figure A8, Figure A9, Figure A10, Figure A11, Figure A12, Figure A13, Figure A14, Figure A15, Figure A16 and Figure A17: Developed countries and territories.
Figure A1.
Australia.

Figure A2.
Canada.

Figure A3.
France.

Figure A4.
Germany.

Figure A5.
Hong Kong.

Figure A6.
Italy.

Figure A7.
Japan.

Figure A8.
Netherlands.

Figure A9.
New Zealand.

Figure A10.
Singapore.

Figure A11.
South Korea.

Figure A12.
Spain.

Figure A13.
Sweden.

Figure A14.
Switzerland.

Figure A15.
UK.

Figure A16.
US-Nasdaq-100.

Figure A17.
US-S&P-500.

Figure A18, Figure A19, Figure A20, Figure A21, Figure A22, Figure A23, Figure A24, Figure A25, Figure A26, Figure A27, Figure A28, Figure A29, Figure A30, Figure A31, Figure A32, Figure A33 and Figure A34: Developing Countries and territories.
Figure A18.
Brazil.

Figure A19.
China (SE).

Figure A20.
China (Shenzhen).

Figure A21.
India.

Figure A22.
Indonesia.

Figure A23.
Malaysia.

Figure A24.
Mexico.

Figure A25.
Pakistan.

Figure A26.
Qatar.

Figure A27.
Russia.

Figure A28.
Saudi Arabia.

Figure A29.
South Africa.

Figure A30.
Taiwan.

Figure A31.
Egypt.

Figure A32.
UAE.

Figure A33.
Turkey.

Figure A34.
Thailand.

| 1 | Sharia is a body of religious law that forms part of the Islamic tradition. All laws under this body are called Sharia law. |
| 2 | According to FTSE Russel screening criteria: (i) a company’s debt financing is no more than 33.33% of its capital; (ii) total interest and noncompliant activities’ income should not exceed 5% of total revenue; and (iii) the composition of account receivables and liquid assets (cash at banks and marketable securities) compared to total assets is at minimum 50%, while a few cite 33% as an acceptable ratio. |
| 3 | The S&P 500 hit the 7% threshold decline on 9 March and 12 March, halting trade during regular market hours for 15 min to ensure trading order. The last and only previous time of a “circuit breaker” was back in 1997. |
References
- Abdullah, Fikriyah, Taufiq Hassan, and Shamsher Mohamad. 2007. Investigation of the performance of Malaysian Islamic unit fund trusts: Comparison with conventional unit fund trusts. Management Finance 33: 142–53. [Google Scholar] [CrossRef]
- Abu-Alkheil, Ahmad, Walayet A. Khan, Bhavik Parikh, and Sunil K. Mohanty. 2017. Dynamic co-integration and portfolio diversification of Islamic and conventional indices: Global evidence. Quarterly Review of Economics and Finance 66: 212–24. [Google Scholar] [CrossRef]
- Aguiar-Conraria, Luís, and Maria Joana Soares. 2011. Oil and the macroeconomy: Using wavelets to analyze old issues. Empirical Economics 40: 645–55. [Google Scholar] [CrossRef]
- Aguiar-Conraria, Luís, Nuno Azevedo, and Maria Joana Soares. 2008. Using wavelets to decompose the time-frequency effects of monetary policy. Physica A 387: 2863–78. [Google Scholar] [CrossRef] [Green Version]
- Albaity, Mohamed, and Rubi Ahmad. 2008. Performance of Syariah and Composite Indices: Evidence from Bursa Malaysia. Asian Academy of Management Journal of Accounting and Finance 4: 23–43. [Google Scholar]
- Aloui, Chaker, Rania Jammazi, and Hela Ben Hamida. 2018. Multivariate co-movement between Islamic stock and bond markets among the GCC: A wavelet-based view. Computational Economics 52: 603–26. [Google Scholar] [CrossRef]
- Al-Yahyaee, Khamis Hamed, Walid Mensi, Mobeen Ur Rehman, Xuan Vinh Vo, and Sang Hoon Kang. 2020. Do Islamic stocks out-perform conventional stock sectors during normal and crisis periods? Extreme co-movements and portfolio management analysis. Pacific-Basin Finance Journal 62: 101385. [Google Scholar] [CrossRef]
- Azad, A. S. M. Sohel, Saad Azmat, Abdelaziz Chazi, and Amirul Ahsan. 2018. Sailing with the non-conventional stocks when there is no place to hide. Journal of International Financial Markets, Institutions, and Money 57: 1–16. [Google Scholar] [CrossRef]
- Baker, Scott R., Nicholas Bloom, Steven J. Davis, Kyle J. Kost, Marco C. Sammon, and Tasaneeya Viratyosin. 2020. The Unprecedented Stock Market Impact of COVID-19. Cambridge, MA: National Bureau of Economic Research, pp. 1–19. [Google Scholar] [CrossRef]
- Baur, Dirk G., and Brian M. Lucey. 2010. Is gold a hedge or a safe haven? An analysis of stocks, bonds, and gold. Financial Review 45: 217–29. [Google Scholar] [CrossRef]
- Baur, Dirk G., and Thomas K. McDermott. 2010. Is gold a safe haven? International evidence. Journal of Banking & Finance 34: 1886–98. [Google Scholar] [CrossRef]
- Cevik, Emrah Ismail, and Mehmet Fatih Bugan. 2018. Regime-dependent relation between Islamic and conventional financial markets. Borsa Istanbul Review 18: 114–21. [Google Scholar] [CrossRef]
- Conlon, Thomas, and Richard McGee. 2020. Safe haven or risky hazard? Bitcoin during the COVID-19 bear market. Finance Research Letters 35: 101607. [Google Scholar] [CrossRef]
- Conlon, Thomas, Shaen Corbet, and Richard J. McGee. 2020. Are Cryptocurrencies a Safe Haven for Equity Markets? An International Perspective from the COVID-19 Pandemic. Research in International Business and Finance 54: 101248. [Google Scholar] [CrossRef] [PubMed]
- Derigs, Ulrich, and Shehab Marzban. 2008. Review and analysis of current Shariah-compliant equity screening practices. International Journal of Islamic and Middle Eastern Finance and Management 1: 285–303. [Google Scholar] [CrossRef]
- Dewandaru, Ginanjar, Syed Aun R. Rizvi, Rumi Masih, Mansur Masih, and Syed Othman Alhabshi. 2014. Stock market co-movements: Islamic versus conventional equity indices with multi-timescales analysis. Economic Systems 38: 553–71. [Google Scholar] [CrossRef]
- Dharani, Munusamy, M. Kabir Hassan, and Andrea Paltrinieri. 2019. Faith-based norms and portfolio performance: Evidence from India. Global Finance Journal 41: 79–89. [Google Scholar] [CrossRef]
- Ebrahim, M. Shahid, Aziz Jaafar, Fatma A. Omar, and Murizah Osman Salleh. 2016. Can Islamic injunctions indemnify the structural flaws of securitized debt? Journal of Corporate Finance 37: 271–86. [Google Scholar] [CrossRef] [Green Version]
- Feng, Wenjun, Yiming Wang, and Zhengjun Zhang. 2018. Can cryptocurrencies be a safe haven: A tail risk perspective analysis. Applied Economics 50: 4745–62. [Google Scholar] [CrossRef]
- Fernandez-Macho, Javier. 2012. Wavelet multiple correlation and cross-correlation: A multiscale analysis of Eurozone stock markets. Physica A 391: 1097–104. [Google Scholar] [CrossRef] [Green Version]
- Goodell, John W., and Stephane Goutte. 2020. Co-movement of COVID-19 and bitcoin: Evidence from wavelet coherence analysis. Finance Research Letters 38: 101625. [Google Scholar] [CrossRef]
- Gradojevic, Nikola, Deniz Erdemlioglu, and Ramazan Gençay. 2020. A new wavelet-based ultra-high-frequency analysis of triangular currency arbitrage. Economic Modelling 85: 57–73. [Google Scholar] [CrossRef]
- Grinsted, Aslak, John C. Moore, and Svetlana Jevrejeva. 2004. Application of the cross wavelet transform and wavelet coherence to geophysical time series. Nonlinear Processes in Geophysics 11: 561–66. [Google Scholar] [CrossRef]
- Hasan, Md Bokhtiar, M. Kabir Hassan, Zeynullah Gider, Humaira Tahsin Rafia, and Mamunur Rashid. 2023. Searching hedging instruments against diverse global risks and uncertainties. The North American Journal of Economics and Finance 66: 101893. [Google Scholar] [CrossRef]
- Hasan, Md Bokhtiar, Masnun Mahi, M. Kabir Hassan, and Abul Bashar Bhuiyan. 2021. Impact of COVID-19 pandemic on stock markets: Conventional vs. Islamic indices using wavelet-based multi-timescales analysis. The North American Journal of Economics and Finance 58: 101504. [Google Scholar] [CrossRef]
- Hkiri, Besma, Shawkat Hammoudeh, Chaker Aloui, and Larisa Yarovaya. 2017. Are Islamic indexes a safe haven for investors? An analysis of total, directional and net volatility spillovers between conventional and Islamic indexes and importance of crisis periods. Pacific-Basin Finance Journal 43: 124–50. [Google Scholar] [CrossRef]
- Ho, Catherine Soke Fun, Nurul Afiqah Abd Rahman, Noor Hafizha Muhamad Yusuf, and Zaminor Zamzamin. 2014. Performance of global Islamic versus conventional share indices: International evidence. Pacific Basin Finance Journal 28: 110–21. [Google Scholar] [CrossRef]
- Hoque, Hafiz, Sarkar Humayun Kabir, El Khamlichi Abdelbari, and Viktor Manahov. 2016. Islamic and Conventional Equity Market Movements During and After the Financial Crisis: Evidence from the Newly Launched MSCI Indices. Financial Markets, Institutions, and Instruments 25: 217–52. [Google Scholar] [CrossRef]
- Huang, Shupei, Haizhong An, Xiangyun Gao, and Xuan Huang. 2016. Time-frequency featured co-movement between the stock and prices of crude oil and gold. Physica A 444: 985–95. [Google Scholar] [CrossRef]
- Hussein, Khaled, and Mohammed Omran. 2005. Ethical investment revisited: Evidence from Dow Jones Islamic Indexes. Journal of Investment 14: 105–26. [Google Scholar] [CrossRef]
- Jawadi, Fredj, Nabila Jawadi, and Abdoulkarim Idi Cheffou. 2020. Wavelet analysis of the conventional and Islamic stock market relationship ten years after the global financial crisis. Applied Economics Letters 27: 466–72. [Google Scholar] [CrossRef]
- Jebran, Khalil, Shihua Chen, and Muhammad Zubair Tauni. 2017. Islamic and conventional equity index co-movement and volatility transmission: Evidence from Pakistan. Future Business Journal 3: 98–106. [Google Scholar] [CrossRef]
- Kayed, Rasem N., and M. Kabir Hassan. 2011. The global financial crisis and Islamic finance. Thunderbird International Business Review 53: 551–64. [Google Scholar] [CrossRef]
- Keating, Con, and William F. Shadwick. 2002. A Universal Performance Measure. London: The Finance Development Centre. [Google Scholar]
- Kraeussl, Roman, and Raphie Hayat. 2011. Risk and Return Characteristics of Islamic Equity Funds. Emerging Markets Review 12. Available online: https://ssrn.com/abstract=1320712 (accessed on 30 April 2023).
- Lintner, John. 1965. The Valuation of Risk Assets and the Selection of Risky Investments in Stock Portfolios and Capital Budgets. The Review of Economics and Statistics 47: 13–37. [Google Scholar] [CrossRef]
- Liu, Haiyue, Aqsa Manzoor, Cangyu Wang, Lei Zhang, and Zaira Manzoor. 2020. The COVID-19 outbreak and affected countries stock markets response. International Journal of Environmental Research and Public Health 17: 2800. [Google Scholar] [CrossRef] [PubMed] [Green Version]
- Liu, Y., X. S. Liang, and R. H. Weisberg. 1994. Wavelet spectrum analysis and ocean wind waves. In Wavelets in Geophysics. Edited by Foufoula-Georgiou Efi and Praveen Kumar. Cambridge, MA: Academic Press. [Google Scholar]
- Majdoub, Jihed, Walid Mansour, and Jamel Jouini. 2016. Market integration between conventional and Islamic stock prices. The North American Journal of Economics and Finance 37: 436–57. [Google Scholar] [CrossRef]
- Maraun, D., and J. Kurths. 2004. Cross wavelet analysis: Significance testing and pitfalls. Nonlinear Processes in Geophysics 11: 505–14. [Google Scholar] [CrossRef] [Green Version]
- Milly, Maher, and Jahangir Sultan. 2012. Portfolio diversification during the financial crisis: Analysis of faith-based investment strategies. In Building Bridges across the Financial Communities: The Global Financial Crisis, Social Responsibility, and Faith-based Finance. Cambridge, MA: Harvard Law School, Islamic Finance Project, pp. 334–52. [Google Scholar]
- Narayan, Paresh Kumar, and Deepa Bannigidadmath. 2015. Are Indian stock returns predictable? Journal of Banking & Finance 58: 506–31. [Google Scholar] [CrossRef]
- Ngwakwe, Collins C. 2020. Effect of COVID-19 Pandemic on Global Stock Market Values: A Differential Analysis. Acta Universitatis Danubius Oeconomica 16: 255–69. [Google Scholar]
- Pagano, Marco, Christian Wagner, and Josef Zechner. 2020. Disaster Resilience and Asset Prices. SSRN. Available online: https://ssrn.com/abstract=3603666 (accessed on 30 April 2023).
- Rahman, Md Lutfur, Amin Abu, and Mamun Mohammed. 2020. The COVID-19 outbreak and stock market reactions: Evidence from Australia. Finance Research Letters 38: 101832. [Google Scholar] [CrossRef]
- Ramelli, Stefano, and Alexander F. Wagner. 2020. Feverish Stock Price Reactions to COVID-19. The Review of Corporate Finance Studies 9: 622–655. [Google Scholar] [CrossRef]
- Rivzi, Syed Aun R., Shaista Arshad, and Nafis Alam. 2015. Crises and contagion in Asia Pacific—Islamic v/s conventional markets. Pacific-Basin Finance Journal 34: 315–26. [Google Scholar]
- Rua, António, and Luís C. Nunes. 2009. International co-movement of stock market returns: A wavelet analysis. Journal of Empirical Finance 16: 632–39. [Google Scholar] [CrossRef] [Green Version]
- Saadaoui, Foued, Nader Naifar, and Mohamed S. Aldohaiman. 2017. Predictability and co-movement relationships between conventional and Islamic stock market indexes: A multiscale exploration using wavelets. Physica A: Statistical Mechanics and Its Applications 482: 552–68. [Google Scholar] [CrossRef]
- Saleem, Kashif, Osama AlHares, Haroon Khan, and Omar Farooq. 2023. FAANG Stocks, Gold, and Islamic Equity: Implications for Portfolio Management during COVID-19. Risks 11: 19. [Google Scholar] [CrossRef]
- Sansa, N. A. 2020. The Impact of COVID-19 on the Financial Markets: Evidence from China and USA. Electronic Research Journal of Social Sciences and Humanities 2. [Google Scholar] [CrossRef]
- Schleicher, Christoph. 2002. An Introduction to Wavelets for Economists. Bank of Canada Working Paper 2002-3. Ottawa: Bank of Canada. [Google Scholar]
- Shahzad, Syed Jawad Hussain, Román Ferrer, Laura Ballester, and Zaghum Umar. 2017. Risk transmission between Islamic and conventional stock markets: A return and volatility spillover analysis. International Review of Financial Analysis 52: 9–26. [Google Scholar] [CrossRef] [Green Version]
- Sharif, Arshian, Chaker Aloui, and Larisa Yarovaya. 2020. COVID-19 pandemic, oil prices, stock market and policy uncertainty nexus in the US economy: Fresh evidence from the wavelet-based approach. SSRN Electronic Journal 70: 1–20. [Google Scholar]
- Sharpe, William F. 1964. Capital asset prices: A theory of market equilibrium under conditions of risk*. The Journal of Finance 19: 425–42. [Google Scholar] [CrossRef] [Green Version]
- Tiwari, Aviral Kumar, Kuptan G. Suresh, Mohamed Arouri, and Frédéric Teulon. 2014. Causality between consumer price and producer price: Evidence from Mexico. Economic Modelling 36: 432–40. [Google Scholar] [CrossRef]
- Torrence, Christopher, and Gilbert P. Compo. 1998. A practical guide to wavelet analysis. Bulletin of the American Meteorological Society 79: 61–78. [Google Scholar] [CrossRef]
- Torun, Erdost, Afife Duygu Ayhan Akdeniz, Erhan Demireli, and Simon Grima. 2022. Long-Term US Economic Growth and the Carbon Dioxide Emissions Nexus: A Wavelet-Based Approach. Sustainability 14: 10566. [Google Scholar] [CrossRef]
- Torun, Erdost, Tzu-Pu Chang, and Ray Y. Chou. 2020. Causal relationship between spot and futures prices with multiple time horizons: A nonparametric wavelet Granger causality test. Research in International Business and Finance 52: 101115. [Google Scholar] [CrossRef]
- Umar, Zaghum. 2017. Islamic vs. conventional equities in a strategic asset allocation framework. Pacific Basin Finance Journal 42: 1–10. [Google Scholar] [CrossRef]
- Umar, Zaghum, and Mariya Gubareva. 2020. A time-frequency analysis of the impact of the COVID-19 induced panic on the volatility of currency and Cryptocurrency markets. Journal of Behavioral and Experimental Finance 28: 100404. [Google Scholar] [CrossRef] [PubMed]
- Yan, Binxin, Logan Stuart, Andy Tu, and Tony Zhang. 2020. Analysis of the Effect of COVID-19 on the Stock Market and Investing Strategies. SSRN Electronic Journal. [Google Scholar] [CrossRef]
- Yarovaya, Larisa, Ahmed H. Elsayed, and Shawkat Hammoudeh. 2021. Determinants of Spillovers between Islamic and Conventional Financial Markets: Exploring the Safe Haven Assets during the COVID-19 Pandemic. Finance Research Letters 43: 101979. [Google Scholar] [CrossRef]

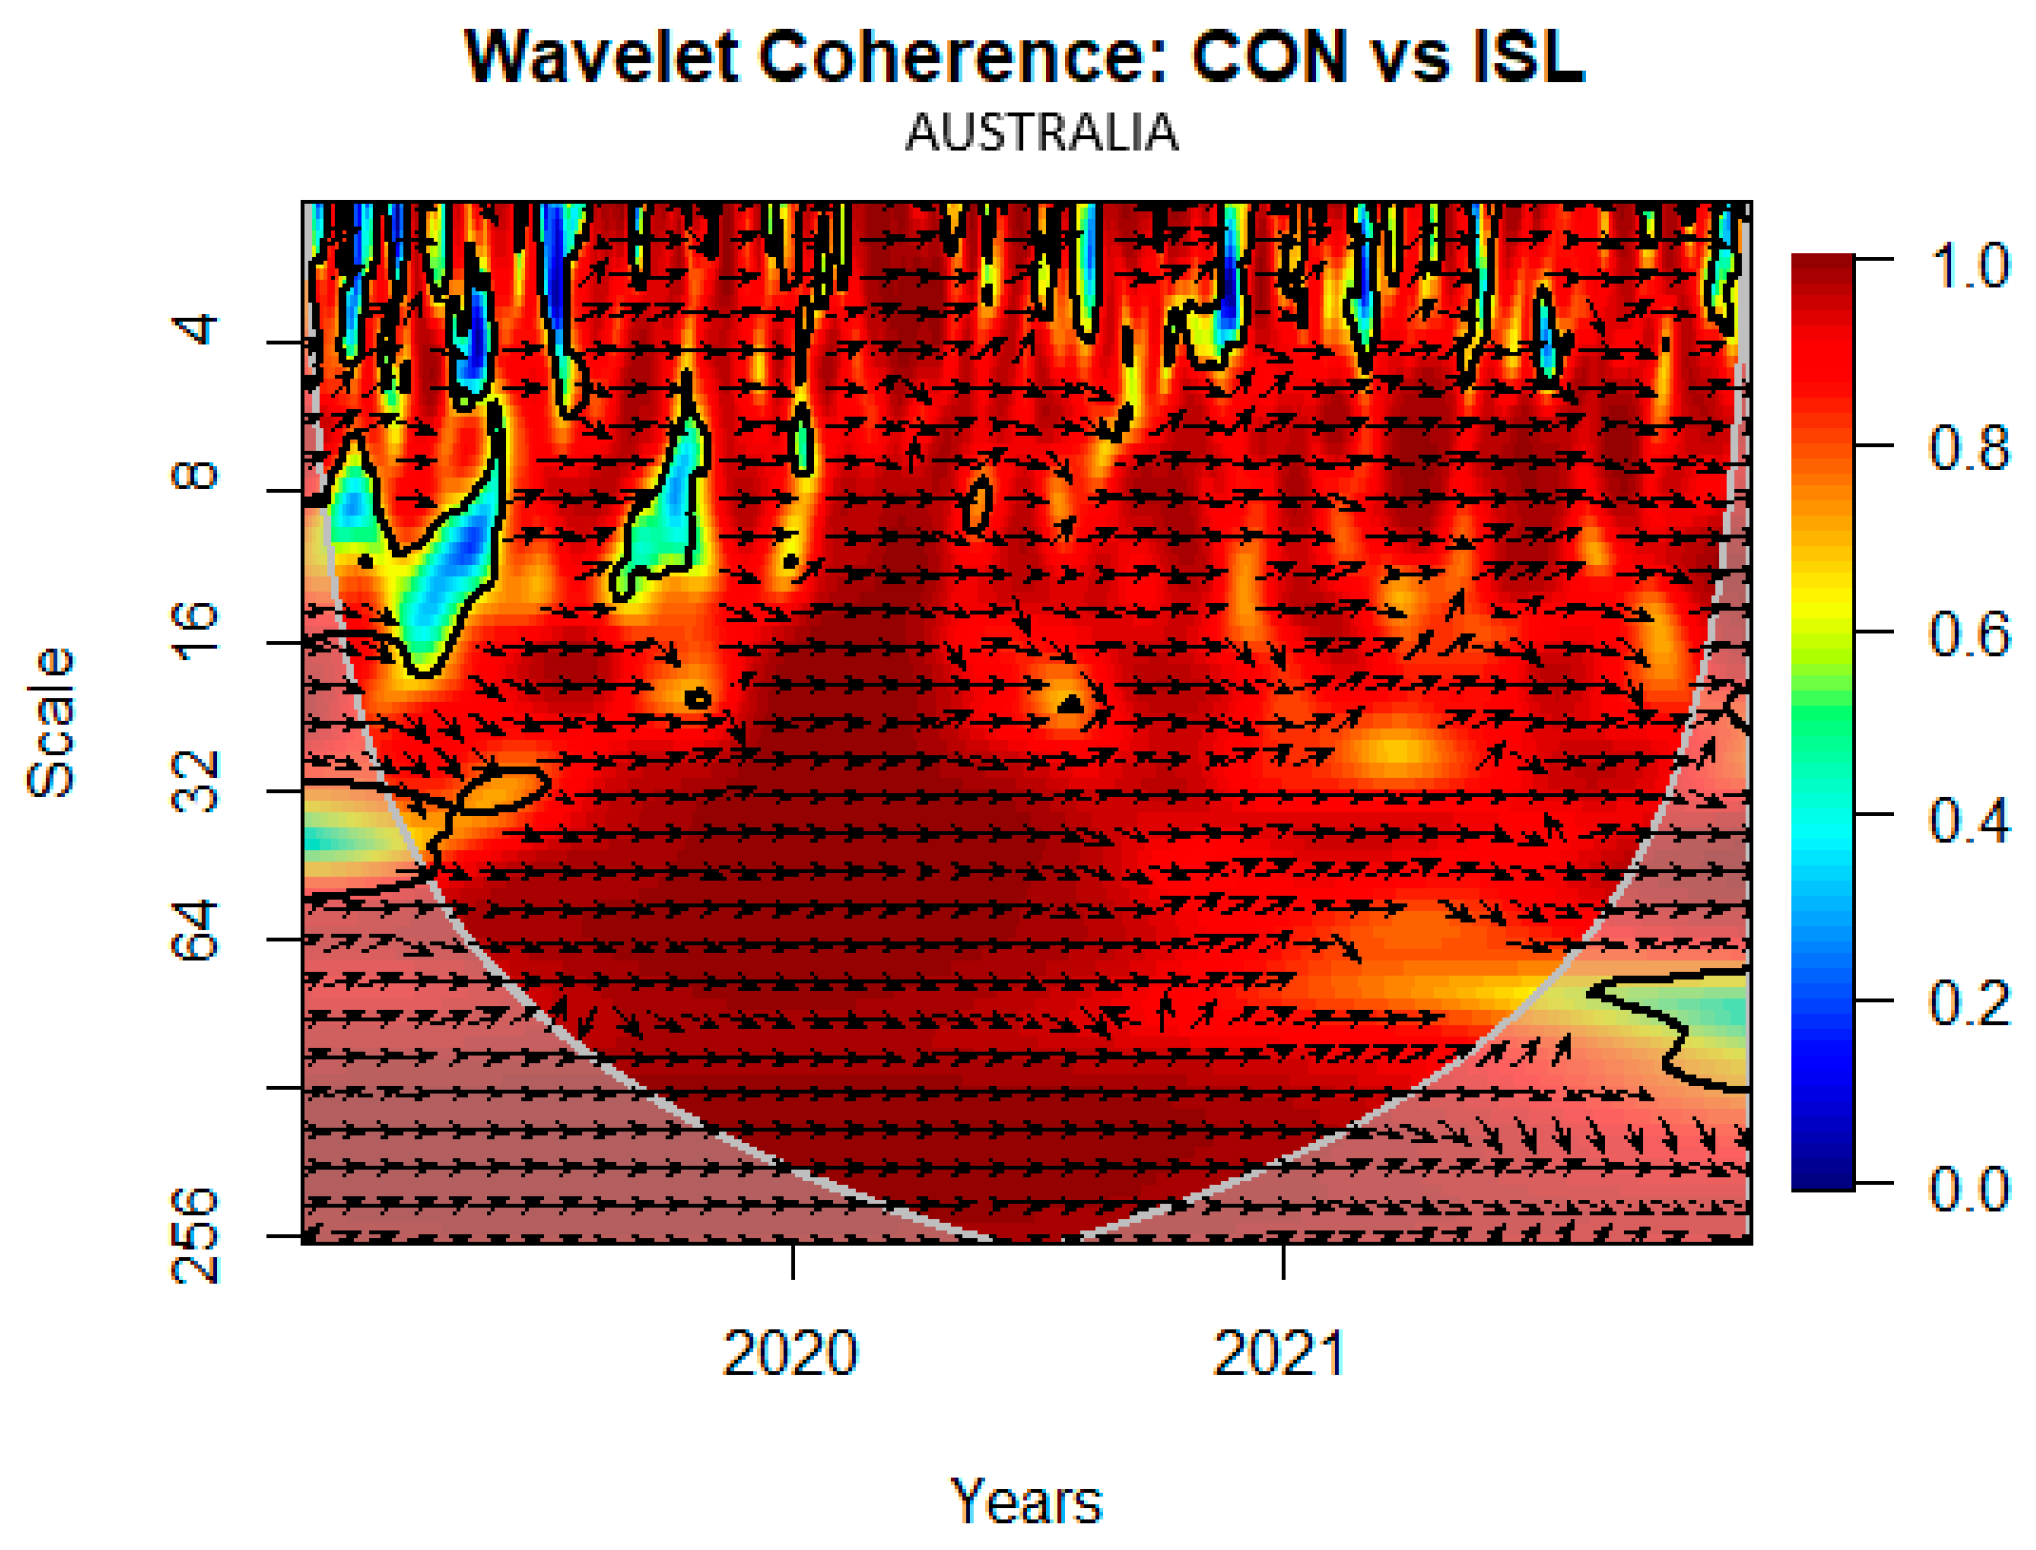
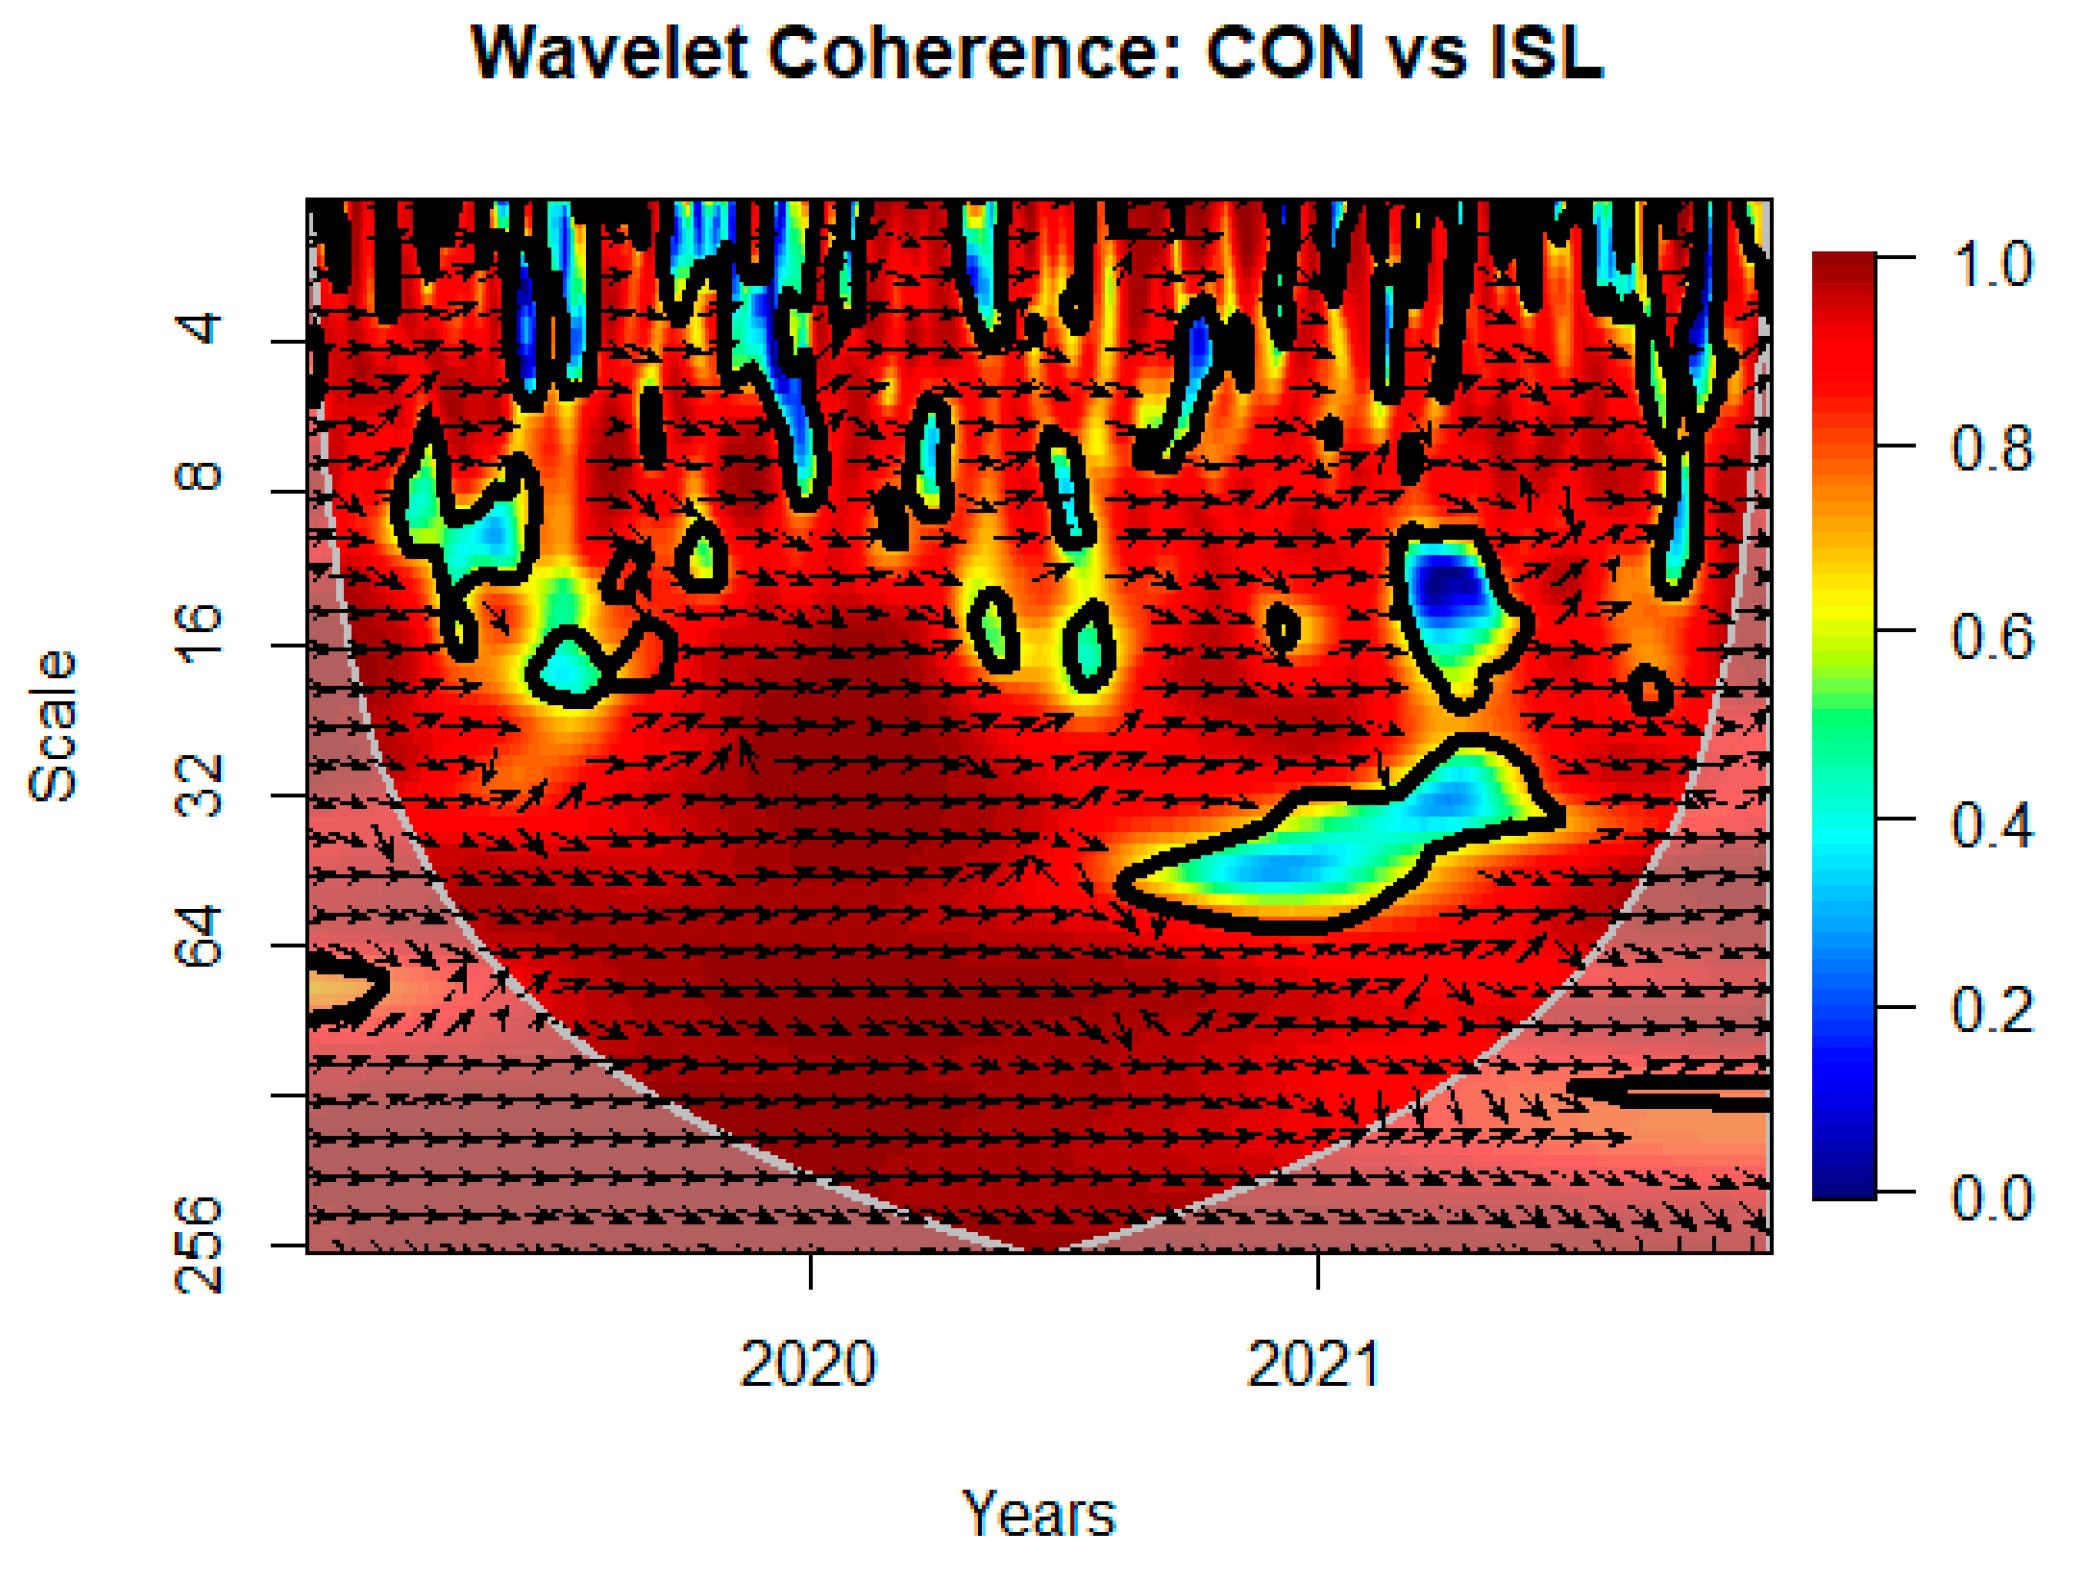
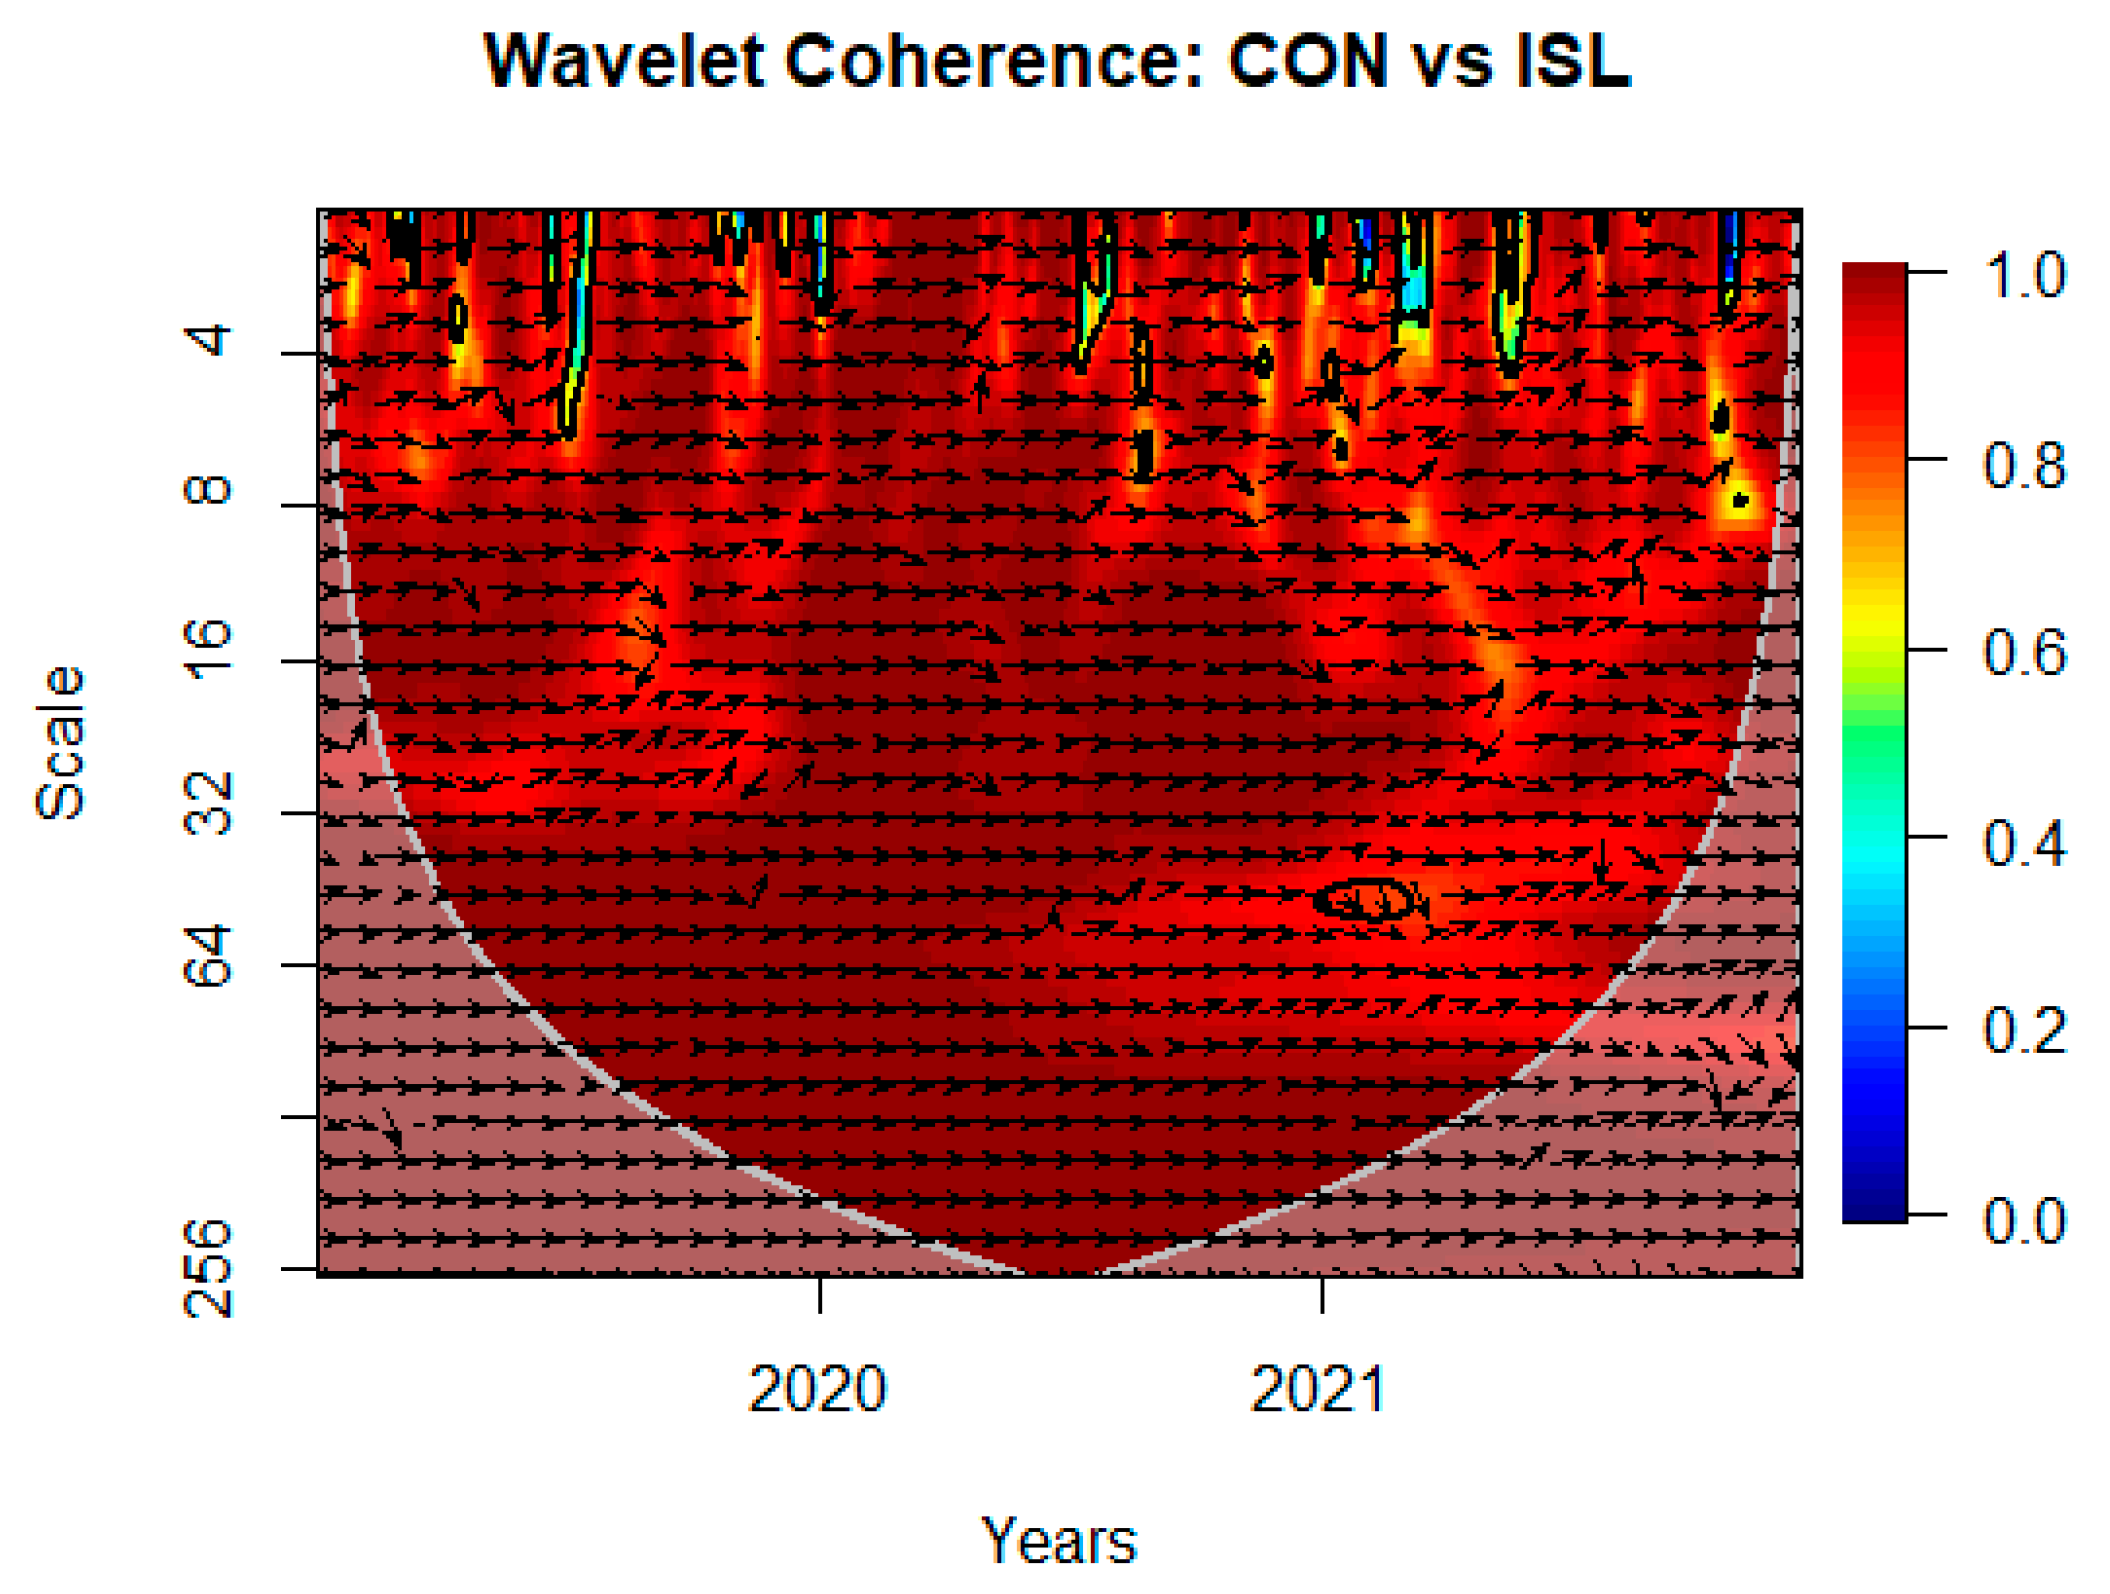
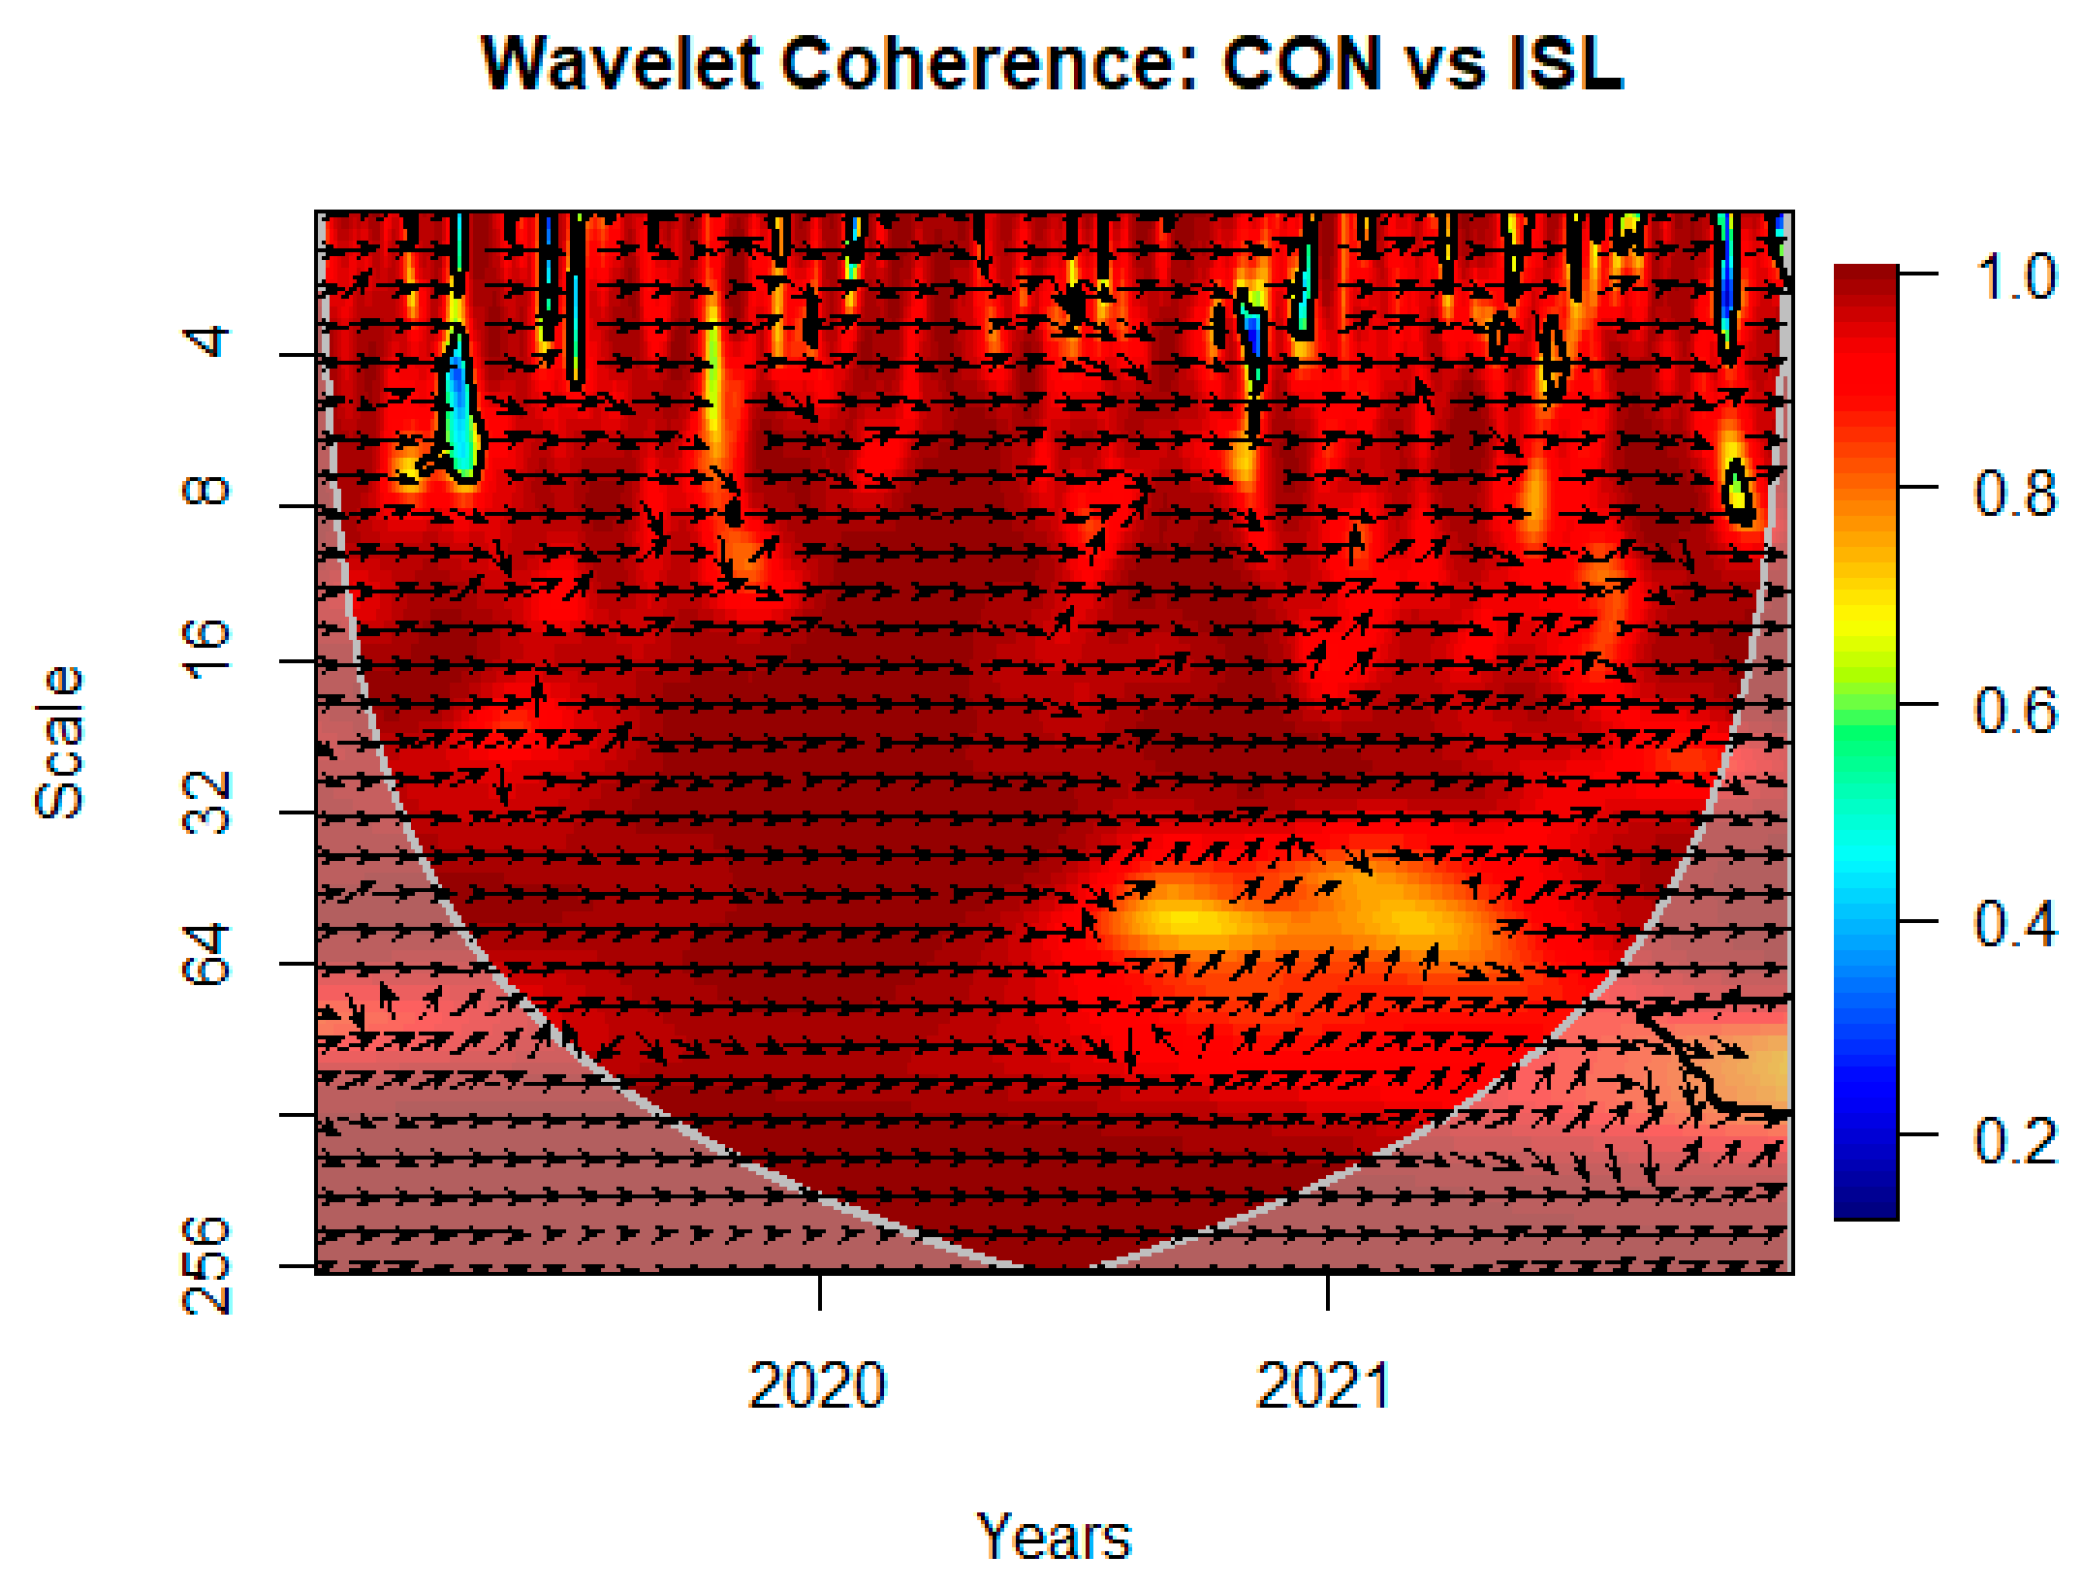
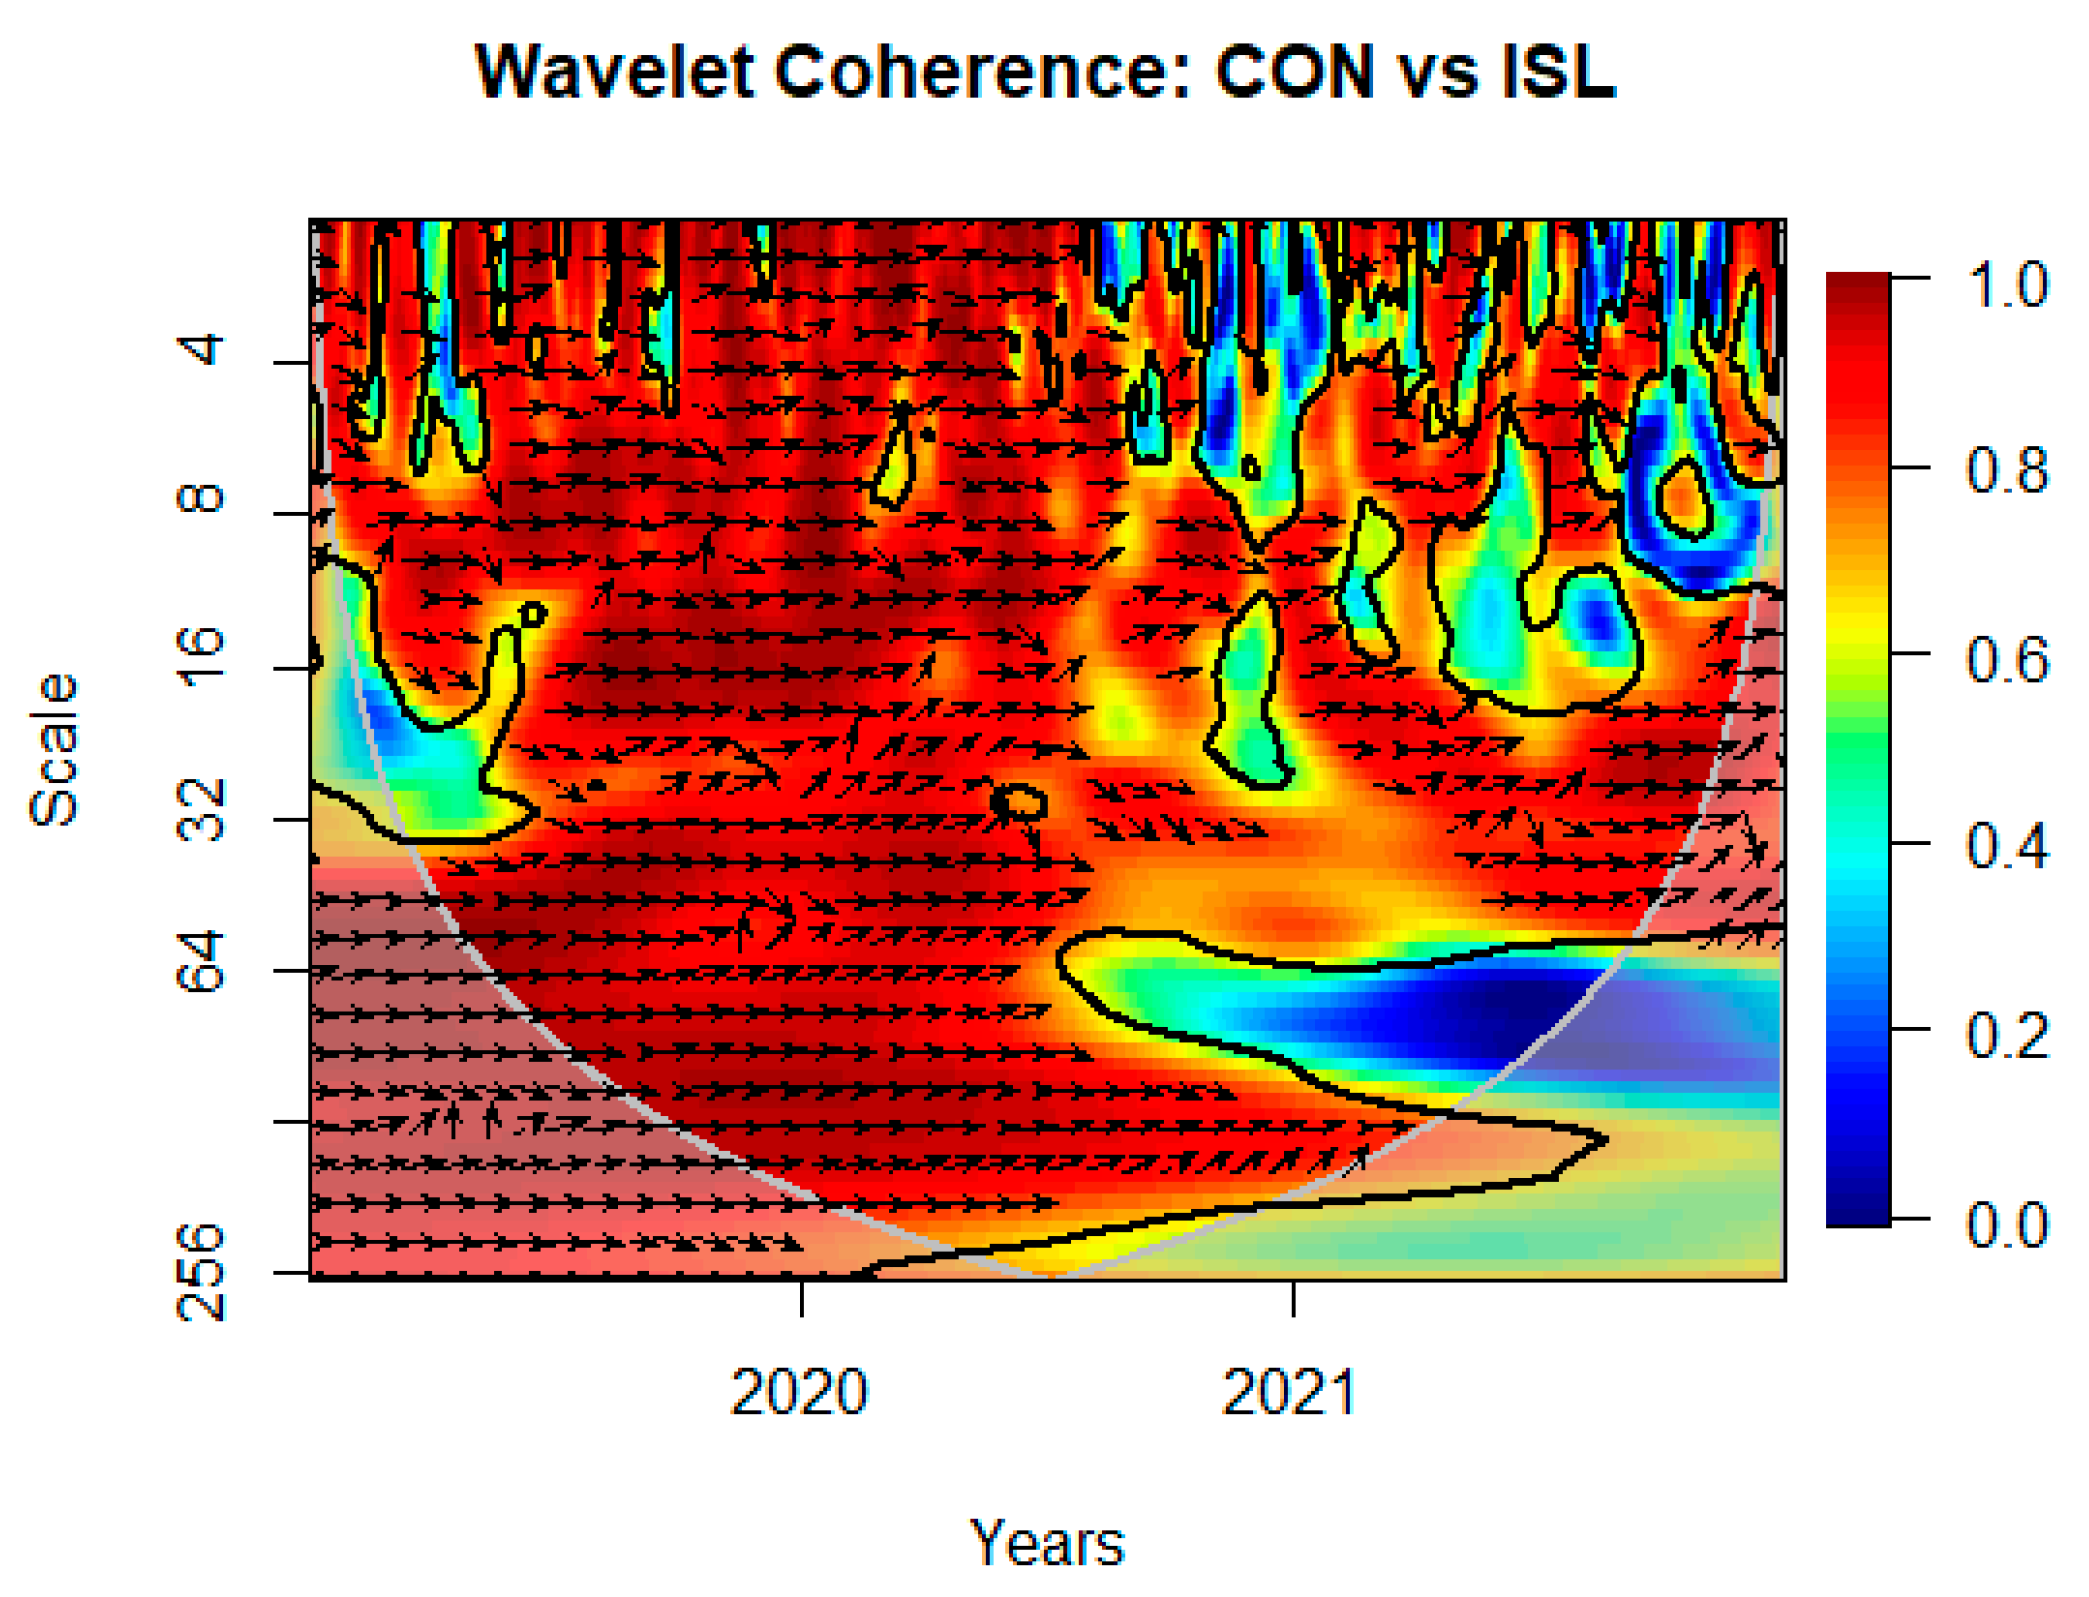
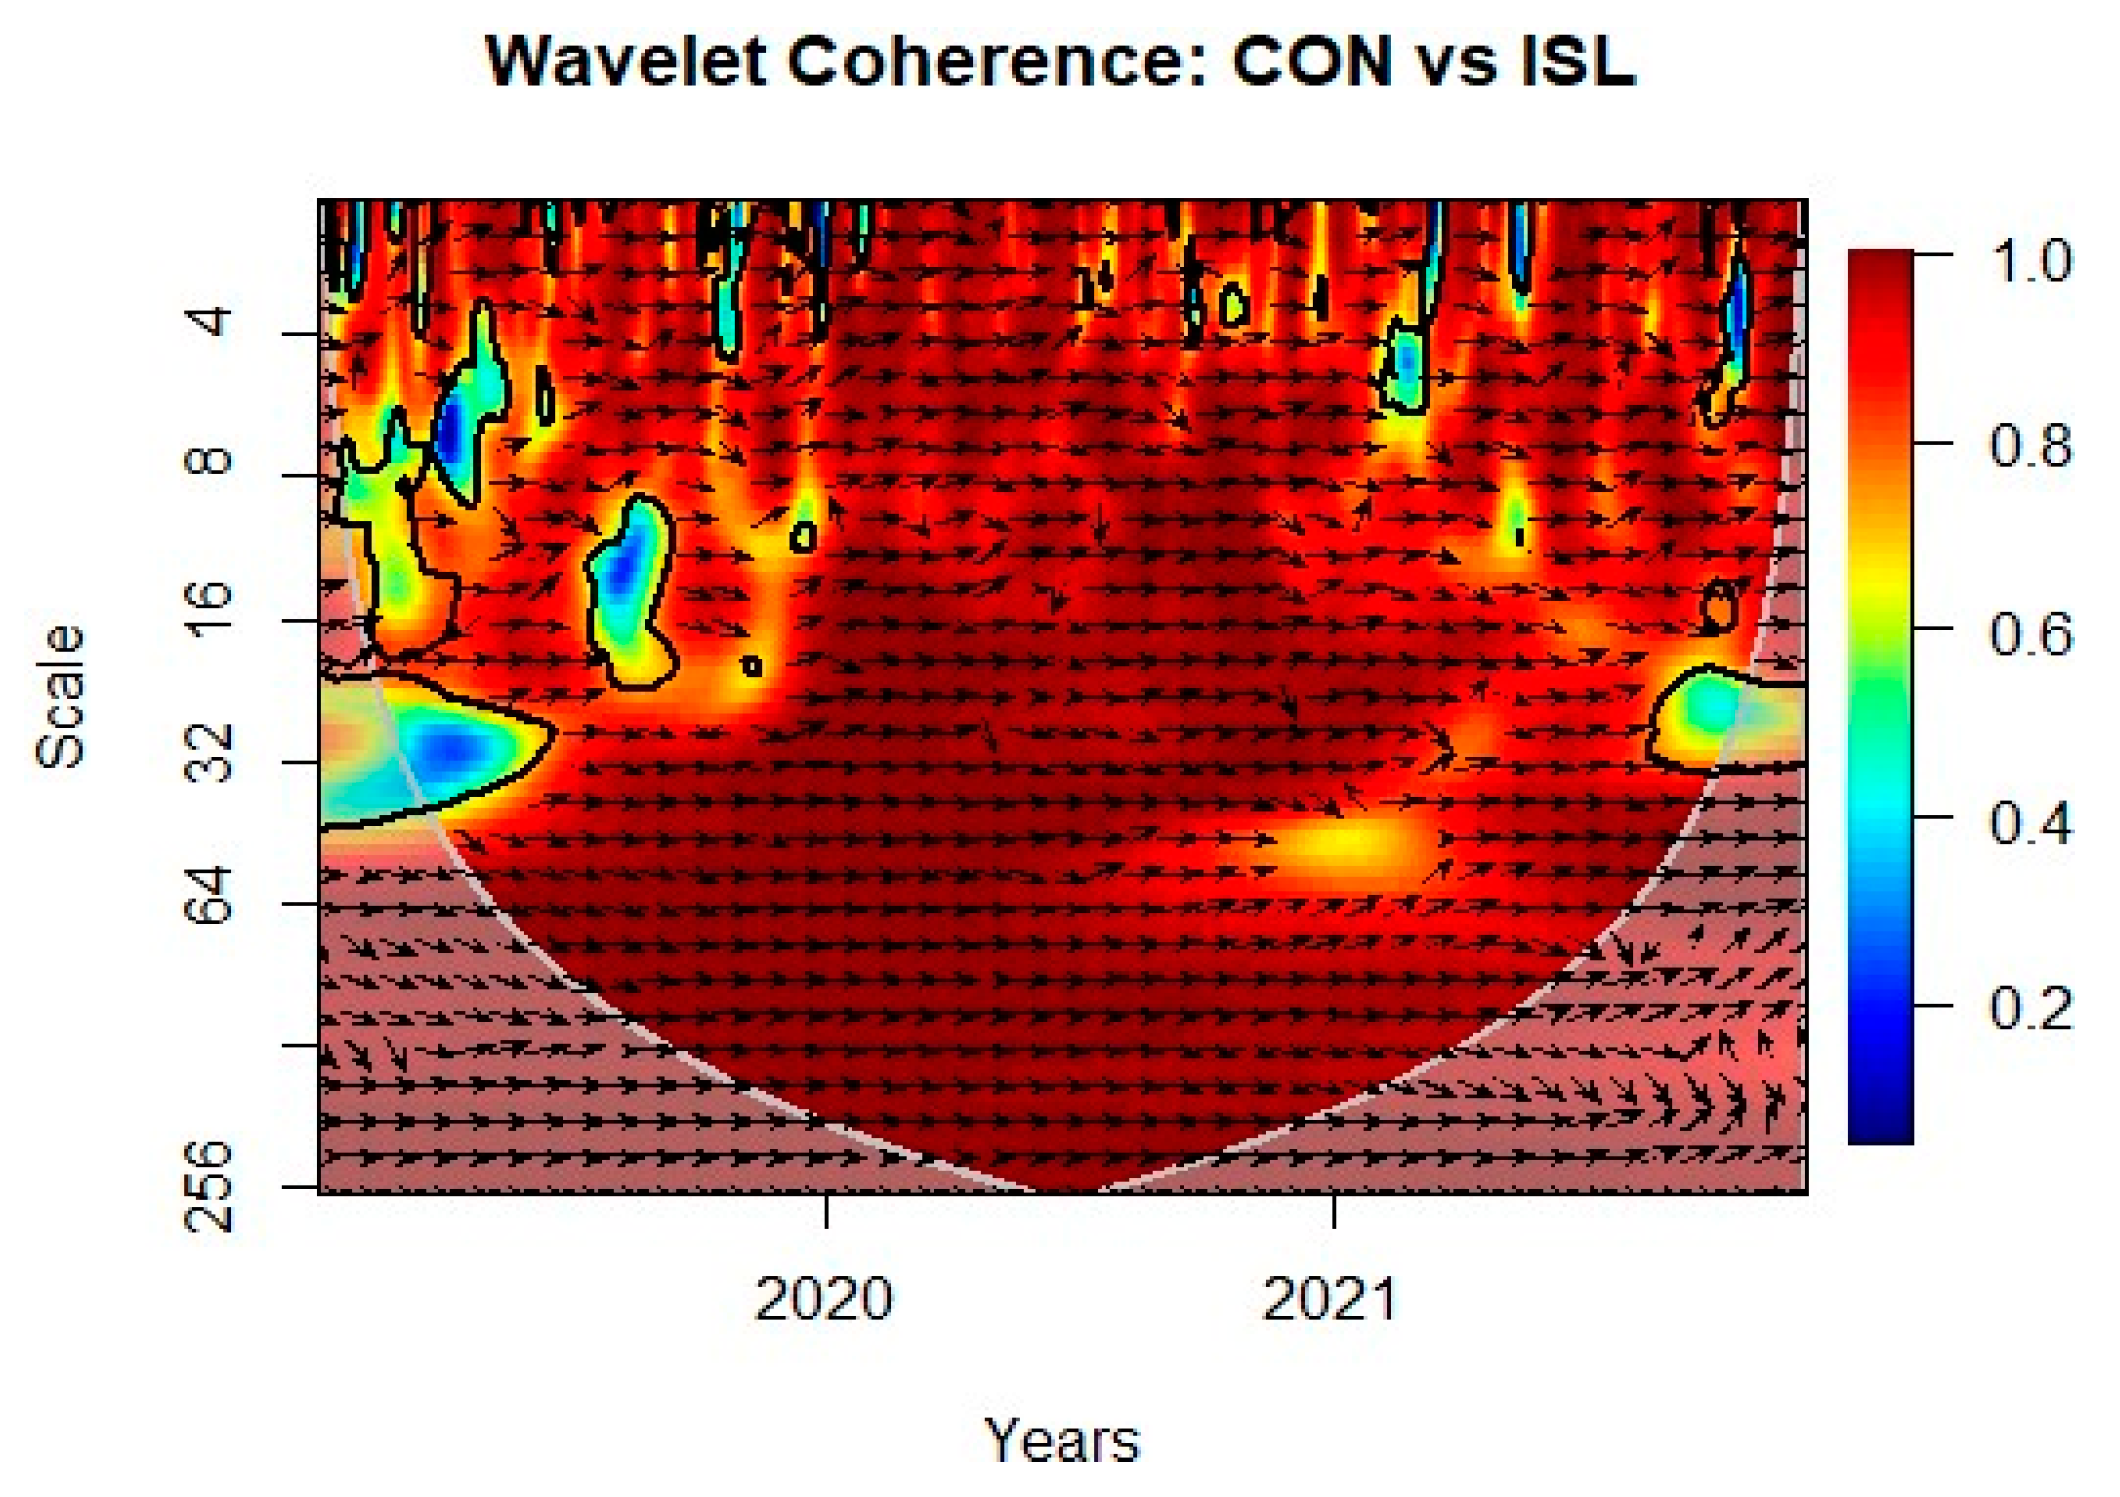
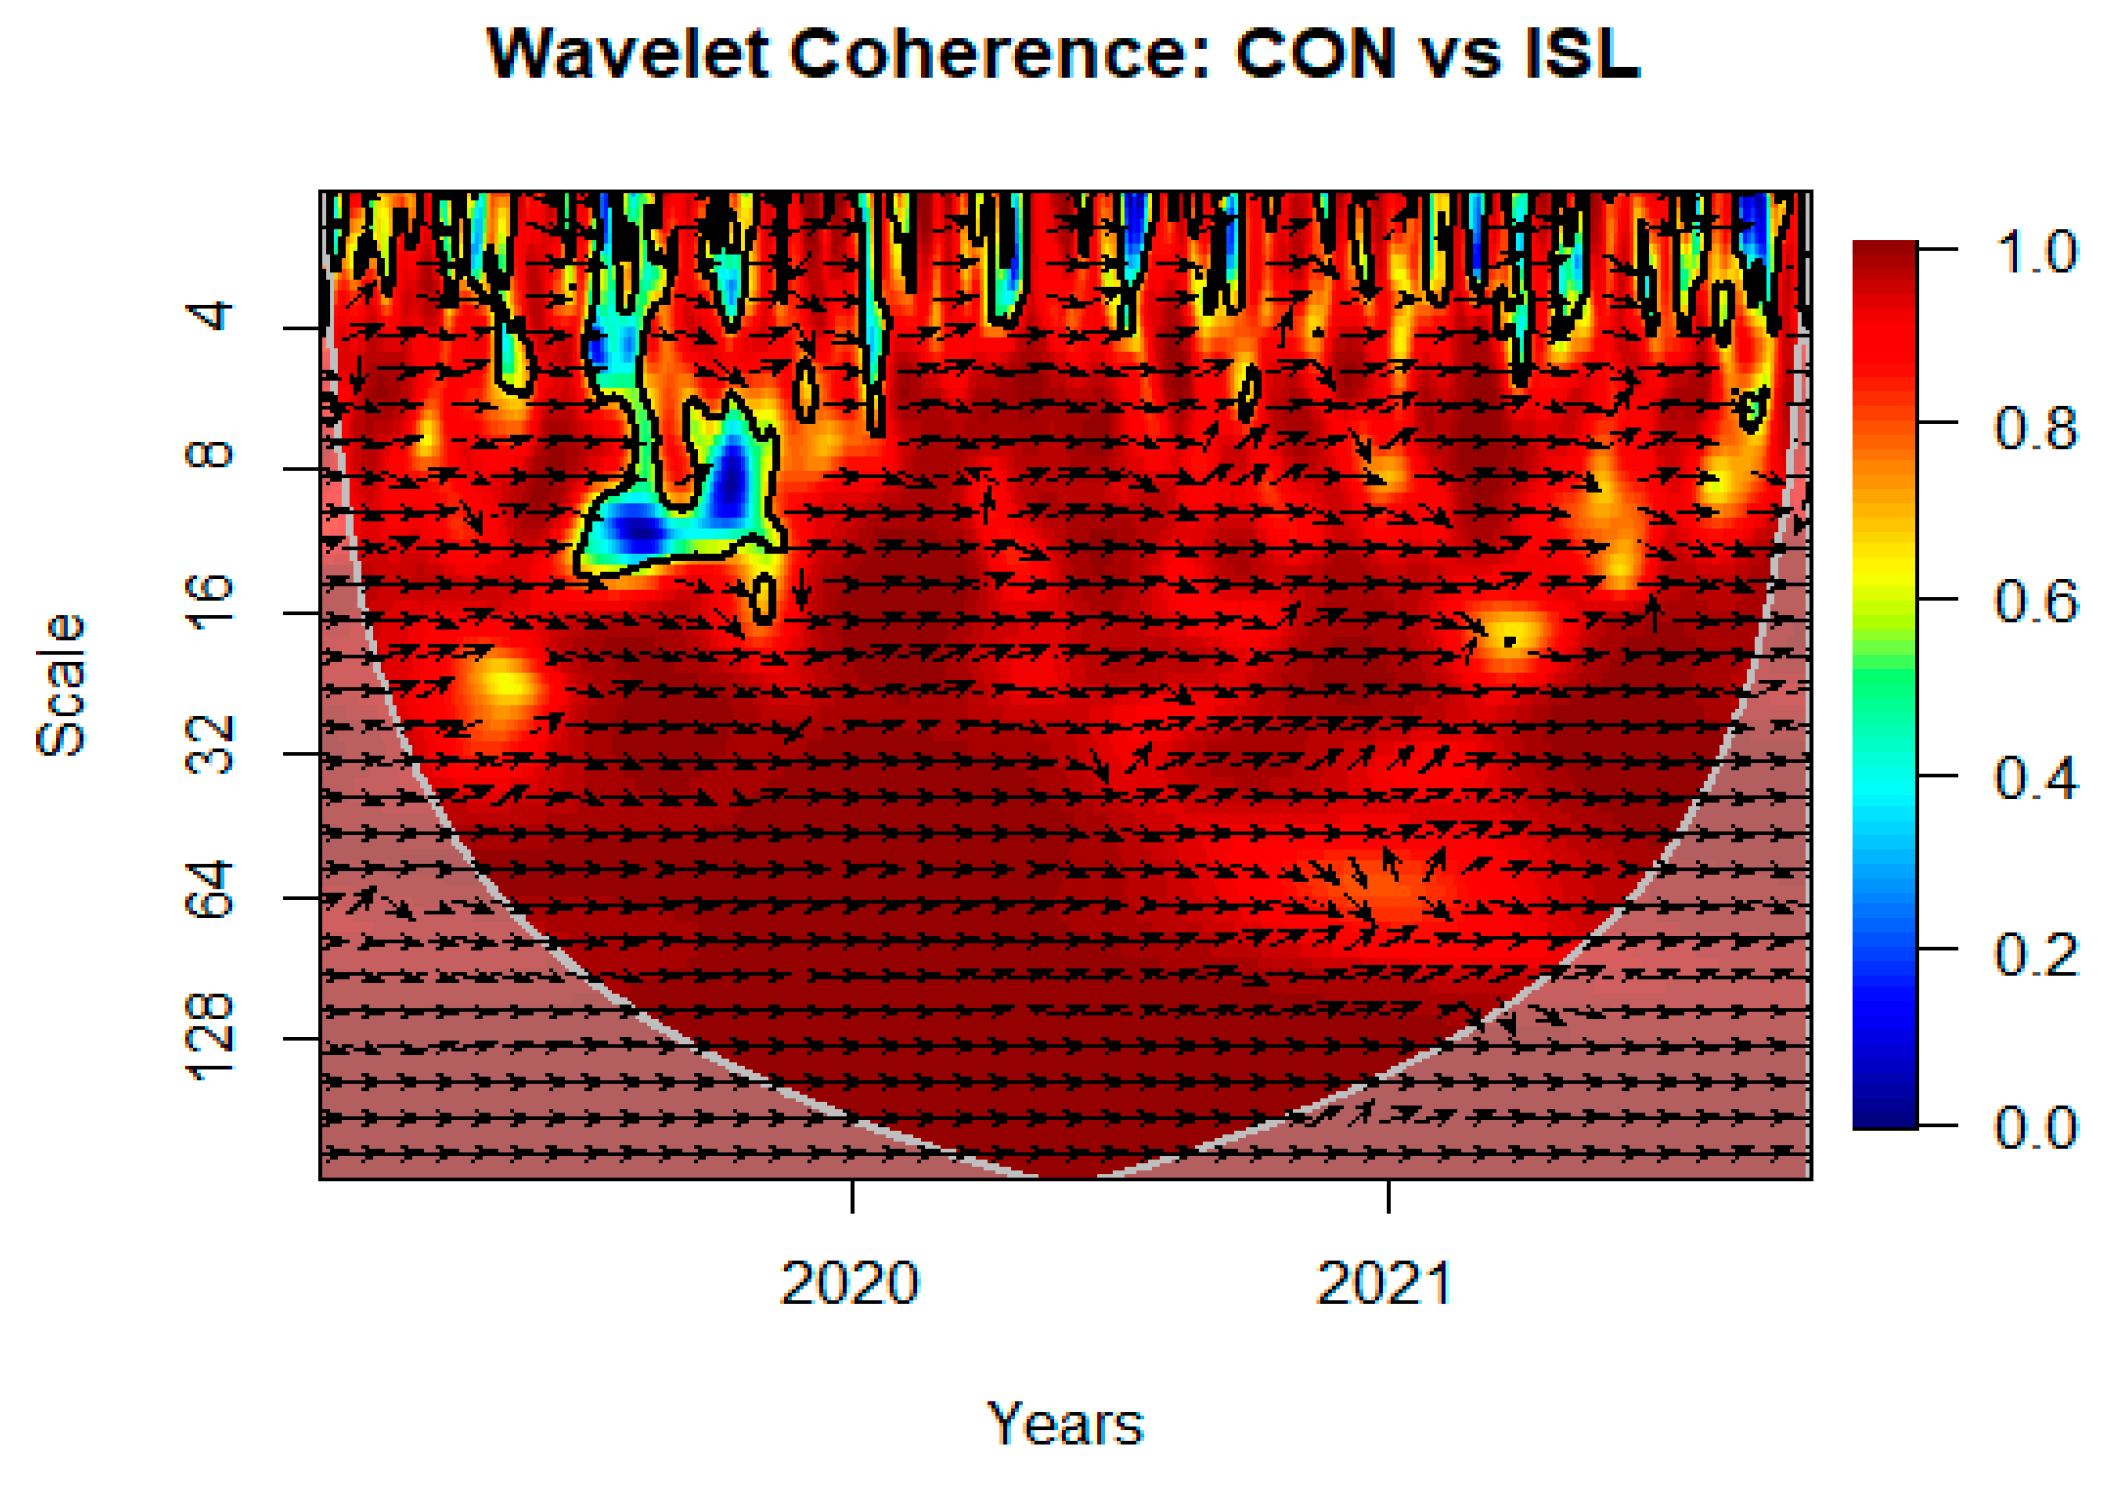
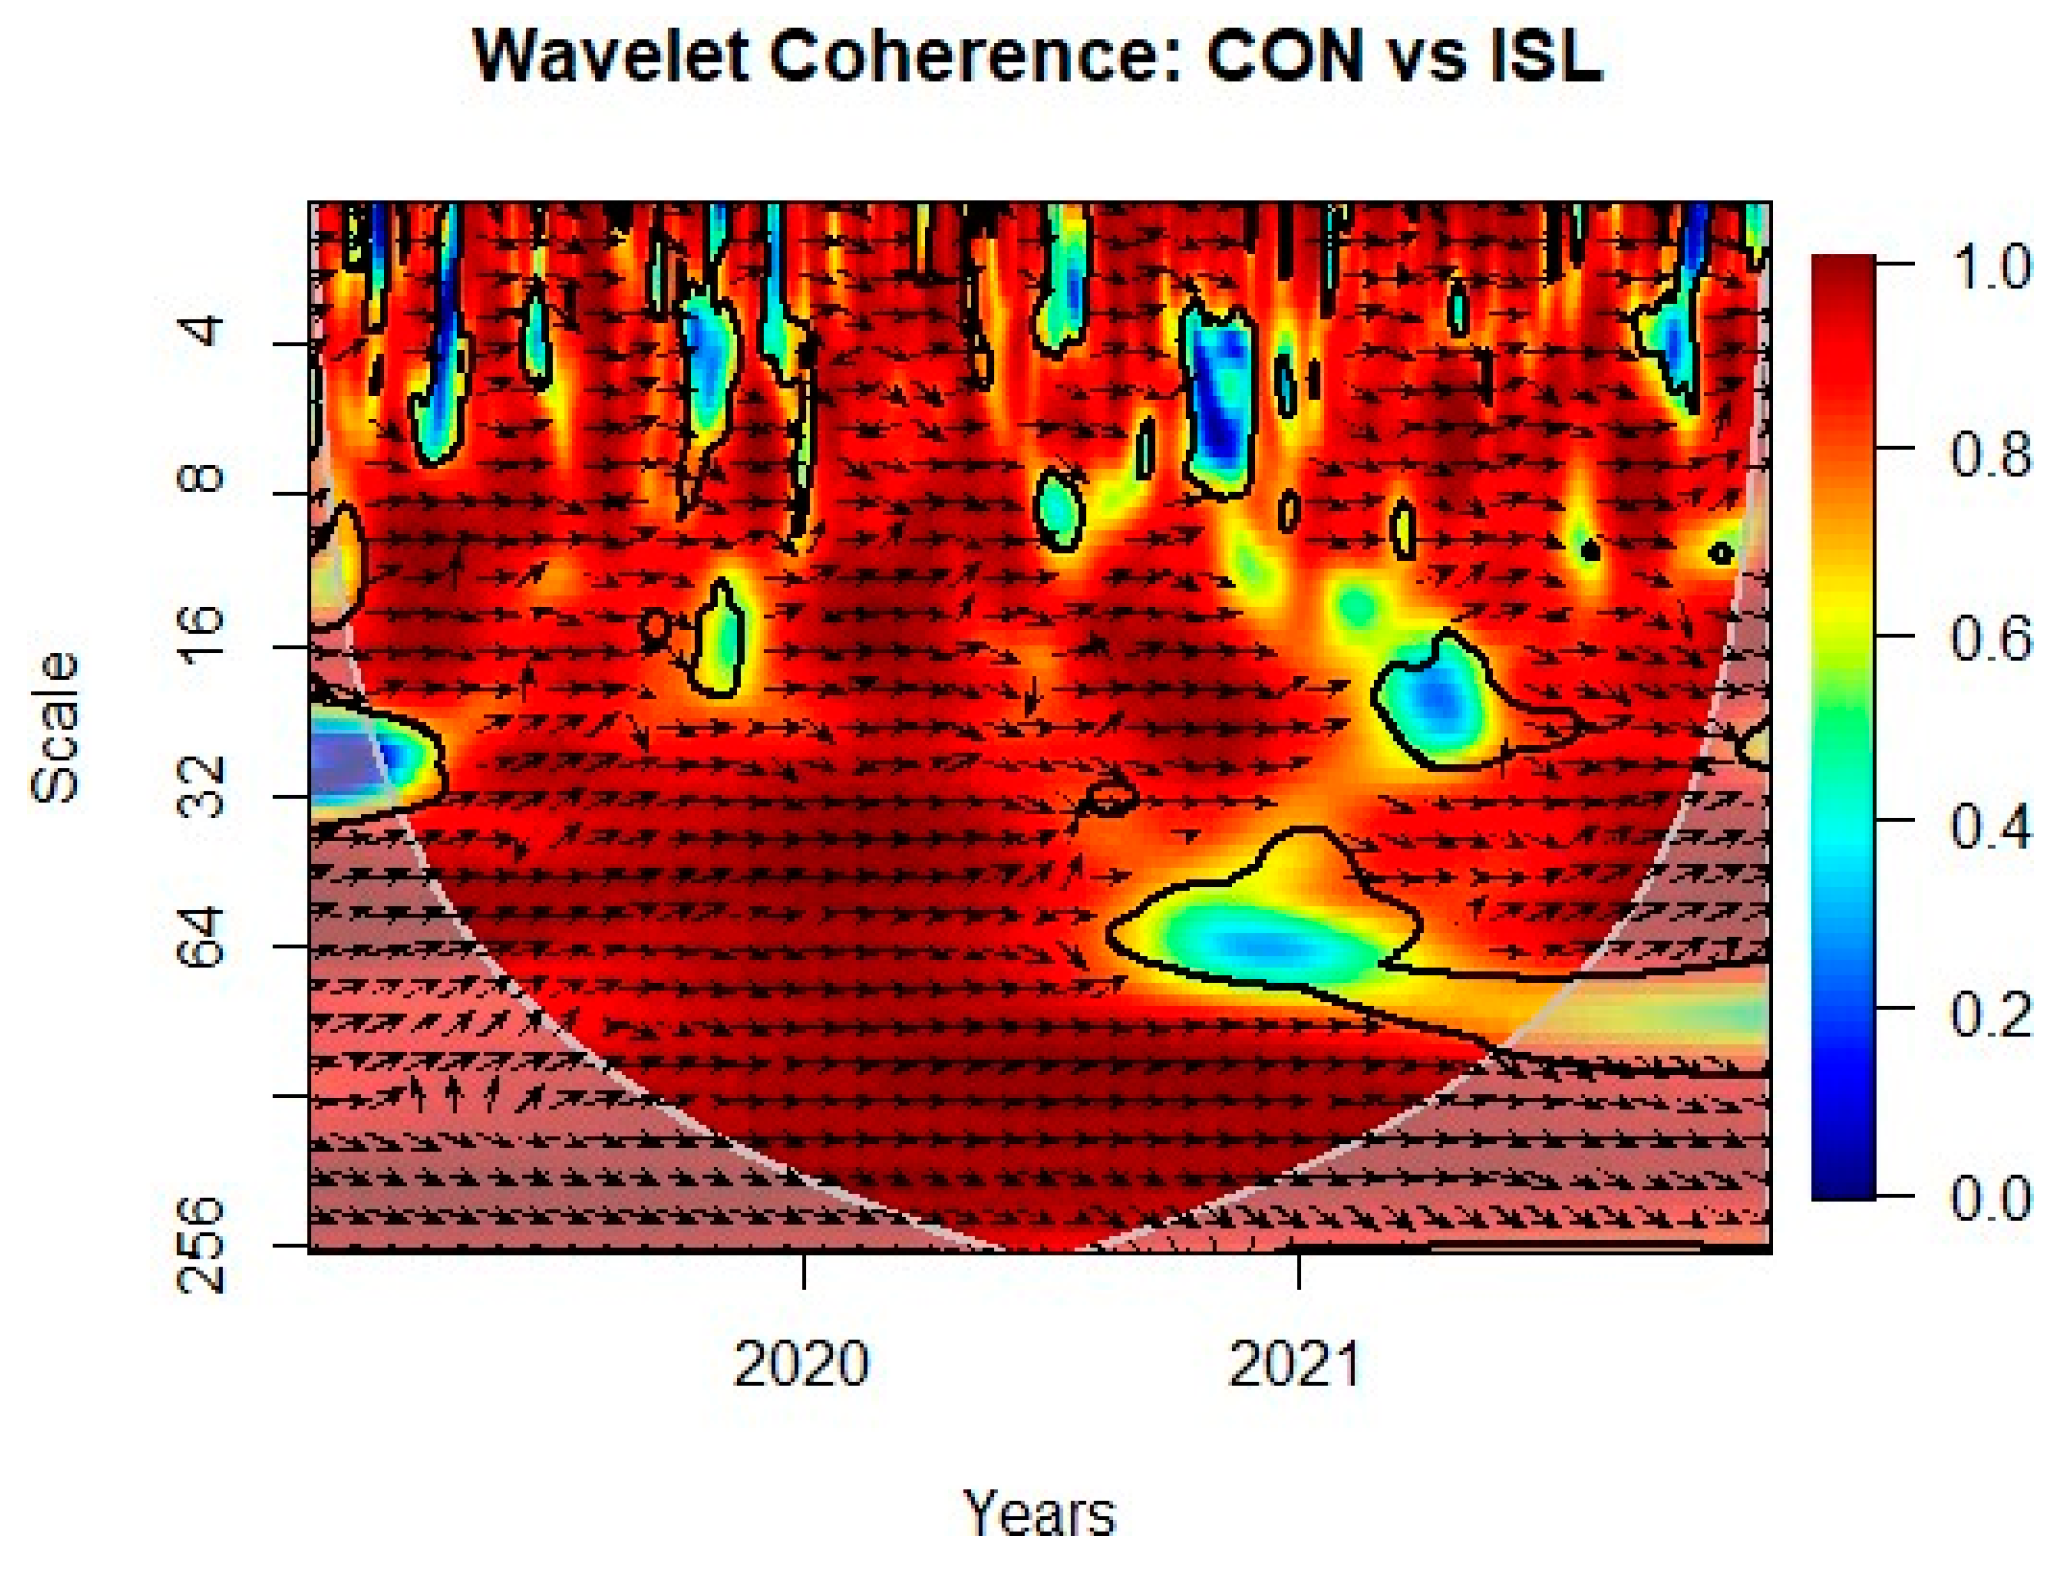
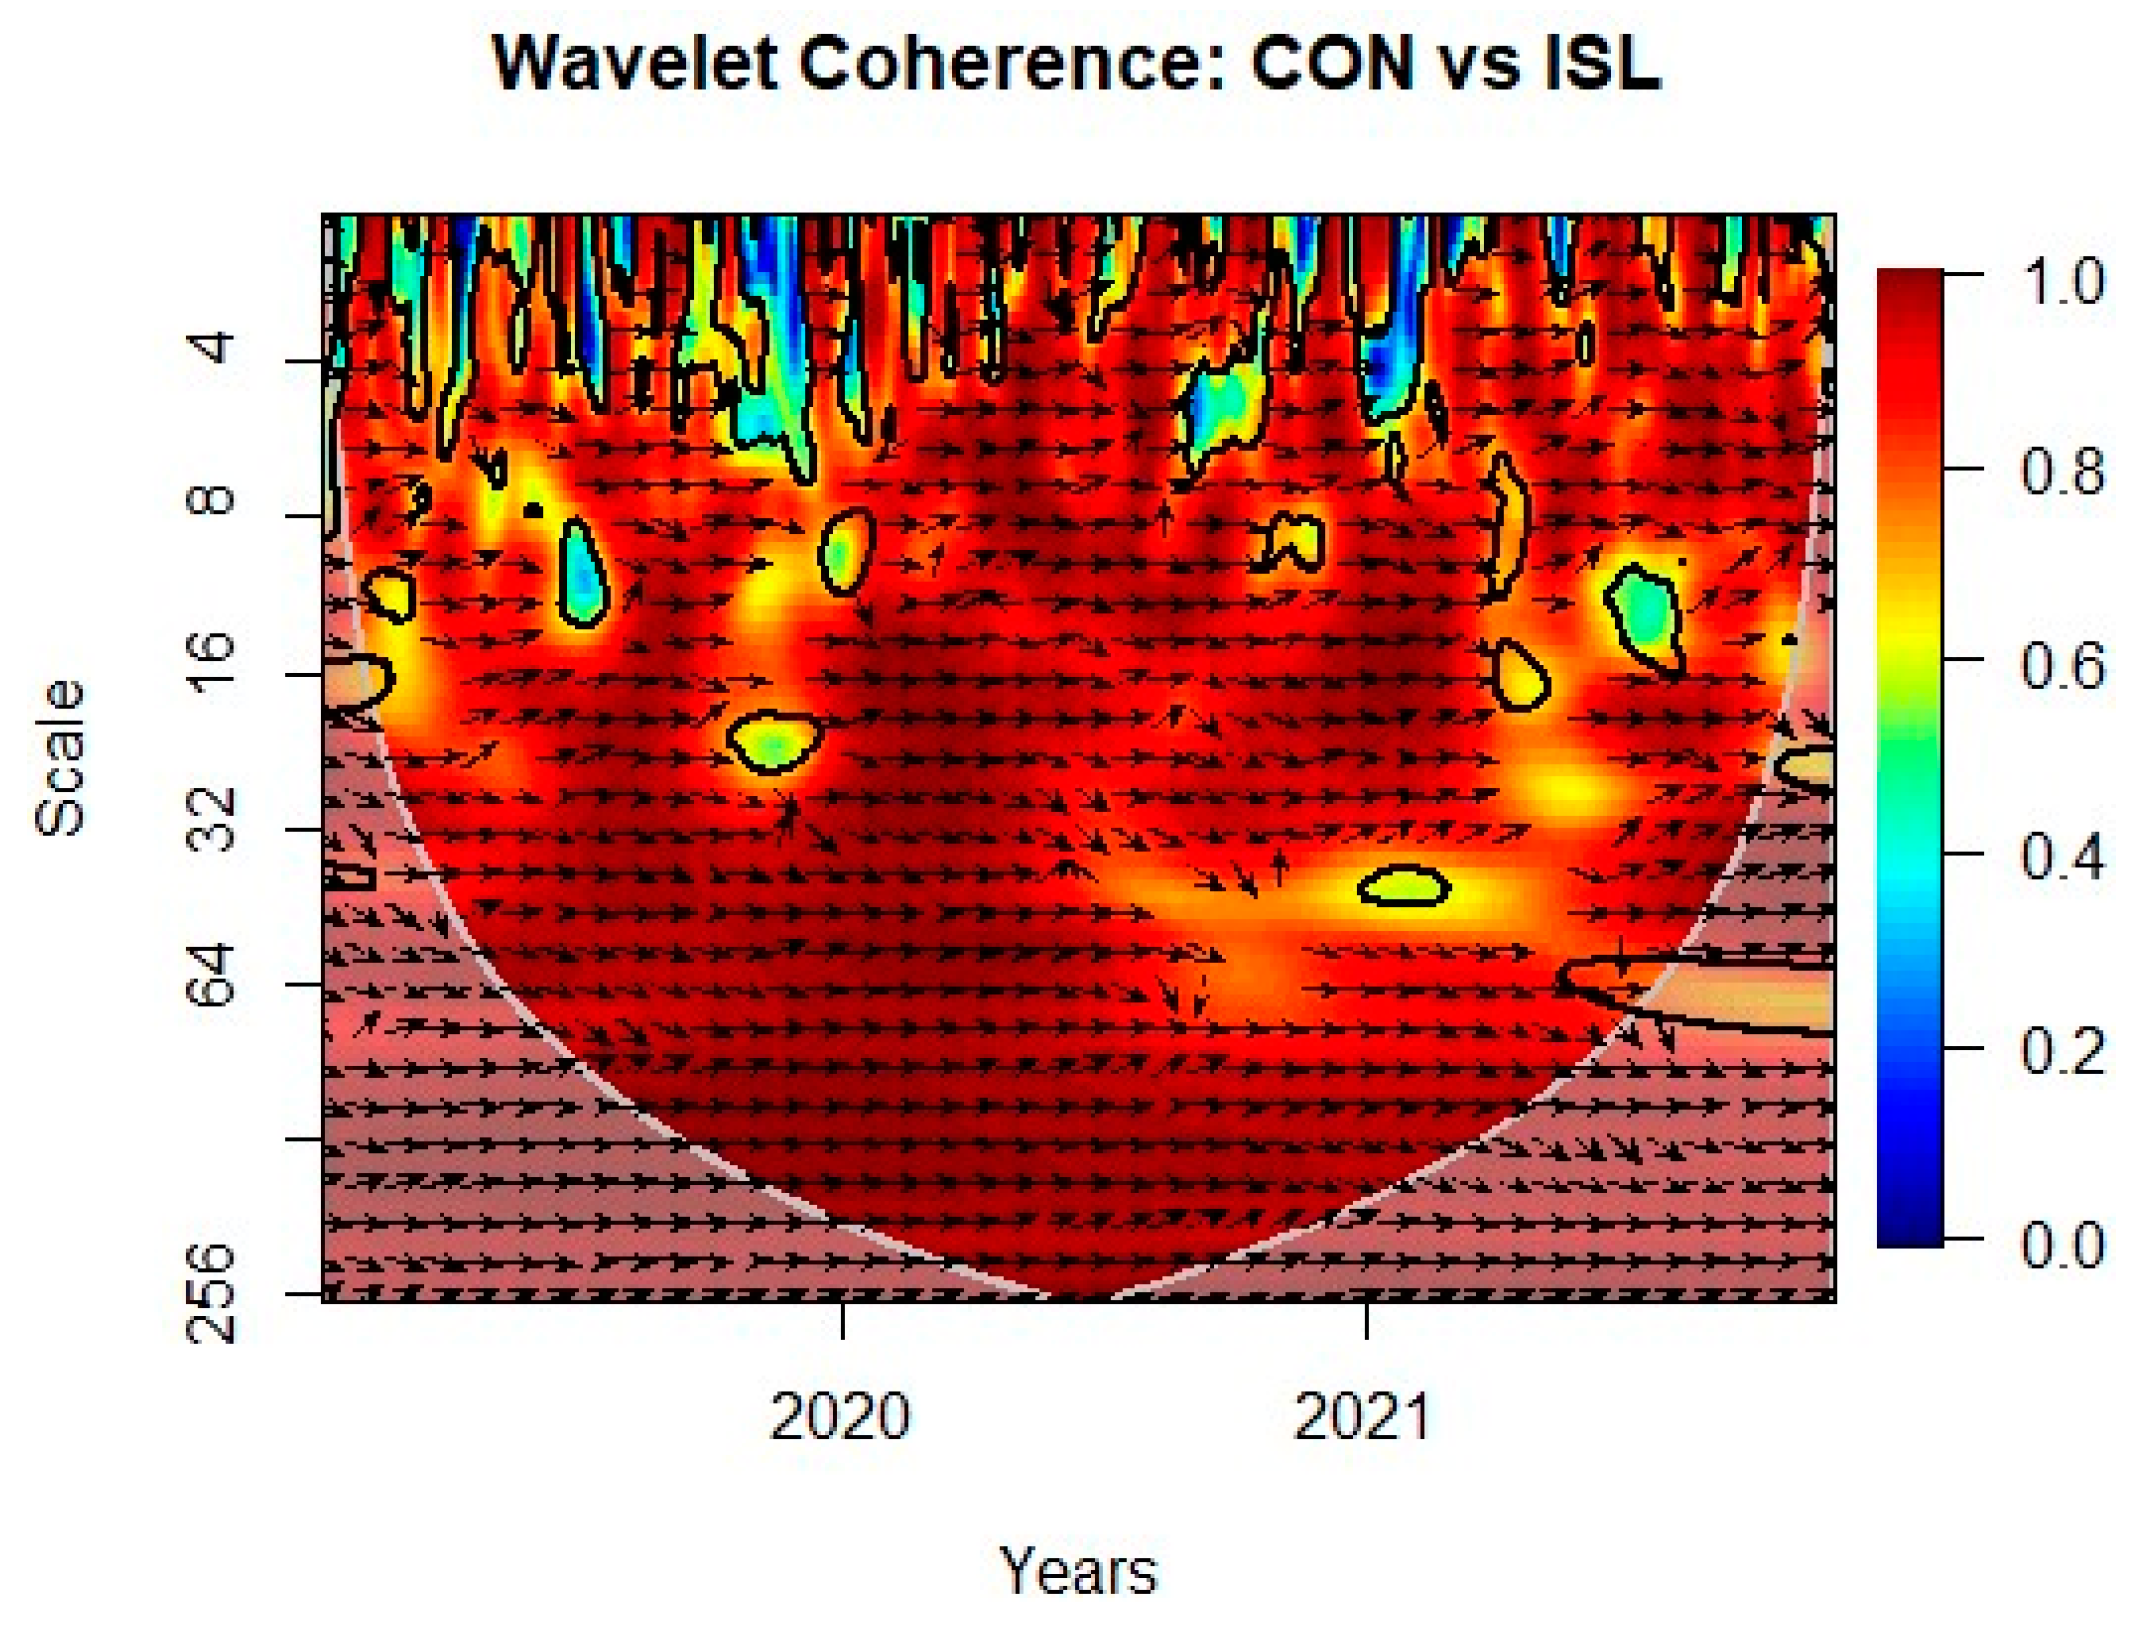
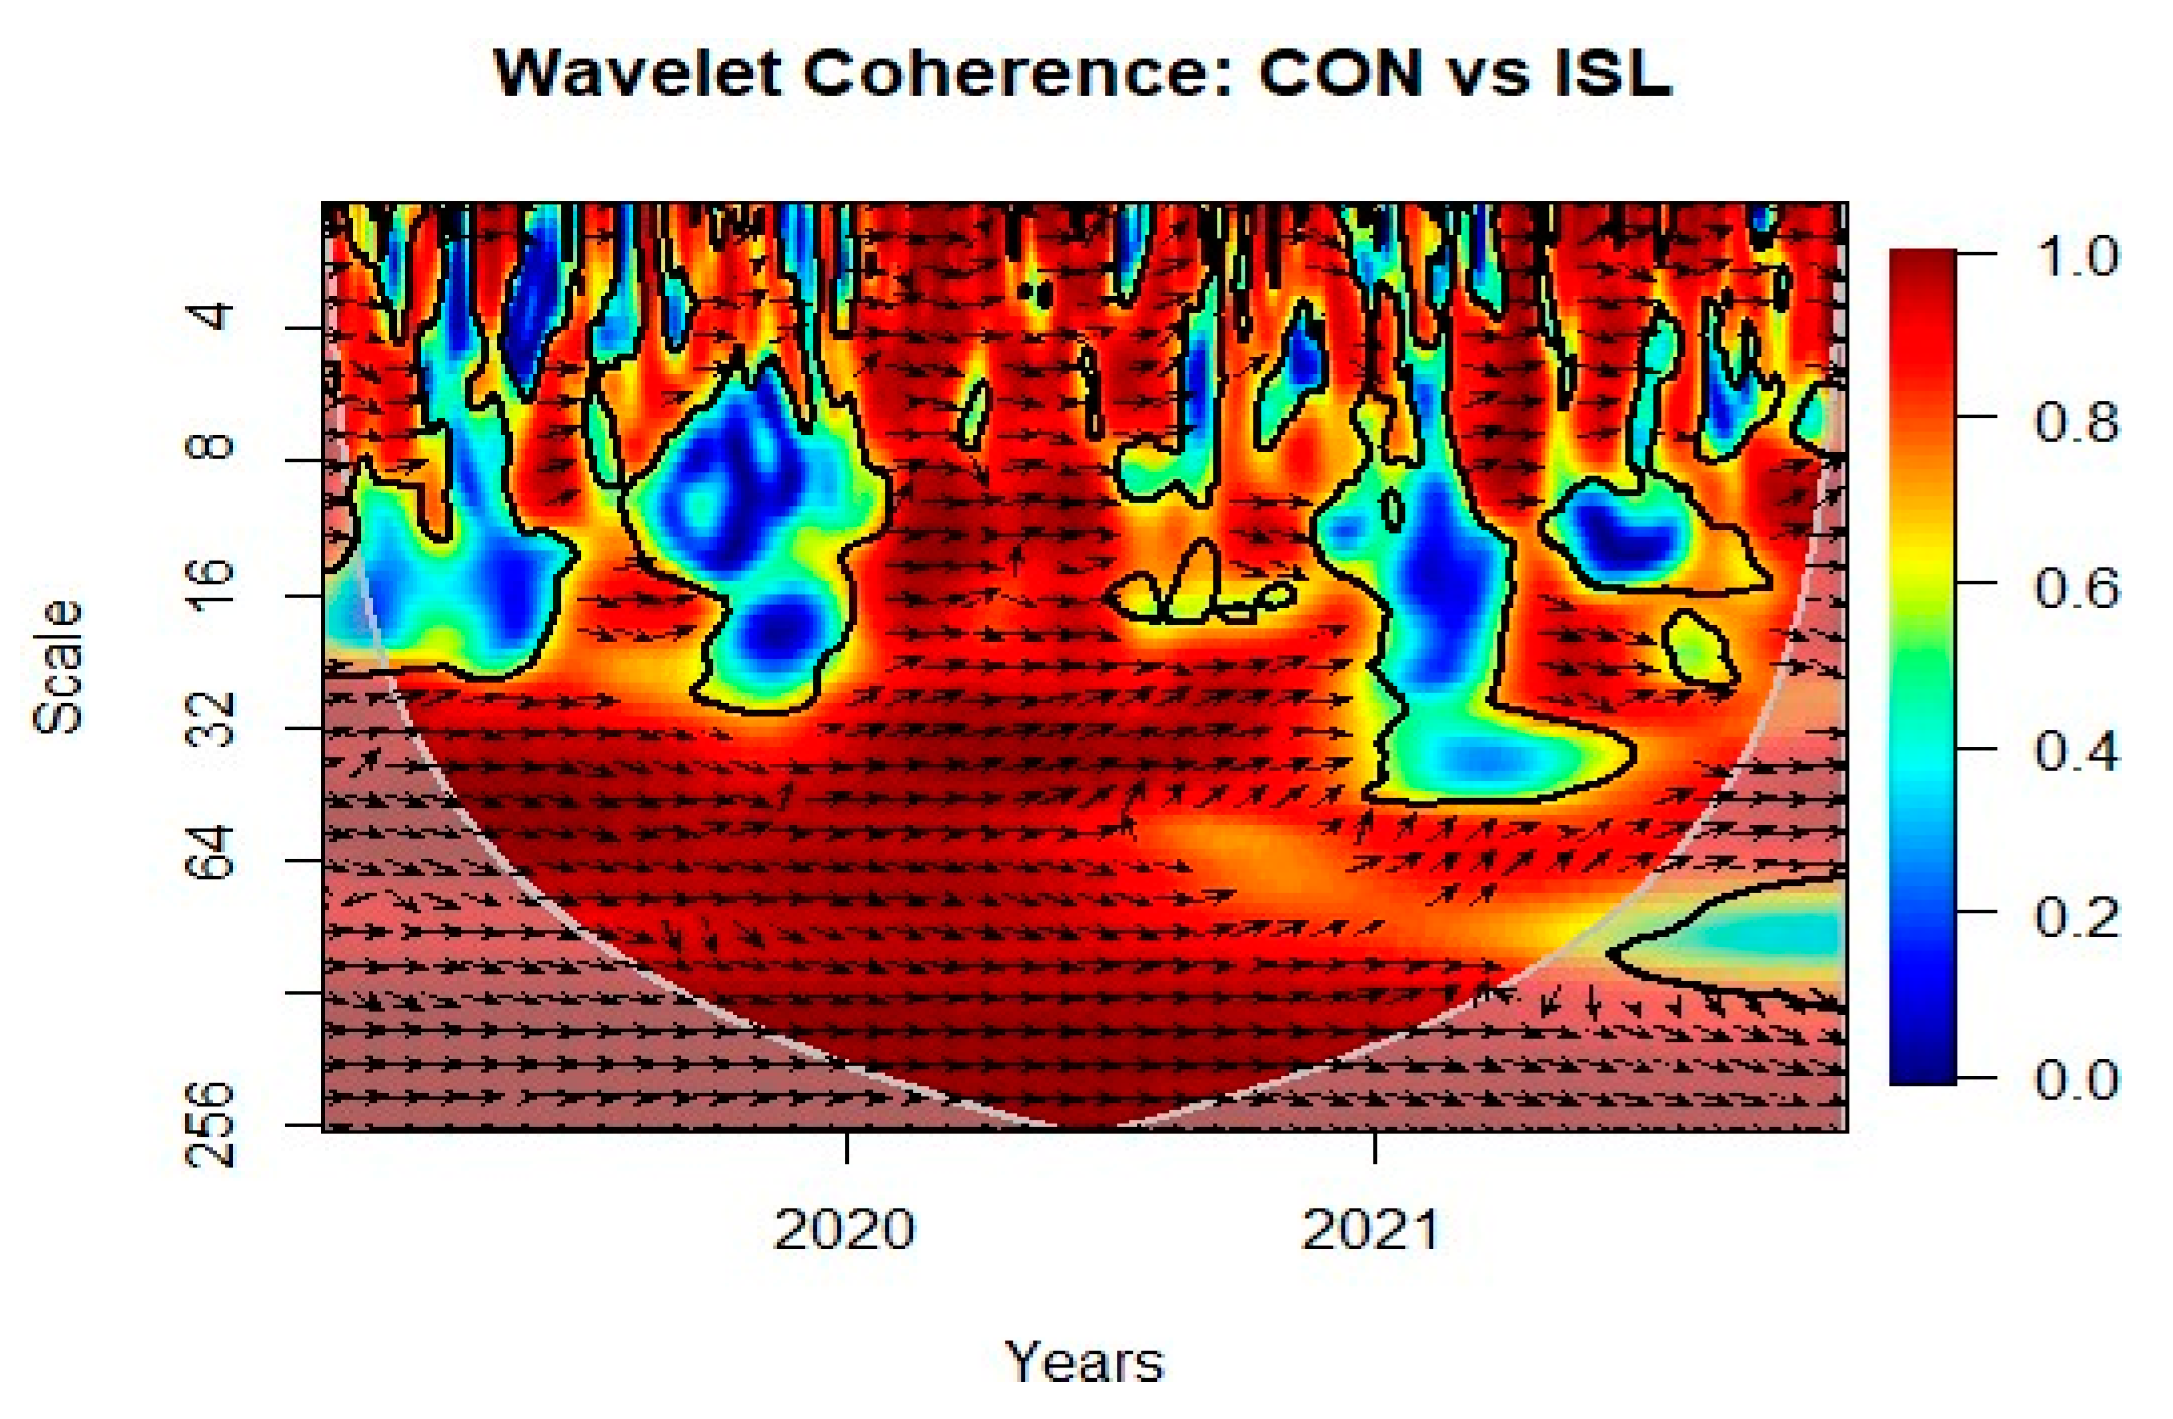
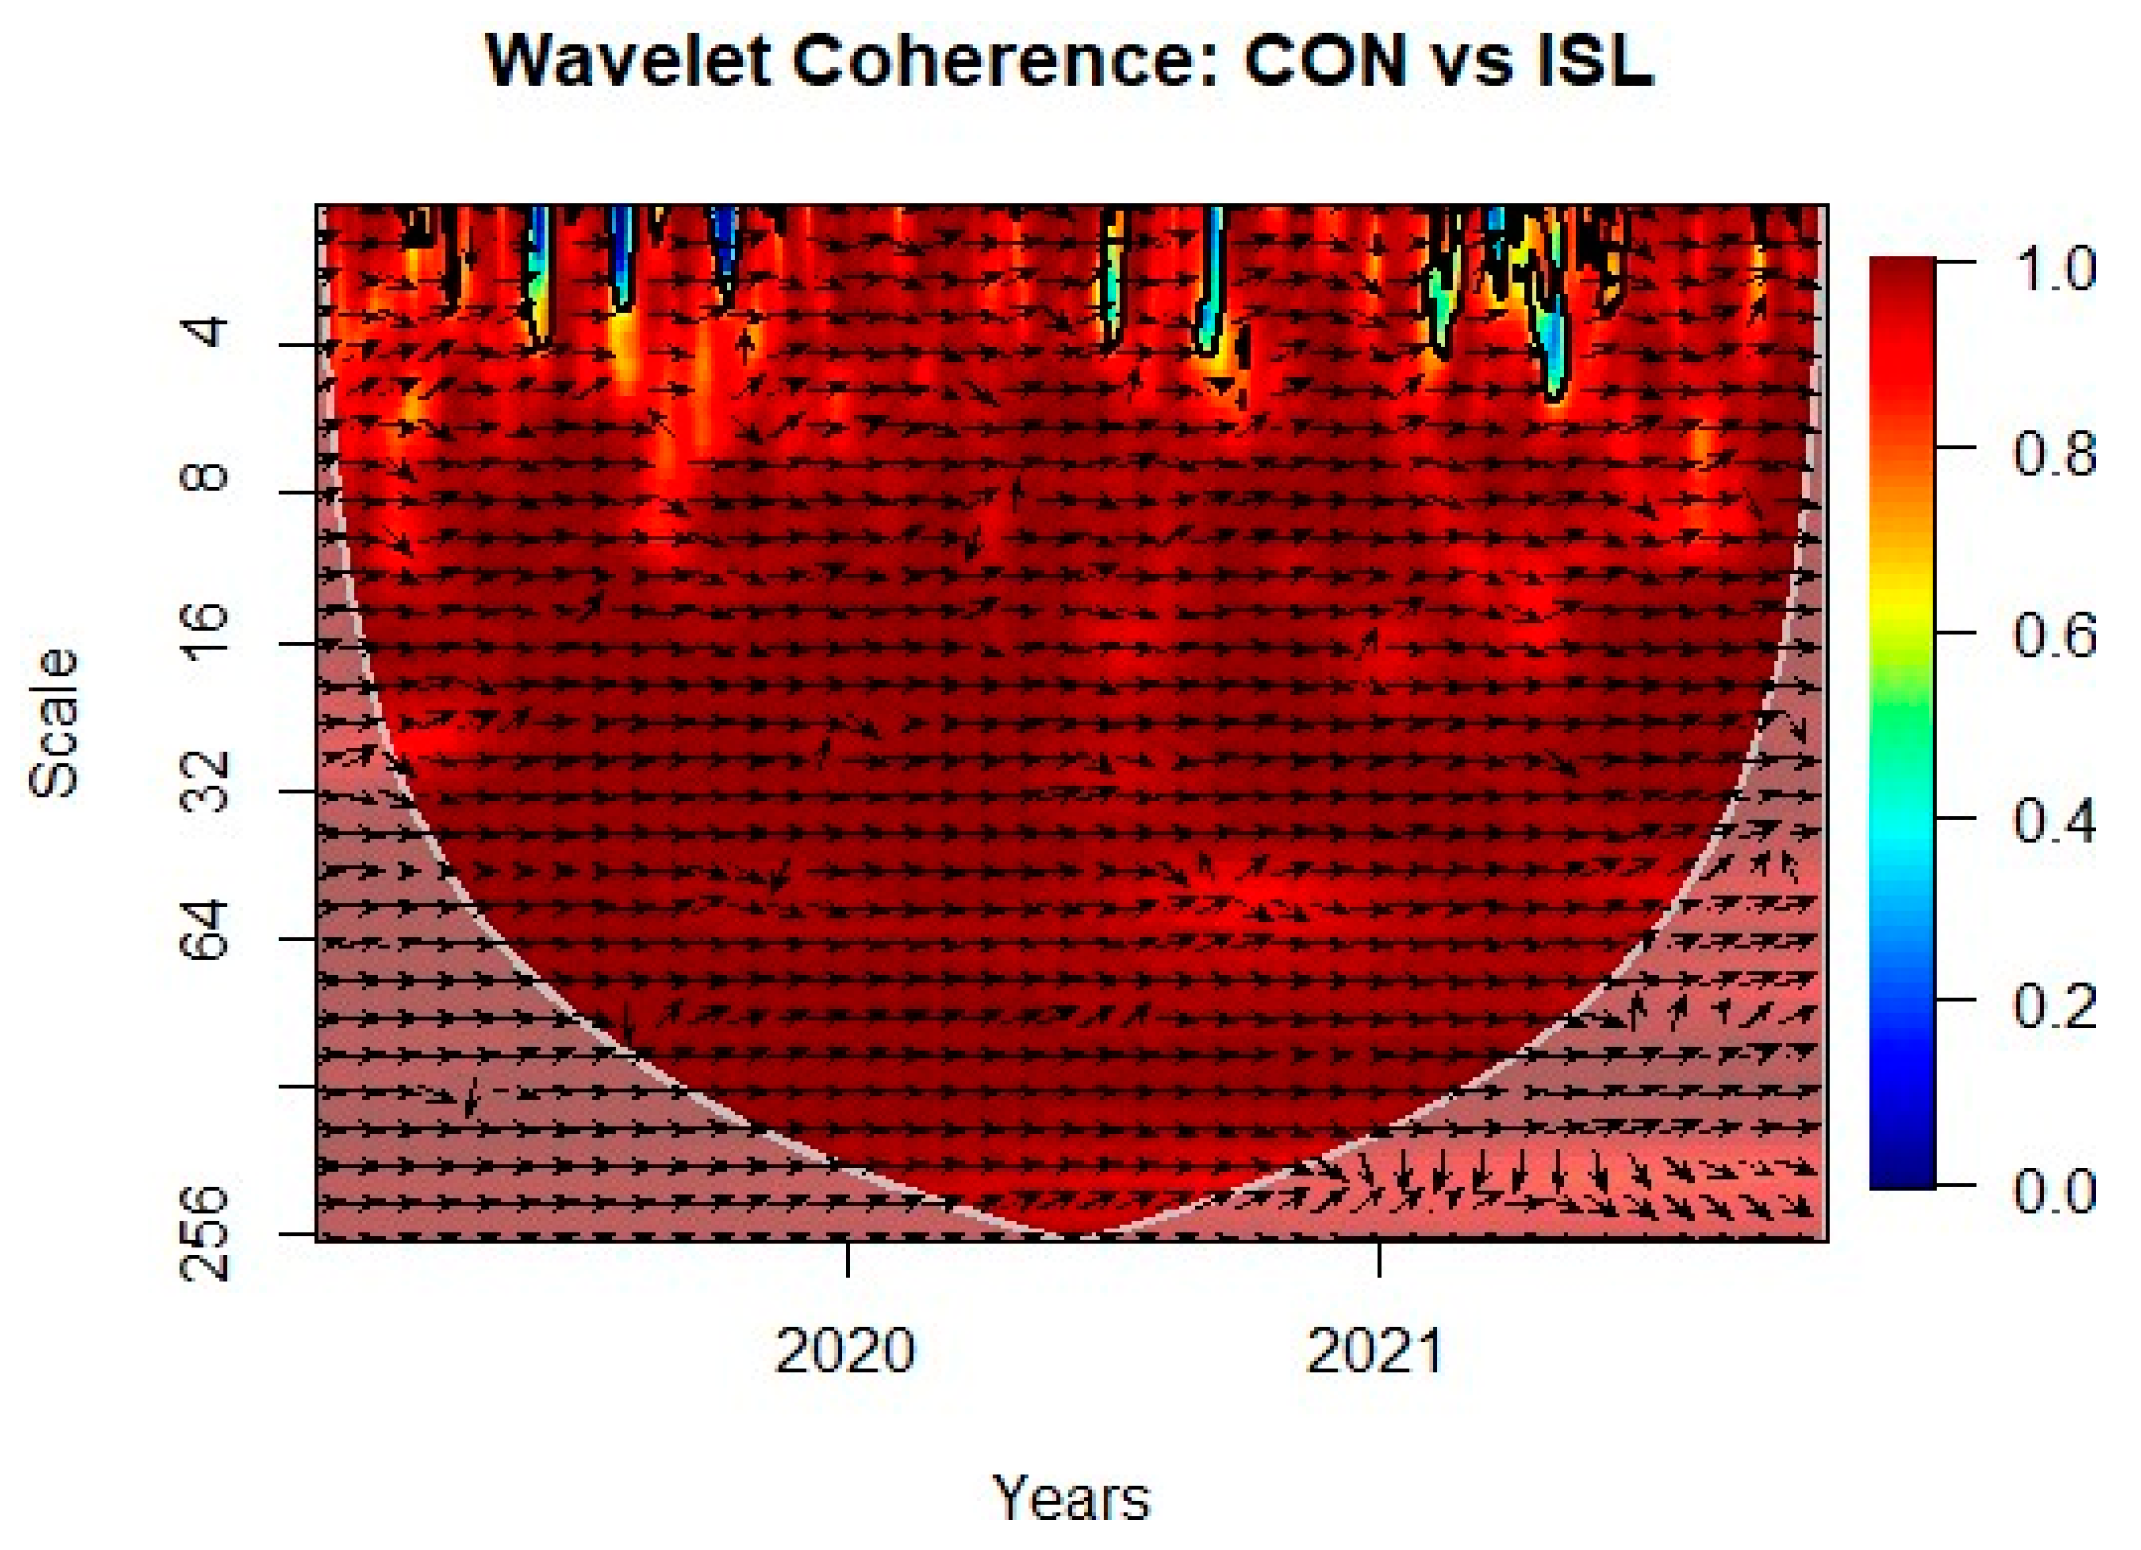
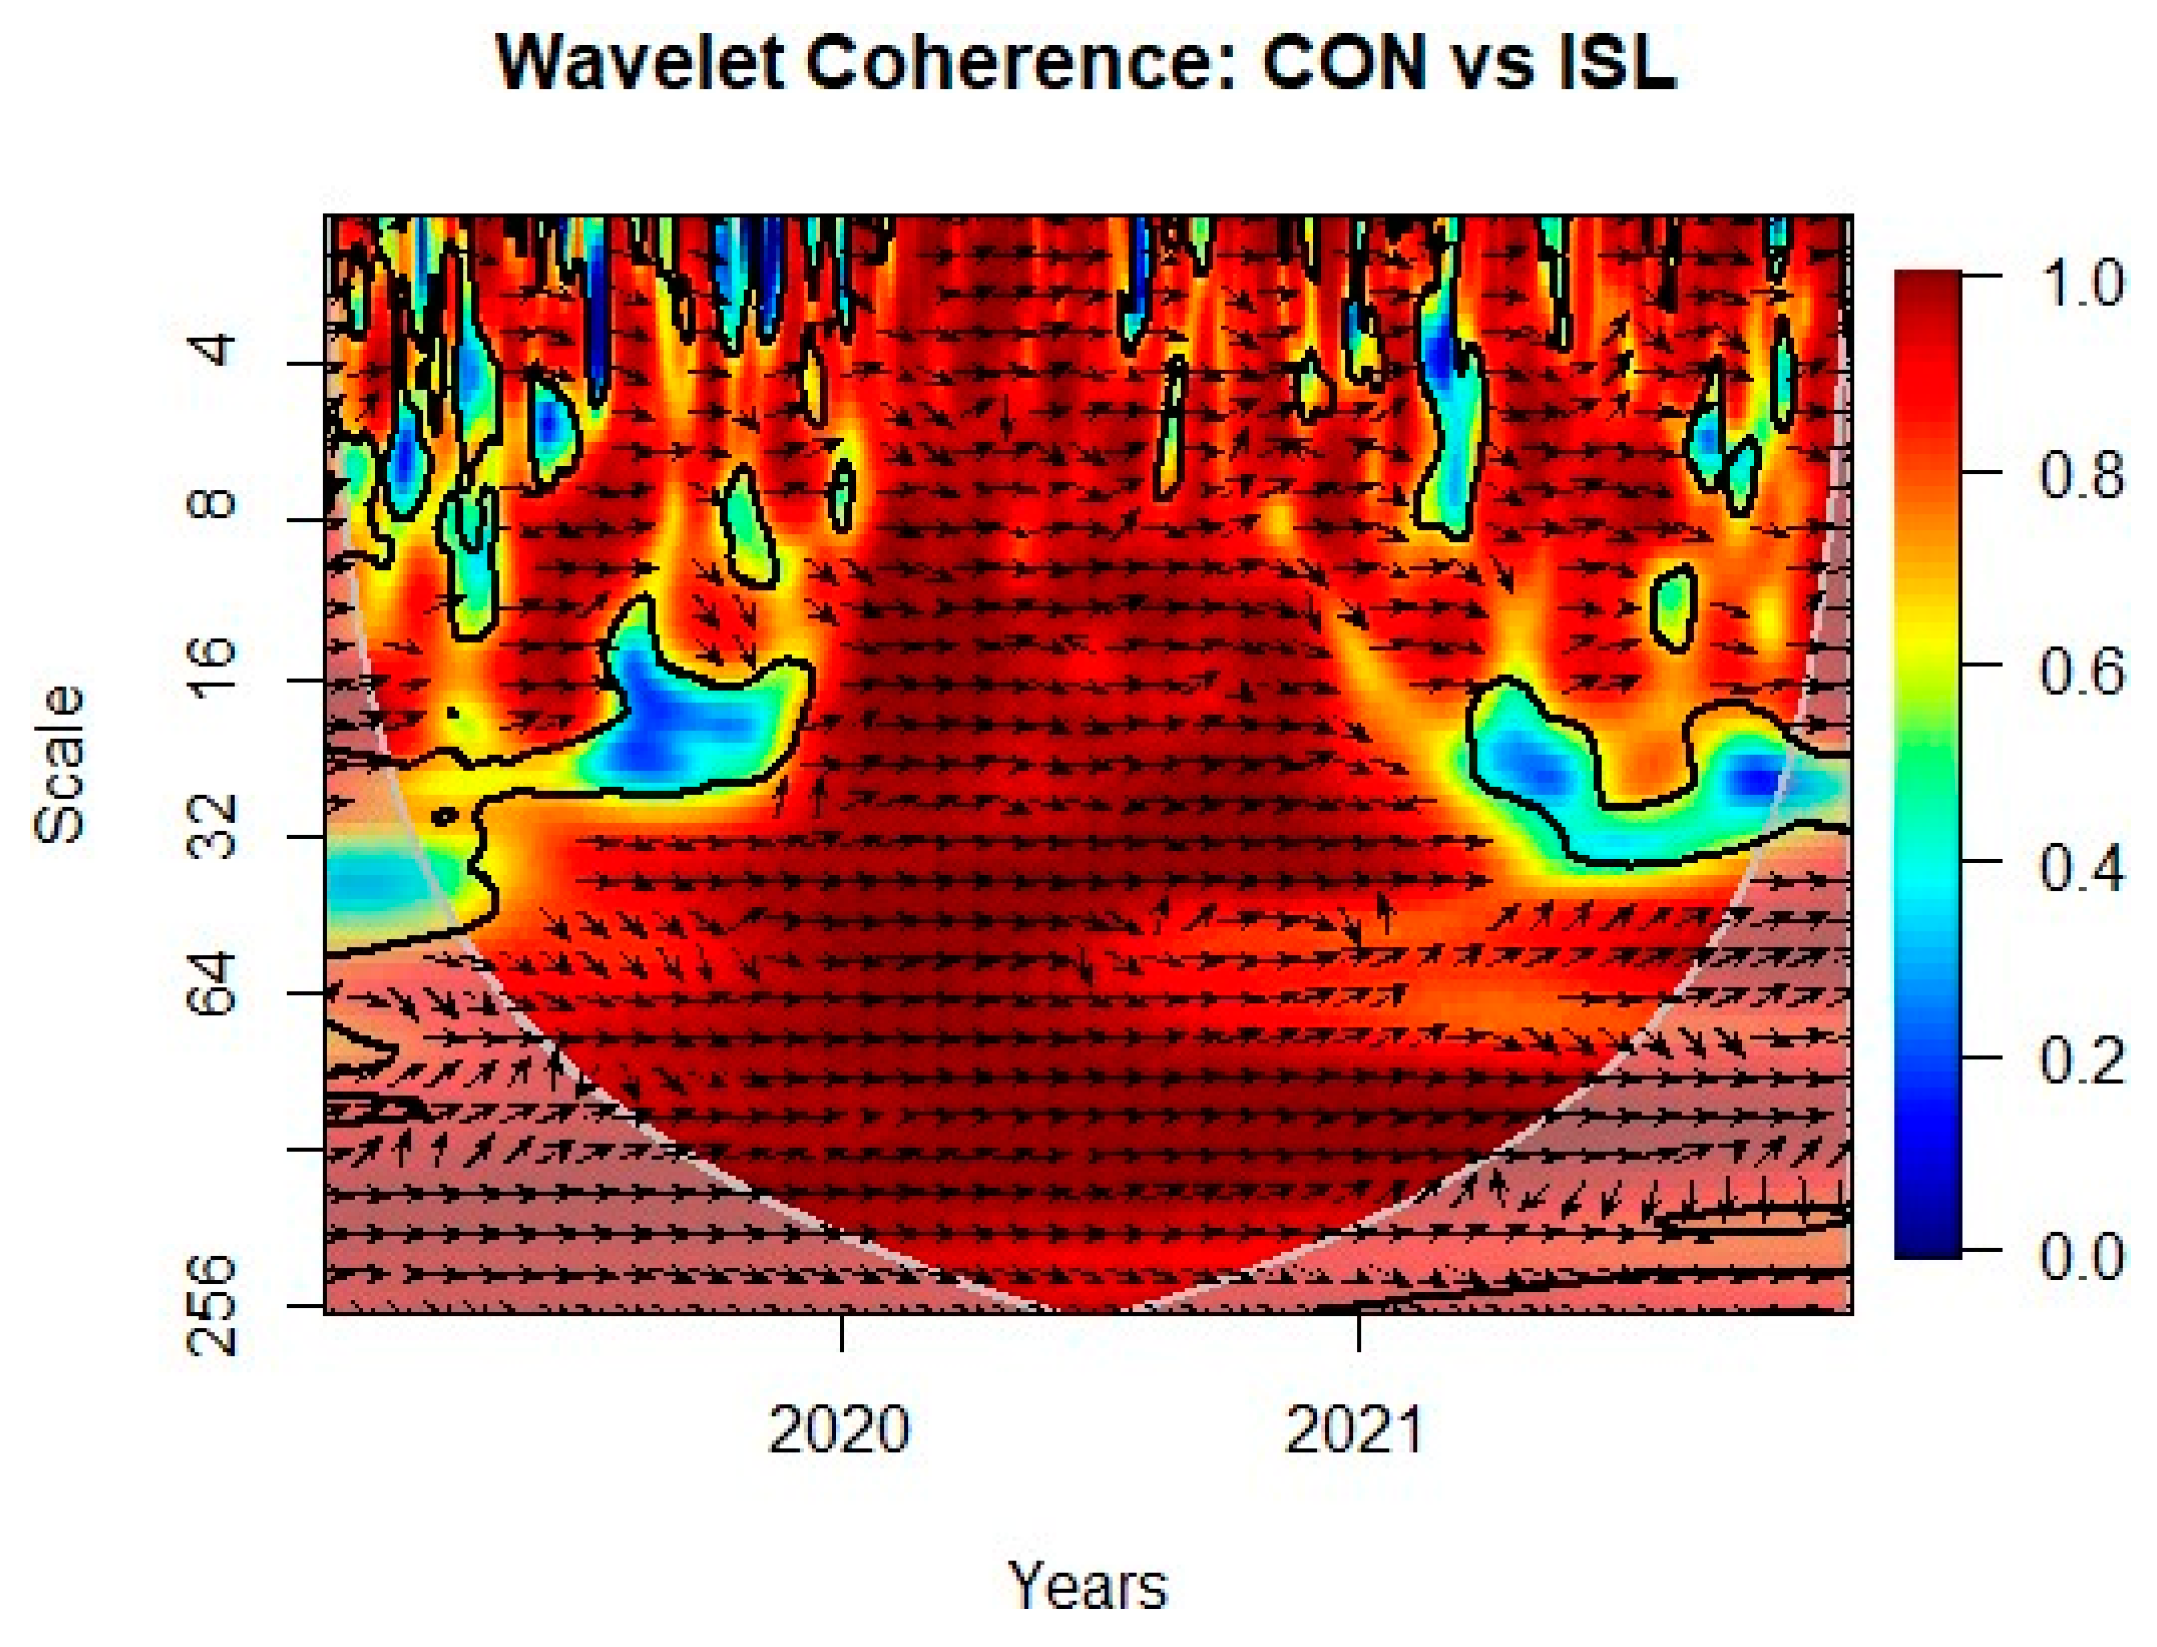
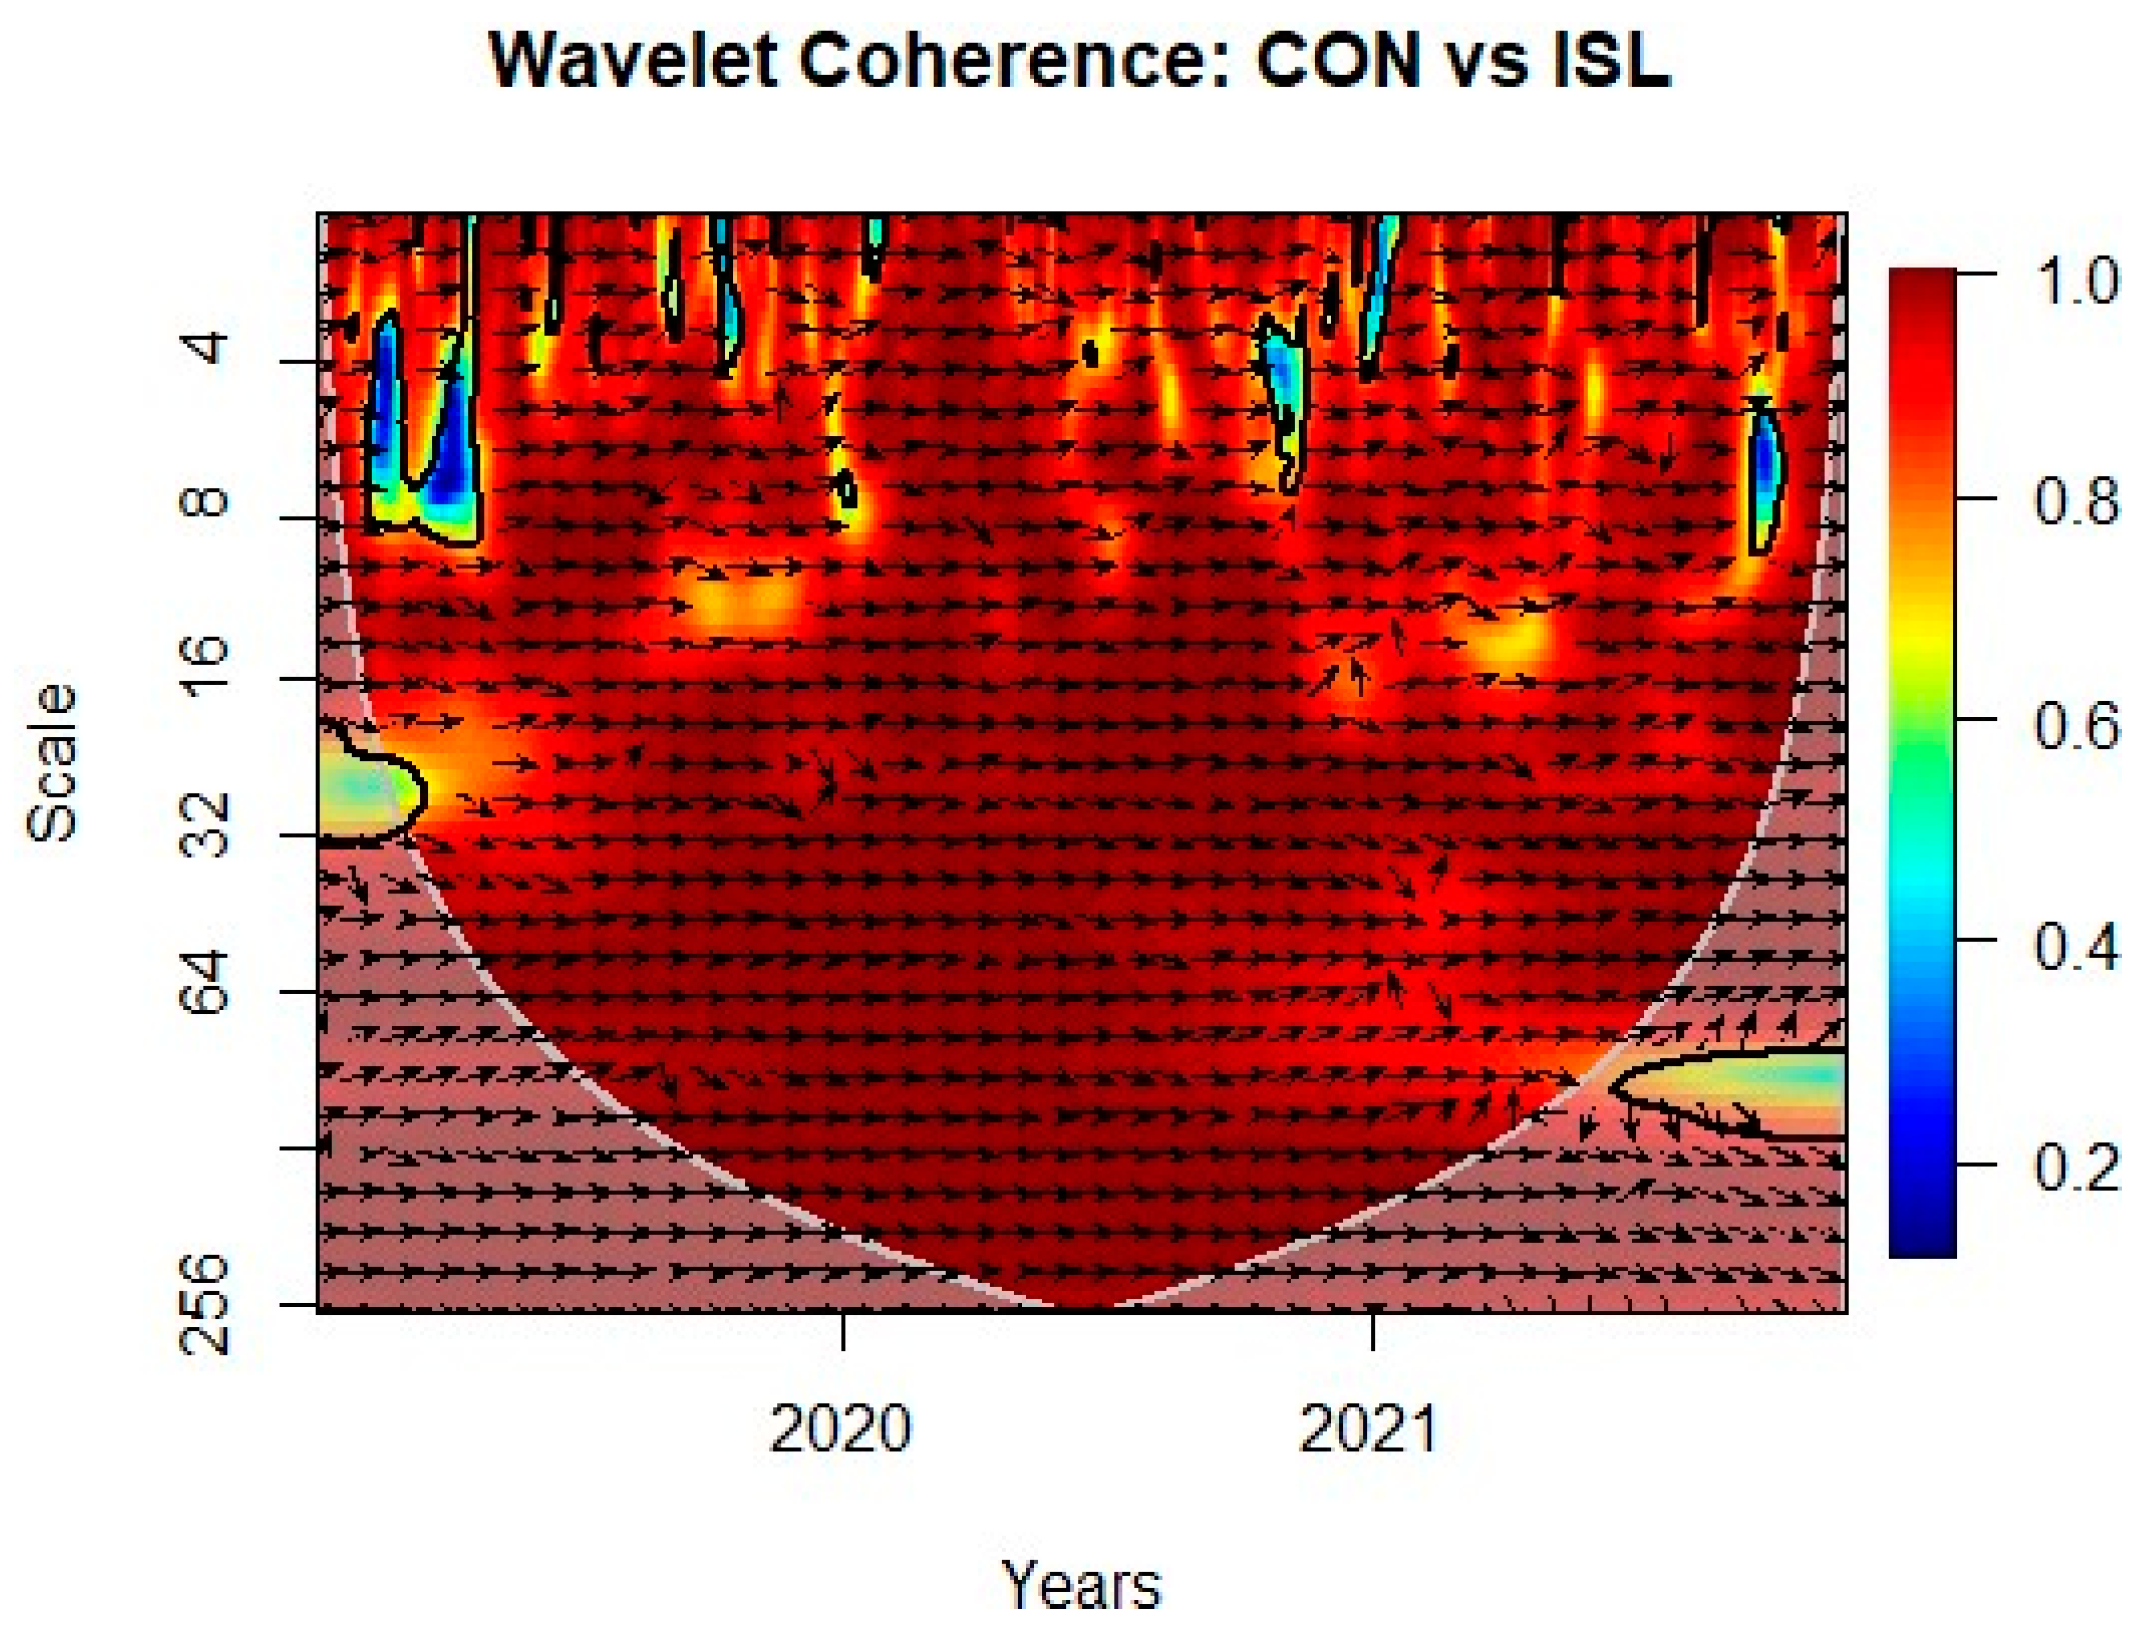
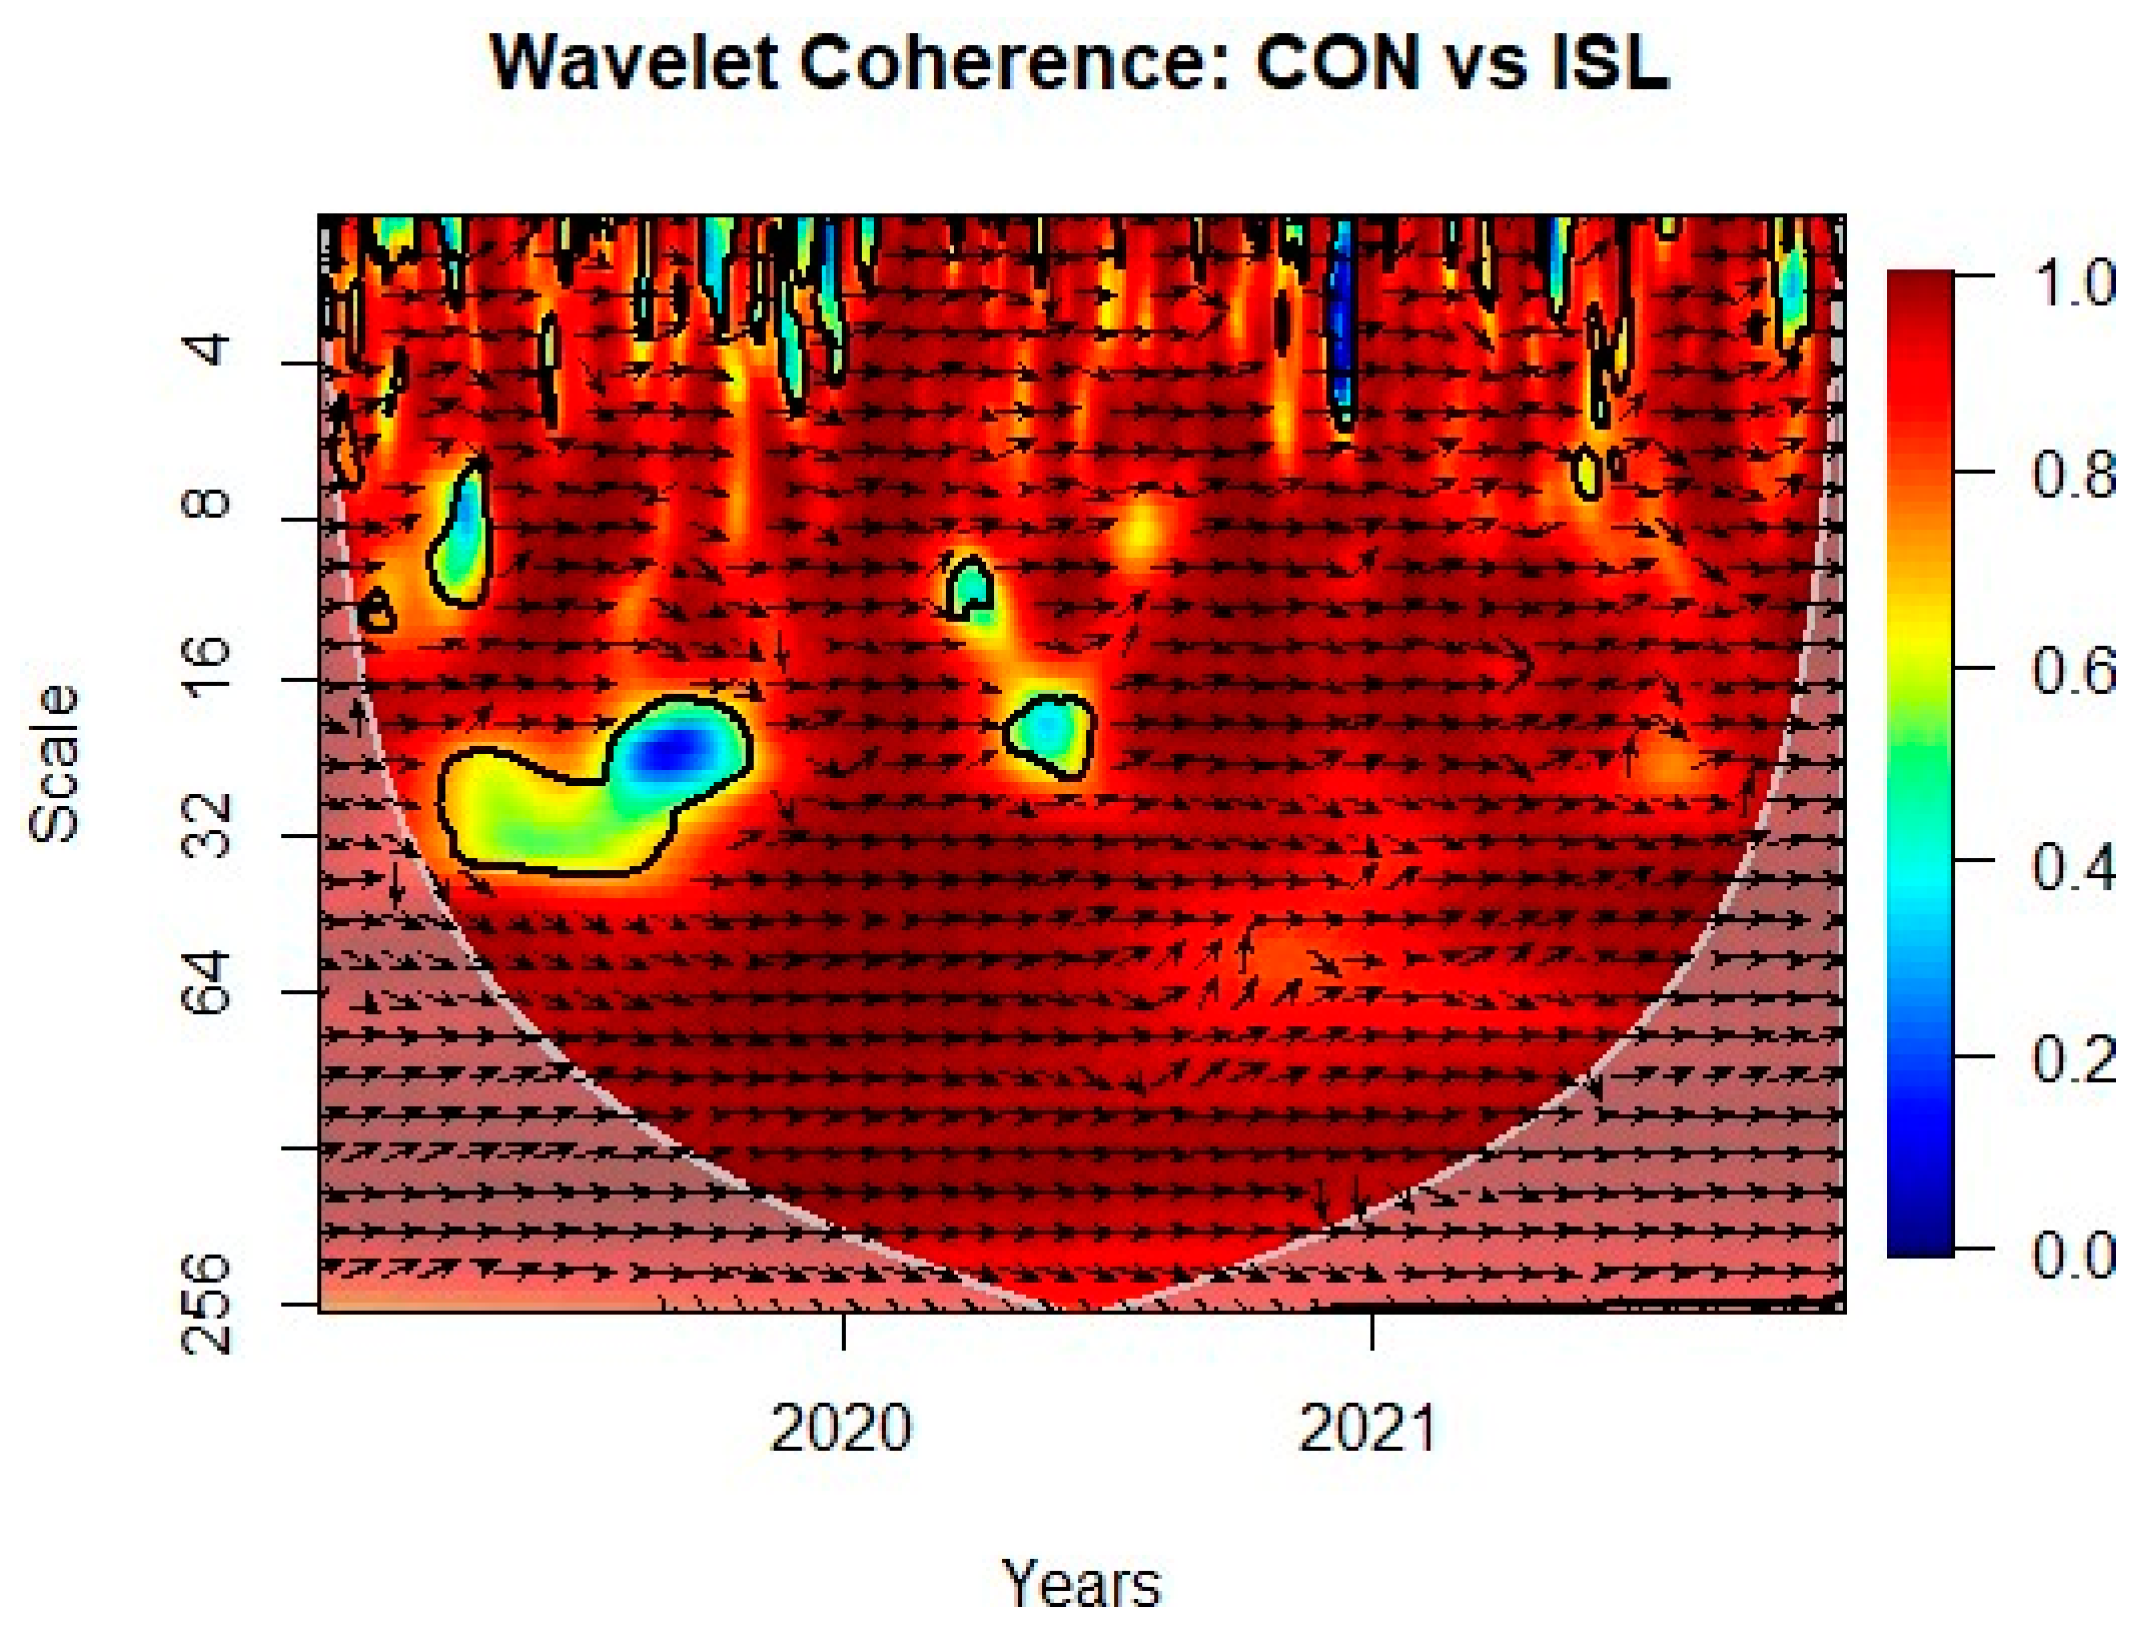
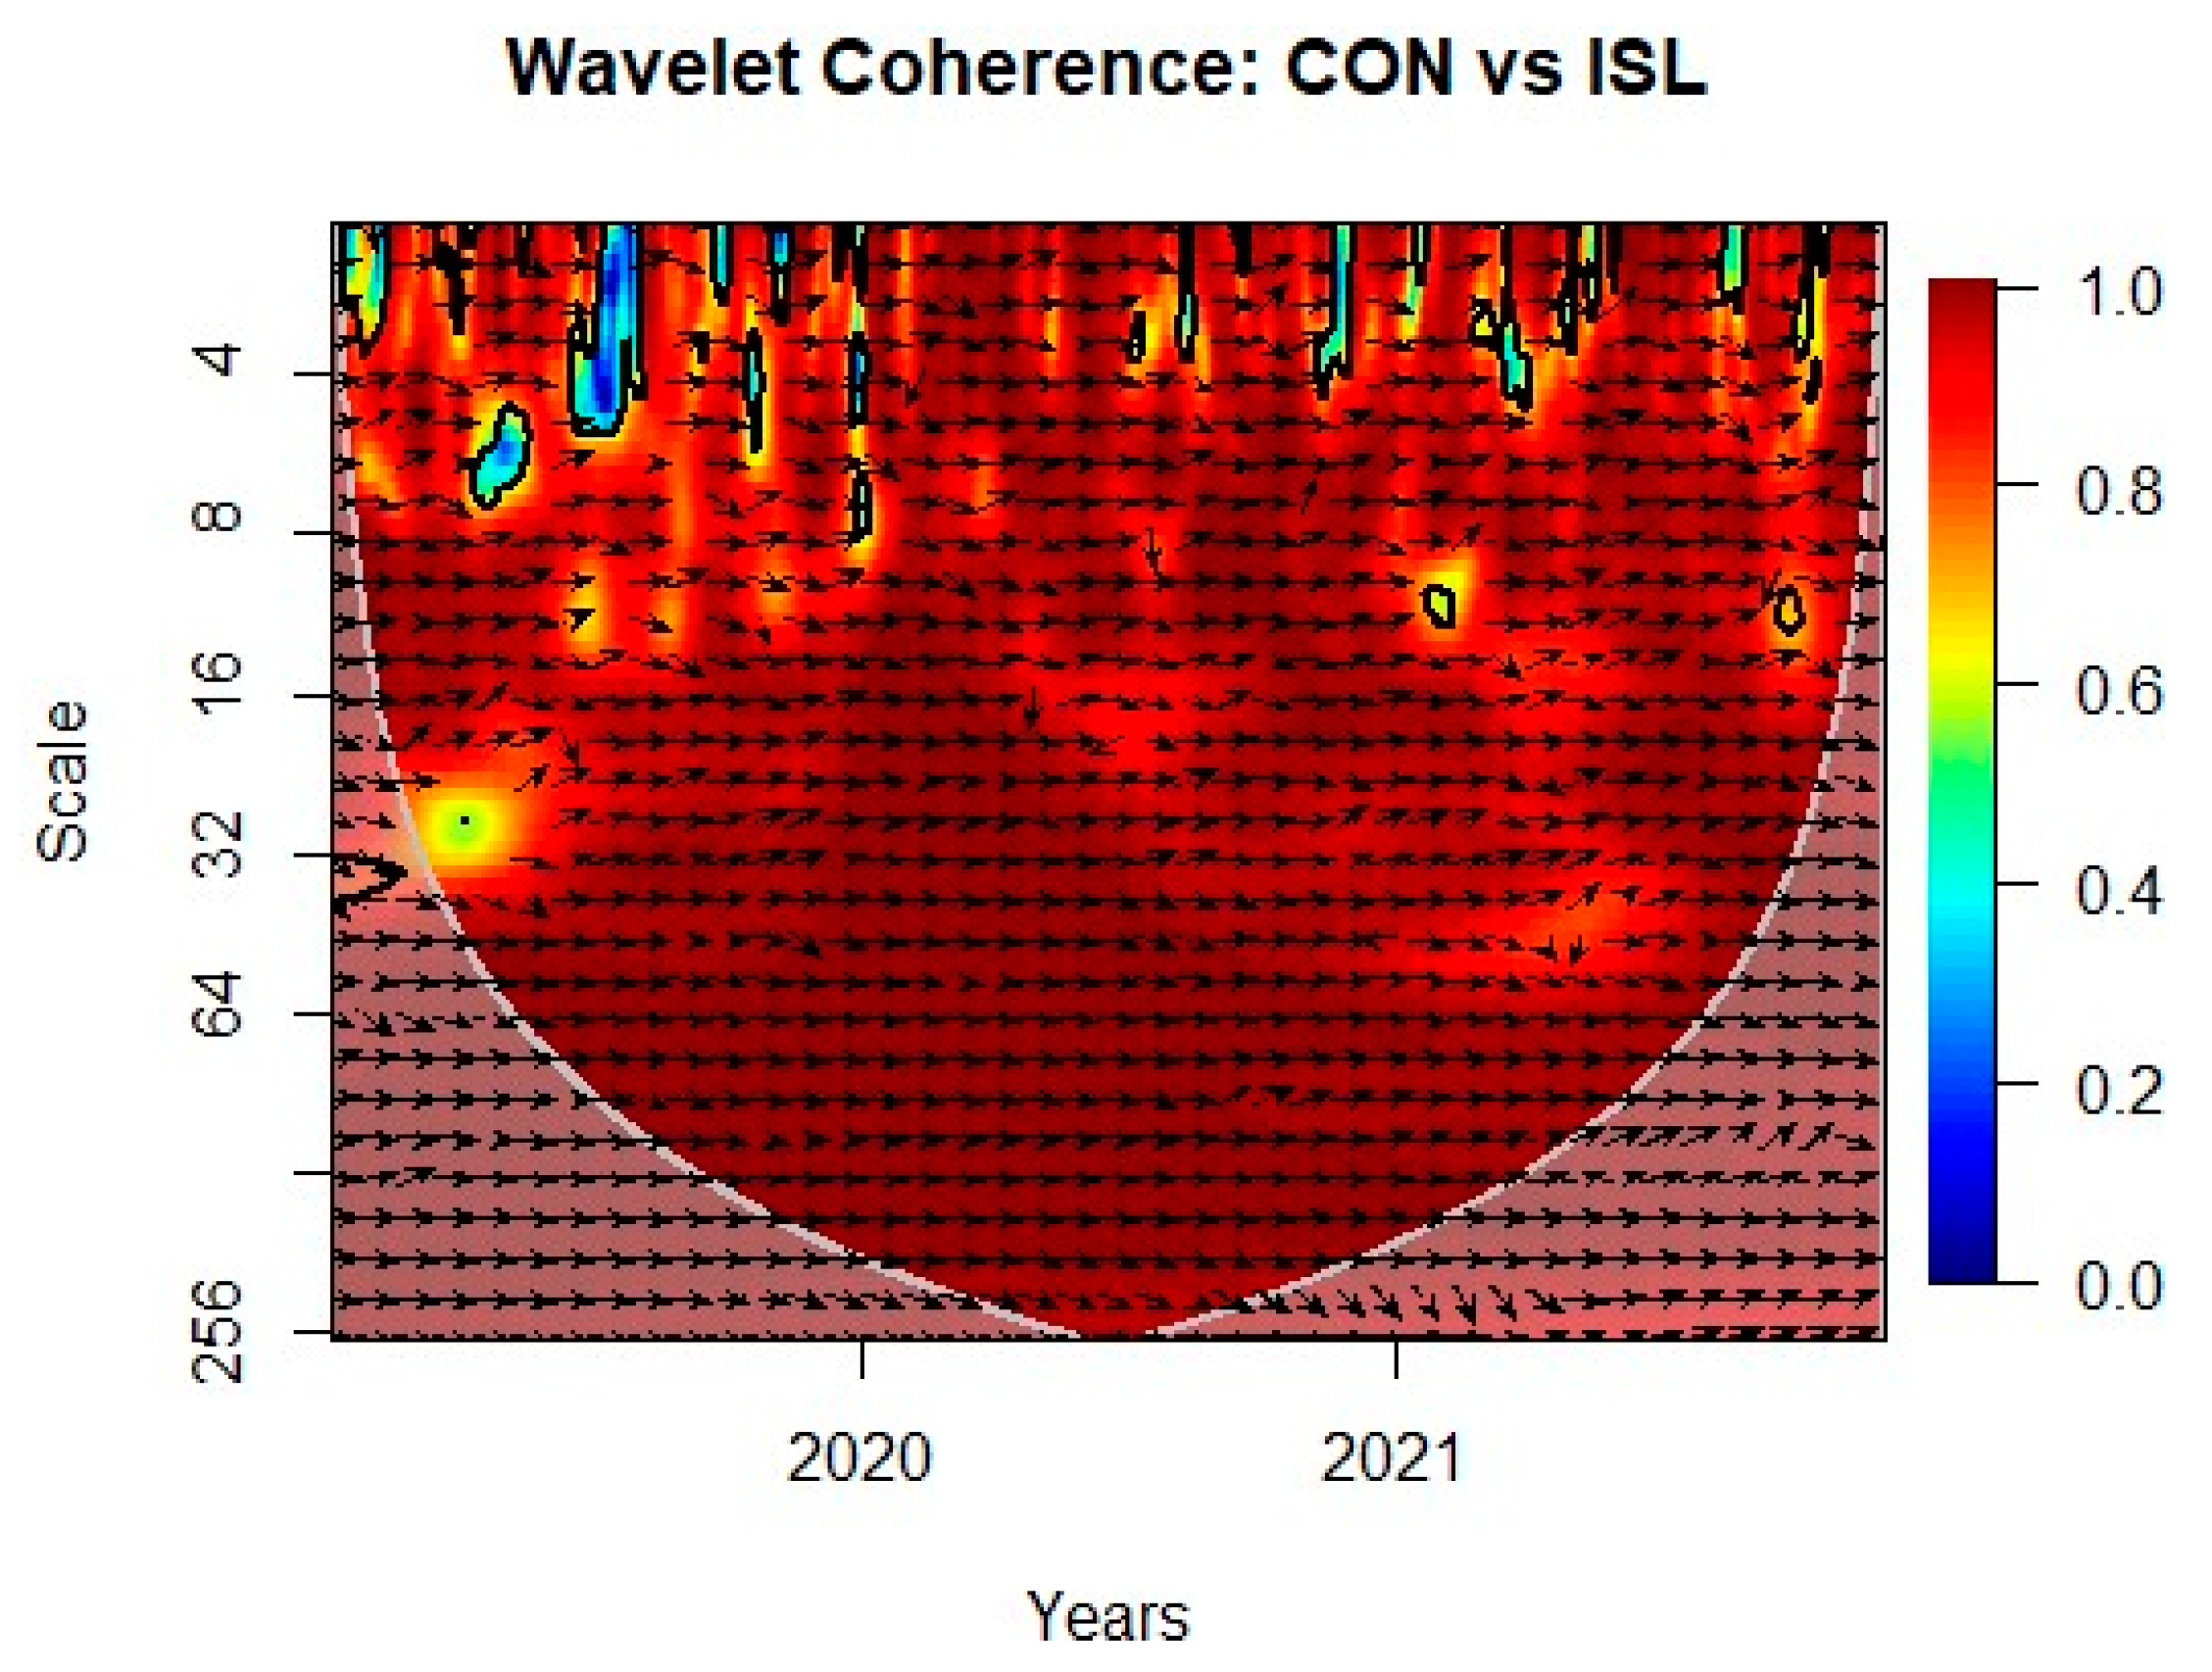
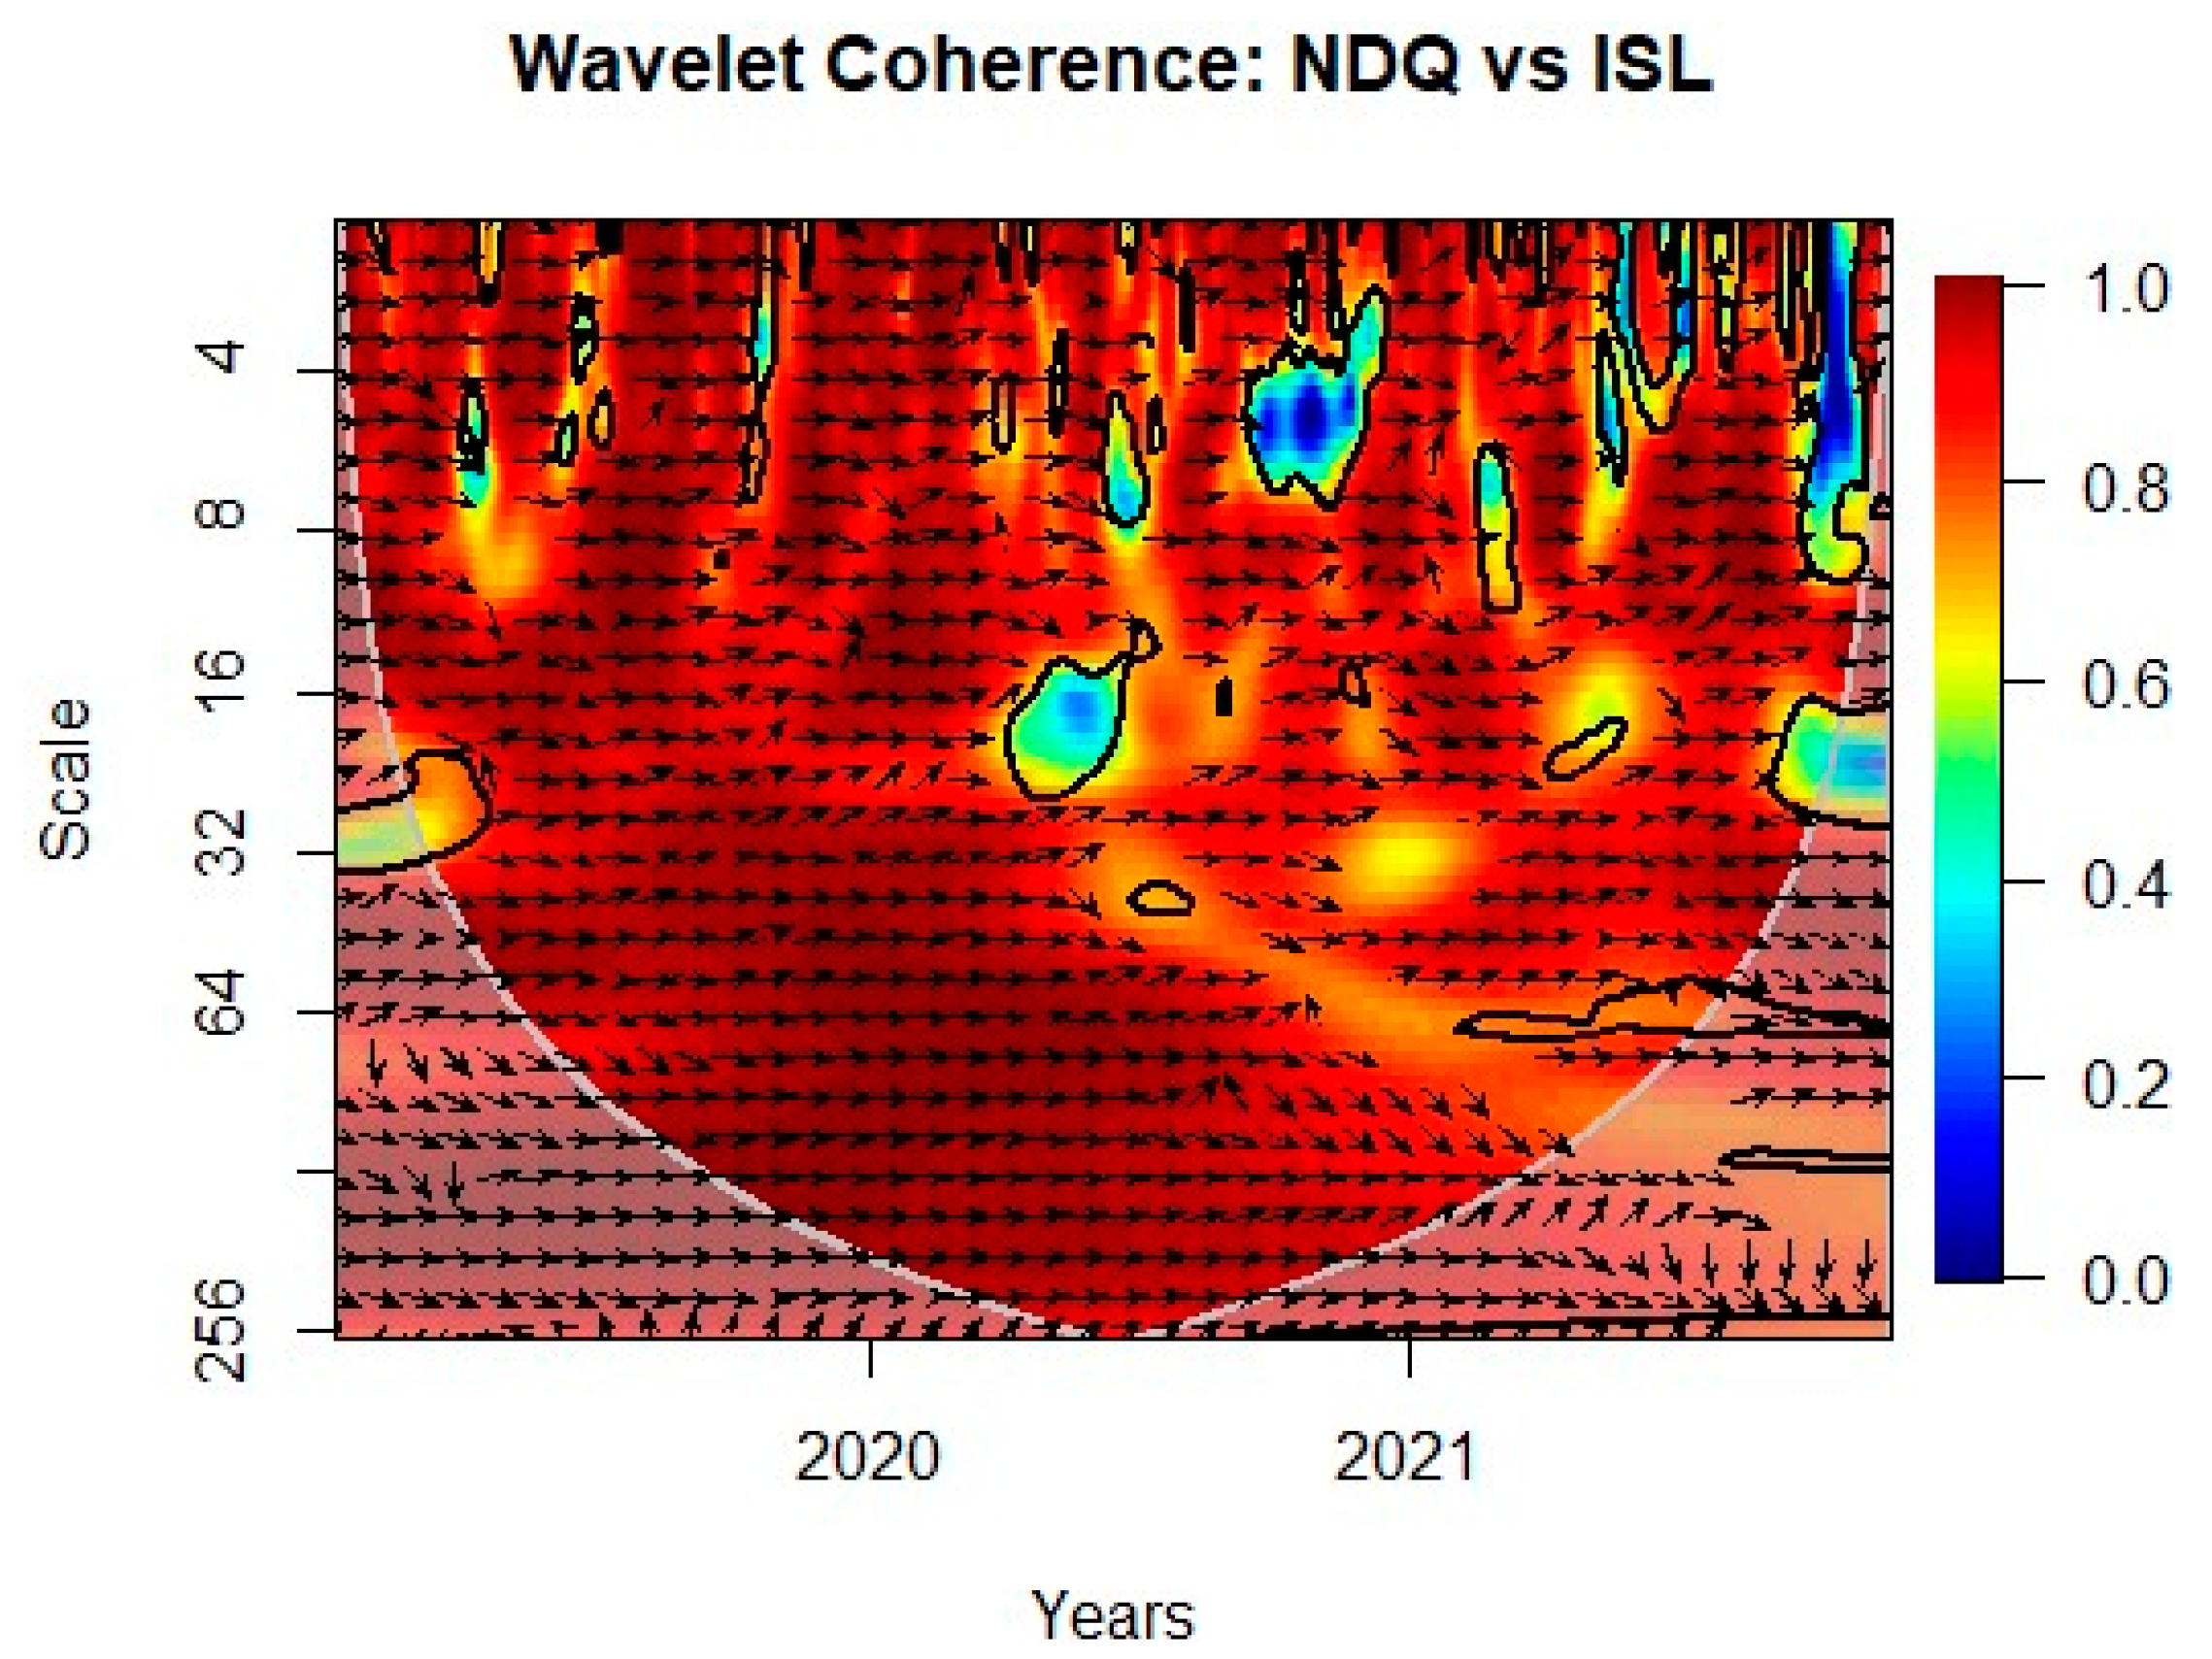
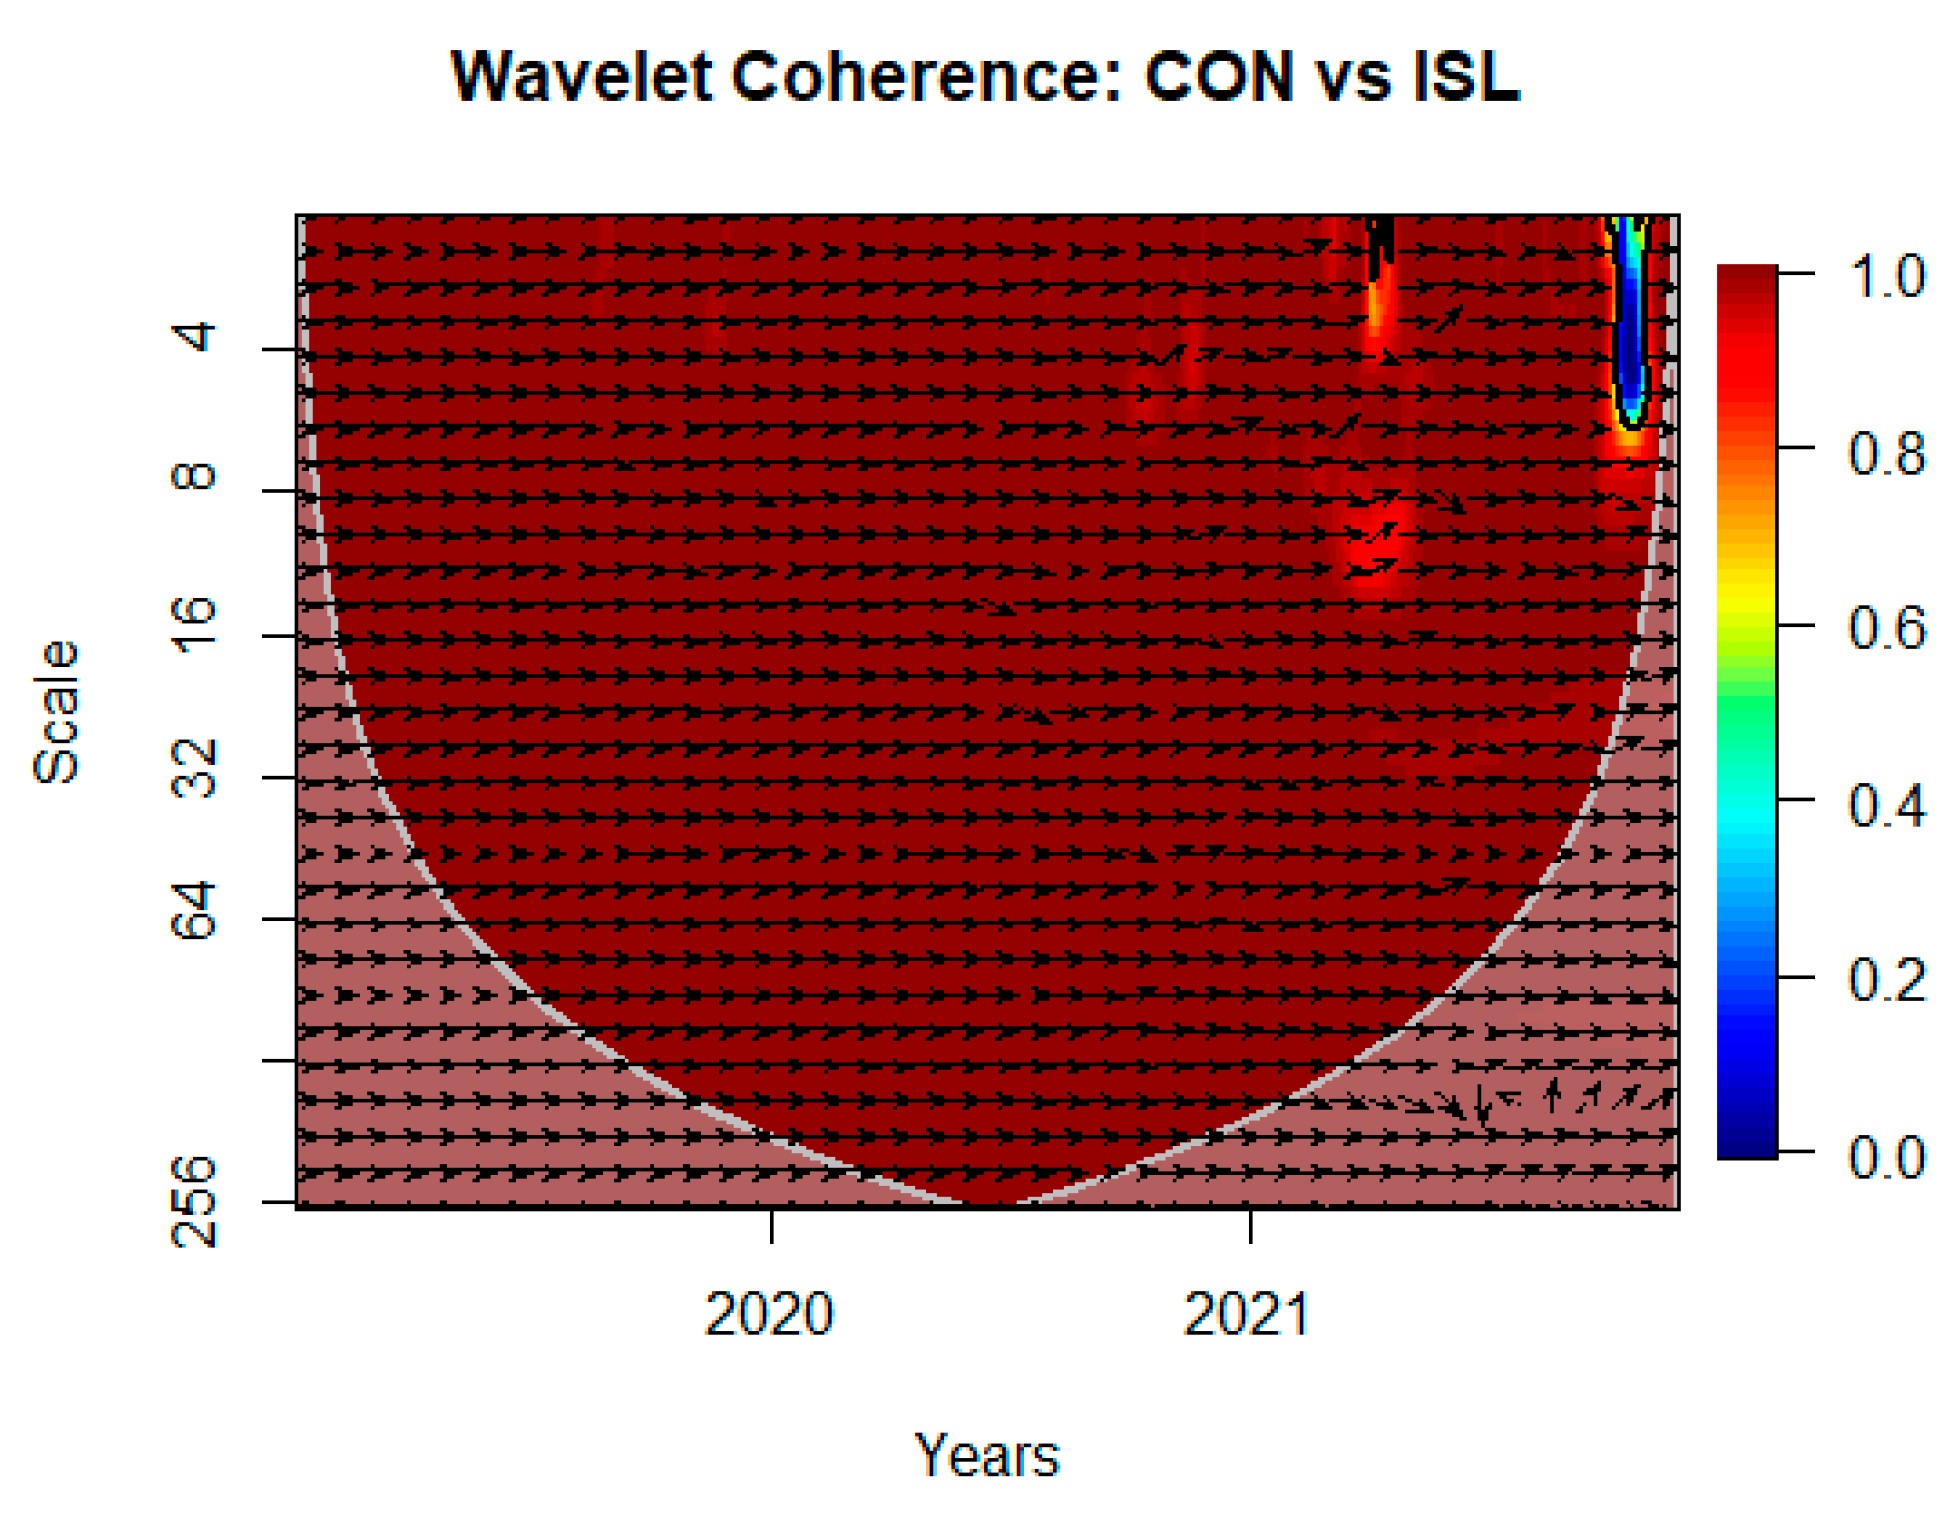
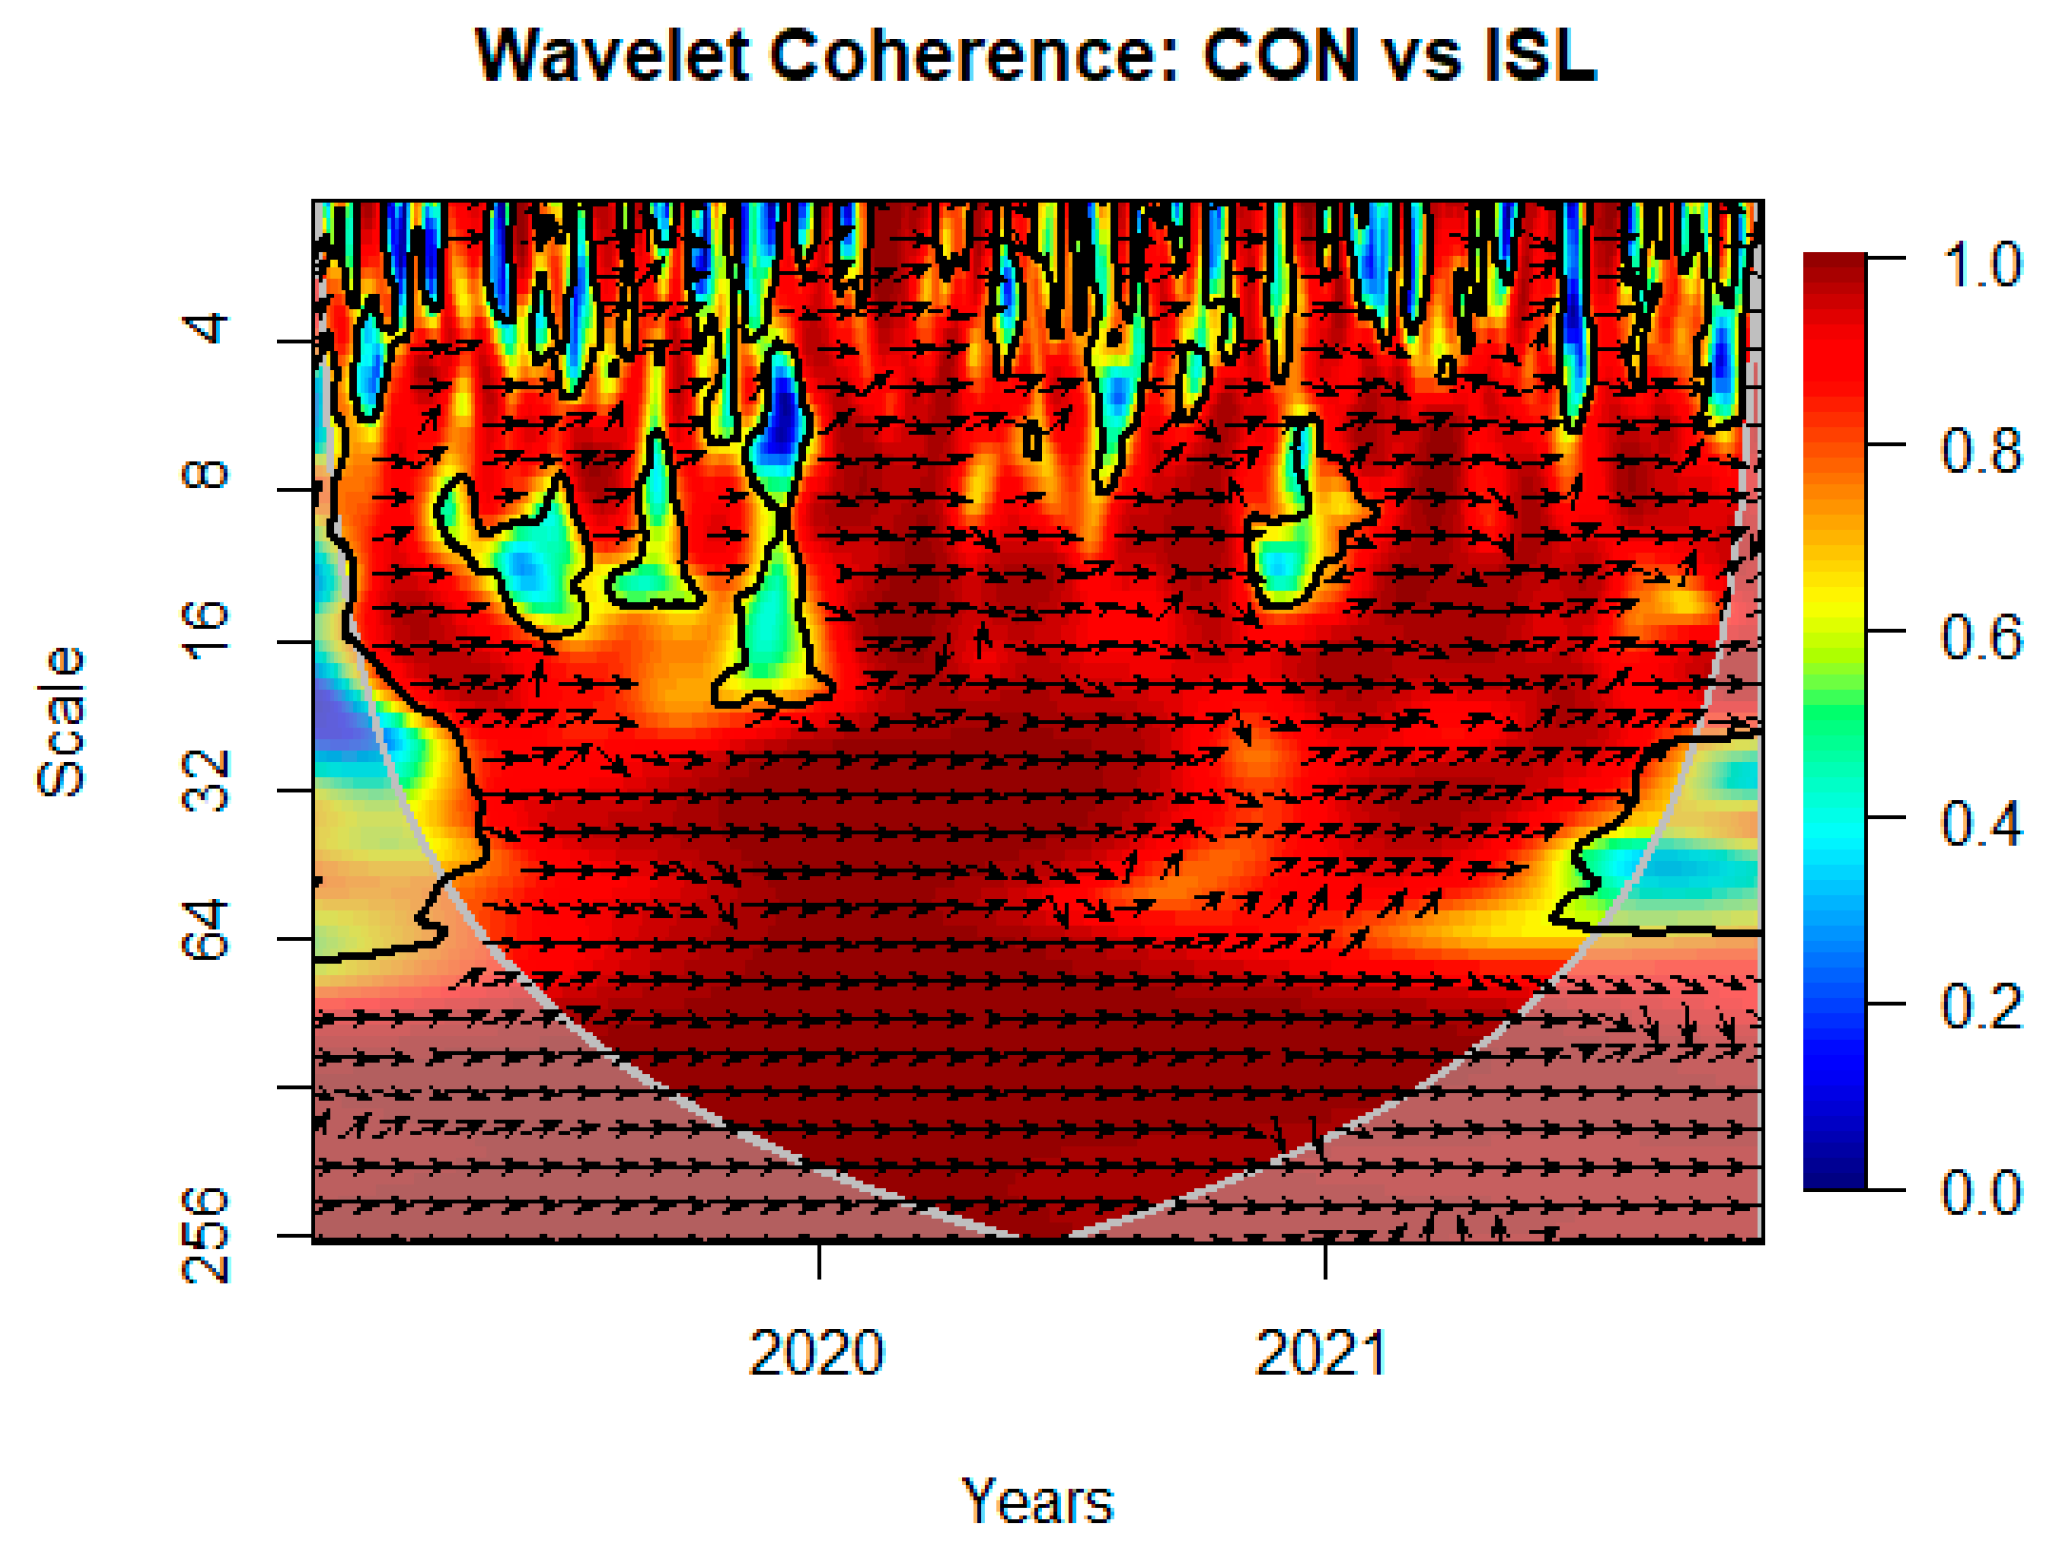
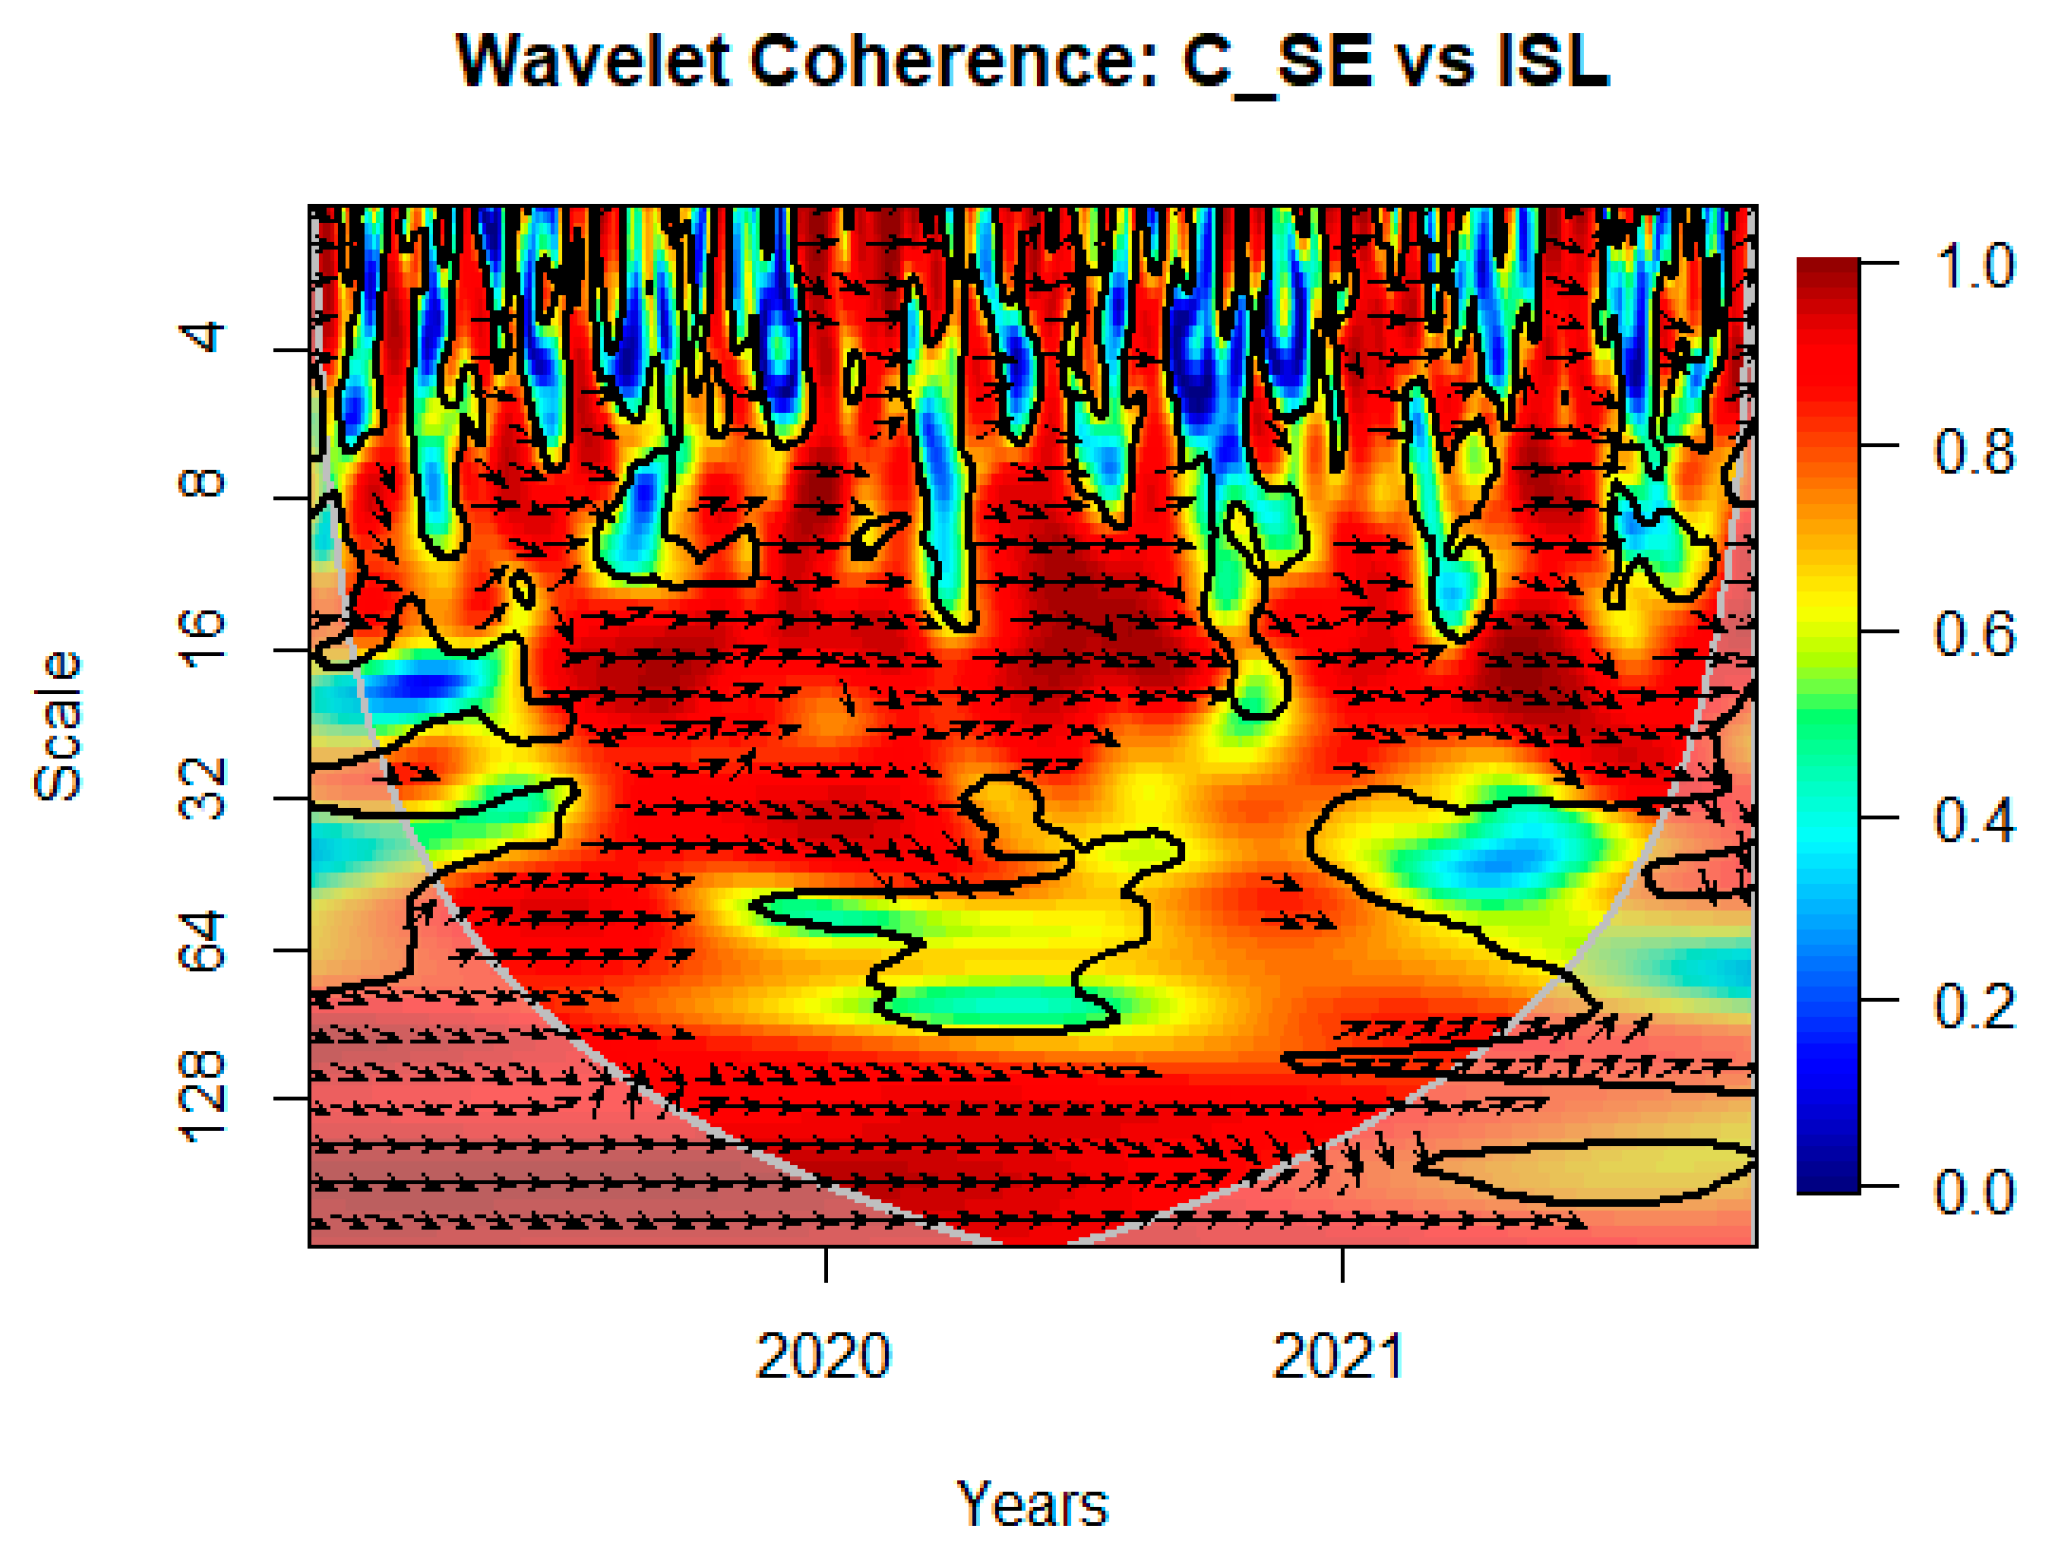
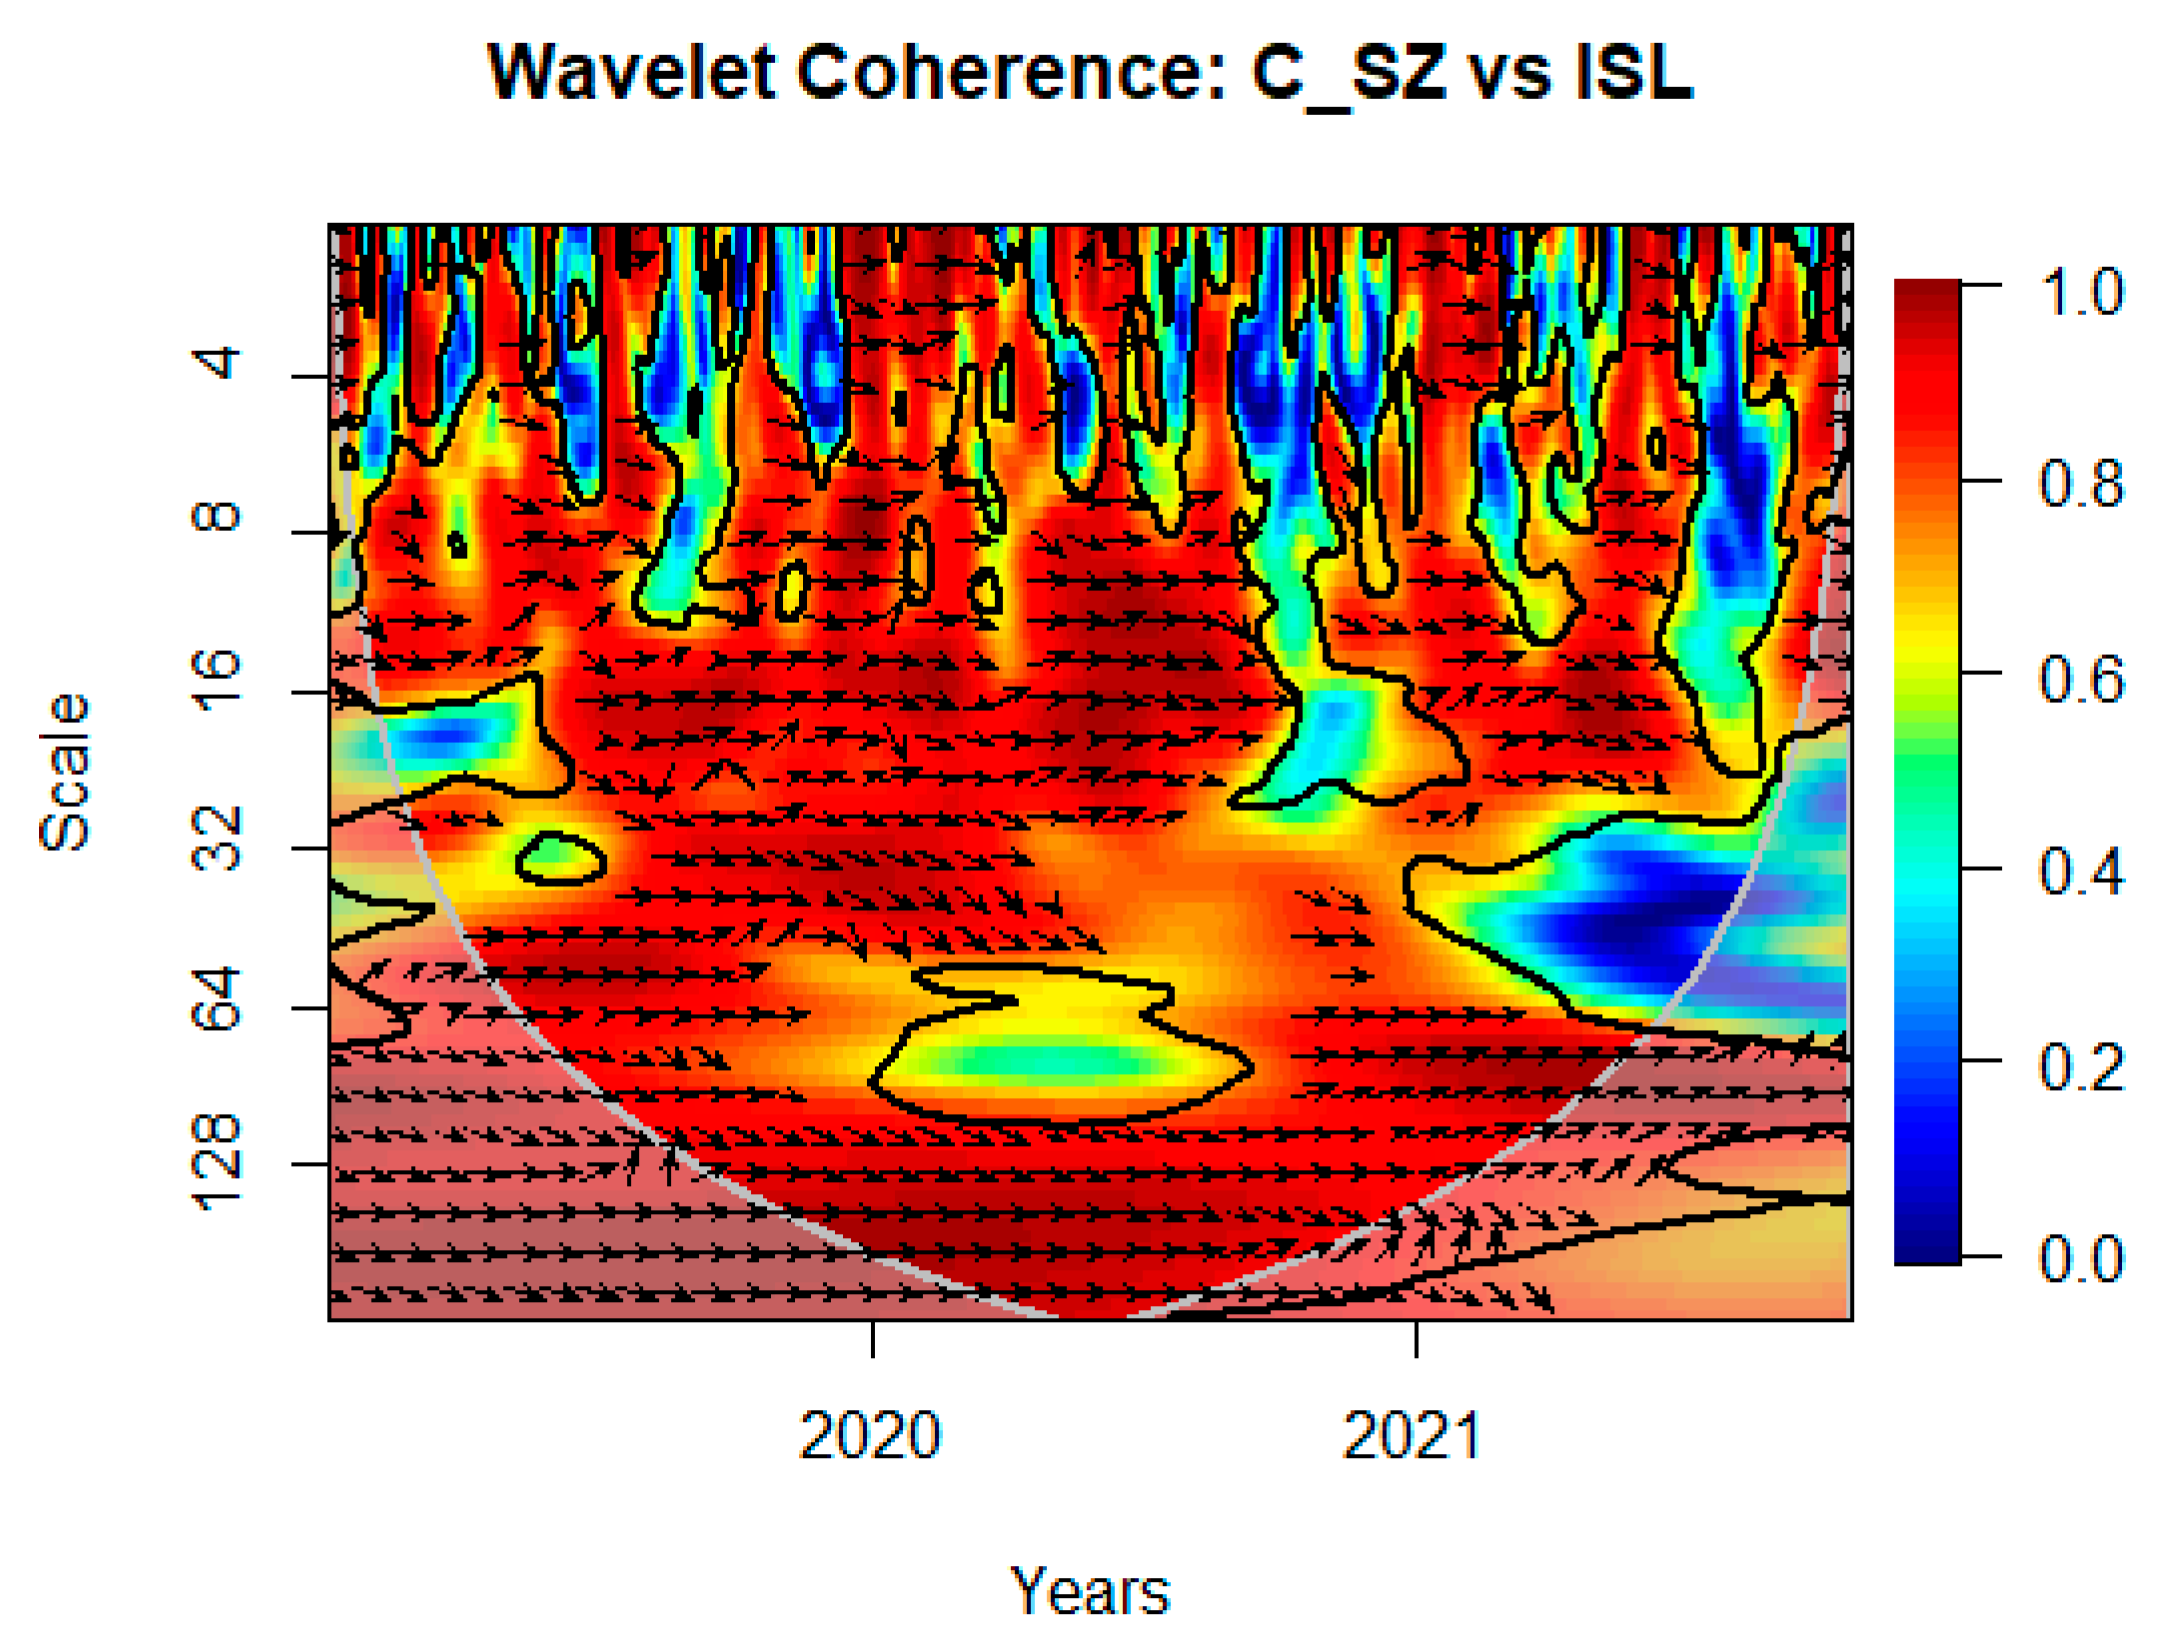
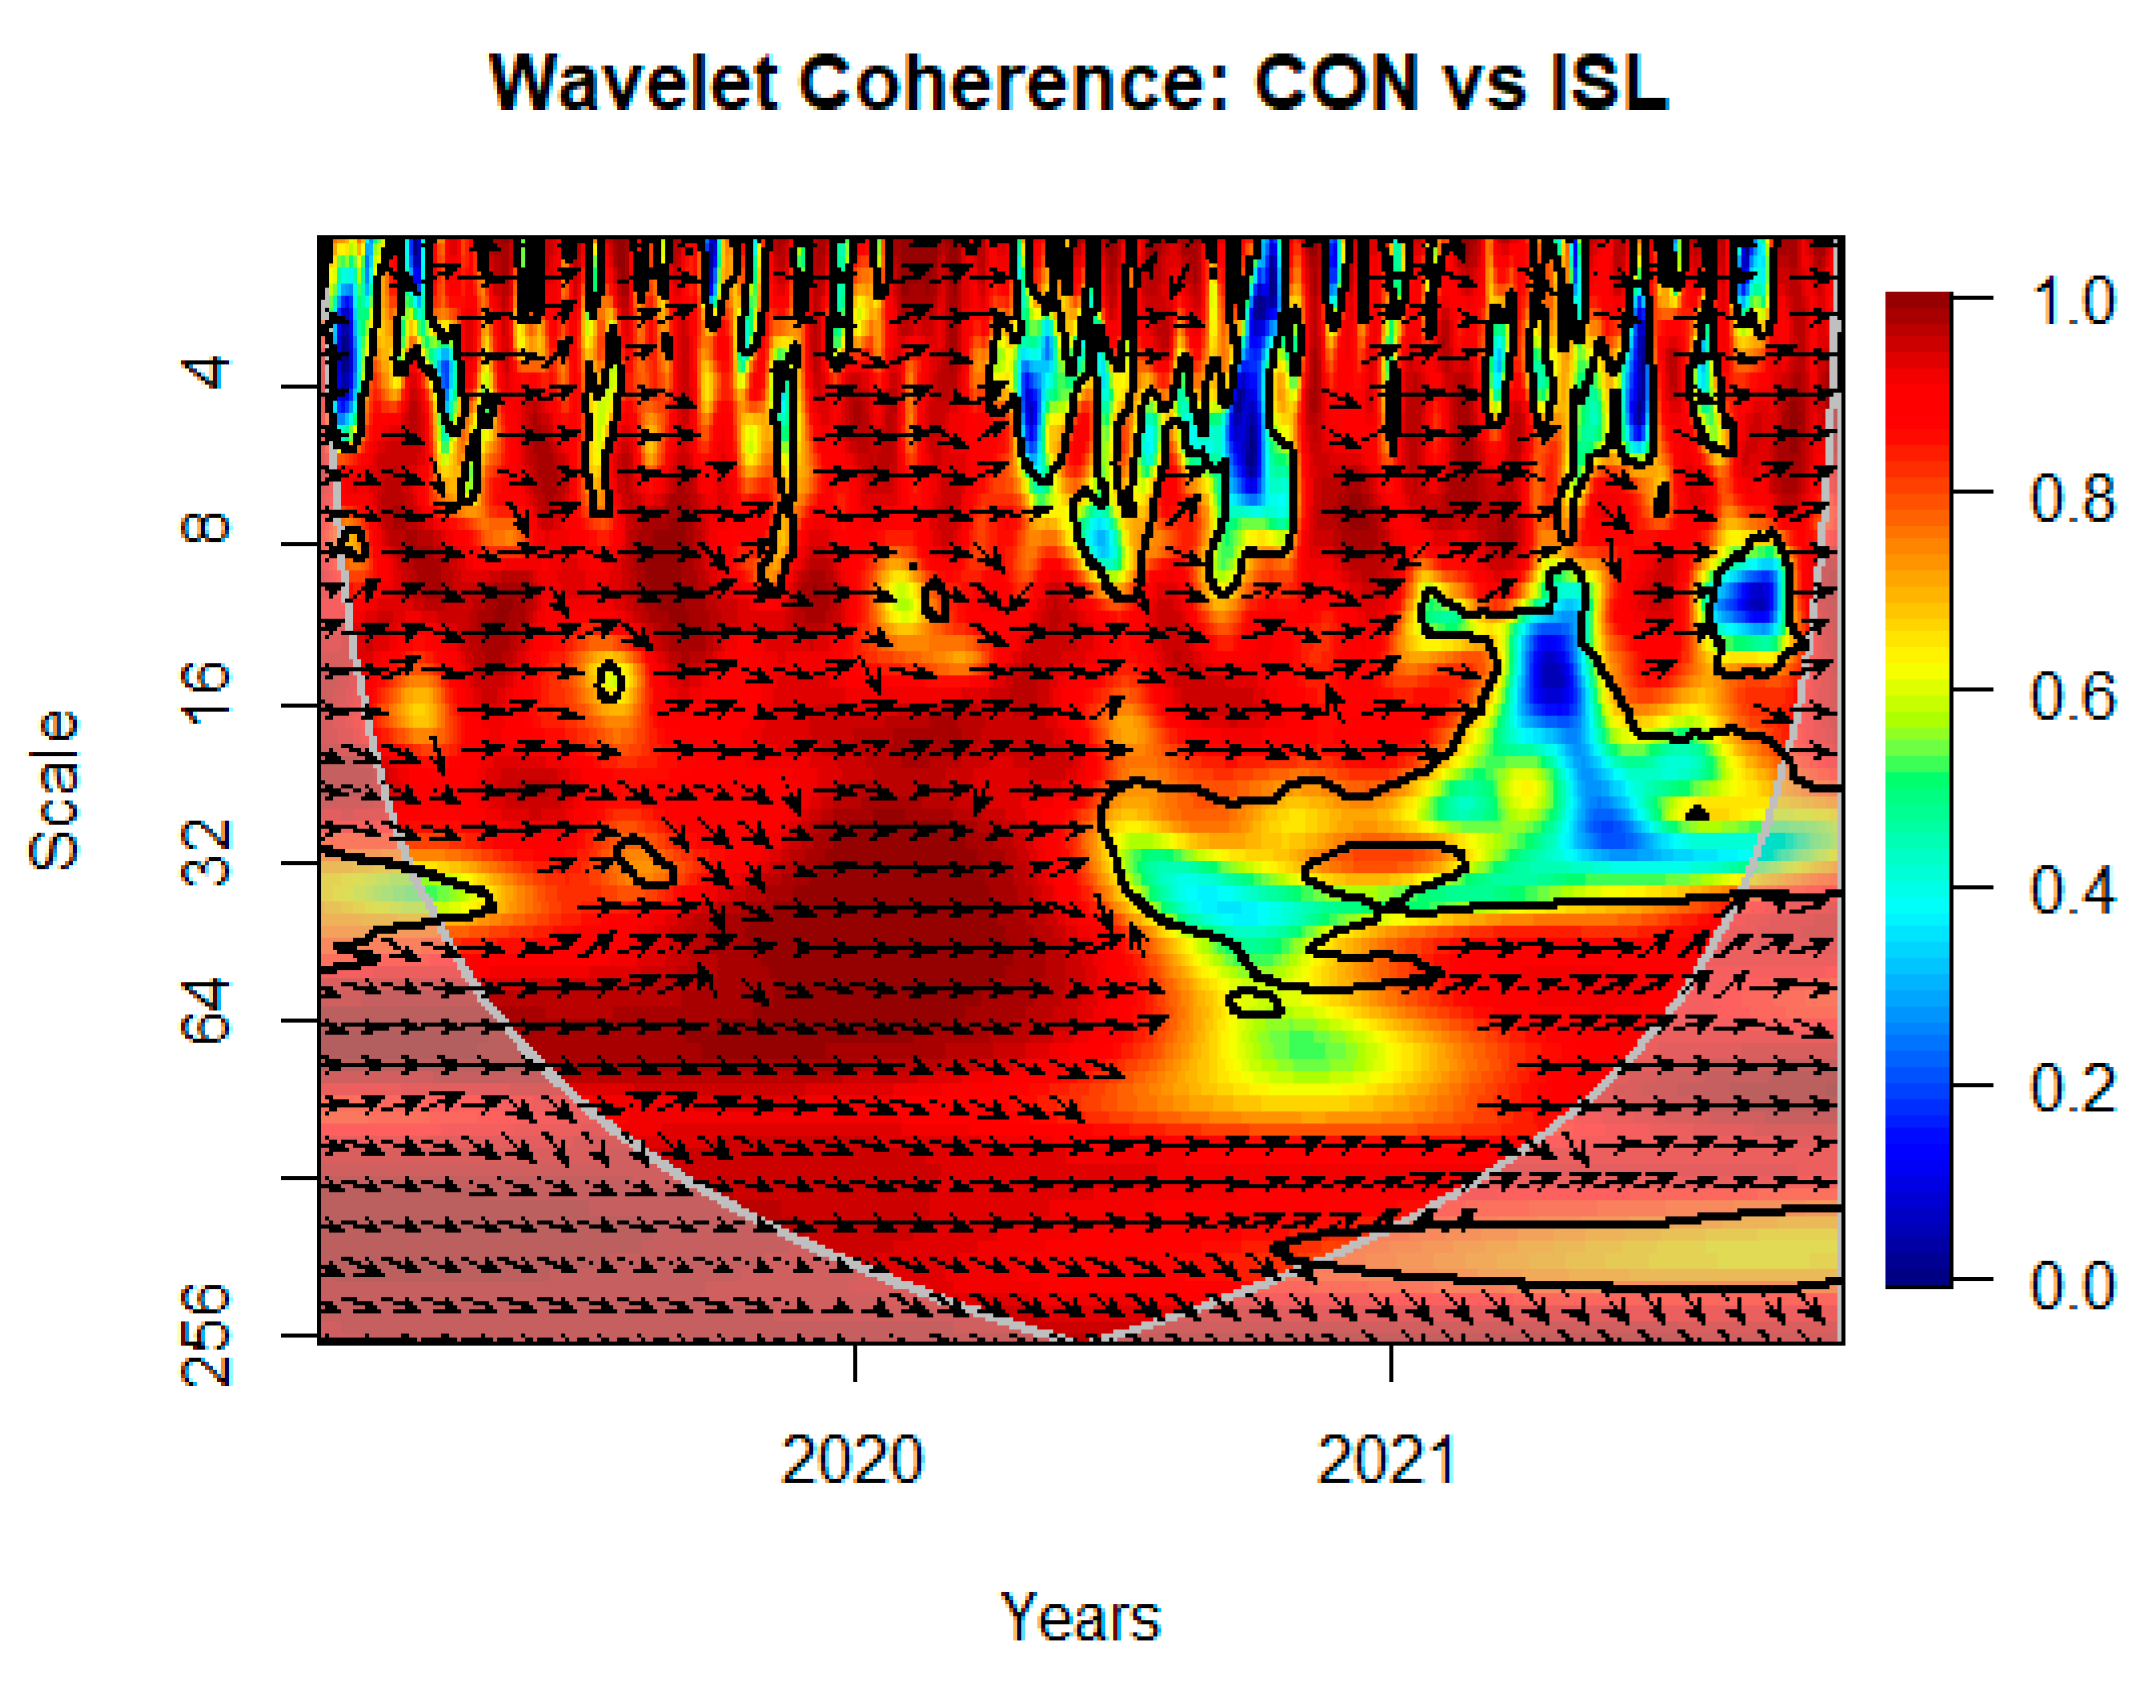
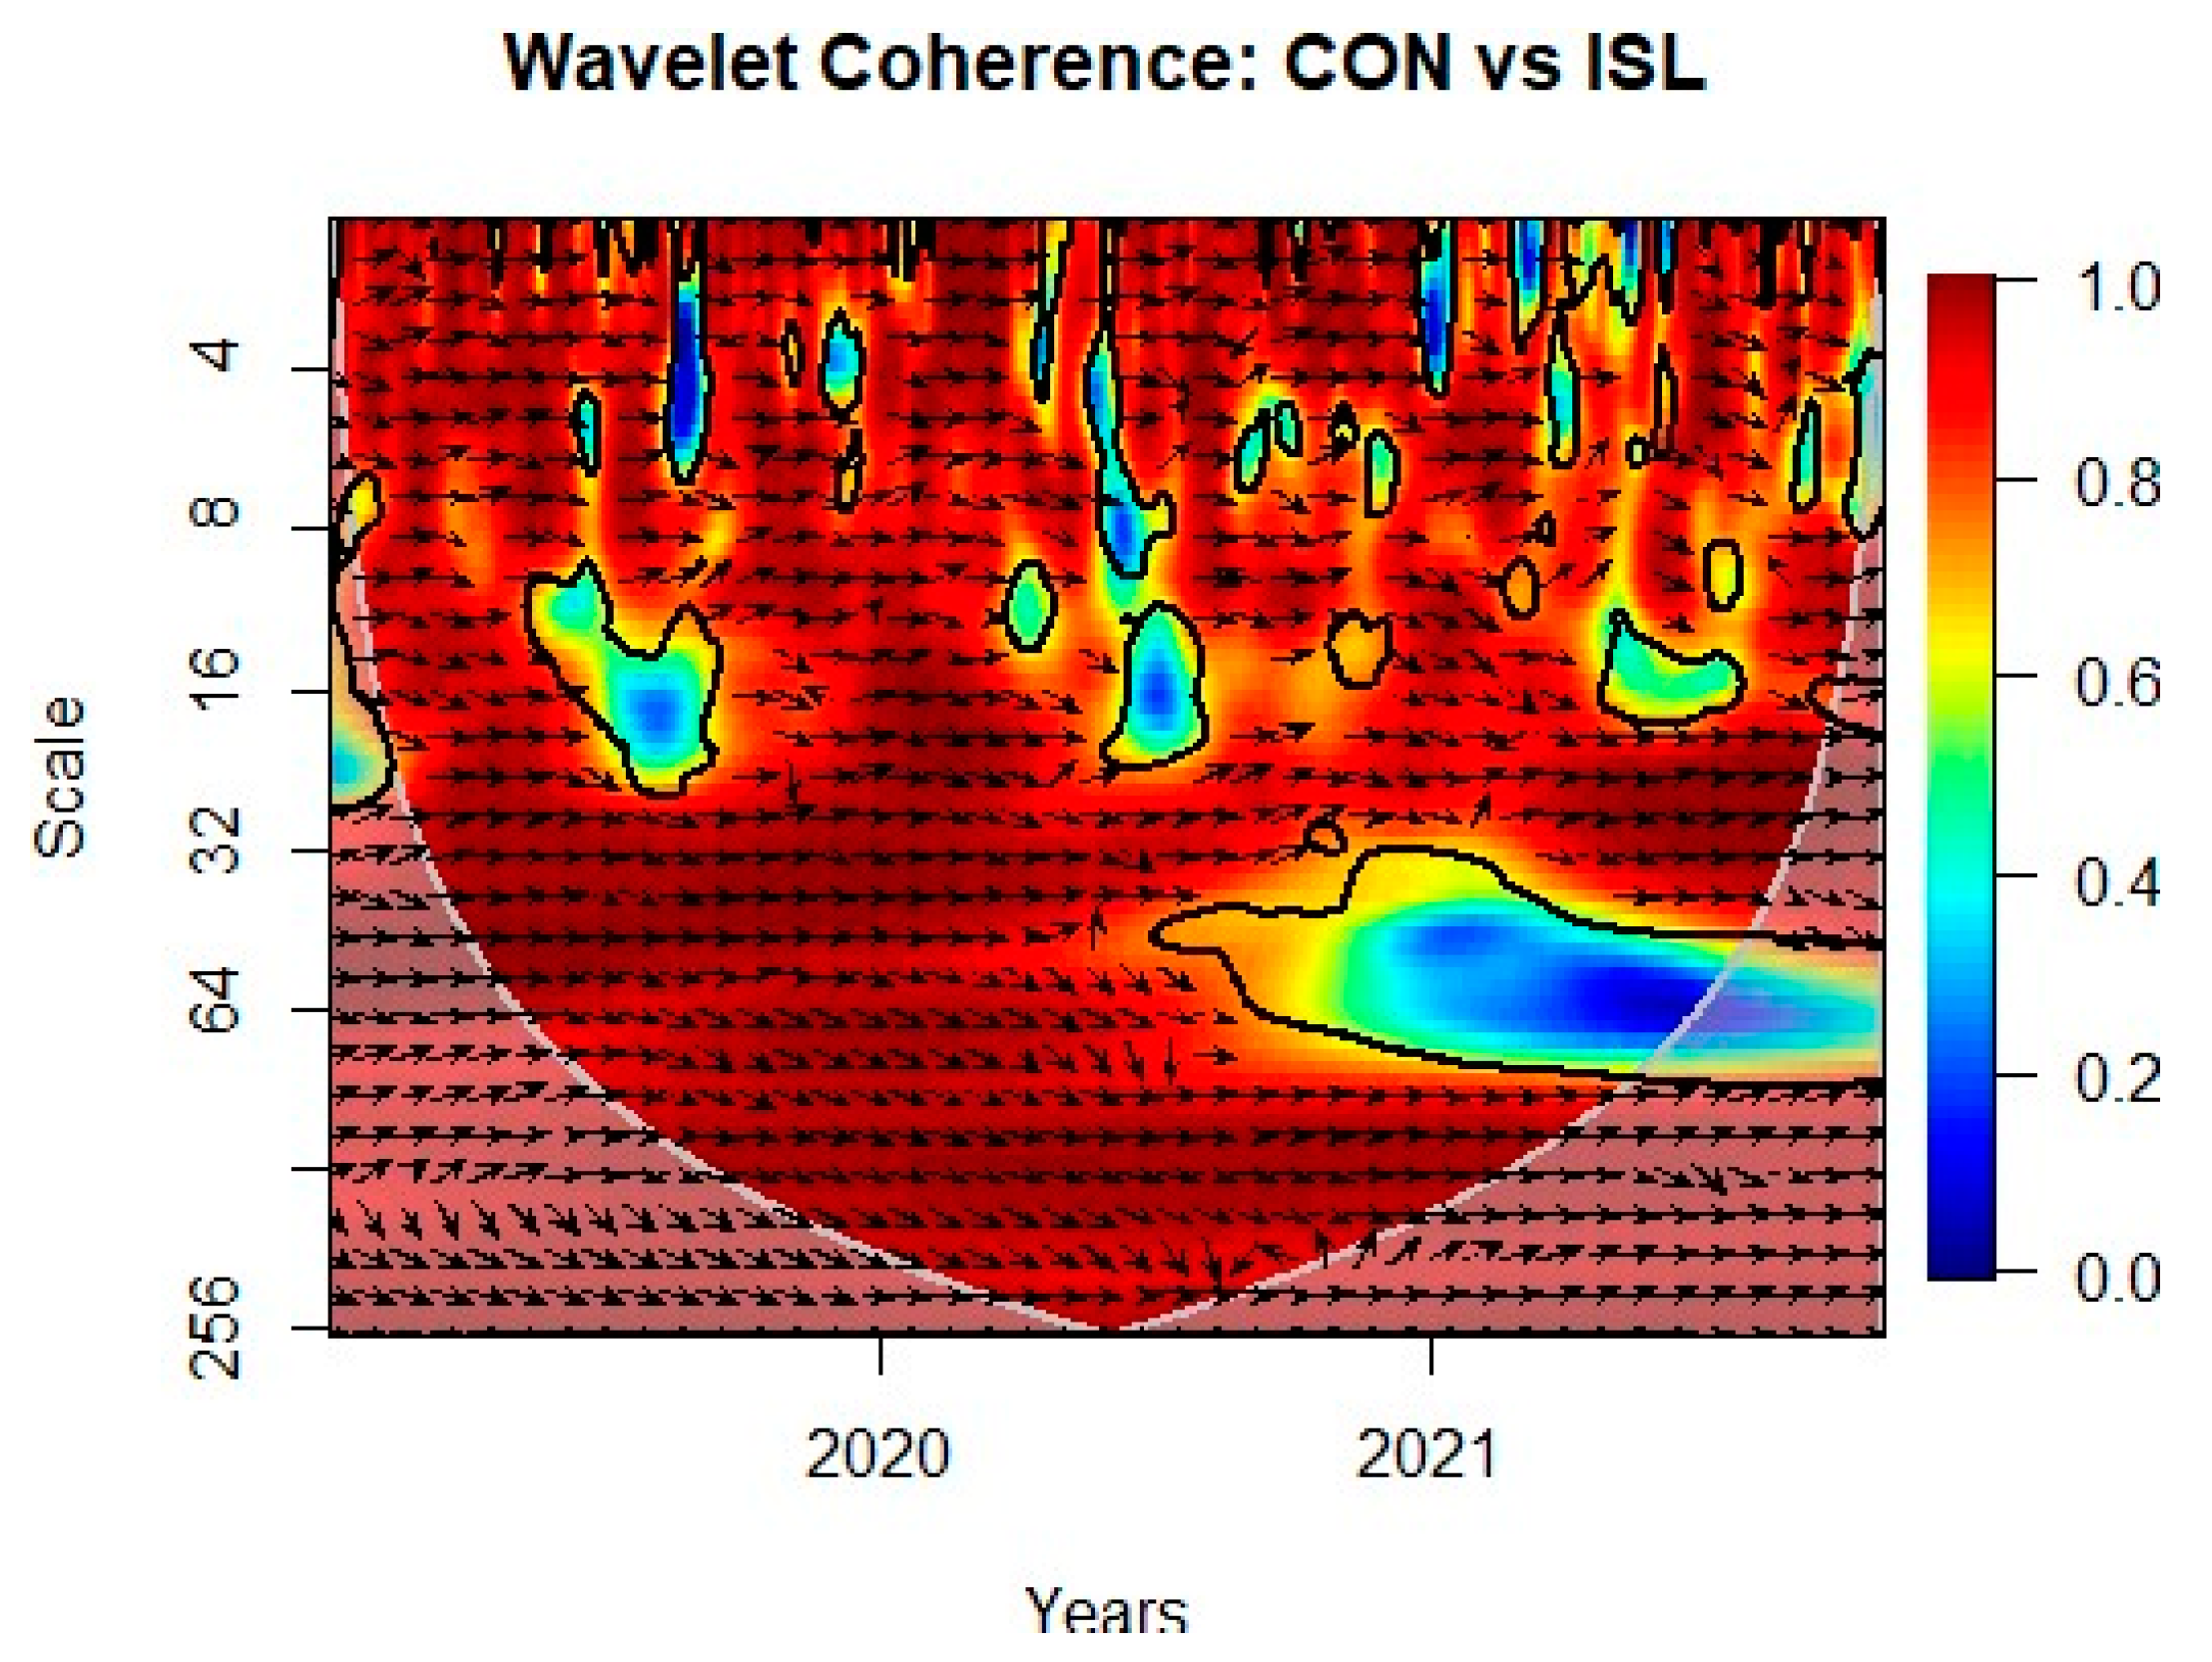
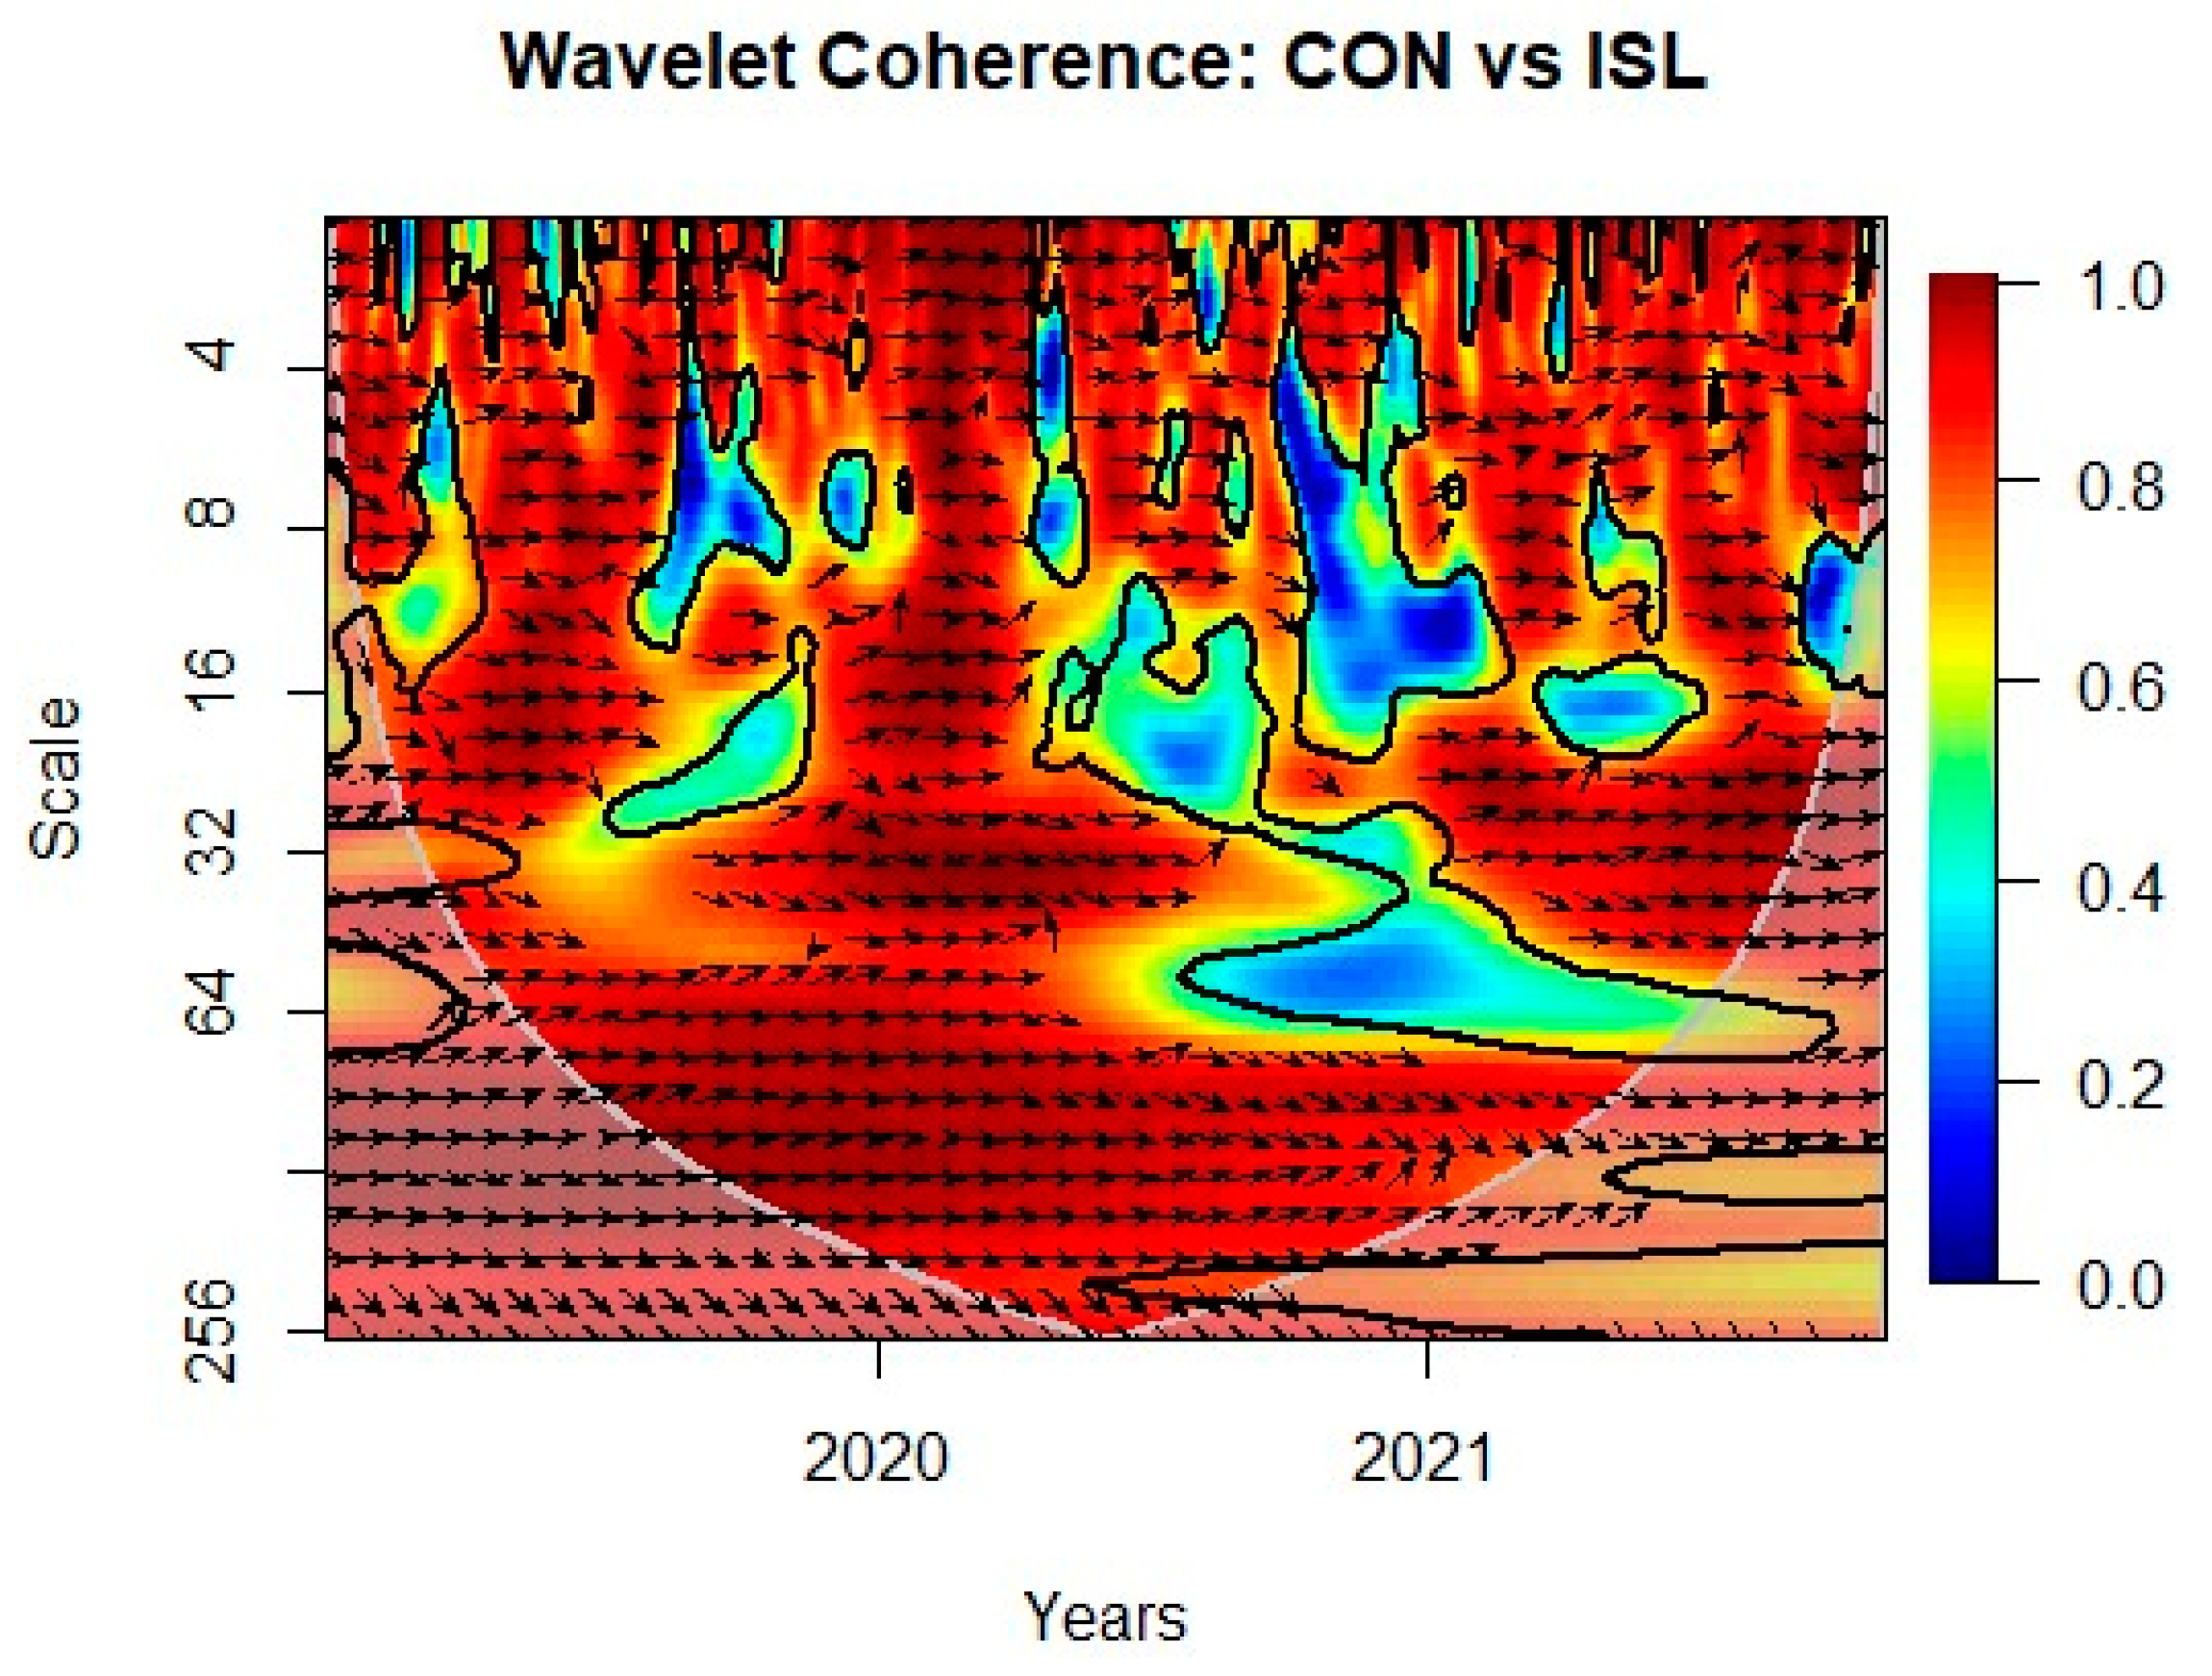
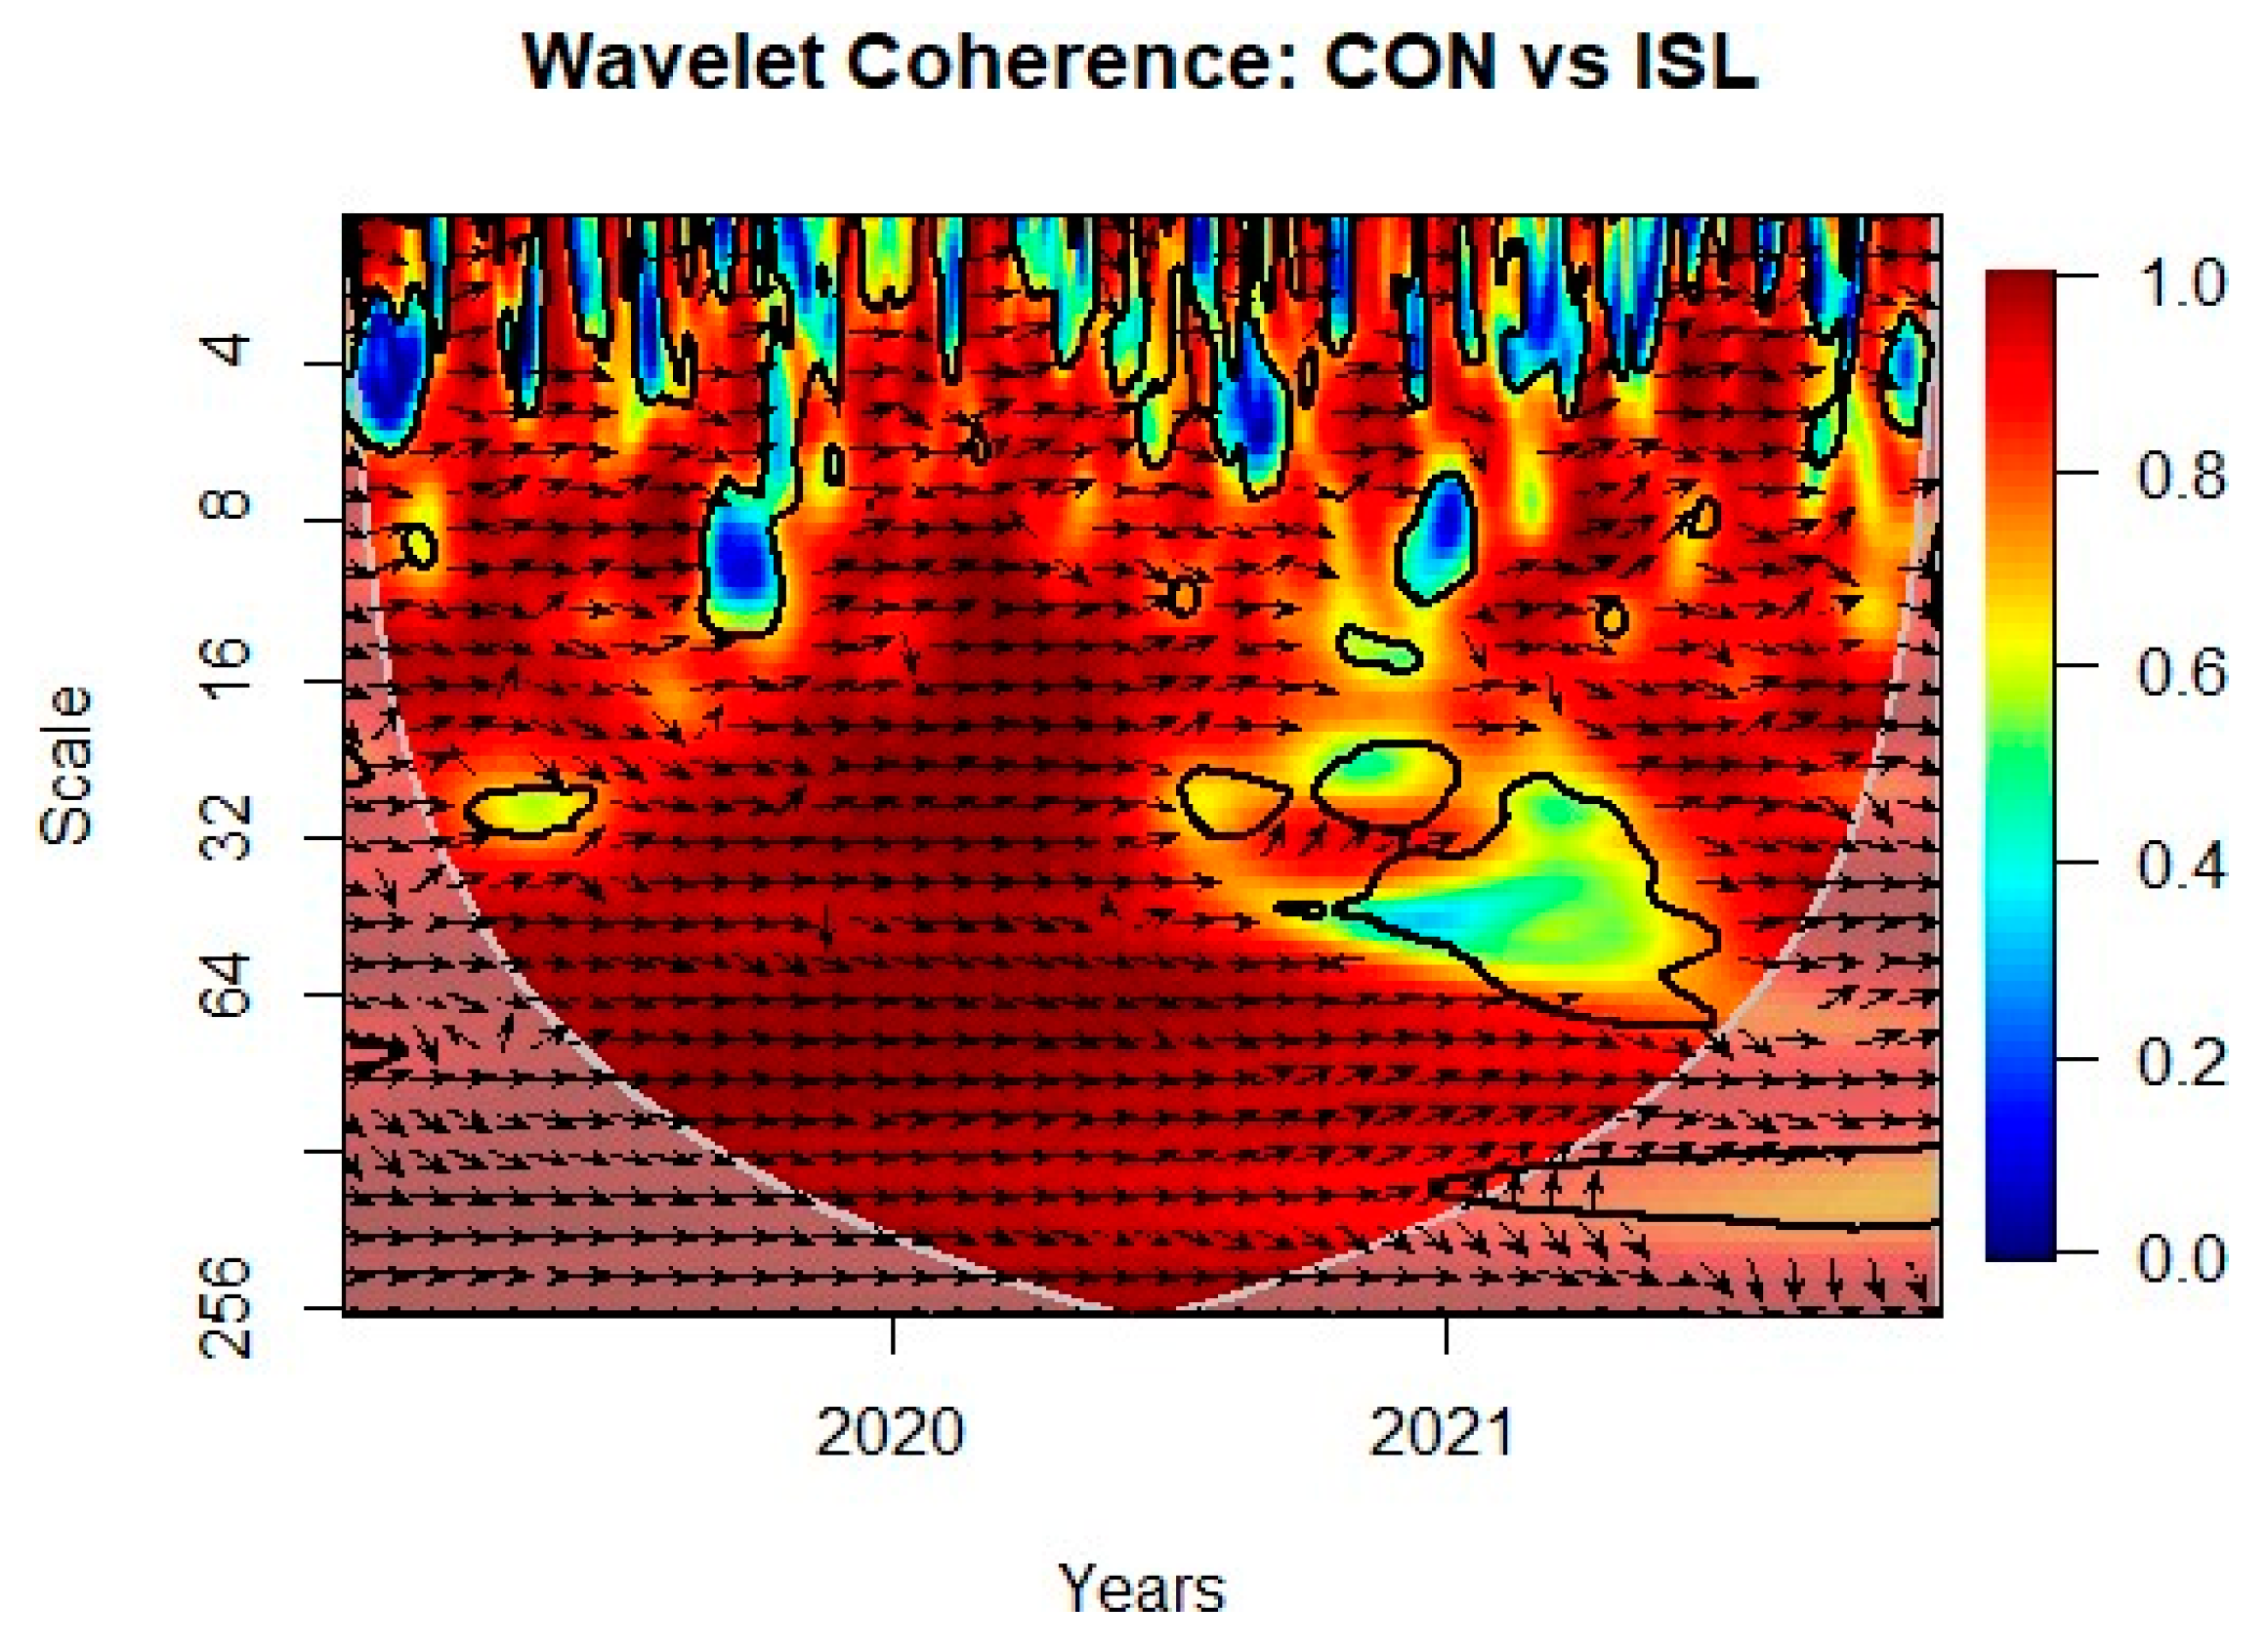
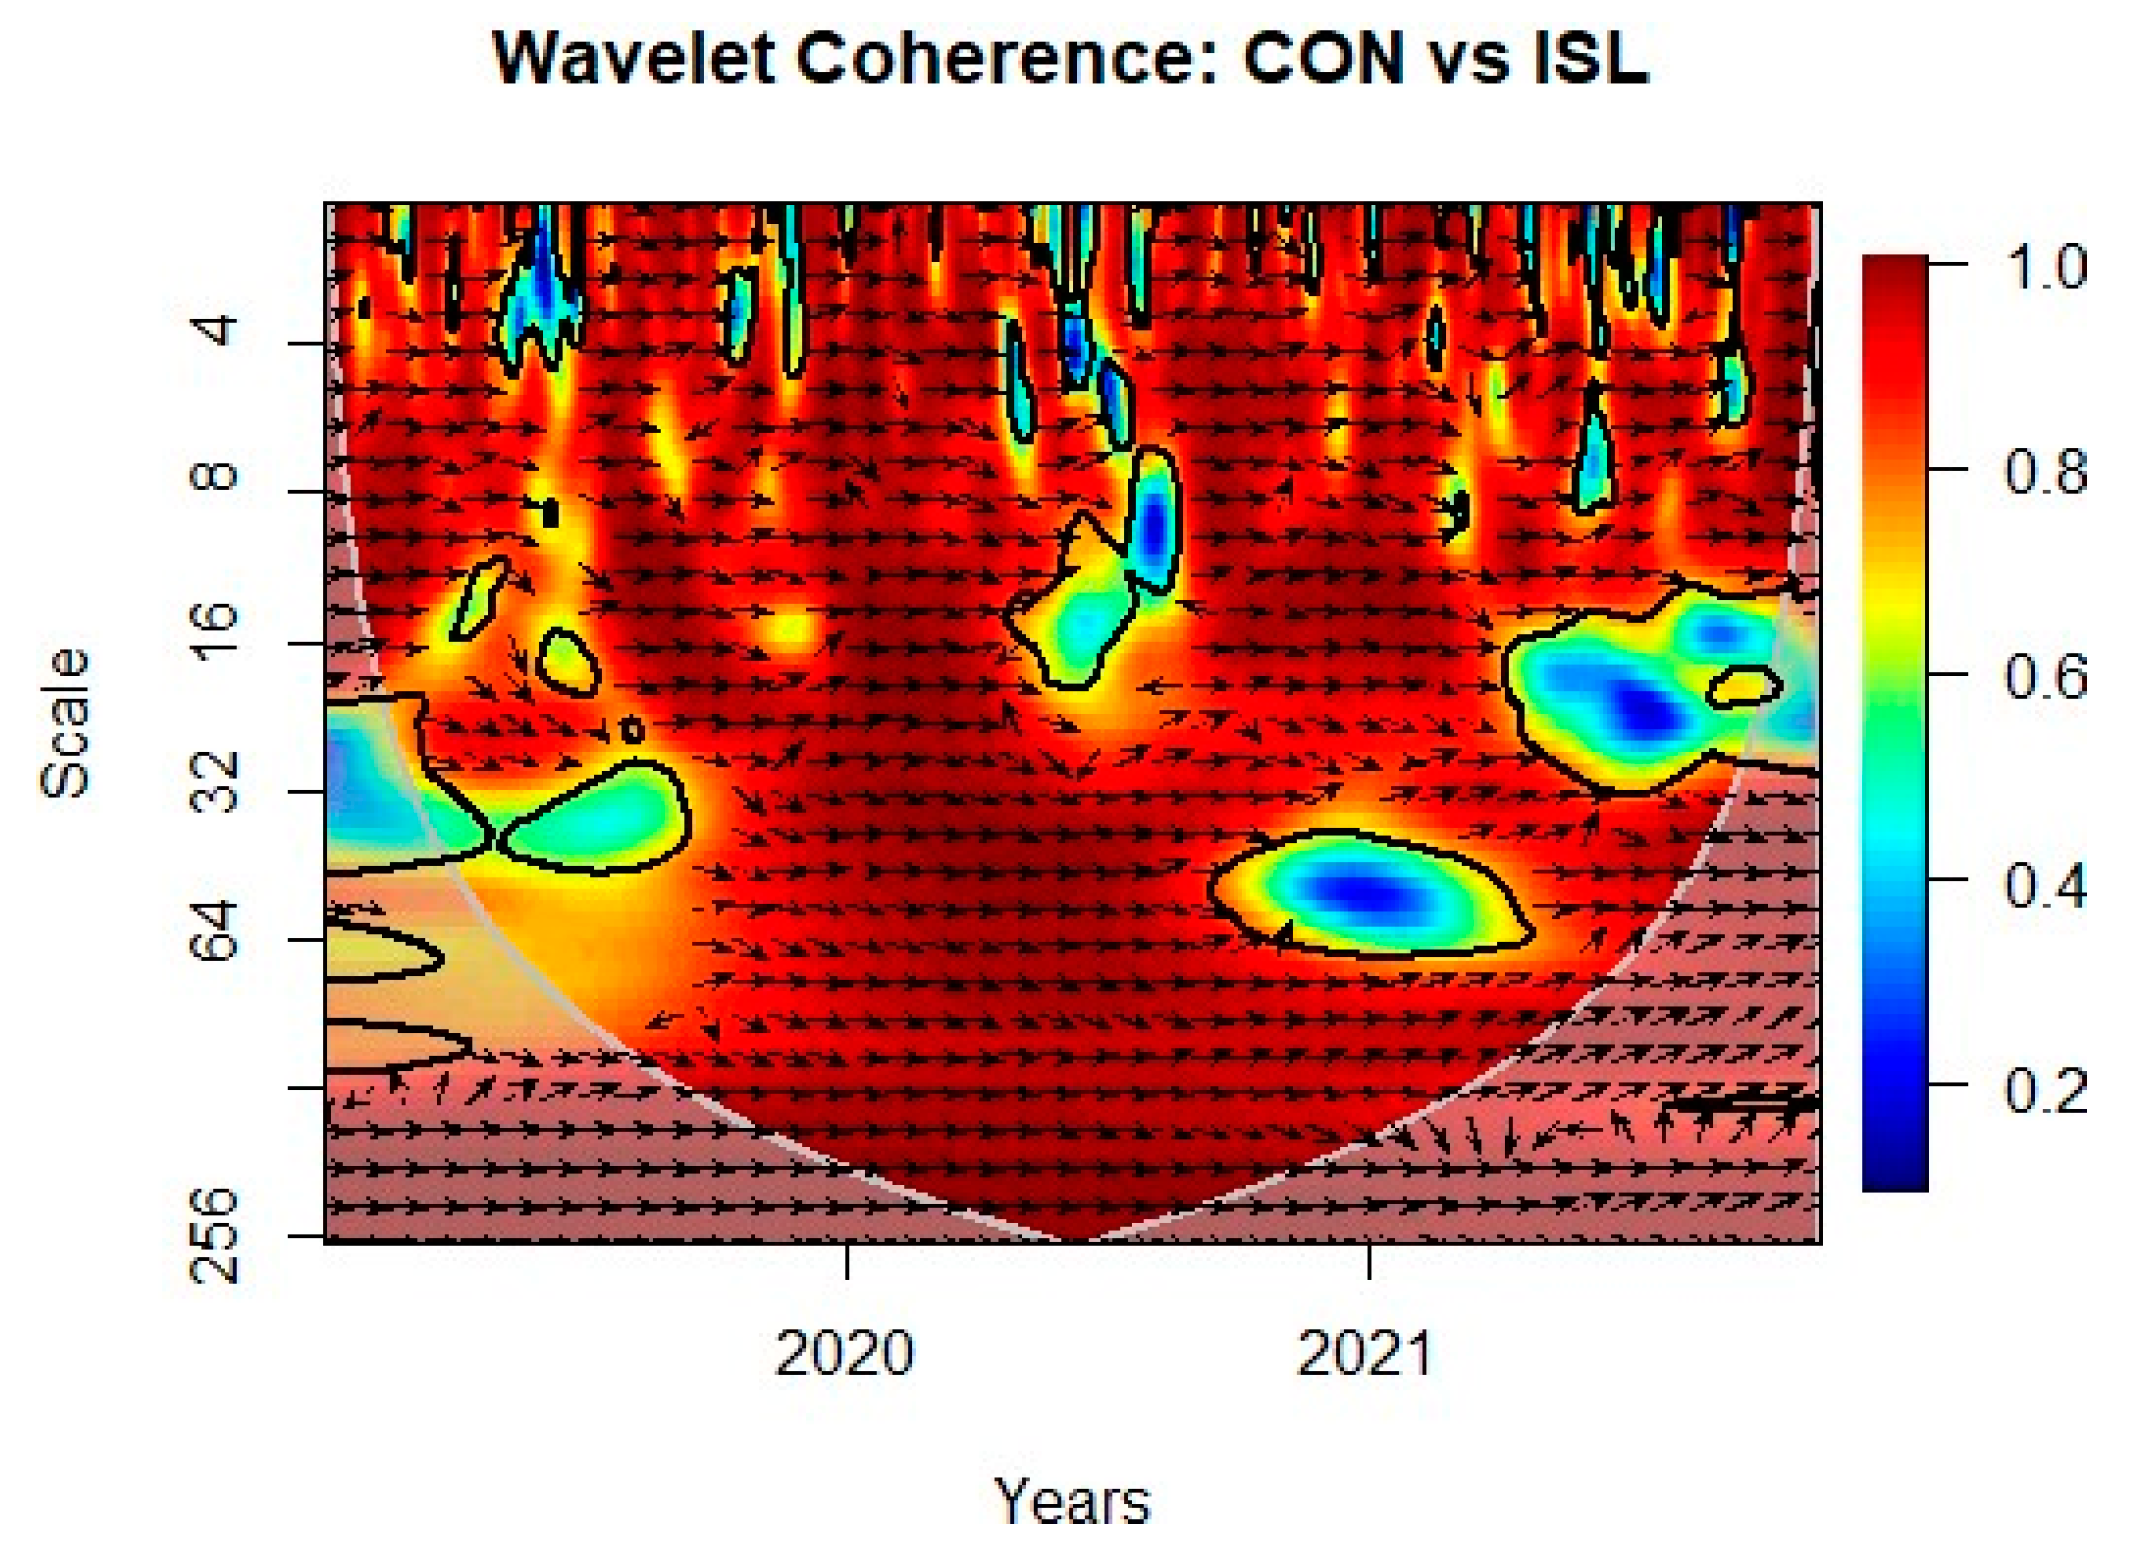
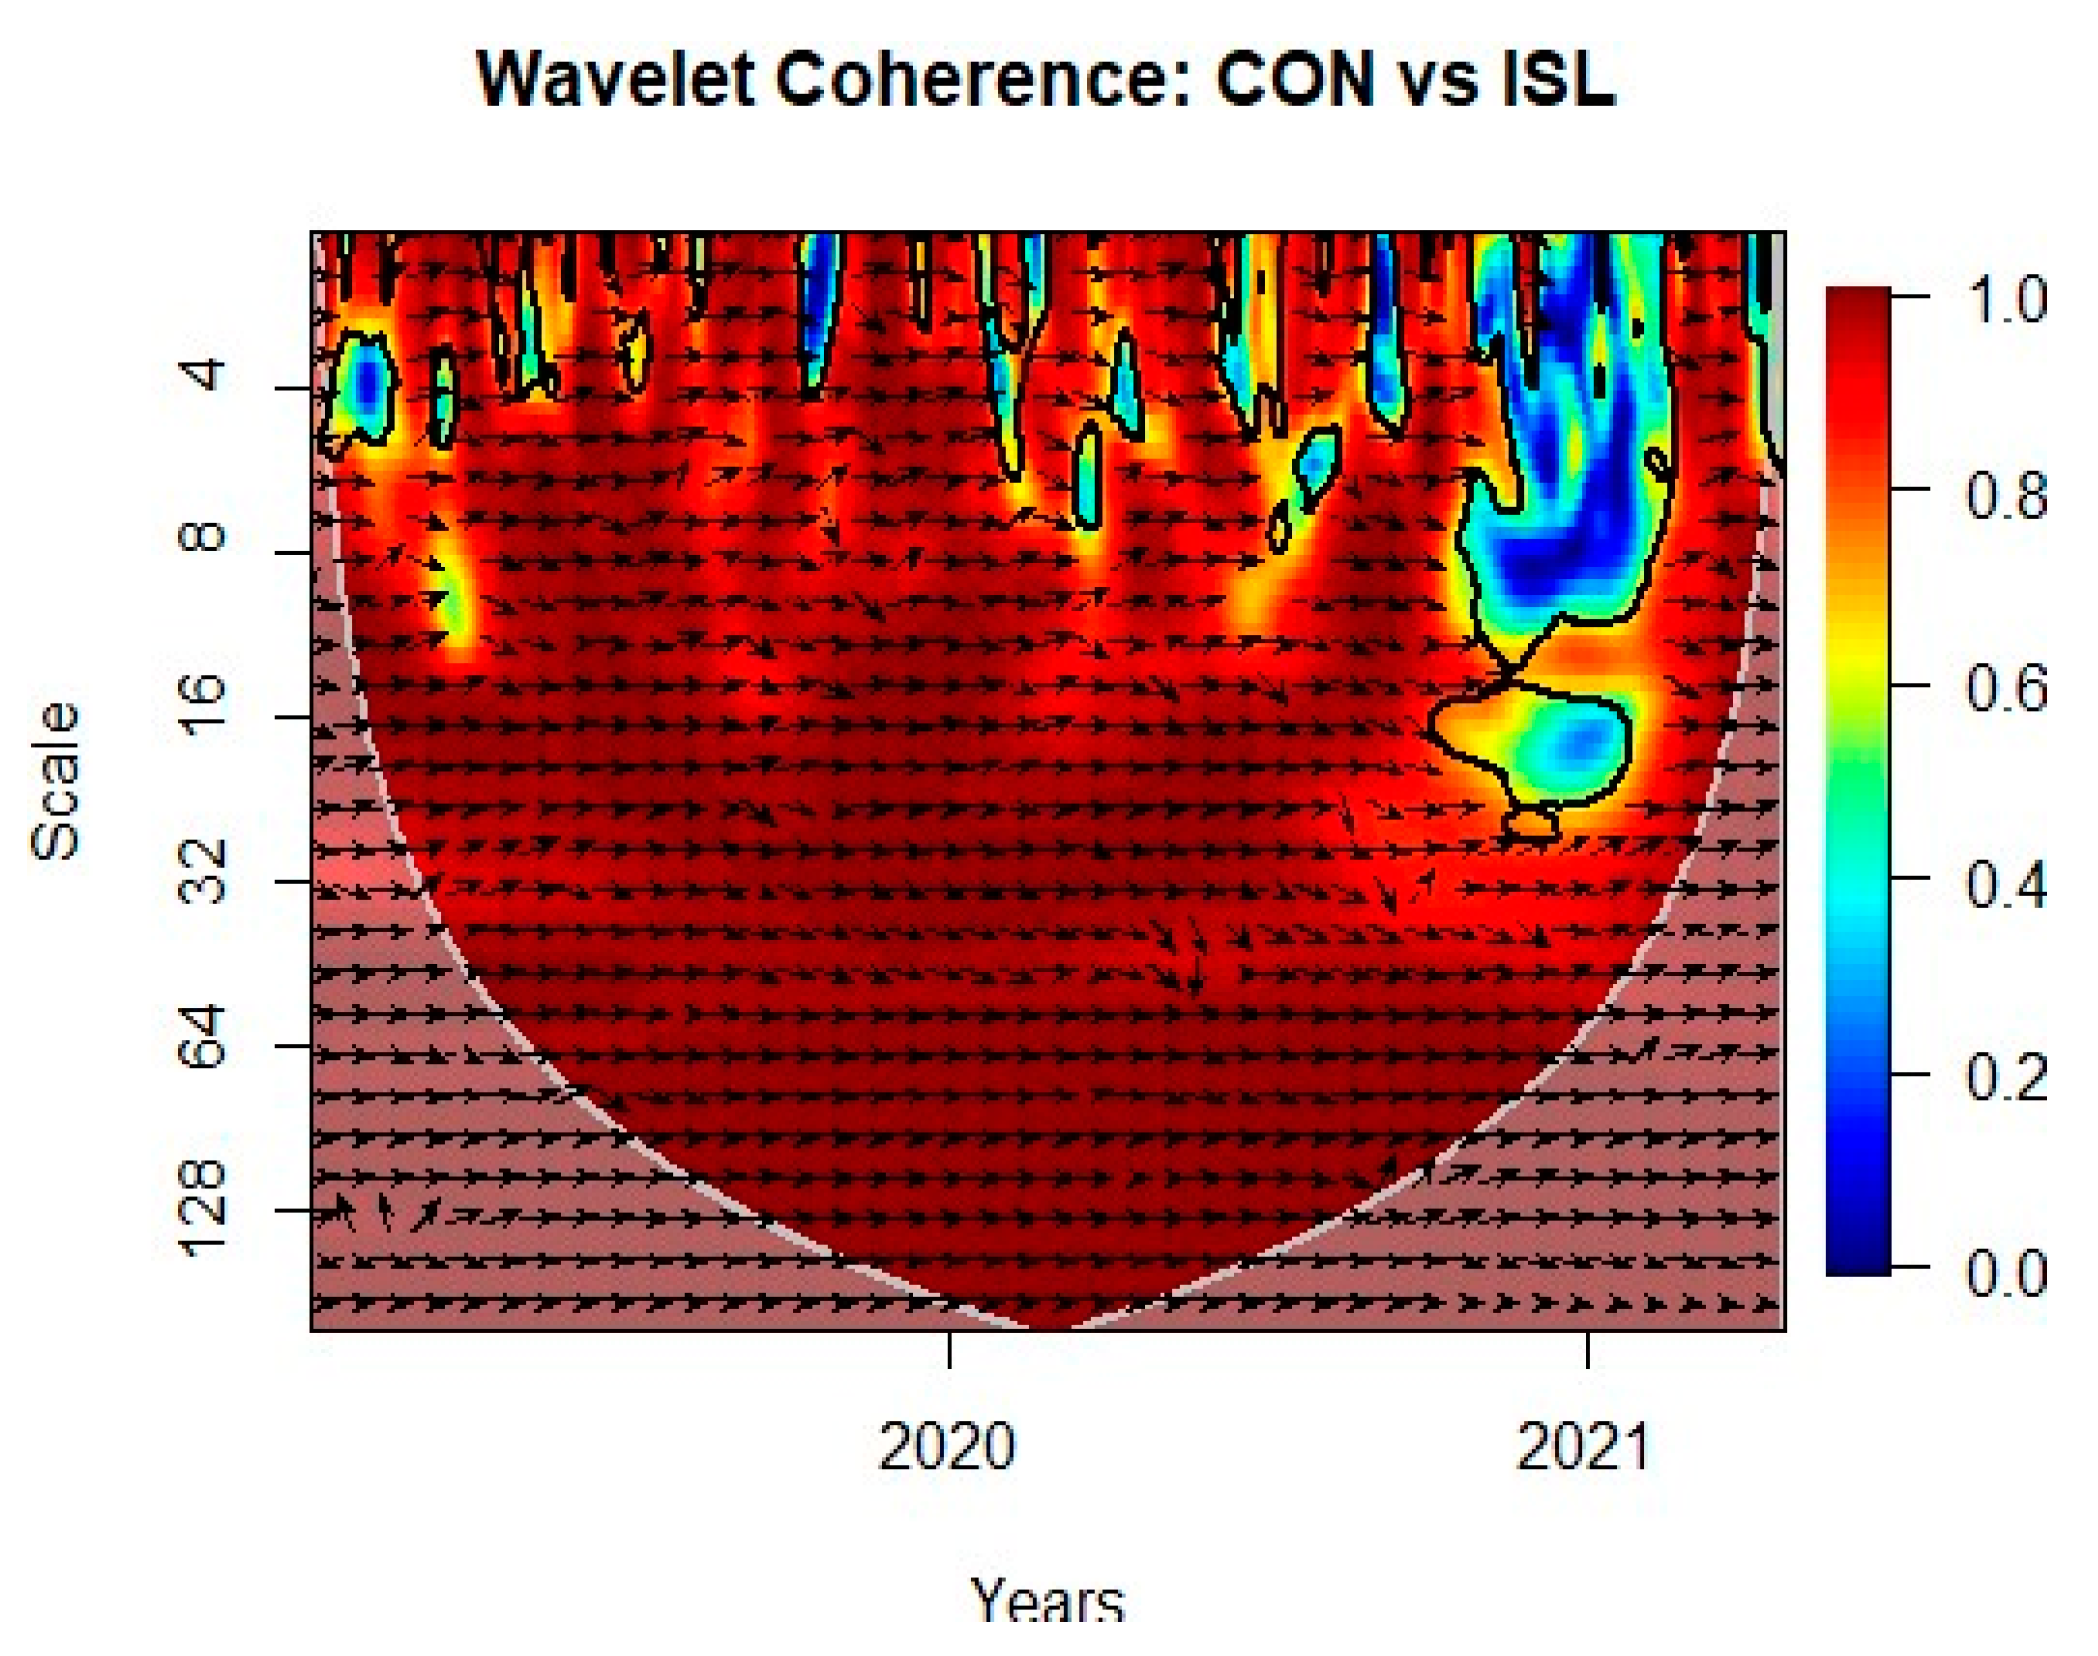
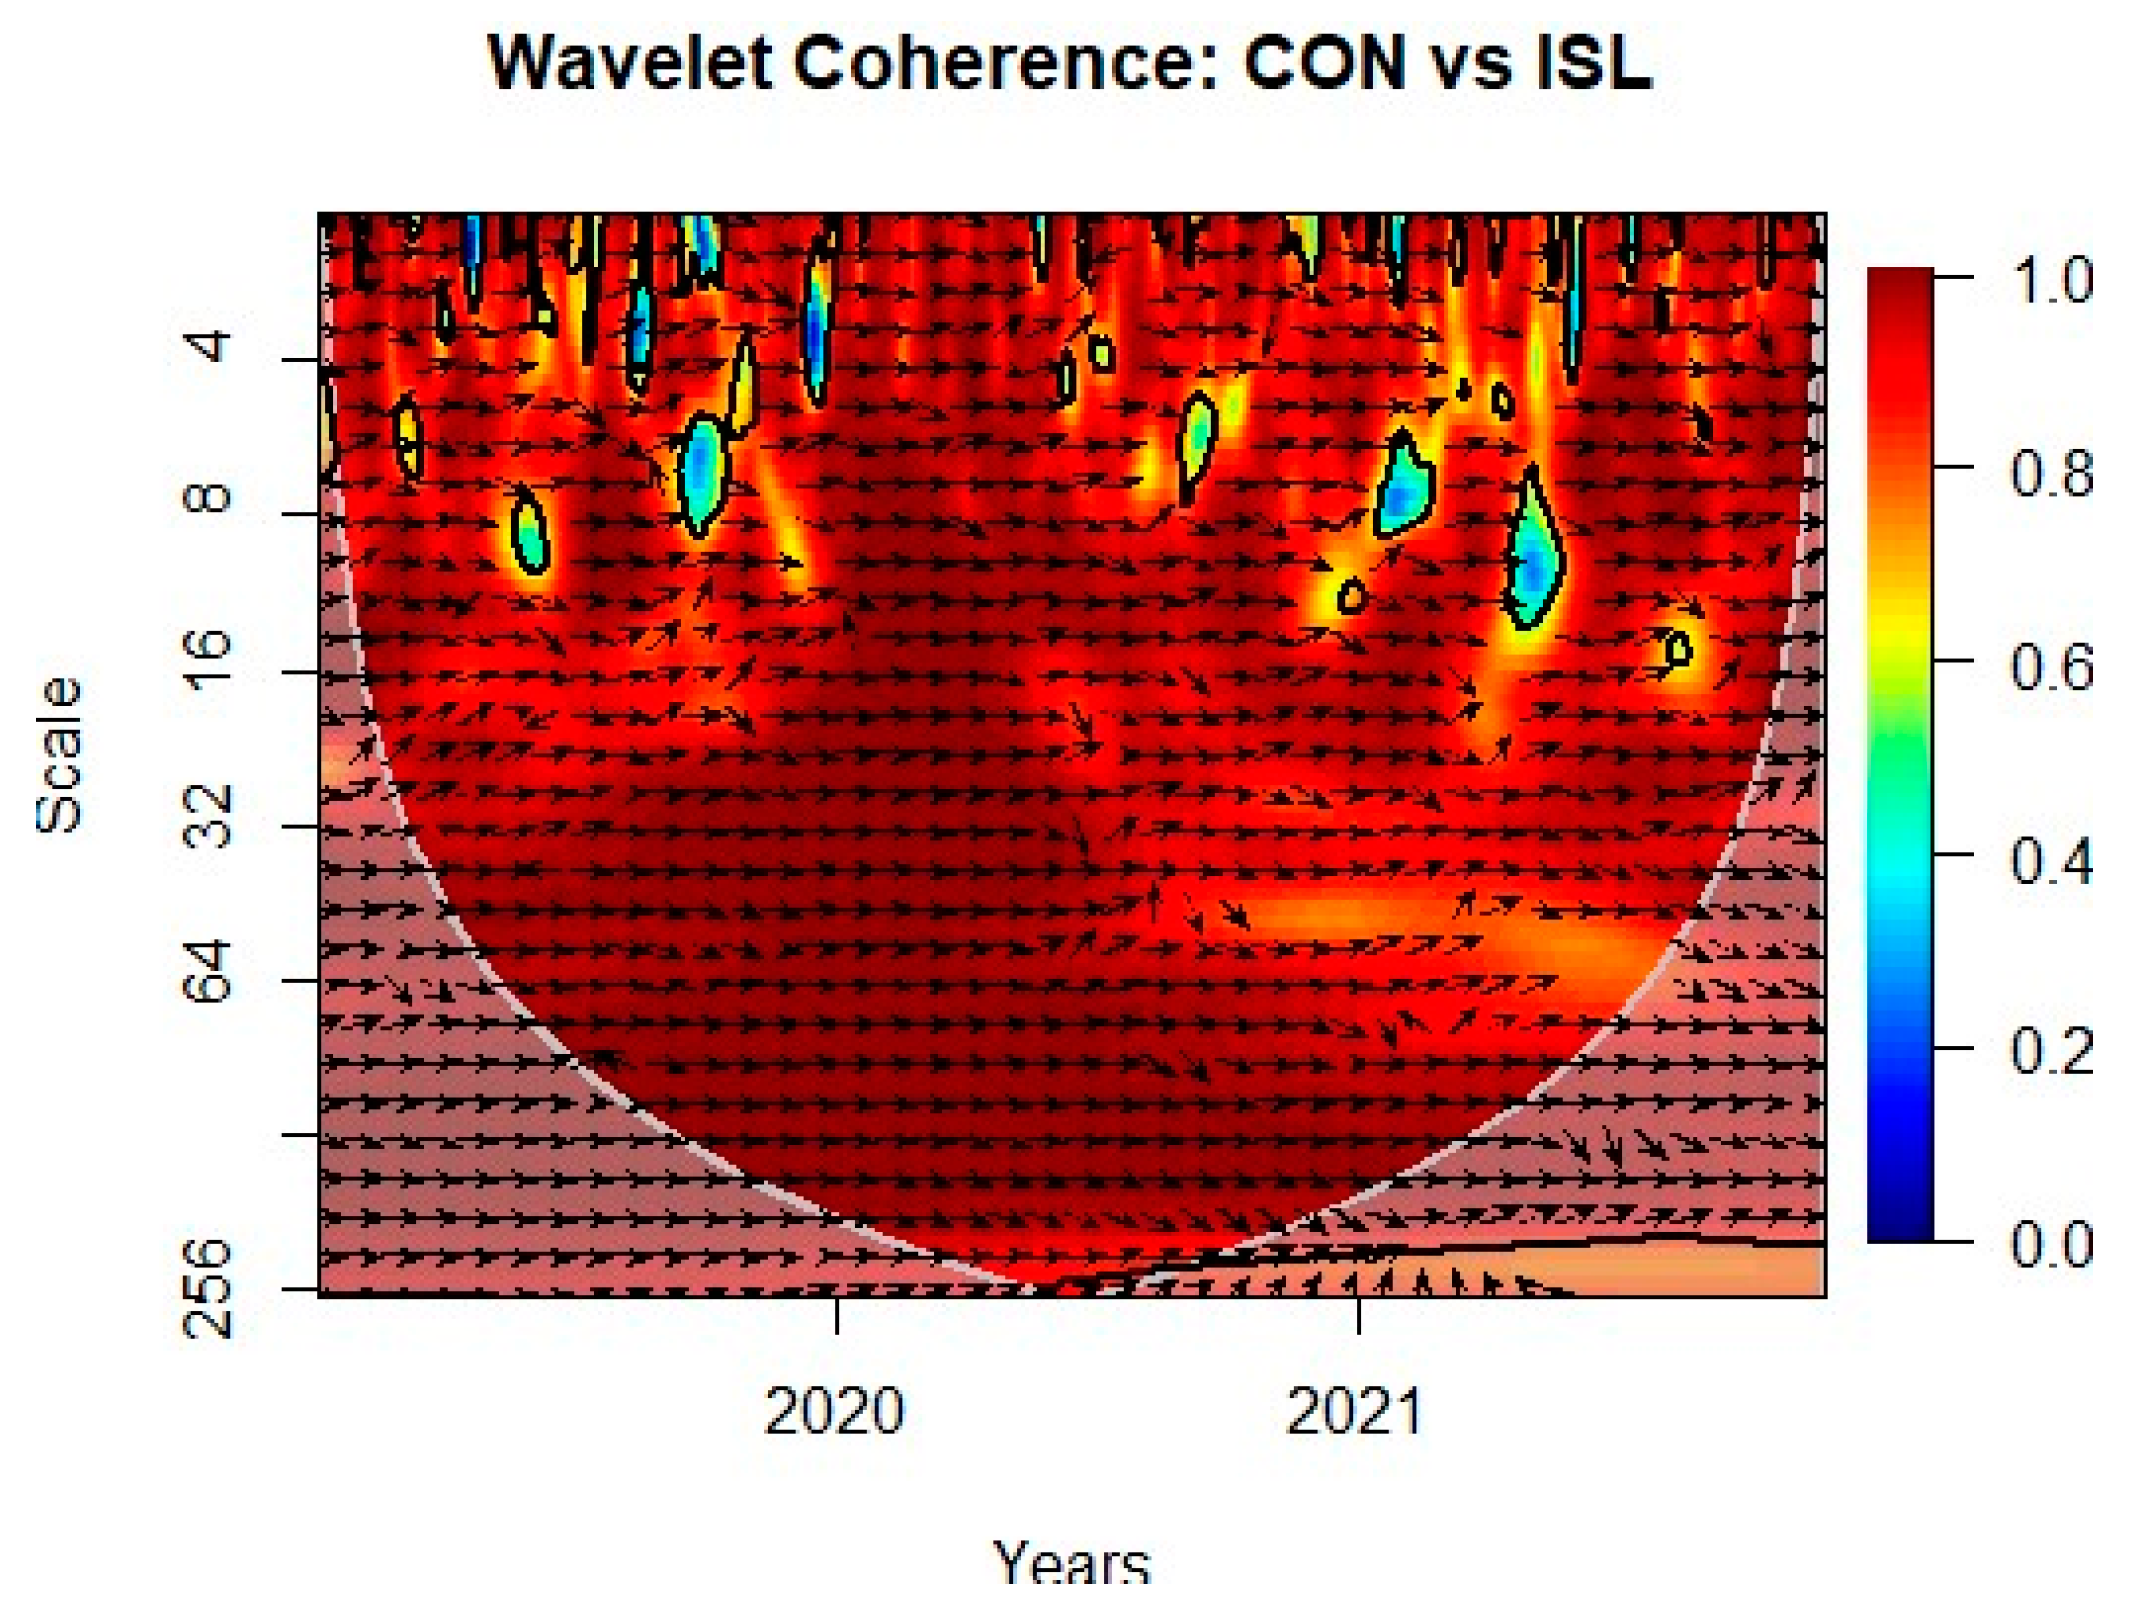
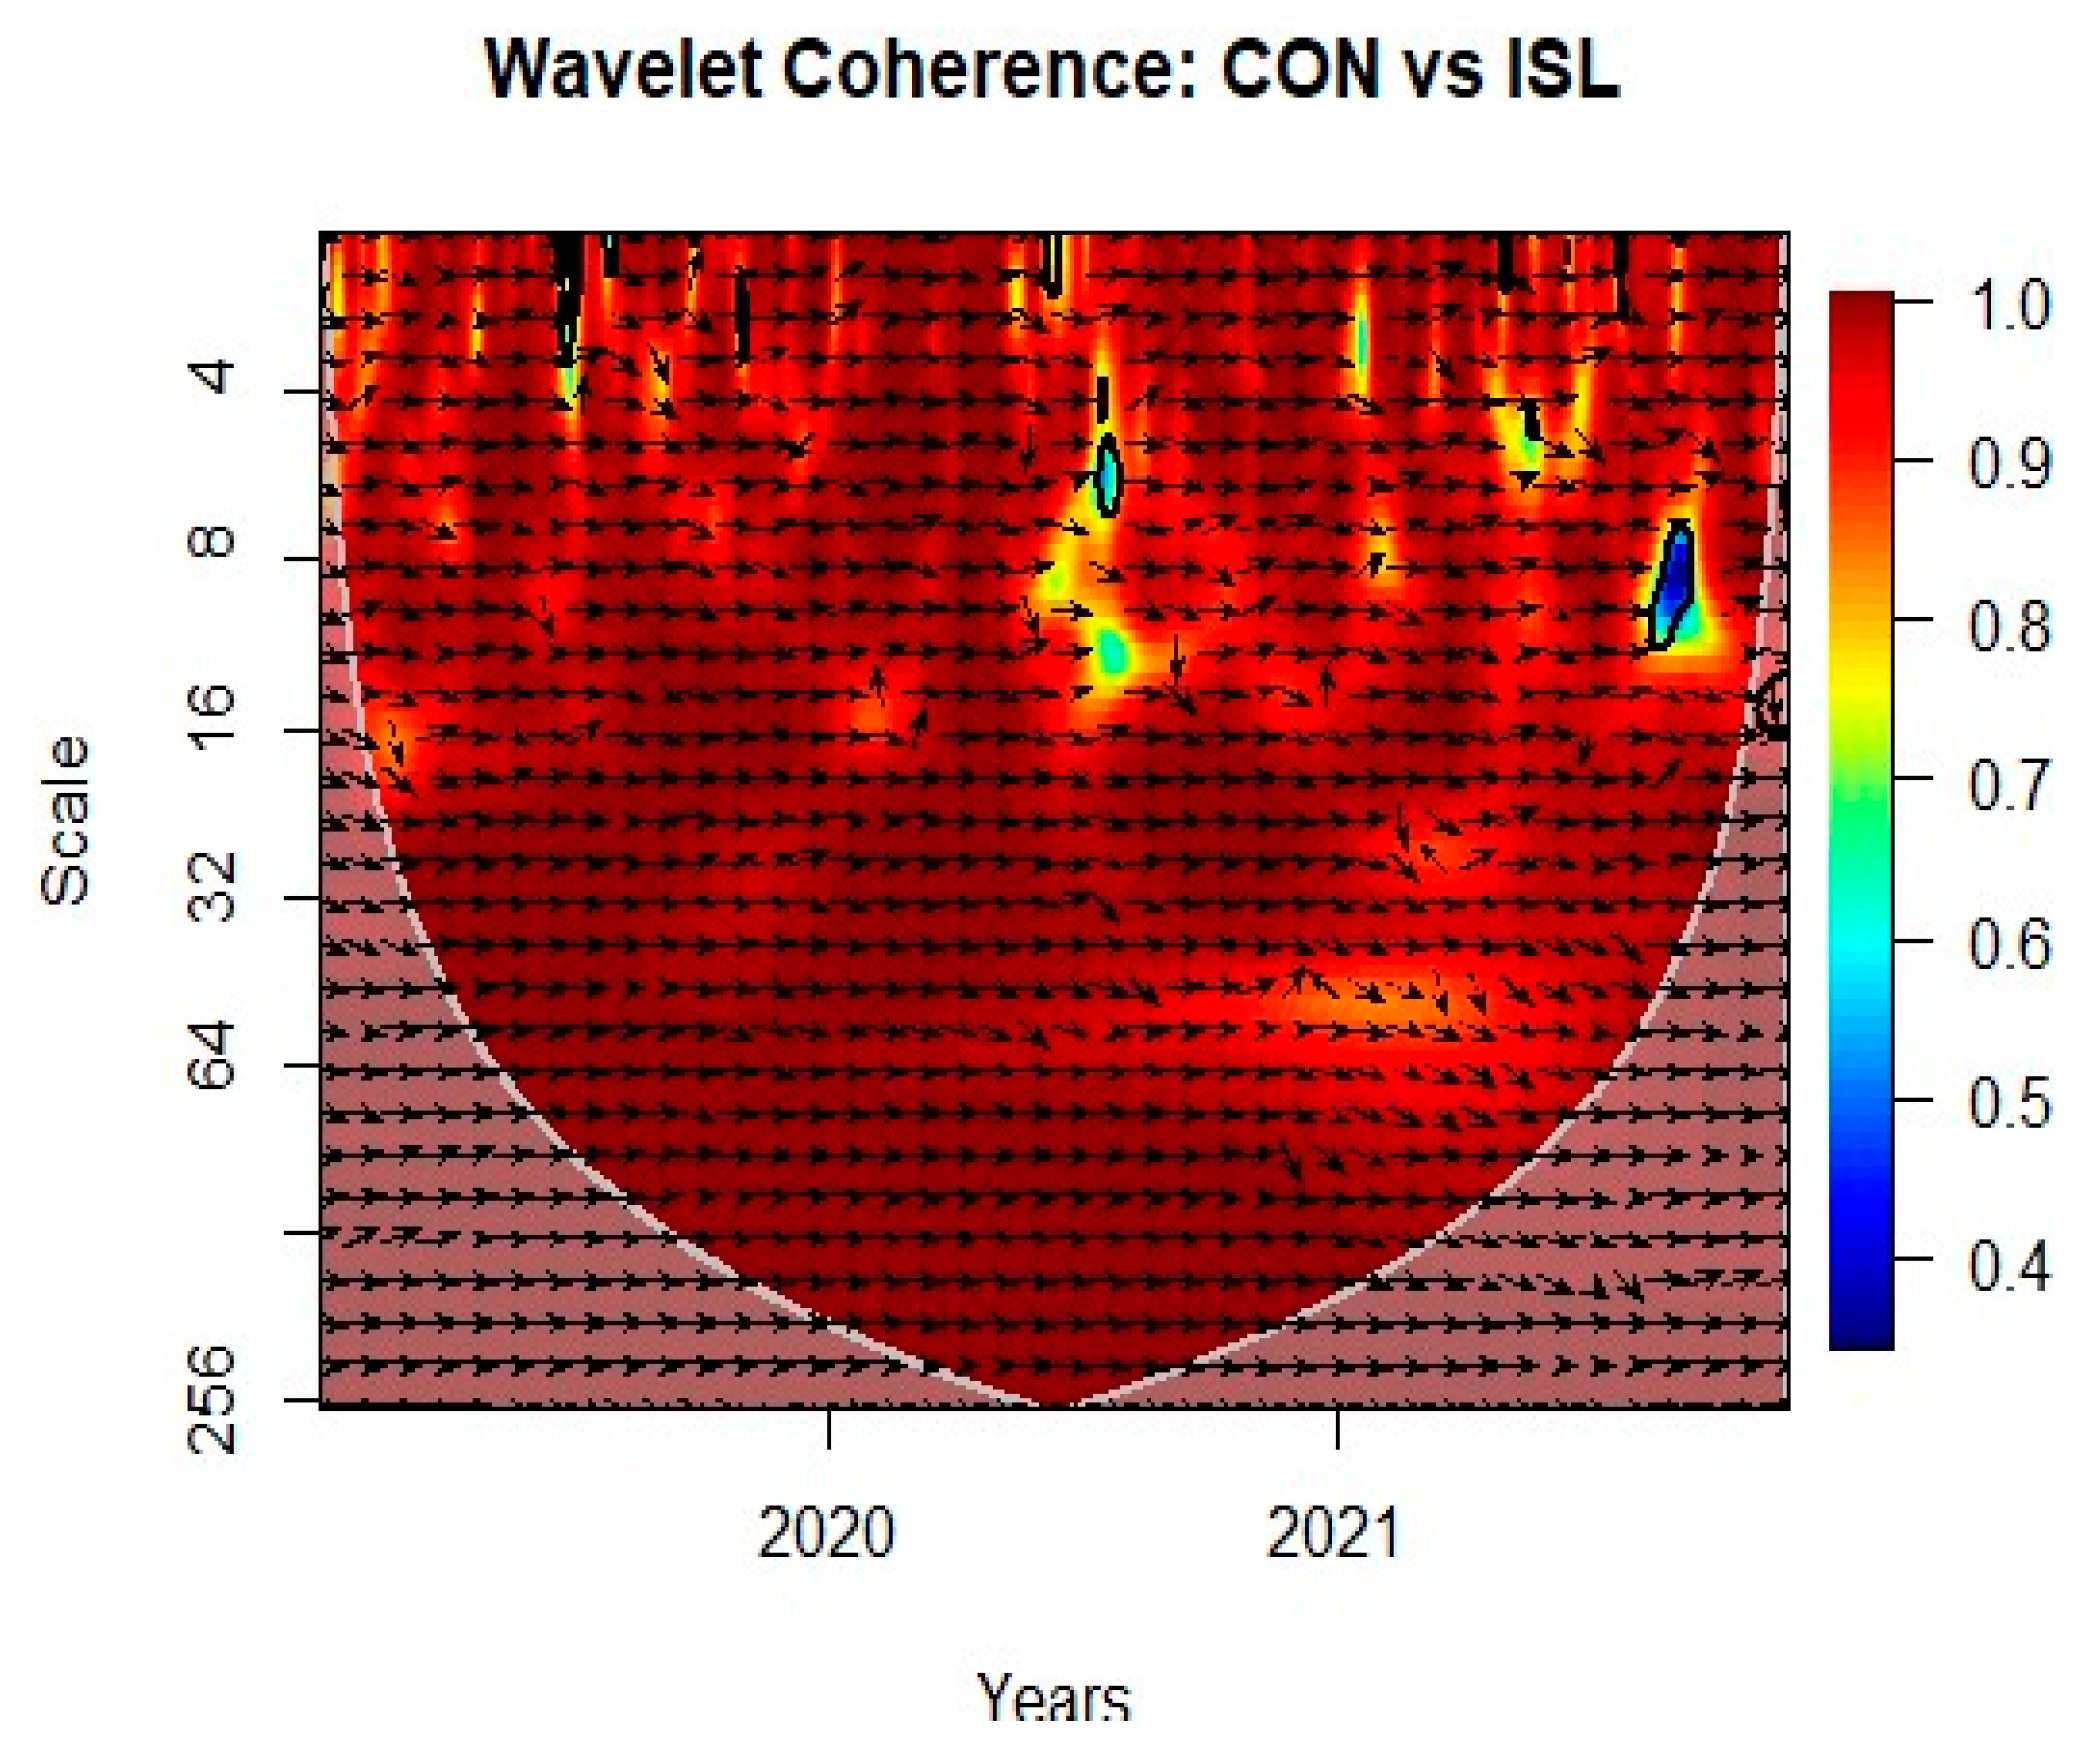
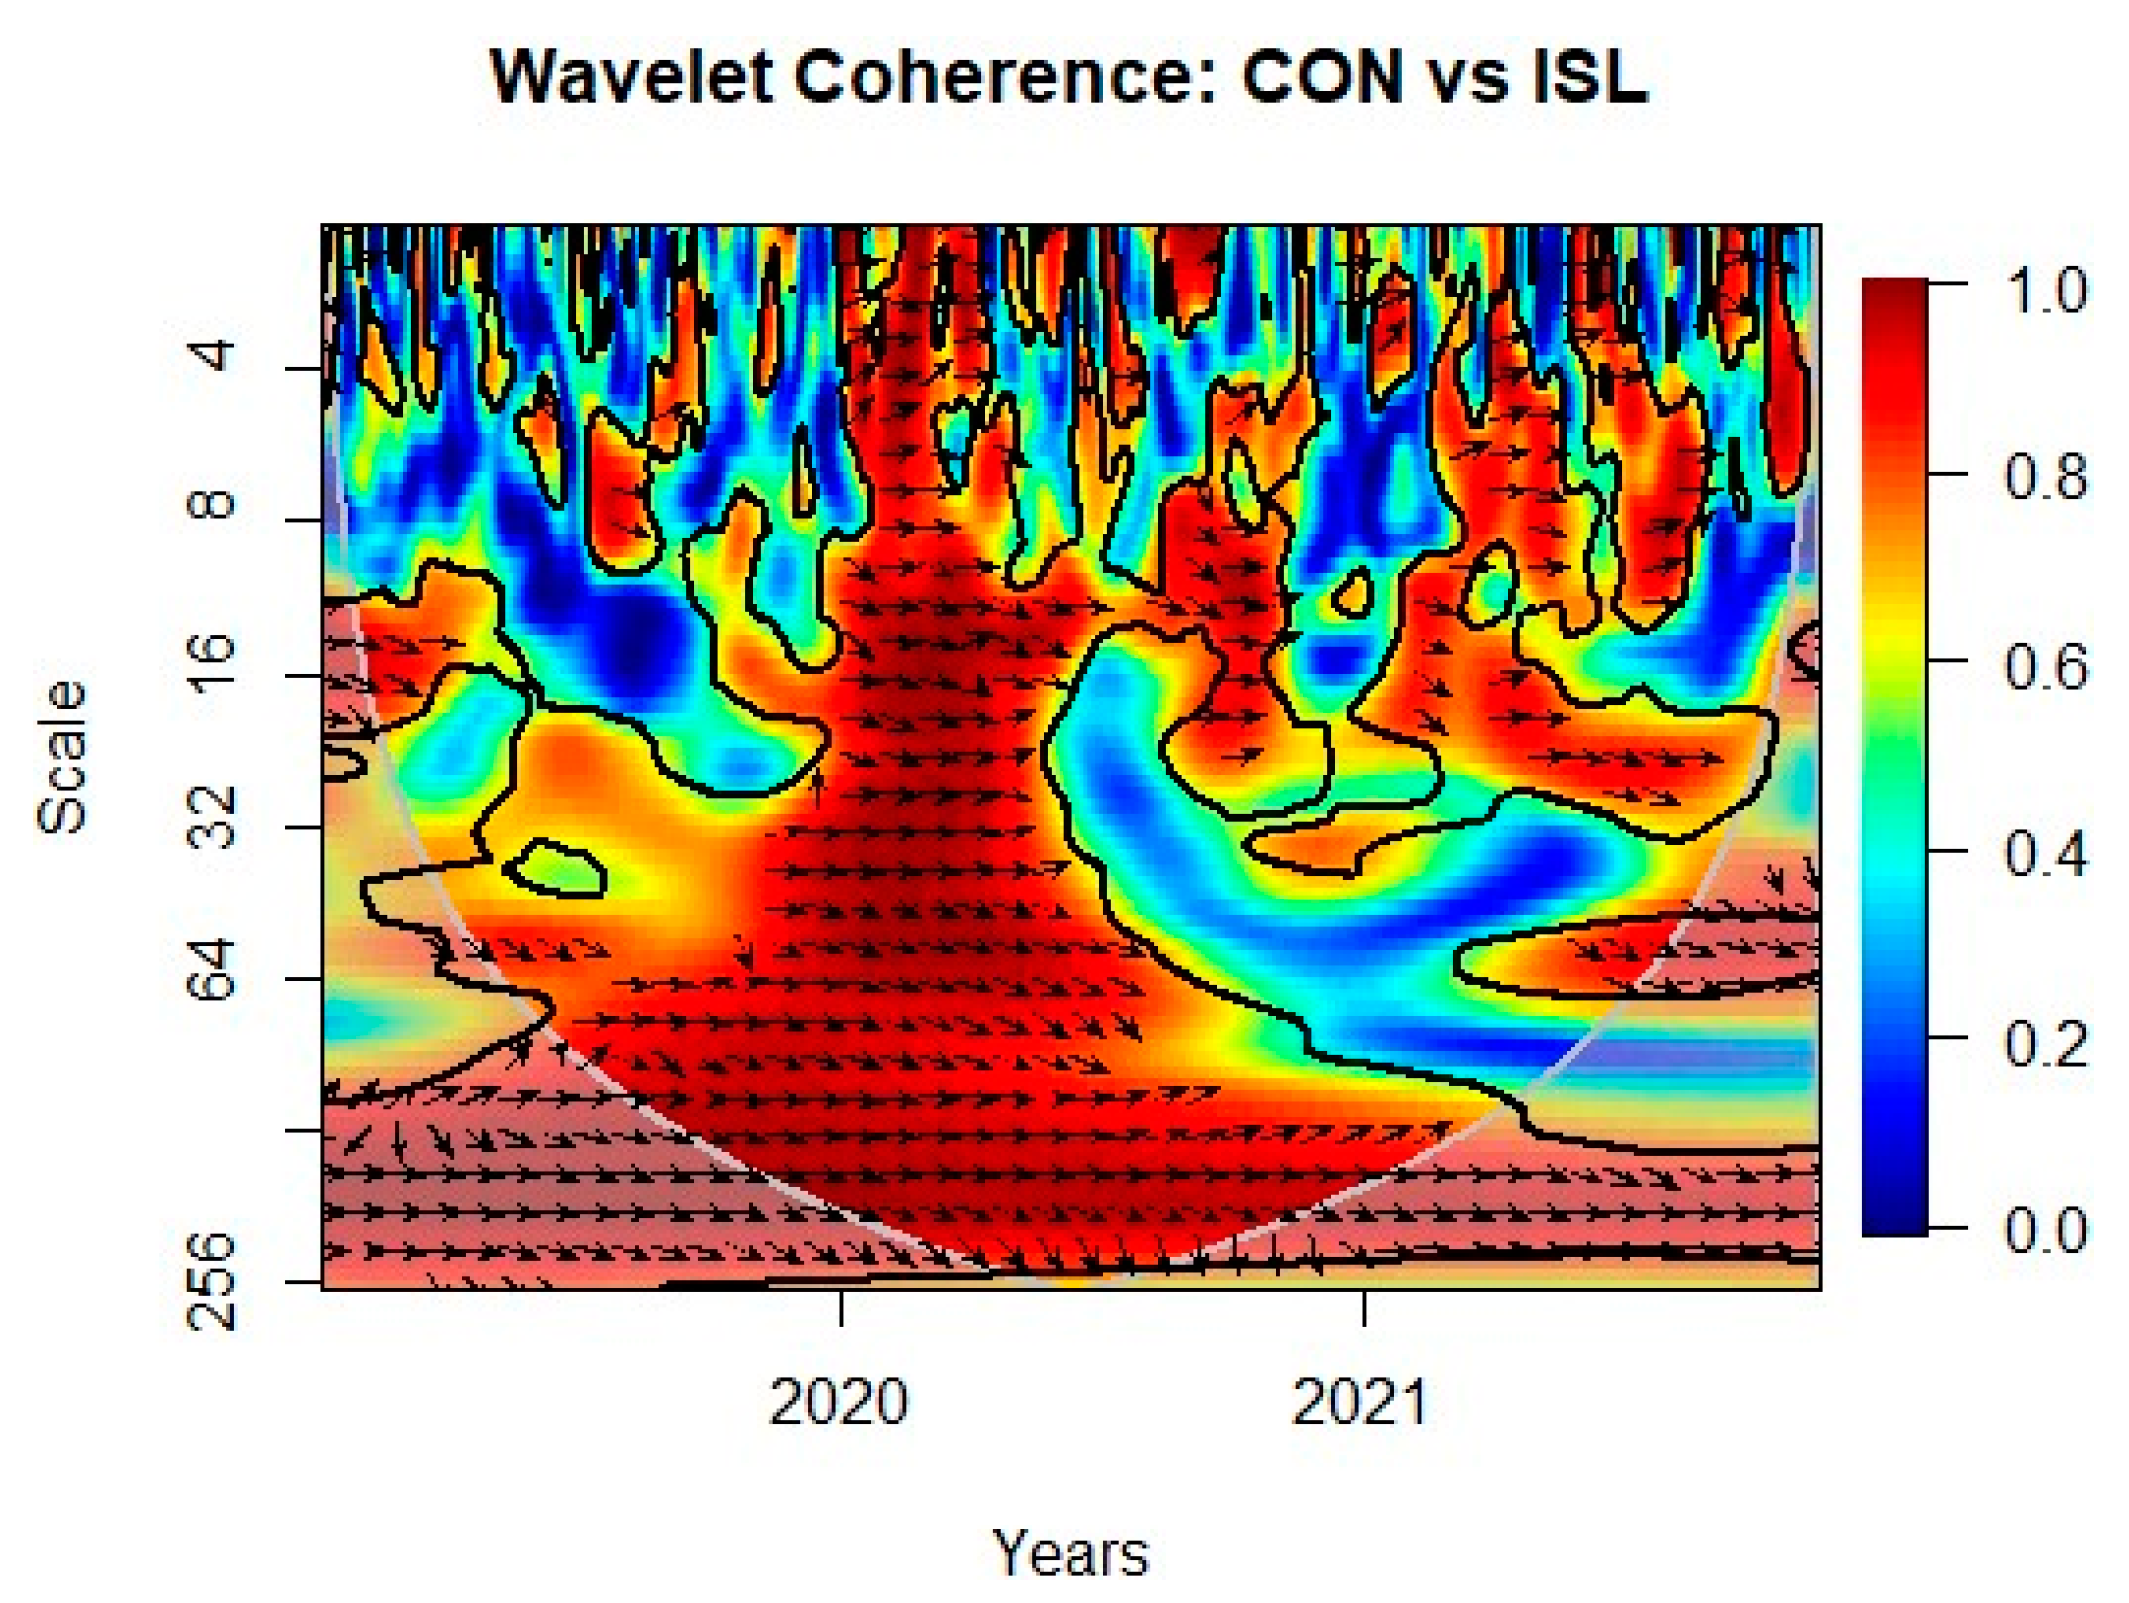
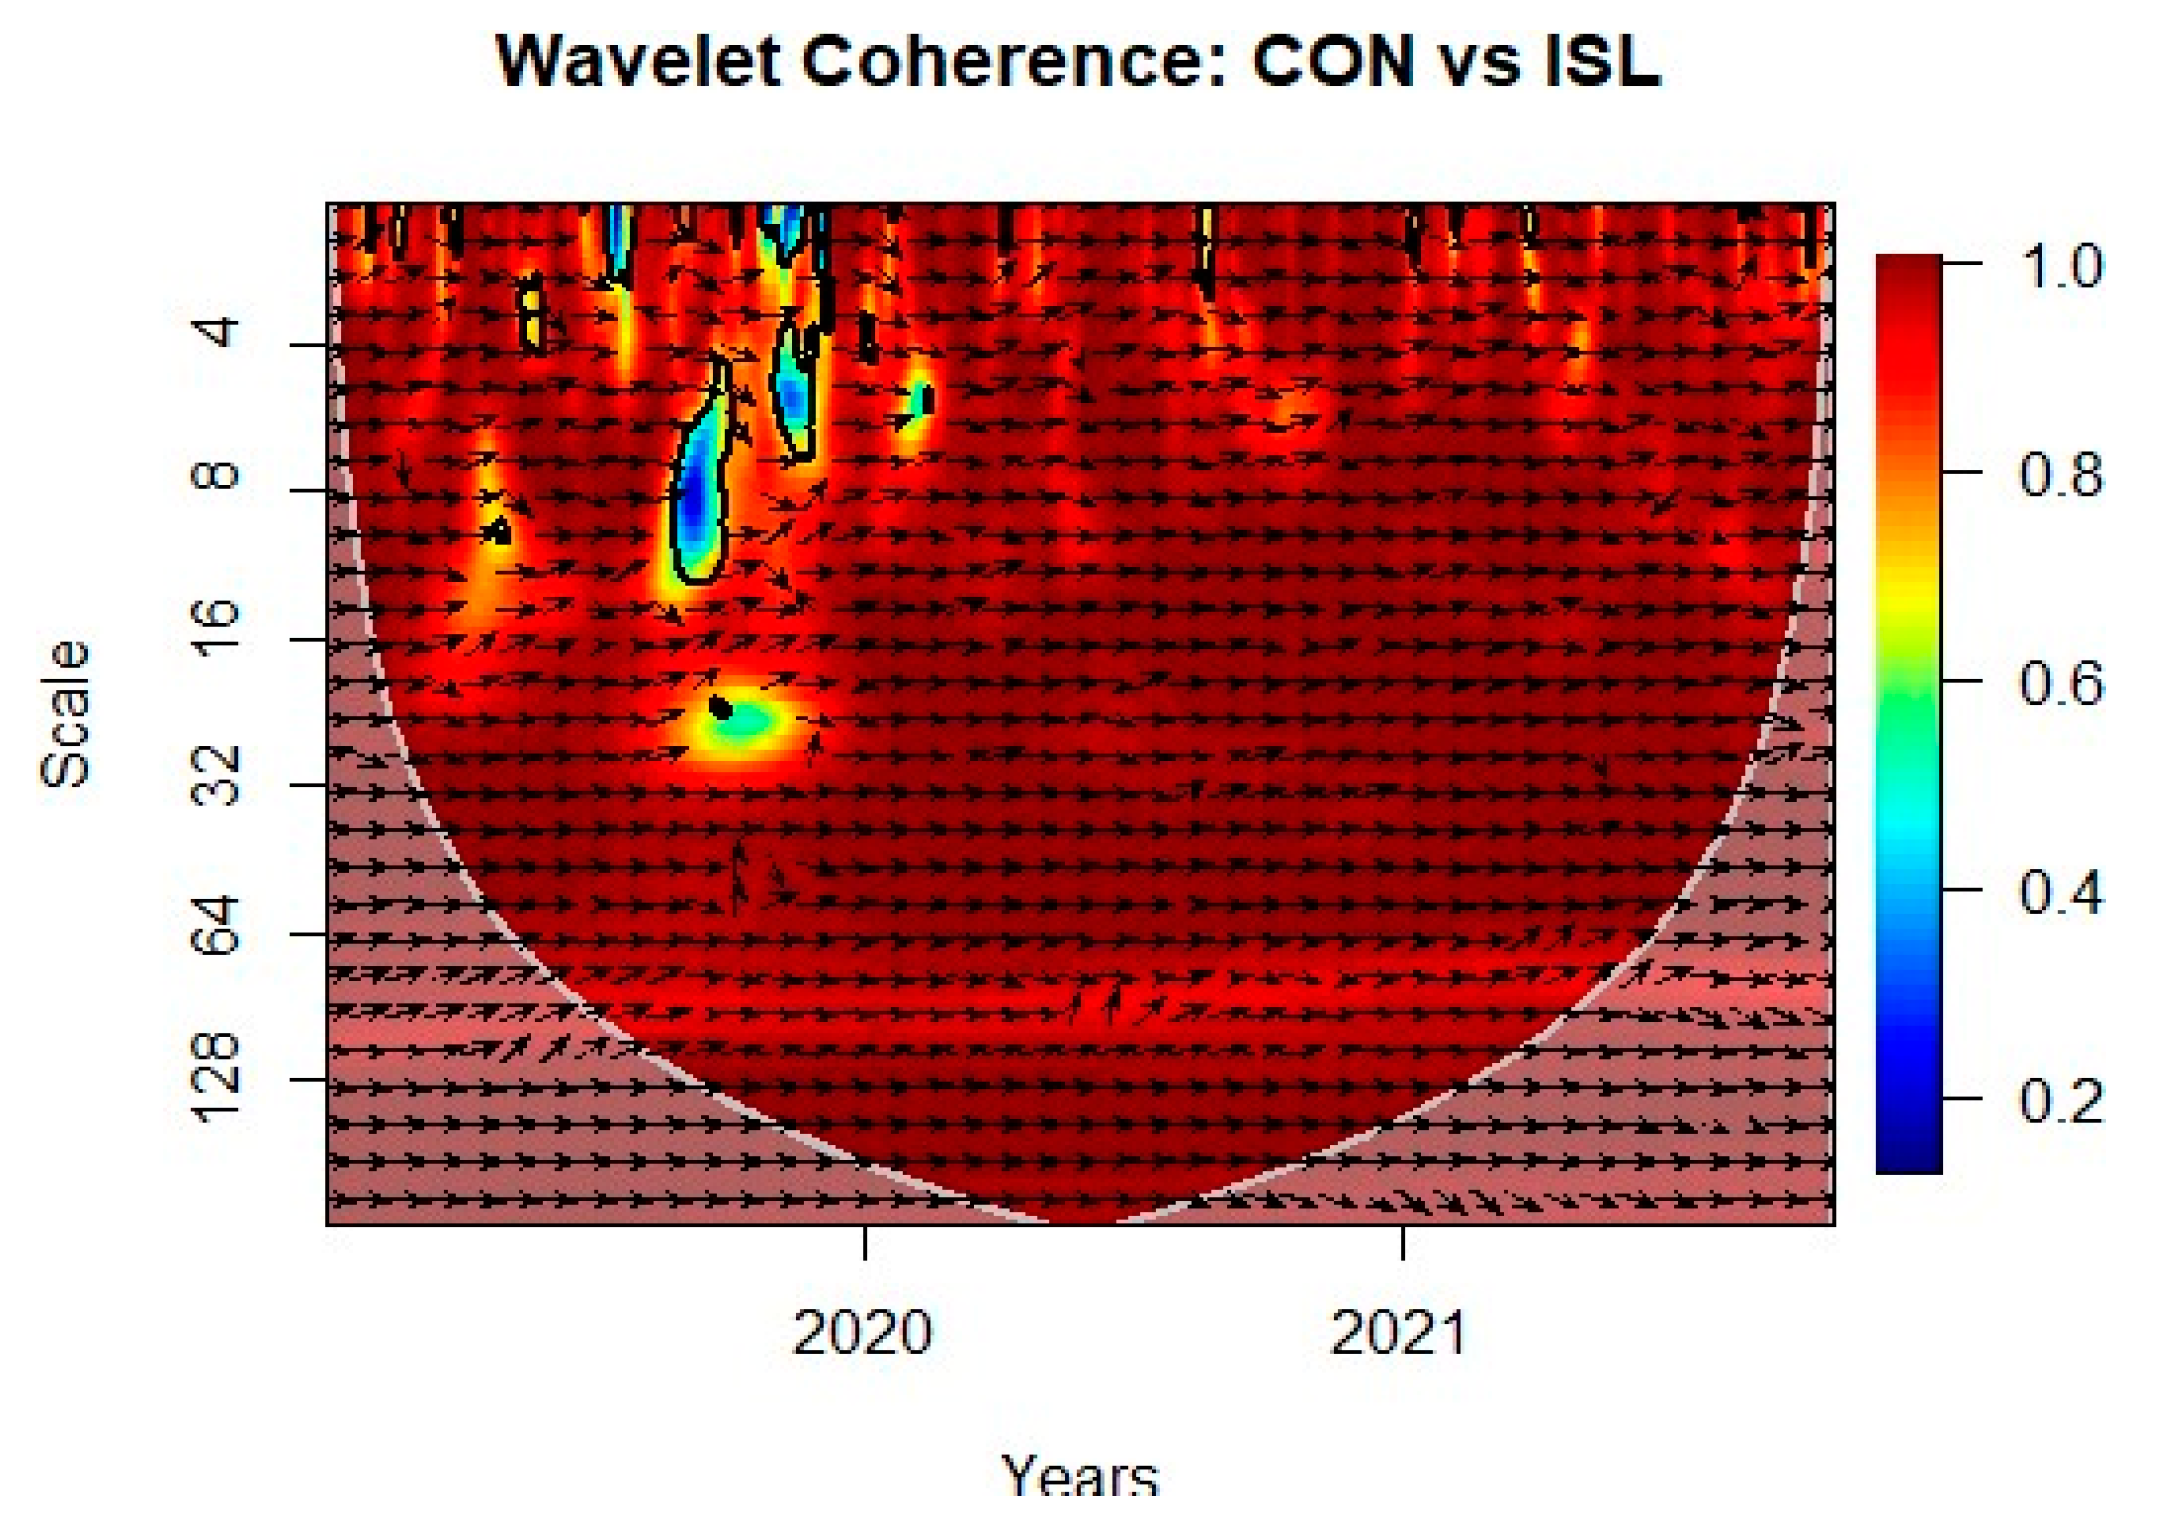
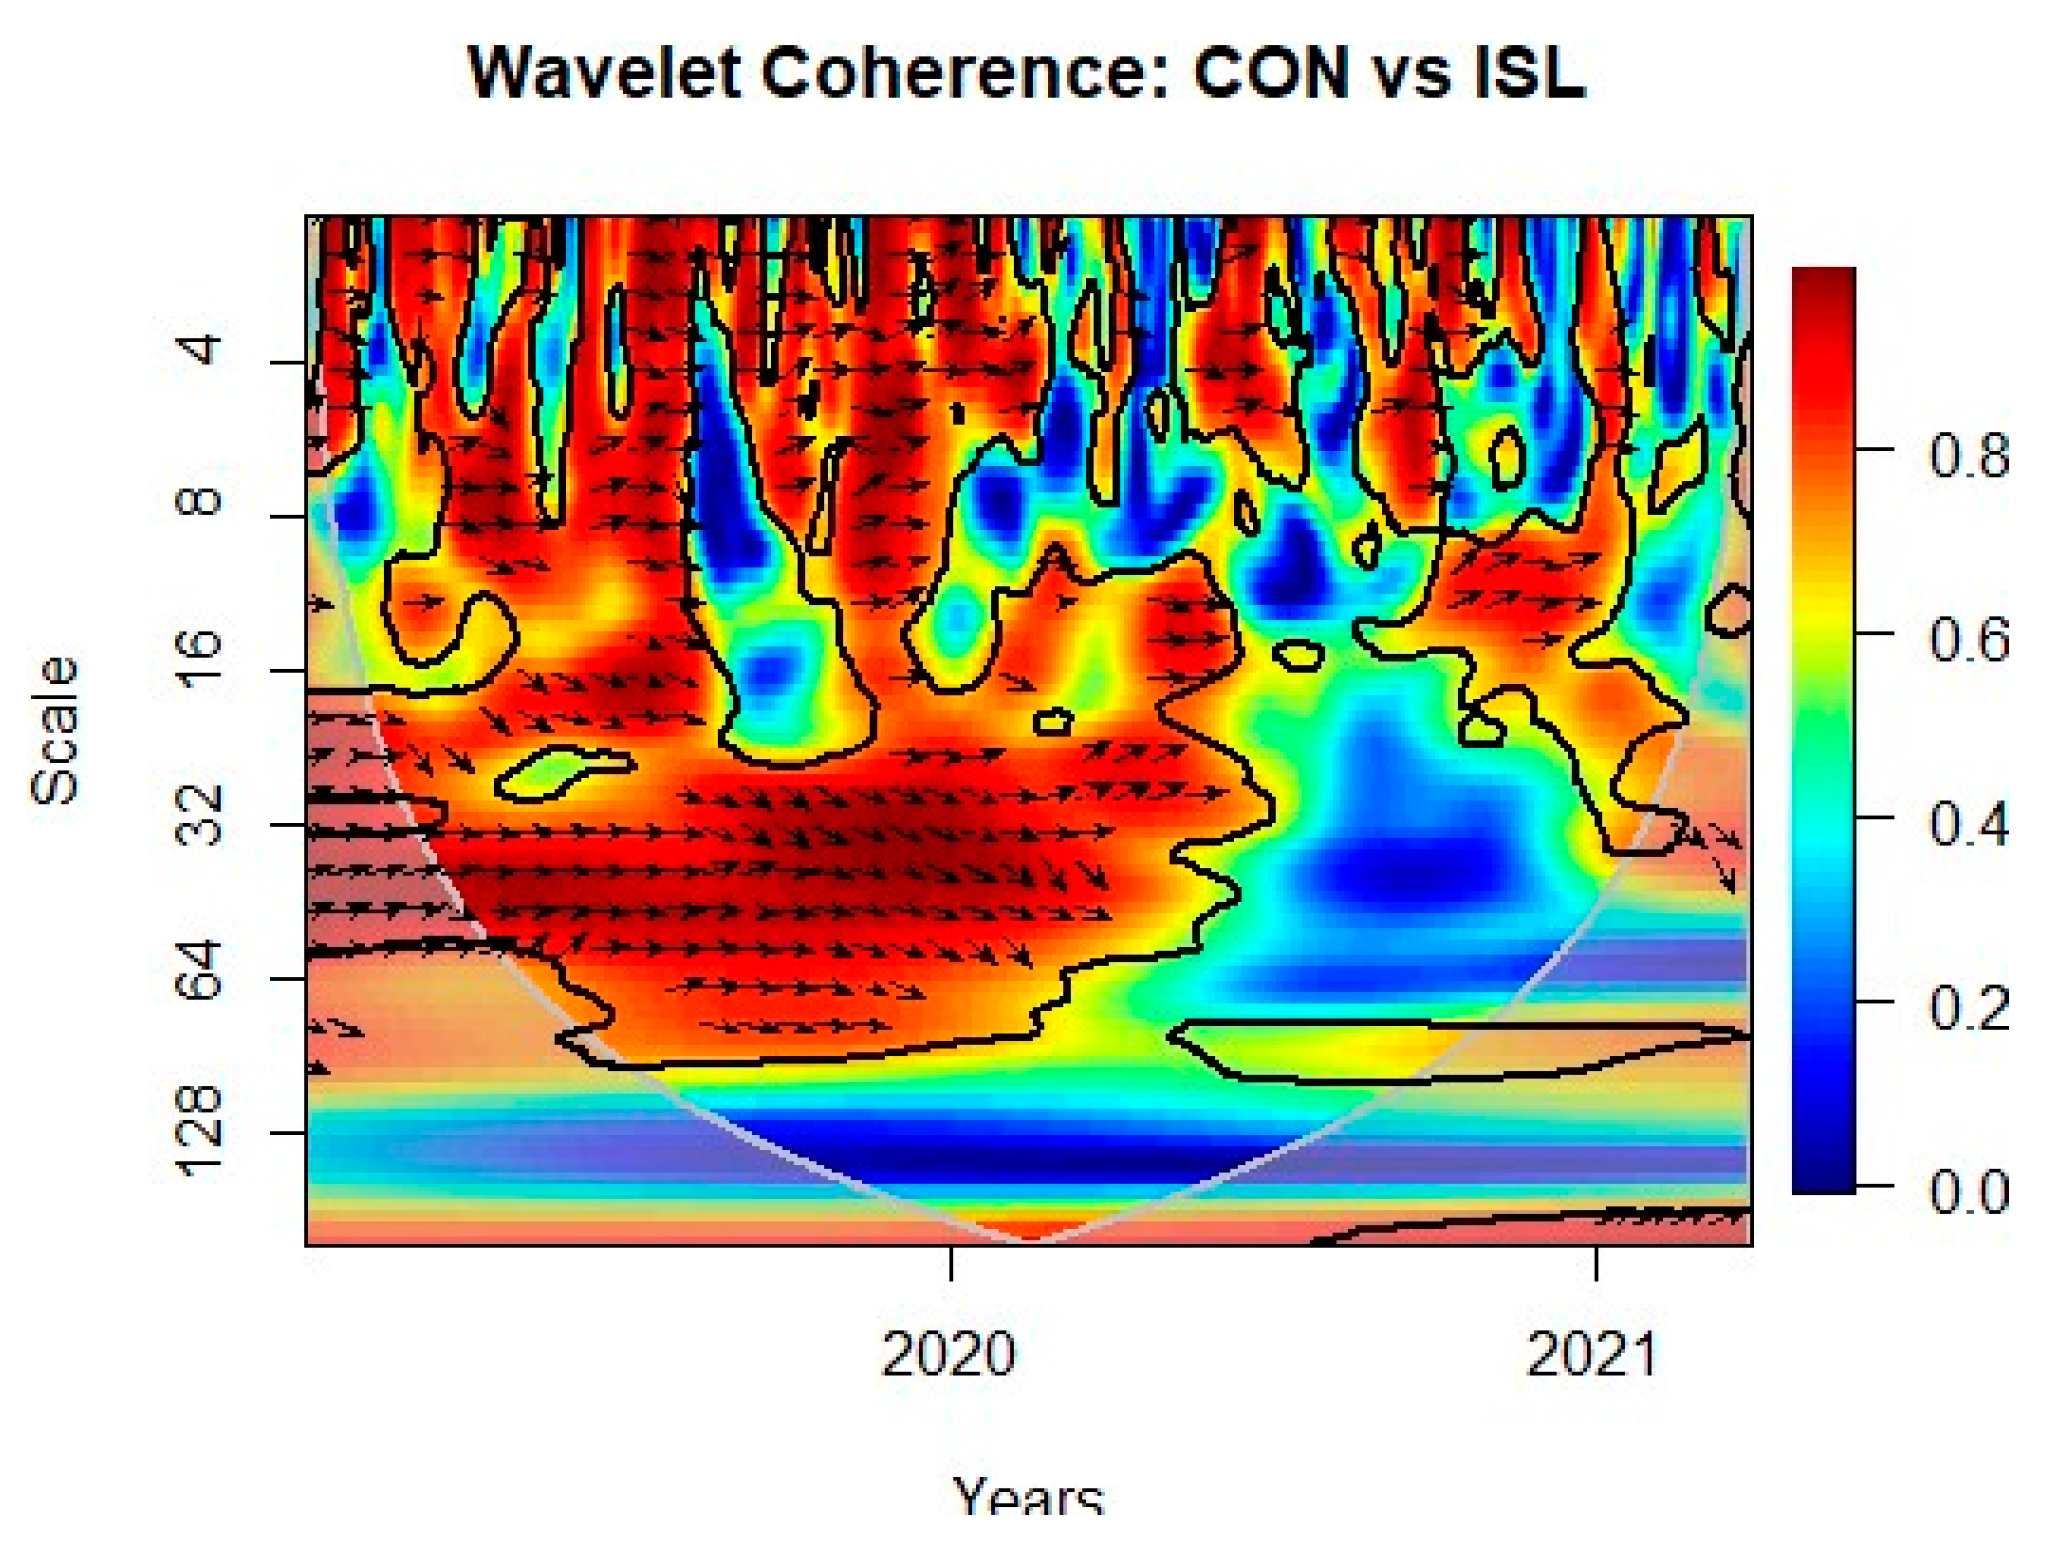
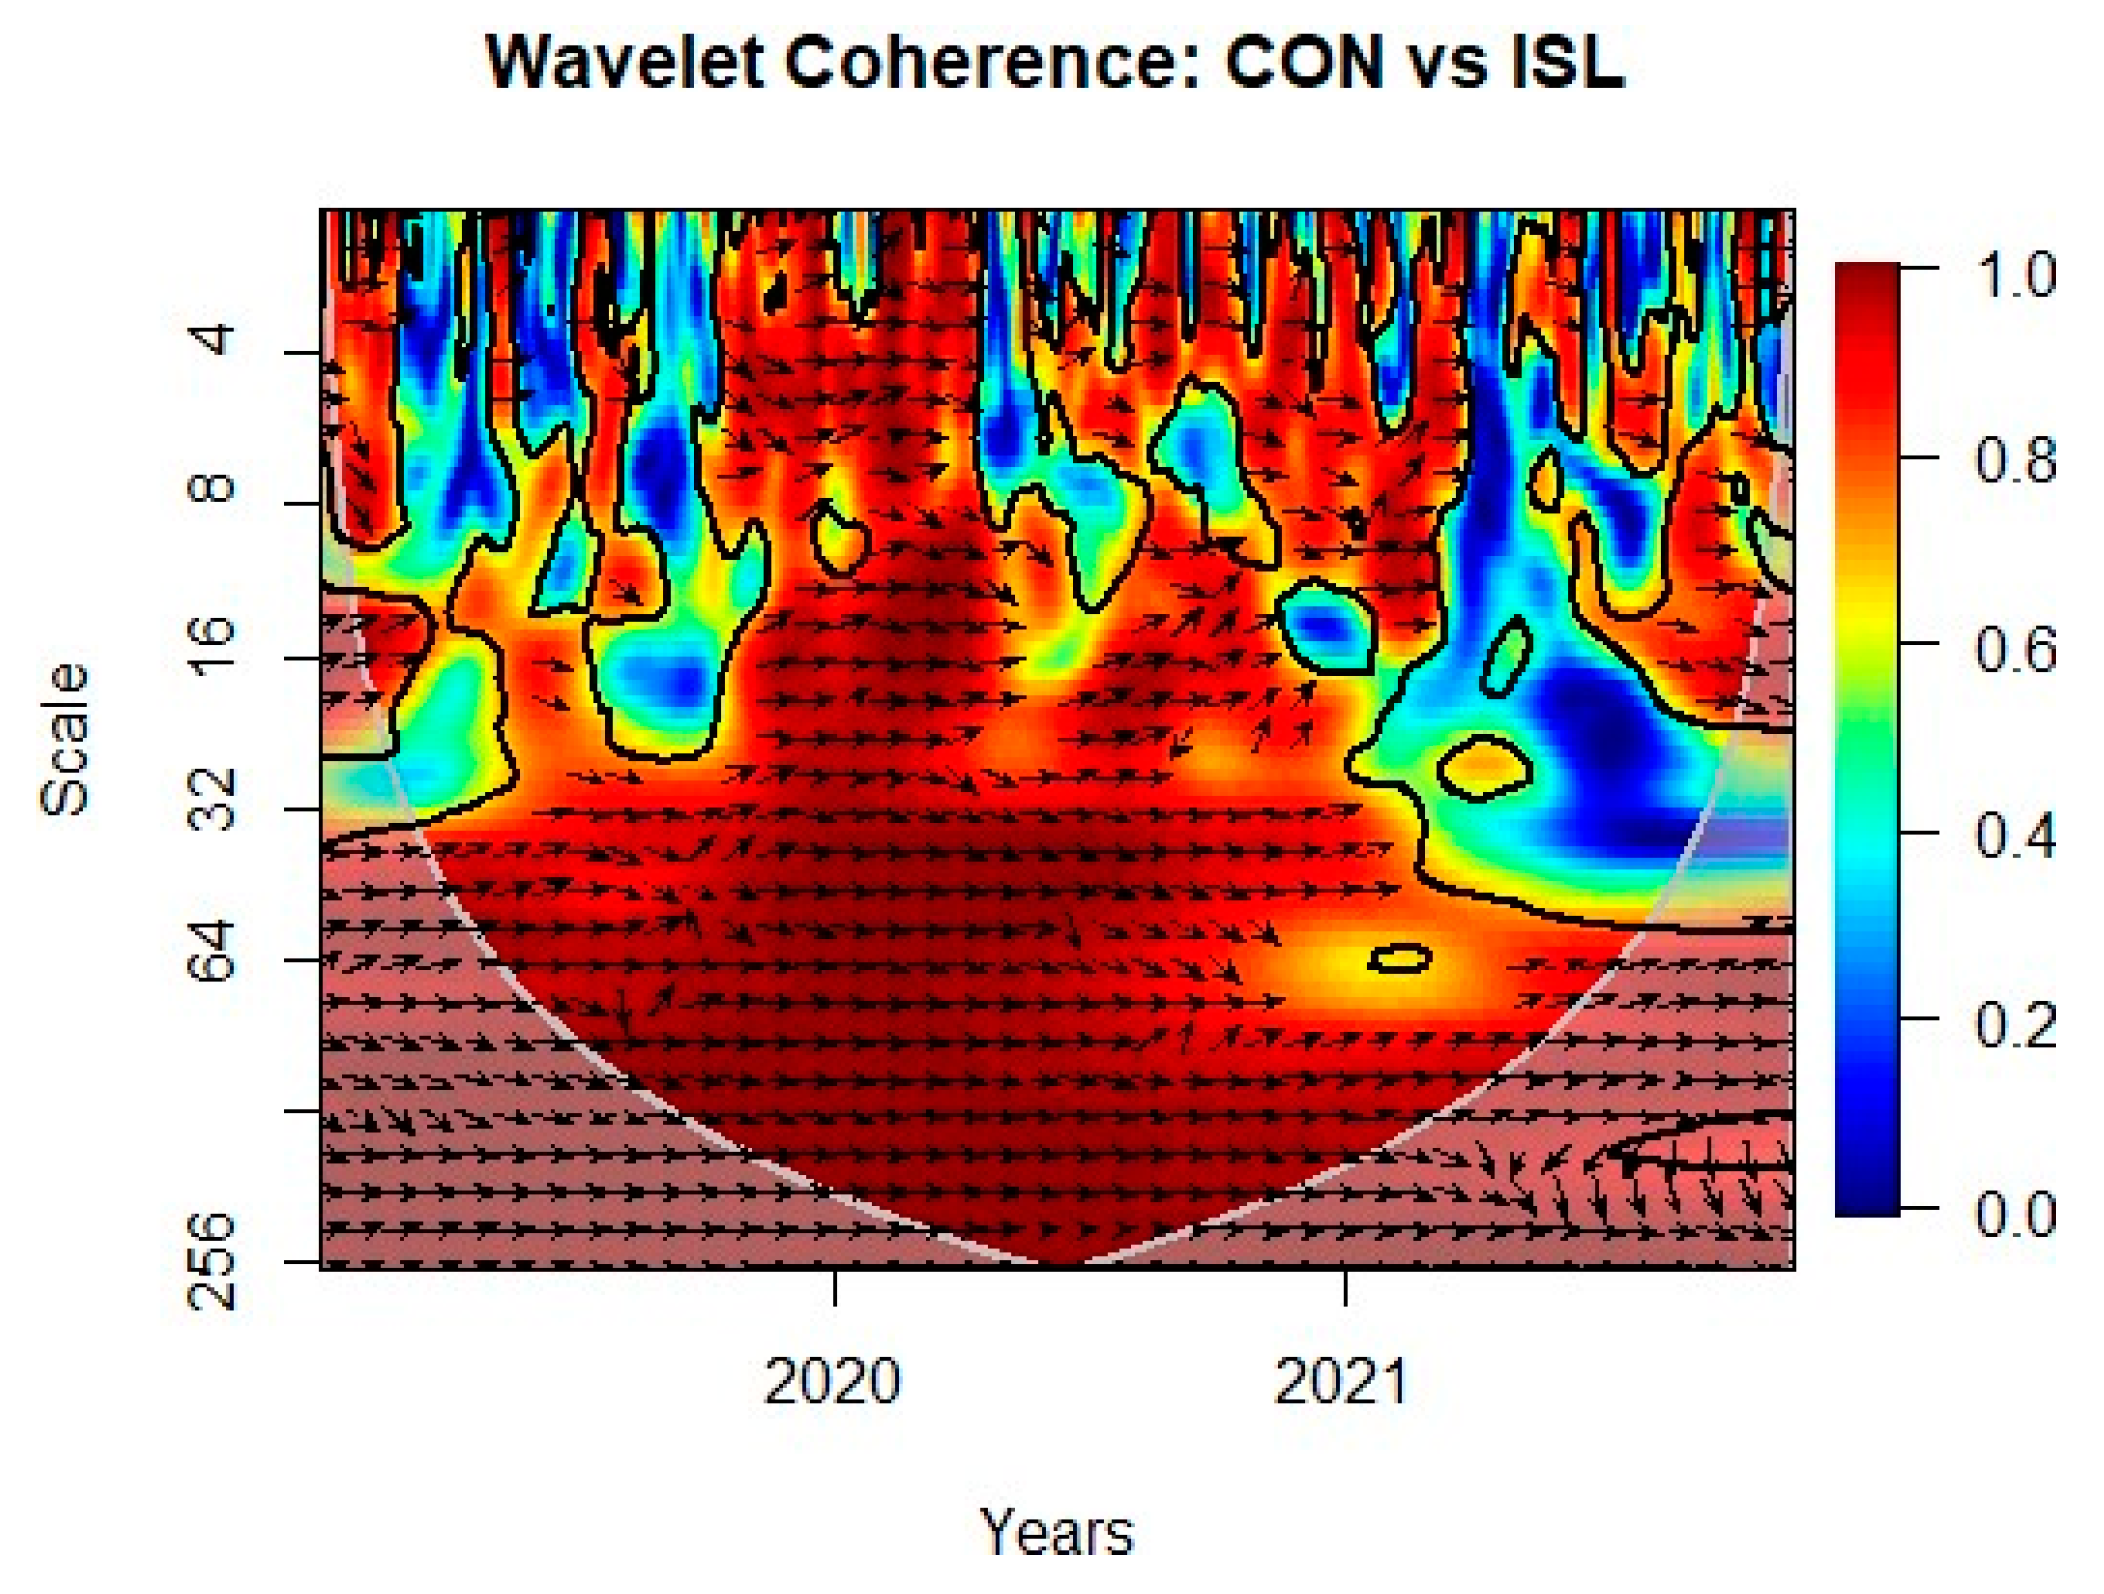
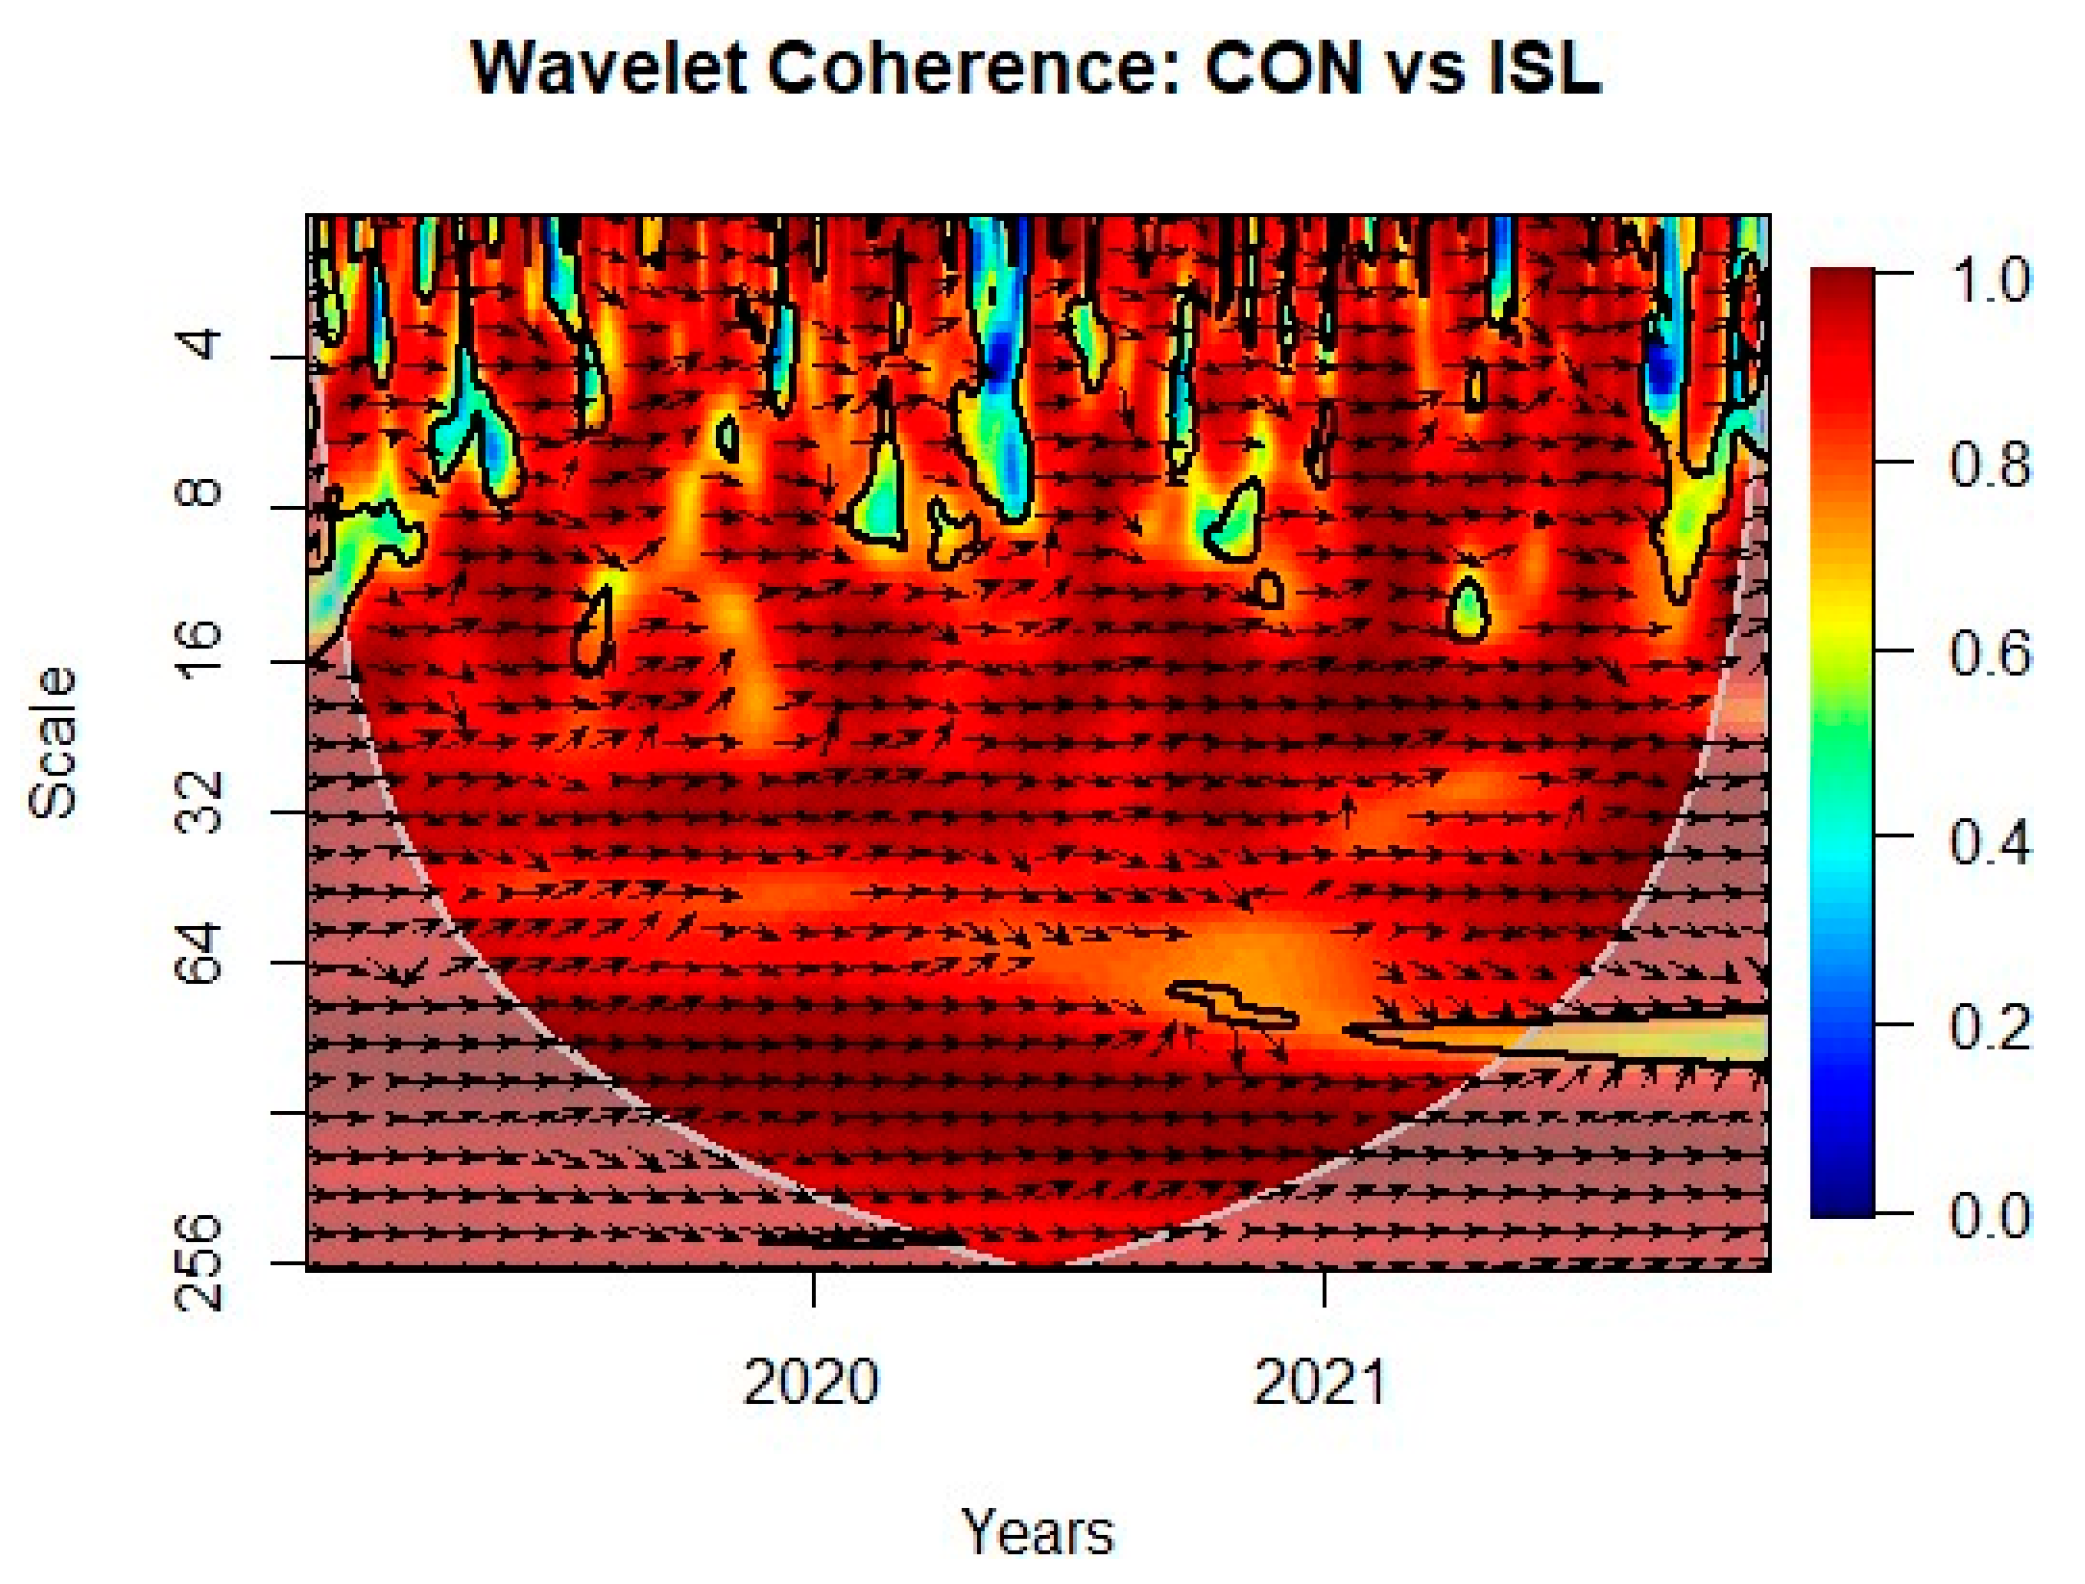
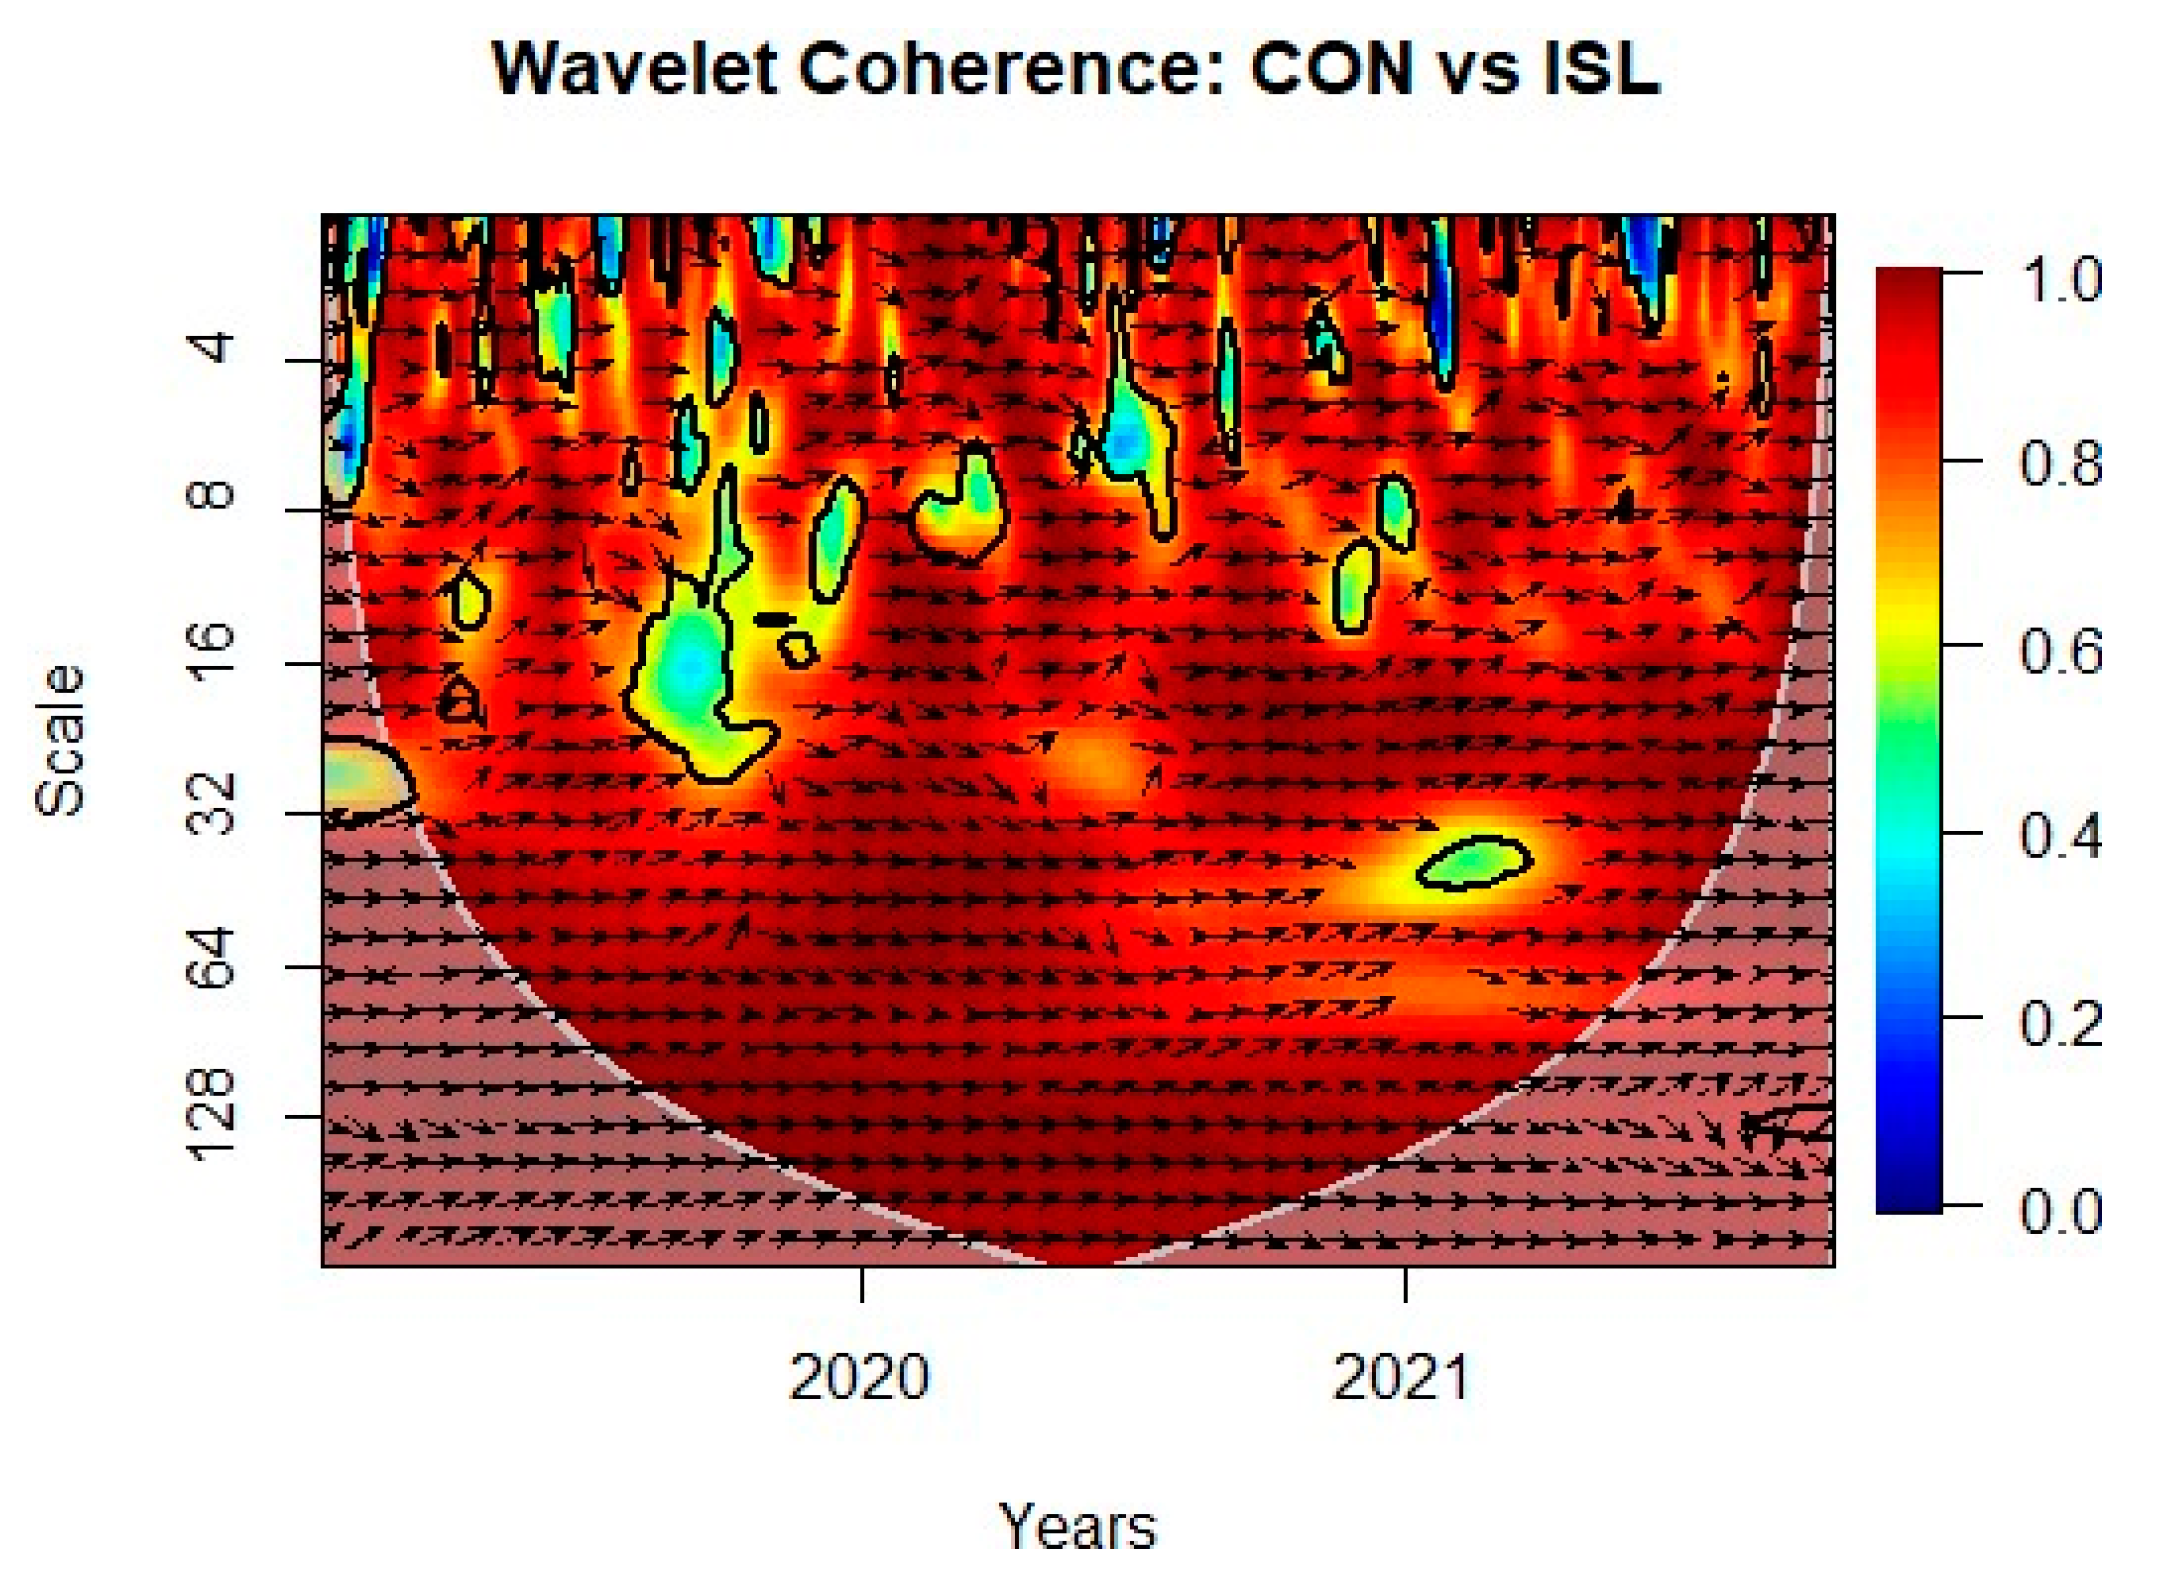
Table 1.
(Panel A): Developed countries and territories. (Panel B): Developed countries and territories.
Table 1.
(Panel A): Developed countries and territories. (Panel B): Developed countries and territories.
| Panel A | |||
| Country | Index Code | Index Name (Conventional) | Islamic Index |
| Australia | ASX | Australian Securities Exchange 200 Index | FTSE Australia Shariah Index |
| Canada | TSX | Toronto Stock Exchange 300 Composite Index | FTSE Canada Shariah Index |
| France | FCHI-CAC-40 | Euronext Paris | FTSE France Shariah Index |
| Germany | DAX-40 | Frankfurt Stock Exchange-Deutscher Aktien-Index | FTSE Germany Shariah Index |
| Hong Kong | H.S.I | Hong Kong Exchanges-Hang Seng Index | FTSE Hong Kong Shariah Index |
| Italy | FTSE-MIB-Index | Borsa Italiana (Milano Indice di Borsa) | FTSE Italy Shariah Index |
| Japan | Nikkei-225 | Tokyo Stock Exchange (TSE) Nikkei Index | FTSE Japan-100 Shariah Index |
| Korea | KOSPI-200 | Korea Stock Exchange-Korean Composite Index | FTSE Korea Shariah Index |
| Netherlands | AEX | The Amsterdam Stock Exchange | FTSE Netherlands Shariah Index |
| New Zealand | NZ50 | New Zealand Stock Market-S&P-50 Index | FTSE New Zealand Shariah Index |
| Singapore | STI-SGX | FTSE Straits Times Index-Singapore Exchange | FTSE SGX Shariah 100 Index |
| Spain | IBEX-35 | Spanish Exchange 35 Index (Bolsa de Madrid) | FTSE Spain Shariah Index |
| Sweden | OMX-30 | Stockholm Stock Exchange 30 Index | FTSE Sweden Shariah Index |
| Switzerland | SMI-SIX | The Swiss Exchange-SIX | FTSE Switzerland Shariah Index |
| UK | FTSE-100 | London Stock Echange-100 Index | FTSE UK Shariah Index |
| US Nasdaq | NASDAQ | NASDAQ 100 Index | FTSE USA Shariah Index |
| USsp500 | S&P | S&P 500 Index | - |
| Panel B | |||
| Country | Index Code | Index Name (Conventional) | Islamic Index |
| Brazil | IBrX-50 | São Paulo Stock Exchange 50 Index | FTSE Brazil Shariah Index |
| China (SE) | SSE | Shanghai SE Composite Index | FTSE China Shariah Index |
| China (SZ) | SZSC | Shenzhen SE Composite Index | - |
| Egypt | EGX30 | Egyptian Exchange 30 Index | S&P Egypt BMI Index |
| India | S&P BSE-100 | Bombay Stock Exchange-S&P 100 Index | FTSE India Shariah Index |
| Indonesia | IDX_KOMPAS100 | Jakarta Stock Exchange Composite Index | Jakarta SE Islamic Index (IDX-JII) |
| Malaysia | FTFBM-100 | FTSE Bursa 100 Index | FTSE Bursa Malaysia EMAS Shariah Index |
| Mexico | S&P/BMV-IPC | Bolsa Mexicana de Valores (MEXBOL) | FTSE Mexico Shariah Index |
| Pakistan | PSX KSE-100 | Pakistan Stock Exchange 100 Index | Pakistan Stock Exchange Meezan Index (KMI-30) |
| Qatar | QE | Qatar Stock Exchange General Index | S&P/IFCI Qatar Index |
| Russia | MOEX | Russia Composite Index (Russian: Индекс МосБиржи) | FTSE Russia Shariah Index |
| Saudi Arabia | TASI | Tadāwul All Share Index | S&P Saudi Arabia Shariah Index |
| South Africa | FTSE/JSE-40 | FTSE/Johannesburg Stock Exchange 40 Index | FTSE JSE Shariah All Share Index |
| Taiwan | TAIEX | Taiwan Stock Exchange Weighted Index | FTSE Taiwan Shariah Index |
| Thailand | SET-100 | Stock Exchange of Thailand 100 Index | FTSE Thailand Shariah Index |
| Turkey | BIST-100 | Borsa Istanbul Stock Exchange 100 Index | FTSE Turkey Shariah Index |
| UAE | DFMGI | Dubai Financial Market General Index | Dubai Financial Market Islamic Index (DFMSI) |
Table 2.
(Panel A): Descriptive statistics for developed countries and territories (2019). (Panel B): Descriptive statistics for developing countries and territories (2019). (Panel C): Descriptive statistics for developed countries and territories (2020). (Panel D): Descriptive statistics for developing countries and territories (2020). (Panel E): Descriptive statistics for developed countries and territories (2021). (Panel F): Descriptive statistics for developing countries and territories (2021).
| Panel A | |||||||||
| Conventional | Islamic | ||||||||
| 2019 | Mean | Std. Dev. | Skewness | Kurtosis | Mean | Std. Dev. | Skewness | Kurtosis | Obs. |
| AUSTRALIA | 0.078 | 0.778 | −0.199 | 3.810 | 0.098 | 0.842 | −0.173 | 3.277 | 253 |
| CANADA | 0.084 | 0.623 | −0.330 | 4.820 | 0.085 | 0.743 | −0.203 | 3.970 | 250 |
| FRANCE | 0.091 | 0.860 | −0.527 | 4.784 | 0.080 | 0.865 | −0.543 | 4.305 | 254 |
| GERMANY | 0.085 | 0.899 | −0.200 | 4.642 | 0.075 | 0.995 | −0.121 | 4.398 | 250 |
| HONG_KONG | 0.049 | 0.994 | −0.046 | 4.312 | 0.035 | 0.911 | −0.153 | 4.519 | 245 |
| ITALY | 0.094 | 0.966 | −0.306 | 3.853 | 0.092 | 0.915 | −0.346 | 3.942 | 251 |
| JAPAN | 0.064 | 0.814 | −0.074 | 3.440 | 0.064 | 0.721 | 0.335 | 4.465 | 239 |
| NETHERLANDS | 0.081 | 0.753 | −0.448 | 4.438 | 0.165 | 1.142 | −0.496 | 3.988 | 254 |
| NEW_ZEALAND | 0.113 | 0.711 | −0.130 | 3.429 | 0.121 | 0.926 | −0.330 | 4.206 | 250 |
| SINGAPORE | 0.024 | 0.621 | −0.446 | 5.245 | 0.055 | 0.771 | −0.121 | 3.778 | 249 |
| SOUTH_KOREA | 0.039 | 1.050 | −0.311 | 3.853 | 0.068 | 1.292 | −0.264 | 3.590 | 245 |
| SPAIN | 0.039 | 0.815 | −0.285 | 3.563 | 0.095 | 0.757 | −0.433 | 3.804 | 254 |
| SWEDEN | 0.078 | 1.006 | −0.417 | 3.868 | 0.109 | 1.208 | −0.256 | 3.896 | 249 |
| SWITZERLAND | 0.098 | 0.645 | −0.232 | 4.116 | 0.106 | 0.655 | −0.142 | 3.358 | 248 |
| UK | 0.065 | 0.827 | −0.024 | 4.879 | 0.056 | 0.874 | 0.027 | 4.946 | 252 |
| US_NASDAQ | 0.127 | 1.033 | −0.473 | 5.527 | 0.102 | 0.794 | −0.635 | 6.192 | 250 |
| US_S&P | 0.101 | 0.788 | −0.647 | 6.259 | |||||
| Panel B | |||||||||
| Conventional | Islamic | ||||||||
| 2019 | Mean | Std. Dev. | Skewness | Kurtosis | Mean | Std. Dev. | Skewness | Kurtosis | Obs. |
| BRAZIL | 0.073 | 1.696 | −0.635 | 4.393 | 0.067 | 1.841 | −1.678 | 13.089 | 247 |
| CHINA (SE) | 0.082 | 1.240 | −0.244 | 7.558 | 0.064 | 1.005 | −0.370 | 3.558 | 243 |
| CHINA (SZ) | 0.126 | 1.350 | −0.044 | 6.838 | |||||
| EGYPT | 0.086 | 1.226 | −0.966 | 9.701 | −0.058 | 1.850 | 0.096 | 10.185 | 195 |
| INDIA | 0.042 | 1.038 | 0.840 | 7.490 | 0.010 | 1.068 | 0.602 | 6.594 | 243 |
| INDONESIA | 0.028 | 1.088 | −0.016 | 3.282 | 0.008 | 1.007 | −0.099 | 3.044 | 244 |
| MALAYSIA | −0.015 | 0.556 | −0.040 | 3.422 | 0.022 | 0.554 | −0.013 | 3.204 | 243 |
| MEXICO | 0.025 | 1.139 | −0.207 | 3.870 | 0.052 | 1.255 | 0.116 | 3.524 | 250 |
| PAKISTAN | −0.016 | 1.346 | 0.041 | 3.747 | 0.017 | 1.479 | 0.069 | 3.306 | 246 |
| QATAR | 0.007 | 0.929 | −0.539 | 6.519 | −0.007 | 1.059 | −0.808 | 7.995 | 199 |
| RUSSIA | 0.140 | 0.958 | −0.247 | 4.137 | 0.121 | 1.036 | −0.255 | 4.355 | 251 |
| SAUDI_ARABIA | 0.029 | 0.895 | −0.389 | 3.707 | 0.034 | 0.890 | −0.447 | 4.168 | 249 |
| SOUTH_AFRICA | 0.059 | 1.244 | −0.034 | 3.312 | 0.056 | 0.823 | −0.173 | 2.645 | 248 |
| TAIWAN | 0.123 | 0.876 | −0.013 | 3.439 | 0.094 | 0.952 | −0.125 | 3.610 | 240 |
| THAILAND | 0.037 | 0.735 | 0.132 | 3.215 | 0.016 | 0.856 | 0.140 | 3.659 | 242 |
| TURKEY | 0.062 | 1.818 | −0.453 | 5.862 | 0.040 | 1.643 | 0.056 | 3.660 | 248 |
| UAE | 0.037 | 0.878 | 0.427 | 7.962 | 0.018 | 0.803 | −0.282 | 7.089 | 248 |
| Panel C | |||||||||
| Conventional | Islamic | ||||||||
| 2020 | Mean | Std. Dev. | Skewness | Kurtosis | Mean | Std. Dev. | Skewness | Kurtosis | Obs. |
| AUSTRALIA | 0.030 | 2.222 | −1.499 | 10.644 | 0.019 | 2.283 | −1.185 | 8.597 | 258 |
| CANADA | 0.016 | 2.445 | −1.401 | 16.554 | −0.004 | 2.184 | −1.651 | 15.716 | 252 |
| FRANCE | 0.005 | 2.133 | −1.048 | 11.331 | 0.018 | 2.056 | −1.444 | 14.880 | 257 |
| GERMANY | 0.051 | 2.171 | −0.804 | 11.903 | 0.044 | 2.090 | −1.384 | 12.340 | 254 |
| HONG_KONG | −0.012 | 1.480 | −0.407 | 5.036 | 0.008 | 1.497 | −0.724 | 6.060 | 248 |
| ITALY | 0.015 | 2.308 | −2.580 | 23.516 | 0.046 | 2.283 | −2.981 | 27.986 | 255 |
| JAPAN | 0.042 | 1.447 | −0.238 | 9.237 | 0.055 | 1.373 | 0.235 | 9.214 | 242 |
| NETHERLANDS | 0.046 | 1.842 | −1.039 | 12.385 | 0.131 | 2.118 | −0.723 | 8.485 | 257 |
| NEW_ZEALAND | 0.077 | 1.666 | −0.325 | 9.877 | 0.107 | 2.005 | 0.181 | 7.675 | 252 |
| SINGAPORE | −0.050 | 1.494 | −0.545 | 8.804 | −0.103 | 1.586 | −0.206 | 8.325 | 252 |
| SOUTH_KOREA | 0.138 | 2.146 | 0.001 | 8.008 | 0.177 | 2.341 | −0.110 | 7.217 | 248 |
| SPAIN | −0.032 | 2.206 | −1.382 | 14.122 | 0.028 | 2.125 | −1.875 | 17.250 | 257 |
| SWEDEN | 0.075 | 2.126 | −1.109 | 10.563 | 0.077 | 2.269 | −0.990 | 10.307 | 252 |
| SWITZERLAND | 0.041 | 1.511 | −1.372 | 14.504 | 0.044 | 1.404 | −1.619 | 14.147 | 252 |
| UK | −0.049 | 2.083 | −0.952 | 12.500 | −0.055 | 2.344 | −0.961 | 15.055 | 254 |
| US_NASDAQ | 0.154 | 2.306 | −0.807 | 9.523 | 0.068 | 2.189 | −0.923 | 11.573 | 253 |
| US_S&P | 0.060 | 2.185 | −0.866 | 11.507 | |||||
| Panel D | |||||||||
| Conventional | Islamic | ||||||||
| 2020 | Mean | Std. Dev. | Skewness | Kurtosis | Mean | Std. Dev. | Skewness | Kurtosis | Obs. |
| BRAZIL | −0.091 | 3.615 | −1.015 | 7.938 | 0.010 | 3.592 | −1.013 | 10.896 | 249 |
| CHINA (SE) | 0.080 | 1.422 | −1.100 | 11.667 | 0.076 | 1.648 | −0.555 | 6.576 | 243 |
| CHINA (SZ) | 0.126 | 1.551 | −1.059 | 9.624 | |||||
| EGYPT | −0.120 | 2.254 | −2.887 | 25.003 | −0.017 | 3.116 | −0.534 | 14.318 | 194 |
| INDIA | 0.049 | 2.254 | −1.653 | 14.533 | 0.085 | 2.082 | −1.489 | 15.528 | 250 |
| INDONESIA | −0.037 | 2.713 | −0.109 | 9.433 | −0.042 | 2.124 | 0.199 | 8.705 | 242 |
| MALAYSIA | 0.017 | 1.380 | −0.454 | 6.692 | 0.039 | 1.280 | −0.494 | 6.894 | 248 |
| MEXICO | −0.015 | 2.401 | −0.720 | 5.281 | 0.091 | 2.761 | −0.656 | 5.953 | 252 |
| PAKISTAN | 0.015 | 1.657 | −0.946 | 7.296 | 0.030 | 1.849 | −0.723 | 6.765 | 251 |
| QATAR | 0.001 | 1.461 | −3.487 | 32.130 | −0.021 | 1.567 | −3.510 | 32.927 | 200 |
| RUSSIA | −0.041 | 2.451 | −1.130 | 9.820 | −0.115 | 2.905 | −1.095 | 10.107 | 250 |
| SAUDI_ARABIA | 0.014 | 1.488 | −1.888 | 15.037 | 0.033 | 1.464 | −1.606 | 15.710 | 251 |
| SOUTH_AFRICA | 0.008 | 2.560 | −0.951 | 8.353 | 0.016 | 2.265 | −1.108 | 10.484 | 250 |
| TAIWAN | 0.126 | 1.545 | −0.283 | 7.515 | 0.148 | 1.636 | −0.591 | 7.112 | 245 |
| THAILAND | −0.063 | 2.305 | −1.255 | 12.013 | −0.004 | 2.376 | −1.288 | 12.647 | 244 |
| TURKEY | 0.013 | 2.188 | −0.485 | 7.729 | 0.039 | 1.959 | −0.408 | 6.922 | 252 |
| UAE | −0.042 | 1.794 | −0.966 | 9.765 | −0.016 | 1.908 | −0.635 | 10.933 | 250 |
| Panel E | |||||||||
| Conventional | Islamic | ||||||||
| 2021 | Mean | Std. Dev. | Skewness | Kurtosis | Mean | Std. Dev. | Skewness | Kurtosis | Obs. |
| AUSTRALIA | 0.030 | 0.998 | −0.468 | 4.091 | 0.010 | 1.114 | −0.676 | 4.169 | 257 |
| CANADA | 0.090 | 0.934 | −0.464 | 3.686 | 0.087 | 1.216 | −0.464 | 3.595 | 251 |
| FRANCE | 0.070 | 0.962 | −0.520 | 3.949 | 0.062 | 0.829 | −0.291 | 3.874 | 258 |
| GERMANY | 0.025 | 0.979 | −0.340 | 3.642 | 0.014 | 0.981 | −0.288 | 3.424 | 255 |
| HONG_KONG | −0.064 | 1.288 | −0.397 | 3.552 | 0.024 | 0.999 | −0.366 | 3.492 | 247 |
| ITALY | 0.049 | 1.041 | −0.457 | 3.601 | 0.047 | 1.061 | −0.404 | 3.436 | 256 |
| JAPAN | −0.004 | 1.041 | −0.237 | 3.293 | 0.006 | 1.031 | −0.406 | 3.726 | 245 |
| NETHERLANDS | 0.067 | 0.994 | −0.165 | 3.162 | 0.134 | 1.640 | −0.161 | 3.849 | 258 |
| NEW_ZEALAND | −0.022 | 0.962 | −0.141 | 3.046 | −0.045 | 1.165 | −0.018 | 3.752 | 251 |
| SINGAPORE | 0.037 | 0.723 | −0.013 | 4.414 | −0.003 | 0.774 | −0.128 | 3.901 | 253 |
| SOUTH_KOREA | −0.031 | 1.251 | 0.076 | 3.486 | −0.050 | 1.415 | 0.197 | 3.630 | 248 |
| SPAIN | 0.000 | 1.084 | −0.292 | 3.559 | −0.026 | 1.071 | −0.220 | 3.170 | 256 |
| SWEDEN | 0.063 | 1.209 | −0.362 | 3.464 | 0.059 | 1.238 | −0.369 | 3.096 | 253 |
| SWITZERLAND | 0.059 | 0.774 | −0.224 | 3.454 | 0.063 | 0.739 | −0.385 | 3.565 | 254 |
| UK | 0.049 | 0.943 | −0.485 | 4.927 | 0.052 | 1.032 | −0.351 | 4.388 | 253 |
| US_NASDAQ | 0.094 | 1.170 | −0.320 | 3.843 | 0.089 | 0.814 | −0.275 | 3.717 | 252 |
| US_S&P | 0.095 | 0.826 | −0.369 | 3.699 | |||||
| Panel F | |||||||||
| Conventional | Islamic | ||||||||
| 2021 | Mean | Std. Dev. | Skewness | Kurtosis | Mean | Std. Dev. | Skewness | Kurtosis | Obs. |
| BRAZIL | −0.079 | 2.071 | −0.485 | 3.577 | −0.079 | 1.982 | −0.510 | 4.819 | 248 |
| CHINA (SE) | 0.030 | 0.944 | −0.216 | 3.495 | −0.040 | 1.353 | −0.475 | 3.437 | 243 |
| CHINA (SZ) | −0.011 | 1.225 | −0.332 | 3.712 | |||||
| EGYPT | 0.051 | 1.044 | −0.308 | 3.891 | 0.055 | 1.689 | 0.205 | 3.303 | 194 |
| INDIA | 0.072 | 1.101 | −0.535 | 6.556 | 0.087 | 1.040 | −0.679 | 4.395 | 248 |
| INDONESIA | −0.008 | 1.177 | 0.290 | 3.517 | −0.046 | 1.116 | 0.335 | 4.260 | 247 |
| MALAYSIA | −0.030 | 0.749 | 0.122 | 3.392 | −0.029 | 0.674 | −0.050 | 3.270 | 245 |
| MEXICO | 0.063 | 1.268 | −0.512 | 4.298 | 0.053 | 1.467 | −0.278 | 3.386 | 253 |
| PAKISTAN | −0.031 | 1.028 | −0.451 | 6.048 | 0.003 | 1.099 | −0.277 | 6.056 | 247 |
| QATAR | 0.054 | 0.809 | −0.293 | 5.113 | 0.059 | 0.621 | −0.707 | 6.946 | 201 |
| RUSSIA | 0.054 | 1.350 | −0.731 | 4.557 | 0.087 | 1.508 | −0.360 | 3.638 | 254 |
| SAUDI_ARABIA | 0.104 | 0.740 | −1.000 | 10.607 | 0.116 | 0.790 | −0.738 | 8.631 | 250 |
| SOUTH_AFRICA | 0.050 | 1.471 | −0.447 | 3.368 | 0.083 | 1.448 | −0.063 | 3.074 | 250 |
| TAIWAN | 0.078 | 1.281 | 0.035 | 4.736 | 0.079 | 1.360 | 0.029 | 4.200 | 244 |
| THAILAND | −0.010 | 0.999 | −0.019 | 3.964 | −0.035 | 1.029 | 0.342 | 3.657 | 241 |
| TURKEY | −0.142 | 2.822 | −0.416 | 18.348 | −0.110 | 2.979 | 0.586 | 27.672 | 249 |
| UAE | 0.100 | 0.932 | −0.387 | 9.627 | −0.161 | 4.344 | −14.496 | 222.606 | 249 |
Table 3.
(Panel A): Mean difference (MDF) and standard deviation difference (SDF) for developed countries and territories. (Panel B): Mean difference (MDF) and standard deviation difference (SDF) for developing countries and territories.
Table 3.
(Panel A): Mean difference (MDF) and standard deviation difference (SDF) for developed countries and territories. (Panel B): Mean difference (MDF) and standard deviation difference (SDF) for developing countries and territories.
| Panel A | ||||||||
| Country | MDF | SDF | MDF | SDF | MDF | SDF | MDF | SDF |
| 2019–2021 | 2019–2021 | 2019 | 2019 | 2020 | 2020 | 2021 | 2021 | |
| Australia | 0.004 | −0.070 | −0.004 | −0.068 | 0.011 | −0.061 | 0.020 | −0.116 |
| Canada | 0.007 | 0.048 | 0.078 | −0.119 | 0.020 | 0.261 | 0.003 | −0.282 |
| France | 0.002 | 0.066 | 0.003 | −0.004 | −0.013 | 0.077 | 0.009 | 0.133 |
| Germany | 0.009 | 0.018 | 0.020 | −0.095 | 0.006 | 0.081 | 0.011 | −0.002 |
| Hong Kong | −0.031 | 0.106 | 0.000 | 0.084 | −0.020 | −0.017 | −0.087 | 0.290 |
| Italy | −0.009 | 0.018 | 0.020 | 0.051 | −0.031 | 0.025 | 0.002 | −0.020 |
| Japan | −0.008 | 0.056 | 0.036 | 0.101 | −0.013 | 0.074 | −0.010 | 0.010 |
| Netherlands | −0.079 | −0.397 | −0.013 | −0.373 | −0.085 | −0.276 | −0.067 | −0.647 |
| New Zealand | −0.005 | −0.258 | 0.070 | −0.210 | −0.029 | −0.339 | 0.023 | −0.202 |
| Singapore | 0.021 | −0.089 | −0.012 | −0.151 | 0.053 | −0.092 | 0.040 | −0.051 |
| South Korea | −0.016 | −0.191 | 0.004 | −0.237 | −0.038 | −0.196 | 0.019 | −0.164 |
| Spain | −0.030 | 0.053 | −0.022 | 0.060 | −0.060 | 0.082 | 0.026 | 0.014 |
| Sweden | −0.010 | −0.120 | −0.005 | −0.195 | −0.003 | −0.143 | 0.004 | −0.029 |
| Switzerland | −0.005 | 0.058 | −0.018 | −0.008 | −0.003 | 0.107 | −0.005 | 0.035 |
| UK | 0.004 | −0.158 | −0.022 | −0.046 | 0.006 | −0.261 | −0.003 | −0.088 |
| US S&P | −0.001 | −0.001 | −0.015 | −0.007 | −0.008 | −0.004 | 0.006 | 0.012 |
| NASDAQ | 0.039 | 1.608 | 0.014 | 1.011 | 0.086 | 2.306 | 0.005 | 1.170 |
| Panel B | ||||||||
| Country | MDF | SDF | MDF | SDF | MDF | SDF | MDF | SDF |
| 2019–2021 | 2019–2021 | 2019 | 2019 | 2020 | 2020 | 2021 | 2021 | |
| Brazil | −0.032 | 0.001 | −0.009 | −0.148 | −0.102 | 0.023 | −0.001 | 0.089 |
| China (SE) | 0.030 | −0.143 | 0.030 | 0.237 | 0.004 | −0.226 | 0.070 | −0.408 |
| China (SZ) | 0.080 | 1.381 | 0.098 | 1.352 | 0.126 | 1.551 | −0.011 | 1.225 |
| Egypt | 0.012 | −0.706 | −0.017 | −0.626 | −0.103 | −0.863 | −0.004 | −0.645 |
| India | −0.007 | 0.089 | 0.013 | −0.030 | −0.036 | 0.172 | −0.015 | 0.061 |
| Indonesia | 0.021 | 0.315 | −0.036 | 0.084 | 0.005 | 0.589 | 0.039 | 0.062 |
| Malaysia | −0.020 | 0.067 | −0.023 | 0.002 | −0.022 | 0.100 | −0.001 | 0.075 |
| Mexico | −0.041 | −0.245 | −0.028 | −0.118 | −0.106 | −0.360 | 0.010 | −0.200 |
| Pakistan | −0.027 | −0.139 | 0.002 | −0.133 | −0.015 | −0.192 | −0.034 | −0.072 |
| Qatar | 0.010 | −0.046 | −0.071 | −0.131 | 0.022 | −0.106 | −0.006 | 0.187 |
| Russia | 0.019 | −0.275 | 0.050 | −0.078 | 0.074 | −0.454 | −0.034 | −0.158 |
| Saudi Arabia | −0.012 | 0.000 | 0.001 | 0.005 | −0.019 | 0.024 | −0.012 | −0.051 |
| South Africa | −0.012 | 0.226 | 0.003 | 0.419 | −0.008 | 0.296 | −0.033 | 0.023 |
| Taiwan | 0.002 | −0.081 | 0.045 | −0.076 | −0.022 | −0.090 | −0.001 | −0.080 |
| Thailand | −0.005 | −0.063 | −0.019 | −0.121 | −0.059 | −0.071 | 0.026 | −0.030 |
| Turkey | −0.012 | 0.048 | 0.019 | 0.174 | −0.026 | 0.228 | −0.032 | −0.158 |
| UAE | 0.085 | −1.503 | −0.015 | 0.076 | −0.026 | −0.114 | 0.261 | −3.412 |
Table 4.
(Panel A): Performance index ratio differences for developed and developing countries and territories (2019). (Panel B): Performance index ratio differences for developed and developing countries and territories (2020).
Table 4.
(Panel A): Performance index ratio differences for developed and developing countries and territories (2019). (Panel B): Performance index ratio differences for developed and developing countries and territories (2020).
| Panel A | |||||||||
| 2019 | 2019 | ||||||||
| Country | Sharp | Alpha | Omega | Treynor | Country | Sharp | Alpha | Omega | TR |
| Australia | −0.024 | −0.068 | −0.045 | −0.004 | Brazil | −0.101 | −0.148 | 0.009 | −0.009 |
| Canada | 0.080 | −0.119 | 0.086 | 0.078 | China SE | 0.178 | 0.137 | 0.024 | 0.030 |
| France | 0.011 | −0.004 | 0.053 | 0.003 | China SZ | 0.223 | 0.247 | 0.123 | 0.023 |
| Germany | 0.061 | −0.095 | 0.062 | 0.020 | Egypt | −0.748 | −0.626 | 0.312 | −0.017 |
| Hong Kong | 0.012 | 0.084 | 0.038 | 0.000 | India | −0.037 | −0.030 | 0.091 | 0.013 |
| Italy | 0.032 | 0.051 | −0.007 | 0.020 | Indonesia | 0.110 | 0.084 | 0.047 | −0.036 |
| Japan | 0.040 | 0.101 | −0.046 | 0.036 | Malaysia | −0.032 | 0.002 | −0.177 | −0.023 |
| Netherlands | 0.130 | −0.373 | −0.138 | −0.013 | Mexico | −0.176 | −0.118 | −0.055 | −0.028 |
| New Zealand | −0.011 | −0.210 | 0.110 | 0.070 | Pakistan | −0.157 | −0.133 | −0.060 | 0.002 |
| Singapore | −0.137 | −0.151 | −0.098 | −0.012 | Qatar | −0.188 | −0.131 | 0.042 | −0.071 |
| South Korea | −0.085 | −0.237 | −0.046 | 0.004 | Russia | −0.098 | −0.078 | 0.105 | 0.050 |
| Spain | −0.108 | 0.060 | −0.257 | −0.022 | Saudi Arabia | 0.003 | 0.005 | −0.018 | 0.001 |
| Sweden | 0.447 | −0.195 | −0.044 | −0.005 | South Africa | 0.872 | 0.419 | −0.047 | 0.003 |
| Switzerland | −0.018 | −0.008 | −0.027 | −0.018 | Taiwan | 0.120 | −0.076 | 0.145 | 0.045 |
| UK | 0.011 | −0.046 | 0.050 | −0.022 | Thailand | −0.113 | −0.121 | 0.087 | −0.019 |
| US S&P | −0.022 | −0.007 | 0.002 | −0.015 | Turkey | 0.165 | 0.174 | 0.032 | 0.019 |
| NASDAQ | 0.076 | 0.232 | −0.031 | 0.014 | UAE | 0.022 | 0.076 | 0.066 | −0.015 |
| Panel B | |||||||||
| 2020 | 2020 | ||||||||
| Country | Sharp | Alpha | Omega | Treynor | Country | Sharp | Alpha | Omega | Treynor |
| Australia | 0.002 | −0.061 | 0.017 | 0.011 | Brazil | −0.024 | 0.023 | −0.079 | −0.102 |
| Canada | 0.017 | 0.261 | 0.029 | 0.020 | China SE | −0.075 | −0.326 | 0.039 | 0.004 |
| France | −0.028 | 0.077 | −0.021 | −0.013 | China SZ | 0.001 | −0.197 | 0.118 | 0.050 |
| Germany | −0.003 | 0.081 | 0.009 | 0.006 | Egypt | −0.380 | −0.863 | −0.156 | −0.103 |
| Hong Kong | −0.015 | −0.017 | −0.038 | −0.020 | India | 0.049 | 0.172 | −0.071 | −0.036 |
| Italy | −0.013 | 0.025 | −0.047 | −0.031 | Indonesia | 0.201 | 0.589 | 0.016 | 0.005 |
| Japan | −0.012 | 0.074 | −0.038 | −0.013 | Malaysia | 0.047 | 0.100 | −0.053 | −0.022 |
| Netherlands | −0.024 | −0.276 | −0.112 | −0.085 | Mexico | −0.143 | −0.360 | −0.111 | −0.106 |
| New Zealand | −0.046 | −0.339 | −0.010 | −0.029 | Pakistan | −0.157 | −0.192 | −0.021 | −0.015 |
| Singapore | 0.015 | −0.092 | 0.079 | 0.053 | Qatar | −0.028 | −0.106 | 0.046 | 0.022 |
| South Korea | −0.033 | −0.196 | −0.035 | −0.038 | Russia | −0.101 | −0.454 | 0.064 | 0.074 |
| Spain | −0.041 | 0.082 | −0.084 | −0.060 | Saudi Arabia | −0.010 | 0.024 | −0.048 | −0.019 |
| Sweden | 0.081 | −0.143 | 0.004 | −0.003 | South Africa | 0.107 | 0.296 | −0.012 | −0.008 |
| Switzerland | −0.025 | 0.107 | −0.012 | −0.003 | Taiwan | 0.015 | −0.090 | −0.029 | −0.022 |
| UK | 0.027 | −0.261 | 0.001 | 0.006 | Thailand | −0.032 | −0.071 | −0.078 | −0.059 |
| US S&P | −0.004 | −0.004 | −0.013 | −0.008 | Turkey | 0.128 | 0.228 | −0.040 | −0.026 |
| NASDAQ | 0.044 | 0.117 | 0.117 | 0.086 | UAE | −0.028 | −0.114 | −0.038 | −0.026 |
Disclaimer/Publisher’s Note: The statements, opinions and data contained in all publications are solely those of the individual author(s) and contributor(s) and not of MDPI and/or the editor(s). MDPI and/or the editor(s) disclaim responsibility for any injury to people or property resulting from any ideas, methods, instructions or products referred to in the content. |
© 2023 by the authors. Licensee MDPI, Basel, Switzerland. This article is an open access article distributed under the terms and conditions of the Creative Commons Attribution (CC BY) license (https://creativecommons.org/licenses/by/4.0/).
Share and Cite
MDPI and ACS Style
Alamgir, M.; Cheng, M.-C. Co-Movement and Performance Comparison of Conventional and Islamic Stock Indices during the Pre- and Post-COVID-19 Pandemic Era. Risks 2023, 11, 146. https://doi.org/10.3390/risks11080146
AMA Style
Alamgir M, Cheng M-C. Co-Movement and Performance Comparison of Conventional and Islamic Stock Indices during the Pre- and Post-COVID-19 Pandemic Era. Risks. 2023; 11(8):146. https://doi.org/10.3390/risks11080146
Chicago/Turabian StyleAlamgir, Muhammad, and Ming-Chang Cheng. 2023. "Co-Movement and Performance Comparison of Conventional and Islamic Stock Indices during the Pre- and Post-COVID-19 Pandemic Era" Risks 11, no. 8: 146. https://doi.org/10.3390/risks11080146
Note that from the first issue of 2016, this journal uses article numbers instead of page numbers. See further details here.