
Corporate Social Responsibility in Terms of Sustainable Development: Financial Risk Management Implications

1
Department of Civil and International Private Law, Volgograd State University, 400062 Volgograd, Russia
2
Department of Civil Law and Procedure, International Law Institute (Volzhsky Branch), 404106 Volzhsky, Russia
3
Department of the Theory of Management and Business Technologies, Plekhanov Russian University of Economics, 115093 Moscow, Russia
4
Institute of Economics and Management, Vyatka State University, 610000 Kirov, Russia
*
Author to whom correspondence should be addressed.
Risks 2022, 10(11), 206; https://doi.org/10.3390/risks10110206
Submission received: 1 September 2022
/
Revised: 21 October 2022
/
Accepted: 26 October 2022
/
Published: 31 October 2022
(This article belongs to the Special Issue Managing Financial Risks Based on Corporate Social Responsibility for Sustainable Development)
Abstract
:The motivation for this study was a new context associated with the increased cyclical nature of the economy and, accordingly, the increased financial risks of the business, which complicated the implementation of corporate social responsibility. The purpose of the article is to explore the relationship of corporate social responsibility with the financial risks of the business and explain this relationship in terms of sustainable development (SDGs). The article contributes to the development of the concept of financial risks of the business by clarifying their connection with corporate social responsibility and substantiating the relationship between the financial risks of the business. Structural equation modeling (SEM) showed that in 2020–2021, financial risks have demonstrated a complex (in most cases negative) relationship with each other and a contradictory impact on corporate social responsibility. The complex systemic relationship between corporate social responsibility and financial risks of business from the point of view of sustainable development is substantiated. In the context of increased financial risks, by systematically implementing SDGs 8, 9, 11, and 12, responsible companies get the opportunity to restore and improve their position in the market. The significance of the findings for businesses is that they proposed the SDGs as a promising new benchmark for business financial risk management. This will allow responsible companies to find a new Pareto optimum in the current conditions of uncertainty and determine for themselves the preferred level of corporate social responsibility that contributes to the effective financial risks of business management in the long term.
1. Introduction
Corporate social responsibility fundamentally distinguishes the modern model of capitalism from the previous one since it puts public well-being above private. Corporate social responsibility is a strategy of management according to which companies voluntarily take into account the social interests and environmental aspects or relations with different groups of stakeholders, in particular employees, in their activities.
The COVID-19 pandemic and crisis are vivid examples of this. In 2020–2021, companies around the world manifested particularly high corporate social responsibility, creating an unprecedentedly high level of sanitation at workplaces and points of sale and transferring employees to remote work. The value of corporate social responsibility lies in the fact that it does not distort or disrupt the operation of the market mechanism but, on the contrary, supports it. Corporate social responsibility has become a new form of non-price competition that supports the “healthy” competition of companies in the market and stimulates them to increase efficiency.
The problem is that the increased cyclicality of the world economic system has formed a new market context to which it is necessary to adapt the practice of the considered liability. Corporate social responsibility is a balance between the commercial interests of business—profit maximization and the non-commercial interests of the social environment in which business is conducted—the creation and preservation of jobs (in particular, knowledge-intensive and high-performance ones) and opportunities for career growth, improvement of working conditions and its remuneration, environmental protection, etc.
From an economic point of view, the described balance is a Pareto optimum, a decrease in the level of corporate social responsibility in relation to which it increases social tension and reduces loyalty to the business, and an increase in this responsibility threatens business with losses. That is, a change in the level of corporate social responsibility may lead to the impossibility of continuing to conduct business, either for commercial or non-commercial reasons, which dictates the urgent need to maintain the established Pareto optimum.
This optimum is especially important amid a crisis when many companies lose interest in corporate social responsibility, desiring only to receive profit. The society also influences the functioning of companies, demonstrating lower readiness to pay the price premium for responsibility and the desire to reduce prices for products.
Amid a crisis, truly responsible companies contrast with companies with changing responsibility—the former preserve responsibility even amid a crisis while the latter avoid it in the crisis conditions. That is why it is especially important to study the experience of truly responsible companies (leaders of international rankings of corporate social responsibility, among which an important place belongs to the ranking Corporate Knight) in the manifestation of responsibility under crisis conditions. This paper is devoted to this topic. This paper is aimed at opening the opportunity for further dissemination of this leading experience to other companies.
The change in the phases of the economic cycle, especially the onset of economic crises, is an external factor that violates the noted Pareto optimum and requires the search for a new given optimum, for which the business must show high flexibility and adaptability. The difference between the phases of the economic cycle takes place at the level of financial risks of the business. There is no doubt that natural altruism is an integral feature of any modern entrepreneur who deliberately creates his business to help people and benefit society.
Altruism is deeply rooted in modern culture and therefore remains the same regardless of the phases of the economic cycle (Fang et al. 2021). When these phases change, only the financial risks of the business change. From the business side, its ability to finance corporate social responsibility projects is reduced. From the side of society, the possibilities of financially rewarding businesses for corporate social responsibility through an increased payment for products compared to their counterparts as a surcharge for business responsibility are limited.
In this article, we do not consider non-profit organizations since their activities are not aimed at making a profit, and the amount of their funding usually does not depend on the phase of the economic cycle because, in a crisis, the state and benefactors double their efforts to finance non-profit organizations. Therefore, we focus on commercial organizations whose activities are tied to the phase of the economic cycle.
In conditions of stability and low cyclicality of the economy, the mechanism of corporate social responsibility is quite simple, known, and widely covered in the existing literature. Thus, responsible companies voluntarily redirect part of their profits in favor of socially significant projects. Instead, they receive the best personnel in the labor market and loyal employees as responsible employers, favorable (the ability to set a premium for responsibility, stable demand) conditions for selling products on the market, as well as an increase in investment attractiveness and the opportunity to apply for state support. All this is possible due to low financial risks. That is, the level of corporate social responsibility in conditions of low financial risks depends on the altruism of entrepreneurs and society (Ho and Huang 2018; Jegers 2018; Khoruzhy et al. 2022; Kotek et al. 2018; Yankovskaya et al. 2022).
However, the new context of non-price business competition has introduced uncertainty, as the financial risks of business have increased many times over (Berzon et al. 2022; Lebedev et al. 2022). By giving up part of the profits in favor of liability, companies run the risk of not covering costs and incurring losses, as well as the risk of not benefiting from this. This points to a gap in the literature in that it does not explain the mechanism of corporate social responsibility in the face of high financial risks that are characteristic of periods of increased cyclicality of the economy.
The context of the increased cyclicality of the economy has developed in recent years. In 2008–2009, there was a global financial and economic crisis. From 2020–2021, the global COVID-19 crisis was driven by the pandemic and the lockdown. The research question (RQ) of this article is: What determines the level of corporate social responsibility in an environment of high financial risks?
Considering that when the world economy became more cyclical (in 2015), the UN adopted the Sustainable Development Goals (SDGs), that the Decade of Action is currently underway, that all 17 SDGs are systemically interconnected, and that corporate social responsibility is a generally recognized tool for sustainable development and the implementation of the SDGs (Bogoviz et al. 2022; Osipov et al. 2022), this article puts forward the following hypothesis. H: The level of corporate social responsibility in an environment of high financial risks depends on the implementation of the SDGs.
The purpose of this article is to explore the relationship of corporate social responsibility with the financial risks of the business and explain this relationship from sustainable development (SDG) perspective. Under the conditions of instability and crisis, it is especially important and necessary to specify this connection since corporate social responsibility is a prospective tool for assuaging the consequences of crises for all stakeholders: society, government, and business. The originality of the article lies in the fact that, for the first time, it reveals the mechanism of corporate social responsibility in the face of high financial risks for the business. The article reveals cause-and-effect relationships and streamlines the patterns of corporate social responsibility in the face of high financial business risks.
The article is also unique in that it offers a new foundation—the implementation of the SDGs—as an explanation for the level of corporate social responsibility. The advantage of the new foundation is that it is applicable in conditions of high financial business risks, while the existing foundation (altruism) explains the level of corporate social responsibility only in conditions of stability and low financial risks and is not applicable when these risks increase.
After this introduction, a literature review is carried out, which introduces the concept of financial risks of the business, conducts a literature review, and analyses the gaps in the field of connection between the financial risks of the business with corporate social responsibility. After that, the methodology is described: the methodology for measuring the financial risks of the business is presented, the procedure for testing the hypothesis put forward is revealed, and the sample of the study is described.
The Results section assesses the level of financial risks of the business in 2020–2021. Modeling of the connection between corporate social responsibility and the financial risks of business is carried out. The system interrelation of corporate social responsibility and financial risks of business from the point of view of sustainable development is substantiated. The Discussion notes the contribution of the article to the literature. The Conclusion provides the main findings and notes the limitations of the study and the prospects for further scientific research.
2. Literature Review
2.1. Business Financial Risk Concept
In the existing literature, there is no unambiguous approach to the definition of the concept and essence of the financial risks of the business. Sun et al. (2022), Efimov et al. (2021), and Matytsin (2022) in their works define financial risks as business losses. In our opinion, this definition is not entirely correct since, firstly, a loss is a risk event that has already occurred and not the risk itself in its classical interpretation as the probability of occurrence and danger of a risk event (Amiri et al. 2020). When identifying financial risks with losses, any possibility of forecasting and preventing (avoiding) losses is excluded. In this case, business losses become inevitable, and the meaning of financial risk management is lost (Derbali and Jamel 2019).
Secondly, the above interpretation does not cover a sufficiently large range of negative changes in the financial performance of a business that is not associated with losses. Therefore, as an example, a business can break even but lose a significant part of the profits, but this, in this interpretation, is not considered a financial risk. The current approach indicates the possibility and necessity of systematic management of the financial risks of the business (Cincinelli et al. 2022; Tafakori et al. 2022; He and Guo 2022). These shortcomings do not allow us to focus on the given interpretation in this article.
Chen and Zhao (2022), Ejaz et al. (2022), In et al. (2022), and Zhang and Luo (2022) in their works define the financial risks of the business as the probability of a negative change in the financial performance of a business in certain market conditions. From a theoretical point of view, this definition corresponds well to the classical concept of risk, but from a practical point of view, the assessment of probability is difficult. Orientation to the experience of the enterprise is not always appropriate. In conditions of stability, when the phase of the economic cycle is unchanged, this is possible, and in conditions of instability during the transition from the phase of rise to the phase of decline (crisis), focusing on the conditions of stability, the enterprise assesses the probability of a negative change in the financial performance of the business as low, but it has increased significantly.
A serious limitation of the definition under consideration is the lack of a reliable methodology for quantitatively measuring the probability of a negative change in the financial performance of a business. Probability estimation cannot be made at the level of multiple enterprises due to differences in their experience and characteristics. This limits the ability to assess financial risks by an individual enterprise and implies reliance on the manager’s intuition—subjectivity reduces the accuracy of the assessment and significantly reduces the effectiveness of financial risk management in a business.
Given the noted shortcomings of the first two definitions, in this article, we are guided by an alternative third interpretation, also presented in the available literature. In the preferred interpretation, financial risk is the frequency of negative changes in the financial performance of a business over a certain period, for example, a calendar year (Kharlanov et al. 2022; Popkova and Sergi 2021; Vagin et al. 2022; Zhilkina et al. 2022).
The advantage of the chosen interpretation is, firstly, that it is not limited to profit and loss but includes a negative change in various financial indicators of the business, in particular, revenue, asset value, and market share, as the main indicators disclosed in corporate reporting and company ratings.
Secondly, frequency is preferable to probability because frequency can be measured for an individual company or a sample of companies. This allows for assessing the level of financial risks in the market as a whole, in the economy, in a certain period, or under certain conditions. Thirdly, the frequency can be measured quantitatively—this is the ratio of companies that have encountered risky events (for example, suffered losses) to the total number of companies under consideration. Due to this, the chosen interpretation eliminates subjectivity and assumes an objective and, therefore, the most accurate and reliable assessment of the financial risks of the business.
Thus, in this article, the financial risks of the business are understood as the frequency (share of companies that have observed) of a negative change in the financial performance of a business in the current period (calendar year) compared to the previous period, in particular, the risk events are the following: (1) reduction revenue; (2) decrease in profit; (3) decrease in the value of assets; and (4) decrease in market share. The frequency is used as a measure of the probability of risk events occurring (in relative terms) and as a measure of the danger of risk events—the magnitude (in absolute terms) of a negative change in the financial performance of the business.
2.2. The Connection of Financial Risks of the Business with Corporate Social Responsibility: Literature Review and Gap Analysis
The main idea of this paper consists of the following: there is a connection between the financial risks of the business and corporate social responsibility. An argument in favor of this idea is that this connection is noted and emphasized in numerous existing publications. However, the academic community has not yet come to a consensus on the nature (direction) of this connection. Bannier et al. (2022), Fritz-Morgenthal et al. (2022), and Szczepankiewicz et al. (2022) in their publications write about feedback and note that the lower the financial risks of the business, the more opportunities and, accordingly, the higher the level of corporate social responsibility. The logic here is that if a business lacks financial capacity, it is simply not able to exercise corporate social responsibility, which requires financial costs, often significant ones.
In contrast, Capelli et al. (2021), Landi et al. (2022), Liu et al. (2021), and Tarighi et al. (2022) in their studies point to a direct link, noting that an increase in the financial risks the business creates a powerful natural (market) incentive for increasing corporate social responsibility. That is, even having financial opportunities, the business does not fully use them to implement corporate social responsibility programs, and only when the business is deprived of opportunities for further development it redirects its financial resources to corporate social responsibility. This means that in the absence of market pressure, even if the business has financial opportunities, its corporate social responsibility is negligibly small.
Despite their obvious difference, the two points of view are similar in that they both focus on the conditions of stability and low financial risks of the business. In contrast, in conditions of instability, financial risks are ambiguous. For example, profits can increase due to inflation while market share decreases. This complicates the process of making decisions on the implementation of corporate social responsibility.
While the impact of financial risks on business liability has been widely studied and is the subject of active scientific discussion, the relationship between financial risks has not been practically studied. Consequently, the current approach to studying the relationship between corporate social responsibility and the financial risks of business has a serious drawback—it is fragmented.
Firstly, the existing approach takes into account only one factor of impact: financial risk is considered a factor of corporate social responsibility. Financial risks are summarized and mostly reduced to profit/loss. However, in reality, these risks are heterogeneous and can have very different impacts on corporate social responsibility. Secondly, the mutual influence of financial risks is not taken into account.
This makes it possible to clarify the RQ posed as a question of how the level of corporate social responsibility and financial risks are related in an unstable and highly cyclical economy. This also makes it possible to clarify the hypothesis (H) put forward as a hypothesis that there is a complex relationship between the level of corporate social responsibility and financial risks, which, in conditions of instability and high cyclicality of the economy, is determined and explained by the implementation of the SDGs.
Accordingly, the conducted literature review showed that the connection between the financial risks of the business and corporate social responsibility is undeniable and is reflected in the existing literature. However, the nature of this relationship is not defined, and the patterns of change in corporate social responsibility depending on the magnitude of the financial risks of the business are unknown, which is a research gap.
To fill the identified gap, this article systematically studies the relationship between corporate social responsibility and the entire set of identified financial risks of business (risk events: (1) revenue reduction, (2) decrease in profit, (3) decrease in the value of assets, and (4) decrease in market share), the relationship between financial risks is examined, and the logic of this relationship is determined from the standpoint of sustainable development (through the prism of the SDGs).
3. Materials and Methods
3.1. Methodology for Measuring the Financial Risks of the Business
According to the definition of financial risk of a business as the frequency of negative changes in the financial performance of a business in the current period (calendar year) compared to the previous period, this article uses the following formula to measure financial risk:
where rd is the risk danger: the amount of change in the financial performance of the business. A positive change indicates a low-risk danger, a zero change indicates a moderate-risk danger, and a negative change indicates a high-risk danger; fint is the value of the financial indicator in a given period t; fint−1 is the value of the financial indicator in the previously specified period: t − 1.
rd = fint × 100%/fint−1 − 100
Risk danger (rdi) is calculated for each company (i) in the sample. Then the overall risk danger for the sample is calculated using the arithmetic mean formula:
where RD is the total risk danger for the sample; n is the total number of companies in the sample.
RD = (∑i=1nrdi)/n
The smaller the negative value of RD, the higher the risk danger. Then the risk event frequency is estimated according to the following formula (for the sample as a whole):
where re is the frequency of the risk event of the financial risk of the business; nrd<0 is the number of companies in the sample that had a risk event (rd < 0).
re = nrd<0/n
The lower the value of re, the lower the frequency of negative changes in the financial performance of the business in the current period. As a result, the financial risk is determined by the following formula:
FRre = RD × re
FRre is the financial risk of a given risk event (re) as the product of the risk danger and the frequency of negative changes in the financial performance of the business.
If FR is positive, the financial risk of the business is low, if FR is zero, it is moderate, and if FR is negative, it is low. The smaller the negative value of FR, the higher the financial risk of the business. For each risk event, its own financial risk is calculated, and then the arithmetic average of the financial risks of the business is calculated using the following formula:
FR = (∑i=14RDre)/4
3.2. The Procedure for Testing the Proposed Hypothesis
To test the proposed hypothesis (H) and identify a complex two-way relationship between the level of corporate social responsibility and financial risks, the method of structural equation modeling (SEM) was chosen. The choice of the structural equation modeling (SEM) method is explained by the fact that it allows for obtaining the most accurate and reliable results. The chosen method (SEM) allows us to solve the complex and inaccessible regression problem of testing the hypothesis (H) put forward.
The advantage of structural equation modeling (SEM) compared to regression analysis is that SEM covers not only the connection between financial risks and corporate social responsibility but also the systemic relationship of financial risks with each other, which the regression analysis method cannot identify and measure (since the indicators are equivalent—there is no resultant and factor variable).
Using SEM, we comprehensively study the bilateral (direct and reverse) causal connections. The logical substantiation of the existence of this connection and the necessity to study it is the fact that not only can financial risks influence corporate social responsibility, but this responsibility can also influence the financial risks of business.
Socially responsible companies can build trust with stakeholders (including investors, creditors, and suppliers) and help develop good relations and developing business activities with stakeholders, which would bring profit—and thus reduce the risk of financing in the aspect of equity financing from investors, debt financing from creditors and trade credits from suppliers. The SEM method is optimal for receiving the fullest (systemic) and objective results that ensure the understanding of this endogeneity in empirical analysis.
The Corporate Knights’ Index of the world’s greenest firms has been chosen as a measure of corporate social responsibility (CSR). In the Corporate Knights (2022a, 2022b) methodology, the level of corporate social responsibility is assessed based on the following indicators: Peer Group Rank: Company’s ranking in the peer group; Carbon Productivity Score: Based on the company’s revenue to Scope 1+2 CO2e ratio; % Taxes Paid: Based on the company’s cash taxes paid to profit ratio over the past five years; CEO–Average Worker Pay Ratio: Ratio of CEO compensation to average worker’s compensation; % Non-Male Board Directors: % of the board of directors who are not male; % Clean Revenue: % of the revenue earned from products and services that are categorized as “clean” under the Corporate Knights Clean Taxonomy; % Clean Investment: % of capital expenditures, R&D and acquisitions that are categorized as “clean” under the Corporate Knights Clean Taxonomy.
The Overall Score is the weighted average percentile rank score across up to 23 metrics. The path diagram of the structural equation model used in the article is shown in Figure 1.
The choice of the SEM method does not exclude (but complements) the regression analysis method. Thus, the impact of financial risks (factors: RDre) on the level of corporate social responsibility (CSR) is determined using multiple linear regression. In the path diagram shown in Figure 1, the determining variables are FRre (financial risk of each of the four identified risk events), and the determining variable is CSR (Corporate Social Responsibility). The path diagram shows that the FRre variables determine the CSR variable, which also depends on the latent control variable e.
The variable e is unobservable, outside the scope of this study. It is very important in this article since the financial risks of the business do not fully explain the level of its corporate social responsibility. There are other factors that the variable e reflects. In particular, altruism refers to the variable e, which is not observed in this article. The dependence of the level of corporate social responsibility on financial risks is determined using multiple linear regression. The research model has the following form:
CSR = λ1 × FRre1 + λ2 × FRre2 + λ3 × FRre3 + λ4 × FRre4 + e
To determine the reliability of the econometric model (1), the Fisher F-test is carried out, with the help of which the level of significance is determined. Relationships between factor variables (financial risks: FRre) are determined using correlation analysis. The measure of dispersion (δ2) of each variable is determined using variation analysis.
The advantage of the selected indicators is, firstly, that they most accurately and in detail statistically describe the chosen subject area of this study. Secondly, they are taken from reliable sources, which guarantees the reliability of the results and the conclusions based on them. Thirdly, they are comparable—both the Corporate Knights’ Index and financial risks have the same units of measurement (measured in percentage), which ensures complete comparability of the research results and consistency and error-free interpretation.
Hypothesis (H) is recognized as proven if a reliable relationship between financial risks, both with the level of corporate social responsibility and among themselves, is revealed, and this relationship receives a convincing rationale from the standpoint of sustainable development (SDGs).
3.3. Study Sample
When forming the sample for this study, we were guided by the fact that the largest companies demonstrate the highest level of corporate social responsibility. First, we took all the Global 100 world’s greenest firms from the Corporate Knights (2022b) 2021 ranking (at year-end). Then we selected from them those companies that were present in the ranking for the previous (2021) year from Corporate Knights (2022a). After that, we selected from the rest those companies that were present in the Forbes (2022) Global 2000 ranking in 2019–2021 (at each corresponding year-end).
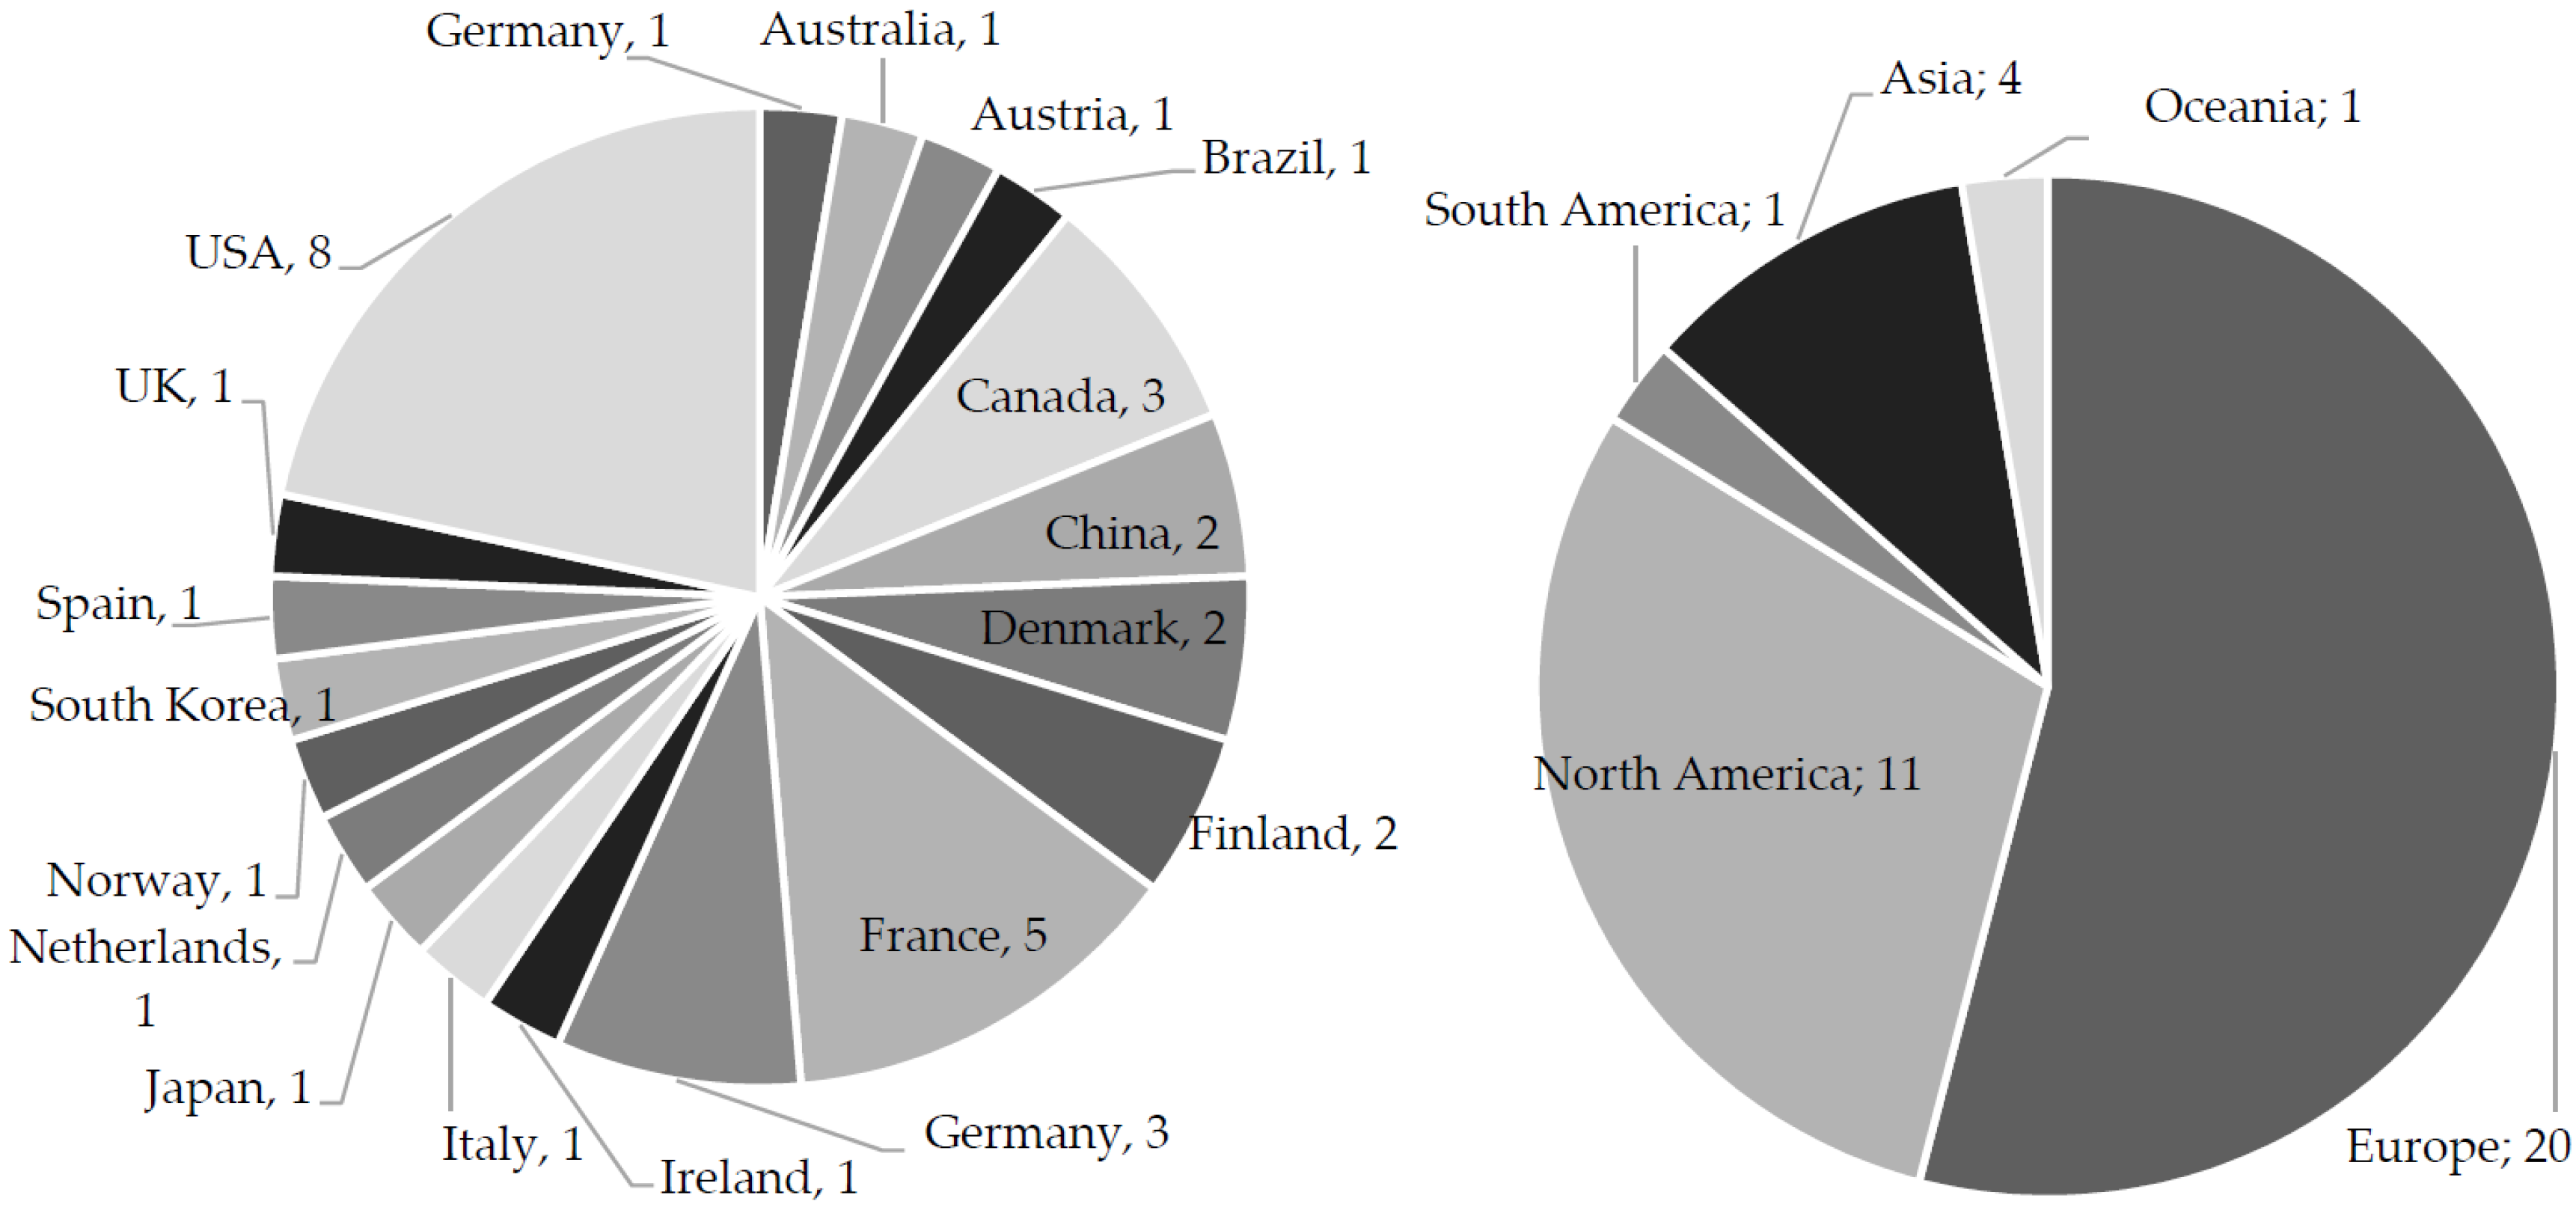
As a result, we received 37 companies with the highest level of corporate social responsibility in the world, as well as statistics on their financial performance, applicable to assess their financial risks in 2020–2021. The resulting sample of companies is given in Table A1 and Table A2, attached to this article. The geographical structure of the companies in the sample (by country—on the left and by region of the world—on the right) is shown in Figure 2.
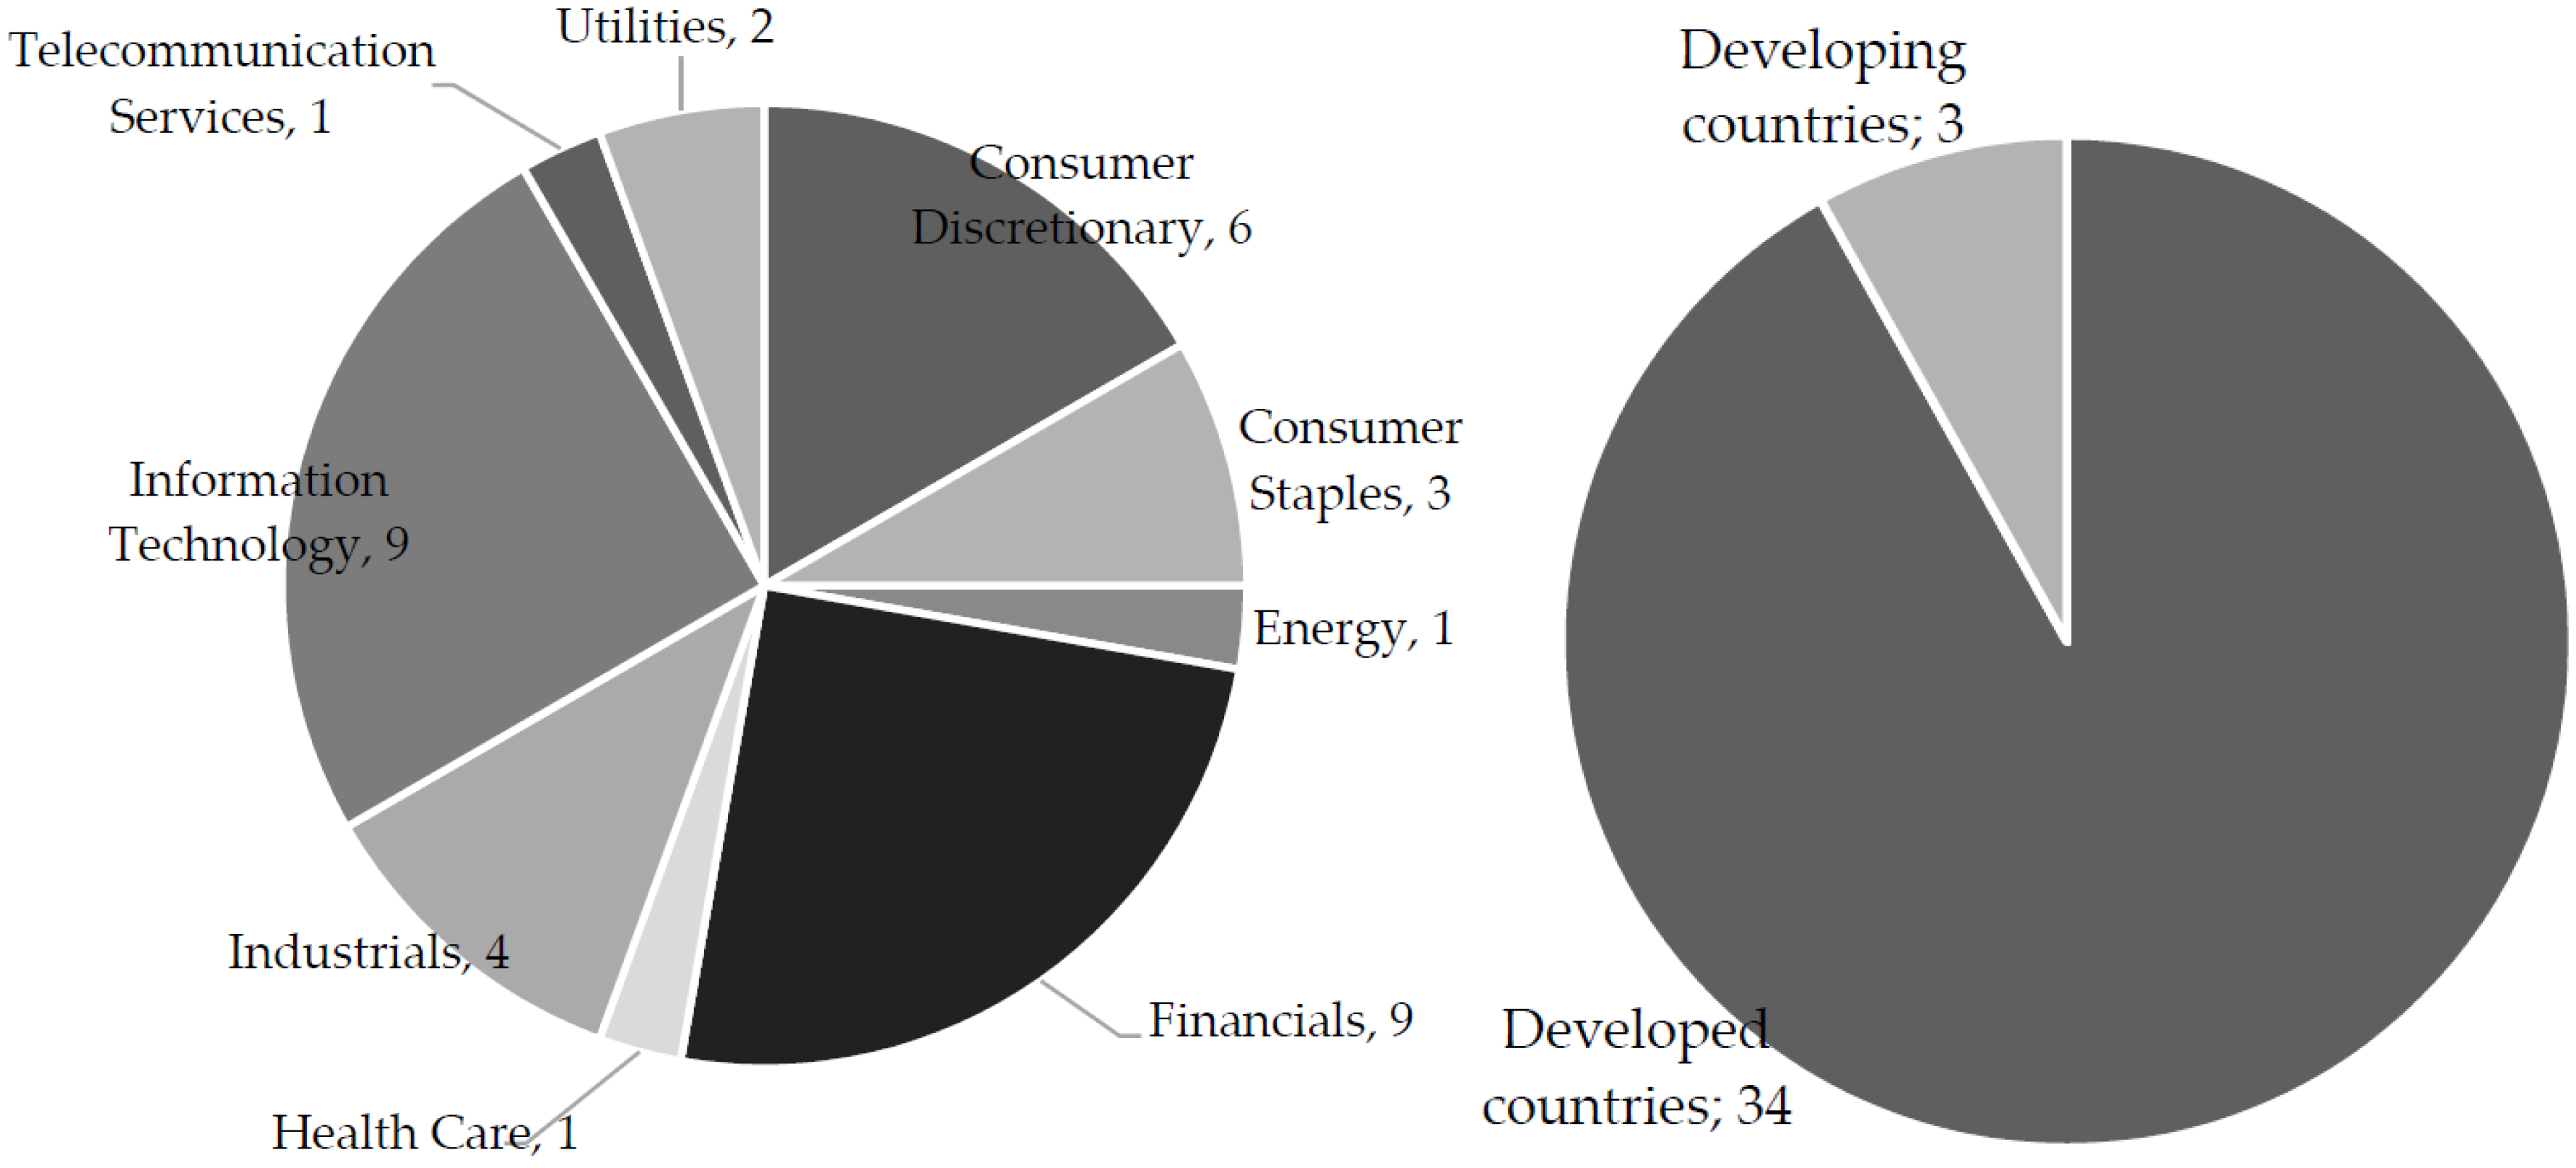
As shown in Figure 2, the majority of companies are from Europe (54.05%). The share of companies from North America was 29.73%, and the share of companies from Asia was 10.81%. The share of companies from South America and Oceania was the smallest and amounted to 2.70%, respectively, for each of these regions of the world. The structure of the companies in the sample by industry (on the left) and by country category (developed and developing countries—on the right) is shown in Figure 3.
As shown in Figure 3, most companies in the sample are in the financials and information technology sectors: 24.32% each. The share of consumer discretionary (16.22%) and industrials (10.81%) is also large. The share of consumer staples was 8.11%, the share of utilities was 5.41%, and the shares of energy, health care, and telecommunication services were 2.70% for each industry. The sample structure is dominated by companies from developed countries (91.89), although there are also companies from developing countries (8.11%). To obtain the most reliable and valid results of econometric modeling, it is carried out based on continuous sampling for 2020–2021, that is, based on 74 observations (for 2 years).
Based on the described sample, we model the connection between corporate social responsibility and the financial risks of business in 2020–2021. The timeframe of modeling cannot be expanded due to the fact that the list of companies is changed annually in the rankings of Corporate Knights. This does not allow forming a dataset only for two years.
However, the list of companies in the Global 2000 ranking is relatively stable. This allowed forming an additional sample of the top 15 countries with the highest level of corporate social responsibility—leaders in Global 100 world’s greenest firms from the ranking Corporate Knights (2022b) for 2021 (at year-end). The top 15 include the following companies: Adidas AG (Germany, Consumer Discretionary); Allianz SE (Germany, Financials); Alstom SA (France, Industrials); Analog Devices Inc (USA, Information Technology); Banco do Brasil SA (Brazil, Financials); Bank of Montreal (Canada, Financials); BNP Paribas SA (France, Financials); Byd Co Ltd. (China, Consumer Discretionary); Canadian Tire Corporation Ltd. (Canada, Consumer Discretionary); Henkel AG & Co KgaA (Germany, Consumer Staples); Iberdrola SA (Spain, Utilities); ING Groep NV (Netherlands, Financials); Intel Corp (USA, Information Technology); Intesa Sanpaolo SpA (Italy, Financials); Johnson Controls International PLC (Ireland, Consumer Discretionary).
For these companies, the data for a longer period—2010–2021—were collected. Since the data for 2022 are yet to be collected, and the statistics are to be formed (this will probably take place in 2023), here we use the data for 2021. The number of companies in the second sample is smaller than in the first one since it is only for these 15 companies that there are no gaps in the data—i.e., there is information on the financial indicators for the entire considered period: 2010–2021. Due to this, based on the second sample, we form a large time row for the most complete dynamic analysis and assessment of the level of the financial risks of business in 2010–2021 (based on the data as a result of each year).
4. Results
4.1. Assessment of the Level of Financial Risks of the Business in 2010–2021
Based on the selected methodology of measuring the financial risks of the business, we assess the danger of risk as a value of change in the financial indicators of business activities. The 2020 and 2021 rd values for all 37 companies in the sample, received with the use of Formula (1), are provided in Table A2 (Appendix A).
The general danger of risk in the sample of the top 15 responsible companies (RD) was calculated according to the arithmetic mean Formula (2). In 2021 (at year-end), the change in sales (sales: RDre1) equaled −4.34% (high risk), the change in profit (profit: RDre2): 10.89% (low risk), the change in assets (assets: RDre3): 2.65% (low risk), and the change in market value (market value: RDre4): 90.32% (low risk).
In 2020 (at year-end), the change in sales (sales: RDre1) equaled −0.18% (high risk), the change in profit (profit: RDre2): −15.38% (high risk), the change in assets (assets: RDre3): 4.66% (low risk), and the change in market value (market value: RDre4): −25.73% (high risk).
The risk events rate (for the sample on the whole) was calculated according to Formula (3). In 2021, the reduction in sales was observed with nine companies—therefore, re = 9/15 = 0.60. The reduction in profit was observed with 10 companies—therefore, re = 10/15 = 0.67. The reduction of assets was observed with three companies—therefore, re = 3/15 = 0.20. The reduction of market value was not observed with any company—therefore, re = 0/37 = 0.
In 2020, the reduction in sales was observed with nine companies—therefore, re = 9/15 = 0.60. The reduction in profit was observed with nine companies—therefore, re = 9/15 = 0.60. The reduction of assets was observed with six companies—therefore, re = 6/15 = 0.40. The reduction of market value was observed with 14 companies—therefore, re = 14/15 = 0.93.
As a result, the financial risks of each risk event were calculated according to Formula (4). In 2021, the risk of reduction of sales FRre = −4.34 × 0.60 = −2.60. The risk of reduction of profit FRre = 10.89 × 0.67 = 7.26. The risk of reduction of assets FRre = 2.65 × 0.20 = 0.53. The risk of reduction of market value FRre = 90.32 × 0 = 0. In 2020, the risk of reduction of sales FRre = −0.18 × 0.60 = −0.11. The risk of reduction of profit FRre = −15.38 × 0.60 = −9.23. The risk of reduction of assets FRre = 4.66 × 0.40 = 1.86. The risk of reduction of market value FRre = −25.73 × 0.93 = −24.02.
Formula (5) was used to assess the general level of financial risk, which turned out to be low in both periods, equalling 28.21 in 2020 and 5.13 in 2021. The dynamics of financial risks (FR) of the top 15 socially responsible companies in 2010–2021 are given in Table 1.
The results were obtained based on a sample of the top 15 countries with the highest level of corporate social responsibility—leaders in Global 100 world’s greenest firms from the ranking Corporate Knights (2022b) for 2021 (as a result of the year). The sample period is 2010–2021.
According to the results of the assessment from Table 1, a high risk of reduction in sales was observed in 2011 (−1.72%) and 2019 (−0.39%). A high risk of reduction in profit was observed in 2015 (−23.15%) and 2018 (−9.74%). A high risk of reduction of assets was observed in 2011 (−6.15%) and 2019 (−2.12%). A high risk of reduction of market value was observed in 2012 (−3.81%), 2013 (−0.08%), and 2019 (−1.64%).
Thus, it is possible to conclude that in 2021, the risk of reduction in sales was particularly high, while other financial risks of companies in the sample remained low. In 2020, apart from a high risk of reduction in sales, there was a high risk of reduction in profit and the risk of reduction in market value. Over 2010–2021, a high general level of financial risks was observed in 2018 (−1.11%) and 2020 (−7.87%); in other periods, the financial risks of business were low.
This means that against the background of the COVID-19 pandemic and crisis, the financial risks of business grew significantly in 2020. However, they were reduced as soon as 2021. Therefore, even companies with a high level of corporate social responsibility are subject to general market tendencies of change in the financial risks of business in relation to the economic cycle. This indicates the necessity for the management of the financial risks of business in companies with a high level of corporate social responsibility. Further on in this paper, it is necessary to specify the contribution to the management of the financial risks of these companies that could be made by corporate social responsibility.
It is also important to take into account that the costs of corporate social responsibility are higher than the advantages of this responsibility when companies take a high financial risk. Thus, the level of corporate social responsibility could be lower as a result of high financial risk. That is why corporate social responsibility may be reduced in the case of high financial risks. For the most objective consideration of the contribution of corporate social responsibility to the reduction of financial risks, we study a long period (2010–2021).
4.2. Modelling the Relationship between Corporate Social Responsibility and Financial Business Risks
The impact of financial risks (factors: RDre) on the level of corporate social responsibility (CSR) based on the statistics from Table A1 and Table A2 (Appendix A) determined using multiple linear regression (Table 2).
In Table 2, the results were obtained based on a sample of 37 companies with the highest level of corporate social responsibility in the world, according to the ranking Global 100 world’s greenest firms from the ranking Corporate Knights (2022b) for 2021 (as a result of the year), which are present in the ranking of Forbes (2022) Global 2000 in 2019–2021 (as a result of each corresponding year). The sample period is 2020–2021. A unified array of data for two years has been formed, due to which the number of observations in the sample is 74 (the data on 37 companies for two years are analyzed).
Regression statistics from Table 2 allow the creation of an econometric model of multiple linear regression dependence of the level of corporate social responsibility on the magnitude of financial risks:
CSR = 0.05 × FRre1 − 0.0002 × FRre2 + 0.05 × FRre3 − 0.08 × FRre4 + 10.48
To check the reliability of the obtained Equation (7), we will carry out Fisher’s F-test. For four-factor variables (m = 4) and 74 observations (n = 74), that is, for k1 = m = 4 and k2 = n – m − 1 = 74 − 4 − 1 = 69 at a significance level of 0.01 tabular F = 3.649, and the observed F from Table 1 was 6.0476. Since the observed F exceeded the tabular F (6.0476 > 3.649), the Fisher F-test was successfully passed, and the model (7) is statistically significant and reliable at a significance level of 0.01.
According to model (7), with an increase in sales by 1%, the level of corporate responsibility increases by 0.05%. With an increase in profit by 1%, the level of corporate responsibility decreases by 0.0002%. With an increase in the value of assets by 1%, the level of corporate responsibility increases by 0.005%. With an increase in market share by 1%, the level of corporate responsibility decreases by 0.08%. Since R2 was 0.2596, the level of corporate social responsibility is 25.96% due to changes in the financial risks of the business in 2020–2021.
In its turn, corporate social responsibility can also influence financial risk. Socially responsible companies may build trust with stakeholders (including investors, creditors, and suppliers), help develop good relations and develop business activities with stakeholders, which would bring profit—and thus reduce the risk financing in the aspect of equity financing from investors, debt financing from creditors and trade credits from suppliers. To take into account this endogeneity in the performed empirical analysis, we conduct a regression analysis of the dependence of each distinguished financial risk (separately) on corporate social responsibility (Table 3, Table 4, Table 5 and Table 6).
Based on the results of the regression analysis (Table 3), it is possible to compile an equation of multiple linear regression:
FRre1 = 0.3994 × CSR − 12.5130
According to Equation (8), an increase in the level of corporate social responsibility by 1% leads to an increase in sales volume by 0.3994%. Therefore, corporate social responsibility reduces the risk of reduction of sales volume. However, the correlation between the indicators is low: multiple R equals 0.1626, and R2 equals 0.0264. Equation (8) conforms to the level of significance of 0.2 since significance F = 0.1662. This is a sign of a weak connection between the considered indicators.
The results obtained in Table 4 demonstrate the absence of a statistically significant connection between the risk of reduction of profit and the level of corporate social responsibility.
The results obtained in Table 5 demonstrate the absence of a statistically significant connection between the risk of reduction of the value of assets and the level of corporate social responsibility.
Based on the results of the regression analysis (Table 6), it is possible to compile an equation of multiple linear regression:
FRre4 = −3.0871 × CSR + 223.5907
According to Equation (9), an increase in the level of corporate social responsibility by 1% leads to a decrease in the market share of companies by 3.0871. Therefore, corporate social responsibility reduces the risk of reduction of sales volume. However, the correlation between the indicators is low: multiple R equals 0.1626, and R2 equals 0.0264. Equation (9) conforms to the highest level of significance of 0.01. At the set level of significance, at k1 = 1 and k2 = 74 − 1 − 1 = 72, table F = 0.77. The observed value F = 22.8625 exceeds the table value—therefore, F-test has been passed, and the regression equation is reliable at the set level of significance. This indicates a strong and close, but negative, connection between the considered indicators.
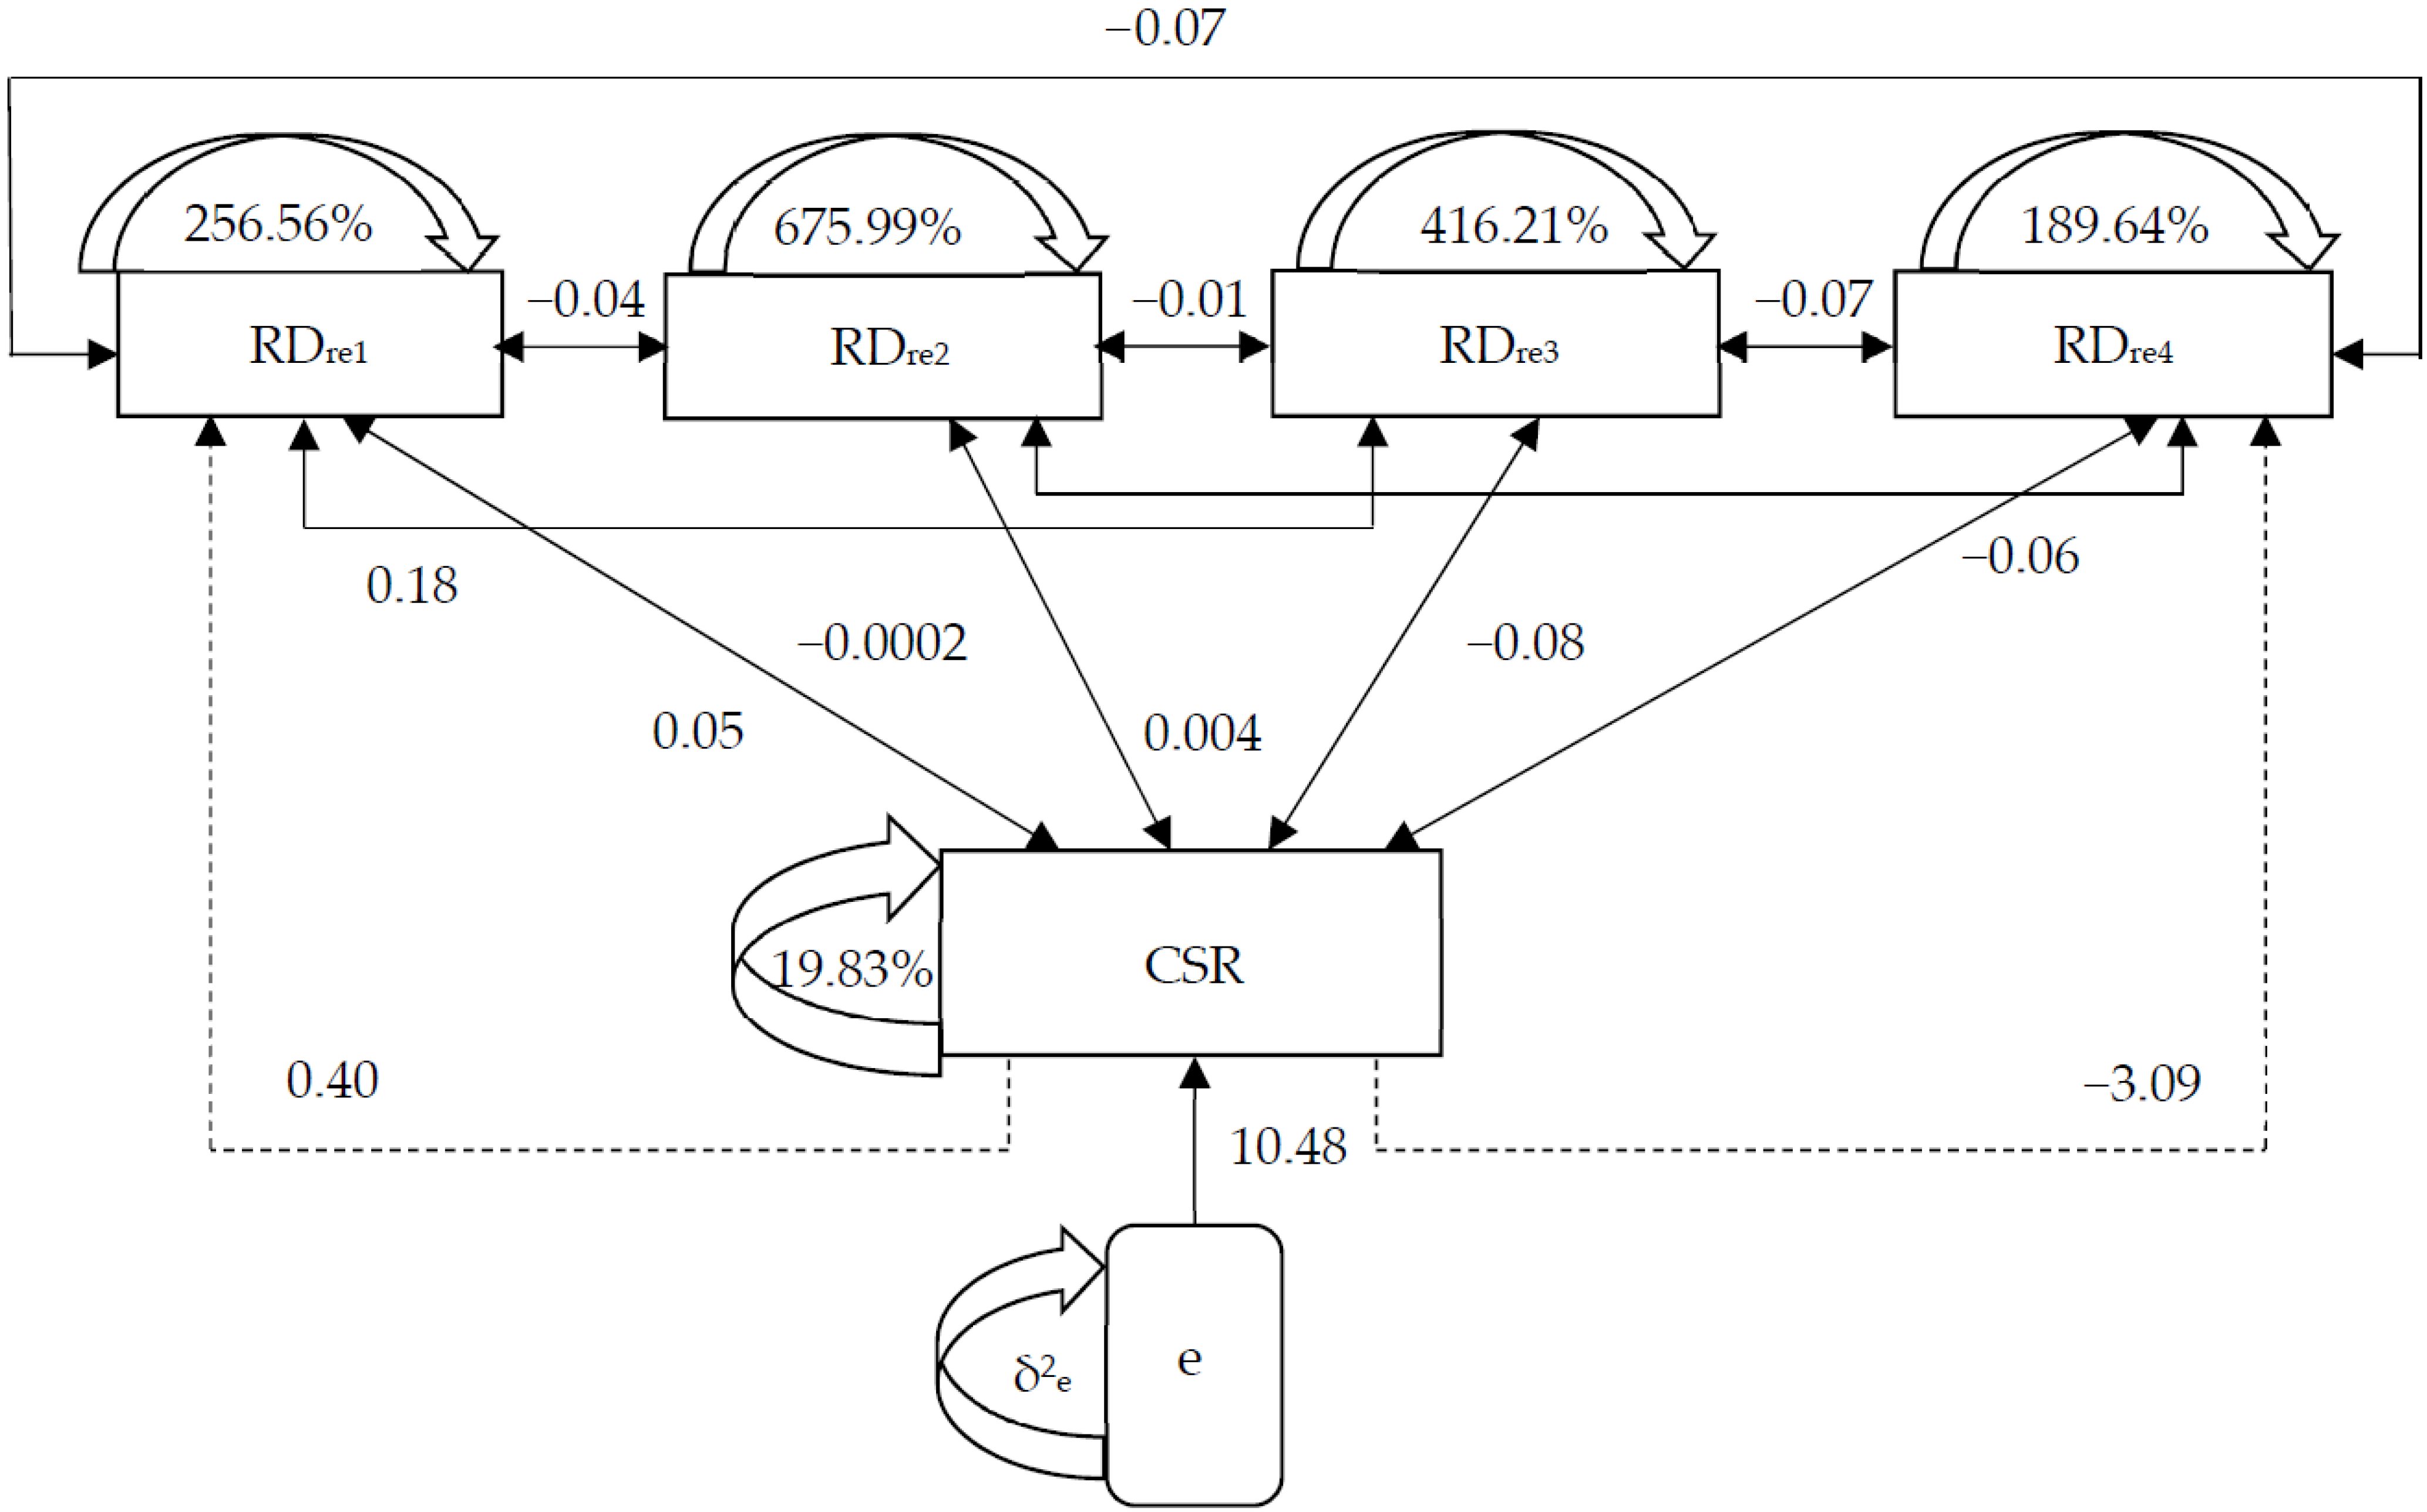
A complex two-way relationship between the level of corporate social responsibility and the financial risks of the business is reflected in the result of modeling structural equations, shown in Figure 4.
In Figure 4, the results are obtained based on a sample of 37 companies with the highest level of corporate social responsibility in the world, according to the ranking Global 100 world’s greenest firms from the ranking Corporate Knights (2022b) for 2021 (as a result of the year), which are presented in the ranking Forbes (2022) Global 2000 in 2019–2021 (as a result of each corresponding year). The sample period is 2020–2021. A unified array of data for two years has been formed, due to which the number of observations in the sample is 74 (the data on 37 companies for two years were analyzed).
As shown in Figure 1, the result of structural equation modeling (SEM) indicates that the determinant variables are heterogeneous—a measure of the dispersion (variation) of the revenue of responsible companies in 2020–2021 is 256.56%, profit—675.99%, asset value—416.21%, and market share—189.64%.
As a whole, they (financial risks) determine the corporate social responsibility of companies at 25.96%. Accordingly, the remaining (latent, beyond the scope of this study) factors (e), including altruism, determine the remaining 74.04% of changes in corporate social responsibility in 2020–2021. At the same time, the level of corporate social responsibility itself is quite homogeneous—its variation was only 19.83%.
A negative relationship was found between revenue and profit (−0.04) and market share (−0.07), profit with asset value (−0.01) and market share (−0.06), as well as asset value with market share (−0.07). At the same time, the relationship between revenue and the value of assets turned out to be positive (0.18). The obtained correlation coefficients can be used in the analysis of multicollinearity and conclude that there are no duplicate factor variables.
Therefore, in 2020–2021, financial risks have demonstrated a complex relationship between each other and a contradictory impact on corporate social responsibility. The obtained quantitative results described the patterns of changes in variables relative to each other, but for a logical explanation of the identified relationships, their qualitative analysis is necessary, which is advisable to be carried out later in this article.
The determined mutual dependence on financial risks allows for their complex management, i.e., the development of a unified approach to the financial management of the business. The advantage of such an approach will be higher effectiveness compared to the existing practice of isolated management of financial risks in business. For example, management of the risk of revenue reduction often implies stimulation of sales through the reduction of prices for products, which might be accompanied by the reduction of quality. This allows reducing the risk only in the short term but might lead to a sharp increase in this risk in the long term.
In another example, management of the risk of profit reduction may envisage an increase in the share of shadow business operations, which is connected with another financial risk—sanctions for the violation of tax law. That is, many implemented practices of isolated management only mask, relieve or postpone financial risks. Reduction of some risks leads to the growth of other risks, while the general risk component of business may grow as a result of such risk management. A general approach to the management of all financial risks of business through corporate social responsibility excludes the reduction of quality and shadowization. This will allow achieving a long-term effect from the management of financial risks of the business, as well as reduction of the general risk component. The advantage of the obtained SEM model is the attention to reverse causality.
4.3. Systemic Relationship between Corporate Social Responsibility and Financial Risks of the Business from the Point of View of Sustainable Development
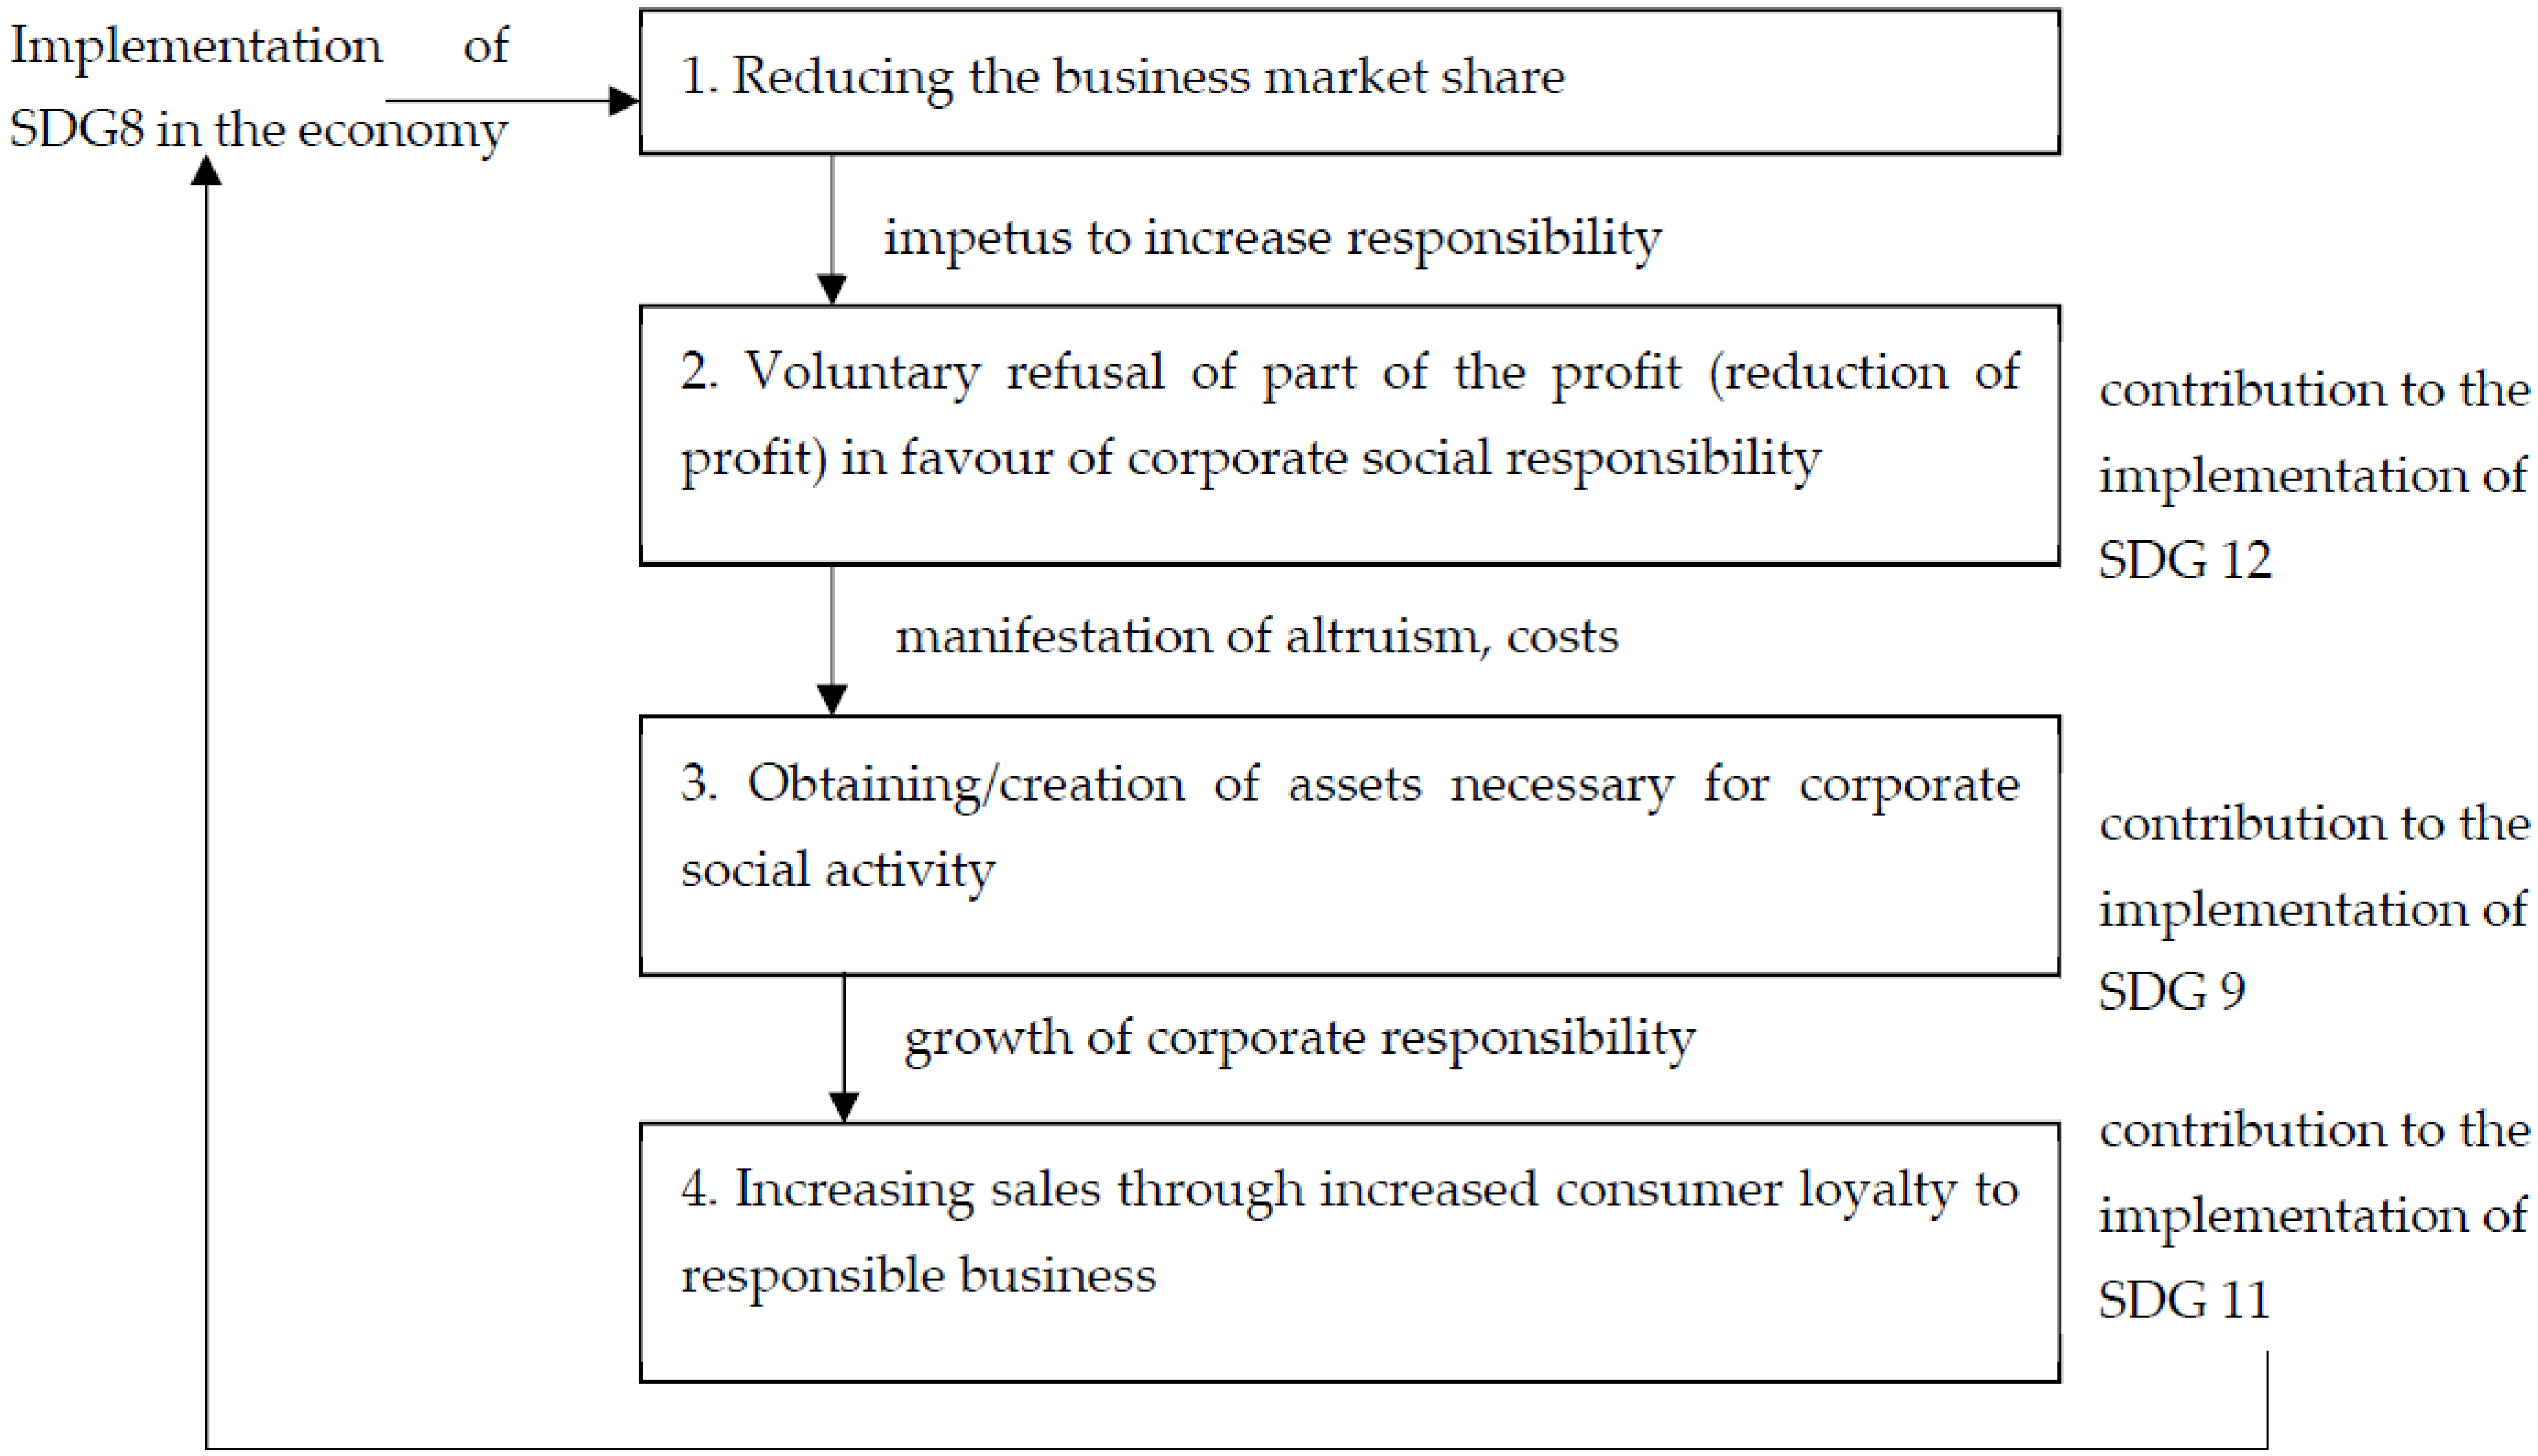
Figure 5 shows the systemic relationship between corporate social responsibility and the financial risks of the business from the point of view of sustainable development.
Figure 5 demonstrates that the complexity of the SDGs makes it possible to logically explain the identified quantitative relationships of the studied indicators. Thus, the implementation of SDG8 ensures decent employment and economic growth. Against the background of responsible companies, the market share of less responsible businesses is declining. This acts as a natural (market) incentive to increase corporate social responsibility. This confirms the negative value of the regression coefficient (−0.08) in the model (7), which reflects the negative impact of market share growth on corporate social responsibility.
A reduction in market share, on the contrary, causes businesses to voluntarily sacrifice part of their profits (decrease in profits) in favor of corporate social responsibility, which contributes to the implementation of SDG12 and acts as a manifestation of altruism and rising costs. This confirms the negative value of the regression coefficient (−0.0002) in the model (7), which reflects the negative impact of profit growth on corporate social responsibility.
A decrease in profits, on the contrary, causes an increase in corporate social responsibility. The allocated financial resources are spent on the acquisition/creation of assets necessary for corporate social activity. For example, more advanced treatment facilities for industrial production. This contributes to the implementation of SDG9 and ensures the growth of corporate social responsibility. This confirms the positive value of the regression coefficient (0.005) in model (7), which reflects the positive impact of asset accumulation on corporate social responsibility.
As a result, an increase in sales is achieved due to the growth of consumer loyalty to a responsible business. This confirms the positive value of the regression coefficient (0.05) in the model (7), reflecting the positive (reinforcing) impact of increased sales on corporate social responsibility. The sales growth of responsible companies contributes to the development of responsible communities and sustainable territories, thereby contributing to the implementation of SDG11. This, in turn, supports the implementation of SDG8 in the economy—and the described algorithm is repeated; that is, it is cyclical.
Thus, the determined and demonstrated systemic interconnection between corporate social responsibility and the financial risks of business—from the position of sustainable development—set a scientific and methodological framework for implementing a unified approach to the management of the financial risks of the business. Seventeen UN SDGs should be a milestone for corporate social responsibility. Foundation on this milestone will allow for a comprehensive reduction of the financial risks of the business and an increase in the companies’ financial sustainability to economic crises.
5. Discussion
The article contributes to the development of the concept of financial risks of the business by clarifying their connection with corporate social responsibility and substantiating the relationship between the financial risks of the business. The scientific novelty of the study is demonstrated in Table 7 comparative analysis of the obtained results with the existing literature.
It is substantiated that the relationship between financial risks and corporate social responsibility is not linear—not direct (unlike Capelli et al. 2021; Landi et al. 2022; Liu et al. 2021; Tarighi et al. 2022) and not reverse (unlike Bannier et al. 2022; Fritz-Morgenthal et al. 2022; Szczepankiewicz et al. 2022). Instead, a complex systemic relationship of financial risks is demonstrated not only with corporate social responsibility but also among each other: in some cases—direct, in other cases—reverse. Thus, the possibility and necessity of systemic management of financial risks of the business have been refuted (unlike Cincinelli et al. 2022; Tafakori et al. 2022; He and Guo 2022), and it has been proved that each financial risk is specific.
Almost all financial risks of the business are negatively related to each other. The only exception is the positive relationship (correlation: 0.18) between asset value and revenue. In this regard, it is impossible to offer any universal solution that will simultaneously increase the value of assets, increase revenue and profit, and strengthen the market share of the business. Instead, each financial risk needs to be independently managed and handled differently.
It has been proved that the reason for the change in the level of corporate social responsibility in times of instability lies not in altruism (unlike Fang et al. 2021) and not in the possibilities of financing corporate social responsibility (unlike Berzon et al. 2022; Khoruzhy et al. 2022; Lebedev et al. 2022; Yankovskaya et al. 2022) recommending the reduction of financial risks. Instead, market incentives are needed to increase the level of corporate social responsibility (it is necessary to increase financial risks, in particular, a reduction in market share).
Due to this, the article answered the research question (RQ) and confirmed the put forward hypothesis (H), proving that the level of corporate social responsibility in conditions of high financial risks depends on the implementation of the SDGs. The SDGs are about more than just altruism. This is altruism backed by specific social goals and therefore combines the values and impulses of the entrepreneur (as isolated altruism) with the priorities of society. That is, the SDGs are altruism directed by society and, therefore, much more valuable because it ensures not only the self-realization of an entrepreneur but also the achievement of public priorities.
The contribution of the article to the literature lies in the fact that it proved that ideal market conditions are not required to increase corporate social responsibility; on the contrary, market imperfections stimulate corporate social responsibility. Losing market positions is the most efficient, but at the same time, the least responsible companies increase their level of corporate social responsibility.
By systematically implementing SDGs 8, 9, 11, and 12, companies get the opportunity to restore and improve their position in the market, but their financial risks will not decrease immediately and simultaneously—some risks will increase, while others will decrease. Neither altruism nor financial capabilities can guarantee a reduction in financial risks in the future, but only the consistent and systematic implementation of the SDGs in the implementation of corporate social responsibility.
6. Conclusions
The main result of that study is the answer to the RQ and the proof of hypothesis H. The article proved that the level of corporate social responsibility in conditions of high financial risks depends on the implementation of the SDGs. It is also possible to draw some individual conclusions. Firstly, the assessment of the level of financial risks of business in 2020–2021 showed that in the period under review, in general, the financial risks of companies were low, except for the risk of a decrease in revenue, which was high in 2020 and the risk of a decrease in market share, which was high in 2021.
It should be noted that even before the pandemic, the financial risks were high. Thus, in 2019, the financial risk of reduction of profit, assets, and market value was high. In 2018, there was a high risk of a reduction in profit. In 2016–2017, the financial risks of business were low. Before that, there were high financial risks of the reduction of profit in 2015, the reduction of market value in 2012 and 2013, and the risks of reduction of profit and assets in 2011.
Based on this, we can make the key conclusion of this paper—the costs of corporate social responsibility are higher than the advantages of responsibility when companies face a high financial risk. Thus, the level of corporate social responsibility could be lower as a result of high financial risk. However, this did not take place in 2020–2021, amid the COVID-19 pandemic and crisis. This proves the existence of a synergetic effect, which is expressed in the form of mutual support of corporate social responsibility and financial risk management of the business.
Secondly, structural equation modeling (SEM) of the relationship between corporate social responsibility and financial risks of the business showed that an increase in corporate social responsibility causes an increase in sales and the value of business assets, but an increase in profits and market share of a business leads to a decrease in corporate social responsibility. The level of corporate social responsibility at 25.96% is explained by the change in the financial risks of the business in 2020–2021. The level of corporate social responsibility and the change in the financial risks of the business are by 25.96%, explained by mutual connections in 2020–2021.
A complex two-way relationship between the level of corporate social responsibility and the financial risks of the business exists and is reflected in the econometric model compiled. In 2020–2021, financial risks have demonstrated a complex (in most cases negative) relationship with each other and a contradictory impact on corporate social responsibility.
Thirdly, the systemic relationship between corporate social responsibility and the financial risks of the business is substantiated from the point of view of sustainable development. An algorithm has been compiled showing that the implementation of SDG8 in the economy increases the financial risks of the business, in particular, reduces the market share of the least responsible companies. This stimulates them to achieve firstly SDG12, then SDG9, and then SDG11 while increasing corporate social responsibility, which finally increases sales and market share.
The theoretical significance of the obtained results lies in the fact that, for the first time, they formed a holistic and convincing logical explanation of the relationship between the financial risks of the business and corporate social responsibility in the conditions of market instability. The implementation of the SDGs has successfully fulfilled the role of explaining the patterns of consistent changes in the magnitude of financial risks and the level of corporate social responsibility, which were previously considered chaotic and uncertain.
The practical significance of the author’s conclusions and proposed recommendations lies in the fact that they revealed a sequence that allows reducing the financial risks of the business through increasing corporate social responsibility in the implementation of the SDGs. The significance of the findings for business is that they offered a more promising benchmark for managing the financial risks of the business.
Due to the author’s recommendations proposed in this article, the implementation of the managers’ motives for altruism will be replaced by the implementation of the SDGs, which will balance the interests of business and the interests of society. This will allow responsible companies to find a new Pareto optimum in the current conditions of uncertainty and determine for themselves the preferred level of corporate social responsibility, which allows them to effectively manage the financial risks of the business in the long term.
The limitation of the study is that it focuses on the experience of large businesses, and the experience of small and medium-sized businesses was left outside the scope of this article. As you know, small and medium-sized businesses have certain characteristics, in particular, much more limited financial opportunities compared to large businesses. Therefore, in future studies, it is advisable to pay attention to the links between corporate social responsibility and the financial risks of small and medium-sized businesses, and, most likely, these links will turn out to be specific. In particular, it is important to find out whether these links can be explained through the prism of the SDGs by analogy with big business or to find another basis for a logical explanation of this link in small and medium-sized businesses.
Author Contributions
Conceptualization, D.E.M., Y.S.P. and N.K.S.; methodology, D.E.M., Y.S.P. and N.K.S.; formal analysis, D.E.M., Y.S.P. and N.K.S.; investigation, D.E.M., Y.S.P. and N.K.S.; writing—original draft preparation, D.E.M., Y.S.P. and N.K.S.; writing—review and editing, D.E.M., Y.S.P. and N.K.S. All authors have read and agreed to the published version of the manuscript.
Funding
The reported study was funded by RFBR according to research project No. 18-29-16132.
Institutional Review Board Statement
Not applicable.
Informed Consent Statement
Not applicable.
Conflicts of Interest
The authors declare no conflict of interest.
Appendix A

Table A1.
Country and industry characteristics of the sample, as well as Corporate Knights’ Index of the world’s greenest firms in 2020–2021, %.
Table A1.
Country and industry characteristics of the sample, as well as Corporate Knights’ Index of the world’s greenest firms in 2020–2021, %.
| Company | Country | Sector | Industry | Corporate Knights’ Index of the World’s Greenest Firms, % | |
|---|---|---|---|---|---|
| 2022 | 2021 | ||||
| Adidas AG | Germany | Consumer Discretionary | Apparel/Accessories | 59.6 | 45 |
| Allianz SE | Germany | Financials | - | 67.4 | 40 |
| Alphabet Inc. | USA | Information Technology | Diversified Insurance | 55.8 | 55 |
| Alstom SA | France | Industrials | Regional Banks | 69.2 | 60 |
| Analog Devices Inc. | USA | Information Technology | Investment Services | 60.2 | 50 |
| Banco do Brasil SA | Brazil | Financials | Regional Banks | 81.7 | 65 |
| Bank of Montreal | Canada | Financials | Major Banks | 67.5 | 45 |
| BNP Paribas SA | France | Financials | Medical Equipment and Supplies | 67.6 | 45 |
| Byd Co., Ltd. | China | Consumer Discretionary | Beverages | 55 | 25 |
| Canadian Tire Corporation Ltd. | Canada | Consumer Discretionary | Food Processing | 51.5 | 30 |
| Cisco Systems Inc. | USA | Information Technology | Household/Personal Care | 75.8 | 60 |
| Henkel AG & Co. KgaA | Germany | Consumer Staples | Beverages | 56.3 | 50 |
| HP Inc. | USA | Information Technology | Real Estate | 67.2 | 55 |
| Iberdrola SA | Spain | Utilities | Property and Casualty Insurance | 72.8 | 65 |
| ING Groep NV | Netherlands | Financials | Regional Banks | 69.6 | 50 |
| Intel Corp. | USA | Information Technology | Iron and Steel | 64.1 | 50 |
| Intesa Sanpaolo SpA | Italy | Financials | Investment Services | 64.8 | 40 |
| Johnson Controls International PLC | Ireland | Consumer Discretionary | - | 69.4 | 65 |
| Kering SA | France | Consumer Discretionary | Regional Banks | 78.4 | 65 |
| Kesko Oyj | Finland | Consumer Staples | Regional Banks | 56.8 | 50 |
| Lenovo Group Ltd. | China | Information Technology | Life and Health Insurance | 59.3 | 40 |
| National Australia Bank Ltd. | Australia | Financials | Electronics | 67.8 | 50 |
| Neste Oyj | Finland | Computer Services | 80.7 | 65 | |
| Ørsted A/S | Denmark | Energy | Consumer Financial Services | 82.7 | 70 |
| Prologis Inc. | USA | Financials | Diversified Chemicals | 59.3 | 50 |
| Samsung SDI Co., Ltd. | South Korea | Information Technology | Regional Banks | 64 | 55 |
| Sanofi SA | France | Health Care | Electronics | 62.9 | 50 |
| SAP SE | Germany | Information Technology | Regional Banks | 57.3 | 50 |
| Schneider Electric SE | France | Industrials | Investment Services | 83.2 | 75 |
| Sekisui Chemical Co., Ltd. | Japan | Industrials | - | 67 | 65 |
| Storebrand ASA | Norway | Financials | Iron and Steel | 75.2 | 50 |
| Telus Corp. | Canada | Telecommunication Services | - | 66 | 55 |
| Tesla Inc. | USA | Consumer Discretionary | Auto and Truck Parts | 53.7 | 55 |
| Unilever PLC | UK | Consumer Staples | Household/Personal Care | 59.2 | 45 |
| Verbund AG | Austria | Utilities | - | 71.8 | 55 |
| Vestas Wind Systems A/S | Denmark | Industrials | Telecommunications services | 72.6 | 75 |
| Workday Inc. | USA | Information Technology | Computer Hardware | 55 | 55 |
Source: Corporate Knights (2022a, 2022b).
Table A2.
Financial performance of companies in the sample in 2020–2021, %.
| Company | 2021 | 2020 | 2019 | |||||||||
|---|---|---|---|---|---|---|---|---|---|---|---|---|
| Sales | Profit | Assets | Market Value | Sales | Profit | Assets | Market Value | Sales | Profits | Assets | Market Value | |
| Adidas AG | 25.1 | 2.5 | 25.17 | 41.08 | 22.6 | 0.4936 | 25.8 | 64.9 | 25 | 1.5 | 22.8 | 44.9 |
| Allianz SE | 138.62 | 7.81 | 1324.62 | 96.42 | 129.9 | 7.8 | 1357.5 | 108 | 122.4 | 8.9 | 1183.5 | 77.1 |
| Alphabet Inc. | 257.49 | 76.03 | 359.27 | 1581.72 | 182.4 | 40.3 | 319.6 | 1538.9 | 166.3 | 34.5 | 273.4 | 919.3 |
| Alstom SA | 15.19 | 0.657 | 35.15 | 8.76 | 8.5 | 0.441 | 15.2 | 20 | 9.3 | 0.3733 | 14.1 | 9.2 |
| Analog Devices Inc. | 8.44 | 1.28 | 51.22 | 81.25 | 5.9 | 1.4 | 21.4 | 58.8 | 5.8 | 1.2 | 21.4 | 40.4 |
| Banco do Brasil SA | 29.54 | 3.4 | 362.53 | 20.7 | 24 | 2.3 | 314 | 15.1 | 42 | 3.8 | 359.5 | 14.7 |
| Bank of Montreal | 26.53 | 6.92 | 804.51 | 72.74 | 24.5 | 4.1 | 761.8 | 59.4 | 29.1 | 4.4 | 665.2 | 32.6 |
| BNP Paribas SA | 127.42 | 9.85 | 2995.89 | 68.76 | 102.7 | 7.6 | 3044.8 | 79.1 | 128 | 8.7 | 2429.9 | 39.2 |
| Byd Co., Ltd. | 32.78 | 0.4696 | 46.55 | 84.46 | 22.3 | 0.5847 | 30.9 | 64.9 | 17.6 | 0.2366 | 28.2 | 17.2 |
| Canadian Tire Corporation Ltd. | 12.99 | 0.8994 | 17.26 | 8.57 | 11.1 | 0.5605 | 16 | 9.5 | 11 | 0.5866 | 15.1 | 4.3 |
| Cisco Systems Inc. | 51.55 | 11.82 | 94.26 | 213.36 | 48 | 10.1 | 95.6 | 222.9 | 51.6 | 0.111 | 90.4 | 179.7 |
| Henkel AG & Co. KgaA | 23.72 | 1.93 | 37.8 | 28.33 | 21.9 | 1.6 | 37.7 | 51.5 | 22.5 | 2.3 | 35.9 | 38.5 |
| HP Inc. | 64.98 | 6.52 | 38.91 | 38.75 | 57.7 | 3.2 | 34.7 | 42.6 | 58.4 | 3 | 31.7 | 22.2 |
| Iberdrola SA | 46.23 | 4.63 | 161.2 | 70.26 | 37.8 | 4.1 | 149.9 | 86.4 | 39.7 | 4.1 | 136.6 | 62.5 |
| ING Group NV | 21.49 | 5.65 | 1081.81 | 39.03 | 20.1 | 2.8 | 116.8 | 49.3 | 20.5 | 5.4 | 1001 | 21.4 |
| Intel Corp | 79.02 | 19.87 | 168.41 | 190.29 | 77.9 | 20.9 | 153.1 | 563.7 | 75.7 | 22.7 | 147.7 | 254 |
| Intesa Sanpaolo SpA | 47.84 | 4.95 | 1215.67 | 41.42 | 45.8 | 3.7 | 1,226.7 | 53.3 | 41.3 | 4.7 | 916.1 | 27.3 |
| Johnson Controls International PLC | 24.19 | 1.57 | 42.22 | 44.22 | 22.1 | 0.923 | 41.4 | 45 | 24.1 | 0.278 | 42.5 | 22.2 |
| Kering SA | 20.86 | 3.75 | 35.33 | 70.75 | 14.9 | 2.5 | 34.3 | 95 | 17.8 | 2.4 | 30.5 | 63 |
| Kesko Oyj | 13.36 | 0.6759 | 7.92 | 10.53 | 12.2 | 0.4941 | 8.1 | 12.2 | 12.1 | 0.372 | 7.7 | 6.5 |
| Lenovo Group Ltd. | 70.56 | 1.88 | 45.65 | 11.89 | 55.7 | 0.9606 | 38.6 | 16.8 | 51.8 | 0.7405 | 35 | 6.5 |
| National Australia Bank Ltd. | 15.76 | 4.78 | 669.03 | 77.24 | 18.4 | 1.7 | 621.3 | 68.1 | 21.4 | 2.3 | 567.8 | 32 |
| Neste Oyj | 17.91 | 2.03 | 14.19 | 36.31 | 89.9 | 13 | 140.3 | 333.2 | 93.1 | 12.7 | 132.1 | 304.1 |
| Orsted A/S | 10.99 | 1.62 | 41.34 | 49.11 | 5.7 | 2.3 | 32.3 | 66.8 | 8.1 | 1.3 | 28.5 | 42.5 |
| Prologis Inc. | 4.83 | 3.72 | 59.78 | 126.34 | 4.4 | 1.5 | 56.1 | 84.2 | 3.5 | 1.7 | 55 | 65.9 |
| Samsung SDI Co., Ltd. | 11.84 | 1.02 | 21.73 | 32.16 | 9.6 | 0.4871 | 19.8 | 41.6 | 8.6 | 0.2596 | 17.2 | 15.7 |
| Sanofi SA | 44.63 | 7.36 | 136.74 | 136.86 | 41.1 | 14 | 140.1 | 127.4 | 40.4 | 3.3 | 126.5 | 122.5 |
| SAP SE | 33.18 | 5.64 | 80.93 | 124.02 | 31.7 | 6.3 | 71.5 | 164.2 | 31.1 | 4.7 | 69.1 | 142.4 |
| Schneider Electric SE | 34.16 | 3.79 | 62.03 | 85.36 | 28.7 | 2.4 | 60.5 | 91.3 | 30.4 | 2.7 | 50.5 | 50.4 |
| Sekisui Chemical Co., Ltd. | 23.39 | 1.39 | 24.31 | 11.78 | 10 | 0.37 | 11.1 | 8.8 | 10.4 | 0.542 | 10.2 | 5.9 |
| Storebrand ASA | 13.77 | 0.3632 | 87.86 | 4.54 | 8.6 | 0.2491 | 85 | 4.7 | 9.6 | 0.2347 | 72 | 2.3 |
| Telus Corp. | 13.43 | 1.32 | 37.99 | 36.05 | 11.4 | 0.8999 | 34 | 28.1 | 11 | 1.3 | 29.3 | 20.7 |
| Tesla Inc. | 53.82 | 5.52 | 62.13 | 1038.73 | 31.5 | 0.69 | 52.1 | 710.1 | 26 | −0.1443 | 37.3 | 144.2 |
| Unilever PLC | 62 | 7.15 | 85.4 | 116.16 | 57.8 | 6.3 | 82.8 | 151.1 | 58.2 | 6.3 | 72.7 | 130.6 |
| Verbund AG | 5.65 | 1.03 | 19.46 | 35.6 | 3.7 | 0.7198 | 14.7 | 27.5 | 4.4 | 0.621 | 13.3 | 15.7 |
| Vestas Wind Systems A/S | 18.42 | 0.1974 | 22.42 | 28.23 | 16.9 | 0.8705 | 22.2 | 40.1 | 13.6 | 0.788 | 16.1 | 16.8 |
| Workday Inc. | 5.15 | 0.294 | 10.5 | 51.74 | 4.3 | −0.2824 | 8.7 | 62.3 | 3.6 | −0.4807 | 6.8 | 36.1 |
References
- Amiri, Mohamed Marouen, Kamel Naoui, Abdelkader Derbali, and Mounir Ben Sassi. 2020. Investor sentiment and the risk-return tradeoff. International Journal of Financial Engineering 7: 2050043. [Google Scholar] [CrossRef]
- Bannier, Christina E., Yannik Bofinger, and Björn Rock. 2022. Doing Safe by Doing Good: Non-Financial Reporting and the Risk Effects of Corporate Social Responsibility. European Accounting Review. [Google Scholar] [CrossRef]
- Berzon, Nikolai I., Maksim M. Novikov, Elena L. Pozharskaya, and Yulia I. Bakhturina. 2022. Monitoring the Modern Experience of Financial Risk Management in Russia Based on Corporate Social Responsibility for Sustainable Development. Risks 10: 92. [Google Scholar] [CrossRef]
- Bogoviz, Aleksei V., Svetlana V. Lobova, and Alexander N. Alekseev. 2022. The Concept of Corporate Social Responsibility Based on Integrating the SDGs into Corporate Strategies: International Experience and the Risks for Profit. Risks 10: 117. [Google Scholar] [CrossRef]
- Capelli, Paolo, Federica Ielasi, and Angeloantonio Russo. 2021. Forecasting volatility by integrating financial risk with environmental, social, and governance risk. Corporate Social Responsibility and Environmental Management 28: 1483–95. [Google Scholar] [CrossRef]
- Chen, Haibei, and Xianglian Zhao. 2022. Green financial risk management based on intelligence service. Journal of Cleaner Production 364: 132617. [Google Scholar] [CrossRef]
- Cincinelli, Peter, Elisabetta Pellini, and Giovanni Urga. 2022. Systemic risk in the Chinese financial system: A panel Granger causality analysis. International Review of Financial Analysis 82: 102179. [Google Scholar] [CrossRef]
- Corporate Knights. 2022a. 2021 Global 100: Which Companies Earned a Spot on Corporate Knights’ Index of the World’s Most Sustainable Corporations? Available online: https://www.corporateknights.com/rankings/global-100-rankings/2021-global-100-rankings/2021-global-100-ranking/ (accessed on 8 July 2022).
- Corporate Knights. 2022b. 2022 Global 100: The 100 Most Sustainable Corporations of 2022. Available online: https://www.corporateknights.com/rankings/global-100-rankings/2022-global-100-rankings/100-most-sustainable-corporations-of-2022/ (accessed on 8 July 2022).
- Derbali, Abdelkader, and Lamia Jamel. 2019. Dependence of Default Probability and Recovery Rate in Structural Credit Risk Models: Case of Greek Banks. Journal of the Knowledge Economy 10: 711–33. [Google Scholar] [CrossRef] [Green Version]
- Efimov, Andrey V., Anna V. Savtsova, Olga N. Pakova, Yuliya N. Dyakova, and Alfiia A. Sokolova. 2021. Trend analysis in the use of artificial intelligence in financial management. In Advances in Research on Russian Business and Management. Charlotte: Information Age Publishing, pp. 517–25. [Google Scholar]
- Ejaz, Rimsha, Sumaira Ashraf, Arshad Hassan, and Ankit Gupta. 2022. An empirical investigation of market risk, dependence structure, and portfolio management between green bonds and international financial markets. Journal of Cleaner Production 365: 132666. [Google Scholar] [CrossRef]
- Fang, Hanqing “Chevy”, Yulin Shi, and Zhenyu Wu. 2021. Familial altruism and reputation risk: Evidence from China. China Finance Review International 11: 437–48. [Google Scholar] [CrossRef]
- Forbes. 2022. The Global 2022. Available online: https://www.forbes.com/lists/global2000/?sh=7726c4515ac0 (accessed on 8 July 2022).
- Fritz-Morgenthal, Sebastian, Bernhard Hein, and Jochen Papenbrock. 2022. Financial Risk Management and Explainable, Trustworthy, Responsible AI. Frontiers in Artificial Intelligence 5: 779799. [Google Scholar] [CrossRef]
- He, Miao, and Yanhong Guo. 2022. Systemic Risk Contributions of Financial Institutions during the Stock Market Crash in China. Sustainability 14: 5292. [Google Scholar] [CrossRef]
- Ho, Shirley J., and Cheng-Li Huang. 2018. Reply to “Modeling Managerial Altruism, CSR, and Donations: A Comment”. Managerial and Decision Economics 39: 591. [Google Scholar] [CrossRef]
- In, Soh Young, Berk Manav, Clothilde M. A. Venereau, Luis Enrique Cruz R., and John P. Weyant. 2022. Climate-related financial risk assessment on energy infrastructure investments. Renewable and Sustainable Energy Reviews 167: 112689. [Google Scholar] [CrossRef]
- Jegers, Marc. 2018. Modeling managerial altruism, CSR, and donations: A comment. Managerial and Decision Economics 39: 425–26. [Google Scholar] [CrossRef]
- Kharlanov, Alexey S., Yuliya V. Bazhdanova, Teimuraz A. Kemkhashvili, and Natalia G. Sapozhnikova. 2022. The Case Experience of Integrating the SDGs into Corporate Strategies for Financial Risk Management Based on Social Responsibility (with the Example of Russian TNCs). Risks 10: 12. [Google Scholar] [CrossRef]
- Khoruzhy, Liudmila I., Valery I. Khoruzhy, Bogdan S. Vasyakin, and Wenhao Shen. 2022. Program-Targeted Approach to Managing Financial Risks of Sustainable Development Based on Corporate Social Responsibility in the Decade of Action. Risks 10: 58. [Google Scholar] [CrossRef]
- Kotek, Klaus, Alina M. Schoenberg, and Christopher Schwand. 2018. CSR Behavior: Between Altruism and Profit Maximization. In Innovation Management and Corporate Social Responsibility. CSR, Sustainability, Ethics and Governance; Edited by Samuel O. Idowu and René Schmidpeter. Cham: Springer, pp. 159–69. [Google Scholar] [CrossRef]
- Landi, Giovanni Catello, Francesca Iandolo, Antonio Renzi, and Andrea Rey. 2022. Embedding sustainability in risk management: The impact of environmental, social, and governance ratings on corporate financial risk. Corporate Social Responsibility and Environmental Management 29: 1096–107. [Google Scholar] [CrossRef]
- Lebedev, Vladimir V., Nelia A. Deberdeeva, Natalya A. Farkova, and Larisa S. Korobeinikova. 2022. Systemic Risk Management of Investments in Innovation Based on CSR. Risks 10: 87. [Google Scholar] [CrossRef]
- Liu, Bai, Tao Ju, and Simon S. S. Gao. 2021. The combined effects of innovation and corporate social responsibility on firm financial risk. Journal of International Financial Management and Accounting 32: 283–310. [Google Scholar] [CrossRef]
- Matytsin, Denis E. 2022. Blockchain turnover of securities placed for financing foreign trade transactions by the business entities under the jurisdiction of the EEU and BRICS. In Advances in Research on Russian Business and Management. Charlotte: Information Age Publishing, pp. 363–73. [Google Scholar]
- Osipov, Vladimir S., Yuriy A. Krupnov, Galina N. Semenova, and Maria V. Tkacheva. 2022. Ecologically Responsible Entrepreneurship and Its Contribution to the Green Economy’s Sustainable Development: Financial Risk Management Prospects. Risks 10: 44. [Google Scholar] [CrossRef]
- Popkova, Elena G., and Bruno S. Sergi. 2021. Dataset Modelling of the Financial Risk Management of Social Entrepreneurship in Emerging Economies. Risks 9: 211. [Google Scholar] [CrossRef]
- Sun, Yanlin, Siyu Liu, and Shoudong Chen. 2022. Fund style drift and stock price crash risk—Analysis of the mediating effect based on corporate financial risk. China Finance Review International. [Google Scholar] [CrossRef]
- Szczepankiewicz, Elżbieta Izabela, Windham Eugene Loopesko, and Farid Ullah. 2022. A Model of Risk Information Disclosures in Non-Financial Corporate Reports of Socially Responsible Energy Companies in Poland. Energies 15: 2601. [Google Scholar] [CrossRef]
- Tafakori, Laleh, Armin Pourkhanali, and Riccardo Rastelli. 2022. Measuring systemic risk and contagion in the European financial network. Empirical Economics 63: 345–89. [Google Scholar] [CrossRef]
- Tarighi, Hossein, Andrea Appolloni, Ali Shirzad, and Abdullah Azad. 2022. Corporate Social Responsibility Disclosure (CSRD) and Financial Distressed Risk (FDR): Does Institutional Ownership Matter? Sustainability 14: 742. [Google Scholar] [CrossRef]
- Vagin, Sergei G., Elena I. Kostyukova, Natalia E. Spiridonova, and Tatiana M. Vorozheykina. 2022. Financial Risk Management Based on Corporate Social Responsibility in the Interests of Sustainable Development. Risks 10: 35. [Google Scholar] [CrossRef]
- Yankovskaya, Veronika V., Timur A. Mustafin, Dmitry A. Endovitsky, and Artem V. Krivosheev. 2022. Corporate Social Responsibility as an Alternative Approach to Financial Risk Management: Advantages for Sustainable Development. Risks 10: 106. [Google Scholar] [CrossRef]
- Zhang, Huang, and Yonghui Luo. 2022. Enterprise Financial Risk Early Warning Using BP Neural Network under Internet of Things and Rough Set Theory. Journal of Interconnection Networks 22: 2145019. [Google Scholar] [CrossRef]
- Zhilkina, Anna N., Marina V. Karp, Anna V. Bodiako, Samal M. Smagulova, Tatiana M. Rogulenko, and Svetlana V. Ponomareva. 2022. Socially-Oriented Approach to Financial Risk Management as the Basis of Support for the SDGs in Entrepreneurship. Risks 10: 42. [Google Scholar] [CrossRef]
Figure 1.
Structural equation model path diagram used in the article. Source: developed and compiled by the authors.
Figure 1.
Structural equation model path diagram used in the article. Source: developed and compiled by the authors.

Figure 2.
Geographical structure of the companies in the sample (by country—on the left and by region of the world—on the right). Source: calculated and built by the authors.
Figure 2.
Geographical structure of the companies in the sample (by country—on the left and by region of the world—on the right). Source: calculated and built by the authors.

Figure 3.
Structure of sample companies by industry (left) and by country category (developed and developing countries: right). Source: calculated and built by the authors.
Figure 3.
Structure of sample companies by industry (left) and by country category (developed and developing countries: right). Source: calculated and built by the authors.

Figure 4.
Structural equation modeling (SEM) result. Source: developed and compiled by the authors.

Figure 5.
Systemic relationship between corporate social responsibility and financial risks of the business in terms of sustainable development. Source: developed and compiled by the authors.
Figure 5.
Systemic relationship between corporate social responsibility and financial risks of the business in terms of sustainable development. Source: developed and compiled by the authors.

Table 1.
Dynamics of financial risks (FR) in 2010–2021.
| Period | Sales | Profit | Assets | Market Value | General Financial Risks |
|---|---|---|---|---|---|
| 2021/2020 | −2.60 | 7.26 | 0.53 | 0.00 | 1.30 |
| 2020/2019 | −0.11 | −9.23 | 1.86 | −24.02 | −7.87 |
| 2019/2018 | −0.39 | 7.64 | −2.12 | −1.64 | 0.87 |
| 2018/2017 | 1.40 | −9.74 | 1.35 | 2.54 | −1.11 |
| 2017/2016 | 2.54 | 69.91 | 287.67 | 64.06 | 106.05 |
| 2016/2015 | 64.06 | 23.95 | 21.57 | 8.76 | 29.58 |
| 2015/2014 | 48.31 | −23.15 | 2708.20 | 0.42 | 683.44 |
| 2014/2013 | 11.96 | 9.88 | 934.15 | 5.93 | 240.48 |
| 2013/2012 | 56.82 | 338.68 | 5945.81 | −0.08 | 1585.31 |
| 2012/2011 | 69.59 | 530.28 | 1226.61 | −3.81 | 455.67 |
| 2011/2010 | −1.72 | 40,589.88 | −6.15 | 4.38 | 10,146.60 |
Source: calculated and compiled by the authors.
Table 2.
Regression analysis of the dependence of the level of corporate social responsibility on the magnitude of financial risks in 2020–2021.
Table 2.
Regression analysis of the dependence of the level of corporate social responsibility on the magnitude of financial risks in 2020–2021.
| Regression statistics | ||||||
| Multiple R | 0.5095 | |||||
| R-square | 0.2596 | |||||
| Adjusted R-square | 0.2167 | |||||
| Standard error | 10.4805 | |||||
| Observations | 74 | |||||
| Analysis of variance | ||||||
| df | SS | MS | F | Significance F | ||
| Regression | 4 | 2657.1102 | 664.2776 | 6.0476 | 0.0003 | |
| Surplus | 69 | 7579.0649 | 109.8415 | |||
| Total | 73 | 10,236.1751 | ||||
| Coefficients | Standard error | t-statistic | p-Value | Lower 95% | Upper 95% | |
| Y-intersection | 62.0700 | 1.5163 | 40.9348 | 0.0000 | 59.0451 | 65.0950 |
| Sales (RDre1) | 0.0498 | 0.0430 | 1.1582 | 0.2508 | −0.0360 | 0.1355 |
| Profit (RDre2) | −0.0002 | 0.0012 | −0.1738 | 0.8625 | −0.0025 | 0.0021 |
| Assets (RDre3) | 0.0046 | 0.0125 | 0.3664 | 0.7152 | −0.0204 | 0.0296 |
| Market Value (RDre4) | −0.0765 | 0.0166 | −4.6179 | 0.0000 | −0.1096 | −0.0435 |
Source: calculated and compiled by the authors.
Table 3.
Regression analysis of the dependence of the risk of revenue reduction on the level of corporate social responsibility in 2020–2021.
Table 3.
Regression analysis of the dependence of the risk of revenue reduction on the level of corporate social responsibility in 2020–2021.
| Regression statistics | ||||||
| Multiple R | 0.1626 | |||||
| R-square | 0.0264 | |||||
| Adjusted R-square | 0.0129 | |||||
| Standard error | 28.8963 | |||||
| Observations | 74 | |||||
| ANOVA | ||||||
| Df | SS | MS | F | Significance F | ||
| Regression | 1 | 1633.1310 | 1633.1310 | 1.9559 | 0.1662 | |
| Residual | 72 | 60,119.6975 | 834.9958 | |||
| Total | 73 | 61,752.8285 | ||||
| Coefficients | Standard error | t-Stat | p-Value | Lower 95% | Upper 95% | |
| Y-intercept | −12.5130 | 17.3809 | −0.7199 | 0.4739 | −47.1612 | 22.1353 |
| Corporate Knights’ index of the world’s greenest firms | 0.3994 | 0.2856 | 1.3985 | 0.1662 | −0.1699 | 0.9688 |
Source: authors.
Table 4.
Regression analysis of the dependence of the risk of profit reduction on the level of corporate social responsibility in 2020–2021.
Table 4.
Regression analysis of the dependence of the risk of profit reduction on the level of corporate social responsibility in 2020–2021.
| Regression statistics | ||||||
| Multiple R | 0.0061 | |||||
| R-square | 0.0000 | |||||
| Adjusted R-square | −0.0139 | |||||
| Standard error | 1058.4841 | |||||
| Observations | 74 | |||||
| ANOVA | ||||||
| df | SS | MS | F | Significance F | ||
| Regression | 1 | 2994.7323 | 2994.7323 | 0.0027 | 0.9589 | |
| Residual | 72 | 80,667,974.6405 | 1,120,388.5367 | |||
| Total | 73 | 80,670,969.3728 | ||||
| Coefficients | Standard error | t-Stat | p-Value | Lower 95% | Upper 95% | |
| Y-intercept | 123.2130 | 636.6708 | 0.1935 | 0.8471 | −1145.9670 | 1392.3929 |
| Corporate Knights’ index of the world’s greenest firms | 0.5409 | 10.4620 | 0.0517 | 0.9589 | −20.3148 | 21.3965 |
Source: authors.
Table 5.
Regression analysis of the dependence of the risk of the reduction of the value of assets on the level of corporate social responsibility in 2020–2021.
Table 5.
Regression analysis of the dependence of the risk of the reduction of the value of assets on the level of corporate social responsibility in 2020–2021.
| Regression statistics | ||||||
| Multiple R | 0.0927 | |||||
| R-square | 0.0086 | |||||
| Adjusted R-square | −0.0052 | |||||
| Standard error | 99.7953 | |||||
| Observations | 74 | |||||
| ANOVA | ||||||
| df | SS | MS | F | Significance F | ||
| Regression | 1 | 6213.5377 | 6213.5377 | 0.6239 | 0.4322 | |
| Residual | 72 | 717,055.5371 | 9959.1047 | |||
| Total | 73 | 723,269.0748 | ||||
| Coefficients | Standard error | t-Stat | p-Value | Lower 95% | Upper 95% | |
| Y-intercept | −22.6041 | 60.0262 | −0.3766 | 0.7076 | −142.2642 | 97.0559 |
| Corporate Knights’ index of the world’s greenest firms | 0.7791 | 0.9864 | 0.7899 | 0.4322 | −1.1872 | 2.7454 |
Source: authors.
Table 6.
Regression analysis of the dependence of the risk of reduction of market share on the level of corporate social responsibility in 2020–2021.
Table 6.
Regression analysis of the dependence of the risk of reduction of market share on the level of corporate social responsibility in 2020–2021.
| Regression statistics | ||||||
| Multiple R | 0.4909 | |||||
| R-square | 0.2410 | |||||
| Adjusted R-square | 0.2305 | |||||
| Standard error | 65.3215 | |||||
| Observations | 74 | |||||
| ANOVA | ||||||
| df | SS | MS | F | Significance F | ||
| Regression | 1 | 97,552.0356 | 97,552.0356 | 22.8625 | 8.96259 × 10⁻⁶ | |
| Residual | 72 | 307,216.3565 | 4266.8938 | |||
| Total | 73 | 404,768.3920 | ||||
| Coefficients | Standard error | t-Stat | p-Value | Lower 95% | Upper 95% | |
| Y-intercept | 223.5907 | 39.2904 | 5.6907 | 0.0000 | 145.2667 | 301.9146 |
| Corporate Knights’ index of the world’s greenest firms | −3.0871 | 0.6456 | −4.7815 | 0.0000 | −4.3741 | −1.8000 |
Source: authors.
Table 7.
Comparative analysis of the obtained results with the existing literature.
| Comparison Criterion | Existing Literature | Obtained New Scientific Results | |
|---|---|---|---|
| Scientific Position | Literature Sources | ||
| The nature of the relationship between financial risks and corporate social responsibility | Linear dependence of corporate social responsibility on financial risks:
|
| A complex systemic connection of financial risks not only with corporate social responsibility but also with each other: in some cases—direct, in other cases—reverse. |
| The reason for the change in the level of corporate social responsibility in conditions of instability |
|
| Market incentives to increase the level of corporate social responsibility (it is necessary to increase financial risks, in particular, reduce the market share). |
Source: developed and compiled by the authors.
Publisher’s Note: MDPI stays neutral with regard to jurisdictional claims in published maps and institutional affiliations. |
© 2022 by the authors. Licensee MDPI, Basel, Switzerland. This article is an open access article distributed under the terms and conditions of the Creative Commons Attribution (CC BY) license (https://creativecommons.org/licenses/by/4.0/).
Share and Cite
MDPI and ACS Style
Matytsin, D.E.; Petrenko, Y.S.; Saveleva, N.K. Corporate Social Responsibility in Terms of Sustainable Development: Financial Risk Management Implications. Risks 2022, 10, 206. https://doi.org/10.3390/risks10110206
AMA Style
Matytsin DE, Petrenko YS, Saveleva NK. Corporate Social Responsibility in Terms of Sustainable Development: Financial Risk Management Implications. Risks. 2022; 10(11):206. https://doi.org/10.3390/risks10110206
Chicago/Turabian StyleMatytsin, Denis E., Yelena S. Petrenko, and Nadezhda K. Saveleva. 2022. "Corporate Social Responsibility in Terms of Sustainable Development: Financial Risk Management Implications" Risks 10, no. 11: 206. https://doi.org/10.3390/risks10110206
Note that from the first issue of 2016, this journal uses article numbers instead of page numbers. See further details here.