1. Introduction
Several mountainous regions of Pakistan are vulnerable to flash floods, which are considered catastrophic torrents [
1]. During the monsoon of 2022, Pakistan experienced its worst flood in the past ten years due to extreme rains. According to Pakistan’s National Disaster Management Authority, approximately 1100 people were killed, 33 million were affected, and 1 million homes were destroyed or damaged by the floods. The worst flooding occurred along the Indus River in Punjab, Khyber Pakhtunkhwa, Balochistan, and Sindh. Approximately 150 bridges and 3500 km (2200 miles) of roads have been destroyed across the country, according to Relief Web. In addition, 2 million acres of crops and orchards, as well as more than 107,000 animals, have been destroyed. In the DG Khan District, 342 villages were damaged, 80 union councils were flooded, and 699,502 people were directly affected.
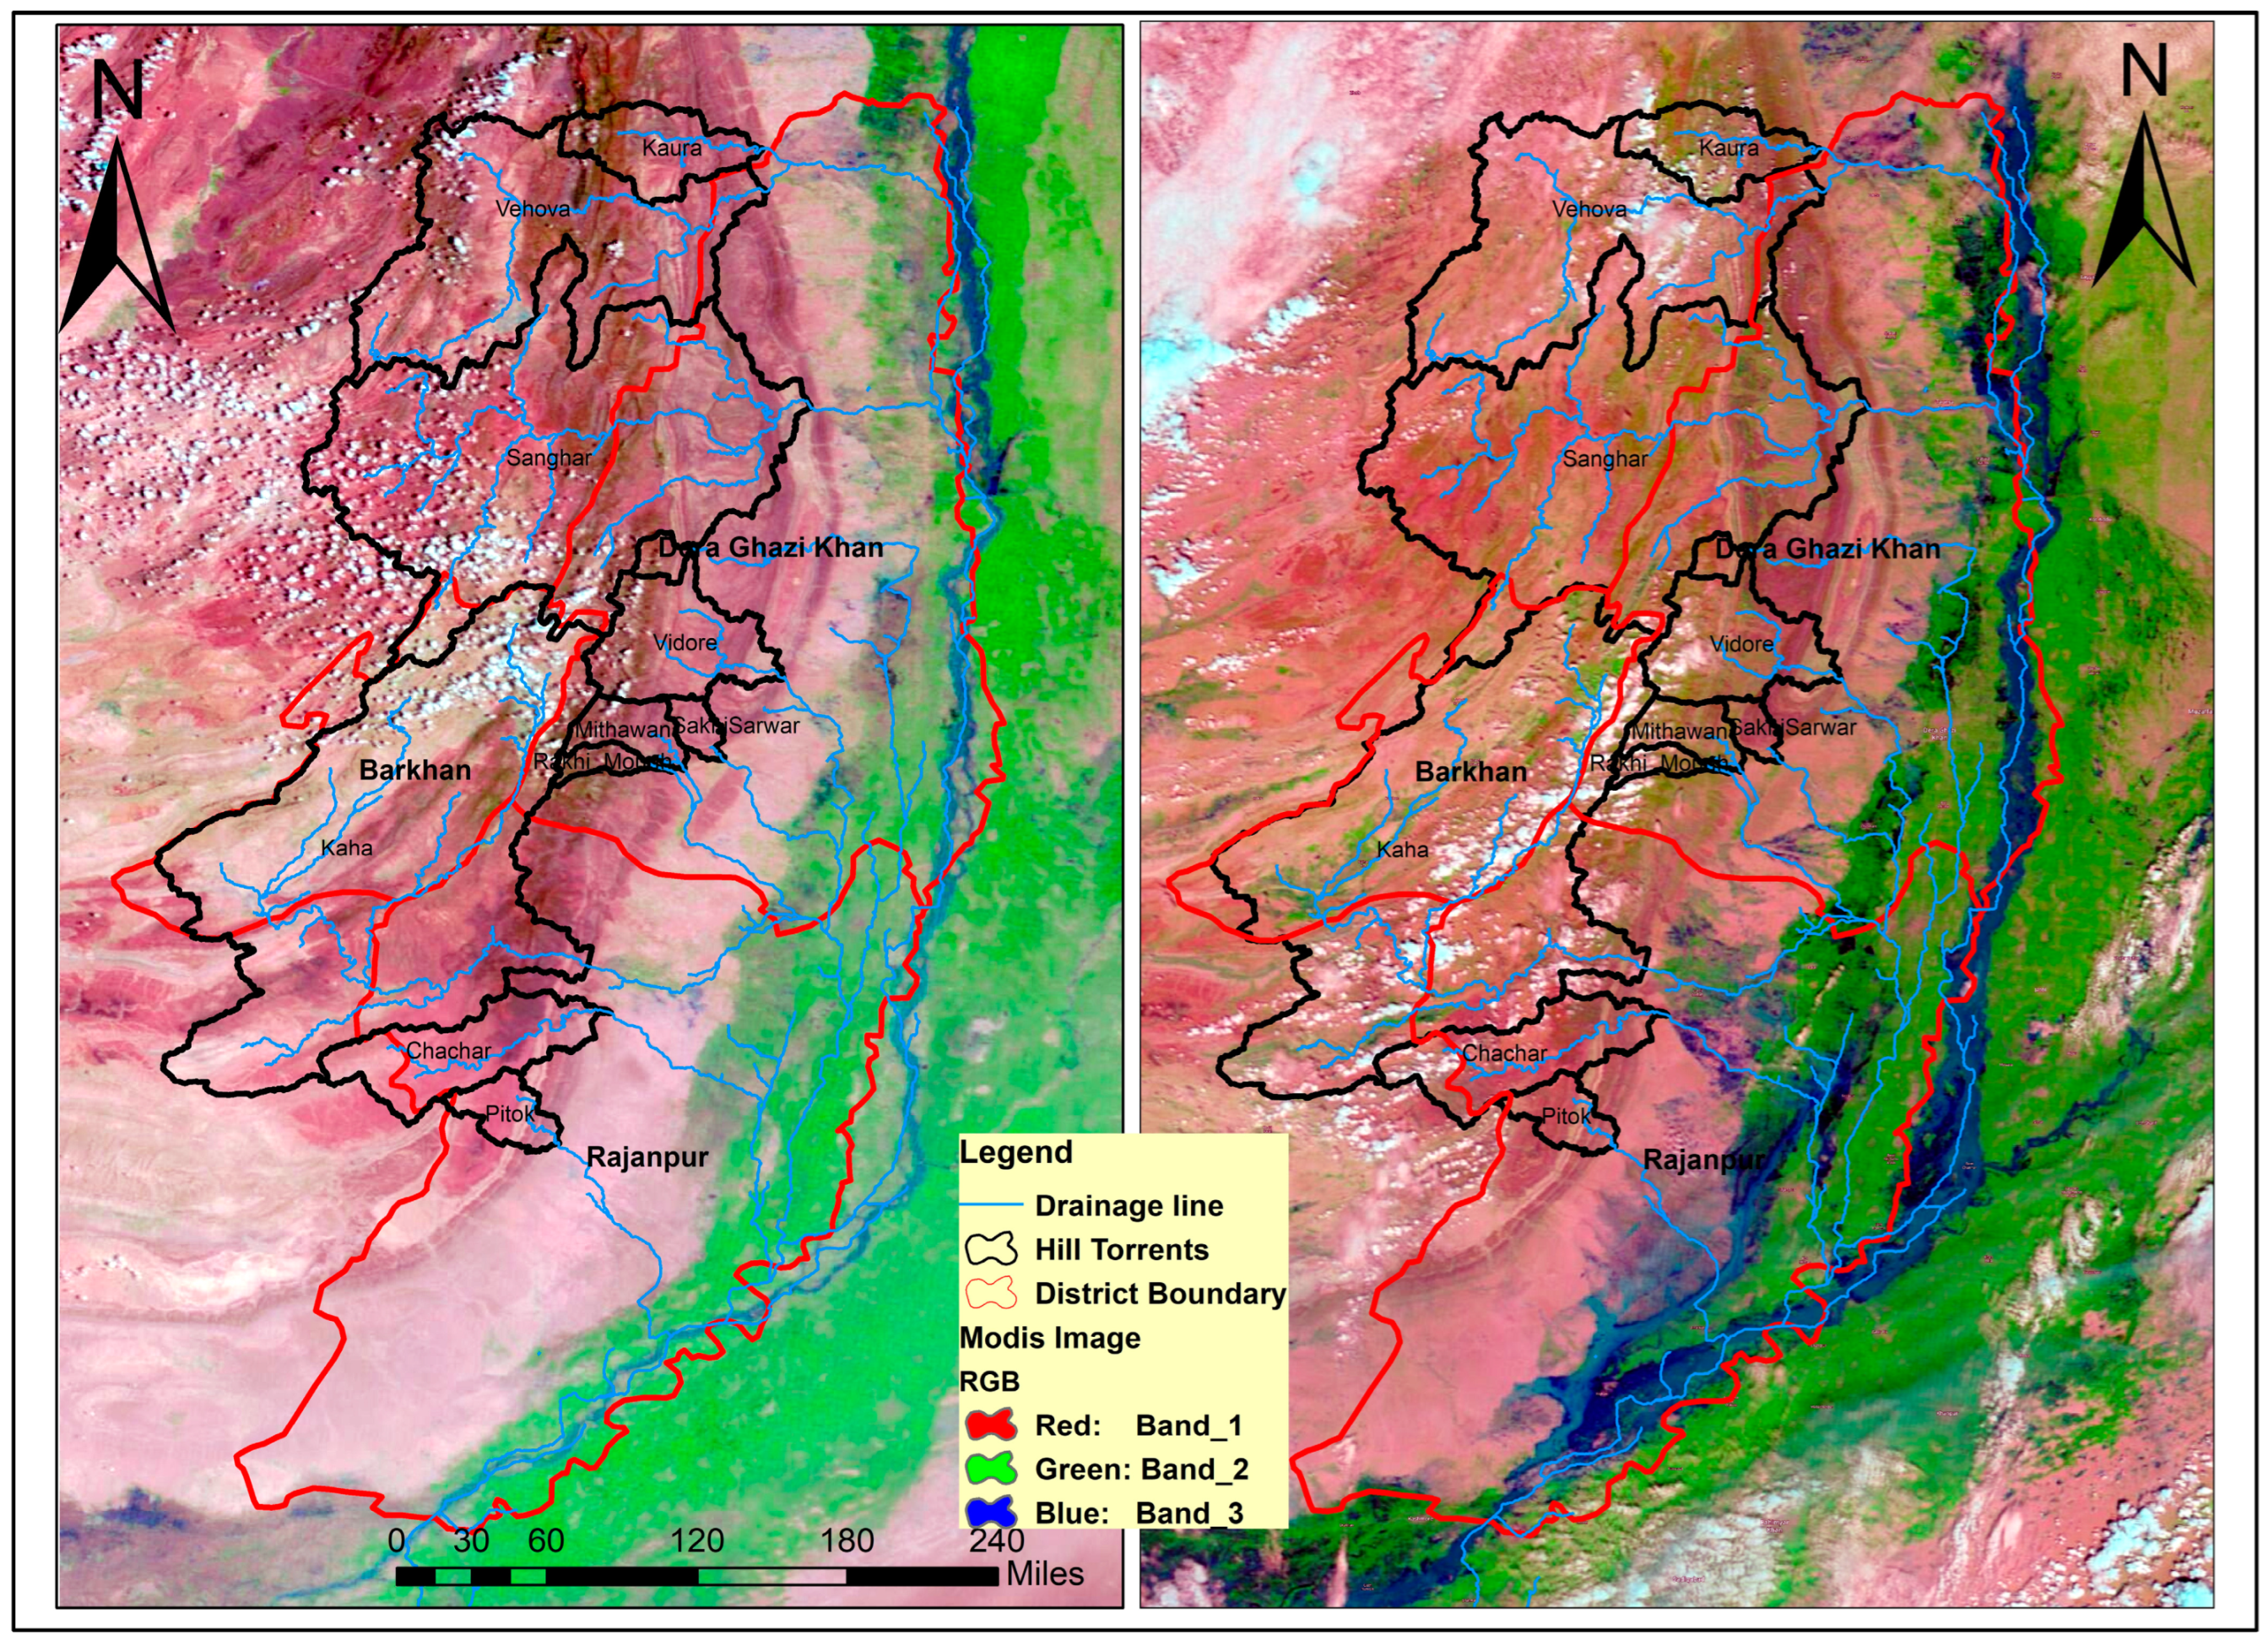
Figure 1 shows the before and after flooding situation in Rajanpur as reported in the official reports, in which hill torrents affected close to 100,000 people and inundated 309,000 acres of agricultural land.
A total of 13 hill torrents have been identified in the vicinity of DG Khan and are known as Kaura, Sanghar, Vehova, Sorilund, Vidor, SakhiSarwar, Mithawan, Kaha, Chadhar, Pitok, SoriShumali, Zangi, and SoriJanubi, which could act as a conduit for floodwater from the nearby catchment [
2]. The torrents, as mentioned above, enter the Indus River from the right bank of the Chashma River, the DG Khan canal, and the Kachhi canal [
3]. Hill torrents from the Koh-e-Suleiman Range enter the Indus between the Taunsa Barrage in Punjab and the Guddu Barrage in Sindh. Watersheds feeding these hill torrents are ungauged, making it impossible to provide reliable information on their contribution to flood water in the Indus River [
4]. Thus, the hill torrents emanating from the Koh-e-Suleman range have caused havoc for flood management officials in Sindh and Punjab.
Climate change has contributed to the increase in flood frequency and magnitude [
5,
6]. One of the impacts of climate change in Pakistan is concentrated rainfall that contributes to floods in the catchments of rivers during the monsoon season. These monsoon currents and wind conditions can intensify floods to an intolerable extent [
4]. There is a need for a floodwater management plan to reduce the impacts of floods (hill torrents) and prevent them from recurring. It may consist of structures that can withstand large quantities of water and reduce the impact of hill torrents, especially during the monsoon season. Various models and methodologies have been used to quantify the runoff produced by ungauged catchments, which may result in flash floods caused by those torrents. Prior studies have focused more on quantifying rainfall runoff than developing mitigation strategies for flash floods. Due to Pakistan’s limited resources, it has contributed minimally to the flash flood routing and management research. In the wake of the 2022 flash flood in Pakistan, it is imperative that ungauged watershed runoff measures are quantified and that remedial measures are taken to divert flood water to the water-scarce areas. Flood water can also be conserved to be used during dry periods. This study aims to quantify hill torrents in DG Khan and Rajanpur. Furthermore, it examines remedial measures since those torrents caused significant economic damage and human casualties during the floods of 2010 and 2022. Moreover, a policy discussion raised questions as an entry point to start discussion to amend customary water laws/rules, how agroecological potential can be tapped avoiding colonial legacy, as well as what crop choices, and types of scale issues of governance paid attention.
Literature Review: Modelling Ungauged Catchments
To minimize the destruction caused by flash floods, it is necessary to quantify them to make early warnings, timely preparations, and appropriate adaptation strategies. Research studies examined various methods for quantifying flash floods in ungauged catchments. For example, Sene (2013) has explored multiple conceptual, data-driven, physically based, and probabilistic flood forecasting models [
7]. A study conducted by Isabelle Braud et al. (2010) examined a flood using two distributed hydrological models: CVN and MARINE. The CVN model is found to have a greater range of uncertainty than the MARINE model [
8]. There is a higher sensitivity of the CVN model to Manning’s roughness coefficient than the MARINE model. Neither model evaluated the relevance of calculating the runoff coefficient during post-maximum discharges. Mishra et al. (2008) developed an empirically based hydrological model for paddy agricultural watersheds with limited hydrometeorological data [
9]. There was a deviation in the results of flood peaks in the range of 9–33%, and a deviation in the runoff coefficient was 4–11%. A lack of data prevented the model from efficiently comparing observed and modeled results, as Nash–Sutcliffe coefficient values (0.10–0.55) and correlation coefficient values (0.45–0.66) were calculated.
Camarasa-Belmonte (2016) analyzed flash flood events in five Mediterranean ephemeral streams in Spain to better understand the semi-arid fluvial system [
10]. The percent accumulation curves of rain and flow showed strong similarities at the beginning of the flood when rainfall intensities were higher. On the other hand, higher intensities at the end showed dissimilarities in both curves. Additionally, high rainfall intensity shortens the response time of the basin, while high amounts result in flood peaks. Black box models perform better in high-intensity events, while distributed or semi-distributed models perform better in low-intensity events. Adamovic et al. (2016) incorporated a simple dynamical system approach into the distributed hydrological model and named it SIMPLEFLOOD [
11]. The study produced satisfactory results over the entire period. In the wet years, the model simulation performed well; however, in the dry years, the simulation performed poorly. Rozalis et al. (2010) used an uncalibrated hydrological model to simulate the watershed of the Mediterranean Sea, covering an area of 27 km
2 [
12].
The study examined limited data usage for rainfall–runoff modeling, land-use-change impacts on runoff, and the impact of rainfall distribution on flash floods. Based on the study’s results, the model performed well in predicting peak flow discharges, but depended on the storm type. The importance of curve number (CN), rainfall amount, and rainfall intensity has been noted to be crucial in simulating runoff production since these factors affect the magnitude of a runoff flow. With the use of a distributed hydrological model, Zoccatelli et al. (2010) have investigated the dependency of rainfall variability on flash flood modeling [
13]. An examination of three extreme flash floods that occurred in Romania between 2005 and 2007 is presented in this study. According to the study, rainfall’s spatial variability significantly affects the flash floods prediction since the Nash–Sutcliffe coefficients are less than 0.8 in two cases and 0.6 in one. Using geology and rainfall variability to determine the impact of flash floods, Zanon et al. (2010) studied the flash flood event in Western Slovenia that occurred on 18 September 2007 [
14]. The study found errors in modeled flood peaks in rainfall volume. A low runoff coefficient is found due to the low soil moisture in the initial conditions, ranging from 0.17 to 0.24. Yasin and Nabi (2014) analyzed the impact of the Mithawan hill torrent in the DG Khan area by using the semi-distributed hydrological model HEC-HMS to assess the degree of damage caused by this hill torrent to the Kachhi canal [
15]. Research has demonstrated that the HEC-HMS model successfully determines the flow peaks within acceptable limits.
An evaluation of rainfall runoff patterns in the upper Baitarani River Basin in east India was carried out by Verma et al. (2010) using the HEC-HMS and WEPP hydrological models [
16]. Based on the study’s results, both hydrological models simulated lower stream flows during the validation period. During the simulation range of different ef-ficiency coefficients NSE, R
2 was found to be between 0.63–0.83 and 0.73–0.84, respec-tively. Based on the results, the HEC-HMS model performed better than the WEPP model in simulating daily stream flows for the upper Baitarani River basin. Using the Refh rainfall–runoff model, Joo et al. (2014) developed a comparison between the Refh rainfall–runoff model and HEC-HMS model in two catchments of Korea (Bukil and Jeungpyeong) located within the Guem River basin [
17]. The model lumped characteristics allow it to perform well only in small catchments. The semi-distributed nature of HEC-HMS makes its performance more reliable.
Yan et al. (2015) have examined the flow routing of two rivers, (1) the Yuan River and (2) the Danube River using a Generalized Nash Model (GNM). This model uses Laplace transformation and mathematical induction [
18]. It was concluded from the study that GNM is more accurate at predicting flows than the traditional IUH model. By improving the current information, it is concluded that IUH’s performance in forecasting short lead times can be enhanced. Paiva et al. (2011) conducted a hydrological and hydrodynamic modeling study in a region of the Purus River Basin with limited data and used the IPH-IV and MGB-IPH models [
19]. The study concluded that little uncertainties and errors occur due to vegetation and cross-section geometry limitations of DEMs.
In another study, Chatterjee et al. (2014) estimated the runoff volume and peak discharge in the India—Damodar watershed using HEC-HMS [
20]. According to the results, both runoff volume and peak discharge are affected by the impervious area and infiltration rate. A study by Urias et al. (2007) determined the probability of precipitation and flood return in Juarez, Mexico [
21]. The statistical precipitation distribution is determined using the Hazen plotting position method. Additionally, it calculates the annual precipitation, which is then arranged in ascending order. Then, each event is ranked, which leads to the calculation of precipitation probability and return period.
2. Materials and Methods
2.1. Study Area
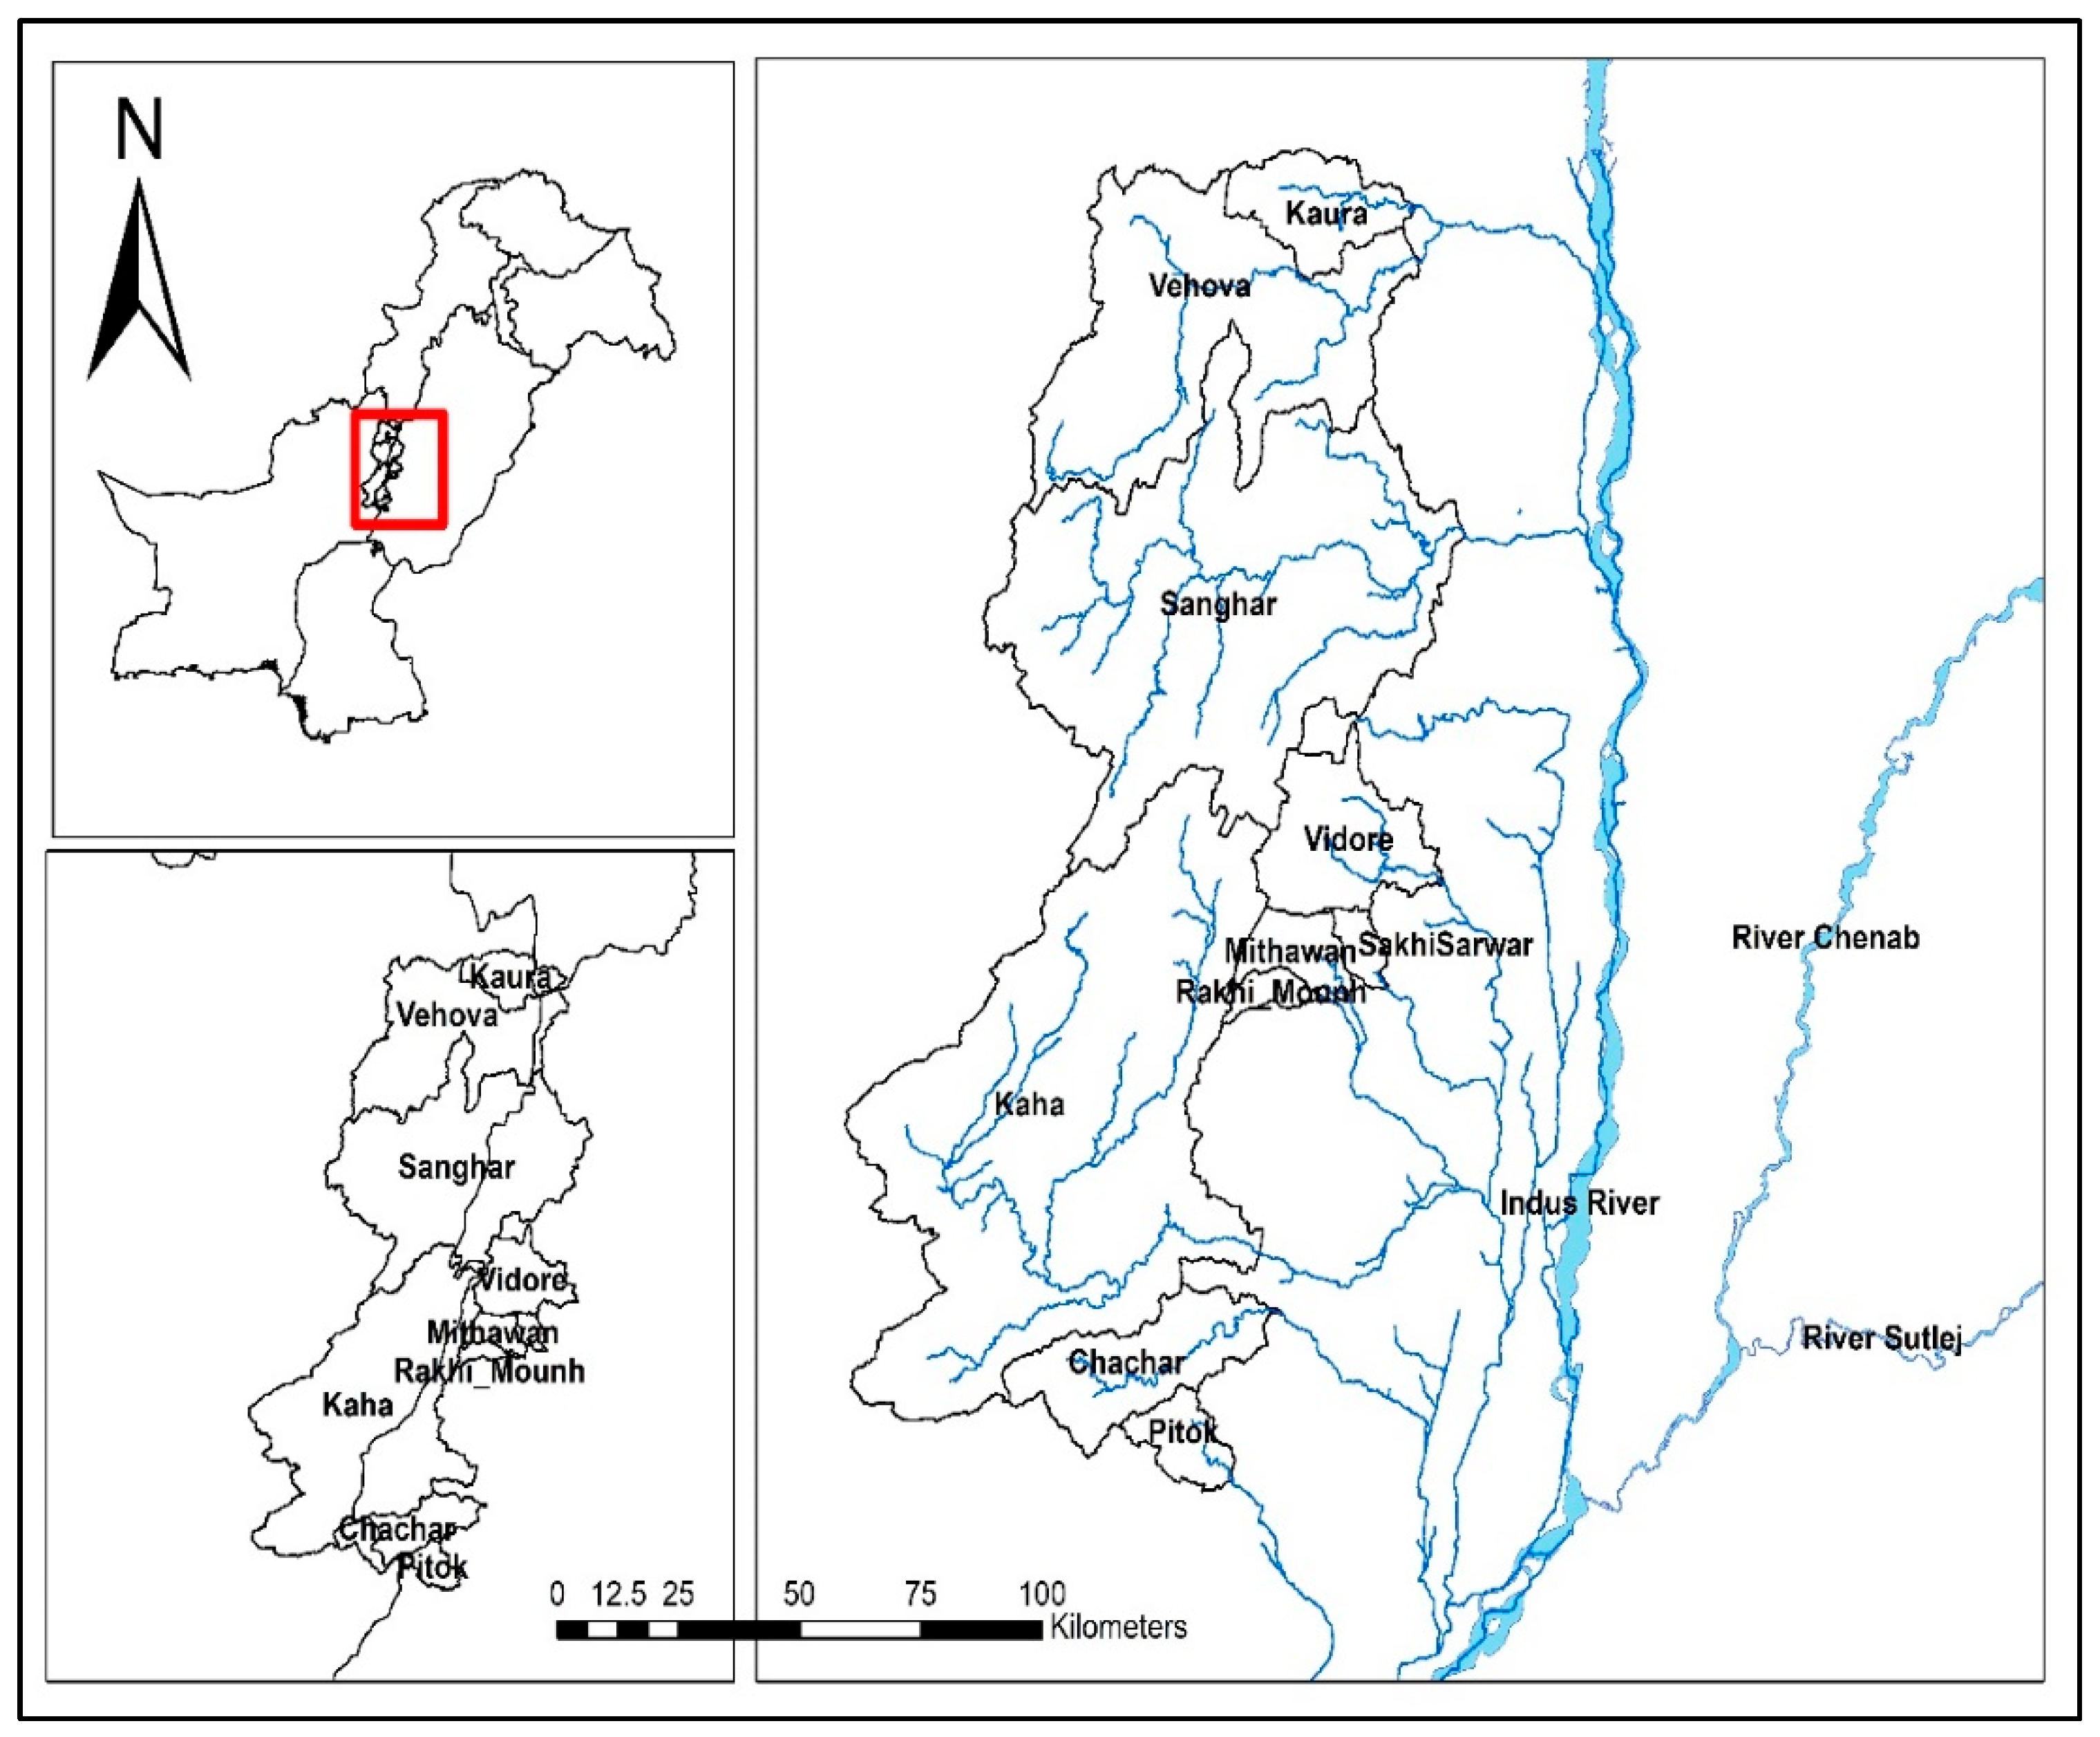
The study focus on the Koh e Suleiman region of Dera Ghazi Khan and Rajanpur in Punjab, Pakistan. D.G. Khan is located at latitude 30.0489° N and longitude 70.6455° E, at an average altitude of 124 m above mean sea level, as shown in
Figure 2.
It extends from the southern part of the Hindu Kush Mountain system in FATA (Southern Federally Administered Tribal Areas) and Afghanistan. In addition, some of its parts are located in Khyber Pakhtunkhwa and the southwest of Punjab, while most of its parts originate from northern Baluchistan. Arid to semi-arid conditions prevail in Dera Ghazi Khan. There is an erratic precipitation pattern in this region’s hill torrent areas. The region usually experiences little or no rainfall following a heavy precipitation pattern.
2.2. Types of Data
2.2.1. Meteorological Data
Pakistan’s Meteorological Department (PMD) provides precipitation throughout the country. This study utilized 30 years’ worth of daily rainfall data from 8 PMD rainfall gauge stations from 1989 to 2008 (see
Table 1). A rainfall storm frequency analysis was performed to calculate the rainfall and runoff return periods.
2.2.2. Soil Data
The main governing parameter in rainfall–runoff modeling is soil texture. Soil textures were acquired through an open-source online database
https://soilgrids.org/ (accessed on 8 August 2022). The database has a grid cell spatial resolution of 250 m for soil texture. Geotiff files containing clay and sand content at a depth of 15 cm are downloaded and utilized in the generation of Curve No.
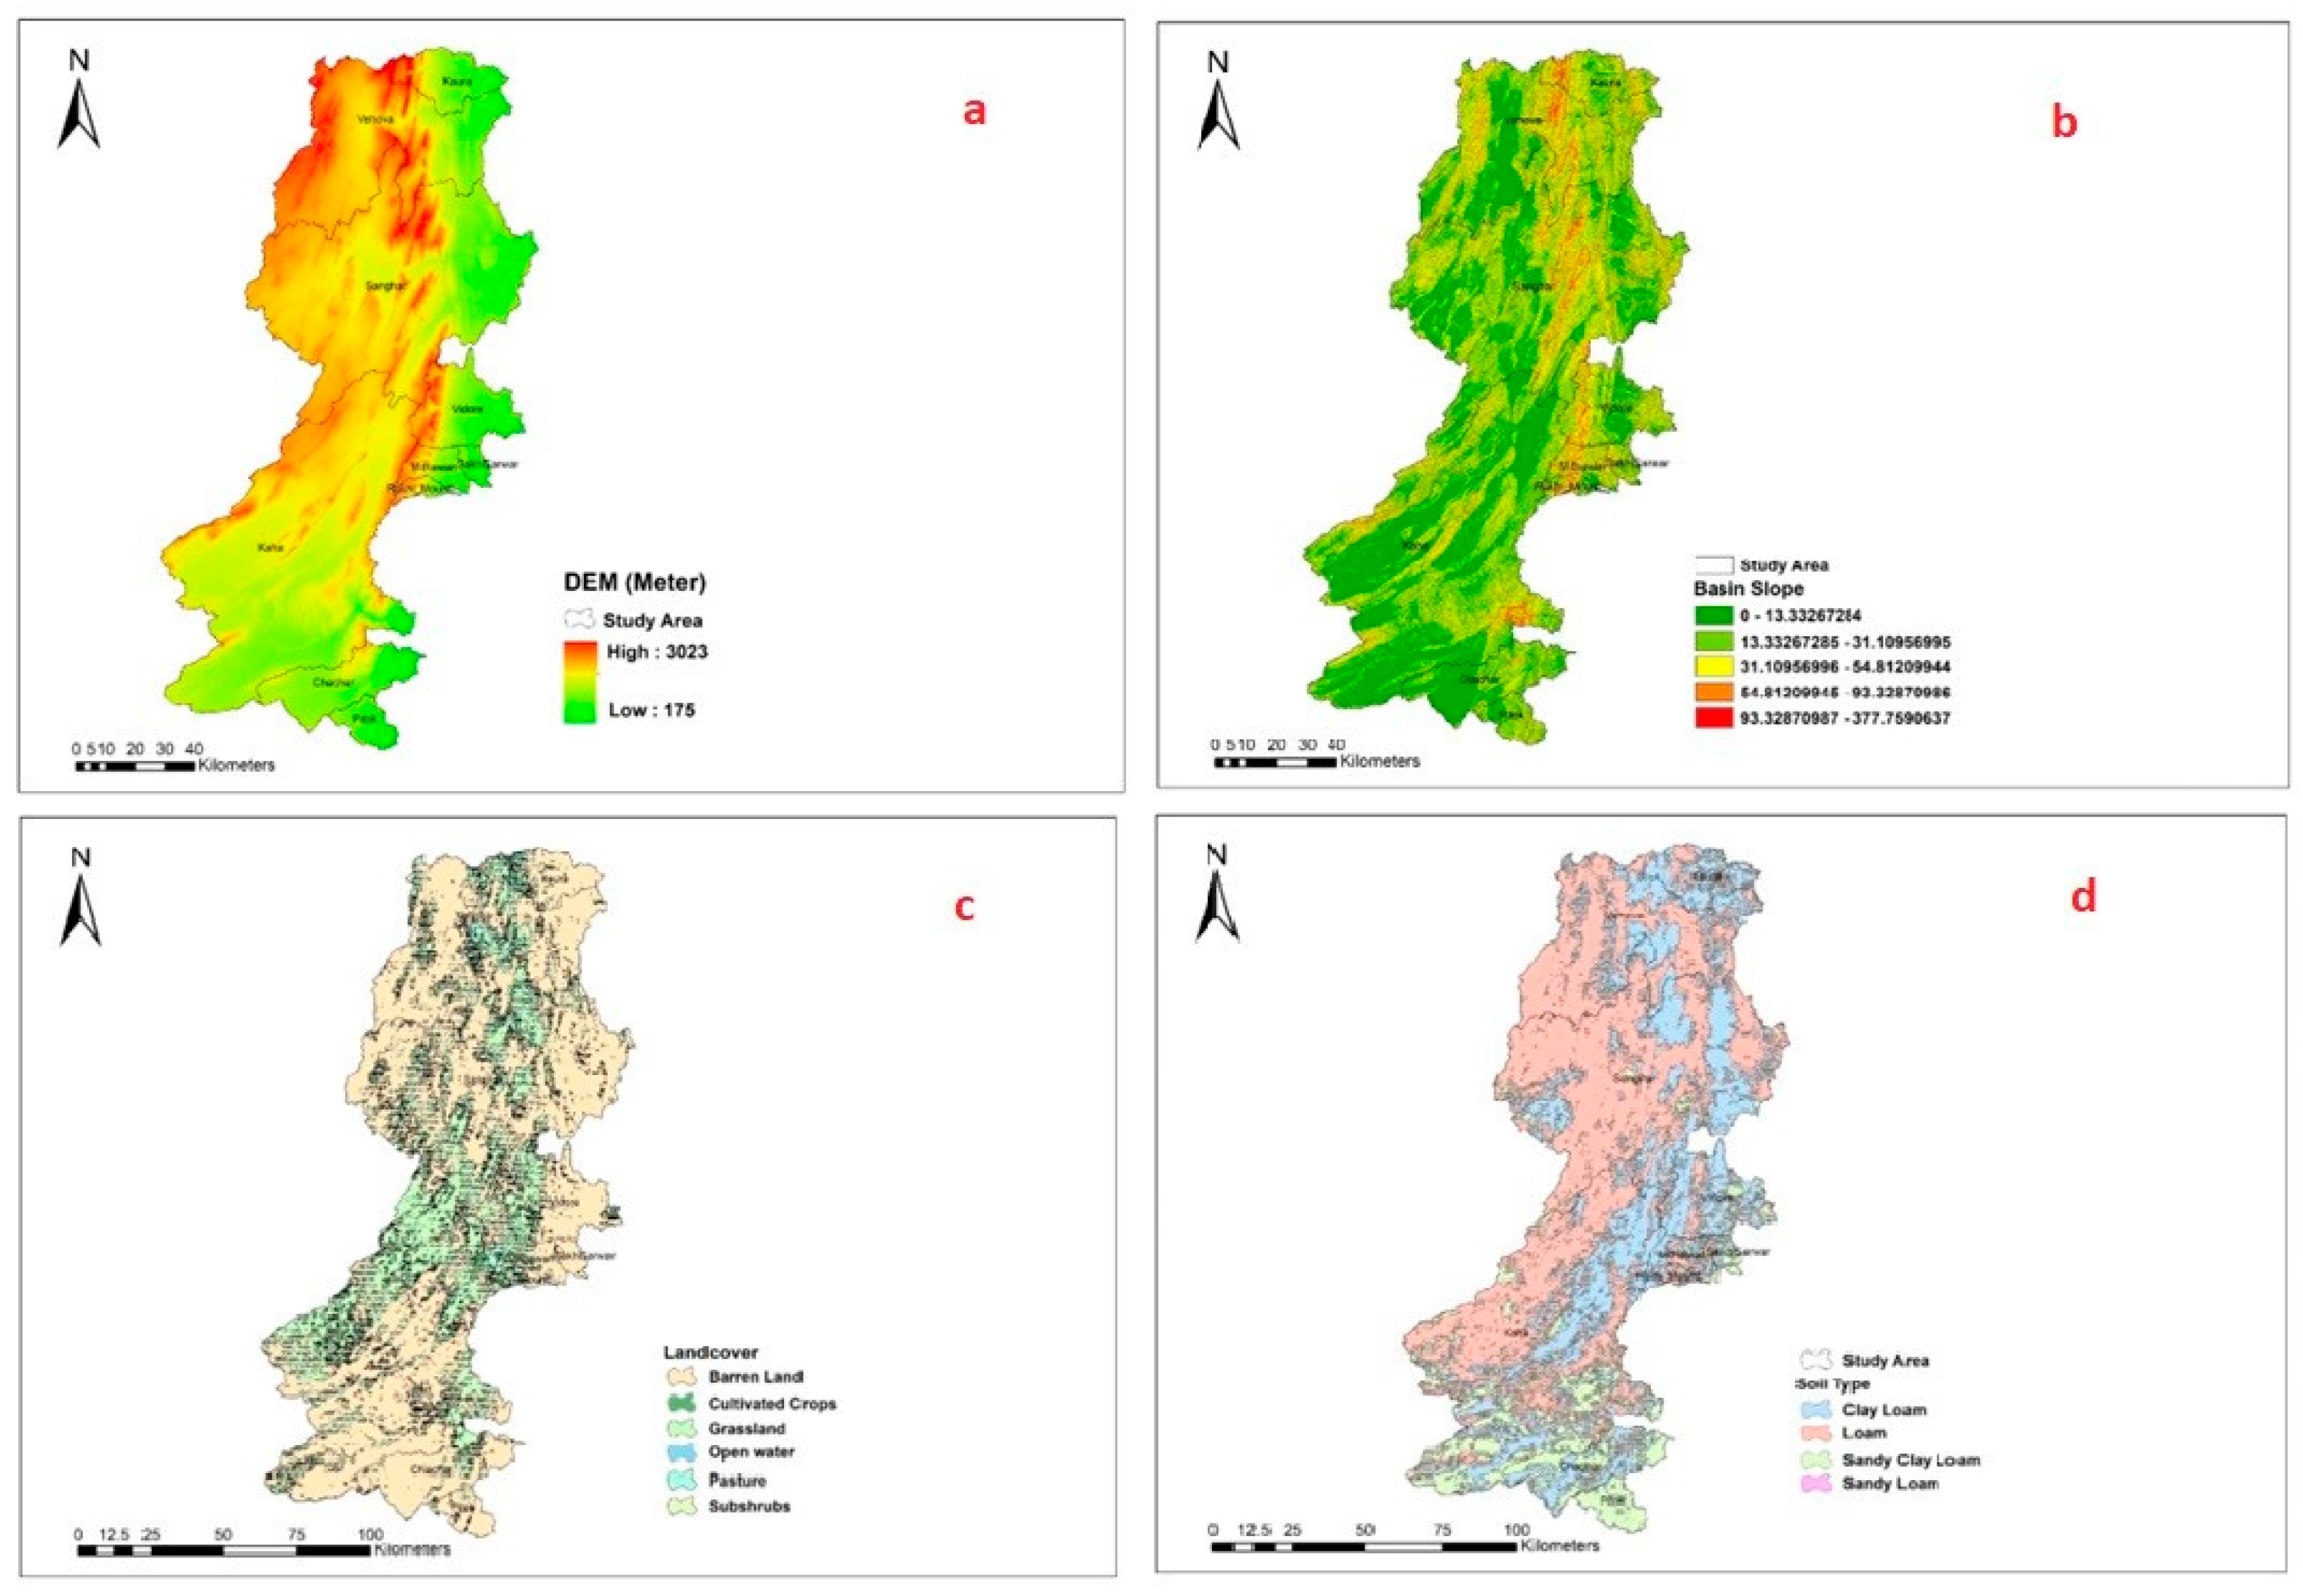
2.2.3. Topographic Data
The topographic data was obtained from the website of the Japan Aerospace Exploration Agency (
http://www.eorc.jaxa.jp, accessed on 8 August 2022). Advance Land Observing Satellite (ALOS) DEM is more suitable because of its higher spatial resolution (30 m × 30 m) and capability to cover high-altitude steep mountain regions. The ALOS DEM provides the basis to delineate the catchment and sub-watersheds.
2.2.4. Land Use/Land Cover Data
Land use and land cover data are used to determine which types of surfaces will produce more runoff and which will produce less. Landsat 8 imagery from the USGS website
https://earthexplorer.usgs.gov/ (accessed on 8 August 2022) has been used to classify the study area’s land use and land cover. The classified land cover from the image contains the following classes:
Open Water
Barren Land
Cultivated Crops
Grassland
Pasture
Subshrubs
2.3. Data Map Preparation
To delineate the watershed of the study area, spatial data are prepared using Arc GIS 10.5.1 software. ArcHydro and the HEC-GeoHMS toolbar in ArcGIS are used to preprocess data for watershed delineation. In order to calculate different parameters, such as shape area, shape length, and other parameters, the downloaded DEM is projected. Since the study area lies within UTM zone 42, the DEM is projected in UTMzone42N using the ArcGIS project tool. Using the Extract by mask tool, the study area of interest (AOI) is clipped on the projected DEM. Every Digital Elevation Model (DEM) has a few sink issues that require adjustment following the neighboring grid. For this purpose, the tool “Fill sinks” is used, which adjusts values in the DEM. Using the “Fdr” tool in HEC-GeoHMS, the flow direction was calculated to understand the location of drainage patterns. Using flow direction results, “Fac” calculates the flow accumulation grid.
The tool “StrLnk” links/segments the stream generated in the above process. Cat generates a grid of catchments draining into each other based on stream segmentation and flow direction. The already prepared catchment grid can be converted into polygons using the catchment tool. Next, a drainage line processing tool was used to create a drainage pattern to define the watershed’s boundaries further. In the end, small catchments are prepared using adjoint catchment processing tools.
2.3.1. Hec-Geo-HMS Characteristics
It is necessary to define the characteristics of the watersheds after they are generated, including the length of the river, the slope of the river, the slope of the basin, the longest flow path, the centroid of the basin, the centroid elevation, and the centroidal longest flow path. The soil maps are prepared using downloaded soil grids. Clay and sand content layers are converted to soil texture using the open-source software QGIS. The shape files are imported into ArcMap and clipped to the study area. The following textures characterize the soil type:
Clay Loam
Loam
Sandy Clay Loam
Sandy Loam
Further, the texture is assigned a hydrological soil group A, B, C, D. According to [
22], assigning group A low runoff rate to D High runoff rate, as shown in
Table 2.
Landsat 8 imagery was used to produce the land use and land cover maps. The raster data was then clipped to the study area using the Extract by Mask tool. Using ArcMap’s raster to polygon tool, raster data is converted to vector data. In hydrology, the runoff curve number is an empirical parameter used to calculate the amount of direct runoff and infiltration following a precipitation event. CN uses land cover values to predict the amount of runoff being produced. Paved areas are assigned a value of 0, while open areas are assigned a value of 100. The CN grid is constructed first by intersecting soil type, land use, and land cover data. In addition, a CNLOOKUP table containing soil type information is used. This
Table 3 contains the object ID, land use values (LUVALUE), land cover data, and hydrological soil parameters. A CN grid is generated after the three-soil type, land cover, and CNLOOKUP tables are converted within HEC-GeoHMS in the utility of the CN grid. Following the above processes, input files are generated for exporting these datasets to HEC-HMS.
2.3.2. Hydrological Modeling
A hydrological model is a dynamic process that calculates all parameters associated with the water cycle, from evaporation to runoff. In this study, HEC-HMS is used. Many researchers have used HEC-HMS to quantify rainfall runoff due to its event-based nature. Through the use of soil type and land cover information, the loss method determines how much water will infiltrate after rainfall has occurred. Runoff modeling requires information on how much is infiltrated and lost. In HEC-HMS, eleven different methods are used to calculate losses. This study uses the soil conservation service curve developed by the United States Department of Agriculture (USDA). The formulas for different computing parameters for runoff using the SCS-CN method are provided below:
where “
Q”, “
P”, “
Ia”, “
S”, and “CN” are Discharge (IN), Rainfall (IN), Initial Abstraction (IN), Potential maximum retention after runoff begins (IN), and Curve Number.
The lag time is calculated using the transform method. A lag time is the amount of time between when maximum rainfall occurs and when peak discharge occurs. In this study, the SCS unit hydrograph method was used. For each Hill torrent and its sub-basins, lag time has been computed using the CN grid, longest flow paths, and basin slopes, as shown in
Table 4.
2.4. Statistical Analysis
2.4.1. Frequency Analysis
The Barkhan rain gauge was selected for frequency analysis since it was the only gauge representative of all hill torrents spatially. Frequency analysis is performed to determine the return periods and probability of the rainfall events. Gumble Extreme Value Analysis Type 1 Distribution has been used for frequency analysis of the Barkhan rain gauge for 56 years (1963–2018). There have been many statistical analysis methods used for storm rainfall frequency analysis, but generally, Gumble Extreme Value Analysis Type 1 Distribution is selected based on the previous study used for its best fit to storm rainfall frequency data in the area [
15]. However, in this analysis, a cross comparison is not drawn between different distribution to determine the best fit for study area rainfall data.
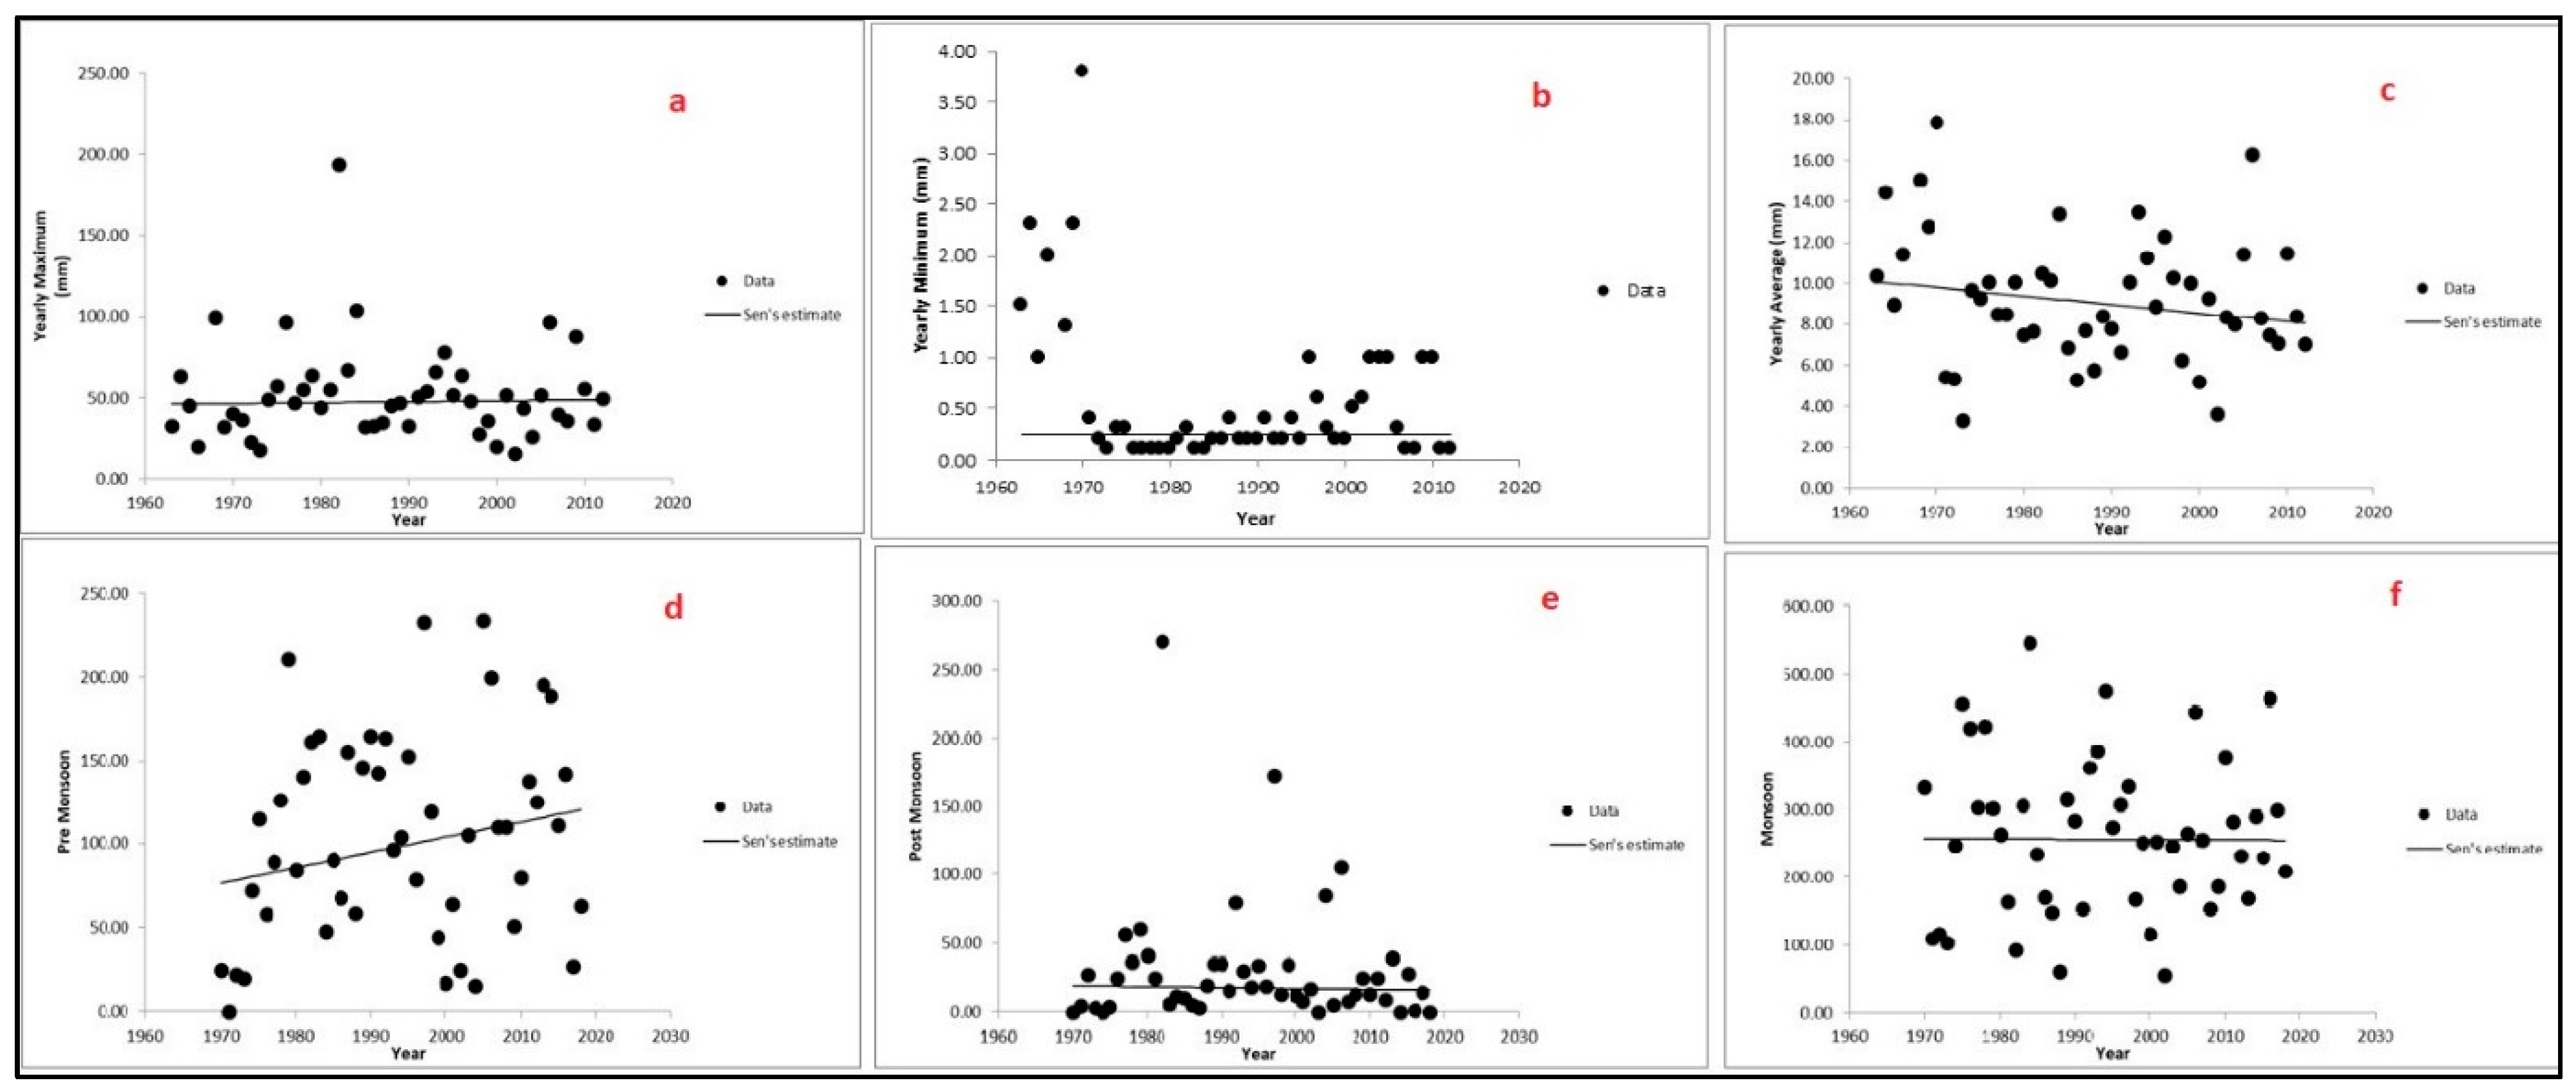
2.4.2. Rainfall Trend Analysis
Nonparametric Mann–Kendall and Sen’s slope methods are used to determine positive and negative trends in precipitation data with their statistical significance [
23,
24]. Three scenarios are analyzed, i.e.,
Annual Maximum, Minimum, and Mean variation;
Seasonal, Pre-Monsoon, Post Monsoon, and Monsoon variation;
Monsoon Monthly variation.
2.5. Sensitivity Analysis
Various parameters used to generate runoff should be analyzed for their influence on runoff generation. In sensitivity analysis, lower and upper bounds are used to determine model sensitivity. Therefore, changes are made to one parameter while keeping the others unchanged. The parameters that HEC-HMS uses in simulating rainfall runoff generation are Curved No. (CN), Initial abstraction (Ia), impervious percent, and lag time. Analysis was carried out on 2, 5, and 10% changes in CN and Initial abstraction. Impervious percent and lag time has no significant impact because the catchment has a small portion of built-up area. Ahmad et al. (2021) [
25] study the Al-Adhaim River catchment in Northern Iraq using HEC-HMS, and noticed that the main parameters which affect runoff quantities were the curve number and initial abstraction.
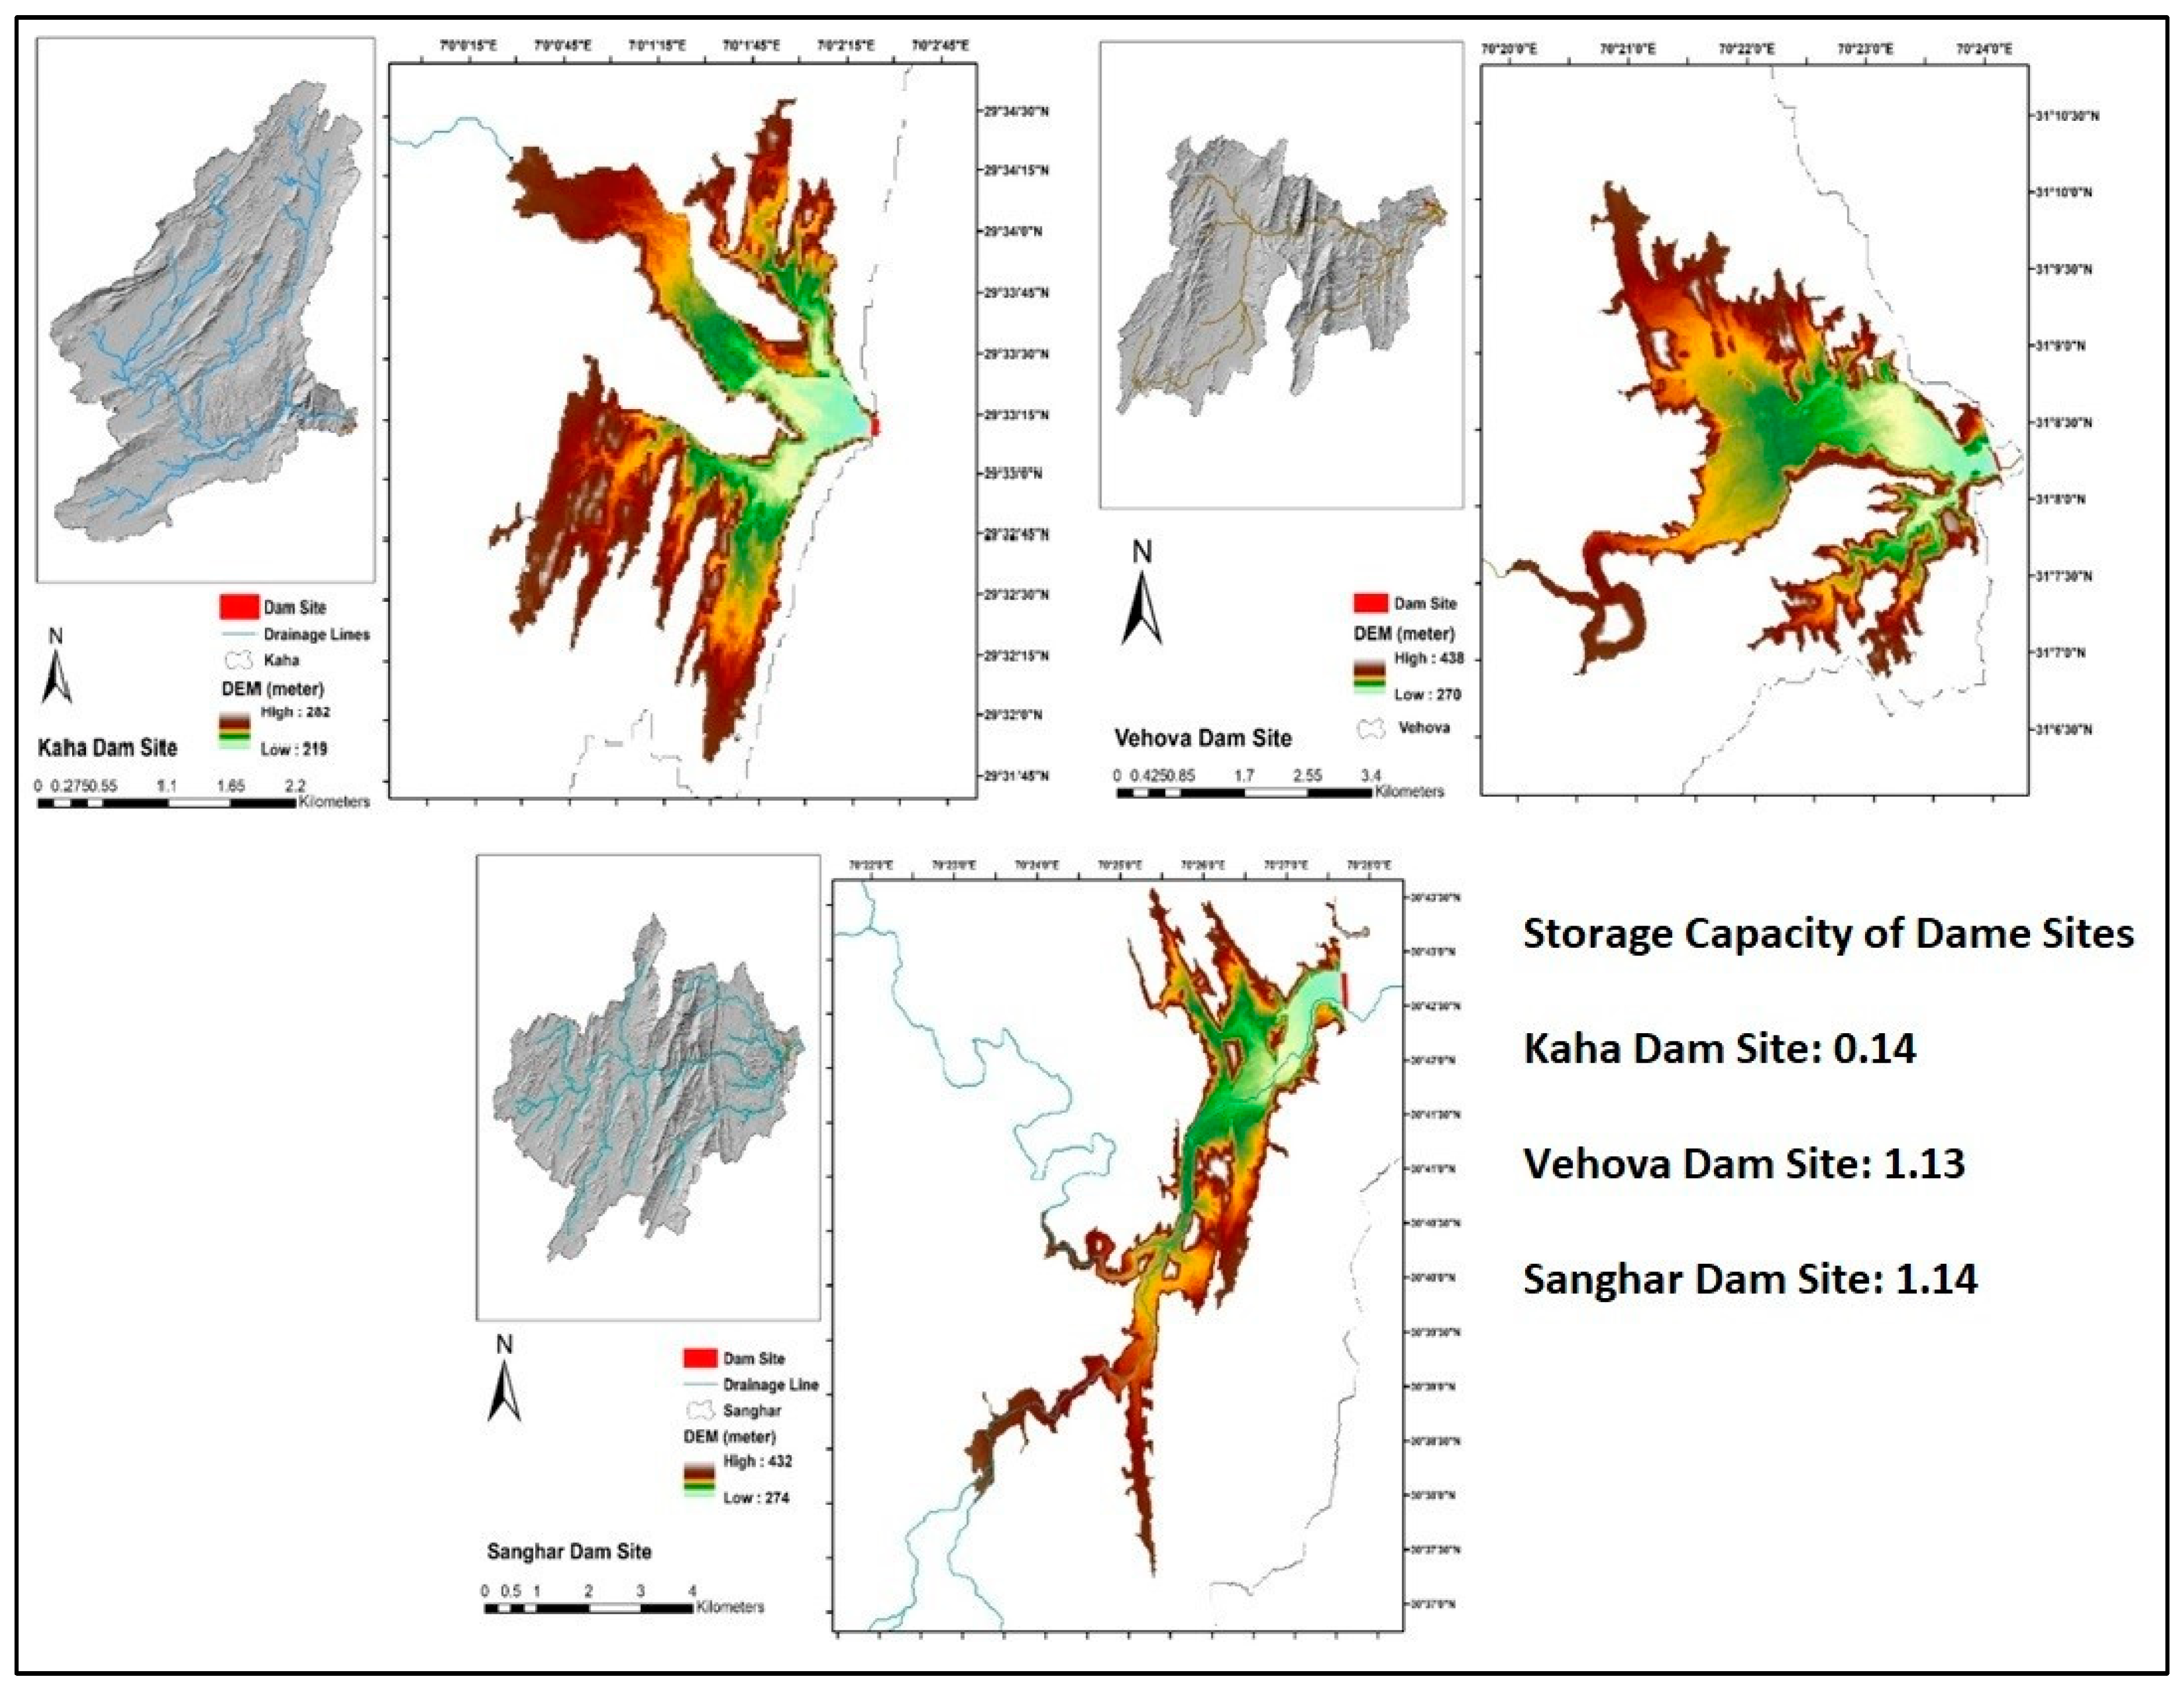
2.6. Storage Availability Analysis
The storage availability is assessed to identify the potential for spate irrigation for the local community residing adjacent to these torrents, as they divert some rainwater for agriculture making kaccha bunds. Based on basin area, three large basin area hill torrents have been chosen for storage availability, i.e., Kaha, Sanghar, and Vehova. DEM contours are used to analyze storage at all three hill torrents.
4. Policy Discussion: Socio-Economic Consequences of Water Infrastructure
Water accounting of Pakistan’s total water resources is somewhat uncertain due to limited data collection (especially for internally generated water resources from the hill torrents of Balochistan and parts of Sindh and Punjab) and the need for real-time water accounting instrumentation required [
30]. National Water Policy (NWP) and National Water Conservation Strategies also discuss the potential of these untapped water resources and asserted the profiling of untapped water resources (hill torrents) for efficient management [
31]. There is a need to plan the construction of water infrastructure. The importance of these infrastructures is well understood in the policy circle, and it is well recognized by Khyber Pakhtunkhwa irrigation official Mr. Zubair in a Pakistan Water Week organized by IWMI from 24–28 October 2022. Mr. Zubair pointed out “Gomal Zam Dam has covered its cost by over 10 times. It has saved the communities of Tank and DI Khan from the impacts of August 2022 floods. The dam has stored 1.1-million-acre ft water in these floods” [
32]. Abdul Wahab Kakar, Director General on Farm Water Management (OFWM) Balochistan, also endorsed Mr. Zubair’s point of view and said, “In Balochistan, floods were caused by hill torrents. Such surface water could be used in the rainfed areas for productive use, and capacity building of farmers also needs to go alongside” [
33].
There is no doubt about the economic and flood protection benefits, but the development of these infrastructures also reshaped the social structure of society and groundwater hydrology contour. The reshaping of land and water resources create new beneficiaries and losers. This is clearly a case for politics of scale.
The politics of scale in water resources refers to the ways in which different levels of government, organizations, and individuals interact and make decisions about water management [
34,
35]. This can include issues such as allocation of water resources, development of water infrastructure, and implementation of regulations and policies. The politics of scale can also involve conflicts and negotiations between different stakeholders with different interests, such as agricultural and urban users, as well as local and regional governments. It also deals with how different levels of government and other actors work together to address complex water management issues that often extend beyond political boundaries [
34]. In the case of hill torrent management in Punjab, Pakistan, the politics of scale is particularly relevant due to the complex and multi-faceted nature of the issue. In Punjab, the provincial government is responsible for overall flood management, including the development of infrastructure and policies to mitigate the impact of hill torrents. However, local governments, such as district and city councils, also play a key role in responding to and recovering from these events. Additionally, public sector organizations, such as irrigation have a vested interest in managing hill torrents as they can affect their operations and infrastructure. Furthermore, the local communities who are most affected by hill torrents, also have a significant role to play in the management of these events. They have the knowledge of the area and their participation is crucial in the decision-making process. However, the involvement of local communities in the decision-making process is not always guaranteed and it can be a source of conflicts between different stakeholders [
36]. Overall, managing hill torrents in Punjab, Pakistan requires coordination and cooperation between different levels of government, private sector organizations, and local communities. The politics of scale is therefore an important consideration in this context, as it can affect the ability of different actors to work together effectively and make decisions that are in the best interest of all stakeholders. In the case of surface storage for hill torrent management, several types of water conflicts may arise. For example, the following conflicts may arise:
Allocation conflicts: Surface storage projects such as dams and reservoirs can affect the distribution and availability of water, leading to conflicts between different water users, such as irrigation command area distribution between upstream and downstream communities.
Environmental conflicts: Surface storage projects can have significant impacts on the natural environment, such as altering flow patterns, flooding areas, and disrupting aquatic ecosystems. This can lead to conflicts between those who support the projects and those who are opposed to them due to environmental concerns.
Decision-making conflicts: Local communities who are most affected by hill torrents and surface storage projects, also have a significant role to play in the management of these events. However, their participation in the decision-making process is not always guaranteed and it can be a source of conflicts between different stakeholders.
There is a need to rethink the past experiences of irrigation management during a colonial-era canal infrastructure and plan future water resource development accordingly. Building these hill torrents infrastructures and its command area development need to understand the existing customary water use practices and crop choices for its use. How to update these customary practices (Governance) for improving this precious water resource use. Flood irrigation is traditionally used to redirect the flow of a hill torrent into areas that need to be irrigated to cultivate seasonal crops. The agricultural operations are designed to withstand heavy floods and droughts, and a special irrigation system for hill torrent areas is used locally called “Kamara Irrigation.” This method disregards the frequency and volume of flows produced by storms and enforces successive water rights, dictating irrigation patterns from higher to lower riparian areas. This strategy prevented far lower riparians from receiving irrigation water during a year of low flow. People have been observed to prepare fields by building around 1.8 m high embankments to hold the water while considering the local soil type, water availability, and several other considerations. As soon as the field’s water supply stopped, crops were sowed and thrived because of the moisture the soil had retained. Other than the rain, no more watering is conceivable if it comes. Discussion on points like; what are the ways to intervene in these customary water laws/rules required, how their agroecological potential tapped but not repeating the colonial legacy of canal colonies, and what are ways these water resources provide an economical and just economic dividend to its inhabitants keeping in view the loser and winner of this new irrigation development.
Based on the previous experience of the Indus Basin irrigated canal development crop choices need to fixed—based on local climate and soil topography, so that the water logging and salinity menace is avoided. In such areas, it is important to select crops that are more drought-tolerant and require less water to grow. Some examples of drought-tolerant crops that may be more suitable for areas with limited water resources include:
Millets: Millets such as pearl millet (Bajara) and finger millet (Ragi) are drought-tolerant crops that can be grown in areas with low rainfall and poor soil fertility.
Pulses: Pulses such as lentils and chickpeas are drought-tolerant crops that can be grown in areas with low rainfall and poor soil fertility. They are also good source of protein.
Oilseeds: Oilseeds such as groundnut and sunflower are drought-tolerant crops that can be grown in areas with low rainfall and poor soil fertility. They are also good source of oil and protein.
Fodder crops: Fodder crops such as oat and barley can be grown as a source of feed for livestock and require less water than other crops.
Agroforestry: Agroforestry systems, that integrate trees and crops on the same land, can be a good choice for command area development in these areas. The trees can provide shade, prevent soil erosion, and improve soil fertility while the crops can provide food and income.
It is important to note that the crop selection will also depend on the specific conditions of the area and the preference of the farmers. In addition, the farmers will have to be trained on different crop management practices, irrigation techniques, and post-harvest management to ensure the successful cultivation of the crops. Additionally, the water management strategy, such as rainwater harvesting, water conservation and efficient irrigation systems can also be implemented to make the best use of the available water resources.
5. Conclusions and Recommendations
This study aimed to estimate the contribution of hill torrents to the river Indus flow. The hydrological modeling analysis revealed that for return periods of 25, 50, 100, and 200 years, the total volume of flow that contributes to the river Indus is approximately 0.5, 0.6, 0.7, and 0.8 million acre-feet, respectively. A sensitivity analysis indicates that the CN and initial abstraction have a significant impact on runoff. Changes in CN by 10% with upper and lower bounds may affect runoff generation by 7.79% and −13.20%, respectively. The storage potential of three large basin hill torrents, Kaha, Vehova, and Sanghar, is 0.14, 1.14, and 1.13 MAF, respectively.
The study indicates that a substantial amount of water is available for spate irrigation development in the region and hydraulic structures need to be built to make the most use of this resource. To examine the effectiveness of hydraulic structures, a sediment transport analysis must be conducted. Furthermore, to obtain a more precise understanding of rainfall patterns, a network of rain gauges should be established.


