Article

Measurements of the Permeability Coefficient of Waste Coal Ash under Hydrostatic Pressure to Identify the Feasibility of Its Use in Construction

Strata Mechanics Research Institute of the Polish Academy of Sciences, Reymonta 27, 30-059 Kraków, Poland
*
Author to whom correspondence should be addressed.
Recycling 2024, 9(2), 22; https://doi.org/10.3390/recycling9020022
Submission received: 22 November 2023 / Revised: 12 February 2024 / Accepted: 20 February 2024 / Published: 4 March 2024

Abstract

:
The aim of this research was to measure the filtration properties of waste coal ash under the influence of hydrostatic pressure generated in a three-axial compression apparatus. The scope of work included determining the compactibility parameters, maximum bulk density and optimal moisture content. Permeability tests were performed for a sample with an average grain composition at three compaction indices I S : 0.964, 0.98 and 1.00. The hydrostatic pressure ranging from 0.5 to 1.8 bar corresponded to the layer depths from 2.17 to 7.83 m. Gradually increasing the pressure during the first loading cycle caused irreversible changes in the structure of the sample by local material agglomeration or grain interlocking. The water permeability coefficient was higher in the second loading cycle than in the first cycle. It was shown that waste coal ash cannot be used as a construction material on its own. To obtain constant filtration properties, the waste coal ash material should be doped, or an optimal compactionshould be used ( I S = 1.00). The results presented in this study are important for assessing the use of waste coal ash for construction engineering purposes.

1. Introduction

The intensive development of different areas of science and, above all, attempts to find modern improvements are driving scientists to focus on developing materials with specific and desired properties. An area that is extremely important in the modern world is environmental sciences, which faces the challenge of zero-waste strategy, aimed at minimizing the amount of waste produced and promoting sustainable waste management. Environmental issues are particularly sensitive to the spectrum of problems related to coal combustion and the impact of this process on broadly understood ecological issues.
As an energy source, hard coal has played an important role in the development of industries and economies around the world. As a result of the invention of the steam engine by James Watt in the 18th century, the demand for coal increased during the Industrial Revolution. Before the modern era of electricity, when coal was used for electricity generation, it was also used to produce gas for lighting [1]. Coal use is still huge around the world, with the exception of 2020 when COVID-19 restrictions were introduced. After the restrictions were eased, energy consumption increased dramatically. According to data from 2021, global coal consumption increased by over 6%, reaching the highest level since 2014 [2]. Coal combustion is the process of undergoing coal oxidation to obtain thermal energy. For many countries, it is a traditional source of energy that has been meeting their energy needs for many years [3]. However, during combustion, pollutants such as sulfur dioxide (SO2), nitrogen oxides (NOx) and carbon dioxide (CO2) are released into the atmosphere. These substances negatively affect air quality, causing health problems among people and degradation of the environment, including soil and water. The combustion of fuels (including coal) is the main source of atmospheric pollution with solid and gaseous combustion products, both toxic and nontoxic.
Converting coal into electricity creates large amounts of waste materials. The type of products after coal combustion largely depends on its type and purity, as well as on the design of the boiler. Waste such as ash, slag and various types of solid pollutants are stored on a large scale in heaps and dumping areas. Waste storage and recycling pose a major challenge to the industry as well as to authorities [4]. The costs associated with waste storage encourage the search for new ways of waste material utilization. Some of the waste is used as anthropogenic construction soil in civil and hydrotechnical construction to build embankments and fill sinkholes and river banks. The possibility of using waste produced ongoingly may help solve some problems related to the need for storage, saving land and limiting the expansion of existing landfills. According to the American Coal Ash Association, in 2021, coal combustion products amounted to a total of 77 million tons, of which approximately 47 million tons were reused. In total, 60% of the fly ash produced in the United States was reused [5]. The increase in electricity production from coal in 2022 was observed by the International Energy Agency as a record level, representing an increase in carbon dioxide (CO2) emissions by over 1/3 of the total electricity production. Based on IEA reports, reducing the use of coal along with the pursuit of implementing the draft of the new Energy Policy is not on track [6].
The zero-waste strategy, introduced to prevent further increases in waste production, introduces a circulation of materials. According to this strategy, the same materials can be used repeatedly to achieve the maximum level of consumption [7]. Thanks to this approach, waste materials are not wasted, therefore reducing environmental pollution [8]. The concept of zero waste assumes that there is no “waste” but rather “secondary raw material” that can be used to produce or transform into new products. The strategy recommends viewing waste as resources that can be recovered and reused and not as a problem that is difficult to dispose of. As a result, hazardous substances from the waste generated during coal combustion will be reduced, and the use of waste residues will increase [9].
The geotechnical properties of waste coal ash are the most important issue determining the scope of use of the coal combustion residuals. These include features such as grain composition, compactibility, strength, load-bearing capacity and water permeability [10]. Knowledge of the range of values and trends in the changes in the mentioned parameters, including the water permeability coefficient, is important for the potential use of postprocess waste in civil and hydrotechnical construction [11,12,13,14].
Permeability is an important parameter describing the ability of soil to conduct liquid through the interconnected pores between the material. It may apply to various materials, including soil, sand or concrete. Hydraulic conductivity, determined by the permeability coefficient, is one of the main physical parameters of the soil that determines the rate of water penetration into its structure. Designed as k, its value varies significantly depending on the type of soil [15] and on the porosity. The higher the density of the soil, the lower the porosity. When soil layers are stacked on top of each other, the permeability in the parallel direction is higher than in the perpendicular direction. The permeability coefficient is sensitive to temperature because it affects the viscosity of water, so if we assume that, for 20°C, it is 100%, then for 10°C, it is equal to 77%. To calculate the percolation rate in m/s, the volume of flowing water per unit of time should be divided by the average area of the voids [16]. Permeability is necessary to assess the stability of the embankments built from anthropogenic soil in the form of waste coal ash. Based on the analysis of the filtration process and the knowledge of the permeability coefficient, it is possible to determine the slope of the embankments at which they remain stable.
Research on the assessment of the permeability coefficient of waste coal ash is limited [17,18,19,20]. The water permeability of coal ash and slag was studied in the work of Lange et al. in order to assess the possibility of their use as road surface layers [19]. Ash samples collected from two landfills with different densities were tested in an extremely dense and loose state. The permeability coefficient with respect to several values of the hydraulic drop was measured. It was found that filtration begins only after reaching a certain hydraulic gradient, called the initial filtration gradient. This effect was related to the features of the composition and structure of the coal residue. The works available in the literature mainly concern the permeability coefficient of coal fly ash, while those concerning bottom ash are very rare [17,19,21,22].
The aim of this work was to measure the filtration properties of waste coal ash samples with a different density index and to discuss the impact of hydrostatic pressure on the value of the permeability coefficient. The novelty of this research is the assessment of the filtration properties under various loading conditions in two loading cycles and under different pressure gradients.

2. Materials and Methods

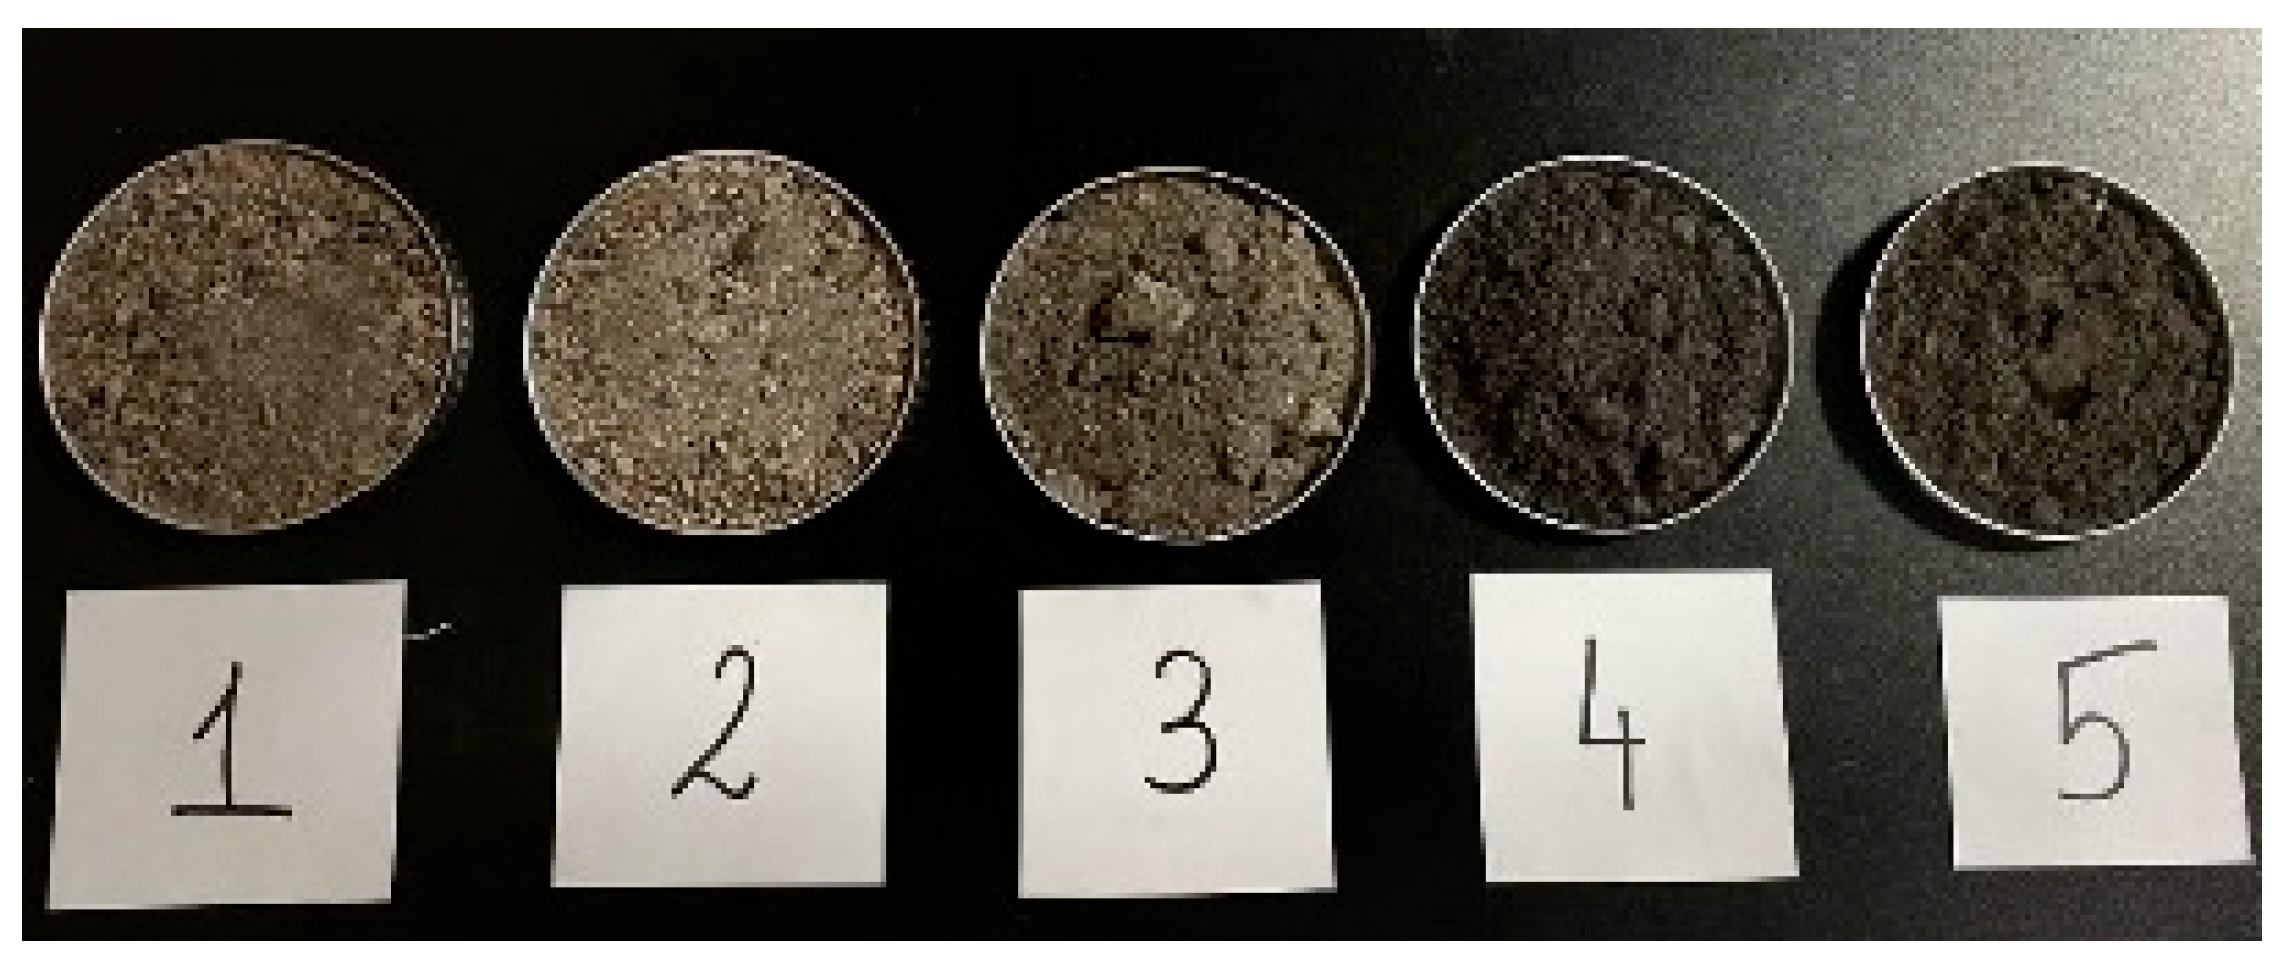
2.1. Waste Coal Ashs

Waste coal ash from a thermal power plant, consisting of bottom ash and gravel mixture (Figure 1), was collected from a landfill located in Tarnów (Poland). Waste material was not included on the list of hazardous waste and was stored in its natural form: wet. Samples marked as AZ1 and AZ2 were taken from the eastern section of the landfill, the area of the pipeline outlet, while samples marked as AZ3 and AZ4 were taken from the western section, also the pipeline outlet. Sample AZ5 was an average material, which, due to the planned permeability tests, had to be taken in larger quantities, approximately 50 kg, and was then properly secured for testing.

2.2. Technical Analysis
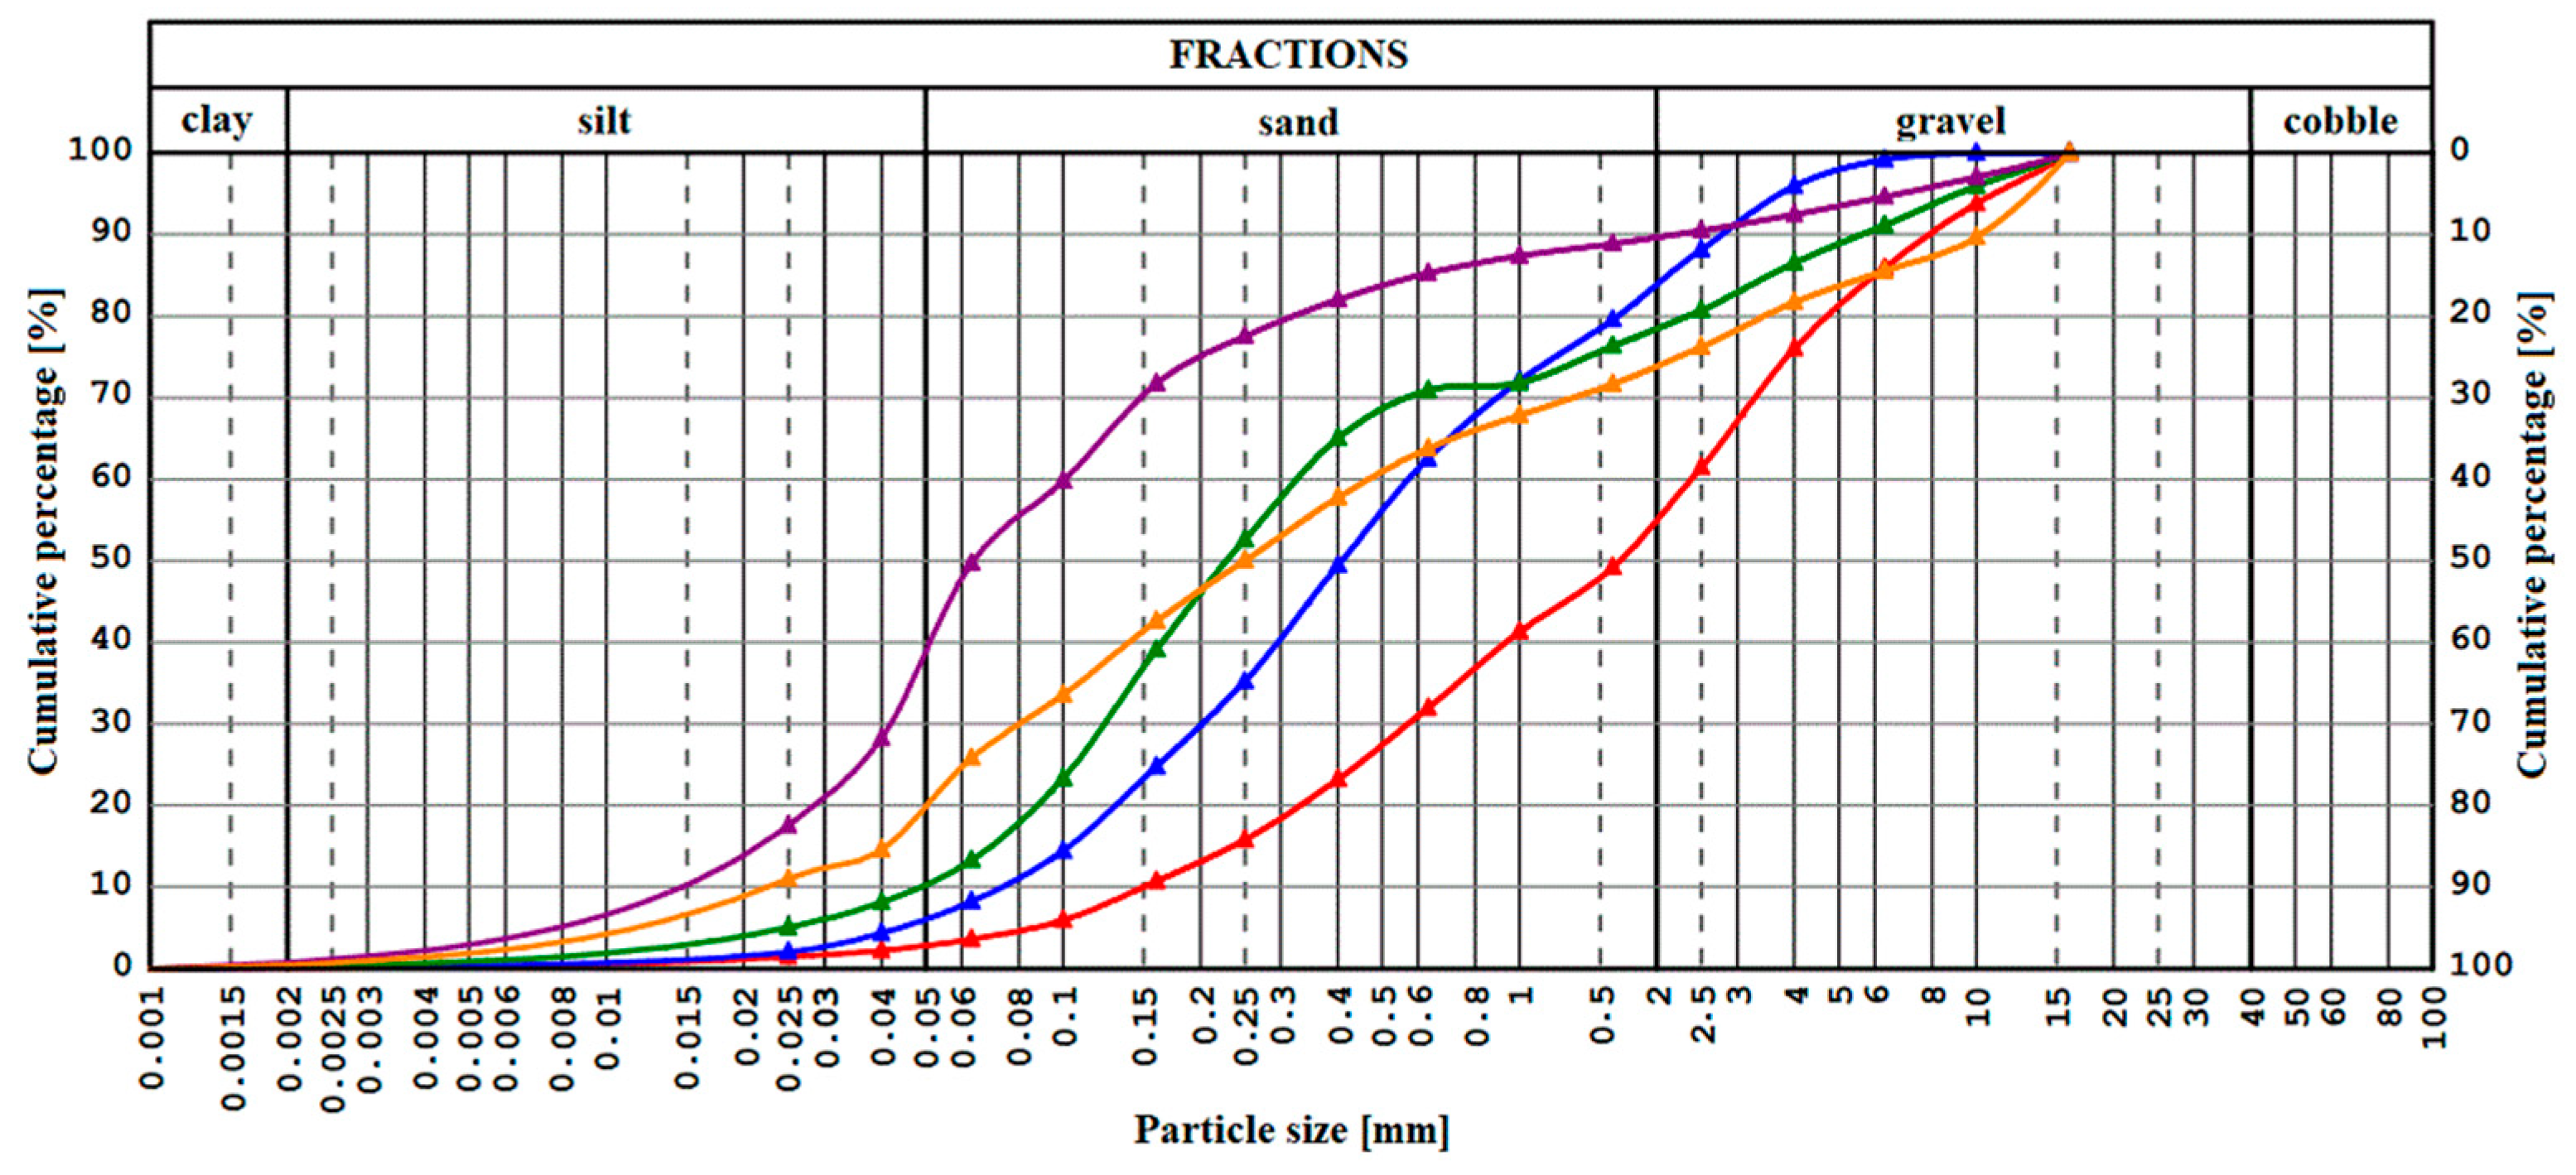
The natural moisture content and absolute density of the waste coal ash delivered to the laboratory were determined by using the procedures included in the standard PN-EN 1097-5:2008 [23] for mineral aggregate testing. The AZ1–AZ5 samples were dried in a ventilated dryer and then weighed. The absolute density of the waste samples was measured by helium pycnometry using an AccuPyc 1340 (Micromeritics, Norcross, GA, USA) [24].

2.3. Sieve Analysis

An analysis of the grain size composition was performed according to PN-EN 12620+A1:2010 [25], consisting of the sieving of the supplied waste material into fractions with specific diameter ranges in mm: >10, 10–6.3, 6.3–4.0, 4.0–2.5, 2.5–1.6, 1.6–1.0, 1.0–0.63, 0.63–0.4, 0.4–0.25, 0.25–0.16, 0.16–0.1, 0.1–0.063, 0.063–0.04, 0.04–0.025 and <0.025 mm. Each of the separated fractions were weighed, and then histograms and grain size curves were constructed.

2.4. Leaching of Soluble Components

Studies on the leaching of soluble components from samples of coal ash mixtures, AZ1 and AZ3, were made in accordance with the PN-EN 12457-1:2006 standard with a solid phase:solution ratio of 1:10 (1 kg:10 L) [26]. The concentration of metal ions and metalloids in the solution was determined by using the ICP OES method (Perkin Elmer Optima 2000 DV ICP–OES spectrometer, PerkinElmer Inc., Waltham, MA, USA), the concentration of anions was determined by using ion chromatography (Thermo Scientific Dionex ICP-1100, Thermo Fisher Scientific, Waltham, MA, USA) and the concentration of carbon was determined by using a carbon analyzer (Shimadzu TOC 5000A, Shimadzu, Kyoto City, Japan). Moreover, pH was determined in water extracts. The obtained pollutant concentrations were converted into loads according to the following formula [26]:
a m o u n t   o f   i n g r e d i e n t   l e a c h e d = C [ L M D + M C 100 ]   [ M g / k g ] ,
where
  • C —the ingredient concentration (mg/L).
  • L —the volume of liquid used (L).
  • MC —the moisture (%).
  • MD —the dry mass of the sample (kg).
The obtained results were compared with the permissible limit values for inert waste to be stored in waste landfills (Journal of Laws, item 1277 of 2015 [27]).

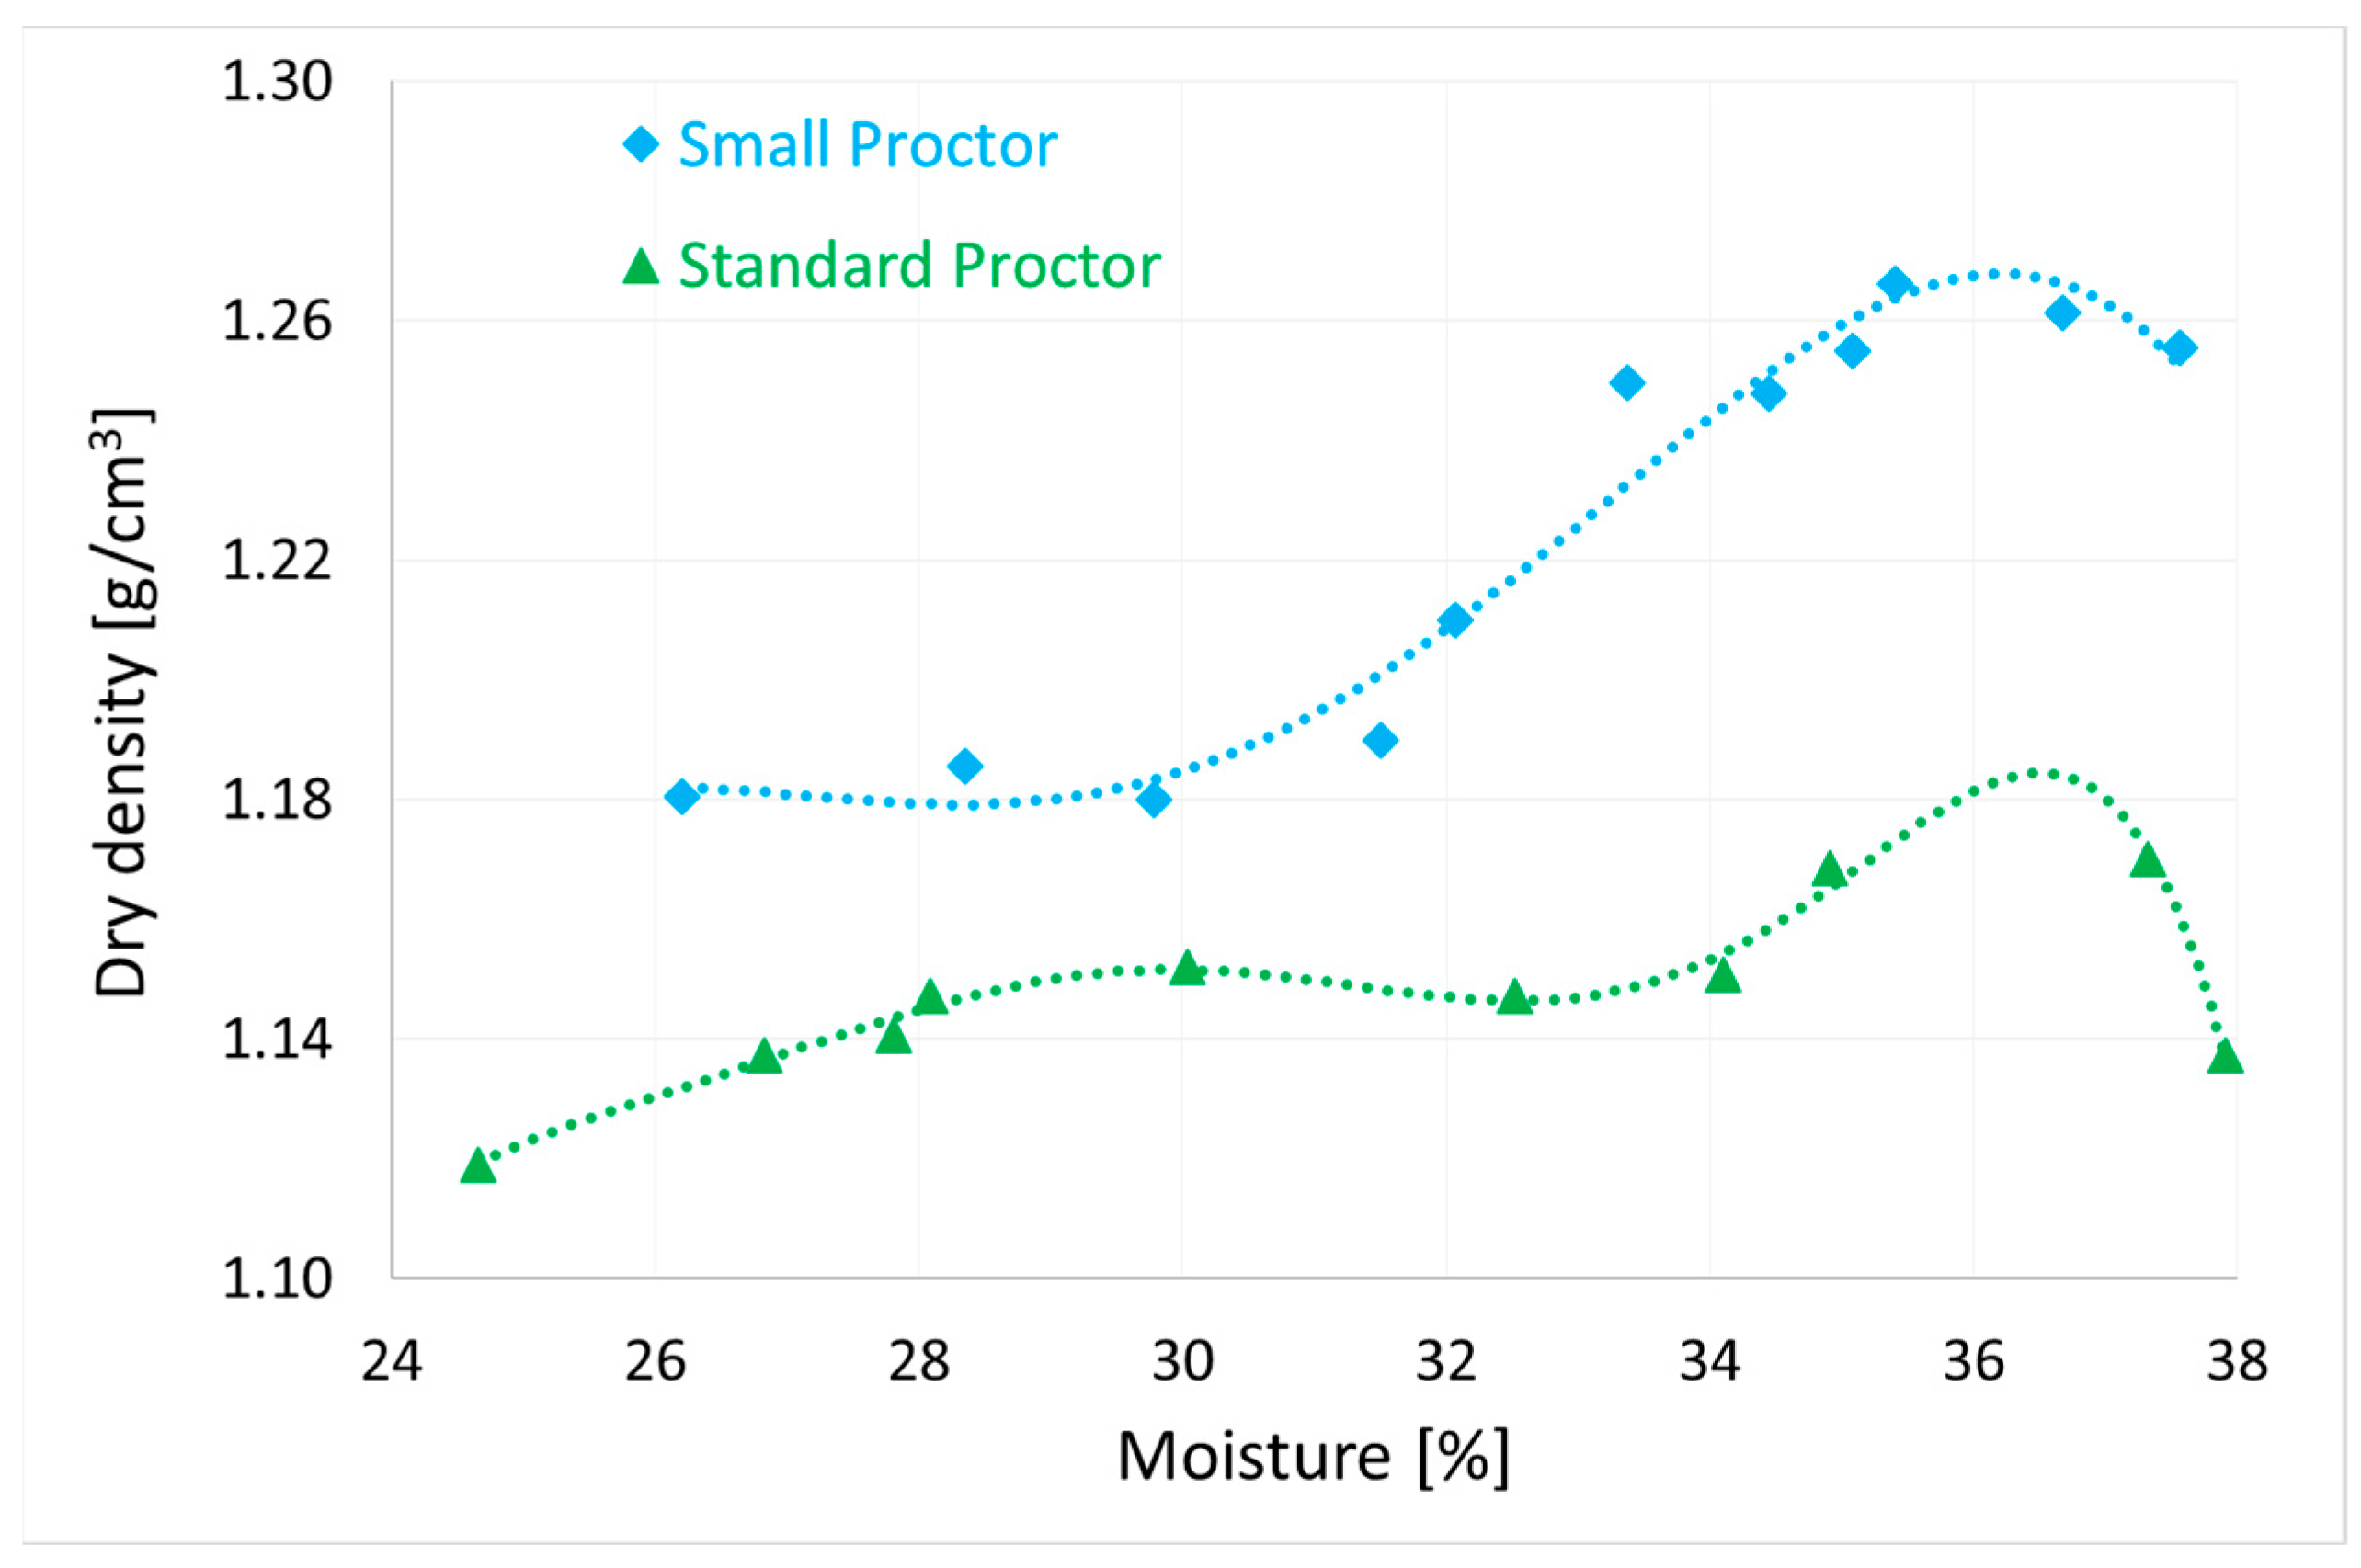
2.5. Compactability Tests

Assuming that the tested waste material behaves like soil, a compaction curve was prepared in accordance with the procedures contained in the PN-B-04481:1988 [28] and PN-EN 13286-2:2010 [29] standards. In order to determine the optimal humidity value at which the waste material can be most compacted, it was necessary to prepare samples with different moisture contents and then compact them in a Proctor apparatus [28]. The compaction process involved compacting several layers of soil in a cylindrical container with energy specified by the standard [29]. This is due to the fact that the conditions of soil compaction in laboratory conditions must correspond to the conditions of compaction of the embankment in situ. Two containers adapted to the Proctor method were used: a small one to save material and plot a test compaction curve, and a large commercial Proctor apparatus [29]. The tests for the waste compaction parameters were carried out at a compaction energy from 0.59 to 0.63 MJ/m3. The diameter of the permeability test sample compacted in the Proctor container had to be greater than five times the diameter of the largest grain. It was necessary to adjust the upper grain size to the size of the sample being prepared by separating the oversize grain. In the case of a standard container, grains larger than 20 mm were sifted out, while subgrains < 20 mm were intended for forming samples. Material with a grain size of <8 mm was used to form the samples in a small container.
The compaction index I S was expressed as the ratio of the bulk density of the soil in the embankment ( ρ d ) to the maximum value of bulk density ( ρ s ) [28]:
I S = ρ d ρ s .
Based on the compaction curve, three samples were formed from the AZ5 material with different I S compaction indices. Samples for permeability testing, made by using the standard Proctor apparatus [29], were cylindrical with dimensions φ100 mm × 100 mm. The AZ5 waste was compacted by using a 2.5 kg rammer, lowered from a height of 30.5 cm and compacting the material in three layers. There were 25 hammer blows for each layer. Compacting the material with humidity close to the optimal one allowed us to obtain an I S compaction index of 0.964, 0.98 and 1.00. The formed samples were transferred to a flexible cover and closed at the top and bottom with porous stones. The material prepared in this way was installed in a triaxial test chamber to test water permeability through cohesive soils.

2.6. Permeability Tests

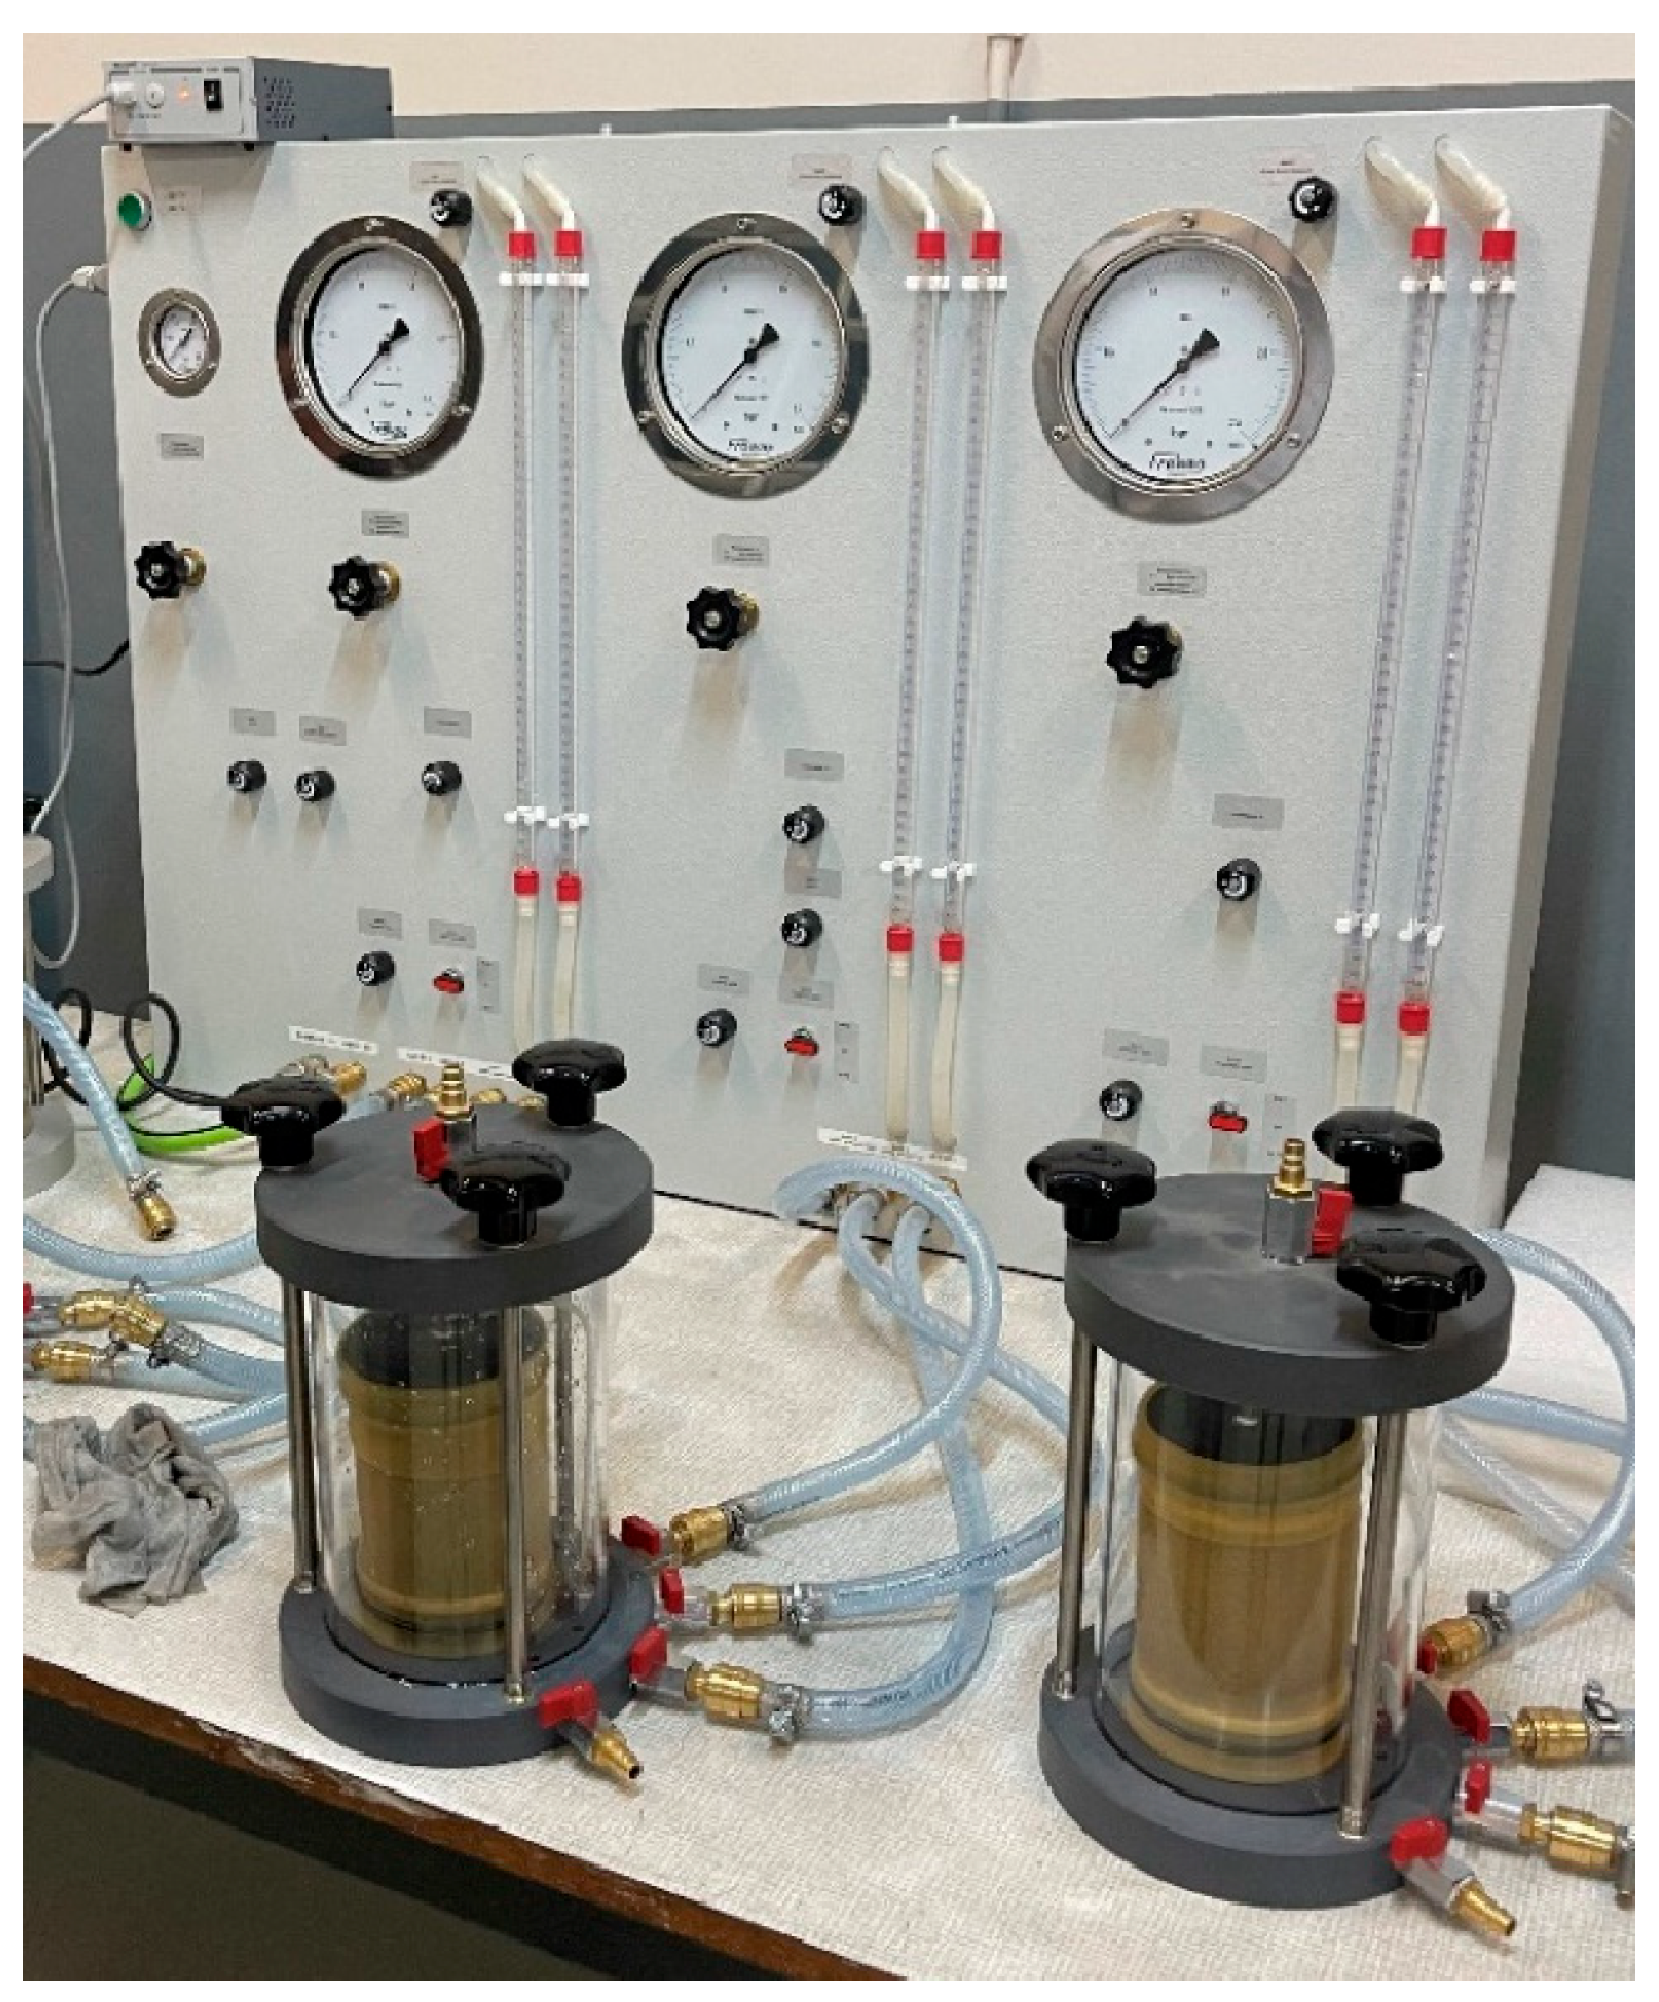
2.6.1. Triaxial Compression Apparatus

To analyze the permeability of waste coal ash, measuring equipment from Fröwag (Germany) was used, using a three-axial pressure system to test the permeability of cohesive and noncohesive soils (Figure 2). A triaxial compression apparatus with a working pressure of 2.5 bar consisted of a tank supplying water to the system; a pressure chamber in which the sample was placed (Figure 2); a water source; two burettes; and manometers enabling the setting of the PH hydrostatic pressure and the regulation of liquid pressures at the inlet and outlet of the sample, P1 and P0, respectively. In the compression apparatus, a sample with dimensions φ100 mm × 100 mm was placed in a cover with flexible walls and then installed in the pressure chamber (Figure 2). The chamber was filled with water, which exerted even pressure on the front, bottom and side surfaces of the sample. The triaxial compression apparatus allowed for the experimental determination of the permeability coefficient in two vertical directions of liquid flow, from top to bottom and from bottom to top.

2.6.2. Measurement Procedure

The filtration properties of the waste coal ash under hydrostatic pressure were measured in accordance with the procedure described in ISO 17892-11:2019 [30]. The value of the permeability coefficient was taken as the arithmetic mean of the measurement results obtained for both directions of water flow through the sample. During the measurement, the water temperature was controlled and the level difference in the burettes was measured.
The waste coal ash samples intended for water permeability measurements were subjected to the process of soaking with water in the chamber of the triaxial compression apparatus (Figure 2). Each sample was left in the chamber for 3–4 days, assuming that, after this time, it was fully saturated. During the permeability test, the samples were loaded with a hydrostatic confining pressure ranging from 0.5 to 1.8 bar, which corresponded to depths ranging from 2.17 to 7.83 m. The calculation of the confining pressure value into depth was based on the height of the soil column, the real density of the tested waste and the value of acceleration due to gravity. During the measurements, the direction of water flow was alternately changed to obtain 10 measurements from top to bottom and 10 from bottom to top. A total of 20 measurement points were then averaged for the permeability coefficient in specific conditions.
The permeability coefficient measurements were performed with a constant hydraulic gradient as well as with a constant flow [30]. The tests consisted of determining the amount of water that will filter through a soil sample with a cross-section A in time t at the hydraulic gradient i and at the determined water temperature [10,17,18,19,20,21,22,23,24,25,26,27,28,29]. The hydraulic gradient i was calculated according to the following formula [30]:
  i = Δ h l ,
where
  • l—the sample height (m).
  • Δh—the hydraulic head difference (m).
The value of the permeability coefficient k was calculated from the following formula [30]:
k = Q A × i × t m s ,
where
  • Q—the filtration efficiency (m3).
  • A—the cross-sectional area of the sample (m2).
  • i—the hydraulic drop (-).
  • t—the measurement duration (s).
Next, the permeability coefficient values were converted to the reference temperature according to the following formula [30]:
k r e f = k × η p o m η r e f [ m s ] ,
where
  • η r e f —the water viscosity at the reference temperature (Pa × s).
Water permeability tests, performed as part of a single measurement cycle, included determining the permeability coefficient for subsequent waste samples with a variable density index under various confining pressure conditions. These were 0.5, 0.8, 1.0, 1.3, 1.5 and 1.8 bar. The ΔP values in the tests were 0.3, 0.5 and 0.8 bar.

3. Results and Discussion

3.1. Technical Parameters

Table 1 lists the basic technical parameters of the waste material samples delivered to the laboratory, including the AZ5 sample selected for permeability testing. The moisture content of the raw material varied from 10.30% to approximately 30%. The actual density of the waste coal ash was 2300 kg/m3.

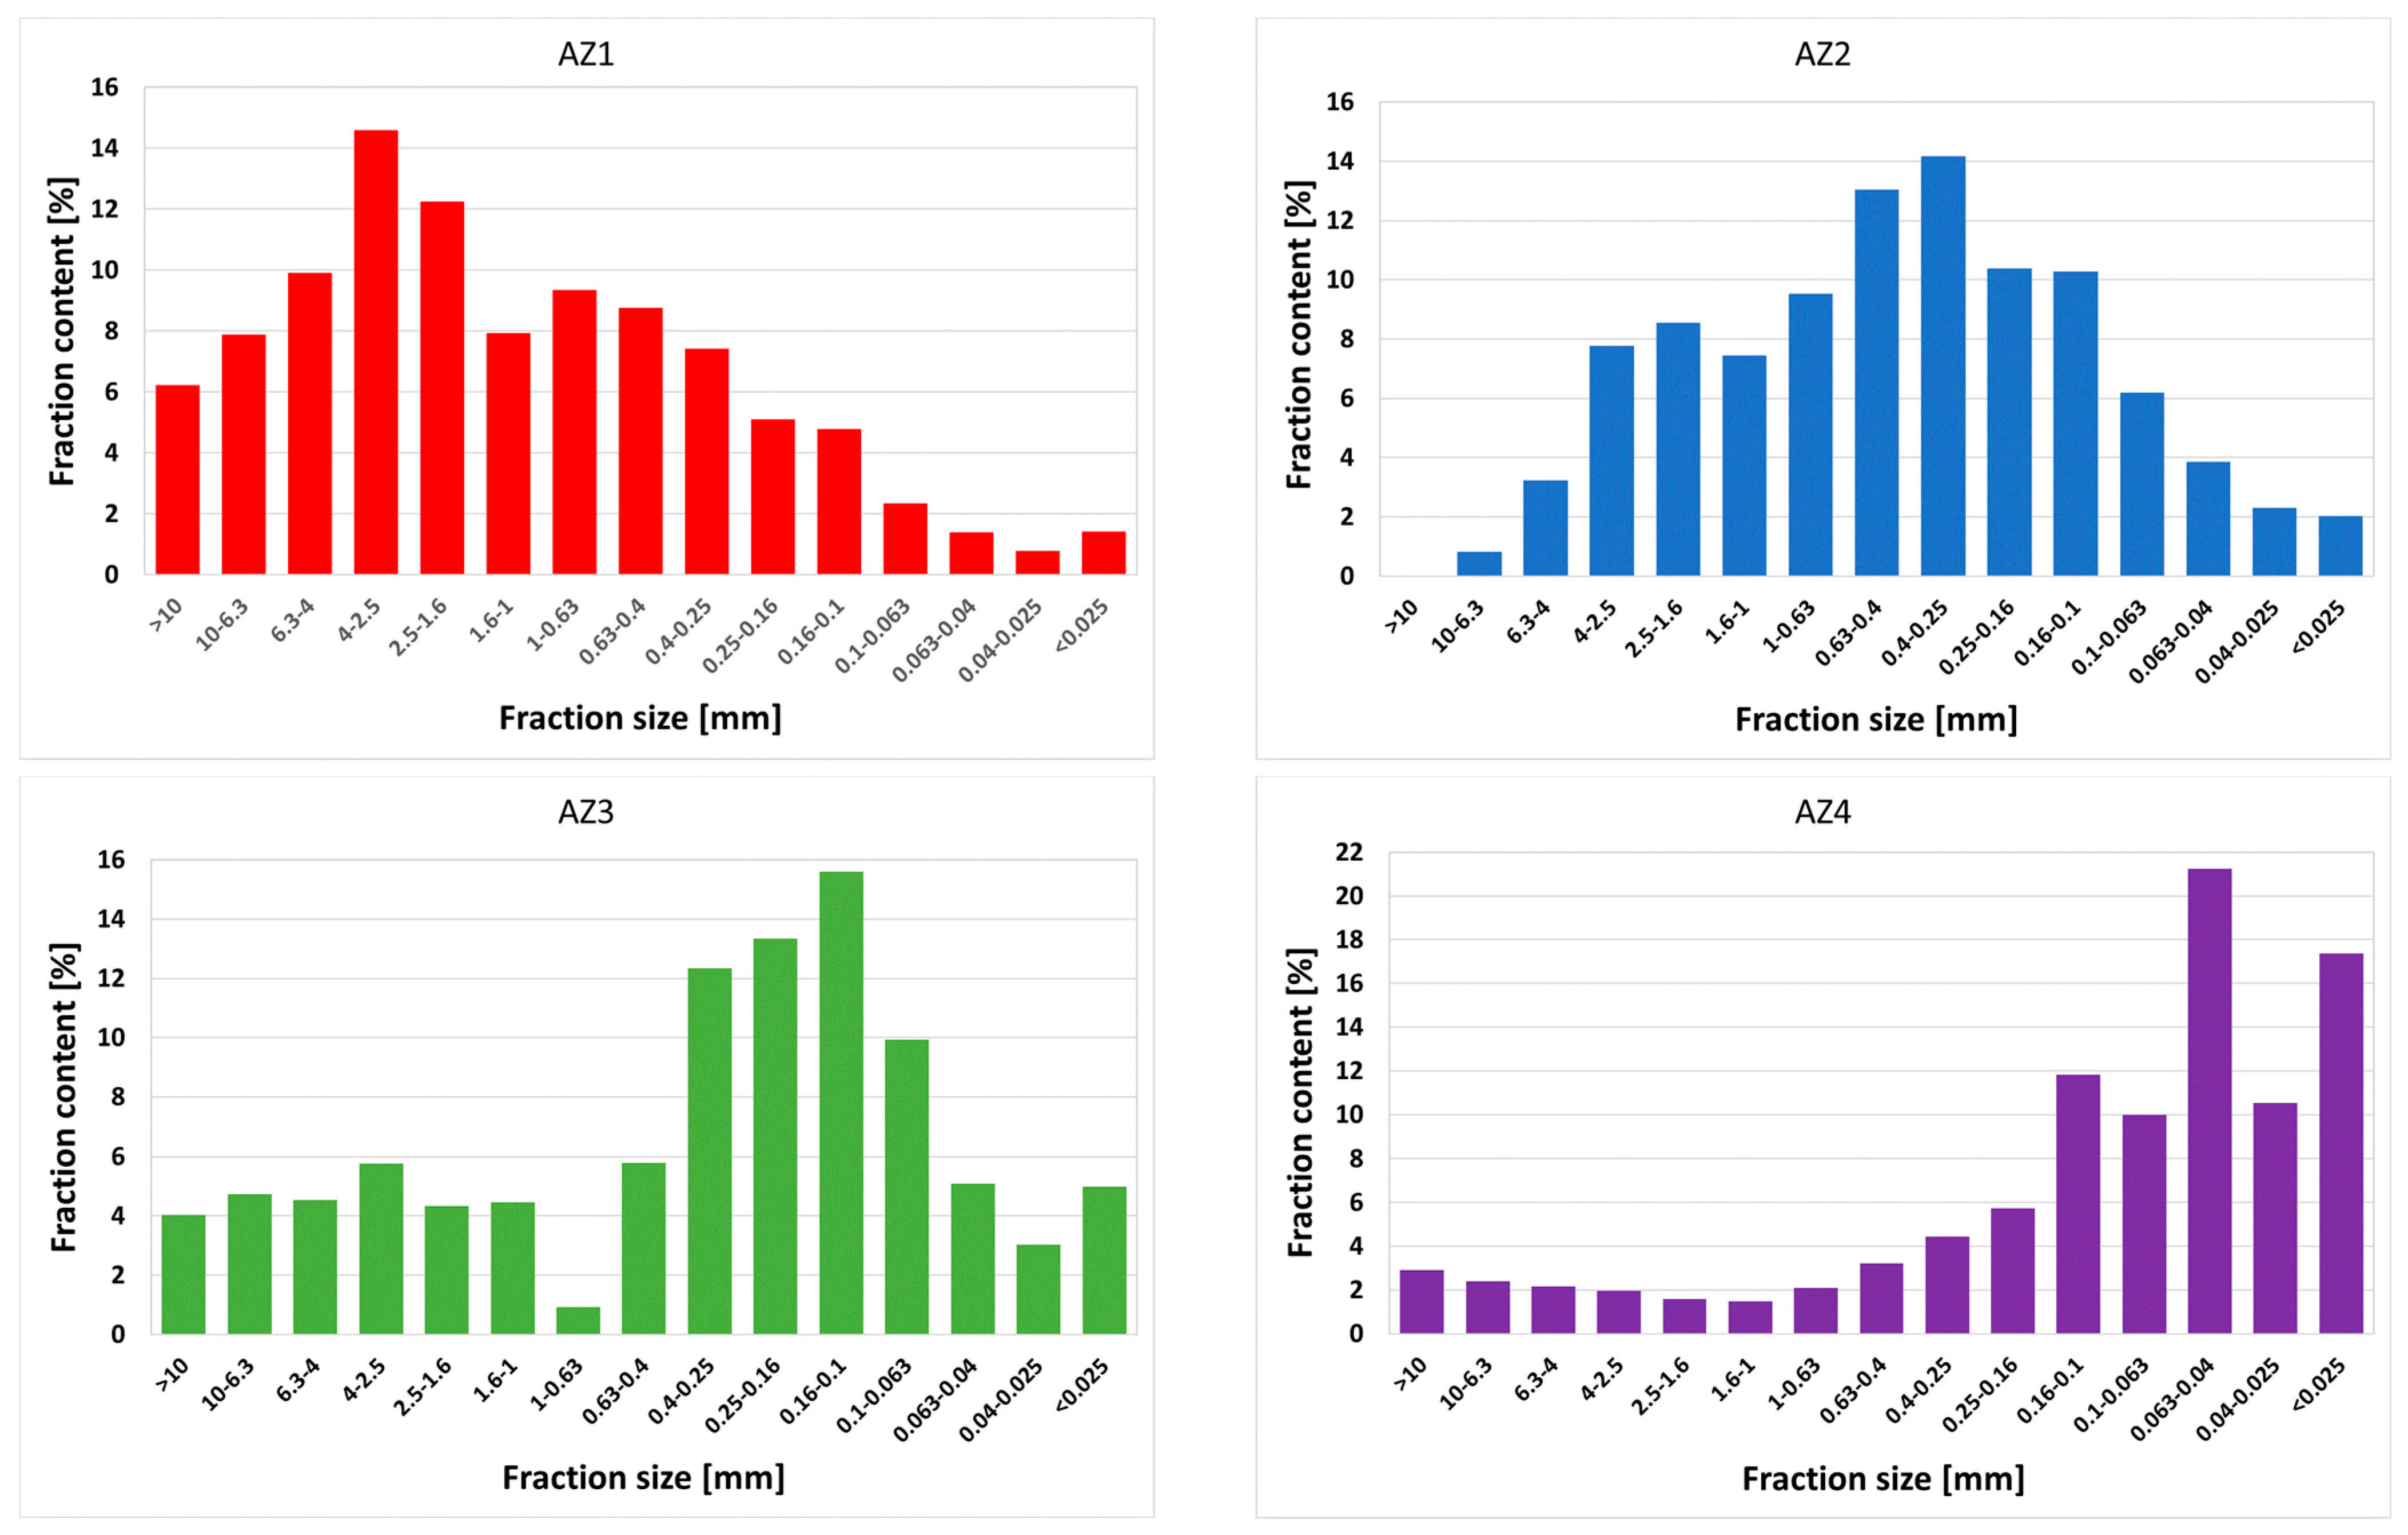
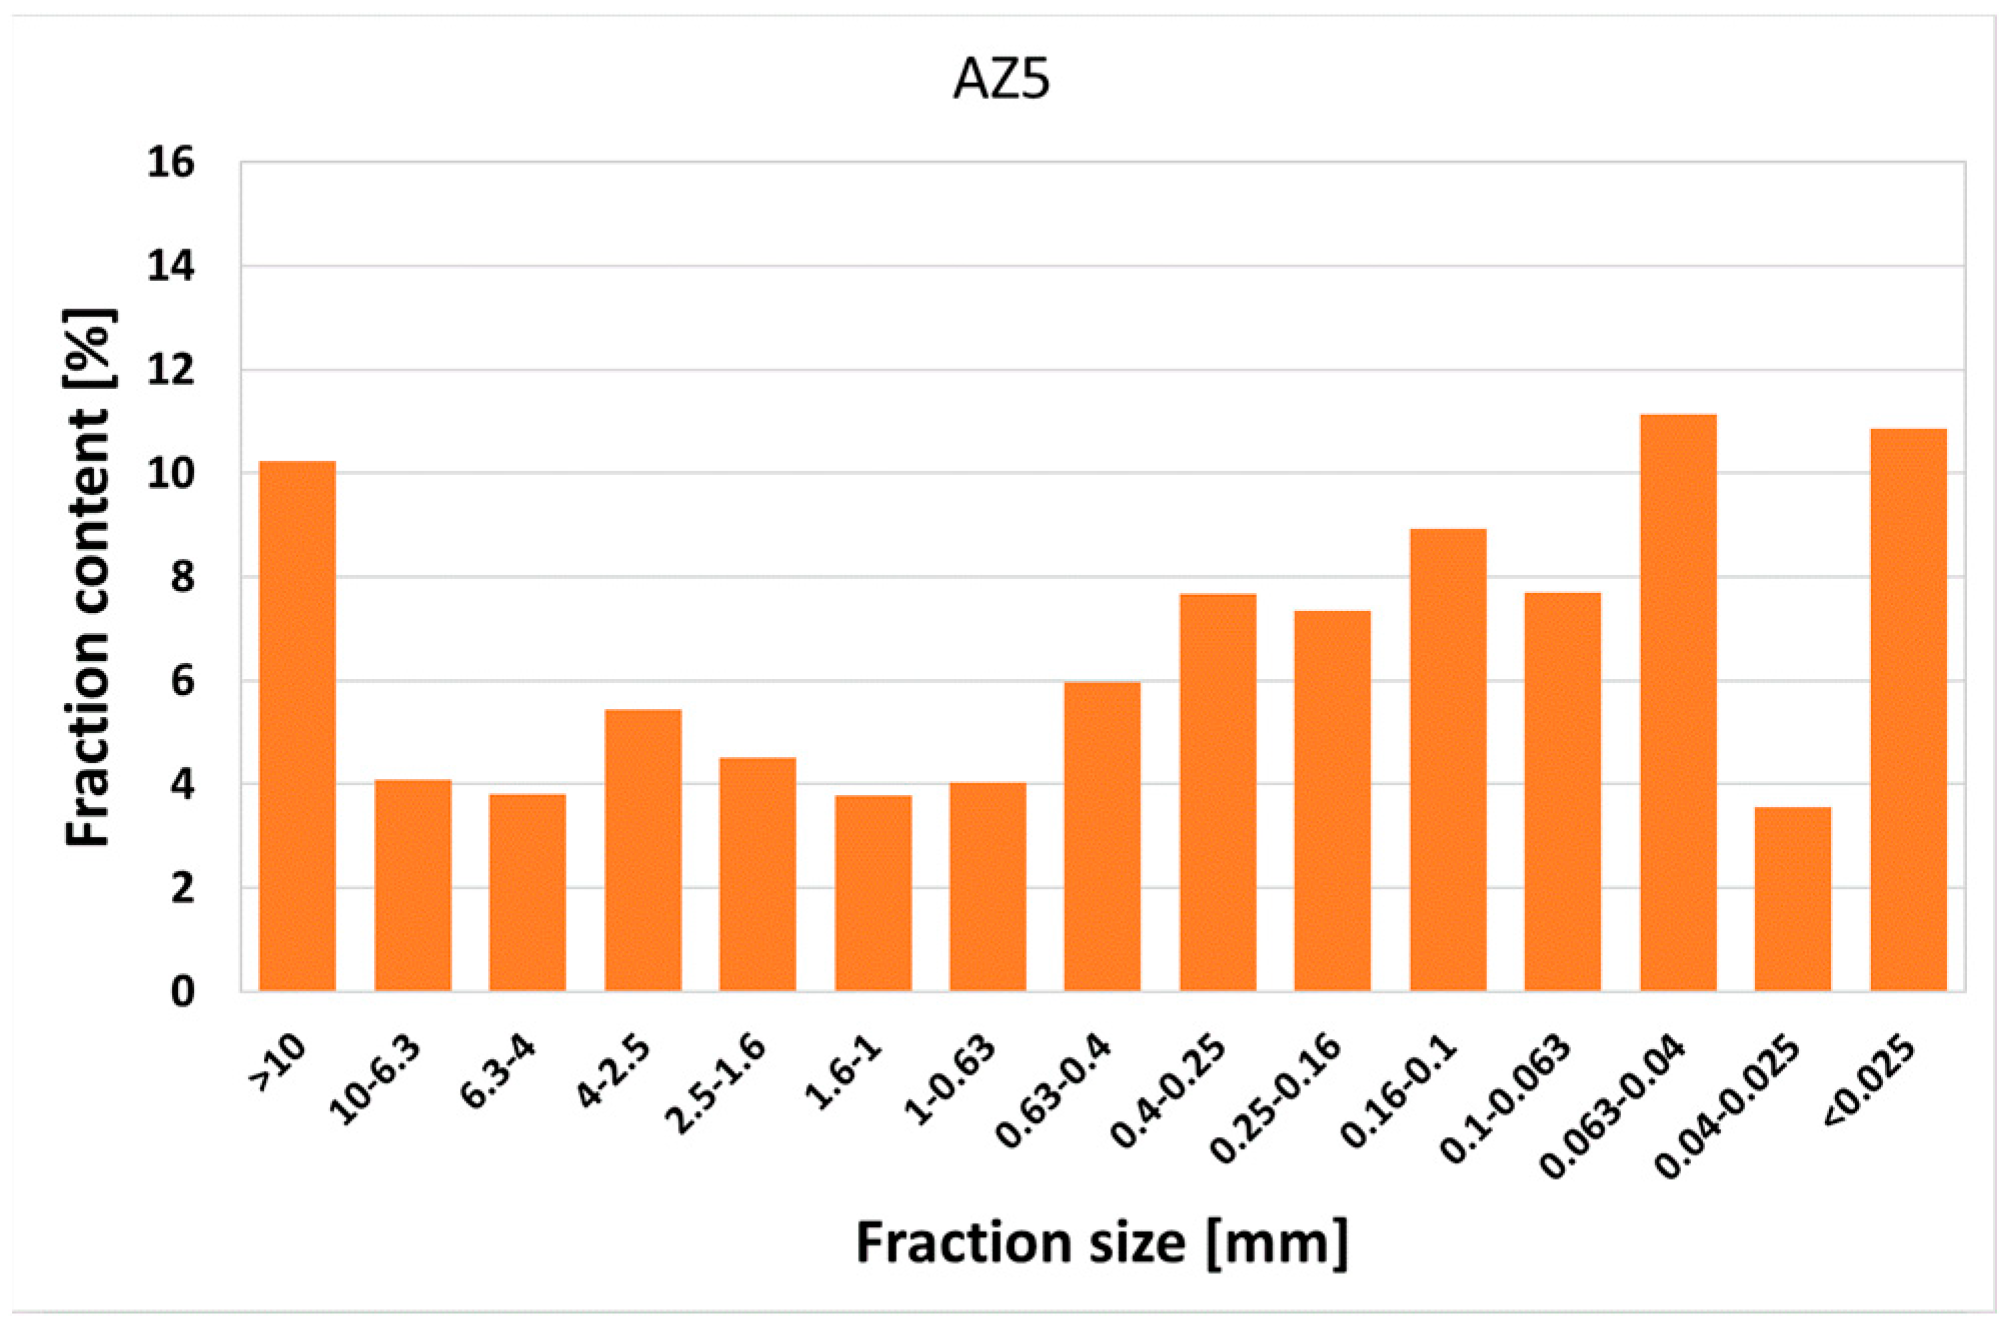
3.2. Granulometric Analysis

Figure 3 shows histograms of the content of individual grain fractions in the coal ash samples while Figure 4 shows a comparison of the grain size curves of the tested samples. According to Figure 4, the waste samples were characterized by significant differences in grain size. In the AZ1 sample, the fraction from 1.6 to 4.0 mm dominated, and in samples AZ2 and AZ3, fractions with grain sizes ranging from 0.16 to 0.63 mm dominated. Samples AZ1 and AZ2 had a small share of the ultrafine fraction below 0.04 mm, while in AZ2, there were no grains above 10 mm at all. In sample AZ3, the smallest share was in the middle fraction from 0.63 to 1.0 mm. Samples AZ4 and AZ5 had the most uniform grain distribution, and in both samples, the fraction with a particle size of 0.04 to 0.063 mm dominated.
The grain size distribution for all the waste samples, presented in Figure 4, shows that the sand fraction dominated, as its share in the tested samples ranged from 50% to 85%. The delivered waste was a mixture of the dust fraction ranging from approximately 5% to 20% (in the case of sample AZ4, approximately 40%) and the gravel fraction ranging from 5% to 50% depending on the sample. The content of the clay fraction in the waste did not exceed 2%. According to the classification of ashes in terms of grain size, it can be stated that sample AZ4 belongs to medium-grained materials, while the remaining samples, marked as AZ1, AZ2, AZ3 and AZ5, belong to coarse-grained materials [10]. Large differences in the granulometric composition usually resulted in different geotechnical properties.

3.3. Leaching Test Results

The results of the leaching tests showed that water extracts from the waste coal ash mixtures were characterized by an alkaline reaction, with pH values ranging from 9.34 to 9.55. Therefore, the leaching of metal ions and metalloids was low, not exceeding the permissible values for waste permitted for disposal in landfills. The exception was selenium in the AZ3 sample (see Table 2).
Moreover, the exceeded values of leachable fluoride loads were found (sample AZ3). Direct extraction with methylene chloride of the waste showed no organic fraction (<0.01 mg/100 mg of the initial substance).

3.4. Compactability Tests

Figure 5 presents the compaction curves of the AZ5 waste showing the dependence of the bulk density on the moisture content. The compaction curve was the relationship between the moisture of the material and the dry density of the soil framework ( ρ d ) [31], which determined the quality of the material compaction. From the obtained curve, the optimal soil moisture was determined, at which the maximum material compaction was achieved. The compaction curve was a standard curve for determining the compaction index I S , characterizing the quality of the soil compaction in the embankment.
Table 3 lists the parameters of three samples formed from the AZ5 waste with different I S compaction indices of 1.0, 0.98 and 0.964. The bulk density of the samples was 1.17 g/cm3 for the sample with a compaction index of 1.0, 1.146 g/cm3 for the sample with a compaction index of 0.98 and 1.138 g/cm3 for the sample with a compaction index of 0.964. The moisture content of the samples determined from the Proctor curve was 36.5% (optimal), 31.1% and 26.2%.

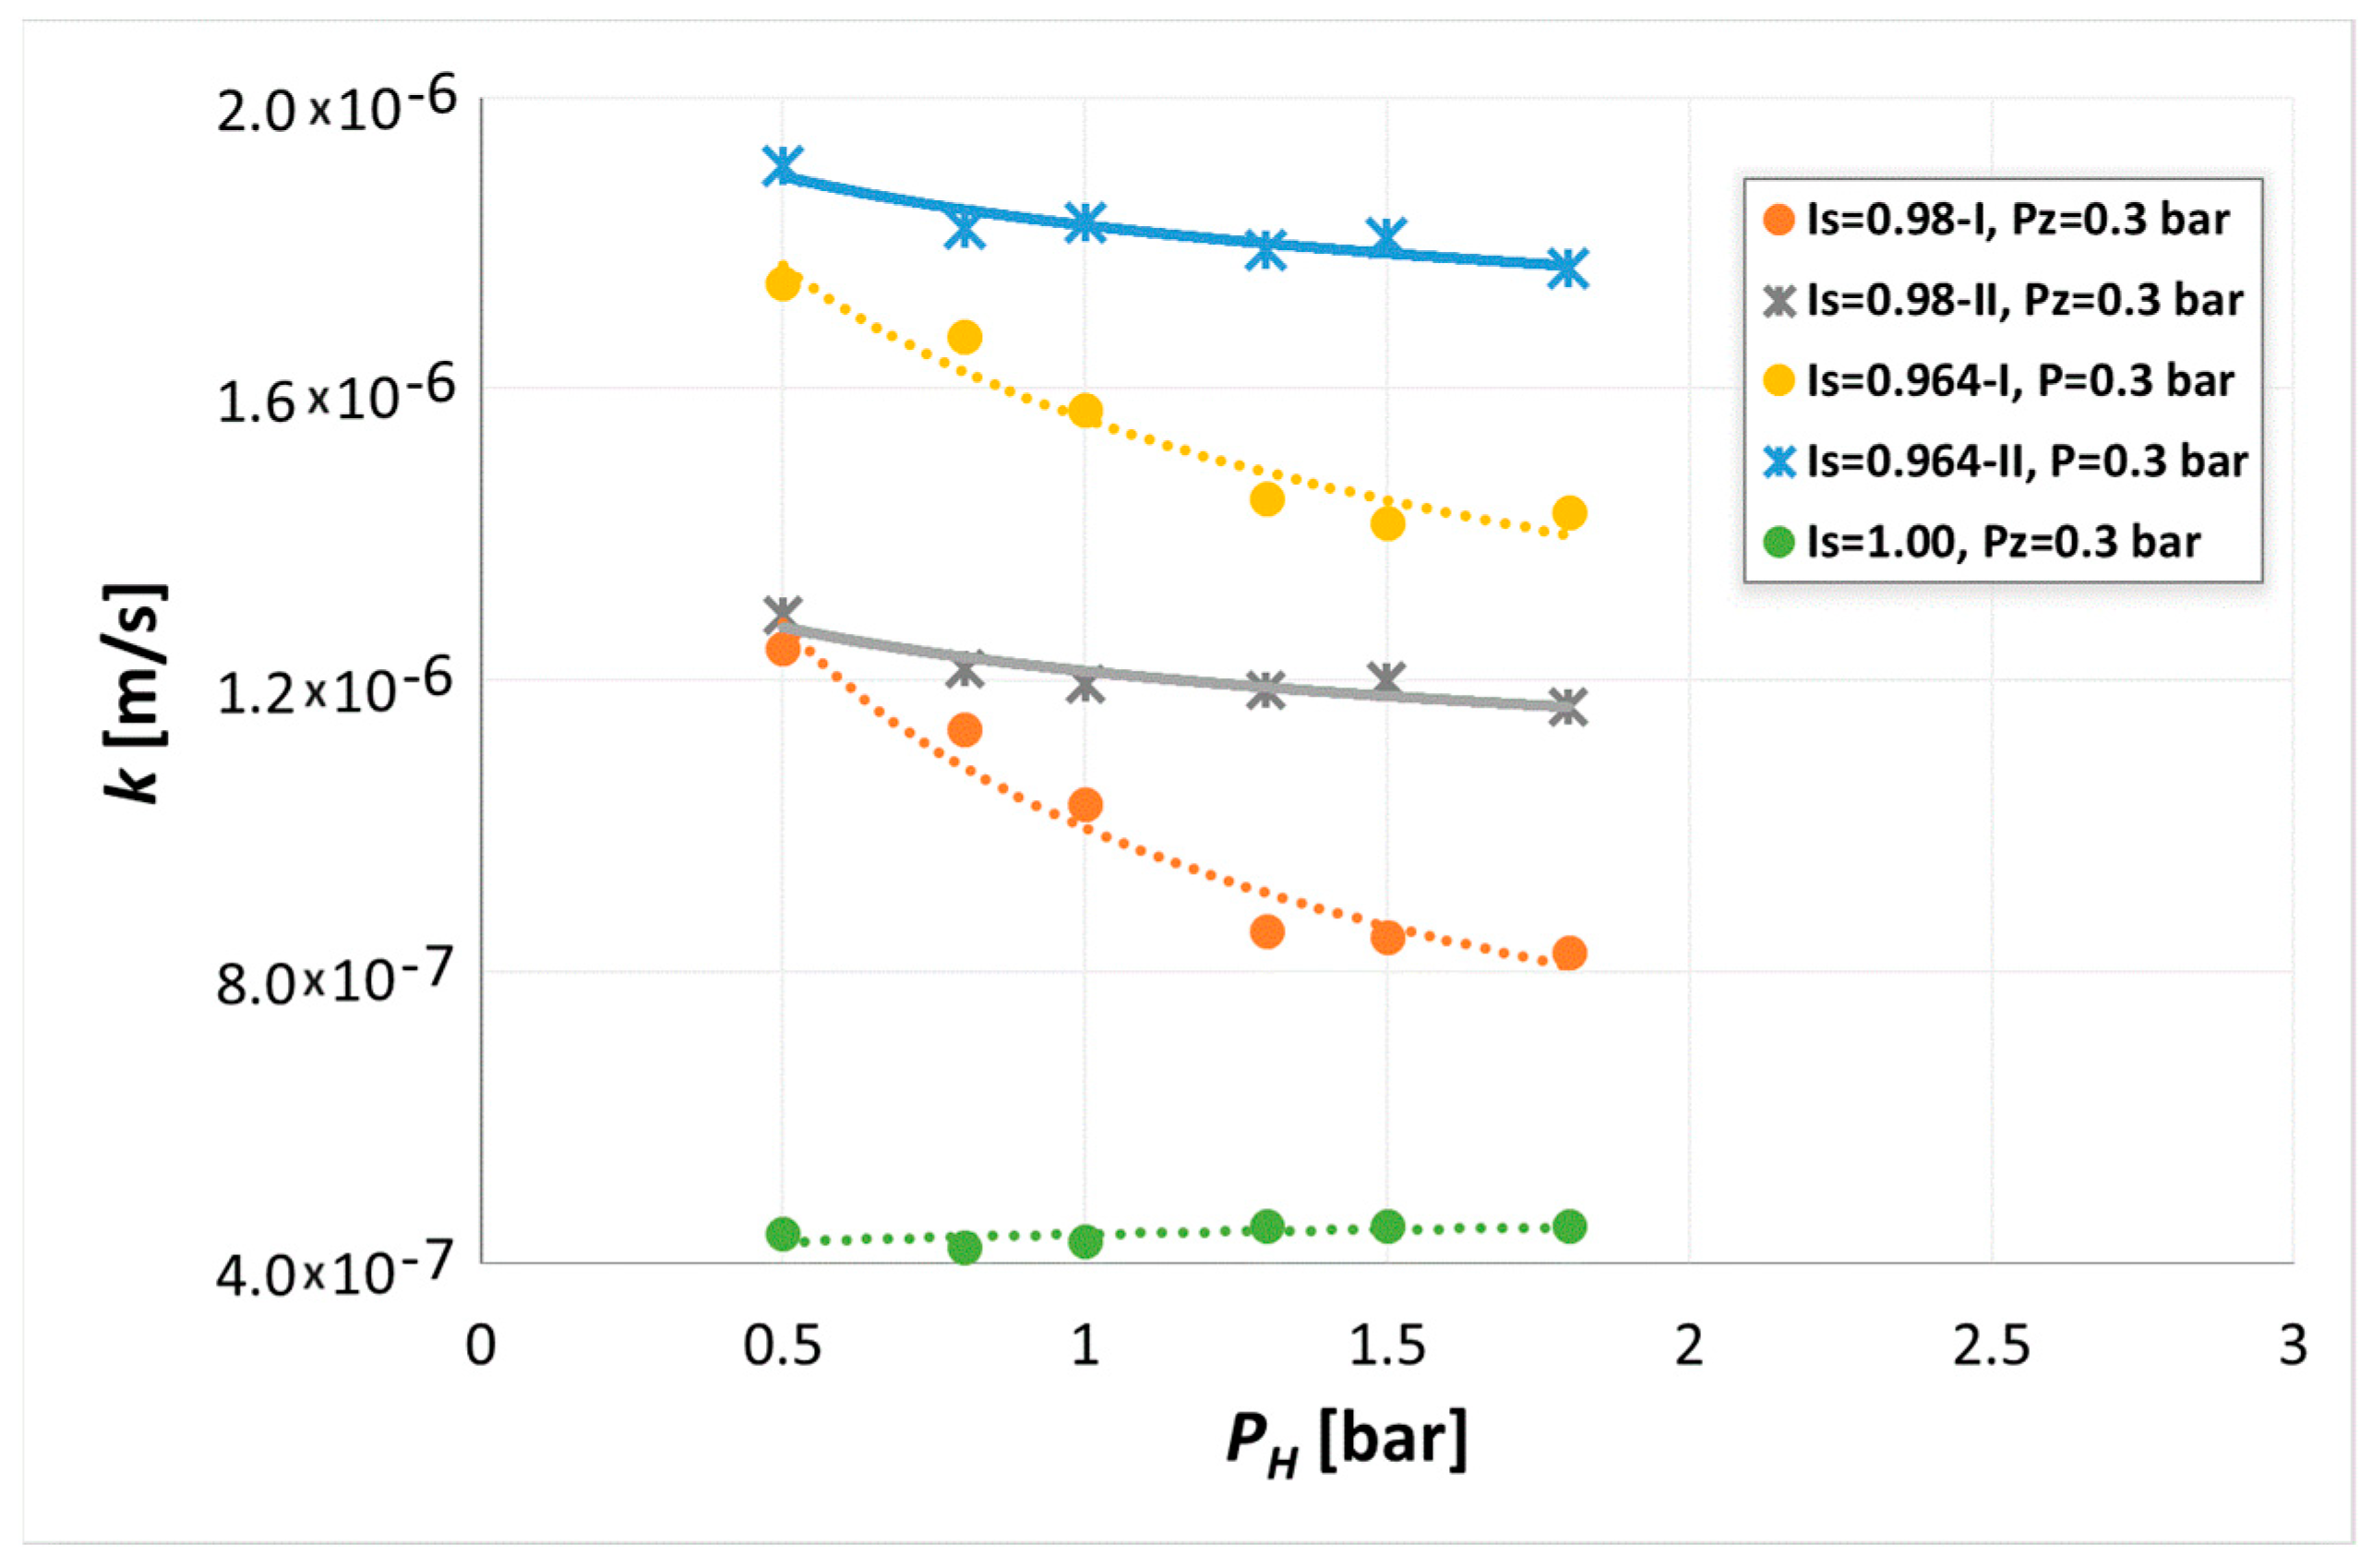
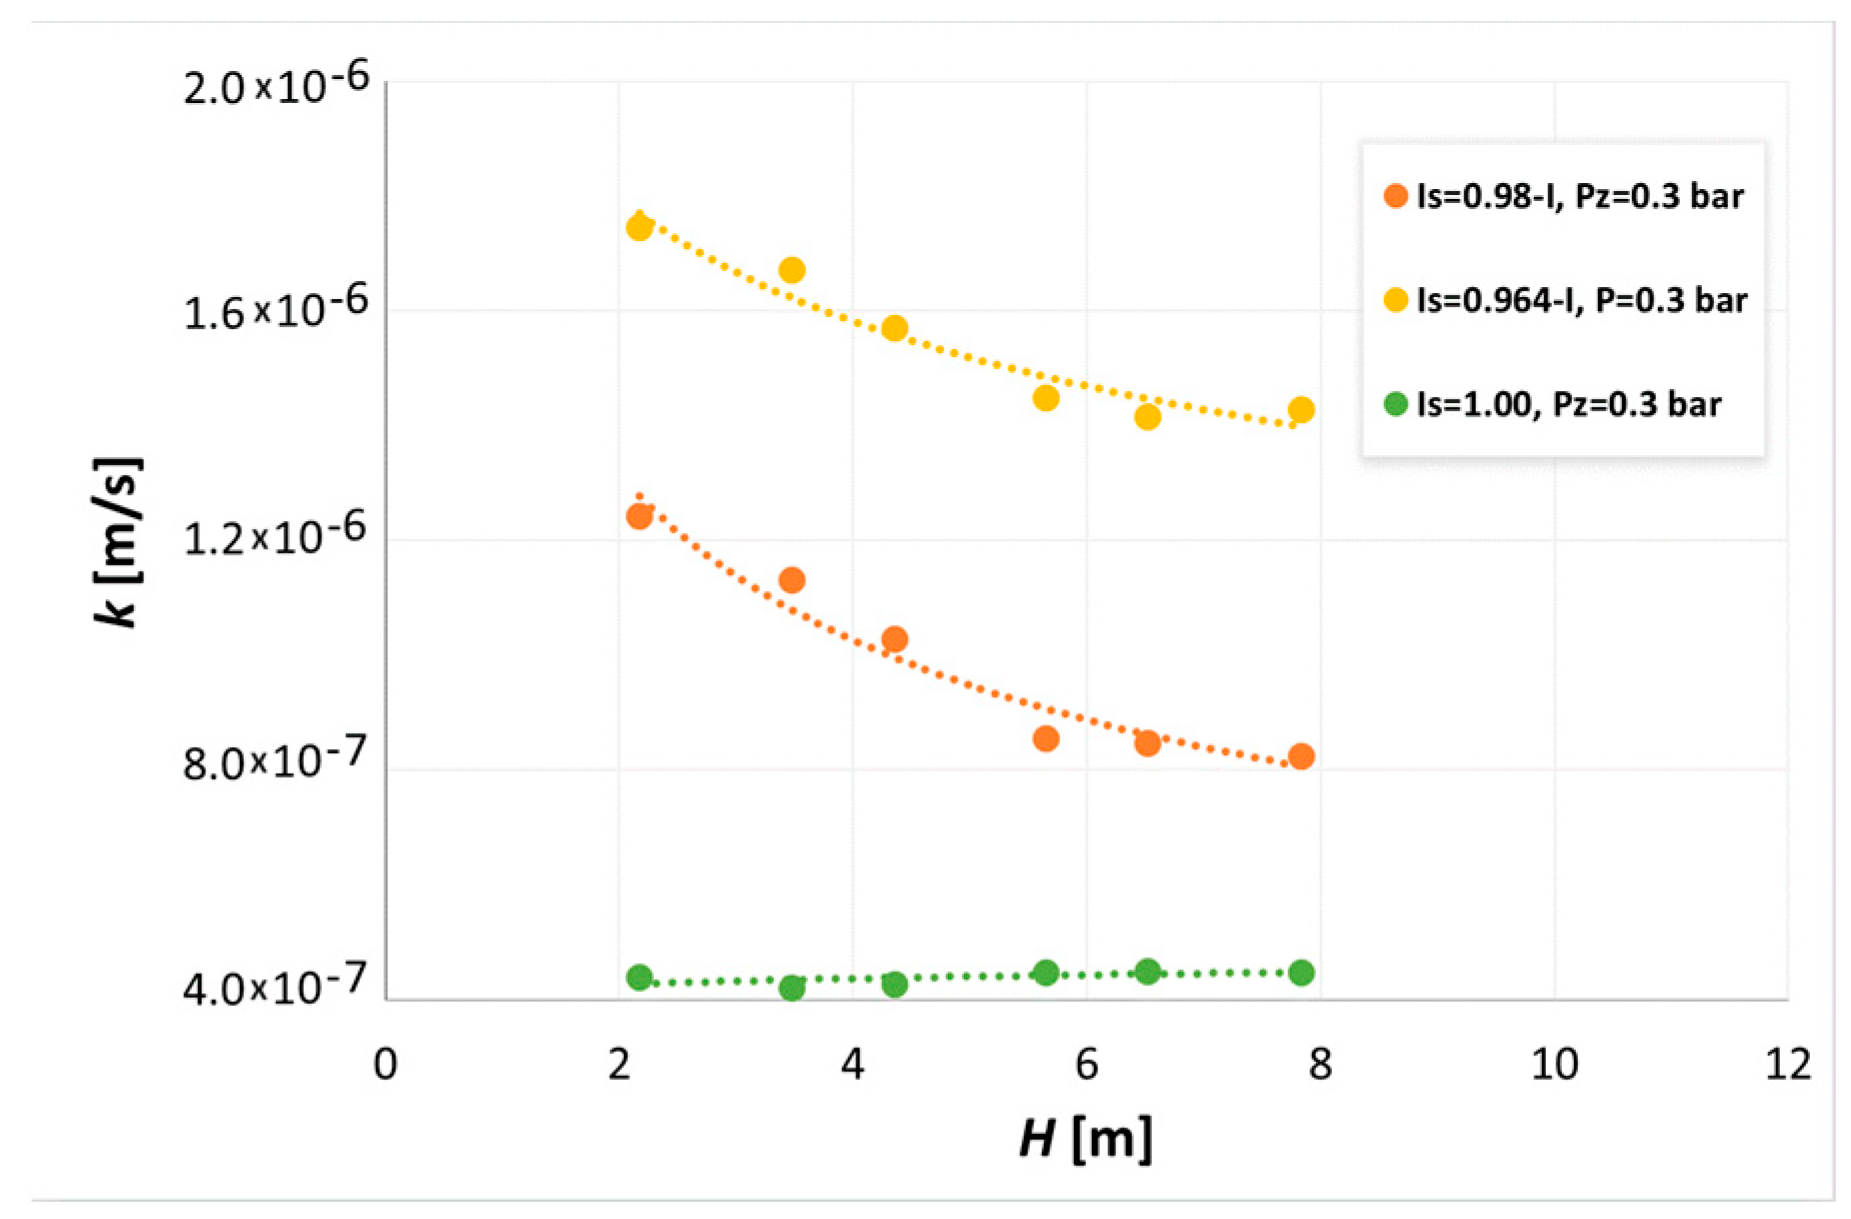
3.5. Permeability Measurements

Figure 6 presents the variability of the k permeability coefficient for all measurement cycles under the influence of changes in the hydrostatic pressure. The dashed line shows the variability of the permeability coefficient in cycle I, while the solid line shows its variability in cycle II. According to Figure 6, the permeability coefficient was dependent on the hydrostatic pressure. For samples with a compaction index of 0.964 and 0.98, a decrease in material permeability was observed according to a power–law tendency. In the case of a sample with a compaction index of 1.00, changes in the permeability coefficient were negligible. The tested waste, having the maximum bulk density, did not respond to the increase in the confining pressure applied in the three-dimensional compression apparatus.
The average values of permeability k ranged from 4.4 × 10⁻⁷ to 1.91 × 10⁻⁶ m/s. The permeability coefficient classified waste coal ash as semipermeable soil. As can be seen from Figure 6, samples with compaction indices I S = 0.964 and I S = 0.98, subjected to confining pressure in two consecutive loading cycles (I and II), showed different trends in permeability changes with loading. The reduction in the permeability coefficient in cycle I, consisting of a successive increase in the sample hydrostatic pressure, was 26% at the waste density of I S = 0.964 and 33% at I S = 0.98. The reduction in the permeability coefficient in cycle II was 7.5% and approximately 10%. Significantly smaller reductions in the permeability coefficient in cycle II indicated changes in the sample structure caused by the effect of confining pressure in cycle I. Gradually increasing the hydrostatic pressure from 0.5 to 1.8 bar and then reducing the load to the initial value PH = 0.5 bar caused irreversible changes in the sample structure. They could involve the local clumping of material at grain boundaries or larger grains interlocking with each other. As a result of such changes, after removing the load, the permeability of the consolidated and partially modified waste sample did not respond to the increase in the hydrostatic pressure.
Research by Reddy et al. [32] showed that the permeability coefficient of the power plant bottom ash had values similar to those obtained in this study from 1.34 × 10⁻⁶ to 2.01 × 10⁻⁶ m/s; hence, such waste ash can be effectively used as road embankment construction material. In contrast, Szwalec et al. [18] give a wide range of permeability coefficient values for coal waste ash ranging from 3.4 × 10⁻¹¹ to 2.61 × 10⁻² m/s. Low water permeability coefficients (from 1.16 × 10⁻⁵ to 1.27 × 10⁻⁵ m/s) obtained by Lange et al. [19] were explained by the chemical composition of the bottom ashes and slags containing large amounts of unburned carbon particles. According to researchers, the presence of unburned carbon increases the sorption activity of sediments and slows down the filtration of free water.
Figure 7 and Figure 8 show the differences in the results obtained in individual measurement cycles based on the depth at which the layer of waste subjected to the tested hydrostatic pressures would be located. The presented graphs show differences in the behavior of samples with a compaction index I S   of 0.964 and 0.98 in cycle I and cycle II, respectively. The variability of the permeability coefficient with depth was greater in cycle I, while in cycle II, there was no reduction in permeability that was the effect of cycle I. The relative reductions in the water permeability coefficient in cycle I, resulting from the increase in the depth of the soil layer, amounted to 6.3 × 10⁻⁸ and 8.0 × 10⁻⁸ m/s for each 1 m increase in depth for the sample with I S = 0.964 and I S = 0.98, respectively. The relative reductions in the permeability coefficient in cycle II with depth were approximately 2.0 × 10⁻⁸ m/s for both samples for each 1 m increase in depth.
The waste samples were characterized by a higher permeability coefficient in cycle II. The influences of hydrostatic pressure and the corresponding depth of the soil layer were 3–4 times smaller in cycle II than in cycle I. The explanation of the waste coal ash behavior in the second cycle may be the irreversible changes that occurred in the structure of the samples subjected to the first loading cycle.
It can be seen in Figure 8 that hydrostatic pressure reduced the permeability of the waste coal ash. This indicates that the water flow paths through the waste material were closed to a certain limit value, appropriate for each degree of density. According to Kaczmarczyk [14], the permeability of cement materials depended on the presence of pores and a network of channel connections, which allowed for the use of bottom ashes in geotechnical works and in construction processes.
Figure 9 and Figure 10 show the influence of hydrostatic pressure on the value of the permeability coefficient determined at different pressure gradients ΔP. The results obtained for different filtration velocities showed a consistent trend in changes in the permeability coefficient for both studied samples ( I S = 0.964 and I S = 0.98). As may be seen in Figure 9 and Figure 10, the hydraulic gradient had an influence on the water filtration rate. As the hydraulic gradient increased, an increase in the water permeability coefficient was observed. It should be emphasized, however, that the measurement series performed at a gradient of 0.3 bar enabled the optimal performance of the measurement procedure and enabled us to obtain results with a low measurement error.
The influence of the hydraulic gradient on the change in the water permeability coefficient was described in the work by Lange et al. [19]. The value of the hydraulic gradient was progressively increased from 0.2 to 1.0 in increments of 0.2. It was found that water filtration began after reaching a certain hydraulic gradient, a so-called initial filtration gradient. The initial hydraulic gradient ranged from 0.49 to 0.53.
Analyzing the impact of compaction on the k value (Figure 11), the permeability coefficient of the waste coal ash depended on the sample density. It was shown that an increase in the I S index from 0.964 to 1.00 resulted in a 4-fold decrease in permeability from 1.76 × 10⁻⁶ to 4.4 × 10⁻⁷ m/s (relative reduction by 75%) at the lowest hydrostatic pressure PH = 0.5 bar. An increase in the I S index from 0.964 to 1.00 at the highest hydrostatic pressure PH = 1.8 bar resulted in a 2.8-fold reduction in permeability from 1.30 × 10⁻⁷ to 4.5 × 10⁻⁷ m/s (relative reduction by 65%).

4. Summary and Conclusions

In this work, due to the limited availability in the literature of the tests determining the water permeability coefficient of waste coal ash, the filtration properties of a representative material were measured. Our contribution to the issue of the water permeability of waste coal ash consisted of measurements under various loads, different hydraulic gradients and cyclic test mode. Based on the measurements conducted, the following conclusions can be drawn:
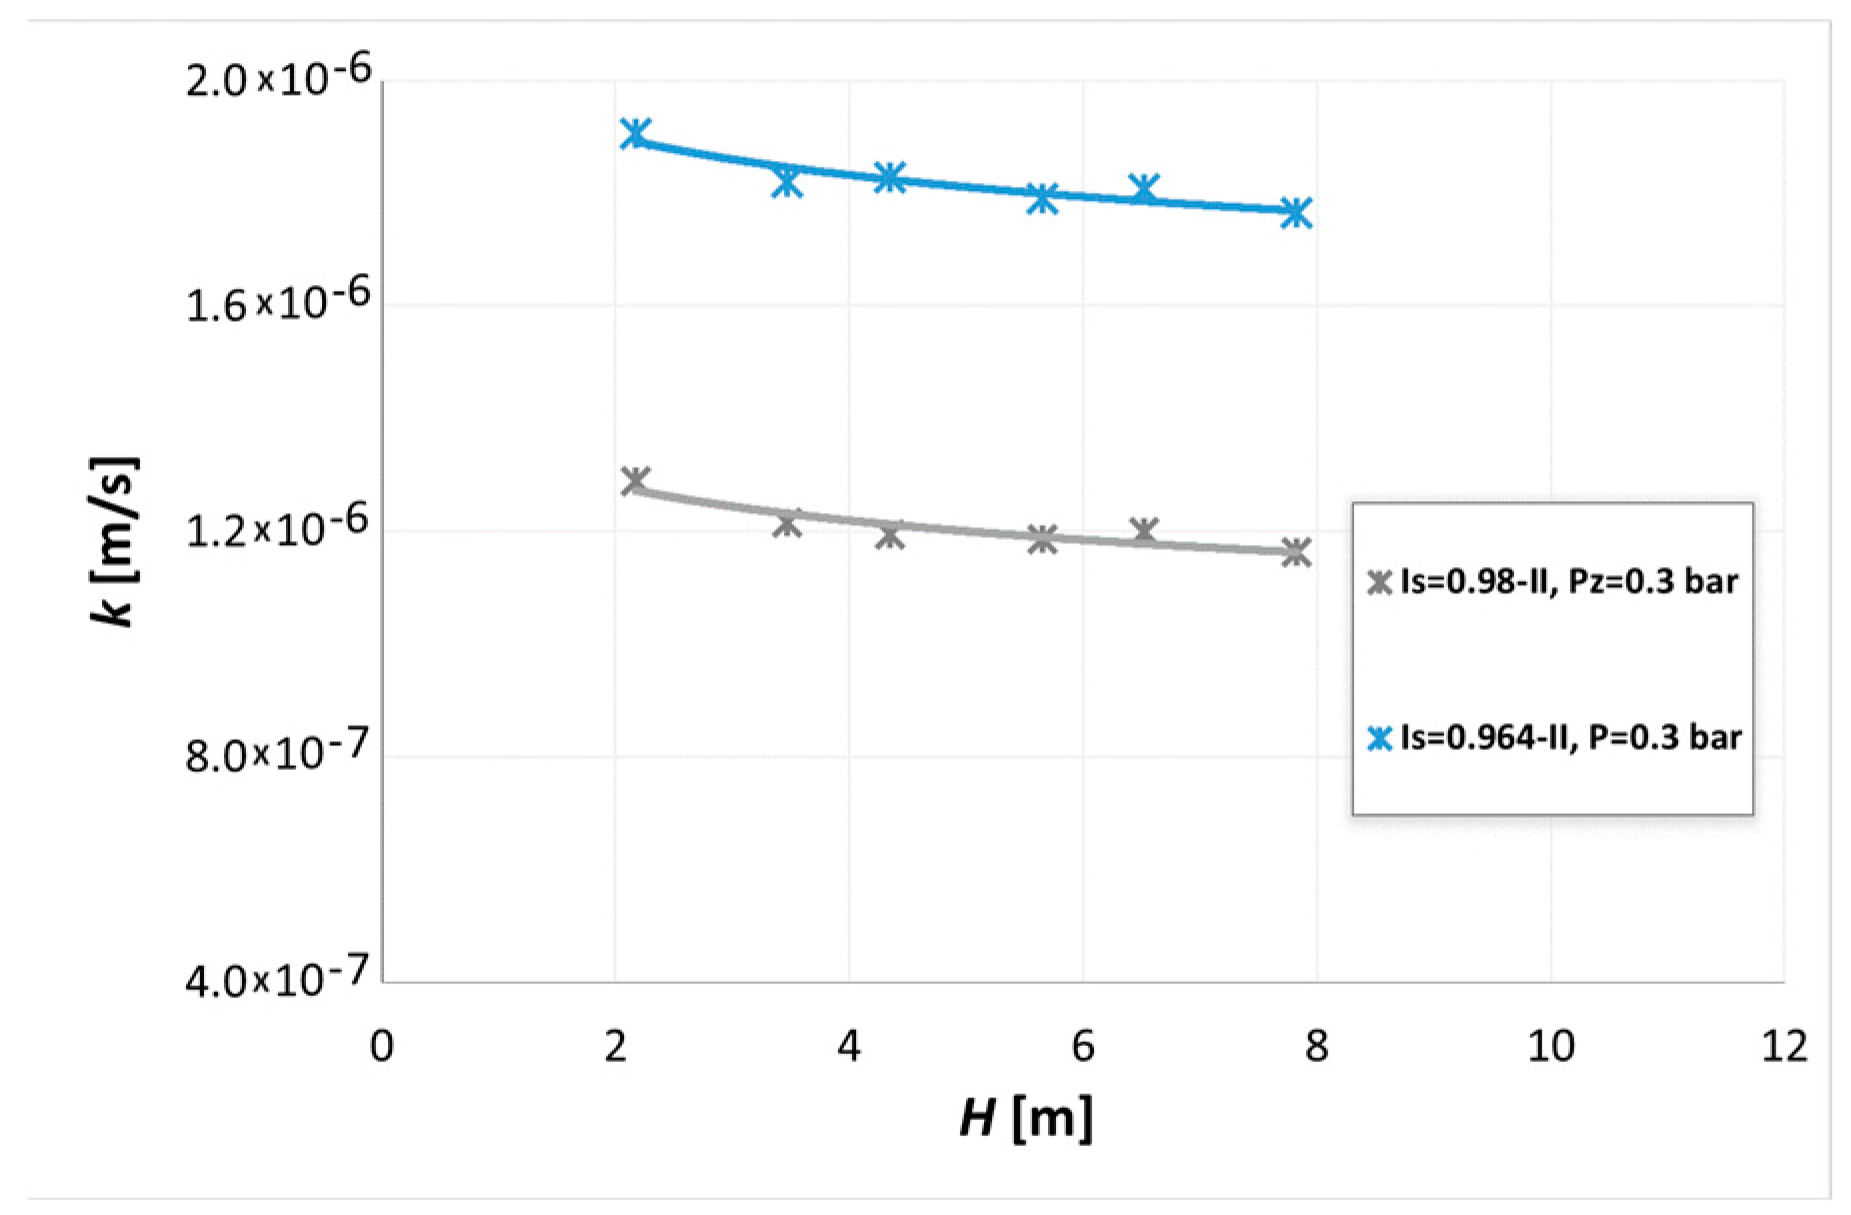
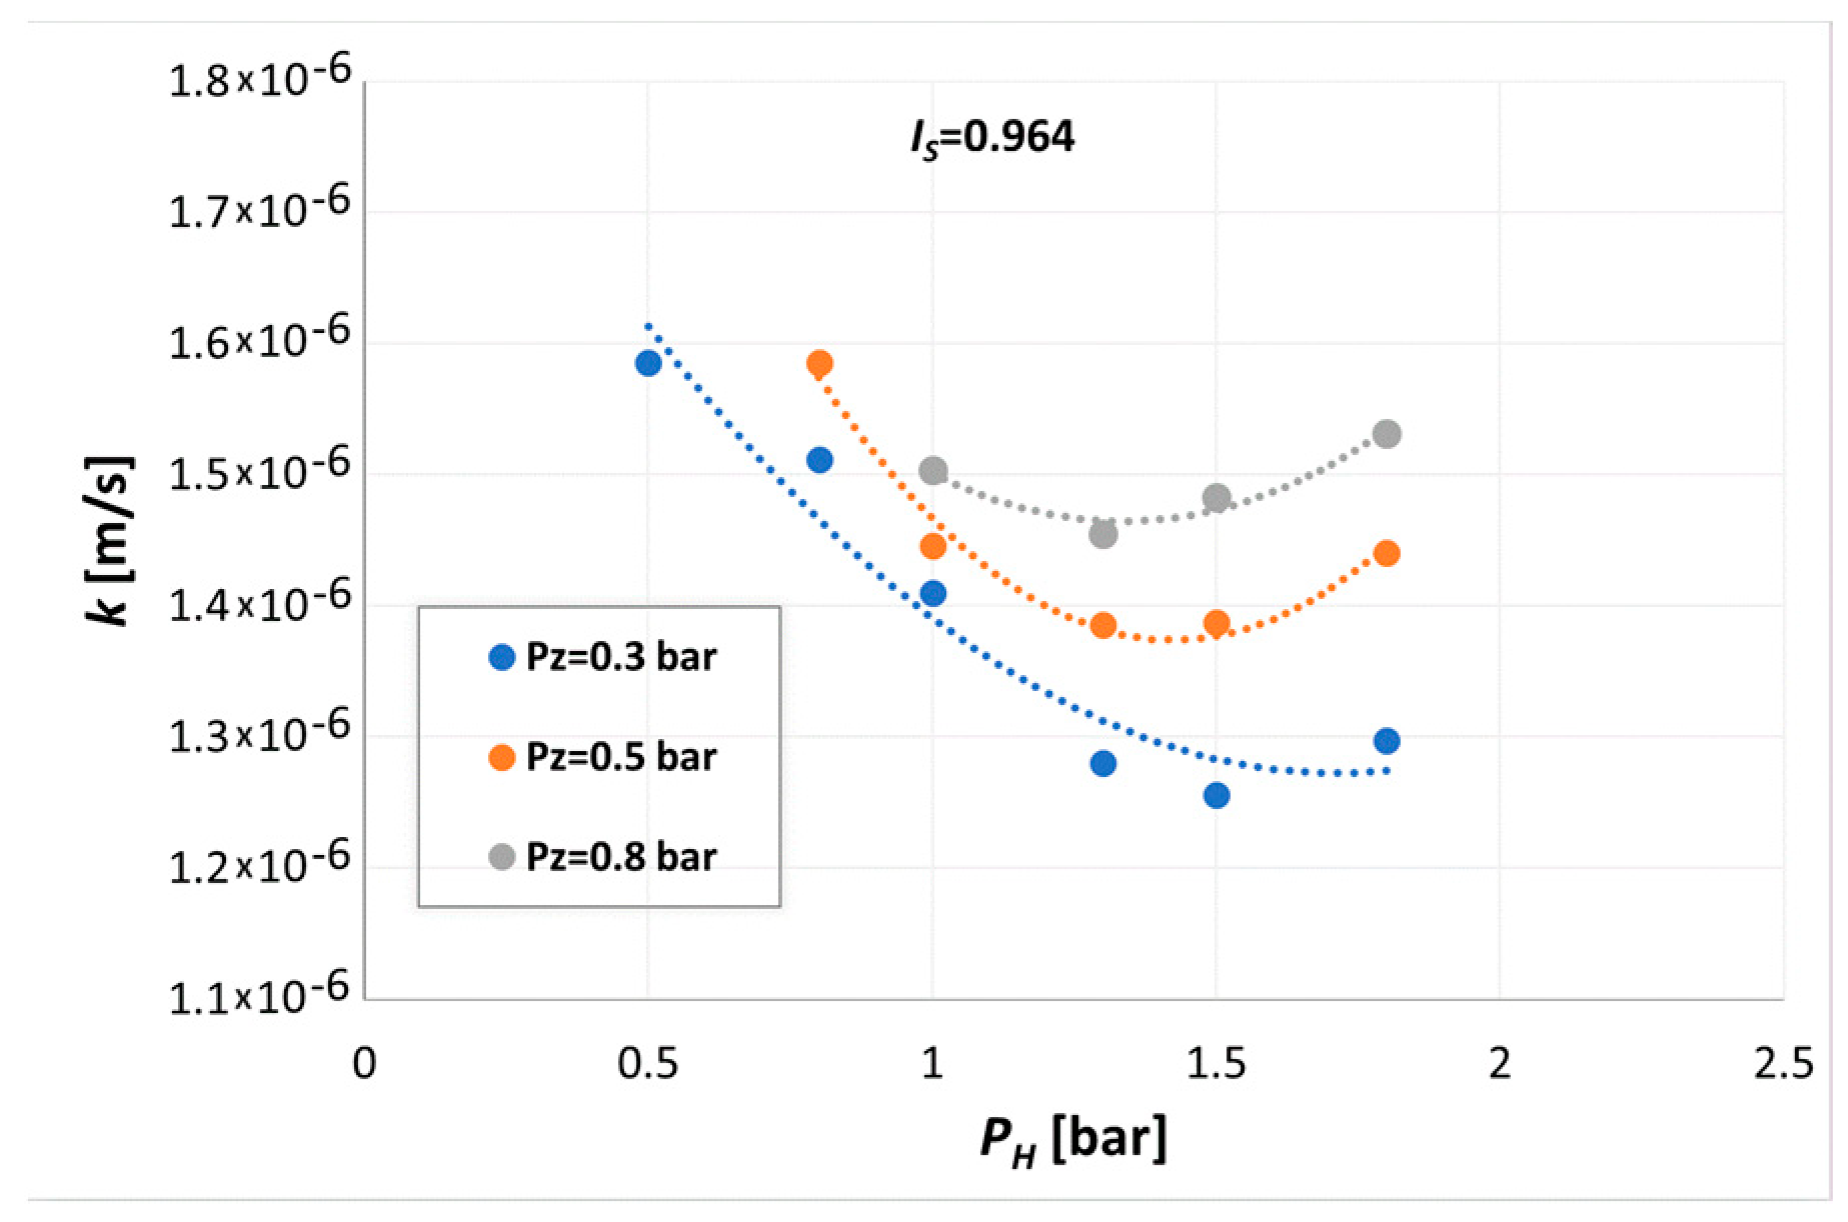
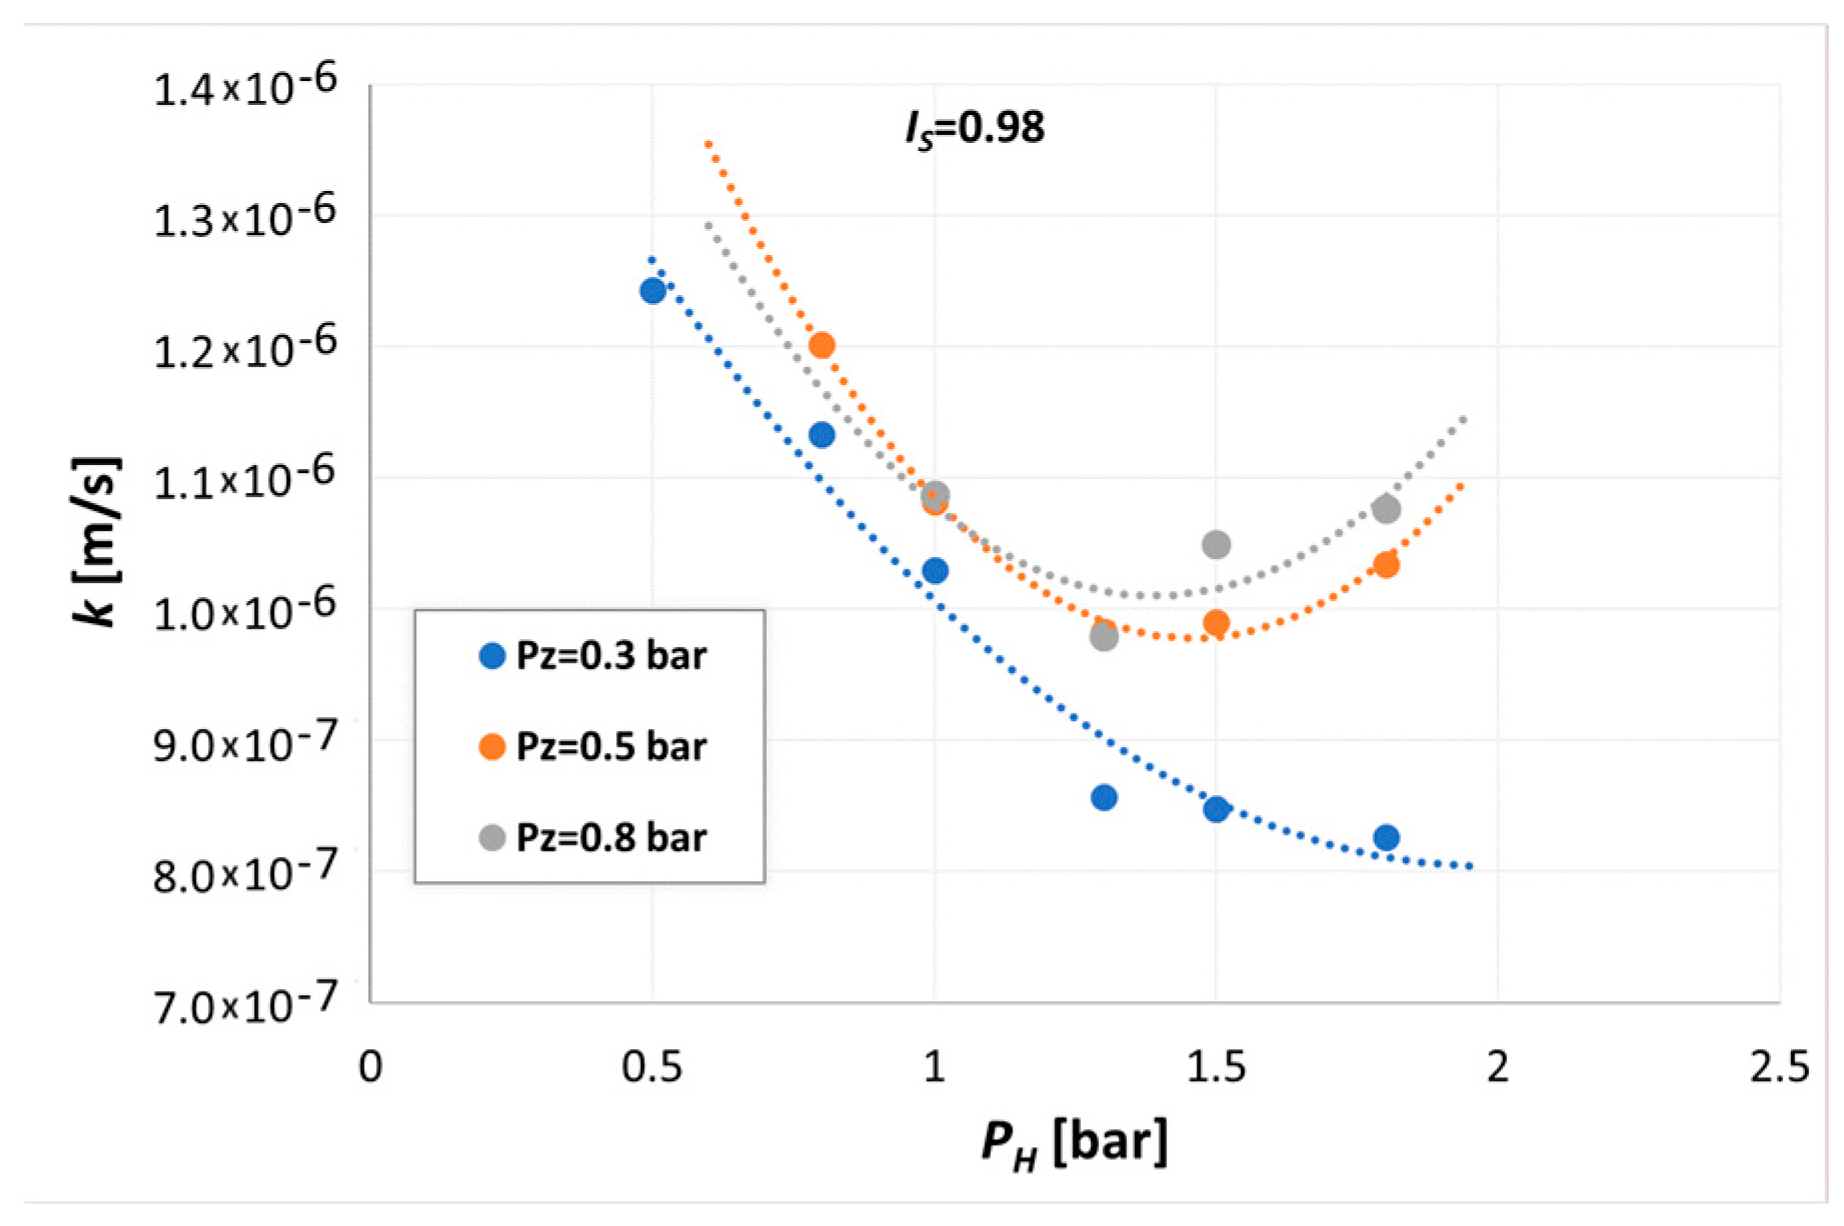
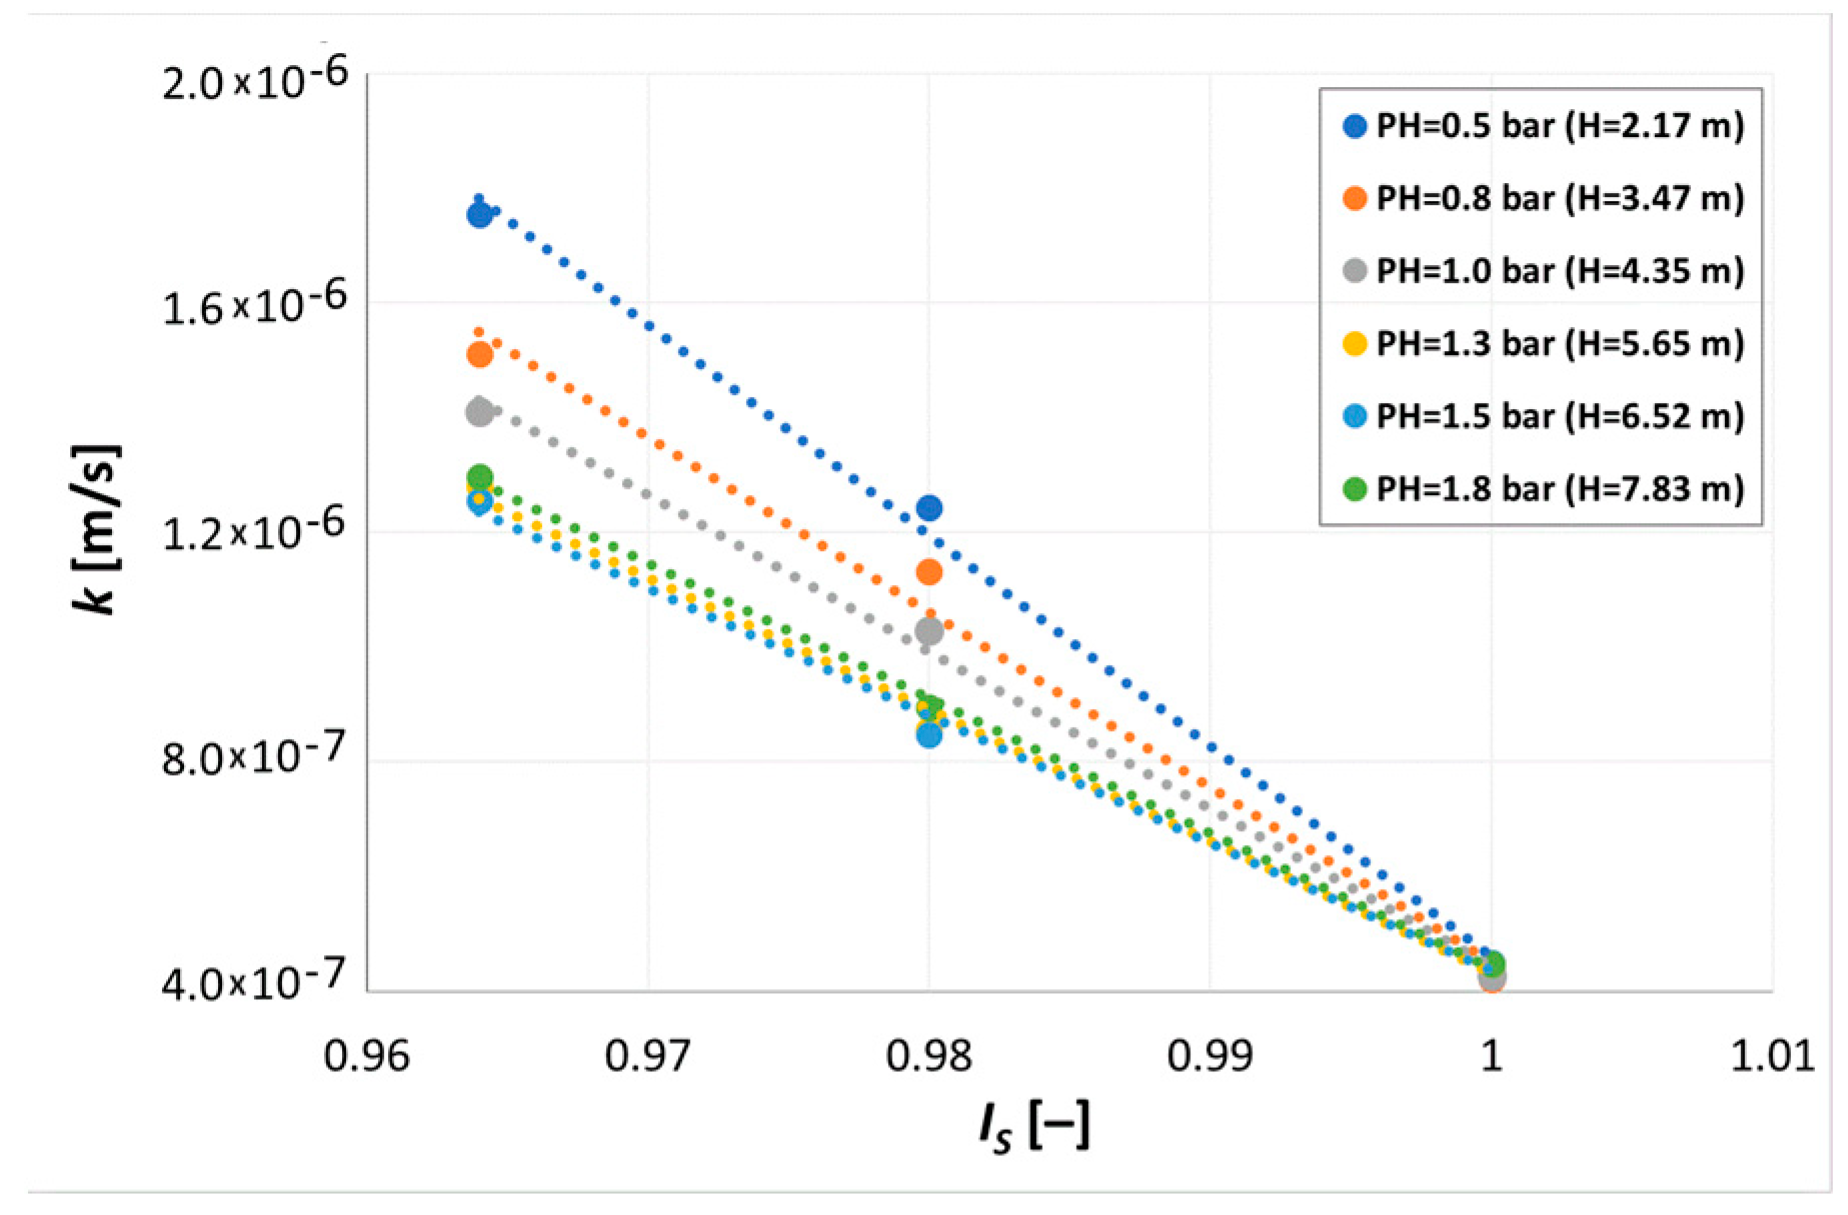
  • The permeability coefficient k ranged from 4.4 × 10⁻⁷ to 1.91 × 10⁻⁶ m/s and classified waste coal ash as semipermeable soil. It was found in the work that the permeability coefficient was dependent on the hydrostatic pressure for samples with a density index I S of 0.964 and 0.98. On the contrary, the tested waste with I S of 1.00 did not respond to the increase in the hydrostatic pressure applied. The increase in the hydrostatic pressure resulted in a reduction in the permeability coefficient in cycle I of 26% at I S = 0.964 and of 33% at I S = 0.98. The permeability coefficient reduction in cycle II was 7.5% and ca. 10%, respectively. A gradual increase in the hydrostatic pressure from 0.5 to 1.8 bar in cycle I caused irreversible changes in the structure of the waste coal ash. The first cycle resulted in the formation of flow paths in the material, which most likely would not change further in the subsequent cycles.
  • The relative reductions in the water permeability coefficient in cycle I resulting for each 1 m increase in depth amounted to 6.3 × 10⁻⁸ for a sample density I S = 0.964 and 8.0 × 10⁻⁸ m/s for I S = 0.98. The relative reductions in the permeability coefficient in cycle II with depth were ca. 2.0 × 10⁻⁸ m/s for both samples for each 1 m increase in depth. The water flow paths through the waste coal ash were reduced to a certain limit value appropriate for each density index.
  • The permeability coefficient of water was influenced by the value of the hydraulic gradient. As the hydraulic gradient increased, a filtration rate increase was observed. The optimal performance of the filtration test was performed at a gradient of 0.3 bar.
Undoubtedly, both during the forming process in the Proctor device and during the permeability tests under hydrostatic pressure, it can be seen that the waste material compacts well.
As a result, waste coal ash cannot constitute a construction material itself, but to ensure constant filtration properties, it must be doped, or the material must be appropriately compacted to a value equal to I S = 1.00.

Author Contributions

Conceptualization, B.D., K.G., P.S. and M.T.; methodology, K.G., M.T. and K.T.; software, M.T.; validation, B.D., K.G. and M.T.; formal analysis, P.S.; investigation, B.D.; resources, P.S.; data curation, K.G.; writing—original draft preparation, B.D.; writing—review and editing, B.D., K.G. and K.T.; visualization, B.D.; supervision, K.G.; project administration, P.S.; funding acquisition, P.S. All authors have read and agreed to the published version of the manuscript.

Funding

This research was funded by the Ministry of Science and Higher Education in Poland through the statutory research fund of the Polish Academy of Sciences.

Data Availability Statement

The data presented in this study are available on request from the corresponding author.

Conflicts of Interest

The authors declare no conflicts of interest.

References

  1. Myszczyszyn, J. Wpływ maszyny parowej na rozwój gospodarczy świata w XIX i XX w. Kultura i Historia 2009, 16, 95–102. [Google Scholar]
  2. BP Statistical Review of World Energy. Whitehouse Associates, London. 2022. Available online: https://www.bp.com/content/dam/bp/business-sites/en/global/corporate/pdfs/energy-economics/statistical-review/bp-stats-review-2022-full-report.pdf (accessed on 19 February 2024).
  3. International Energy Agency (IEA). Coal 2019 Analysis and Forecasts to 2024; IEA Publications: Paris, France, 2019. [Google Scholar]
  4. Dubiński, J.; Turek, M.; Aleksa, H. Węgiel Kamienny dla Energetyki Zawodowej w Aspekcie Wymogów Ekologicznych. Pr. Nauk. GIG. Górnictwo I Sr. 2005, 2, 5–21. [Google Scholar]
  5. 2021 Coal Combustion Product (CCP) Production and Use Survey Report. American Coal Ash Association. 2022. Available online: https://acaa-usa.org/wp-content/uploads/2022/12/2021-Production-and-Use-Survey-Results-FINAL.pdf (accessed on 19 February 2024).
  6. Key World Energy Statistic 2021—IEA International Energy Agency 2021. Available online: https://www.iea.org/reports/key-world-energy-statistics-2021 (accessed on 19 February 2024).
  7. Godyń, K.; Dutka, B. Preliminary Studies of Slag and Ash from Incinerated Municipal Waste for Prospective Applications. Energies 2023, 16, 117. [Google Scholar] [CrossRef]
  8. Murphy, S.; Pincetl, S. Zero waste in Los Angeles: Is the emperor wearing any clothes? Resour. Conserv. Recycl. 2013, 81, 40–51. [Google Scholar] [CrossRef]
  9. Zero Waste International Alliance. Available online: https://zwia.org/2023/03/ (accessed on 19 February 2024).
  10. Tiab, D.; Donaldson, E.C. Petrophysics: Theory and Practice of Measuring Reservoir Rock and Fluid Transport Properties, 3rd ed.; Elsevier/Gulf Professional Publishing: Amsterdam, The Netherlands, 2012. [Google Scholar]
  11. Kumar, D.; Gupta, A.; Ram, S. Uses of Bottom ash in the Replacement of fine aggregate for Making Concrete. Int. J. Curr. Eng. Technol. 2014, 4, 3891–3895. [Google Scholar]
  12. Galos, K.; Uliasz-Bocheńczyk, A. Źrodła i użytkowanie popiołow lotnych ze spalania węgli w Polsce. Gospod. Surowcami Miner. 2005, 1, 23–42. [Google Scholar]
  13. Jayaranjan, M.L.D.; van Hullebusch, E.D.; Annachhatre, A.P. Reuse options for coal fired power plant bottom ash and fly ash. Rev. Environ. Sci. Bio-Technol. 2014, 13, 467–486. [Google Scholar] [CrossRef]
  14. Kaczmarczyk, G. Application of Fluidized Bed Furnance Bottom Ash in Civil Engineering—A Review. IOP Conf. Ser. Mater. Sci. Eng. 2021, 1203, 032013. [Google Scholar] [CrossRef]
  15. Das, B.M.; Sobhan, K. Principles of Geotechnical Engineering; Cengage Learning: Boston, MA, USA, 2017. [Google Scholar]
  16. Knappett, J.; Craig, R.F. Craig’s Soil Mechanics; CRC Press: Boca Raton, FL, USA, 2012; pp. 39–42. [Google Scholar]
  17. Kuk, K.; Kim, H.; Chun, B. A Study on the Engineering Characteristics of Power Plant Coal Ash. J. Korean Geoenviron. Soc. 2010, 5, 25–34. (In Korean) [Google Scholar]
  18. Szwalec, A.; Gruchot, A.; Mundała, P.; Zawisza, E.; Kędzior, R. Physicochemical and geotechnical properties of an ash-slag mixture deposited on a landfill in terms of its use in engineering. Geol. Geophys. Environ. 2017, 43, 127–137. [Google Scholar] [CrossRef]
  19. Lange, I.Y.; Lebedeva, Y.A.; Kotiukov, P.V. A Study of Water Permeability of Coal Ash and Slag to Assess the Possibility of Their Use as Road Pavement Layers. Int. J. Eng. Res. Technol. 2020, 13, 374–378. [Google Scholar] [CrossRef]
  20. Afinogenov, O.P.; Malykhin, R.N. The Use of Ash and Slag Waste from the Kuzbass Thermal Power Plants (TPP) for the Construction of the Road Pavements. Tech. Technol. Eng. 2019, 2, 20–24. [Google Scholar]
  21. Kaniraj, S.R.; Gayathri, V. Permeability and Consolidation Characteristics of Compacted Fly Ash. J. Energy Eng. 2004, 130, 18–43. [Google Scholar] [CrossRef]
  22. Vig, N.; Mor, S.; Ravindra, K. The multiple value characteristics of fly ash from Indian coal thermal power plants: A review. Environ. Monit. Assess. 2023, 195, 33. [Google Scholar] [CrossRef]
  23. PN-EN 1097-5:2008; Badania Mechanicznych i Fizycznych Właściwości Kruszyw—Część 5: Oznaczanie Zawartości Wody Przez Suszenie w Suszarce z Wentylacją. Polish Committee for Standardization: Warszawa, Poland, 2008.
  24. AccuPyc II 1340 Operator’s Manual V1.03. 134-42801-01; Micromeritics Instrument Corporation: Norcross, GA, USA, 2007.
  25. PN-EN 12620+A1:2010; Kruszywa do Betonu. Polish Committee for Standardization: Warszawa, Poland, 2010.
  26. PN-EN 12457-1:2006; Characterisation of Waste. Leaching. Compliance Test for Leaching of Granular Waste Materials and Sludges. Polish Committee for Standardization: Warszawa, Poland, 2006.
  27. Regulation of the Minister of Economy of 16 July 2015 on the acceptance of waste for landfill. Pol. J. Laws. 2015. Item 1277 (In Polish)
  28. PN-B-04481:1988; Construction Land. Soil Sample Testing. Polish Committee for Standardization: Warszawa, Poland, 1988. (In Polish)
  29. PN-EN 13286-2:2010; Unbound and Hydraulically Bound Mixtures—Part 2: Test Methods for Laboratory Reference Density and Water Content—Proctor Compaction. Polish Committee for Standardization: Warszawa, Poland, 2010.
  30. ISO 17892-11:2019; Geotechnical Investigation and Testing. Laboratory Testing of Soil. Part 11: Permeability Tests. International Organization for Standardization: Geneva, Switzerland, 2019.
  31. Skrzypkowski, K.; Korzeniowski, W.; Poborska-Młynarska, K. Binding capability of ashes and dusts from municipal solid waste incineration with salt brine and geotechnical parameters of the cemented samples. Arch. Min. Sci. 2018, 63, 903–918. [Google Scholar]
  32. Reddy, C.S.; Mohanty, S.; Shaik, R. Physical, chemical and geotechnical characterization of fly ash, bottom ash and municipal solid waste from Telangana State in India. Int. J. Geo-Eng. 2018, 9, 23. [Google Scholar] [CrossRef]
Figure 1. Samples taken from the landfill marked as AZ 1 to 5.
Recycling 09 00022 g001
Figure 2. View of the station and the triaxial compression apparatus for testing the permeability coefficient (two pressure chambers in which individual samples are installed, enclosed in flexible sleeves; three pairs of measuring burettes; and three manometers—the middle one is used for the setting of the PH hydrostatic pressure and the left and right ones are used for regulation of liquid pressures at the inlet and outlet of the sample, P1 and P0, respectively, set interchangeably depending on the direction of water flow through the sample).
Recycling 09 00022 g002
Figure 3. Histograms of the content of individual grain fractions in samples AZ1–AZ5.
Recycling 09 00022 g003aRecycling 09 00022 g003b
Figure 4. Particle size curves of dry waste samples from AZ1 to AZ5 (the colors of the curves refer to AZ1-AZ5 samples shown in Figure 3).
Recycling 09 00022 g004
Figure 5. Proctor compaction curves made with a standard and reduced Proctor apparatus.
Recycling 09 00022 g005
Figure 6. Permeability coefficient k, all cycles, variation with hydrostatic pressure, ΔP = 0.3 bar.
Recycling 09 00022 g006
Figure 7. The influence of depth on the value of the permeability coefficient k in measurement cycle I, all samples, ΔP = 0.3 bar.
Recycling 09 00022 g007
Figure 8. Influence of depth on the value of the permeability coefficient k in measurement cycle II, all samples, ΔP = 0.3 bar.
Recycling 09 00022 g008
Figure 9. The influence of confining pressure on the value of the permeability coefficient measured at different set pressures, sample I S = 0.964.
Recycling 09 00022 g009
Figure 10. The influence of confining pressure on the value of the permeability coefficient measured at different set pressures, sample I S = 0.98.
Recycling 09 00022 g010
Figure 11. The influence of compaction index on the value of the permeability coefficient of AZ5 waste.
Recycling 09 00022 g011
Table 1. Sample characteristics.
Sample/Waste AshMoisture Content (%)Real Density (kg/m3)
AZ110.30data
AZ211.80
AZ320.302300
AZ430.10
AZ527.16
Table 2. Loads of soluble components leached from waste coal ash.
Lp.ComponentWaste Sample (mg/kg)Acceptable Leaching
Values (mg/kg)
AZ1AZ3
1(As)0.05550.06130.3
2(Ba)0.1620.6447
3(Cd)<0.0024<0.00240,03
4(Cr)0.02920.09080.2
5(Cu)0.0102<0.00380.9
6(Hg)<0.0025<0.00250.003
7(Mo)0.02110.02430.3
8(Ni)0.02540.01050.2
9(Pb)<0.0022<0.00220.2
10(Sb)0.0160.0150.2
11(Se)0.0140.335 10.06
12(Zn)<0.0109<0.01092
13(Cl)8.139.64550
14(F)2.9812.51 14
15(SO42−)25.1191560
16Phenolic compounds<0.002<0.0020.5
17Soluble organic carbon (DOC)6.253.60240
18Solid soluble compounds (TDS)74613802500
19Total carbon110.7203.5
20Inorganic carbon105.4199.9
21pH9.349.55
1 exceeded the permissible value for waste allowed to be stored in landfills.
Table 3. Properties of samples intended for permeability tests.
Compaction   Index   I S (-)Maximum Bulk Density (g/cm3)Moisture from the Proctor Curve (%)
1.01.17036.5 (optimal)
0.9801.14631.1
0.9641.13826.2
Disclaimer/Publisher’s Note: The statements, opinions and data contained in all publications are solely those of the individual author(s) and contributor(s) and not of MDPI and/or the editor(s). MDPI and/or the editor(s) disclaim responsibility for any injury to people or property resulting from any ideas, methods, instructions or products referred to in the content.

