
Co-Hydroprocessing of Fossil Middle Distillate and Bio-Derived Durene-Rich Heavy Ends under Hydrotreating Conditions

Engler-Bunte-Institute–Division of Fuel Technology, Karlsruhe Institute of Technology, Engler-Bunte-Ring 1a, 76131 Karlsruhe, Germany
*
Author to whom correspondence should be addressed.
Reactions 2023, 4(3), 531-551; https://doi.org/10.3390/reactions4030032
Submission received: 31 July 2023
/
Revised: 7 September 2023
/
Accepted: 18 September 2023
/
Published: 21 September 2023
(This article belongs to the Special Issue Hydrogen Production and Storage, 2nd Edition)
Abstract
:Methanol-to-gasoline (MTG) and dimethyl ether-to-gasoline (DTG), as industrially approved processes for producing greenhouse gas-neutral gasoline, yield byproducts rich in heavy mono-ring aromatics such as 1,2,4,5-tetramethylbenzene (durene). Due to its tendency to crystallize and the overall poor fuel performance, the heavy fuel fraction is usually further processed using after-treatment units designed for this purpose. This research article discusses the co-hydroprocessing (HP) of bio-derived heavy gasoline (HG) with fossil middle distillate (MD), drawing on available refinery hydrotreaters. Co-HP experiments were conducted in a laboratory-scale fixed bed reactor using an industrial CoMo/-AlO catalyst, varying the space-time between 0.7 and 4.0 h and the reaction temperature between 340 and 390 °C. In addition to the durene conversion, special attention was paid to the octane and cetane numbers (CN) of gasoline and MD, respectively. A six-lump model with ten parameters was developed to predict relevant fuel yields dependent on the process conditions. Under stable catalyst conditions, C aromatic conversions of more than 60% were obtained, while the CN remained close to that of pure MD. Harsh process conditions increased the gasoline yield up to 20% at the cost of MD, while the kerosene yield remained almost constant. With an optimized lumping model, fuel yields could be predicted with an R of 0.998. In this study, co-HP heavy aromatic-rich MTG/DTG fuels with fossil MD were proven to be a promising process strategy compared to a stand-alone after-treatment.
1. Introduction
Primary energy consumption has risen steadily over the last few centuries, showing an exponential increase since 1940 [1]. While most of the 20th century’s demand was met with fossil energy carriers, global warming and its evermore noticeable repercussions urgently call for a greenhouse gas (GHG)-neutral, cross-sector energy supply. The European Union (EU) committed its willingness toward GHG neutrality with the European Green Deal [2]. In June 2021, the European Parliament and Council enforced a binding regulation to all member states to lower the EU’s GHG emissions by 55% until 2030 compared to 1990 [3]. With the “Fit for 55” action plan, the European Commission has published proposals for adapting laws to the climate targets mentioned above [4] and to pave the way to full GHG neutrality by 2050.
Transportation is one of the most intensively debated sectors and was recently involved in an incisive decision: the EU-wide ban of cars relying on internal combustion engines by 2035 [5]. However, a ban does not tantamount to the sudden disappearance of liquid hydrocarbon-fueled vehicles. Especially, aviation and maritime transport will further rely on energy carriers with high energy densities. The EU has recognized this and supports the implementation of synthetic fuels in these sectors [4]. Germany, for example, aims to produce at least 200,000 t a of Power-to-Liquid kerosene by 2030 [6]. Synthetic fuels will further play an important role during the transition toward technologies such as electrification. Registration rates of electric vehicles were still modest in 2022, e.g., 21% and 29% for Europe and China, respectively, as the fastest-growing markets [7]. Moreover, automobiles on European roads are on average twelve years old [8]. Consequently, vehicles relying on liquid hydrocarbon fuels will only gradually disappear, and it is therefore inevitable to supply GHG-neutral synthetic fuels in order to reach the EU’s ambitious targets.
Over the last decades, bioethanol and fatty acid methyl esters (FAME) were blended into gasoline and diesel, respectively, to meet the mandatory renewable shares [9]. The blending rate of bioethanol and FAME is limited by the applicable standards to 10 vol.% and 7 vol.%, respectively [10,11]. Higher shares are possible but may require the adjustment of engine components, as both bioethanol [12,13] and FAME [14] can cause problems with plastics and metals. Another approach is the blending of GHG-neutral synthetic hydrocarbons. Owing to their similarity to fossil hydrocarbons, the advantage of such synthetic fuels is their unfettered applicability, even in older vehicles, without the necessity for constructional adjustments.
Methanol to gasoline (MTG) and dimethyl ether to gasoline (DTG) are processes based on Mobil’s discovery for synthesizing high-octane gasoline using a zeolite catalyst [15]. The high octane number (ON) is due to the composition of the fuels, consisting of paraffins, naphthenes, olefins, and, for the most part, methylated aromatics [16]. Both process variants were already commercialized by Mobil and Haldor Topsøe, respectively [17,18], producing similar hydrocarbon product ranges [19]. Research is still underway, for example, with the bioliq® pilot plant at the Karlsruhe Institute of Technology, which produces synthetic gasoline from straw. A decentralized fast pyrolysis is used for biomass liquefaction [20,21], followed by a centralized entrained flow gasification process [22] and a DTG synthesis [23,24]. Synthetic hydrocarbons are a great measure to gradually defossilize the refinery sector in its product variety. For example, mineral oil refinery Oberrhein (MiRO) in Karlsruhe, Germany, recently announced plans to integrate such GHG-neutral hydrocarbon streams into its portfolio [25].
Raw products of an MTG or DTG synthesis are usually separated into light gasoline (LG) and heavy gasoline (HG) to get rid of 1,2,4,5-tetramethylbenzene (durene), which is the largest compound accruing in significant amounts of 3–6 wt.% as a consequence of the underlying methanol-to-hydrocarbon mechanism [26]. While the aromatic-rich LG can be easily incorporated into a refinery due to its similarity to fossil reformate, HG consists almost entirely of C–C aromatics and is especially rich in durene (see Section 2.1 for detailed information). Durene tends to crystallize due to its high melting temperature of 79 °C, which bears the danger of clogging the fuel injection system, causing driveability problems [16]. A further reason for cutting off the heavy aromatics is their strong correlation with increased engine-out hydrocarbon [27] and soot emissions [28], one of the main factors for reduced life expectancy worldwide [29].
Besides its drawbacks, HG originating from a sustainably operated MTG or DTG plant has a GHG reduction potential and thus is of high economic value. Consequently, refineries must search for solutions to process streams rich in heavy aromatics and overcome the negative properties. In Section 1.1, we discuss the most promising processing options and outline the experimental scope of this study. A brief overview of modeling approaches on co-processing is presented in Section 1.2, including the questions that this study aims to answer.
1.1. Processing of Feedstocks Rich in Heavy Mono-Ring Aromatics
Refineries have several options to incorporate an aromatic-rich stream. With little effort, the durene containing HG could be blended into reformate or middle distillate (MD) to dilute durene below a particular concentration at which it no longer crystallizes. Chang [30] found a concentration below 3% sufficient, whereas Olsbye et al. [16] emphasized that there might be climate conditions at which crystallization could still occur. Therefore, such a measure would only be feasible for small volumes of HG. Additionally, even if crystallization issues are solved, emission tendencies and petrochemical parameters such as the cetane number (CN) remain negatively affected by aromatics [31]. Therefore, an after-treatment is usually applied, e.g., isomerization [32,33] or HP [32,34]. As such processes are capital intensive [35] but are also available in most refineries, the co-processing of bio-derived feedstocks with fossil intermediates is frequently discussed. Besides defossilizing the refinery sector, co-processing bio-derived feedstocks comes with self-evident advantages. It makes biofuels more competitive by saving capital investment, as a highly integrated processing infrastructure [36,37,38] and a reliable blending and fuel distribution system can be drawn on [39]. Therefore, co-processing is an attractive way to lower production costs while decreasing the GHG impact of synthetic fuels.
Processes regularly found in refineries are (a) transalkylation/disproportionation, (b) fluid catalytic cracking (FCC), and (c) hydrotreating or generally HP. Even if transalkylation and disproportionation are already commercialized, for example, with the Mobil TransPlusSM process [40], these options are not available in every refinery. Additionally, low molecular aromatic streams such as toluene are required for the transalkylation of C–C aromatics, present in HG, toward lighter aromatics. FCC is frequently discussed for co-processing various bio-derived and fossil feedstocks as it is readily found in the refinery environment [41]. Typical FCC feedstocks are vacuum gas oil (VGO) and heavy atmospheric gas oil with boiling temperatures between 280 and 580 °C [42]. Therefore, high boiling feedstocks, such as vegetable oils, animal fats [43], and bio-oils obtained, for example, by flash pyrolysis of biomass [37,44,45], are usually co-processed in FCC units. HG from MTG and DTG processes comes with a boiling range of approx. 177–290 °C (see Section 2.1 for detailed petrochemical parameters) and, therefore, lies below the boiling temperature of typical FCC feedstocks. As HG consists almost entirely of aromatics, it is to expect that almost no reaction takes place besides some dealkylation of ring-attached side chains [46]. Like FCC, HP is virtually found in any refinery [42]. Typically, HP is used to remove heteroatoms such as sulfur, nitrogen, and oxygen from MD [42,47,48]. One of the most commonly applied catalysts is a cobalt-molybdenum (CoMo)-based catalyst for hydrodesulfurization (HDS) [36,49]. HP also became increasingly important for the partial hydrogenation of aromatics [42,50]. For example, the data of Bisht et al. show that hydrogenation of aromatic compounds to naphthenes helps to improve the CN [31]. Simultaneously, the expected emissions are reduced because naphthenes have lower sooting tendencies [51]. HP is reportedly suitable for co-processing aromatic-rich feedstocks such as light cycle oil (LCO), which is comparable to the HG considered in this study in terms of high aromatic content [50,52]. Ancheyta-Juárez proved a product quality improvement for the co-HP of MD and LCO, using a CoMo/-AlO catalyst [50]. Sági et al. investigated the co-HP of LCO with animal fats and straight run gas oil using a nickel-molybdenum (NiMo)/AlO catalyst [52]. Depending on the process conditions, the aromatics were significantly reduced, which resulted in a primarily standard-compliant diesel.
The aim of the experimental part of our study was to investigate the suitability of a common hydrotreater for the co-HP of fossil MD and durene-rich bioliq® HG. We conducted experiments with a feedstock of 15 wt.% durene and 85 wt.% MD according to a local refinery’s reaction parameters using a commercially available CoMo/-AlO catalyst. An important aim was to find stable operating conditions, as high deactivation rates would affect the product quality and the lifespan of the catalyst before regeneration [35]. The results were further used to calculate the hydrogenation and isomerization selectivity of the durene conversion in order to evaluate the catalyst’s suitability to improve important fuel parameters linked to the aromatic content. We conducted additional experiments with the aim of evaluating the resulting fuel yields and qualities using a feedstock of 15 wt.% bioliq® HG and 85 wt.% MD. The fuel yields of gasoline, kerosene, and diesel and the economically important parameters ON and CN [53] were of particular interest.
1.2. Modeling of Hydroprocessing
HP involves various reactions, e.g., hydrogenation and dehydrogenation, isomerization, C–C bond scission, hydrogen transfer, and disproportionation [54]. C–C bond scission represents all types of cracking reactions, including exo- and endo-cyclic -scission of cyclic compounds. Exo-cyclic -scission means the dealkylation of side chains attached to naphthenes and aromatics, while endo-cyclic -scission is the ring opening that forms olefins and paraffins [55]. An especially fast mechanism is the so-called paring reaction, becoming relevant for cyclic molecules ≥ C, yielding iso-Butane and the respective remaining cyclic carbenium ion by fast tertiary–tertiary -scission [56]. Which reaction predominates strongly depends on the catalyst used and the reaction conditions [57]. While mostly hydrogenation, i.e., hydrotreating reactions, are favored at medium temperatures, isomerization and cracking reactions become more predominant as the temperature increases [55,58].
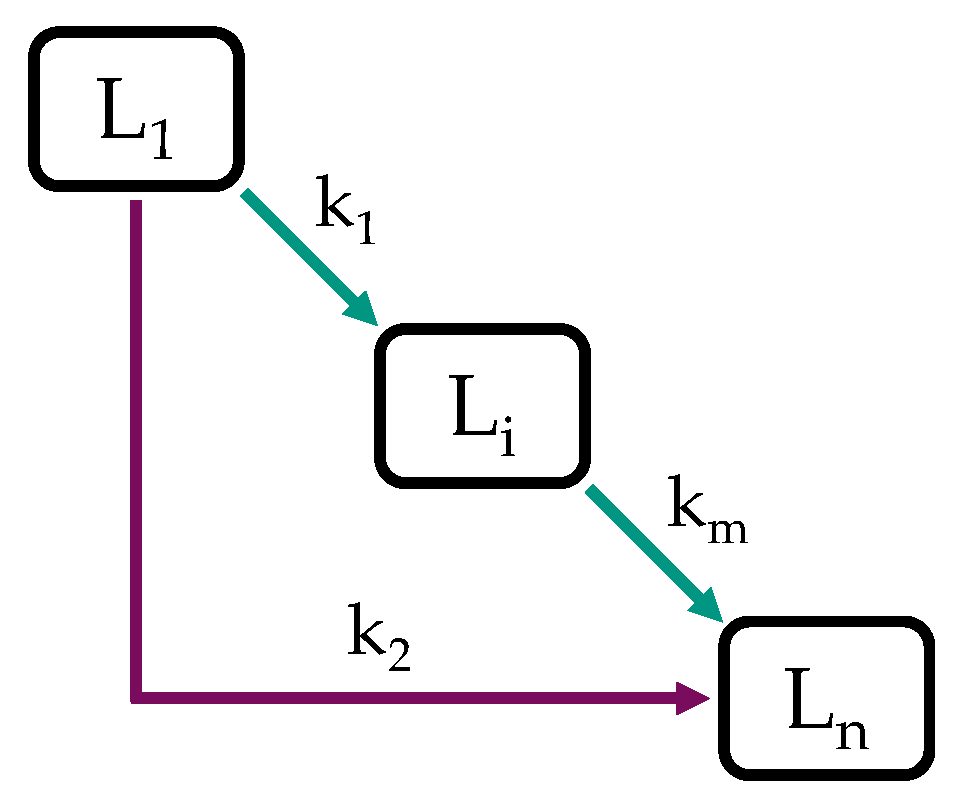
Due to the numerous reactions involved and the complex compositions of fossil and biomass-derived feedstocks, HP is regularly modeled with simplified approaches such as discrete lumping models, e.g., [57,58,59,60,61,62,63,64,65,66,67], and substance group lumping models, e.g., [58,59]. In discrete and substance group lumping models, the sample is subdivided into lumps of specific boiling ranges or substance groups [59]. Lumps can be typical refinery products, for example, gasoline, kerosene, and diesel, if boiling ranges are considered, or paraffins, naphthenes, and aromatics in the case of substance groups [54,60]. Lumping by boiling ranges has the advantage of practical accessibility, as boiling curves are convenient to measure [60], while detailed hydrocarbon analysis requires sophisticated techniques such as GC*GC to gain integral information on a sample’s composition. Such are available but not as regularly found as boiling range analyzers. As shown in Figure 1, lumps are treated as chemical compounds, and a reaction network is constructed in between [61], where all the individual reactions are lumped together [54,68].
In general, a model’s predictive power improves as the number of lumps increases, which, however, is also accompanied by an over-proportional increase in kinetic parameters to be determined [54,69]. Further modeling techniques, relying on more detailed knowledge, are continuous lumping models, where a feedstock’s reactivity is described as a continuous function, e.g., [54,68], and single event models, where a more in-detail mechanistic knowledge is required, e.g., [69]. Depending on the task, lumping models are as precise as the more complex ones while, however, being restricted to the prediction of prior defined lumps, which must therefore be chosen deftly [57]. Nevertheless, complex reaction systems are relatively straightforward to implement with lumping models, for example, into process simulation software [58,63].
The aim of our study’s theoretical part was to develop an application-oriented lumping model for predictions during daily refinery operations about the co-HP of bioliq® HG and fossil MD. By this modeling approach, we strived to precisely predict the fuel yields of gasoline, kerosene, and diesel. The results of the parameter estimation were further evaluated to gain information on the main reactions involved.
2. Materials and Methods
2.1. Experimental Setup and Procedure
Besides the relevant information presented here, a more detailed description of the experimental setup can be found in our prior study [34]. The co-HP experiments were conducted in an electrically heated fixed bed reactor with an inner diameter of 14.9 mm, operated top-down in co-current mode. A total of 67.689 g of a commercially available CoMo/-AlO catalyst with a particle size distribution of 100–200 m was filled into the reactor. The first 15 cm of the reactive zone consisted of catalyst diluted with SiC (weight-ratio 70:30) of the same particle size distribution. Further, 30 cm of pure catalyst completed the reactive zone. By this measure, the axial reactor temperature profile could be maintained within ±0.9 °C of the set reaction temperature for all experiments performed. The inlet and outlet of the reactor were additionally filled with SiC (210 m) over a length of 15 cm and 20 cm, respectively, to keep the catalyst in position and ensure an ideal mixing of the feed components. A central probe tube with an outer diameter of 1/8 was available for measuring the reactor’s temperature profile by axially moving a K-Typ thermocouple.
Table 1 lists the petrochemical parameters of the hydrocarbon fractions used for the experiments in this study.
MD was provided by ASG Analytik-Service, Neusaess, Germany. It consists mainly of paraffins, about 5.7 wt.% polycyclic aromatic hydrocarbons, and has a sulfur content of below 5 wppm. HG was obtained by rectification of the bioliq® raw gasoline to a top temperature of approx. 176 °C and consists of 33.6 wt.% C and 52.6 wt.% C aromatics, of which 21.4 wt.% is durene. Another large proportion are C aromatics at 10.4 wt.%, with the remainder consisting mainly of paraffins and naphthenes. Additionally, dimethyl disulfide (DMDS) (≥99%, Alfa Aesar, Heysham, UK) and durene (97%, Fisher Scientific GmbH, Schwerte, Germany) were used. The feedstock for the experiments consisted of 15 wt.% HG and 85 wt.% MD (see right column of Table 1), which had a boiling range of 175.0–365.2 °C and an aromatics content of approx. 19.4 wt.%. Additionally, a mixture of 15 wt.% pure durene and 85 wt.% MD with a total aromatic content of approx. 19.8 wt.% was used as feed for several experiments. The boiling range could not be provided as the condenser of the boiling range analyzer got clogged by the crystallization of durene due to its high concentration. Which feed was used for the respective experiments will be indicated in the discussion.
Before the experiments, the CoMo/-AlO catalyst was activated using a sulfur-enriched stream of MD. Sulfur was added as DMDS, which comes with a sulfur content of 68 wt.% and is frequently used to activate traditional hydrotreating catalysts [65,70]. The amount of DMDS added to the MD was calculated based on the catalyst mass and expected sulfur uptake according to the manufacturer. To ensure complete catalyst activation, the theoretical mass of sulfur was multiplied with a security factor of 1.25. In total, 15.305 g DMDS dissolved in 716 g MD was used as feed to carry out the activation procedure of 67.689 g catalyst. For the sulfiding process, the following procedure, related to the findings of Texier et al. [70], was applied. Before the sulfidation, the catalyst was dried at 150 °C for 60 h in a pure argon atmosphere. The pump was then set to a feed flow rate of 0.29 mL min. Simultaneously, the gas supply was adjusted to a hydrogen and argon flow of 300 mL min and 20 mL min, respectively. All flow rates were kept constant over the whole sulfidation process. Right after the flows were adjusted, the temperature was increased from 150 °C to 225 °C with a rate of approx. 18.8 °C h and held constant at 225 °C for 8 h. After this period, a second temperature ramp of approx. 14.7 °C h was applied for 8.5 h, increasing the temperature from 225 °C to 350 °C. The temperature was again kept constant for 8 h at 350 °C, after which the activation procedure was completed. For all following experiments, the feed was enriched with 1000 wppm of sulfur equivalent in the form of DMDS to preserve the active state of the catalyst.
The first set of experiments focused on the conversion, the selectivity, i.e., differentiation between hydrogenation and isomerization of durene, and the catalyst deactivation. For these experiments, MD was enriched with 15 wt.% of durene. For approx. 860 h on stream, experiments were conducted at 320 °C, 350 °C, and 380 °C for a constant LHSV of 0.4 h, a constant total pressure of 62.9 bar (59 bar , 3.9 bar Ar), and a ratio / of 1042 Nm m. Argon was added as an internal standard for calculating the volume flow rates of the gaseous products. Related product concentrations were measured with an Agilent 7890A online gas chromatograph (GC). All liquid samples’ compositions were measured using an Agilent 7890B according to ASTM 6730-01 [71].
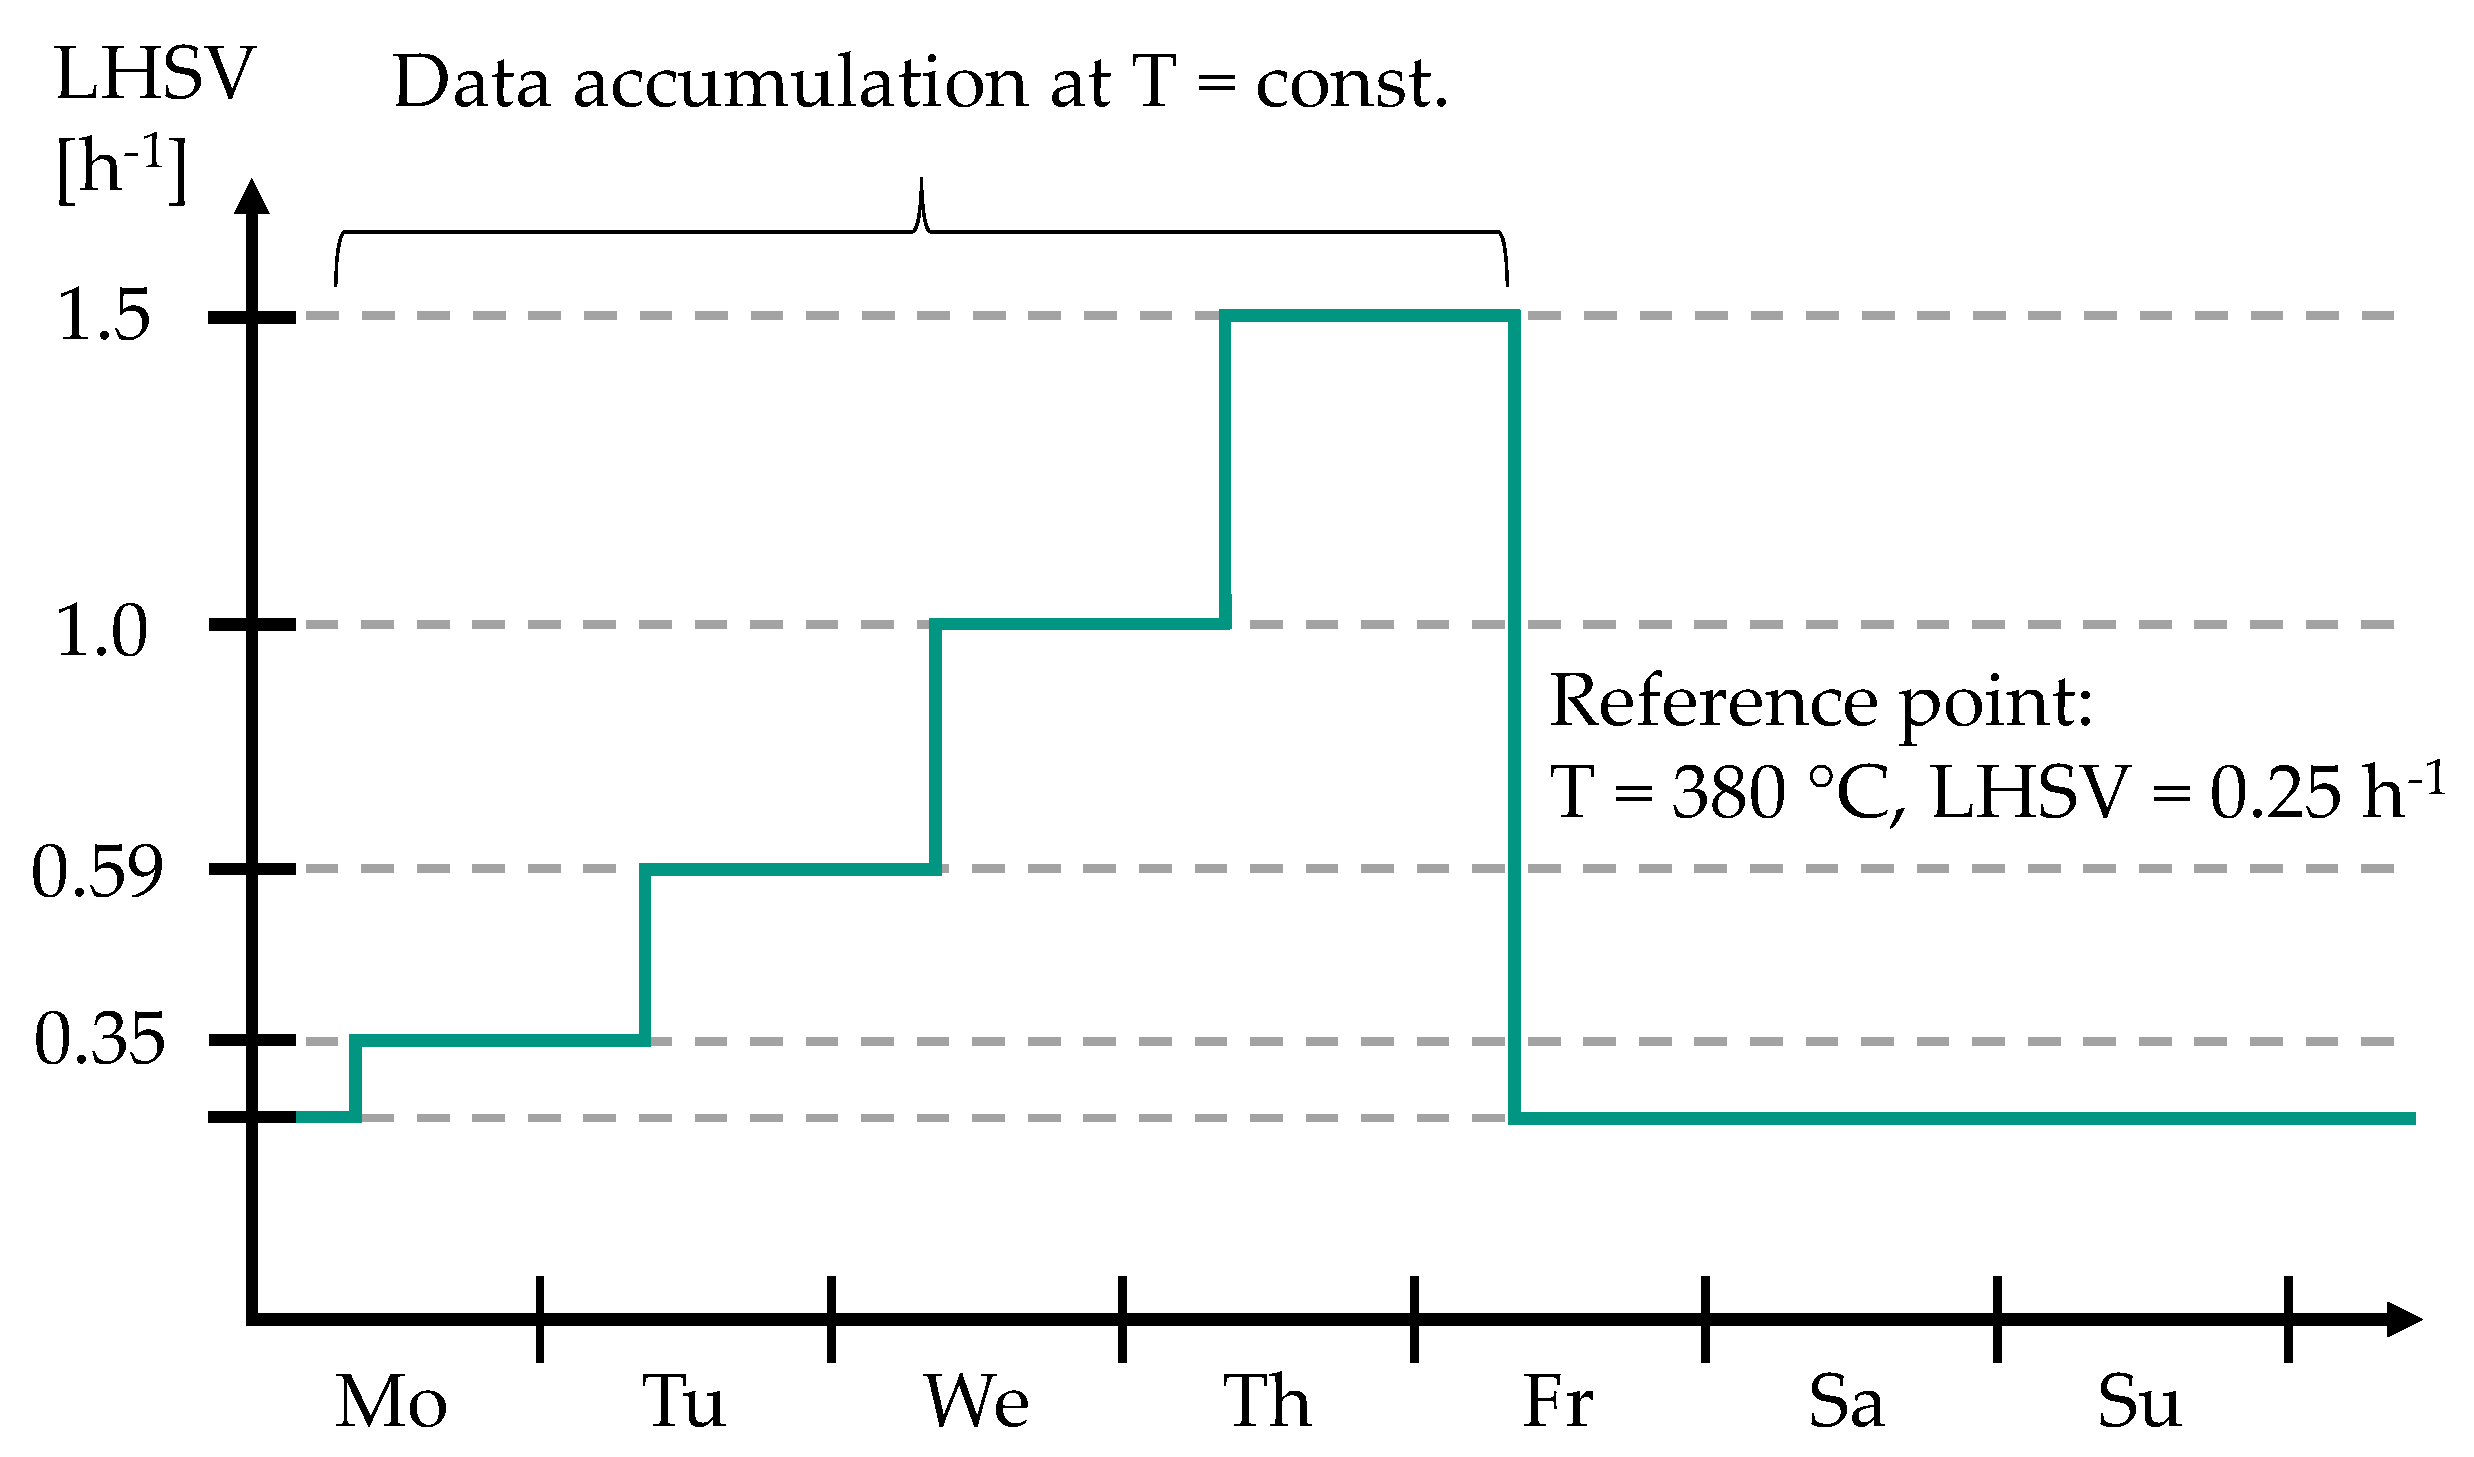
As shown in Figure 2, a reference point at T = 380 °C and LHSV = 0.25 h was set every weekend to keep track of possible catalyst deactivation. After approx. 1000 h on stream, the catalyst deactivation was negligibly low and further experiments were conducted under nearly steady-state conditions (see Figure S1 in Supplementary Materials).
For these experiments, 85 wt.% MD was enriched with 15 wt.% bioliq® HG (see Table 1 for petrochemical parameters). A parameter study was conducted to investigate durene and C aromatics conversions in dependence on temperature and LHSV. Additionally, the fuel yields, i.e., gasoline, kerosene, and diesel, were measured for the conducted experiments. Typical HP temperatures of 340–390 °C were set at weekly intervals. As can be seen in Figure 2, for 350 °C, 370 °C, 380 °C, and 390 °C, the LHSV was set to 0.35 h, 0.59 h, 1.0 h, and 1.5 h on a daily basis. At 340 °C, LHSVs of 0.25 h, 0.5 h, 0.75 h, and 1.20 h were investigated. The ratio / was kept constant at 1042 Nm m for all conducted experiments. All samples obtained from the feedstock consisting of 15 wt.% bioliq® HG and 85 wt.% MD were additionally separated into LG (30–170 °C) and diesel (170–365 °C) using a water-cooled laboratory-scale rectification column with a capacity of 250 mL. ONs and CNs of the obtained gasoline and diesel fractions were measured using an OptiFuel from PAC (Houston, TX, USA). Additionally, the compositions of the gasoline samples were measured using a Reformulyzer M4 from AC PAC (Houston, TX, USA). The data obtained from the parameter study were subsequently used to develop three lumping models, the methodology of which is explained in the following.
2.2. Model Structure and Procedure
Three lumping models are presented in this study, two of which are based on different assumptions regarding the reaction network. Based on the findings, a third optimized model is developed. As mentioned in Section 2.1, all models are based on the data obtained from the experiments with a feedstock of 15 wt.% bioliq® HG and 85 wt.% MD (see Table 1 for petrochemical parameters). Four datasets at reaction temperatures of 340 °C, 350 °C, 380 °C, and 390 °C were used for the parameter estimation, with one dataset at 370 °C left out for independent validation of each model. The experimental data for the parameter estimation can be found in Table S1 in the Supplementary Materials.
Boiling curves of feed and products were measured according to ASTM D7345 [72] and subdivided into lumps. The number of lumps was chosen based on the results of other researchers. Alhumaidan et al. [63] investigated three models for the same dataset having four, five, and ten lumps, respectively. They found no significant increase in the models’ performances if the number of lumps was increased from five to ten and highlighted the tendency of over-fitting. Similar results were reported by Ayasse et al. [61], who compared three models with five, six, and seven lumps for modeling the hydrocracking of bitumen. They achieved similar accuracies for all three models and stated an over-determination for the seven-lump model. It can be concluded that the number of lumps should be chosen only as high as necessary to describe the product composition at hand with the required accuracy. In this study, five liquid lumps were found sufficient to describe the fuels of interest, i.e., gasoline, kerosene, and diesel. A sixth lump represents the gaseous losses, calculated based on a mass balance. Table 2 lists the six lumps considered in this study. Besides their boiling ranges, information on their rough compositions and initial mass fractions (feedstock) is also given.
Gaseous losses (0–30 °C) are represented by lump 6, LG (30–170 °C) by lump 5, HG by lump 4, kerosene (170–270 °C) by the summation of lumps 3 and 4, and diesel (170–365 °C) by the summation of lumps 1–4. Lumps 1–4 consist primarily of paraffins as they strongly overlap with the MD-rich feedstock. Lumps 2–5 are additionally enriched with aromatics originating from bioliq® HG, of which lump 4 has the highest share of aromatics according to the HG boiling range. Gas lump 6 is, with good approximation, entirely paraffinic, resulting from cracking and dealkylation reactions. Cracking and hydrogenation reactions will further result in an enrichment of the lighter lumps with paraffins and naphthenes. Discussions on the mass distribution due to HP reactions will be presented in Section 3.2 and Section 3.3.
The modeling of the experimental data was based on assumptions, which are highlighted in the following. After approx. 1000 h on stream, the catalyst activity could be considered constant, so the experiments for data acquisition were conducted under near steady-state conditions. For constant monitoring, a reference point was adjusted every 6th and 7th day on stream (see Figure 2). Deactivation was quantified as a relative conversion loss of 1.1–2.2% between 1450 h and 2150 h on stream, which is within measurement uncertainty (see Figure S1 in the Supporting Materials). Furthermore, the experiments were considered to be conducted under isothermal conditions, which was ensured by catalyst dilution, as explained in Section 2.1. As proven experimentally [73], HP reactions, e.g., HDS, HDN, and hydrocracking, are frequently considered independent of the hydrogen concentration and thus of first order with respect to the feed [58,61,63,66]. Due to a high excess of hydrogen in the experiments of this study, the rate expressions are considered first order. For all three models, the reactions are further considered irreversible. This seems difficult since up to 19.4 wt.% aromatics are present in the feed, whose hydrogenation is a thermodynamically limited equilibrium reaction [74]. However, with such simplification, good results were obtained in the literature [59,66]. To review the validity of this assumption, we conducted an additional temperature variation from 350 °C to 400 °C in 10 °C steps at a relatively low LHSV of 0.4 h (see Figure S2 in the Supplementary Materials). It was found that the durene conversion increases rapidly from 350 °C to 380 °C and slower between 380 °C and 390 °C, which indicates the equilibrium getting noticeable. Therefore, it can be assumed that the reverse reactions can be neglected for the parameter range and the catalyst investigated in this study. Considering the above-stated and by assuming ideal plug flow reactor conditions, the component mass balances of each lump,
are developed, where and are the mass fractions of lump i and z, respectively, and and are the rate constants for reactions from lump i to z and lump z to i, respectively. The space-time ,
is directly linked to the LHSV, which was calculated based on the actual catalyst volume. For the CoMo/-AlO catalyst used in this study, a particle density of 2.69 ± 0.14 g cm was measured using an Ultrapyc 1200e from Quantachrome (Boynton Beach, FL, USA). The temperature dependencies of the reaction rates in Equation (1) were modeled using the reparameterized Arrhenius equation,
where is the rate constant of reaction j, is the pre-exponential factor for a given reference temperature , is the activation energy and T the reaction temperature. was set to 365 °C, which lies in the middle of the investigated temperature range in this study. The reparameterized equation avoids strong correlations between activation energies and rate constants during fitting [58].
The model equations are constructed from Equations (1)–(3) and solved considering each lump’s initial conditions ( = 0) listed in Table 2. Depending on the number of lumps and reactions, the pre-exponential factors and activation energies in the resulting model equations must be determined. The best set of kinetic parameters was obtained by minimization of the objective function,
based on the sum of square errors between the measured product weight fractions and the calculated product weight fractions , for all lumps and conducted experiments [75]. For the least-squares minimization, the lmfit package in Python was used [76]. A first estimation of the parameter set was either performed by the Levenberg–Marquardt or the Nelder–Mead algorithm. In most cases, the slower but more robust Nelder–Mead algorithm provided a more promising first guess. In contrast, the final parameter estimation was mainly performed with the Levenberg–Marquardt algorithm, as it is strong in finding an optimum if the set of parameters is already close to the global solution [76]. The system of ODEs was solved using scipy.integrate, a sub-package of scipy [77] based on the Runga–Kutta algorithm. However, in some cases, Runga–Kutta was found to fail. If so, the algorithm was switched automatically using the LSODA algorithm. LSODA is a method with automatic stiffness detection and subsequent switching of the solver, e.g., Adams (non-stiff) to BDF (stiff) [77].
As mentioned, three models are developed and compared based on the same data in this study. If the data are described more precisely by model B than by model A, and model B does so with different degrees of freedom, it is helpful to evaluate whether this improvement is statistically valid, for example, using Fisher’s exact test. A lower error with model B than model A is significant if the condition,
is fulfilled, where is the critical value of the F-distribution, are the sums of square errors () and the degrees of freedom [58]. The degrees of freedom of model i,
are calculated based on the number of lumps , number of parameters , and number of experiments . depends on the level of significance, which was chosen with 95 % ( = 0.05) [58]. If the condition of Equation (5) is not fulfilled, the improvement of model B over model A is insignificant, meaning the model with fewer parameters is preferred. The critical values of the F-distribution were calculated with Excel®’s finv function. Input parameters are the degrees of freedom, and , and the probability .
3. Results and Discussion
3.1. Co-Hydroprocessing of Middle Distillate and Heavy Mono-Ring Aromatics
Data discussed in the following were collected over 860 h on stream at three reaction temperatures of 320 °C, 350 °C, and 380 °C for a constant LHSV of 0.4 h, a constant total pressure of 62.9 bar (59 bar , 3.9 bar Ar), and a ratio / of 1042 Nm m using a feedstock consisting of 15 wt.% pure durene and 85 wt.% MD. Additionally, data originating from a temperature variation between 350 °C and 400 °C at pseudo-steady state conditions is discussed in this section.
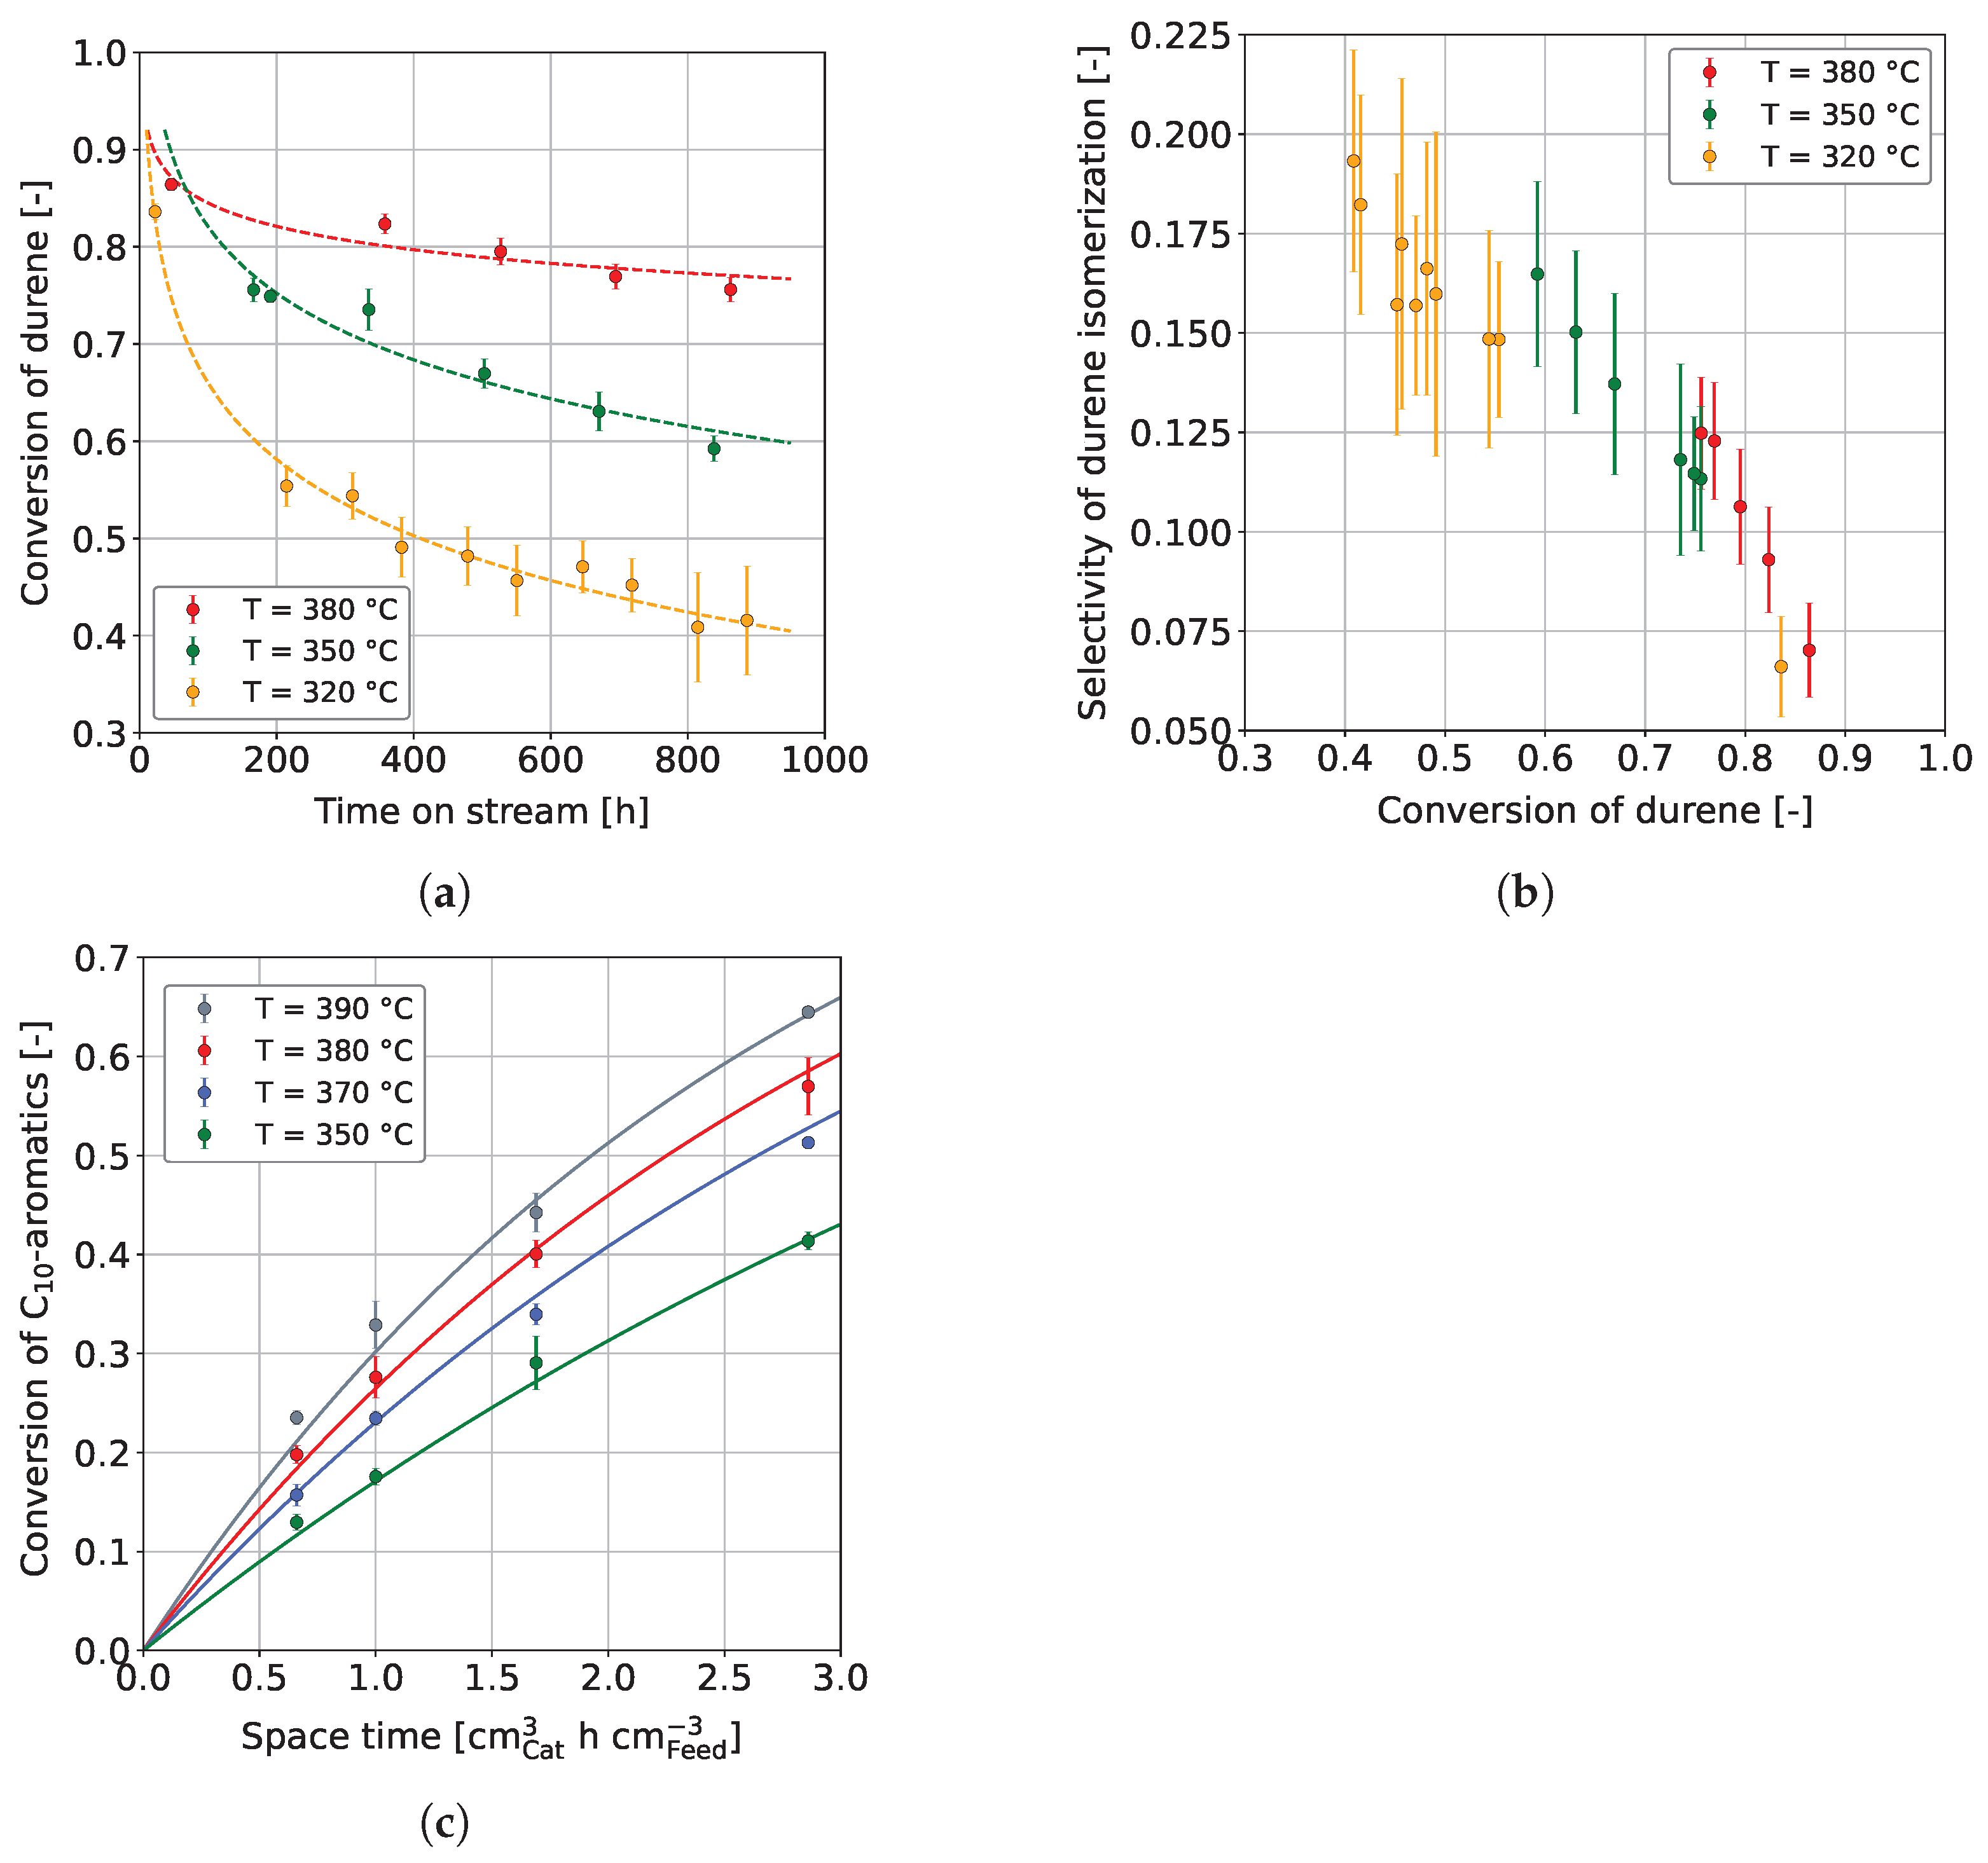
Figure 3a shows the durene conversion,
where and are the respective mass fractions of durene in the feedstock and product, respectively, over a time on stream (TOS) of approx. 860 h, in dependence on temperature. Dashed curves are drawn to clarify the trend and are not based on any mathematical model. At all temperatures studied, especially 320 °C and 350 °C, the durene conversion decreases rapidly in the first hours on stream. The substantial decrease can be explained by catalyst coking, occurring disproportionately in the first hours on stream [65,78]. After a certain decline, the deactivation seems to continue to decrease linearly at all three temperatures, with a pseudo-steady-state presumed at 380 °C. Similar findings were reported by Vivas-Báez et al. [78], who investigated the HP of VGO using a sulfided NiMo/USY catalyst. In their experiments, the catalyst activity decreased significantly in the first 170 h on stream. After this period, deactivation decelerated, and the conversion developed toward a steady-state after approx. 1700 h on stream. In our experiments, it is also noticeable that the hydrogenation conversion increases strongly with increasing reaction temperature, which was also found by other authors [50,58,66]. More precisely, in the present study, durene conversion increased up to the highest reaction temperature investigated, 400 °C (see Figure S2 in the Supplementary Materials), while no conversion maximum was observed as a consequence of equilibrium influence, as found by other authors [52]. This is due to the additional influence of other process parameters on the hydrogenation equilibrium, e.g., an increased hydrogen pressure, which shifts the hydrogenation maximum toward higher reaction temperatures [50,74]. As explained in Section 1.1, aromatics negatively influence a fuel’s petrochemical parameters and emission tendencies. Therefore, we additionally considered the durene isomerization selectivity,
where and are the mass fractions of all C aromatics besides durene in the feedstock and product, respectively.
From the prior mentioned, the selectivity must be low to favor hydrogenation. In Figure 3b, the durene isomerization selectivity is plotted over durene conversion for the temperatures 320 °C, 350 °C, and 380 °C. In general, the isomerization selectivity decreases with conversion, on the first view independent of the reaction temperature. However, slight differences can be observed, although these are not highly significant due to measurement error. The selectivity curve slightly shifts upward at higher reaction temperatures, favoring isomerization. This change in selectivity is most likely due to the influence of the chemical equilibrium on the hydrogenation of aromatics at increased reaction temperatures [74]. An influence of the deactivation is unlikely since the data points were measured over 860 h on stream and no trend could be perceived between points measured early compared to points measured later in the campaign.
We finally investigated the co-HP at nearly steady-state catalyst conditions (1.1–2.2% of relative activity loss), using a blend of 15 wt.% bioliq® HG and 85 wt.% MD as feedstock. Additionally, the data obtained from these experiments were used for modeling purposes, as discussed in Section 3.3. The experiments’ scope can be comprehended in Table S1 in the Supplementary Materials.
Figure 3c shows the C aromatics conversion over space-time in dependence on temperature. The C aromatics conversion increases with higher temperature, similar to Figure 3a for a feedstock containing pure durene. As expected, a higher space-time also increases the conversion of C aromatics, which is also confirmed by other studies [50,58,63,64]. Figure 3c also shows the modeled conversions, applying the reparameterized Arrhenius equation at T = 365 °C. For the hydrogenation of C aromatics, a pre-exponential factor of 0.26 cm h cm and an activation energy of 55.8 kJ mol were found, which lies in the range of activation energies found by other authors for various catalysts and aromatics [74].
It can be concluded that a high reaction temperature is beneficial for the co-HP of heavy aromatics such as durene and MD. The overall aromatic conversion is higher, reducing the isomerization selectivity in favor of hydrogenation. An increased reaction temperature of ≥380 °C is further beneficial as the catalyst reaches pseudo-steady-state conditions faster. A higher C aromatics conversion was additionally reached by increasing the space-time (lower LHSV). Controlling the aromatic hydrogenation over temperature is preferred due to the mentioned benefits but also for process reasons, as the throughput remains unchanged. At the same time, the reaction temperature cannot be increased without constraints. This is partly for constructional reasons, and partly because the reaction temperature is regularly increased to counteract ongoing deactivation. Therefore, the options need to be weighed individually.
3.2. Fuel Yields and Qualities
In addition to removing aromatics, fuel yields, i.e., gasoline, kerosene, and diesel, and the corresponding petrochemical parameters are also of interest to a refinery. The economically most important parameters for gasoline and diesel are the ON, i.e., research octane number (RON) and motor octane number (MON), and the CN, respectively. In the case of kerosene, no further parameters were investigated besides the yield. As the feed mainly consists of linear paraffins and no strong isomerization activity of the catalyst was found in the durene experiments, further downstream processing, such as hydroisomerization, is likely required to meet the low temperature requirements of Jet-A1 [79]. The discussions in this section are based on the samples collected from the experiments presented in Section 3.1 with a feedstock of 15 wt.% bioliq® HG and 85 wt.% MD.
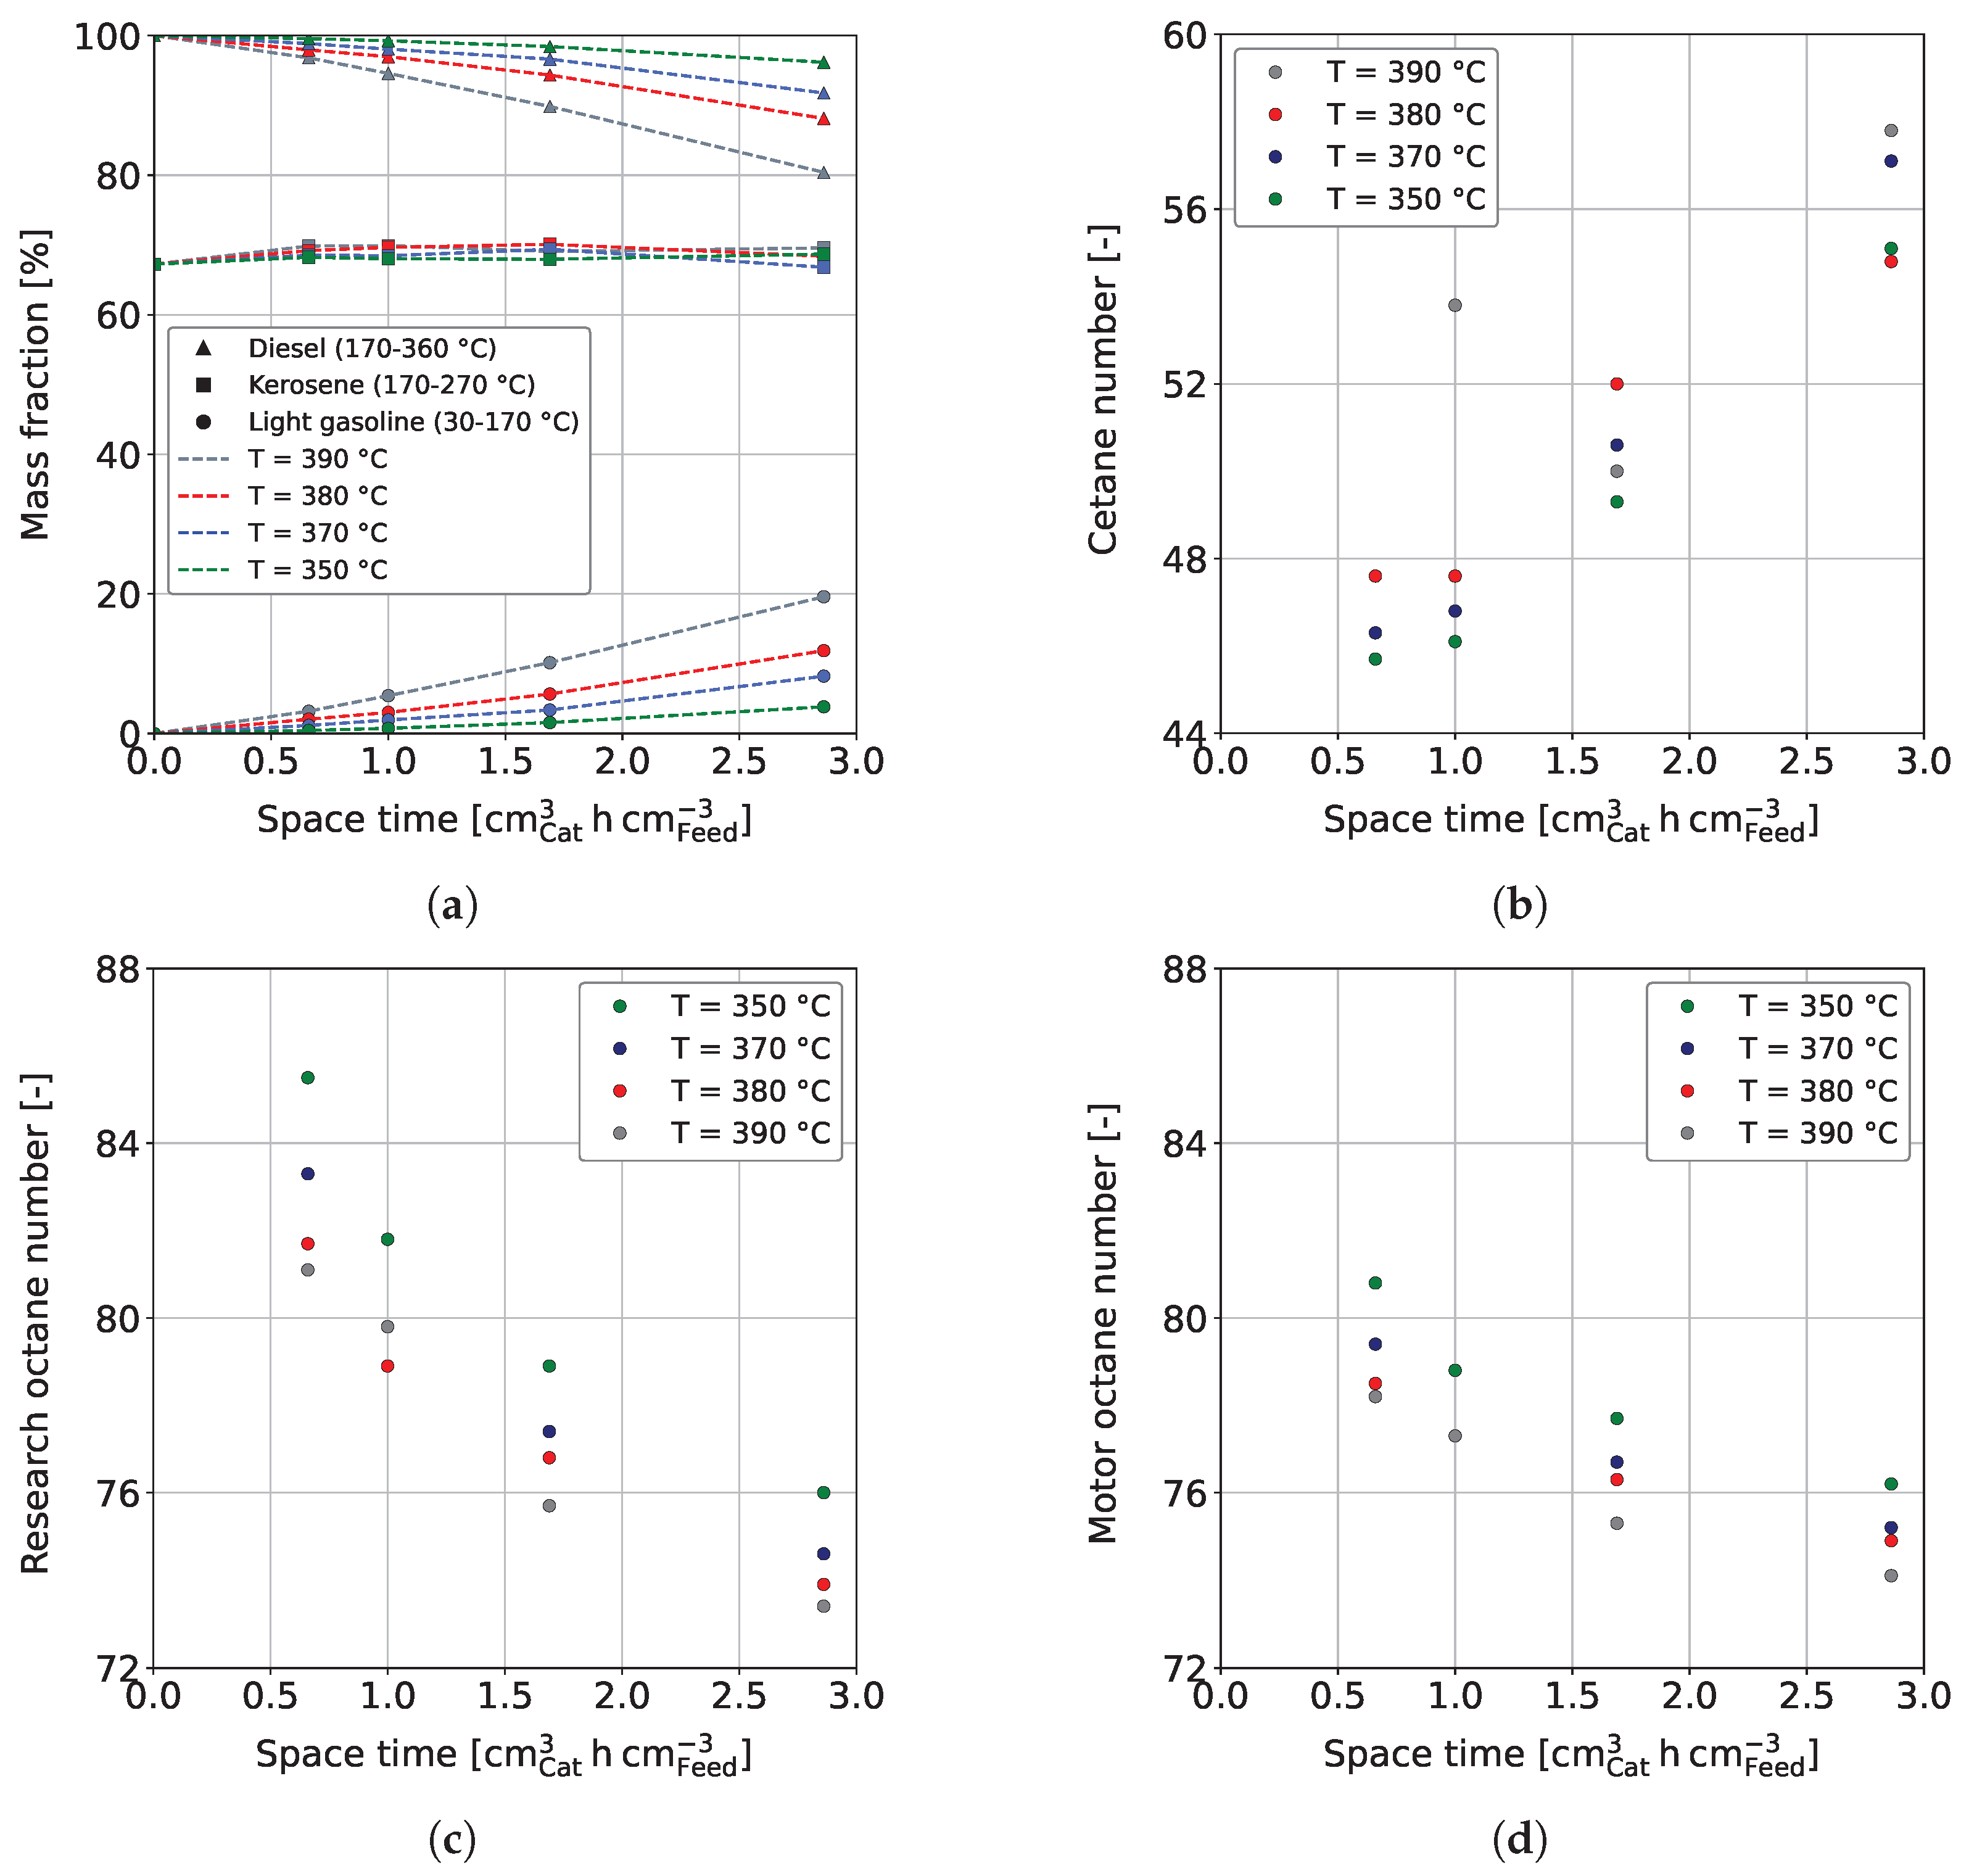
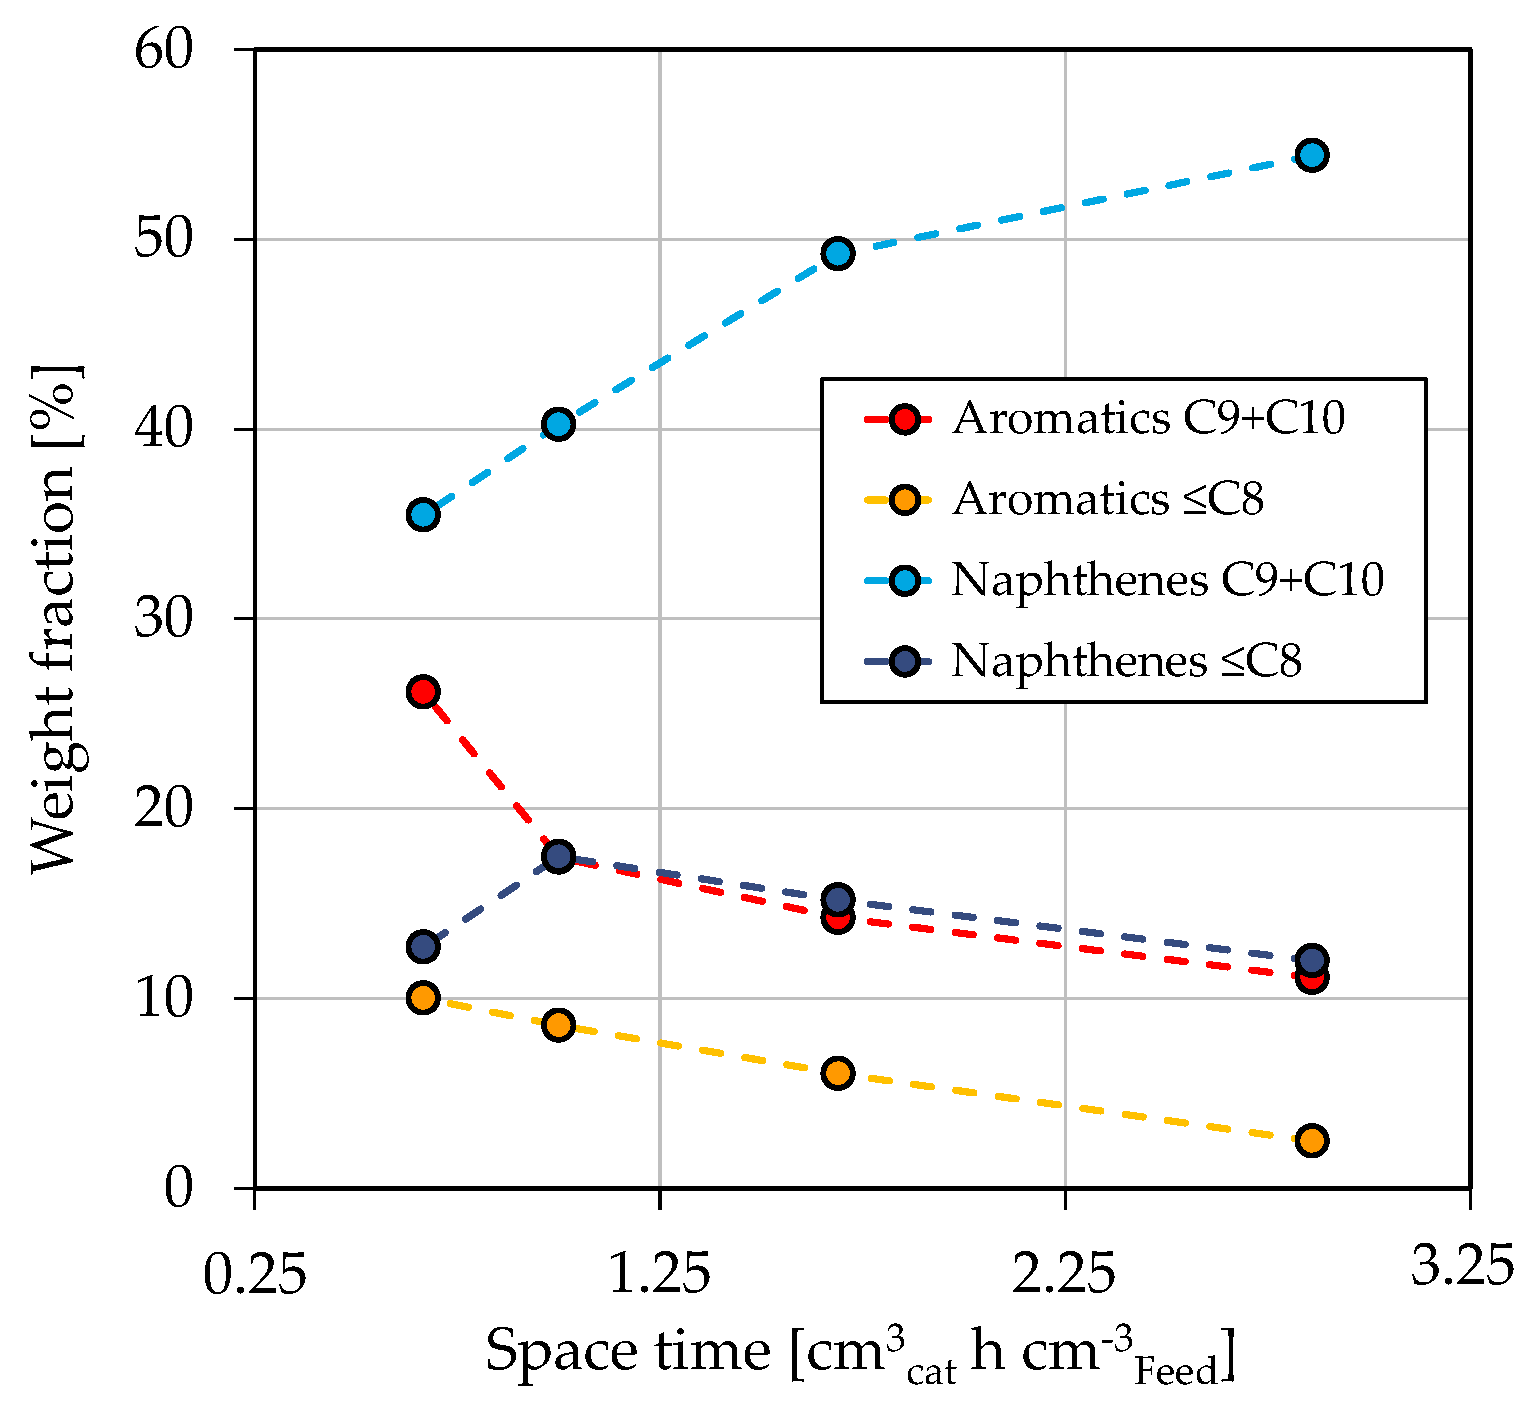
Figure 4a shows the mass fractions of LG, kerosene, and diesel as a function of space-time in dependence on reaction temperature. The gas fraction is not shown, as it does not represent a valuable product fraction. However, further information can be found in Section 3.3 and in the Supporting Materials in Figure S3. It has to be noted that the boiling ranges of kerosene and diesel overlap each other. Consequently, adding up all three fractions would result in a mass fraction above 100%. The mass fraction of diesel decreases while LG increases with rising space-time. This is further enhanced by a higher reaction temperature, which is especially visible for a temperature increase from 380 °C to 390 °C. The observed is due to temperature-sensitive reactions involved in hydrocracking [67]. Similar dependencies on the process conditions are reported in the literature [62,63,66]. For example, Alhumaidan et al. found the same strong influence of the temperature on the hydrocracking of atmospheric residues [63]. In the present study, the hydrogenation of C and C aromatics in the HG forms naphthenes with the same carbon number; however, at a lower boiling range of approx. 140–155 °C. Additionally, the dealkylation of cyclic molecules leads to the formation of smaller aromatics and naphthenes in the gasoline boiling range. This can be comprehended in Figure 5, which shows the weight fractions of aromatic and naphthene lumps in LG for a reaction temperature of 370 °C in dependence on space-time. The C and C aromatics decrease with space-time due to enhanced hydrogenation, as previously shown in Figure 3c, while C and C naphthenes, the direct hydrogenation products, increase. The weight fraction of ≤C aromatics follows that of the lumped C and C aromatics, indicating that the dealkylation of aromatics is responsible for their occurrence. Naphthenes ≤C are formed by hydrogenation of the respective aromatics and by dealkylation of large naphthenes. Simultaneously, this fraction reacts to paraffins (not shown), thus being an intermediate that shows a maximum at a space-time of 1 cm h cm in the investigated parameter range.
Following this argumentation, one would also expect a decreasing yield for kerosene, as the boiling range of HG strongly overlaps with the one of kerosene (see Table 1). However, the kerosene yield stays almost constant over the parameter range investigated. This is probably explained by a pseudo-equilibrium of kerosene-producing and reducing reactions. In fact, there are reactions that exclusively increase kerosene yield, such as the partial hydrogenation of poly-aromatic hydrocarbons (PAHs) already contained in MD. Decalin, the hydrogenation product of the smallest existing PAH naphthalene, has a boiling temperature of approx. 189 °C. Thus, it can be assumed that hydrogenation products of PAHs increase the kerosene yield (170–270 °C) while being of minor influence on the LG yield (30–170 °C). Additionally, it is reported by several authors that catalysts, as used in the present study, are highly cracking selective toward MD fractions [63,65,66] while of a comparably low selectivity toward light boiling hydrocarbons such as gasoline and gases. Consistent with the mentioned, gases were reported to be produced mainly from heavy hydrocarbons [61,62,64,65] and, in fact, stayed within 5.4 wt.% in the present study. Authors stated that increasing cracking activation energies [65] and lower overall reaction rates [63] from heavy to lighter feedstocks are responsible for the observed. Interestingly, such selectivity is typical for catalysts such as CoMo/-AlO, as used in this study, whereby HP catalysts based on zeolites are reported to produce significantly more gasoline [66].
As outlined in Section 2.1, we separated each sample into gasoline and diesel and measured the ONs (RON and MON) and CN, respectively. Figure 4b shows the CN in dependence on space-time and temperature. It can be observed that the CN increases with space-time and reaction temperature. This is due to a decrease in the concentration of aromatics, as shown in Figure 3c, which generally have poor CNs [31]. The required space-time to provide a respective CN is thus higher if a lower reaction temperature is considered. An increasing diesel quality with higher reaction temperature and space-time was also reported by Ancheyta et al. for the co-processing of MD and LCO [50]. Figure 4b shows some outliers, which are due to measurement uncertainties and, in particular, uncertainties in sample distillation. The CN reaches over a wide range of approx. 46–58 for the investigated process conditions. Therefore, diesel that meets the minimum CN of 51 of EN 590 can be provided for every reaction temperature investigated, even if a loss is observable for all samples taken compared to the pure MD (CN = 60.3).
Figure 4c,d shows the RON and MON, respectively, in dependence on space-time and reaction temperature. It can be seen that RON and MON decrease with space-time and temperature due to increased hydrogenation of aromatics (see Figure 3c), having high ONs [80]. In general, CN and ONs are oppositely dependent on the reaction conditions. The more significant decrease in RON compared to MON can be explained by the change in the chemistry of the samples with increasing degrees of hydrogenation and cracking. While aromatics have high RONs, naphthenes and paraffins have comparably high MONs [80].
It can be concluded that high reaction temperatures and space-times reduce diesel yield and increase gasoline yield, while kerosene yield remains constant over the range of parameters studied. Additionally, high reaction temperatures and space-times are favorable for the CN but negatively influence RON and MON due to enhanced hydrogenation of aromatics. Even if beneficial for ONs, a high aromatic content is not to strive for in the case of this study. As outlined in Section 1, heavy aromatics, especially durene, have clear downsides. Therefore, we emphasize that a further evaluation of the fuels’ petrochemical parameters should be carried out. In particular, the cold filter plugging point (CFPP) should be considered, as durene could have negative effects due to crystallization issues.
3.3. Parameter Estimation and Model Validation
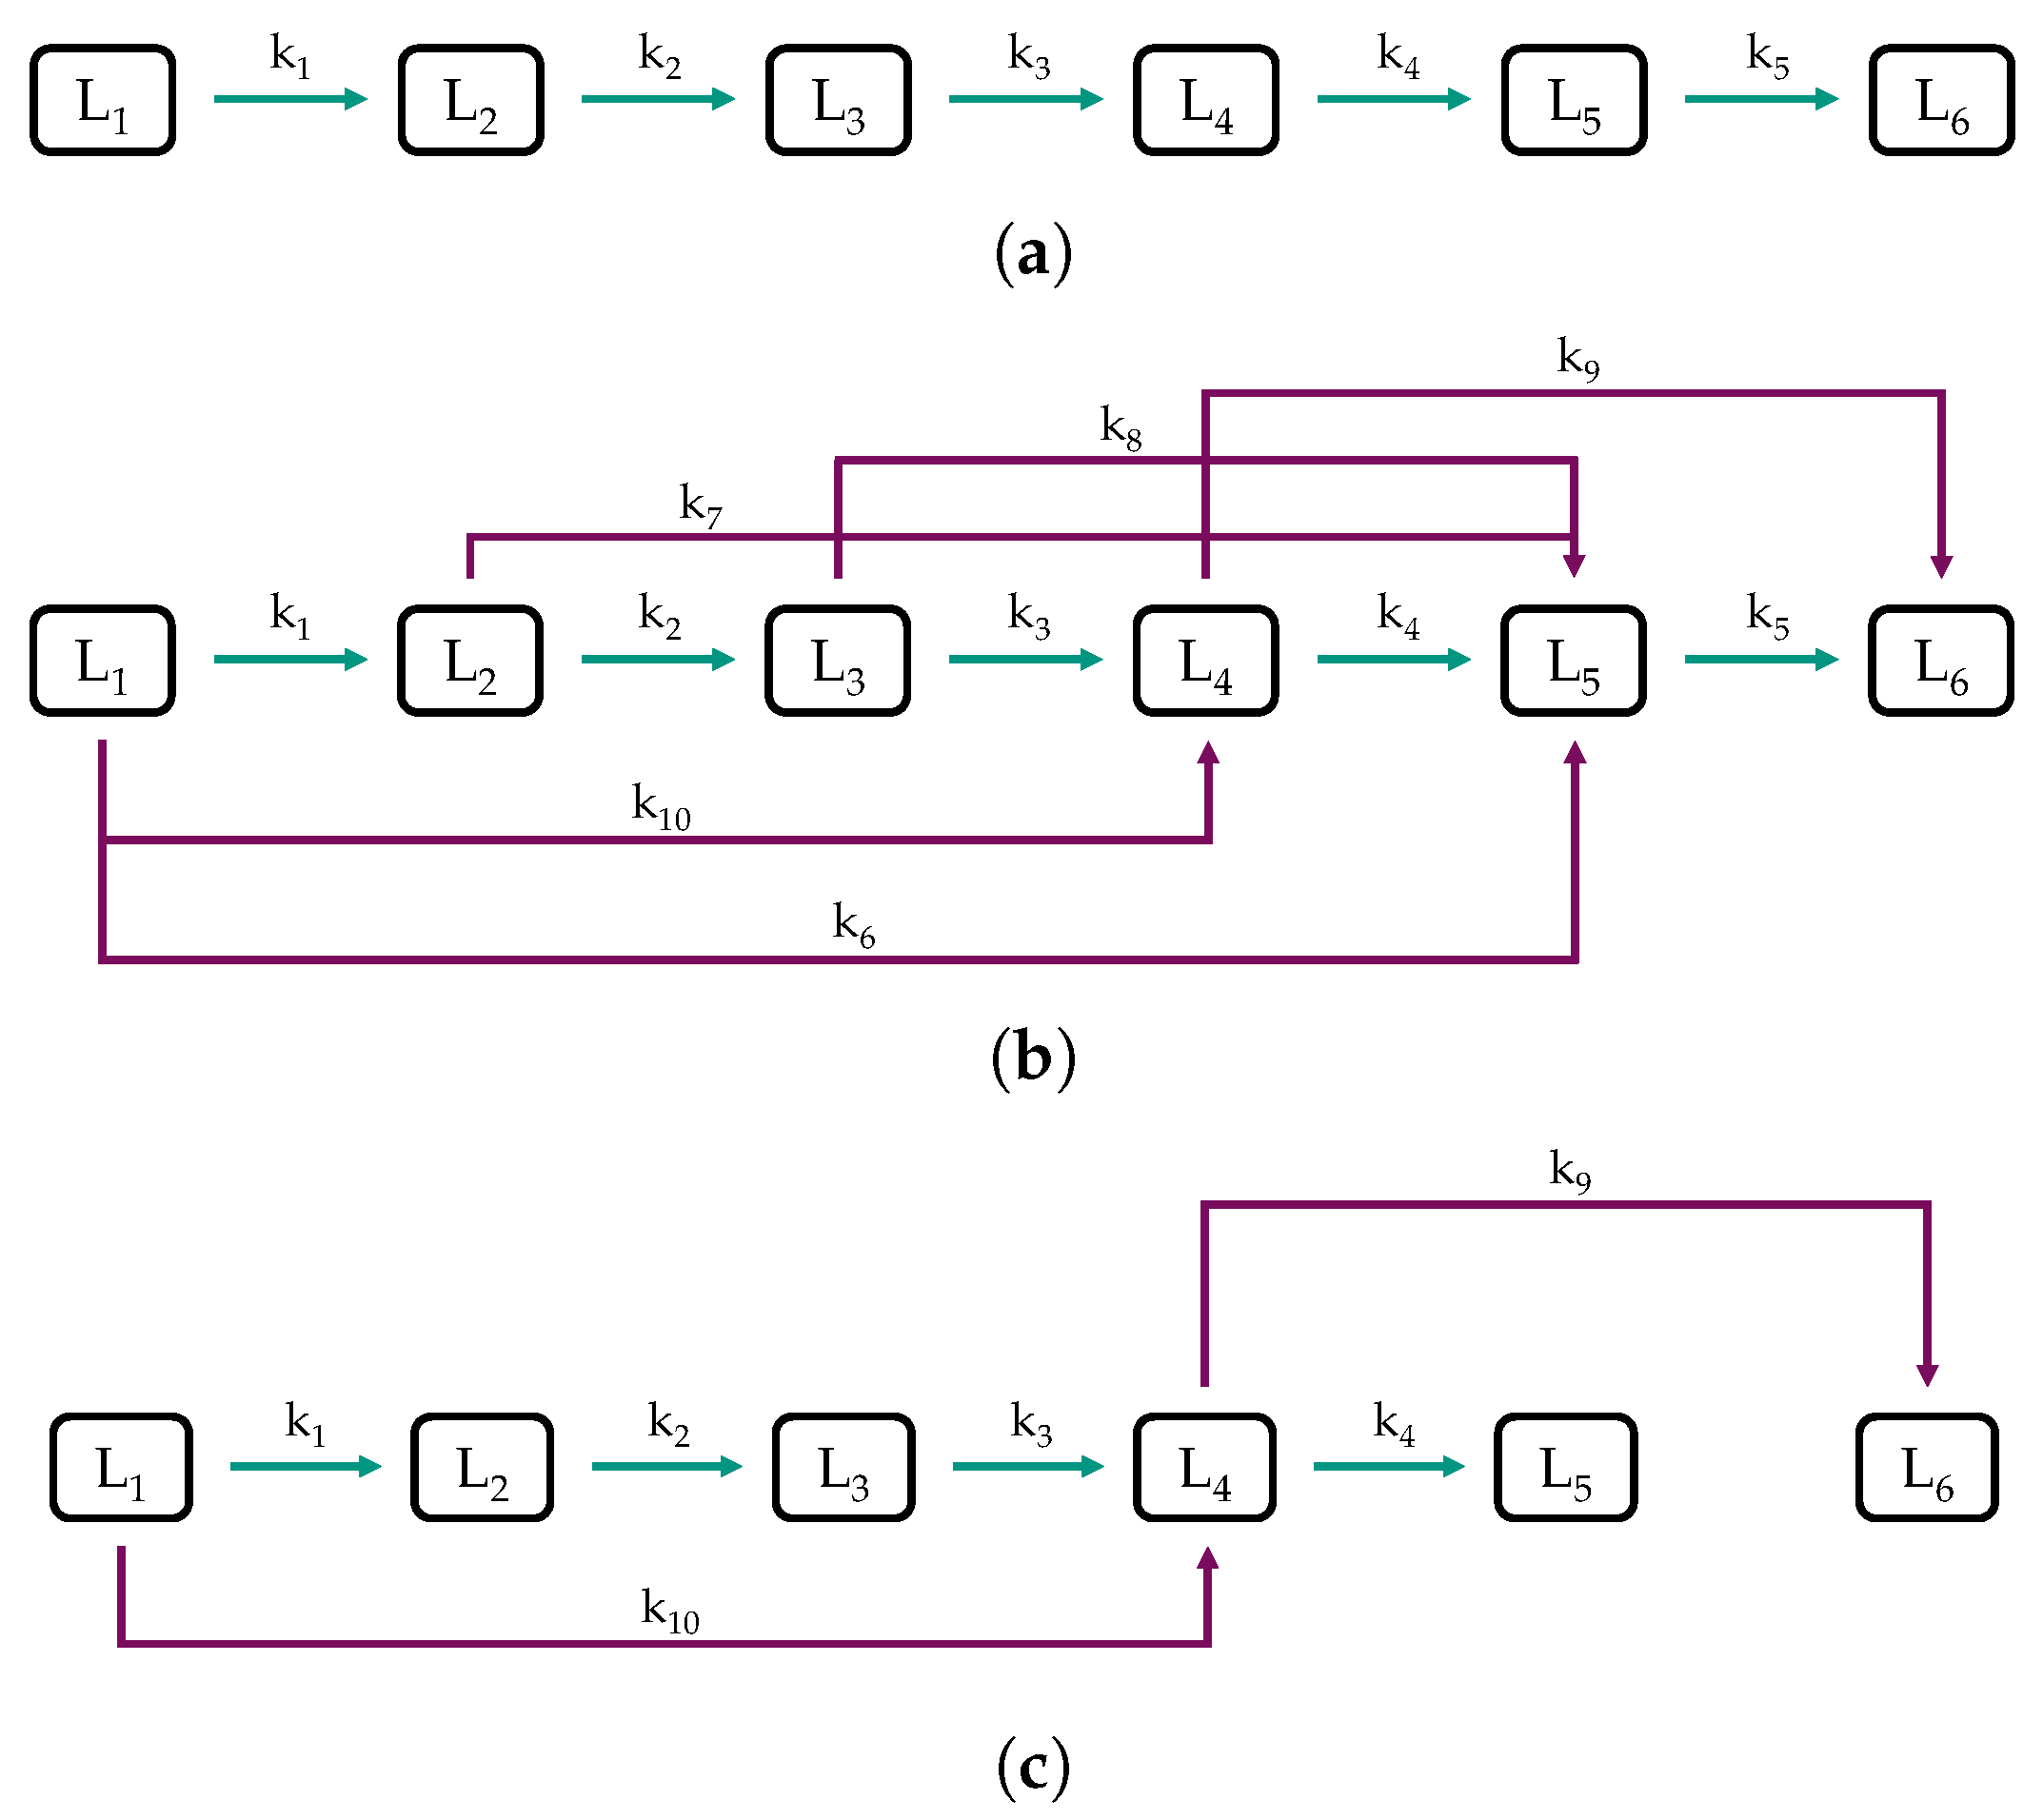
To make process decisions in daily operations, refineries must have models that can predict important product yields. Due to the high complexity of the reactions involved in HP, lumping models are frequently applied. Discrete lumping models can differ in the number of lumps and reaction paths, making it interesting to investigate how different model frameworks fit the same set of experimental data. Figure 6 shows the three lumping models we investigate in this work, all based on six lumps but on different assumptions regarding the reaction network. Five liquid lumps and one gaseous one were chosen as it was identified as the sweet spot between predictive power and the number of parameters to be estimated (see Section 2.2).
Figure 6a shows the sequential model, consisting of a cascade of reactions toward lower boiling lumps. It was considered because such simplified models obtained good results in the literature [58,63,65]. As shown in Figure 6b, the combined model is a detailed discrete lumping model based on the sequential model with additional assumptions, which are also frequently found in the literature [57,58,60,61,62,64,65,66]. As the feedstock used in this study consists almost exclusively of paraffins and mono-ring aromatics (see Section 2.1), important reactions are the hydrogenation of aromatics and cracking reactions, i.e., dealkylation of naphthenes and aromatics, and cracking of paraffins. We assumed an ideal hydrocracking of paraffins, which was, for example, reported by Becker et al. for the HP of VGO using a common hydrotreating catalyst [68]. Ideal hydrocracking is tantamount to predominant cracking in the middle of the hydrocarbon chain, resulting in a bell-shaped molar distribution curve [55]. For example, lump 1, rich in C paraffins, would react mainly to C and C paraffins, which end up as a large share in lump 5 (reaction ) due to their boiling range. The reactions , , , and are constructed following the same assumptions. Additionally, as the feed is rich in C and C aromatics, which are primarily concentrated in lump 4, due to their boiling temperatures, dealkylation was considered with reaction . Dealkylation forms of lighter naphthenes and aromatics besides gaseous compounds ≤C, as outlined in Section 1.2. Finally, a reduced model was developed based on the findings obtained from the sequential and combined model to minimize the number of parameters and thus the risk of over-fitting [81]. The experimental datasets used to develop the models can be found in Table S1 in the Supplementary Materials.
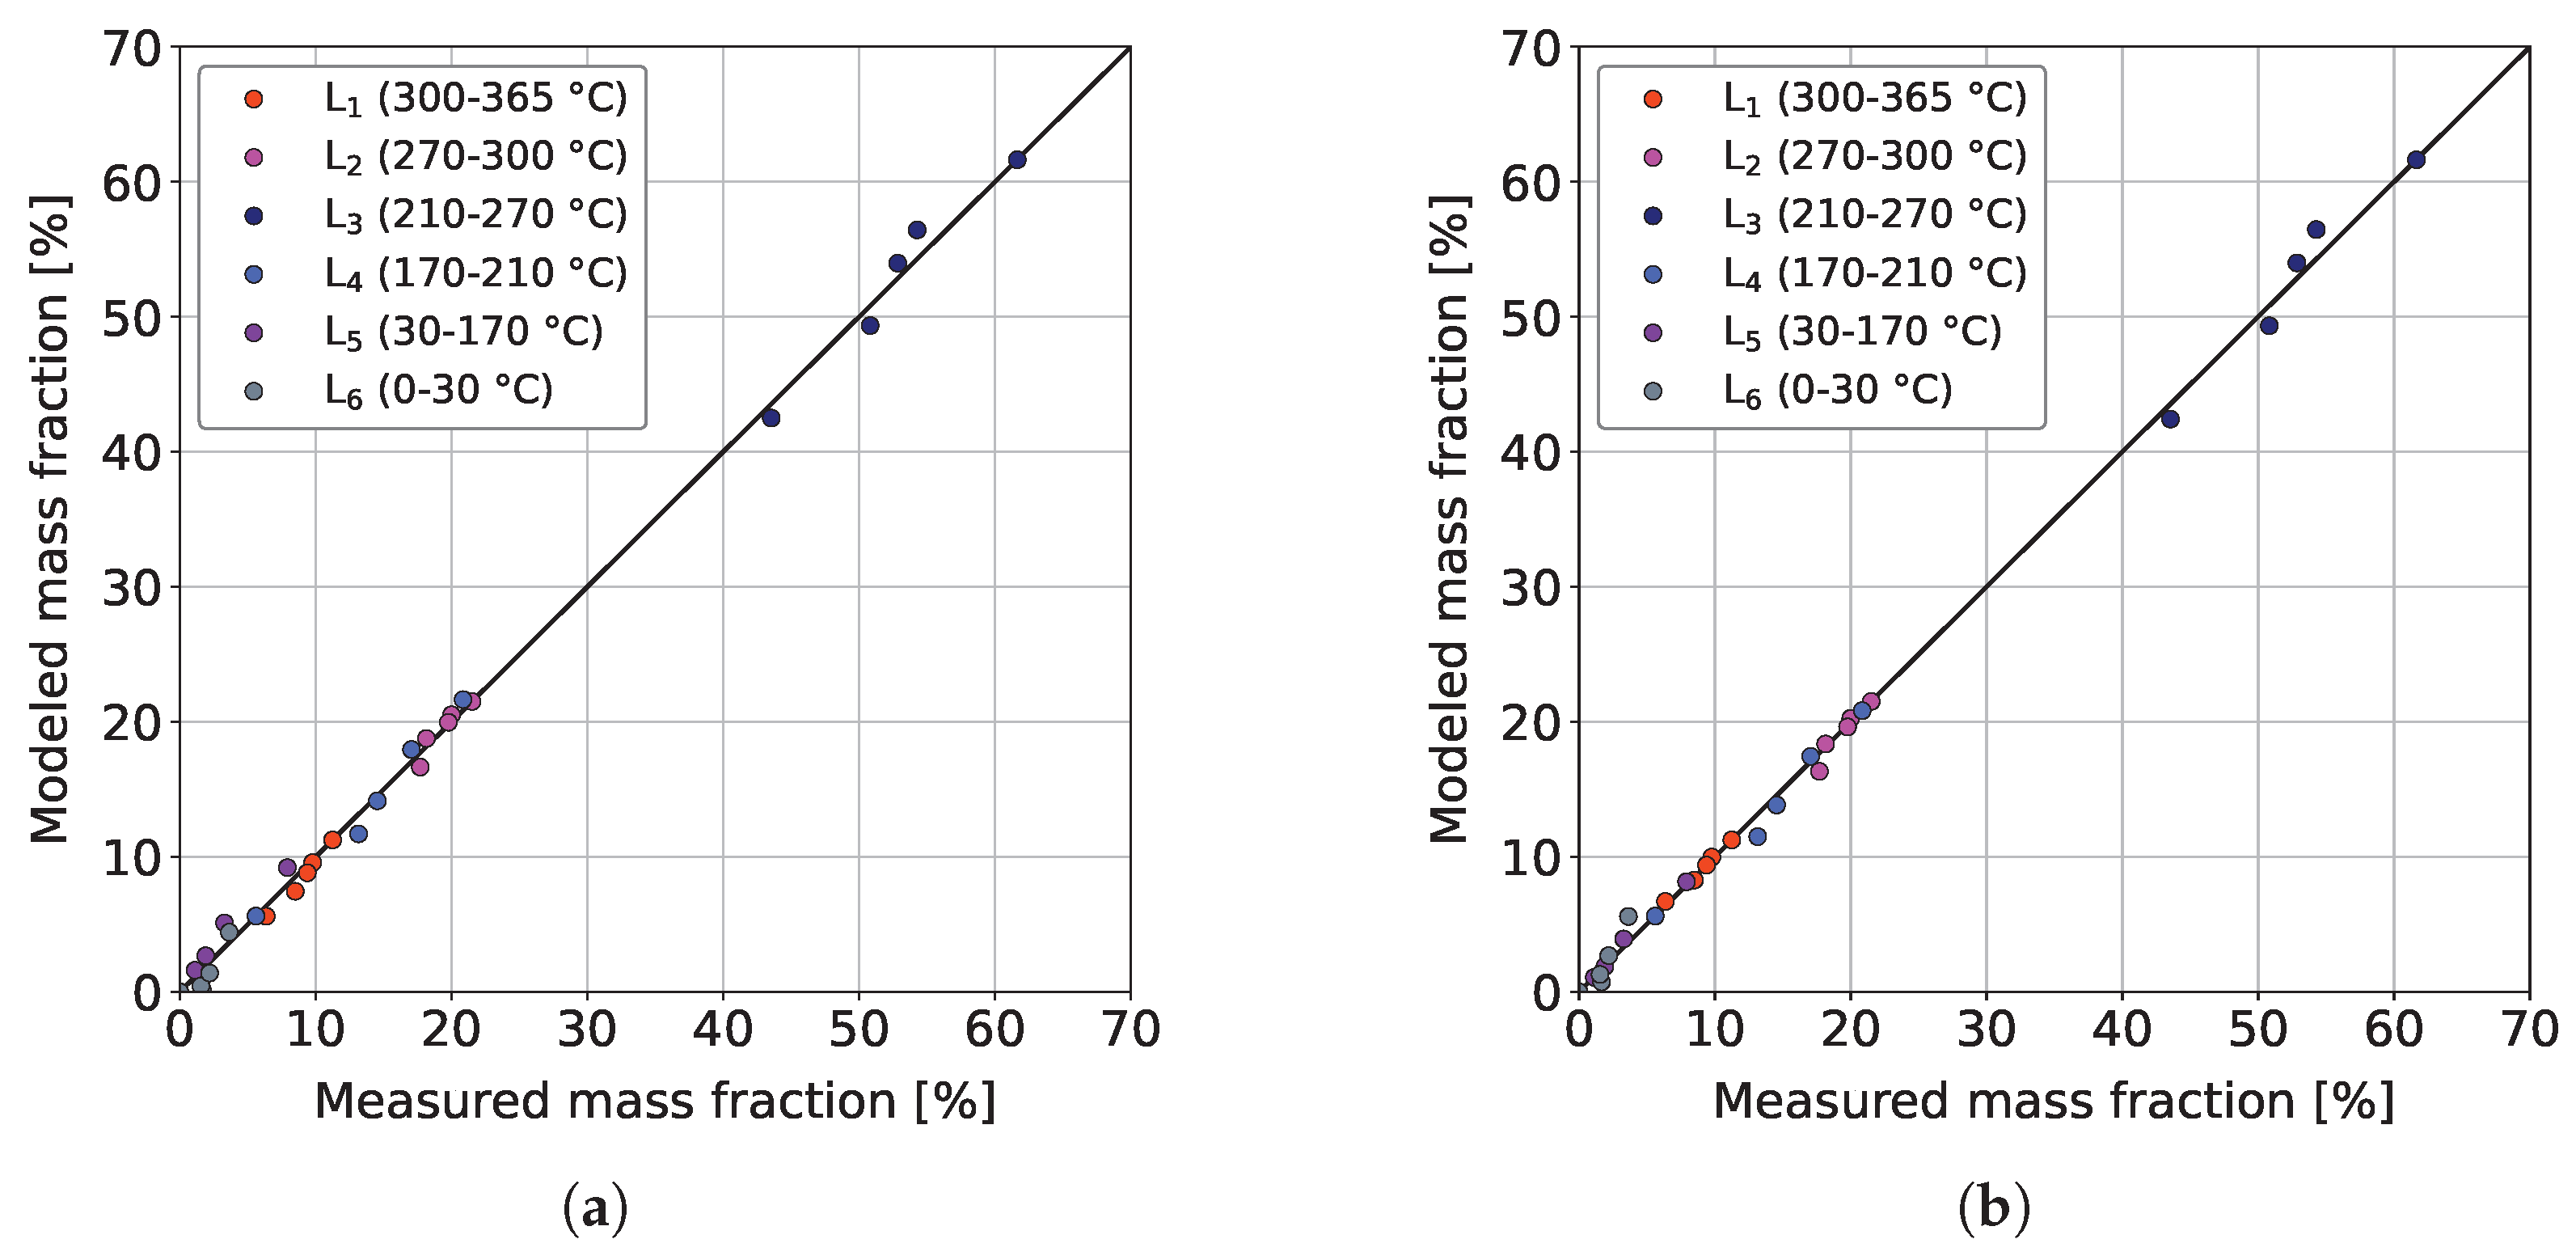
Figure 7a,b show the parity plots of the sequential and the combined model, respectively, for the validation dataset at 370 °C.
It can be seen that both models provide similar qualitative agreements between the measurements and respective model predictions, whereby the combined model returns a slightly better coefficient of determination (0.9978 > 0.9971). Therefore, it can already be concluded that the additional cracking reactions do not bring major benefits. This could be because ideal hydrocracking is insignificant because of the comparatively low acidity of the CoMo/-AlO catalyst used. As a result, a non-carbenium ion-based reaction pathway, such as thermal cracking, could become more important [55]. This gets additional meaning since ideal hydrocracking is usually observed at lower reaction temperatures of about 250 °C [55]. Similar good performances of sequential lumping models for the hydrocracking of heavy hydrocarbons were also reported by other authors [58,63,65]. The same can be comprehended in Table 3, where the reactions , , and have pre-exponential factors clearly below those of the remaining ones.
The low but still significant pre-exponential factor of reaction and the insignificance of reaction can be interpreted as high cracking selectivity of heavy lumps toward gases, as observed for similar sulfided catalysts [61,62,64,65]. Reaction , with its high pre-exponential factor, in the first view, is not in line with the prior statement as gas is formed from the low boiling LG. The observed can be explained with dealkylation reactions (see Figure 5), producing low boiling aromatics, naphthenes, and gases.
For most of the reactions, the calculated activation energies lie in the magnitude found by other authors [57,64,65], even though it must be stated that kinetic parameters of lumping models are highly dependent on the system, e.g., feed and model structure, and should therefore be compared with care [61]. The of the combined model is comparatively high, which, together with the small pre-exponential factor, emphasizes the overall insignificance of reaction . also appears comparably high, which might be due to two reasons. The investigated temperature range could be too low for a pronounced cracking, and the high activation energy indicates its importance for increased temperatures. More likely is that the reaction is misplaced or another is missing, better representing the actual reaction mechanism. As discussed above, other studies have identified heavy fractions as major sources for the production of low molecular hydrocarbons, which correspond to a reaction of heavy lump 1 (maybe also lump 2) to lump 6.
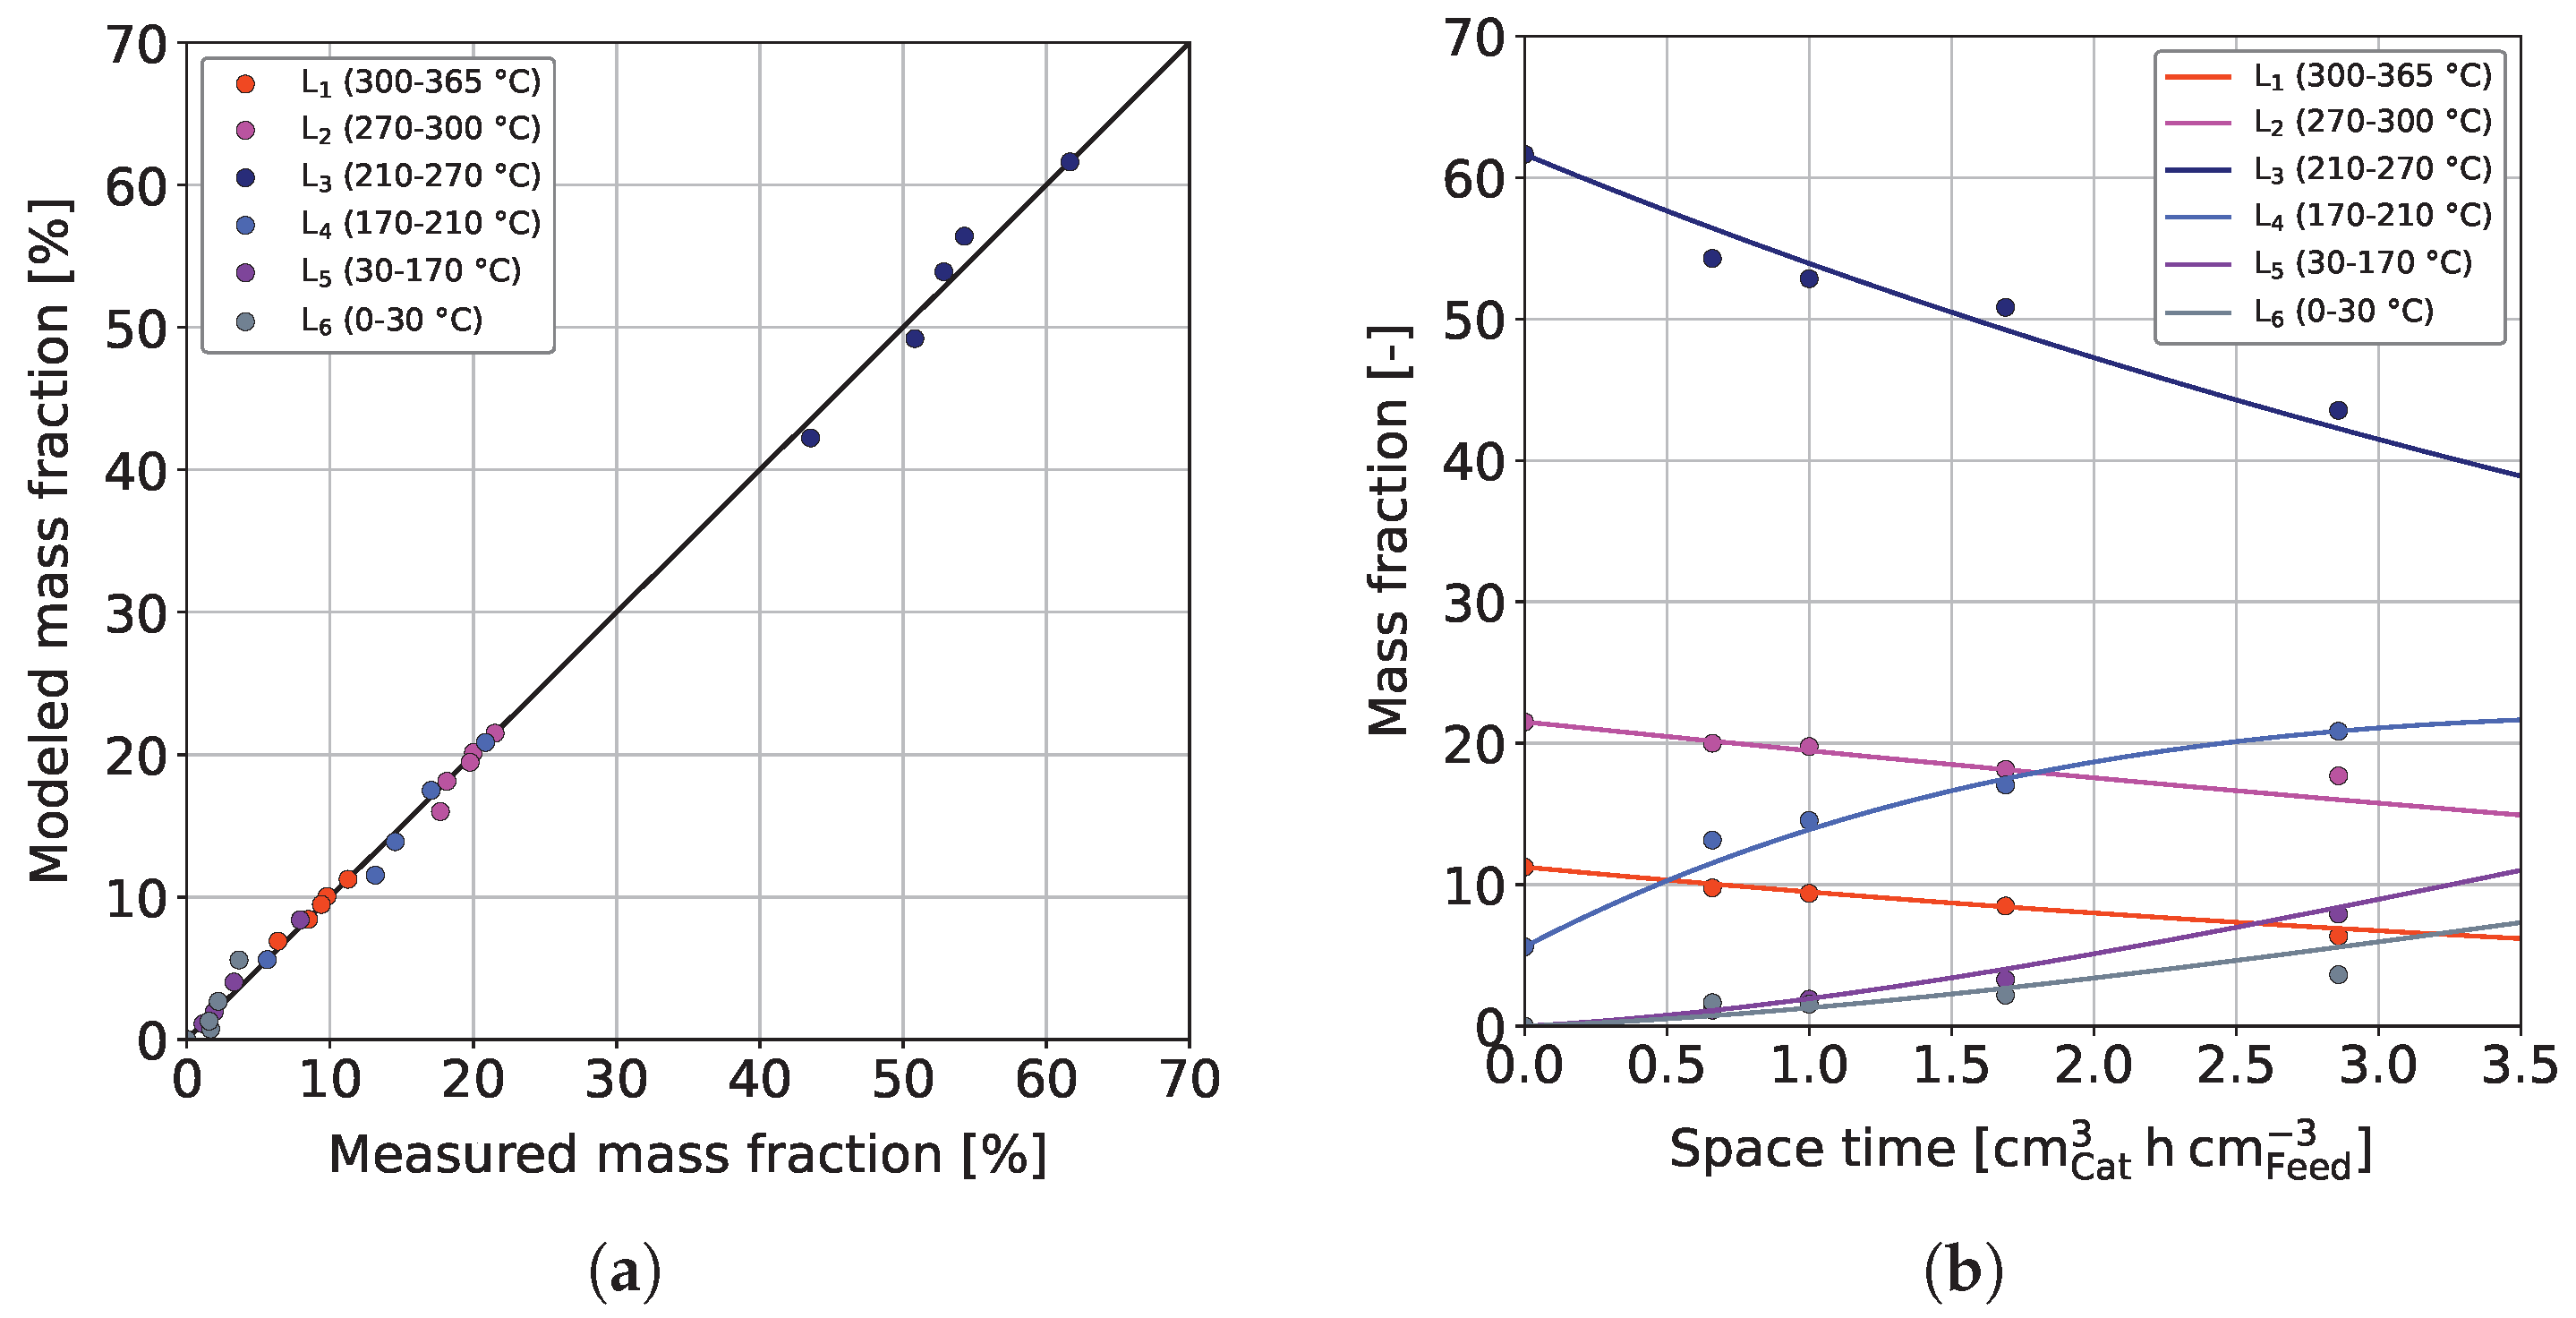
The results from the sequential and combined models were further used to develop a reduced model in which insignificant reactions were omitted. In general, the obtained kinetic parameters (see Table 3) agree with those found for the combined model, and the prior interpretation can be drawn on. Figure 8 shows the results obtained for the reduced model.
The parity plot shown in Figure 8a confirms a qualitatively good fit. As expected, with 0.9976, the coefficient of determination lies between the ones for the sequential and combined model ( > > ).
Fisher’s exact test was applied to the model predictions for the validation dataset at 370 °C to verify that a parameter reduction justifies a loss of accuracy. Calculations were made according to Equations (5) and (6) as described in Section 2.2. The parameters and results are shown in Table 4. By comparing the sequential and reduced model, it was obtained that > , which means that the condition is fulfilled. Therefore, the improvement from the sequential to the reduced model is statistically significant, and one should prefer the reduced model. If the reduced and the combined model are compared by Fisher’s exact test, it is obtained that < . The statistical difference between the reduced and combined model is insignificant, so the reduced model should be preferred. Consequently, the combined model is more accurate but insignificant in terms of the higher number of parameters involved.
Figure 8b additionally shows measured and computed mass fractions of the different lumps for the experimental validation dataset at 370 °C. As can be seen, all measurements of the different lumps are described very well, and no significant over or under-determination can be recognized.
It can be concluded that the reduced model is very well suited for modeling the co-HP of bioliq® HG and fossil MD in the investigated parameter range.
4. Conclusions
In this study, the co-HP of HG originating from the bioliq® process and fossil MD was investigated over a broad parameter range using a commercial CoMo/-AlO catalyst under realistic hydrotreating process conditions. Attention was especially paid to 1,2,4,5-tetramethylbenzene (durene), the most critical component originating from MTG and DTG processes because of its crystallization and high emission tendencies.
High reaction temperatures and space-times significantly improved the durene conversion and simultaneously decreased the isomerization selectivity in favor of hydrogenation. Additionally, cracking of aromatics and naphthenes was greatly enhanced, which decreased the diesel yield in favor of the gasoline yield. In contrast, the kerosene yield stayed almost constant over the investigated parameter range. At high reaction temperatures, the catalyst reached pseudo-steady-state conditions faster, for example, after approx. 1000 h on stream at 380 °C.
The hydrogenation of aromatics led to a considerable improvement of the CN in the diesel fraction, while MON and, more significantly, RON of the gasoline samples decreased. Depending on the parameters applied, a loss of CN between approx. 2.3 and 14.3 was found compared to the original MD (60.3). Hence, diesel meeting a CN of 51 (EN590) could be provided for the co-HP of 15 wt.% bioliq® HG and 85 wt.% MD.
In this work, three models were developed that can accurately predict the data in the experimentally investigated parameter range. As found by other authors, sequential reactions from heavier to lighter lumps were the most important for modeling the HP reactions [58,63,65]. In contrast, adding ideal hydrocracking reactions resulted in only a little more predictive accuracy. Highly significant were incorporated dealkylation reactions, producing gaseous compounds, as well as aromatics and naphthenes in the gasoline boiling range.
Further experiments should be conducted under variation of the feed compositions, i.e., bioliq® HG and heteroatoms, as aromatics were reported to compete in hydrotreating reactions [50]. Co-HP of feedstocks rich in aromatics is highly exothermic and thus challenging [35]. Therefore, the studies performed at a laboratory scale should be repeated at a larger scale where exothermic reactions become a critical factor. In addition, it may be interesting to investigate other catalysts, such as those based on nickel-molybdenum, which have been reported to have high aromatics hydrogenation activity [74]. Finally, it should be clarified under which legal regulations and process conditions co-HP can be run economically profitably, as petrochemical parameters such as the CN decline to some extent.
Supplementary Materials
The following are available online at https://www.mdpi.com/article/10.3390/reactions4030032/s1, Figure S1: Durene and C aromatics conversion at a reference point for the co-HP of 15 wt.% durene and 85 wt.% MD.; Figure S2: Duren conversion under variation of temperature for the co-HP of 15 wt.% durene and 85 wt.% MD.; Figure S3: Fitting results for the reduced model at (a) 350 °C, (b) 380 °C, and (c) 390 °C for the co-HP of 15 wt.% durene and 85 wt.% MD.; Table S1: Experimental data (weight fractions) at 340 °C, 350 °C, 370 °C, 380 °C, and 390 °C for the co-HP of 15 wt.% durene and 85 wt.% MD.
Author Contributions
Conceptualization, D.G. and J.W.; methodology, D.G. and J.W.; software, J.W.; validation, D.G., J.W. and R.R.; formal analysis, D.G. and J.W.; investigation, D.G. and J.W.; resources, R.R.; data curation, D.G. and J.W.; writing—original draft preparation, D.G. and J.W.; writing—review and editing, D.G., J.W. and R.R.; visualization, D.G. and J.W.; supervision, R.R.; project administration, R.R.; funding acquisition, R.R. All authors have read and agreed to the published version of the manuscript.
Funding
This work was supported by the Strategic Dialogue Automotive Industry SDA and the Ministry of Transport Baden-Wuerttemberg as part of the project “refuels–rethinking fuels”.
Data Availability Statement
The data presented in this study, if not included in the Supplementary Materials, are available upon request from the corresponding author.
Acknowledgments
We thank Thomas Otto and Doreen Neumann-Walter from the Institute of Catalysis Research and Technology (IKFT) as part of Karlsruhe Institute of Technology, Germany, for their strong support in characterizing the fuels. We would particularly like to thank our partners from Mineralölraffinerie Obberrhein (MiRO), Karlsruhe, Germany, for constructive discussions during the conduction of this study.
Conflicts of Interest
The authors declare no conflict of interest. The funders had no role in the design of the study; in the collection, analyses, or interpretation of data; in the writing of the manuscript; or in the decision to publish the results.
References
- Our World in Data. Global Direct Primary Energy Consumption. Available online: https://ourworldindata.org/grapher/global-primary-energy (accessed on 6 February 2023).
- European Commission. Communication from the Commission of the European Parliament, the European Council, the Council, the European Economic and Social Committee and the Committee of the Regions: The European Green Deal; European Commission: Brussels, Belgium, 2019.
- The European Parliament and the Council of the European Union. Regulation (EU) 2021/1119 of the European Parliament and of the Council of 30 June 2021 Establishing the Framework for Achieving Climate Neutrality and Amending Regulations (EC) No 401/2009 and (EU) 2018/1999 (’European Climate Law’): Regulation 2021/1119; The European Parliament and the Council of the European Union: Strasbourg, France, 2021. [Google Scholar]
- European Commission. Communication from the Commission to the European Parliament, the Council, the European Economic and Social Committee and the Committee of the Regions: ’Fit for 55’: Delivering the EU’s 2030 Climat Target on the Way to Climate Neutrality; European Commission: Brussels, Belgium, 2021.
- Abnett, K. EU Approves Effective Ban on New Fossil Fuel Cars from 2035. Available online: https://www.reuters.com/markets/europe/eu-approves-effective-ban-new-fossil-fuel-cars-2035-2022-10-27/ (accessed on 25 November 2022).
- Federal Ministry for the Environment, Nature Conservation, Nuclear Safety and Consumer Protection. PtL Roadmap: Sustainable Aviation Fuel from Renewable Energy Sources for Aviation in Germany; Federal Ministry for the Environment, Nature Conservation, Nuclear Safety and Consumer Protection: Berlin, Germany, 2021.
- International Energy Agency. Global EV Outlook 2023: Catching up with Climate Ambitions; International Energy Agency (IEA): Paris, France, 2023. [Google Scholar]
- European Automobile Manufacturers’ Association. Vehicles in Use Europe; European Automobile Manufacturers’ Association (ACEA): Brussels, Belgium, 2023. [Google Scholar]
- Alvarez-Majmutov, A.; Badoga, S.; Chen, J.; Monnier, J.; Zhang, Y. Co-Processing of Deoxygenated Pyrolysis Bio-Oil with Vacuum Gas Oil through Hydrocracking. Energy Fuels 2021, 35, 9983–9993. [Google Scholar] [CrossRef]
- DIN Deutsches Institut für Normung e.V. Automotive Fuels–Unleaded Petrol–Requirements and Test Methods, German version EN 228:2012+A1:2017; Beuthe Verlag GmbH: Berlin, Germany, 2017. [Google Scholar]
- DIN Deutsches Institut für Normung e.V. Automotive fuels—Diesel—Requirements and Test Methods, German version EN 590:2022; Beuthe Verlag GmbH: Berlin, Germany, 2022. [Google Scholar]
- Jeuland, N.; Montagne, X.; Gautrot, X. Potentiality of Ethanol as a Fuel for Dedicated Engine. Oil Gas Sci. Technol.-Rev. l’IFP 2004, 59, 559–570. [Google Scholar] [CrossRef]
- Munsin, R.; Laoonual, Y.; Jugjai, S.; Imai, Y. An experimental study on performance and emissions of a small SI engine generator set fuelled by hydrous ethanol with high water contents up to 40%. Fuel 2013, 106, 586–592. [Google Scholar] [CrossRef]
- Haseeb, A.; Fazal, M.A.; Jahirul, M.I.; Masjuki, H.H. Compatibility of automotive materials in biodiesel: A review. Fuel 2011, 90, 922–931. [Google Scholar] [CrossRef]
- Chang, C.D.; Silvestri, A.J. The Conversion of Methanol and Other O-Compounds to Hydrocarbons over Zeolite Catalysts. J. Catal. 1977, 47, 249–259. [Google Scholar] [CrossRef]
- Olsbye, U.; Svelle, S.; Bjørgen, M.; Beato, P.; Janssens, T.V.W.; Joensen, F.; Bordiga, S.; Lillerud, K.P. Conversion of Methanol to Hydrocarbons: How Zeolite Cavity and Pore Size Controls Product Selectivity. Angew. Chem. Int. Ed. 2012, 51, 5810–5831. [Google Scholar] [CrossRef]
- Chang, C.D. The New Zealand Gas-to-Gasoline plant: An engineering tour de force. Catal. Today 1992, 13, 103–111. [Google Scholar] [CrossRef]
- Topp-Jørgensen, J. Topsøe Integrated Gasoline Synthesis—The Tigas Process. Stud. Surf. Sci. Catal. 1988, 36, 293–305. [Google Scholar] [CrossRef]
- Fujimoto, K.; Asami, K.; Saima, H.; Shikada, T.; Tominaga, H.O. Two-Stage Reaction System for Synthesis Gas Conversion to Gasoline. Ind. Eng. Chem. Prod. Res. Dev. 1986, 25, 262–267. [Google Scholar] [CrossRef]
- Trippe, F.; Fröhling, M.; Schultmann, F.; Stahl, R.; Henrich, E. Techno-Economic Analysis of Fast Pyrolysis as a Process Step Within Biomass-to-Liquid Fuel Production. Waste Biomass Valorization 2010, 1, 415–430. [Google Scholar] [CrossRef]
- Pfitzer, C.; Dahmen, N.; Tröger, N.; Weirich, F.; Sauer, J.; Günther, A.; Müller-Hagedorn, M. Fast Pyrolysis of Wheat Straw in the Bioliq® Pilot Plant. Energy Fuels 2016, 30, 8047–8054. [Google Scholar] [CrossRef]
- Dahmen, N.; Henrich, E.; Dinjus, E.; Weirich, F. The bioliq® bioslurry gasification process for the production of biosynfuels, organic chemicals, and energy. Energy Sustain. Soc. 2012, 2, 3. [Google Scholar] [CrossRef]
- Stiefel, M.; Ahmad, R.; Arnold, U.; Döring, M. Direct synthesis of dimethyl ether from carbon-monoxide-rich synthesis gas: Influence of dehydration catalysts and operating conditions. Fuel Process. Technol. 2011, 92, 1466–1474. [Google Scholar] [CrossRef]
- Zimmermann, M.C.; Otto, T.N.; Wodarz, S.; Zevaco, T.A.; Pitter, S. Mesoporous H–ZSM–5 for the Conversion of Dimethyl Ether to Hydrocarbons. Chem. Ing. Tech. 2019, 91, 1302–1313. [Google Scholar] [CrossRef]
- Amelang, S. Pilot Project in Germany’s Largest Refinery to Produce Synthetic Fuels. 2021. Available online: https://www.cleanenergywire.org/news/pilot-project-germanys-largest-refinery-produce-synthetic-fuels (accessed on 8 March 2023).
- Liederman, D.; Yurchak, S.; Kuo, J.C.W.; Lee, W. Mobil Methanol-to-Gasoline Process. J. Energy 1982, 6, 340–341. [Google Scholar] [CrossRef]
- Petit, A.; Montagne, X. Effects of the Gasoline Composition on Exhaust Emissions of Regulated and Speciated Pollutants. SAE Tech. Pap. 1993, 932681, 1–11. [Google Scholar] [CrossRef]
- Calcote, H.F.; Manos, D.M. Effect of Molecular Structure on Incipient Soot Formation. Combust. Flame 1983, 49, 289–304. [Google Scholar] [CrossRef]
- Lim, S.S.; Vos, T.; Flaxman, A.D.; Danaei, G.; Shibuya, K.; Adair-Rohani, H.; AlMazroa, M.A.; Amann, M.; Anderson, H.R.; Andrews, K.G.; et al. A comparative risk assessment of burden of disease and injury attributable to 67 risk factors and risk factor clusters in 21 regions, 1990–2010: A systematic analysis for the Global Burden of Disease Study 2010. Lancet 2012, 380, 2224–2260. [Google Scholar] [CrossRef]
- Chang, C.D. Hydrocarbons from Methanol. Catal. Rev. Sci. Eng. 1983, 25, 1–118. [Google Scholar] [CrossRef]
- Bisht, D.; Petri, J. Considerations for Upgrading Light Cycle Oil with Hydroprocessing Technologies. Indian Chem. Eng. 2014, 56, 321–335. [Google Scholar] [CrossRef]
- Mokrani, T.; Scurrell, M. Gas Conversion to Liquid Fuels and Chemicals: The Methanol Route–Catalysis and Processes Development. Catal. Rev. 2009, 51, 1–145. [Google Scholar] [CrossRef]
- Vivas, A.H.; Joensen, F. Process and Catalyst for Upgrading Gasoline. U.S. Patent US10150714B2, 11 December 2018. [Google Scholar]
- Graf, D.; Neuner, P.; Rauch, R. Hydroprocessing and Blending of a Biomass-Based DTG-Gasoline. Energy Eng. 2022, 119, 2169–2192. [Google Scholar] [CrossRef]
- van Dyk, S.; Su, J.; Ebadian, M.; Saddler, J. Production of lower carbon-intensity fuels by co-processing biogenic feedstocks: Potential and challenges for refineries. Fuel 2022, 324, 124636. [Google Scholar] [CrossRef]
- van Dyk, S.; Su, J.; Mcmillan, J.D.; Saddler, J. Potential synergies of drop–in biofuel production with further co–processing at oil refineries. Biofuels Bioprod. Biorefin. 2018, 13, 760–775. [Google Scholar] [CrossRef]
- Lappas, A.A.; Bezergianni, S.; Vasalos, I.A. Production of biofuels via co-processing in conventional refining processes. Catal. Today 2009, 145, 55–62. [Google Scholar] [CrossRef]
- Marker, T.L. Opportunities for Biorenewables in Oil Refineries; U.S. Department of Energy: Washington, DC, USA, 2005. [CrossRef]
- Le, W.; Wang, Y.; Zheng, L.; Shi, M.; Li, J. Design and optimization of bio-oil co-processing with vacuum gas oil in a refinery. Energy Convers. Manag. 2019, 195, 620–629. [Google Scholar] [CrossRef]
- Tsai, T.C.; Liu, S.B.; Wang, I. Disproportionation and transalkylation of alkylbenzenes over zeolite catalysts. Appl. Catal. A Gen. 1999, 181, 355–398. [Google Scholar] [CrossRef]
- Vogt, E.T.C.; Weckhuysen, B.M. Fluid catalytic cracking: Recent developments on the grand old lady of zeolite catalysis. Chem. Soc. Rev. 2015, 44, 7342–7370. [Google Scholar] [CrossRef]
- Bezergianni, S.; Dimitriadis, A.; Kikhtyanin, O.; Kubička, D. Refinery co-processing of renewable feeds. Prog. Energy Combust. Sci. 2018, 68, 29–64. [Google Scholar] [CrossRef]
- Al-Sabawi, M.; Chen, J.; Ng, S. Fluid Catalytic Cracking of Biomass-Derived Oils and Their Blends with Petroleum Feedstocks: A Review. Energy Fuels 2012, 26, 5355–5372. [Google Scholar] [CrossRef]
- Pinho, A.d.R.; de Almeida, M.B.; Mendes, F.L.; Ximenes, V.L.; Casavechia, L.C. Co-processing raw bio-oil and gasoil in an FCC Unit. Fuel Process. Technol. 2015, 131, 159–166. [Google Scholar] [CrossRef]
- Thegarid, N.; Fogassy, G.; Schuurman, Y.; Mirodatos, C.; Stefanidis, S.; Iliopoulou, E.F.; Kalogiannis, K.; Lappas, A.A. Second-generation biofuels by co-processing catalytic pyrolysis oil in FCC units. Appl. Catal. B Environ. 2014, 145, 161–166. [Google Scholar] [CrossRef]
- Jones, D.S.J.S.; Pujadó, P.R. Handbook of Petroleum Processing; Springer: Dordrecht, The Netherlands, 2006. [Google Scholar] [CrossRef]
- van Dyk, S.; Su, J.; Mcmillan, J.D.; Saddler, J. ’Drop-In’ Biofuels: The Key Role That Co-Processing Will Play in Its Production; IEA Bioenergy: Paris, France, 2019. [Google Scholar]
- Zacher, A.H.; Olarte, M.V.; Santosa, D.M.; Elliott, D.C.; Jones, S.B. A review and perspective of recent bio-oil hydrotreating research. Green Chem. 2014, 16, 491–515. [Google Scholar] [CrossRef]
- Furimsky, E. Selection of catalysts and reactors for hydroprocessing. Appl. Catal. A Gen. 1998, 171, 177–206. [Google Scholar] [CrossRef]
- Ancheyta-Juárez, J.; Aguilar-Rodríguez, E.; Salazar-Sotelo, D.; Betancourt-Rivera, G.; Leiva-Nuncio, M. Hydrotreating of straight run gas oil–light cycle oil blends. Appl. Catal. A Gen. 1999, 180, 195–205. [Google Scholar] [CrossRef]
- Nakakita, K.; Ban, H.; Takasu, S.; Hotta, Y.; Inagaki, K.; Weissman, W.; Farrell, J.T. Effect of Hydrocarbon Molecular Structure in Diesel Fuel on In-Cylinder Soot Formation and Exhaust Emissions. SAE Int. J. Fuels Lubr. 2003, 112, 1763–1775. [Google Scholar] [CrossRef]
- Sági, D.; Baladincz, P.; Varga, Z.; Hancsók, J. Co-processing of FCC light cycle oil and waste animal fats with straight run gas oil fraction. J. Clean. Prod. 2016, 111, 34–41. [Google Scholar] [CrossRef]
- Jiang, Y.; Phillips, S.D.; Singh, A.; Jones, S.B.; Gaspar, D.J. Potential economic values of low-vapor-pressure gasoline-range bio-blendstocks: Property estimation and blending optimization. Fuel 2021, 297, 120759. [Google Scholar] [CrossRef]
- Laxminarasimhan, C.S.; Verma, R.P.; Ramachandran, P.A. Continuous lumping model for simulation of hydrocracking. AIChE J. 1996, 42, 2645–2653. [Google Scholar] [CrossRef]
- Weitkamp, J. Catalytic Hydrocracking—Mechanisms and Versatility of the Process. ChemCatChem 2012, 4, 292–306. [Google Scholar] [CrossRef]
- Sullivan, R.F.; Egan, C.J.; Langlois, G.E.; Sieg, R.P. A New Reaction That Occurs in the Hydrocracking of Certain Aromatic Hydrocarbons. J. Am. Chem. Soc. 1961, 83, 1156–1160. [Google Scholar] [CrossRef]
- Ancheyta, J.; Sánchez, S.; Rodríguez, M.A. Kinetic modeling of hydrocracking of heavy oil fractions: A review. Catal. Today 2005, 109, 76–92. [Google Scholar] [CrossRef]
- Palos, R.; Gutiérrez, A.; Hita, I.; Castaño, P.; Thybaut, J.W.; Arandes, J.M.; Bilbao, J. Kinetic Modeling of Hydrotreating for Enhanced Upgrading of Light Cycle Oil. Ind. Eng. Chem. Res. 2019, 58, 13064–13075. [Google Scholar] [CrossRef]
- Hita, I.; Aguayo, A.T.; Olazar, M.; Azkoiti, M.J.; Bilbao, J.; Arandes, J.M.; Castaño, P. Kinetic Modeling of the Hydrotreating and Hydrocracking Stages for Upgrading Scrap Tires Pyrolysis Oil (STPO) toward High-Quality Fuels. Energy Fuels 2015, 29, 7542–7553. [Google Scholar] [CrossRef]
- Soto-Azuara, L.A.; Ramírez-López, R.; del Carmen Monterrubio-Badillo, M.; Elizalde, I. Mathematical modeling of the hydrocracking kinetics of a heavy oil fraction using the discrete lumping approach: The effect of the variation of the lump number. React. Kinet. Mech. Catal. 2022, 135, 655–667. [Google Scholar] [CrossRef]
- Ayasse, A.R.; Nagaishi, H.; Chan, E.W.; Gray, M.R. Lumped kinetics of hydrocracking of bitumen. Fuel 1997, 76, 1025–1033. [Google Scholar] [CrossRef]
- Jarullah, A.T.; Mujtaba, I.M.; Wood, A.S. Enhancement of Productivity of Distillate Fractions by Crude Oil Hydrotreatment: Development of Kinetic Model for the Hydrotreating Process. Comput. Aided Chem. Eng. 2011, 29, 261–265. [Google Scholar] [CrossRef]
- Alhumaidan, F.; Lababidi, H.M.S.; Al-Adwani, H. Hydrocracking of atmospheric residue feedstock in hydrotreating processes. Kuwait J. Sci. Eng. 2010, 37, 129–159. [Google Scholar]
- Sánchez, S.; Rodríguez, M.A.; Ancheyta, J. Kinetic Model for Moderate Hydrocracking of Heavy Oils. Ind. Eng. Chem. Res. 2005, 44, 9409–9413. [Google Scholar] [CrossRef]
- Martínez, J.; Ancheyta, J. Kinetic model for hydrocracking of heavy oil in a CSTR involving short term catalyst deactivation. Fuel 2012, 100, 193–199. [Google Scholar] [CrossRef]
- Sadighi, S.; Ahmad, A.; Rashidzadeh, M. 4-Lump kinetic model for vacuum gas oil hydrocracker involving hydrogen consumption. Korean J. Chem. Eng. 2010, 27, 1099–1108. [Google Scholar] [CrossRef]
- Ramírez, S.; Martínez, J.; Ancheyta, J. Kinetics of thermal hydrocracking of heavy oils under moderate hydroprocessing reaction conditions. Fuel 2013, 110, 83–88. [Google Scholar] [CrossRef]
- Becker, P.J.; Celse, B.; Guillaume, D.; Dulot, H.; Costa, V. Hydrotreatment modeling for a variety of VGO feedstocks: A continuous lumping approach. Fuel 2015, 139, 133–143. [Google Scholar] [CrossRef]
- Martens, G.G.; Thybaut, J.W.; Marin, G.B. Single-Event Rate Parameters for the Hydrocracking of Cycloalkanes on Pt/US-Y Zeolites. Ind. Eng. Chem. Res. 2001, 40, 1832–1844. [Google Scholar] [CrossRef]
- Texier, S. Activation of alumina-supported hydrotreating catalysts by organosulfides: Comparison with H2S and effect of different solvents. J. Catal. 2004, 223, 404–418. [Google Scholar] [CrossRef]
- ASTM D6730-01; Standard Test Method for Determination of Individual Components in Spark Ignition Engine Fuels by 100-Metre Capillary (with Precolumn) High-Resolution Gas Chromatography. ASTM International: West Conshohocken, PA, USA, 2001. [CrossRef]
- ASTM D7345; Standard Test Method for Distillation of Petroleum Products and Liquid Fuels at Atmospheric Pressure (Micro Distillation Method). ASTM International: West Conshohocken, PA, USA, 2017. [CrossRef]
- Qader, S.A.; Hill, G.R. Hydrocracking of Gas Oil. Ind. Eng. Chem. Process. Des. Dev. 1969, 8, 98–105. [Google Scholar] [CrossRef]
- Cooper, B.H.; Donnis, B.B. Aromatic saturation of distillates: An overview. Appl. Catal. A Gen. 1996, 137, 203–223. [Google Scholar] [CrossRef]
- Alcázar, L.A.; Ancheyta, J. Sensitivity analysis based methodology to estimate the best set of parameters for heterogeneous kinetic models. Chem. Eng. J. 2007, 128, 85–93. [Google Scholar] [CrossRef]
- Newville, M.; Stensitzki, T.; Allen, D.B.; Antonino, I. LMFIT: Non-Linear Least-Square Minimization and Curve-Fitting for Python 2014. Available online: https://zenodo.org/record/11813 (accessed on 31 July 2023).
- Virtanen, P.; Gommers, R.; Oliphant, T.E.; Haberland, M.; Reddy, T.; Cournapeau, D.; Burovski, E.; Peterson, P.; Weckesser, W.; Bright, J.; et al. SciPy 1.0: Fundamental algorithms for scientific computing in Python. Nat. Methods 2020, 17, 261–272. [Google Scholar] [CrossRef]
- Vivas-Báez, J.C.; Servia, A.; Pirngruber, G.D.; Dubreuil, A.C.; Pérez-Martínez, D.J. Insights in the phenomena involved in deactivation of industrial hydrocracking catalysts through an accelerated deactivation protocol. Fuel 2021, 303, 120681. [Google Scholar] [CrossRef]
- Meurer, A.; Kern, J. Fischer–Tropsch Synthesis as the Key for Decentralized Sustainable Kerosene Production. Energies 2021, 14, 1836. [Google Scholar] [CrossRef]
- Kubic, W.L. A Group Contribution Method for Estimating Cetane and Octane Numbers; Los Alamos National Laboratory: Los Alamos, NM, USA, 2016. Available online: https://www.osti.gov/biblio/1291241/ (accessed on 8 March 2023).
- Hawkins, D.M. The Problem of Overfitting. J. Chem. Inf. Comput. Sci. 2004, 44, 1–12. [Google Scholar] [CrossRef]
Figure 1.
Lumping model with n lumps and m reactions.

Figure 2.
Weekly experimental procedure for the parameter study with a feedstock of 85 wt.% MD and 15 wt.% bioliq® HG.
Figure 2.
Weekly experimental procedure for the parameter study with a feedstock of 85 wt.% MD and 15 wt.% bioliq® HG.

Figure 3.
(a) Durene conversion and (b) durene isomerization selectivity for the co-HP of durene (15 wt. %) and MD (85 wt. %) at constant = 0.40 h, and (c) C aromatic conversion for the co-HP of HG (15 wt. %) and MD (85 wt. %); / = 1042 Nm m, = 59 bar, and = 3.9 bar.
Figure 3.
(a) Durene conversion and (b) durene isomerization selectivity for the co-HP of durene (15 wt. %) and MD (85 wt. %) at constant = 0.40 h, and (c) C aromatic conversion for the co-HP of HG (15 wt. %) and MD (85 wt. %); / = 1042 Nm m, = 59 bar, and = 3.9 bar.

Figure 4.
(a) Yield of diesel (triangles), kerosene (squares), and LG (circles), (b) CN of diesel, (c) RON of LG, and (d) MON of LG for the co-HP of HG (15 wt.%) and MD (85 wt.%) at = 0.40 h, / = 1042 Nm m, = 59 bar and = 3.9 bar.
Figure 4.
(a) Yield of diesel (triangles), kerosene (squares), and LG (circles), (b) CN of diesel, (c) RON of LG, and (d) MON of LG for the co-HP of HG (15 wt.%) and MD (85 wt.%) at = 0.40 h, / = 1042 Nm m, = 59 bar and = 3.9 bar.

Figure 5.
Concentration of aromatics and naphthenes in LG in dependence on space-time at T = 370 °C, / = 1042 Nm m, = 59 bar and = 3.9 bar.
Figure 5.
Concentration of aromatics and naphthenes in LG in dependence on space-time at T = 370 °C, / = 1042 Nm m, = 59 bar and = 3.9 bar.

Figure 6.
Structures of the (a) sequential model, (b) combined model, and (c) reduced model.

Figure 7.
Parity plots of the (a) sequential model and (b) combined model for the experimental validation dataset at T = 370 °C, / = 1042 Nm m, = 59 bar and = 3.9 bar.
Figure 7.
Parity plots of the (a) sequential model and (b) combined model for the experimental validation dataset at T = 370 °C, / = 1042 Nm m, = 59 bar and = 3.9 bar.

Figure 8.
(a) Parity plot and (b) curve fitting results of the reduced model for the experimental validation dataset at T = 370 °C, / = 1042 Nm m, = 59 bar and = 3.9 bar.
Figure 8.
(a) Parity plot and (b) curve fitting results of the reduced model for the experimental validation dataset at T = 370 °C, / = 1042 Nm m, = 59 bar and = 3.9 bar.


Table 1.
Hydrocarbon fractions used for the experiments in this study.
| Middle Distillate (MD) | bioliq® Heavy Gasoline (HG) | Feedstock | |
|---|---|---|---|
| [-] | 60.3 | N/A | N/A |
| [kg m] | 823.0 | 890.0 | 827.6 |
| [mg kg] | <5 | 0 | 0 |
| [°C] | −14 | N/A | N/A |
| [wt.%] | 5.7 | 97.0 | approx. 19.4 |
| IBP [°C] | 179.7 | 176.7 | 175.0 |
| T25 [°C] | 247.7 | 185.7 | 230.6 |
| T50 [°C] | 263.2 | 190.0 | 257.5 |
| T75 [°C] | 277.6 | 198.2 | 275.1 |
| FBP [°C] | 365.2 | 289.8 | 365.2 |
Table 2.
Boiling ranges, compositions, and inital mass fractions of the lumps used for modeling (Naph. Naphtenes, Par. Paraffins, Aro. Aromatics).
Table 2.
Boiling ranges, compositions, and inital mass fractions of the lumps used for modeling (Naph. Naphtenes, Par. Paraffins, Aro. Aromatics).
| Lump | Boiling Range [°C] | Approx. Composition | L @ = 0 [wt.%] |
|---|---|---|---|
| 1 | 300–365 | Mainly Par. | 11.25 |
| 2 | 270–300 | Aro., Par. | 21.51 |
| 3 | 210–270 | Aro., Par. | 61.64 |
| 4 | 170–210 | Aro., Par. and Naph. | 5.61 |
| 5 | 30–170 | Aro., Par. and Naph. | 0 |
| 6 | 0–30 | Par. | 0 |
Table 3.
Reaction constants and activation energies of the different models.
| [cm h cm] | [kJ mol] | ||||||
|---|---|---|---|---|---|---|---|
| Sequential | Combined | Reduced | Sequential | Combined | Reduced | ||
| 0.206 | 0.119 | 0.123 | 116.3 | 0 | 0 | ||
| 0.156 | 0.135 | 0.142 | 142.4 | 79.9 | 89.8 | ||
| 0.186 | 0.181 | 0.185 | 54.1 | 19.1 | 22.9 | ||
| 0.264 | 0.160 | 0.161 | 97.0 | 109.9 | 122.4 | ||
| 0.360 | 6.09 × 10 | - | 0 | 24.9 | - | ||
| - | 3.20 × 10 | - | - | 0 | - | ||
| - | 9.25 × 10 | - | - | 1845.5 | - | ||
| - | 9.65 × 10 | - | - | 15.8 | - | ||
| - | 0.126 | 0.126 | - | 12.1 | 11.0 | ||
| - | 0.036 | 0.025 | - | 382.6 | 435.4 | ||
Table 4.
Statistical comparison of the reduced model with the sequential and combined model according to Fisher’s exact test for the experimental validation dataset at T = 370 °C.
Table 4.
Statistical comparison of the reduced model with the sequential and combined model according to Fisher’s exact test for the experimental validation dataset at T = 370 °C.
| Parameters | Sequential Model | Reduced Model | Combined Model |
|---|---|---|---|
| 10 | 12 | 20 | |
| 6 | 6 | 6 | |
| 16 | 16 | 16 | |
| 86 | 84 | 76 | |
| [-] | 0.9971 | 0.9976 | 0.9978 |
| [kg kg] | 27.16 | 22.24 | 20.51 |
| F | - | 9.29 () | 0.8 () |
| - | 3.11 | 2.06 |
Disclaimer/Publisher’s Note: The statements, opinions and data contained in all publications are solely those of the individual author(s) and contributor(s) and not of MDPI and/or the editor(s). MDPI and/or the editor(s) disclaim responsibility for any injury to people or property resulting from any ideas, methods, instructions or products referred to in the content. |
© 2023 by the authors. Licensee MDPI, Basel, Switzerland. This article is an open access article distributed under the terms and conditions of the Creative Commons Attribution (CC BY) license (https://creativecommons.org/licenses/by/4.0/).
Share and Cite
MDPI and ACS Style
Graf, D.; Waßmuth, J.; Rauch, R. Co-Hydroprocessing of Fossil Middle Distillate and Bio-Derived Durene-Rich Heavy Ends under Hydrotreating Conditions. Reactions 2023, 4, 531-551. https://doi.org/10.3390/reactions4030032
AMA Style
Graf D, Waßmuth J, Rauch R. Co-Hydroprocessing of Fossil Middle Distillate and Bio-Derived Durene-Rich Heavy Ends under Hydrotreating Conditions. Reactions. 2023; 4(3):531-551. https://doi.org/10.3390/reactions4030032
Chicago/Turabian StyleGraf, David, Johannes Waßmuth, and Reinhard Rauch. 2023. "Co-Hydroprocessing of Fossil Middle Distillate and Bio-Derived Durene-Rich Heavy Ends under Hydrotreating Conditions" Reactions 4, no. 3: 531-551. https://doi.org/10.3390/reactions4030032