Development of a New Performance Metric for Golf Clubs Using COR Maps and Impact Probability Data †

Cleveland Golf, 5601 Skylab Rd., Huntington Beach, CA 92647, USA
*
Author to whom correspondence should be addressed.
†
Presented at the 12th Conference of the International Sports Engineering Association, Brisbane, Queensland, Australia, 26–29 March 2018.
Proceedings 2018, 2(6), 240; https://doi.org/10.3390/proceedings2060240
Published: 24 February 2018
(This article belongs to the Proceedings of The 12th Conference of the International Sports Engineering Association)
Abstract
:Golf clubs are often evaluated by many methods to determine their performance. For drivers in particular, the primary performance indicator is ball speed, which is directly related to distance. Golf club manufacturers make many claims about how extra ball speed is achieved. For example, these may include: design features, face thickness, materials, center of gravity location, and moments of inertia. This paper proposes a new method to evaluate the performance of golf clubs from a single metric. With the benefits of modern launch monitors, accurate impact location data can be captured very efficiently. Using this, along with COR (coefficient of restitution) map testing, the Expected Value of COR can be calculated for a golfer or population of golfers. The “Expected COR” metric takes into account many engineering properties of a particular club that affect ball speed, along with the impact variation of the golfer, to give a single score for rating.
1. Introduction
Golf manufacturers have achieved significant gains in club and ball performance over the past few decades. The primary indicator for this is distance. On the PGA Tour, average driving distance has increased approximately 30 yards from 1980 to 2016 [1]. Similarly, amateur golfers have seen an average distance gain of 10 yards from 1996 to 2016. In recent years, however, distance gains have stalled. From 2006 to 2016, the average drive has increased 2 yards on the PGA tour and has not changed at all for the amateur golfer.
From a club perspective, distance is increased by improving the launch conditions of the golf ball. That is, the golf ball leaves the clubface with higher velocity or a more optimal combination of launch angle and spin rate. The velocity of the ball is its primary energy component and most influential factor for distance, thus it is the targeted parameter for this paper.
Certain past innovations in club design are responsible for the largest distance and ball speed gains. Drivers have evolved from small, wooden heads to hollow, oversized metalheads with titanium faces. Irons have become larger with perimeter-weighted cavities and thin faces. Compared to many years ago, these clubs are significantly more efficient at transferring energy to the golf ball, regardless of impact quality.
Golf manufacturers continue to pursue new club designs that attempt (and claim) to give a golfer more distance. Given the relatively small improvements recently, this is clearly a difficult task. The manufacturer must work within various constraints of cost and durability. They are also limited by the rules of the USGA, else the product could be deemed non-conforming. As these performance gains have clearly slowed down, there becomes a need to objectively evaluate smaller differences in performance. Given the variation from golfer to golfer and swing to swing, it can be difficult to do enough testing to confidently determine and compare the quality of products.
A club performance rating, that includes a golfer’s swing to swing variation, has been proposed to evaluate and compare designs [2] (pp. 31–33). This solution relies on models to simulate impact and determine results. As golf manufacturers implement more complicated design features to improve performance, physics based math models cannot capture the influence of these features accurately. Ultimately, to evaluate the effects of current golf technologies, advanced FEA simulations or physical testing is required.
1.1. COR Mapping
One of the most common performance tests for a clubhead is COR (Coefficient of Restitution). COR is defined as the ratio of relative velocities of two objects after and before a collision. That is,
where is the COR, is the velocity object after collision, is the velocity object after collision, is the velocity object before collision, and is the velocity object before collision.
The COR of a clubhead is usually measured with an air cannon to fire golf balls normal to the face of a stationary head [3]. The test could be performed with a shaft as well; however, it would have little effect on results due to the short duration of impact [4] (pp. 8–9). Following the test procedure defined by the USGA, only temperature-controlled golf balls of certain hardness are used for testing. Additionally, the initial ball velocity from the air cannon is set to approximately 160 fps. The actual velocity of the golf ball is captured with light traps before and after impact. The velocity of the clubhead after impact, , is not captured, but using conservation of momentum, it can be calculated:
where is the mass of the golf ball, is the mass of the clubhead, is the initial velocity of the golf ball, is the final velocity of the golf ball, and is the initial velocity of the clubhead. Therefore, the COR of the collision can be calculated:
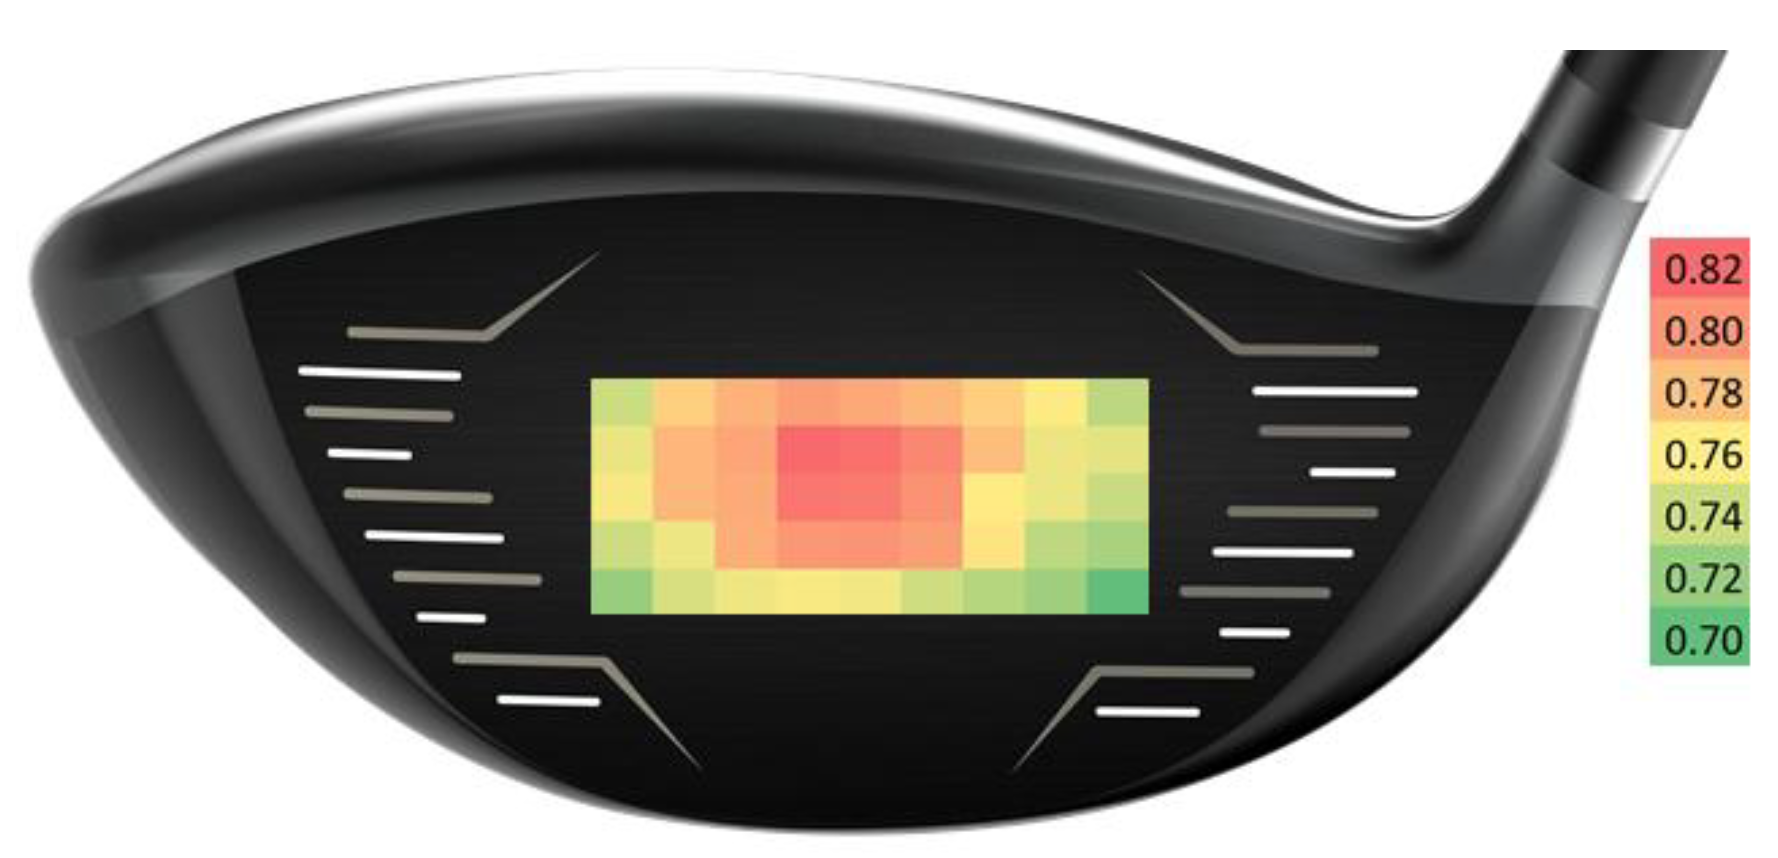
COR mapping refers to the process of repeated COR tests across a wide area of the face of a golf club. It is an effective tool to evaluate the performance of a head because the results are a function of the entire clubhead design. Critical engineering parameters such as mass, center of gravity, moments of inertia, face flexibility, and structural rigidity are all influential for this test. An example of a driver’s COR map is shown in Figure 1.
For this example, COR is tested at 45 locations within a grid of 8 cm2 aligned with the center of the clubface. If desired, the tested region can be a different size and the data can be filtered or averaged. To sample COR points within the grid, interpolation may be used.
A similar process is sometimes used with the USGA pendulum test. This test measures a parameter known as characteristic time (CT), which is correlated with COR [5]. Although more efficient, the additional uncertainty in the true COR may be undesired and is not used for our examples.
1.2. Impact Measurements
Impact location measurements are effective for determining the quality and consistency of a golf swing. For example, if a golfer tends to hit the ball towards a particular off-center region of the face, they can make swing and setup adjustments to help improve. Golfers with high variation in impact location tend to have higher handicaps and will benefit more from forgiving “game-improvement” clubheads.
Until recently, the most common method for determining impact location was with impact tape, where an imprint is left after a swing. This method is cumbersome, as the tape needs to be re-applied after each swing, and the location must be manually recorded. Launch monitors, using high speed cameras, can now capture impact location accurately. The data used in this paper is acquired with the Foresight GC2 + HMT, which uses high-speed stereoscopic cameras to capture the clubhead at impact to determine impact location relative to the center of the face.
2. Method
In general, the probability matrix for any group of players can be described by:
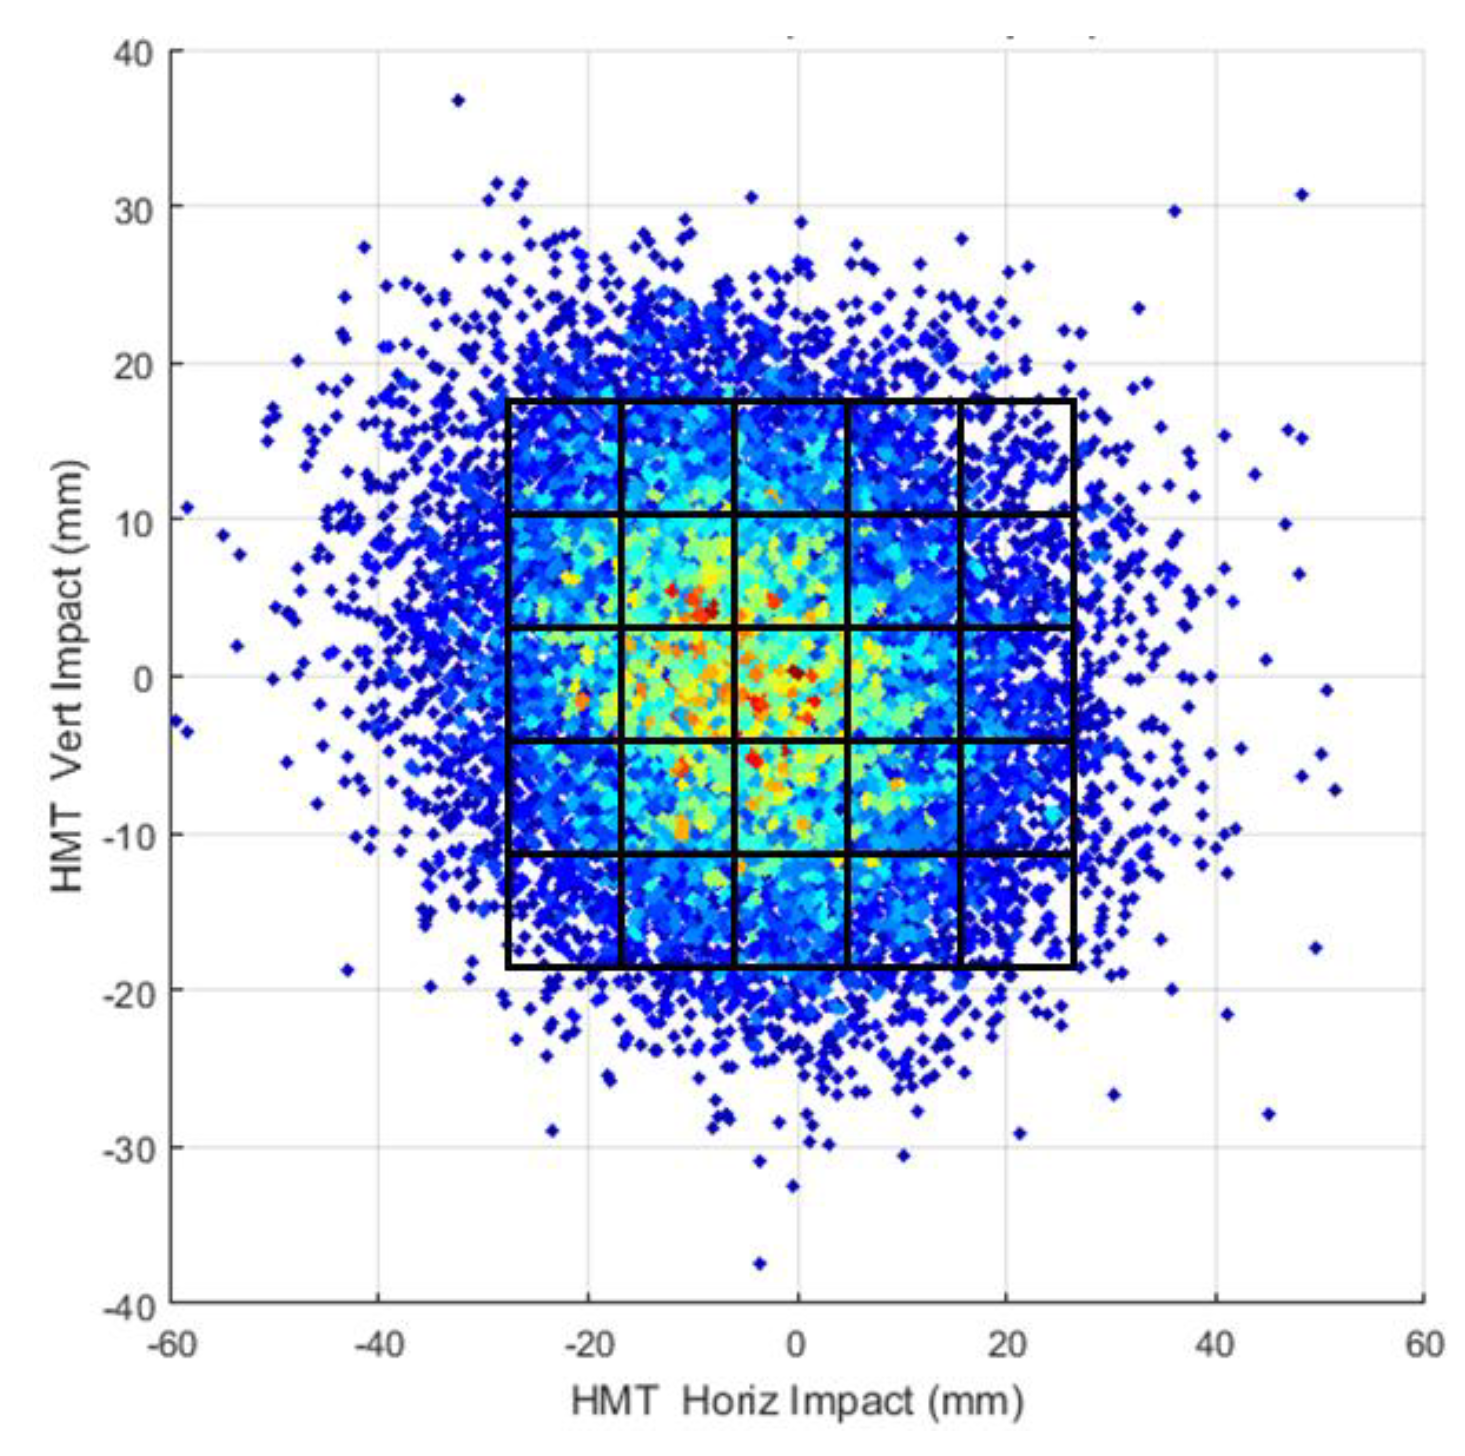
where the probability of impact at location . A probability matrix for a group of players can be calculated directly from test data. An example scatter plot of impact data, along with bins used to determine the probability matrix, is shown in Figure 2.
The impact probability, , can be calculated from summing the total number of shots that fall within the bin and dividing by the total shots in the sample. A sufficiently large amount of shots are required in each bin to have confidence in the probability matrix.
In general, the COR map for a particular driver head can be described by:
where the COR at location . Therefore, the expected value of COR for a player, or group of players, with impact location probability mass function, , hitting driver with COR map function, , can be calculated as:
The probability matrix, used in this context, is the weight function for the expected value. If the COR map and probability distribution (joint density) were continuous functions, this expected value could be calculated by:
where x and y are the horizontal and vertical impact locations, respectively. This method may be beneficial for compact characterization. In such cases, the weight function may be fit with a bivariate normal distribution, and the COR map fit with a quadric surface (e.g., paraboloid).
3. Results
The Expected COR (expected value of COR) was determined for 4 different drivers recently in the market. COR Maps for each of these drivers were created using the method outlined by the USGA, with a total of 41 measurement locations. Two shots are fired at each location, and results are averaged. The grid used for these measurements extend from the center of the face to 20 mm heel and toe, and 10 mm high and low. Grid locations were spaced by 5 mm. This is shown in Table 1.
Two weight functions were determined from extensive player testing using Foresight GC2 + HMT. Data was truncated to only include shots hit within the outer bounds of the COR maps. Ideally, we would have included all the data, but COR testing can become more difficult on shots extremely far from center. These weight functions are shown in Table 2.
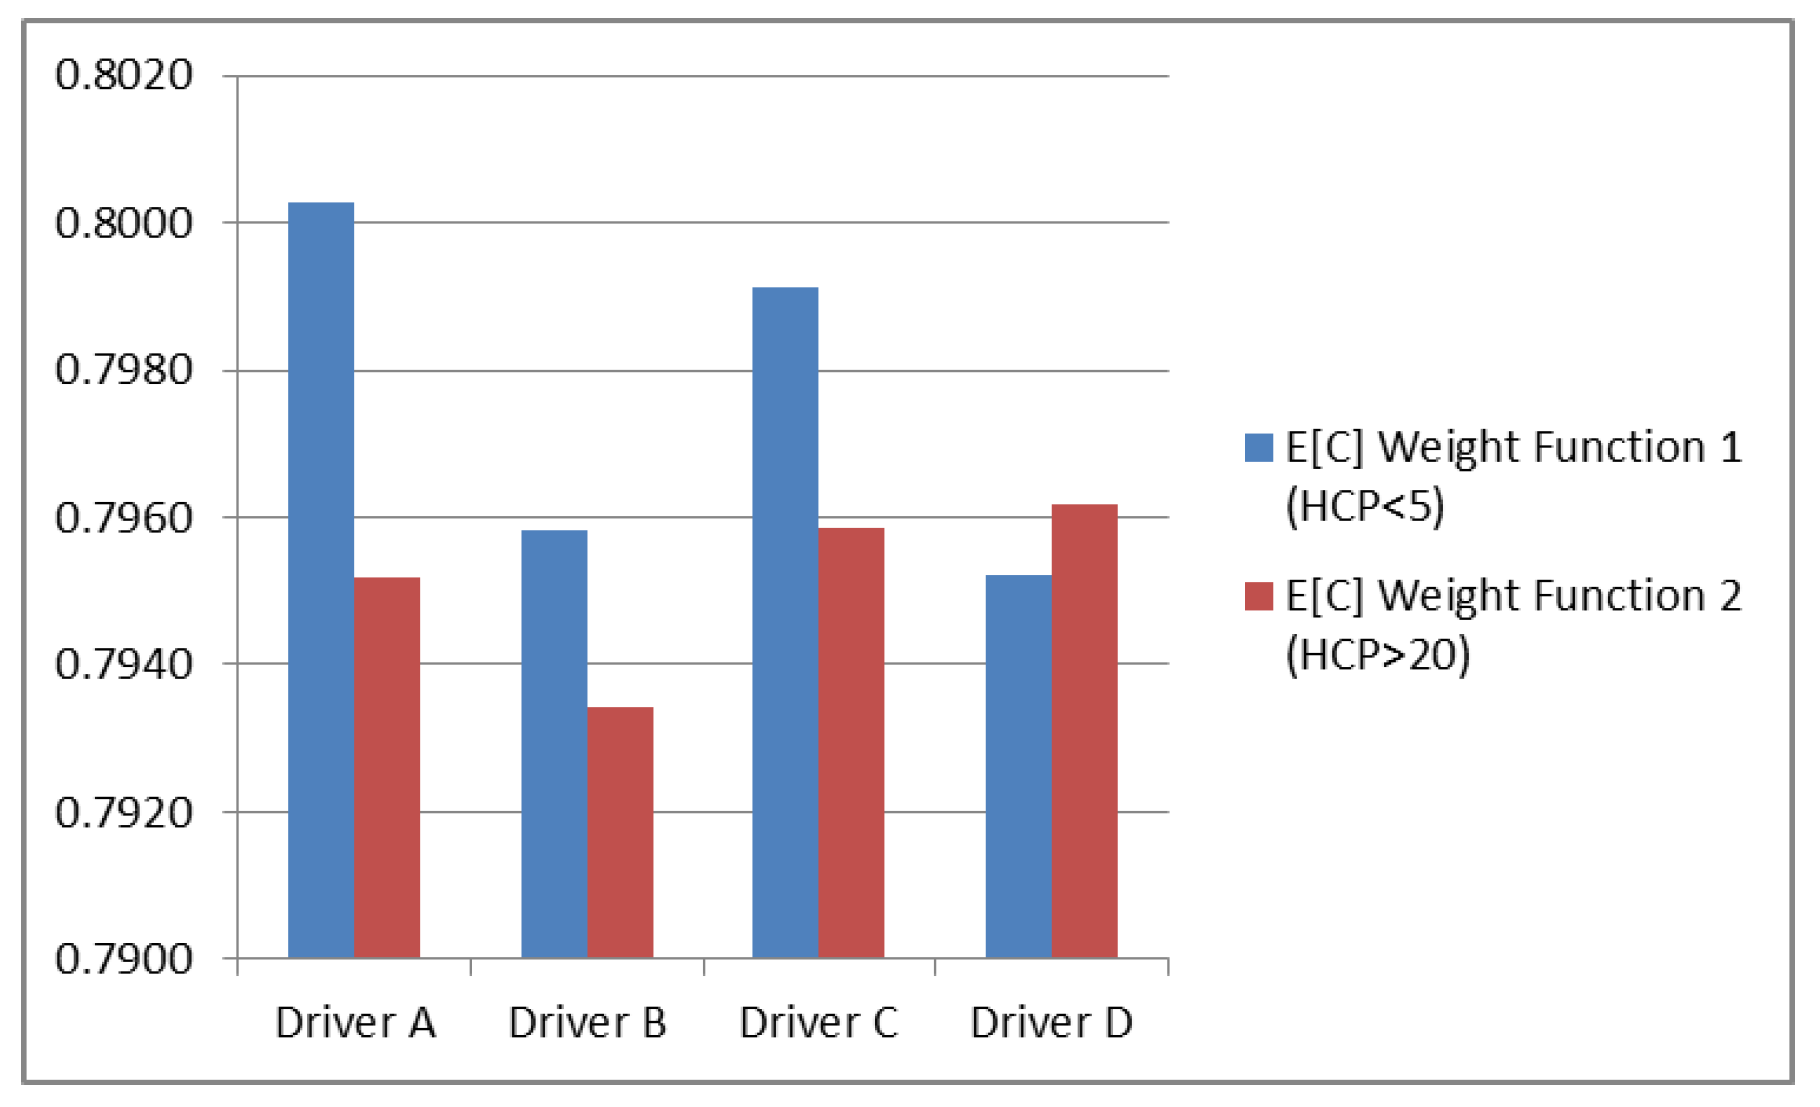
The two weight functions represented test data from high handicap players (HCP > 20, 2300 shots) and low handicap players (HCP < 5, 1200 shots). Shots were taken from a historical database that includes a large variety of driver types and players. Using the method outlined previously, the Expected COR was determined for each driver and weight function (player group). This is shown in Figure 3.
Driver A had the highest Expected COR for low handicap players, while Driver D had the highest Expected COR for high handicap players. As one would expect, the Expected COR was generally higher for the low handicap players. They tend to impact the ball with less variation and closer to the center of the face (where COR is usually highest). Surprisingly, Driver D actually had a slightly higher Expected COR for the high handicap group. Driver D had the highest COR towards the top of the face, where lower handicaps tend to hit more shots. It should be noted shots outside the bounds of the COR map region were ignored, so extending COR measurements out there could very well change these results.
4. Discussion
The Expected COR metric can be used in a variety of ways. As outlined previously, it can be an effective tool to evaluate the preferred driver for a particular group of golfers. In addition to handicap, potential filters for the weight function include: age, head speed, gender, nationality, and shot shape.
Expected COR can also be used as an effective fitting approach for an individual golfer. With access to a launch monitor that can capture impact location data, a golfer can realistically capture many shots to estimate their own unique weight function. In limited environments, automatic fitting algorithms could make this process more efficient. A bivariate normal or t-distribution could be used to fill out the weight function from significantly fewer shots necessary to fill a probability matrix. Ideally, this would be used alongside traditional fitting methods where one may determine proper loft, lie, face angle, length, weight, and shaft.
This metric may also be used as a guideline for design. A manufacturer would focus attention on a certain impact region to maximize the Expected COR for their target consumer. They may also increase priority to more general head properties that influence this metric. For example, maximizing moments of inertia within the limitations of the USGA will help increase Expected COR for all weight functions. Or the designer could only maximize the moment of inertia around the axis that has the most influence on the Expected COR for their target consumer. In general, the targeted player/group will have a more efficient energy transfer at impact (i.e., more ball speed) using a driver with a higher Expected COR (for a given clubhead mass), thus they will have the potential to hit the ball farther.
Assumptions
Although this performance metric is intuitive, there are a few assumptions that must be kept in mind when using this to evaluate a clubhead.
The process of creating a COR map used the test procedure outlined by the USGA. In reality, the COR is not necessarily the same when certain parameters change. For example, golfers may use different types of balls with different compression properties compared to what is used during testing. The test is also only performed at one speed. The COR of the clubhead may change slightly as the ball/club speed changes. The test also enforces normality of impact, which is clearly not the case with a golf swing. It is, however, likely that losses in COR across clubheads are similar with oblique impacts due to the club’s dynamic loft and path.
Although an industry standard for performance, COR does not directly predict ball speed from delivery conditions. Ball speed is also a function of the mass of the clubhead, as seen in (5). One could consider the direct ratio between clubhead speed and ball speed instead (often referred to as Smash Factor). This, however, would ignore the strong relationship between clubhead mass and clubhead speed due to the change in resistance felt by the golfer. Nonetheless, the negating effect of these relationships (clubhead mass, clubhead speed, and ball speed) helps make COR a useful performance metric.
The impact probability data used for the examples in this paper are limited to a portion of the clubface. In reality, amateur golfers impact all over the entire face. It is assumed that working within this region provides useful results, but for golfers that hit a large portion of balls outside the region, the COR maps should be adapted to represent this.
Finally, this performance metric does not consider the accuracy or consistency of shots hit with the test club. When it comes to irons, for example, this becomes a more important thing to consider. Also, certain design considerations, like bulge and roll, along with cg location, are ignored in this metric. A higher ball speed, represented by higher Expected COR, could be less important in some instances than launch angles and spin rates for maximizing distance.
5. Conclusions
Performance increases of golf clubs have slowed in recent years. Many new innovations represent small changes in performance that become difficult to evaluate for diverse populations of golfers and swings. A metric is defined that represents the expected value of COR for a golfer or subset of golfers. A COR map is created for a clubhead using the method outlined by the USGA. The resulting table of COR data is averaged or integrated using a weight function. The weight function represents the impact probability map of the targeted golfer(s) and is acquired from high-speed camera impact location measurements.
This metric, referred to as Expected COR, is a single parameter that can easily be used to assess performance. It is ultimately dependent on the inertial and material properties of the clubhead, along with the golfer’s impact pattern. The result is a number that is intuitive and easy to compare across clubs. Expected COR can be used for fitting purposes or as a directive for engineering design.
Every golf club on the market claims high ball speed from a variety of features and technologies. Comparing one club to another is very difficult even for knowledgeable industry-insiders, let al.one the average consumer. Expected COR is an inclusive metric that captures performance in a single value, enabling very easy comparison between any clubs in the market.
Conflicts of Interest
The authors declare no conflict of interest.
References
- United States Golf Association. A Review of Driving Distance; United States Golf Association: Far Hills, NJ, USA, 2017. [Google Scholar]
- Werner, F.D.; Greig, R.C. How Golf Clubs Really Work and How To Optimize Their Designs; Origin Inc.: Jackson, WY, USA, 2000; ISBN 0-9677625-0-2. [Google Scholar]
- United States Golf Association. Procedure for Measuring the Velocity Ratio of a Club Head for Conformance to Rule 4-1e, Appendix II (Revision 2); United States Golf Association: Far Hills, NJ, USA, 1999. [Google Scholar]
- Daish, C.B. The Physics of Ball Games; The English Universities Press Ltd.: London, UK, 1972; ISBN 0-340-05399-2. [Google Scholar]
- United States Golf Association. Technical Description of the Pendulum Test; United States Golf Association: Far Hills, NJ, USA, 2003. [Google Scholar]
Figure 1.
COR map overlaid across a driver face.

Figure 2.
Example scatter plot of impact data.

Figure 3.
Expected COR, drivers A-D, weight functions 1–2.


Table 1.
COR Maps for drivers A, B, C, and D.
| Driver A | Y [mm] | Driver B | Y [mm] | ||||||||||||||||||
| 0.770 | 0.778 | 0.798 | 0.802 | 0.801 | 0.777 | 0.762 | 10 | 0.778 | 0.796 | 0.810 | 0.809 | 0.805 | 0.778 | 0.774 | 10 | ||||||
| 0.775 | 0.791 | 0.809 | 0.819 | 0.826 | 0.818 | 0.797 | 0.782 | 0.762 | 5 | 0.782 | 0.791 | 0.817 | 0.820 | 0.815 | 0.813 | 0.797 | 0.781 | 0.746 | 5 | ||
| 0.769 | 0.801 | 0.816 | 0.828 | 0.828 | 0.819 | 0.810 | 0.782 | 0.761 | 0 | 0.778 | 0.796 | 0.814 | 0.820 | 0.822 | 0.814 | 0.793 | 0.785 | 0.774 | 0 | ||
| 0.778 | 0.794 | 0.812 | 0.813 | 0.819 | 0.810 | 0.795 | 0.770 | 0.752 | −5 | 0.736 | 0.779 | 0.794 | 0.807 | 0.813 | 0.797 | 0.787 | 0.783 | 0.752 | −5 | ||
| 0.773 | 0.779 | 0.794 | 0.780 | 0.759 | 0.763 | 0.745 | −10 | X [mm] | 0.721 | 0.768 | 0.767 | 0.786 | 0.779 | 0.767 | 0.748 | −10 | |||||
| X [mm] | −20 | −15 | −10 | −5 | 0 | 5 | 10 | 15 | 20 | −20 | −15 | −10 | −5 | 0 | 5 | 10 | 15 | 20 | |||
| Driver C | Y [mm] | Driver D | Y [mm] | ||||||||||||||||||
| 0.776 | 0.791 | 0.799 | 0.797 | 0.802 | 0.791 | 0.774 | 10 | 0.811 | 0.827 | 0.827 | 0.826 | 0.821 | 0.802 | 0.787 | 10 | ||||||
| 0.772 | 0.794 | 0.807 | 0.816 | 0.815 | 0.813 | 0.802 | 0.790 | 0.765 | 5 | 0.803 | 0.814 | 0.820 | 0.829 | 0.822 | 0.825 | 0.812 | 0.803 | 0.766 | 5 | ||
| 0.781 | 0.796 | 0.811 | 0.822 | 0.821 | 0.817 | 0.805 | 0.781 | 0.773 | 0 | 0.776 | 0.808 | 0.812 | 0.812 | 0.809 | 0.814 | 0.803 | 0.779 | 0.767 | 0 | ||
| 0.765 | 0.794 | 0.801 | 0.812 | 0.812 | 0.814 | 0.794 | 0.781 | 0.750 | −5 | 0.764 | 0.784 | 0.792 | 0.790 | 0.799 | 0.804 | 0.765 | 0.762 | 0.735 | −5 | ||
| 0.750 | 0.777 | 0.787 | 0.788 | 0.774 | 0.782 | 0.749 | −10 | X [mm] | 0.738 | 0.763 | 0.777 | 0.760 | 0.764 | 0.724 | 0.743 | −10 | |||||
| X [mm] | −20 | −15 | −10 | −5 | 0 | 5 | 10 | 15 | 20 | −20 | −15 | −10 | −5 | 0 | 5 | 10 | 15 | 20 | |||
Table 2.
Weight functions for high and low handicap test groups.
| Weight Function 1 (Low HCP) | Y [mm] | Weight Function 2 (High HCP) | Y [mm] | ||||||||||||||||||
| 0.018 | 0.017 | 0.018 | 0.013 | 0.005 | 0.003 | 0.002 | 10 | 0.021 | 0.028 | 0.034 | 0.027 | 0.027 | 0.019 | 0.023 | 10 | ||||||
| 0.019 | 0.018 | 0.041 | 0.042 | 0.029 | 0.017 | 0.005 | 0.005 | 0.000 | 5 | 0.013 | 0.030 | 0.035 | 0.029 | 0.029 | 0.035 | 0.019 | 0.021 | 0.025 | 5 | ||
| 0.028 | 0.043 | 0.040 | 0.076 | 0.043 | 0.028 | 0.017 | 0.008 | 0.002 | 0 | 0.023 | 0.025 | 0.025 | 0.043 | 0.036 | 0.031 | 0.030 | 0.023 | 0.018 | 0 | ||
| 0.017 | 0.037 | 0.044 | 0.058 | 0.045 | 0.044 | 0.023 | 0.013 | 0.003 | −5 | 0.015 | 0.014 | 0.028 | 0.038 | 0.025 | 0.023 | 0.024 | 0.021 | 0.013 | −5 | ||
| X [mm] | 0.020 | 0.021 | 0.034 | 0.037 | 0.030 | 0.025 | 0.013 | −10 | X [mm] | 0.014 | 0.026 | 0.008 | 0.029 | 0.022 | 0.025 | 0.007 | −10 | ||||
| −20 | −15 | −10 | −5 | 0 | 5 | 10 | 15 | 20 | −20 | −15 | −10 | −5 | 0 | 5 | 10 | 15 | 20 | ||||
Publisher’s Note: MDPI stays neutral with regard to jurisdictional claims in published maps and institutional affiliations. |
© 2018 by the authors. Licensee MDPI, Basel, Switzerland. This article is an open access article distributed under the terms and conditions of the Creative Commons Attribution (CC BY) license (https://creativecommons.org/licenses/by/4.0/).
Share and Cite
MDPI and ACS Style
Lambeth, J.; Brunski, J.; Brekke, D. Development of a New Performance Metric for Golf Clubs Using COR Maps and Impact Probability Data. Proceedings 2018, 2, 240. https://doi.org/10.3390/proceedings2060240
AMA Style
Lambeth J, Brunski J, Brekke D. Development of a New Performance Metric for Golf Clubs Using COR Maps and Impact Probability Data. Proceedings. 2018; 2(6):240. https://doi.org/10.3390/proceedings2060240
Chicago/Turabian StyleLambeth, Jacob, Jeff Brunski, and Dustin Brekke. 2018. "Development of a New Performance Metric for Golf Clubs Using COR Maps and Impact Probability Data" Proceedings 2, no. 6: 240. https://doi.org/10.3390/proceedings2060240