The Role of Storage Systems in Industrial and Residential Environments †
by
Camilla Neumann
1,*, 
Johanna Pucker-Singer
1,
Andreas Türk
1,
Jernej Zupančič
2 and
Andrej Gubina
2 1
Joanneum Research Forschungsgesellschaft mbH, 8020 Graz, Austria
2
University of Ljubljana, Department of Laboratory of Energy Policy, 1000 Ljubljana, Slovenia
*
Author to whom correspondence should be addressed.
†
Presented at the Sustainable Places 2020, Online, 28–30 October 2020.
Proceedings 2020, 65(1), 25; https://doi.org/10.3390/proceedings2020065025
Published: 8 January 2021
(This article belongs to the Proceedings of The 8th Annual International Sustainable Places Conference (SP2020) Proceedings)
Abstract
:This paper assesses storage applications from an environmental, economic and technical dimension. Three different demonstration set-ups are considered, as well as one large-scale simulation. The results emphasize that storage needs to be tailored to a specific purpose and tradeoffs between the three perspectives have to be considered to benefit the entire energy system. Currently, system integration and the possibility to use the grid as storage are hampering the potential of storage. It is however shown that storage can provide valuable technical and environmental benefits to the grid and possibly defer grid investment.
1. Introduction
The rapid emergence of distributed energy resources poses new challenges to the grid, which will require new system management strategies and innovative use of emerging technologies. Energy storage systems not only allow balance optimization between demand and supply but further provide grid services, such as peak shaving or congestion management, which improves the overall energy system efficiency and facilitates a higher renewable energy penetration in the system. This paper compares different storage applications from economic, environmental and technical viewpoints. The following analysis has been conducted as part of the STORY Horizon 2020 project, which aims at demonstrating the added value of storage in distribution systems for a flexible and secure energy system. Within the project, six demonstrations in four different countries have been analysed with a diversity of technology and actors. For the succeeding analysis, three quite diverse demo cases are presented and compared with a large scale simulation. The demo cases are evaluated and compared with regard to their economic, environmental and technical impacts on the energy grid. As grid limitations were not encountered at the chosen photovoltaic (PV) settings, additional aspects as grid enforcement were not considered, nor the need for a dynamisation of the energy system in case of a high share of variable renewables injected into the grid.
2. Large Scale Simulation
The aim of the large-scale simulation was to understand the impact of large-scale European-wide deployment of a combination of household- and grid-level battery energy storage systems (BESS) in the distribution grid. The synthetic grid model employed in the large-scale simulation represents a typical European medium and low voltage network with rural and urban grid sections. Different network development scenarios were simulated, varying in PV deployment share (peak power of PV units), installed capacity of electric vehicles (EV) and storage penetration level (capacity and type-grid/household units) (Table 1). In the case of storage implementation, electricity from the PV units is assumed to be either consumed locally (in the LV feeder), stored in the BESS or injected into the MV grid, thereby replacing another type of electricity generation. Based on these simulations, the environmental impact for eight scenarios by the means of a life-cycle analysis was assessed.
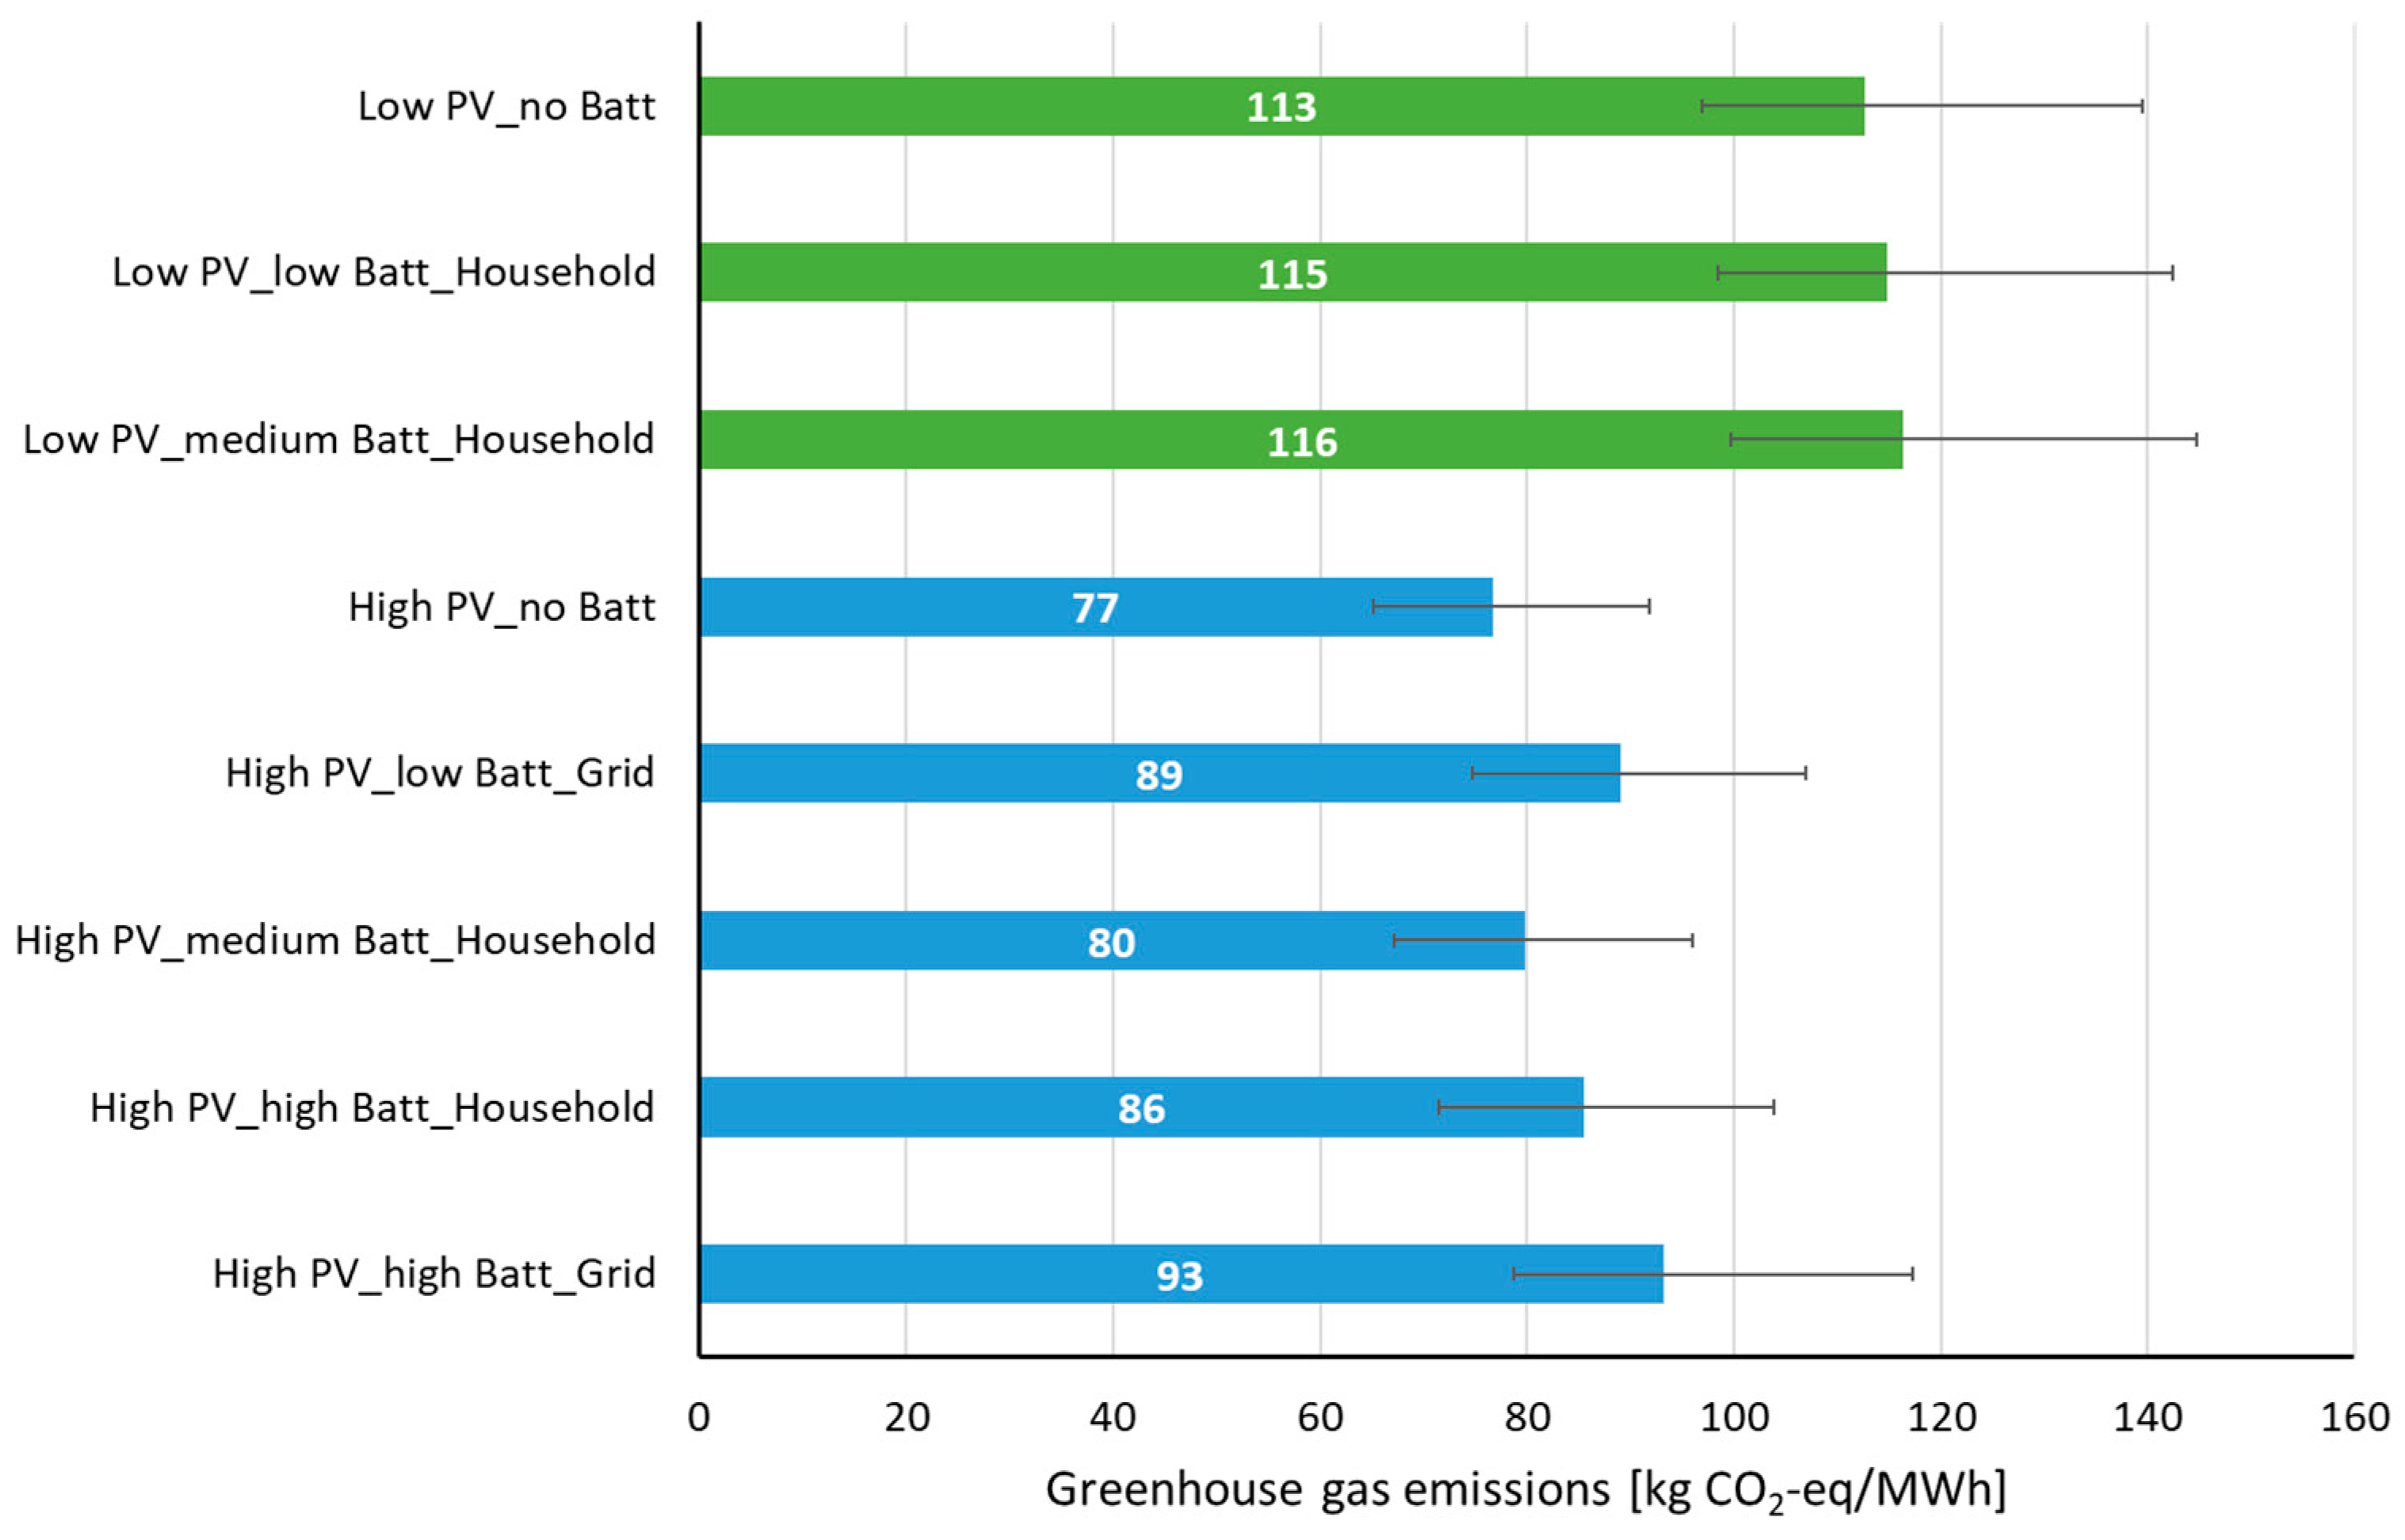
Figure 1 presents the results for all scenarios. The most crucial parameter regarding greenhouse gas (GHG) emissions is the amount of PV power installed. It should be noted that at the chosen PV deployment level no major grid problems in the scenarios occurred (even in the high PV scenarios), therefore PV energy does not have to be curtailed in any scenario. This approach also allows using the grid as storage, thereby entailing smaller losses than a BESS and reducing the benefits of storage implementation. The manufacturing of a BESS further contributes to the overall GHG emissions, although only to a small degree (2–11% of total GHG emissions). These factors lead to the result that scenarios with battery implementation have higher GHG emissions compared to scenarios without.
3. Demo Case I—Storage Deployed in a Factory in Spain
The first demo case is a factory in Spain, where a 200 kWh, 50 kW lithium-ion battery storage system has been installed in addition to a 113 kWp PV system in the internal LV power grid. The tariff structure in Spain includes a significant demand charge and therefore the initial aim of the BESS was to decrease peaks. Secondly, the aim was to reduce the overall grid electricity demand in high tariff hours. During the five-year project, the Spanish regulatory framework conditions have changed, and the operational strategy for BESS had to be adapted accordingly. Four different use cases were analysed: UC0 considers only the load of the factory. In UC1 the PV system partly covers the load of the factory, which represents the actual reference case of the demonstration. UC2 and UC3 consider BESS implementation. In UC2 BESS must not charge from the grid, while in UC3 this is permitted.
3.1. Environmental Analysis
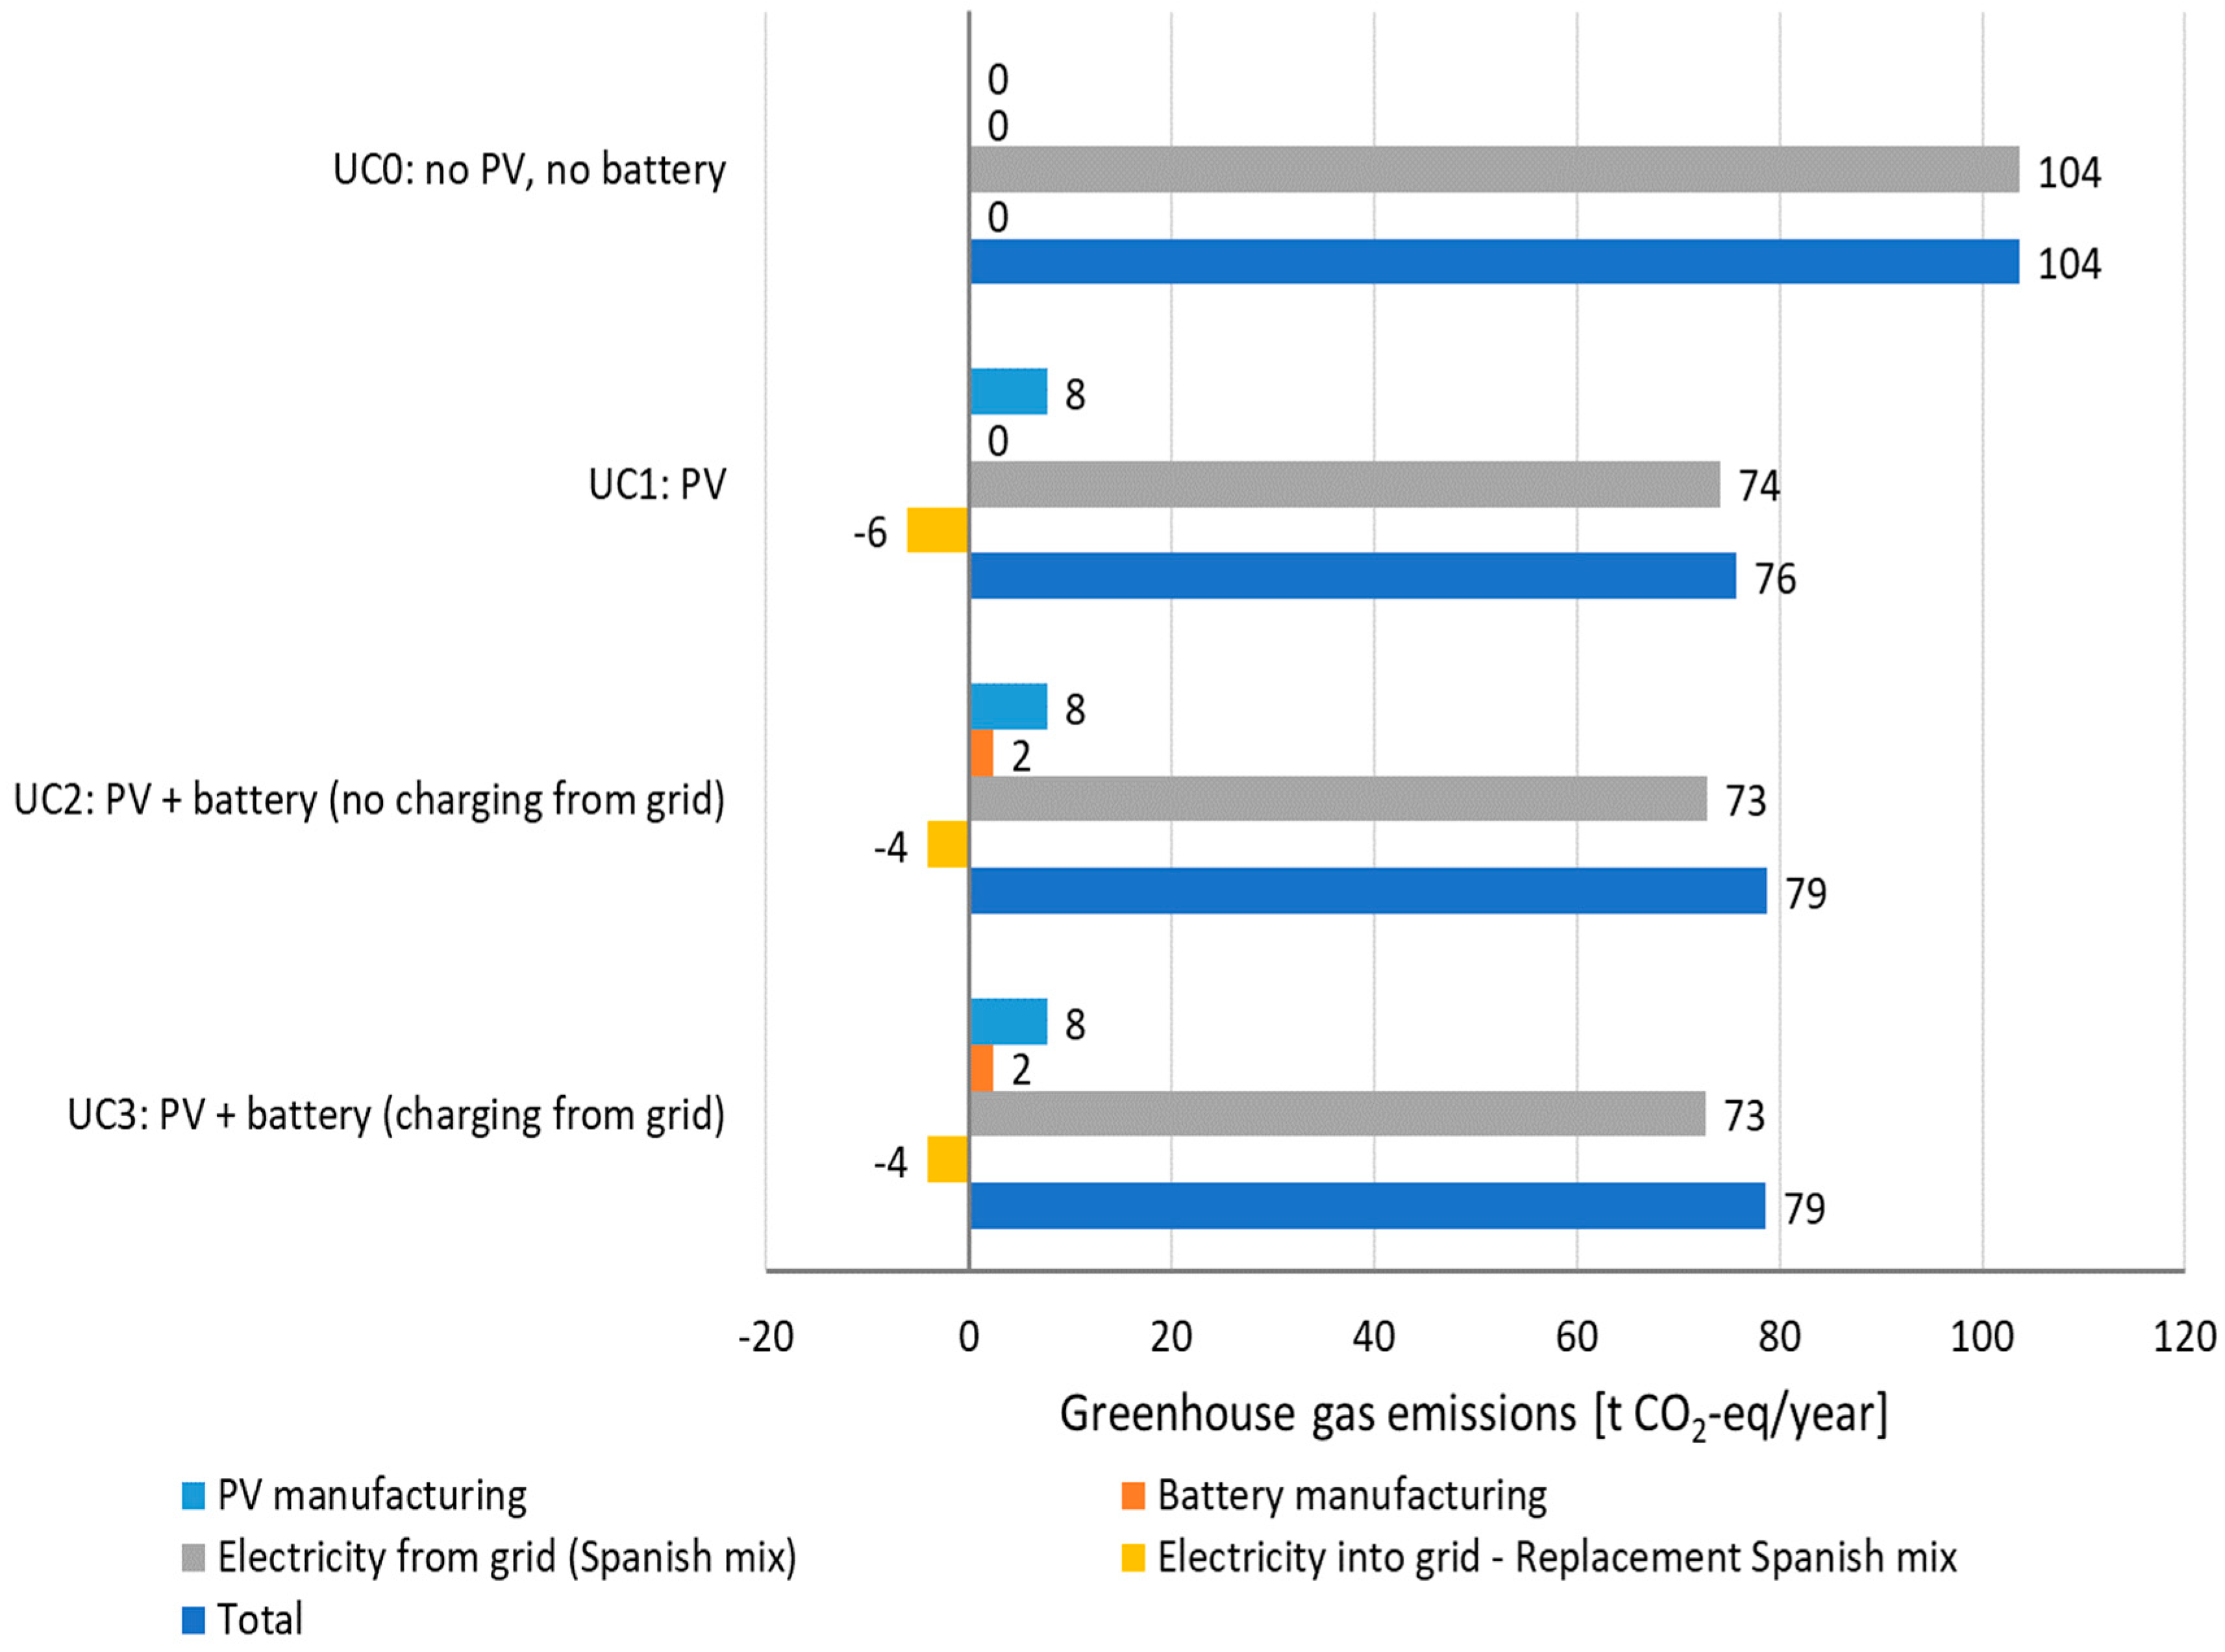
The results of the environmental analysis are presented in Figure 2. GHG emissions from PV and BESS manufacturing as well as GHG attributed to electricity consumed from the grid were considered. Further electricity injected into the grid was included, as it replaces electricity generated from other power plants and thus reduces emissions. The dark blue bar represents the overall emissions, which were the highest for UC0 and reduced in UC1 due to the implementation of PV to 76 t CO2 equivalent. The implementation of BESS allows more PV-produced electricity to be used locally, thus further slightly decreasing the GHG emissions attributed to electricity from the grid, but it also decreases the negative emissions from PV-produced electricity injected into the grid due to the additional power consumption of the BESS and adds GHG emissions from battery manufacturing. The charging strategy for UC2 and UC3 does not have a significant influence on the results. Overall, the implementation of the BESS only moderately changes the electricity flows, leading to similar emissions.
3.2. Economic Analysis
Table 2 presents the results of the economic analysis, which focuses on demand charge reduction in the peak period. It is shown that PV implementation does not decrease the demand charge in the winter months. This is due to the high tariff period, which starts at 17:00 and therefore does not coincide with the time of PV production. Storage enables shifting excess PV electricity to the high tariff period and therefore reduces the demand charge by 6%. In September and October the high tariff period is from 10:00–16:00 and thus PV electricity can reduce the demand charge significantly (−15%). The implementation of BESS reduces the savings from PV implementation, as it shifts excess electricity to the flat tariff period in the evening. The total savings over a year are mostly attributed to PV implementation; however, storage plays a valuable role especially in winter. Nevertheless, in this set-up, the implementation of storage does not provide a business case. It should be noted that the overall savings were additionally diminished due to low availability of the BESS unit.
4. Demo Case II—Community Battery in a Residential Village in Slovenia
The second demo case is a residential village in Slovenia, where a 320 kWh, 170 kW community BESS was installed and connected to a 400-kVA MV/LV transformer. In the current system topology only minor grid issues are observed. In the paper, two PV deployment scenarios were investigated: a low RES scenario describing the current set-up, with 210 kWp RES; and a high RES scenario with an extrapolated configuration of the network and 630 kWp RES where PV injection is causing power quality violations and PV production has to be either curtailed or the surplus energy needs to be stored in a battery. In each scenario, two use cases were analysed: UC1 (PV curtailment) and UC2 (BESS implementation). In UC1, the PV installations are regulated with a droop control algorithm, which gradually curtails PV power output when voltage levels are rising due to high PV injection. UC2 (BESS implementation) utilizes a community battery, which provides peak demand and peak generation control on the transformer level.
4.1. Environmental Analysis
In the low RES scenario (210 kWp) the implementation of storage (UC2) leads to slightly higher GHG emissions (123 tCO2-eq./year) compared to UC1 (114 tCO2-eq./year) (Figure 3). The reduced emissions attributed to the electricity from the grid are not enough to compensate for the lower savings from electricity injected into the grid and GHG emissions attributed to BESS manufacturing. In this scenario the grid can deal with the injected energy at almost all times and therefore PV curtailment is not necessary. This changes in the high RES scenario (630 kWp PV), where the BESS implementation reduces curtailment and therefore entails lower GHG emissions for electricity withdrawn from the grid but also higher negative emissions for electricity injected into the grid. In this scenario, UC2 (40 t CO2-eq./year) shows lower GHG in comparison to UC1 (64 t CO2-eq./year).
4.2. Economic Analysis
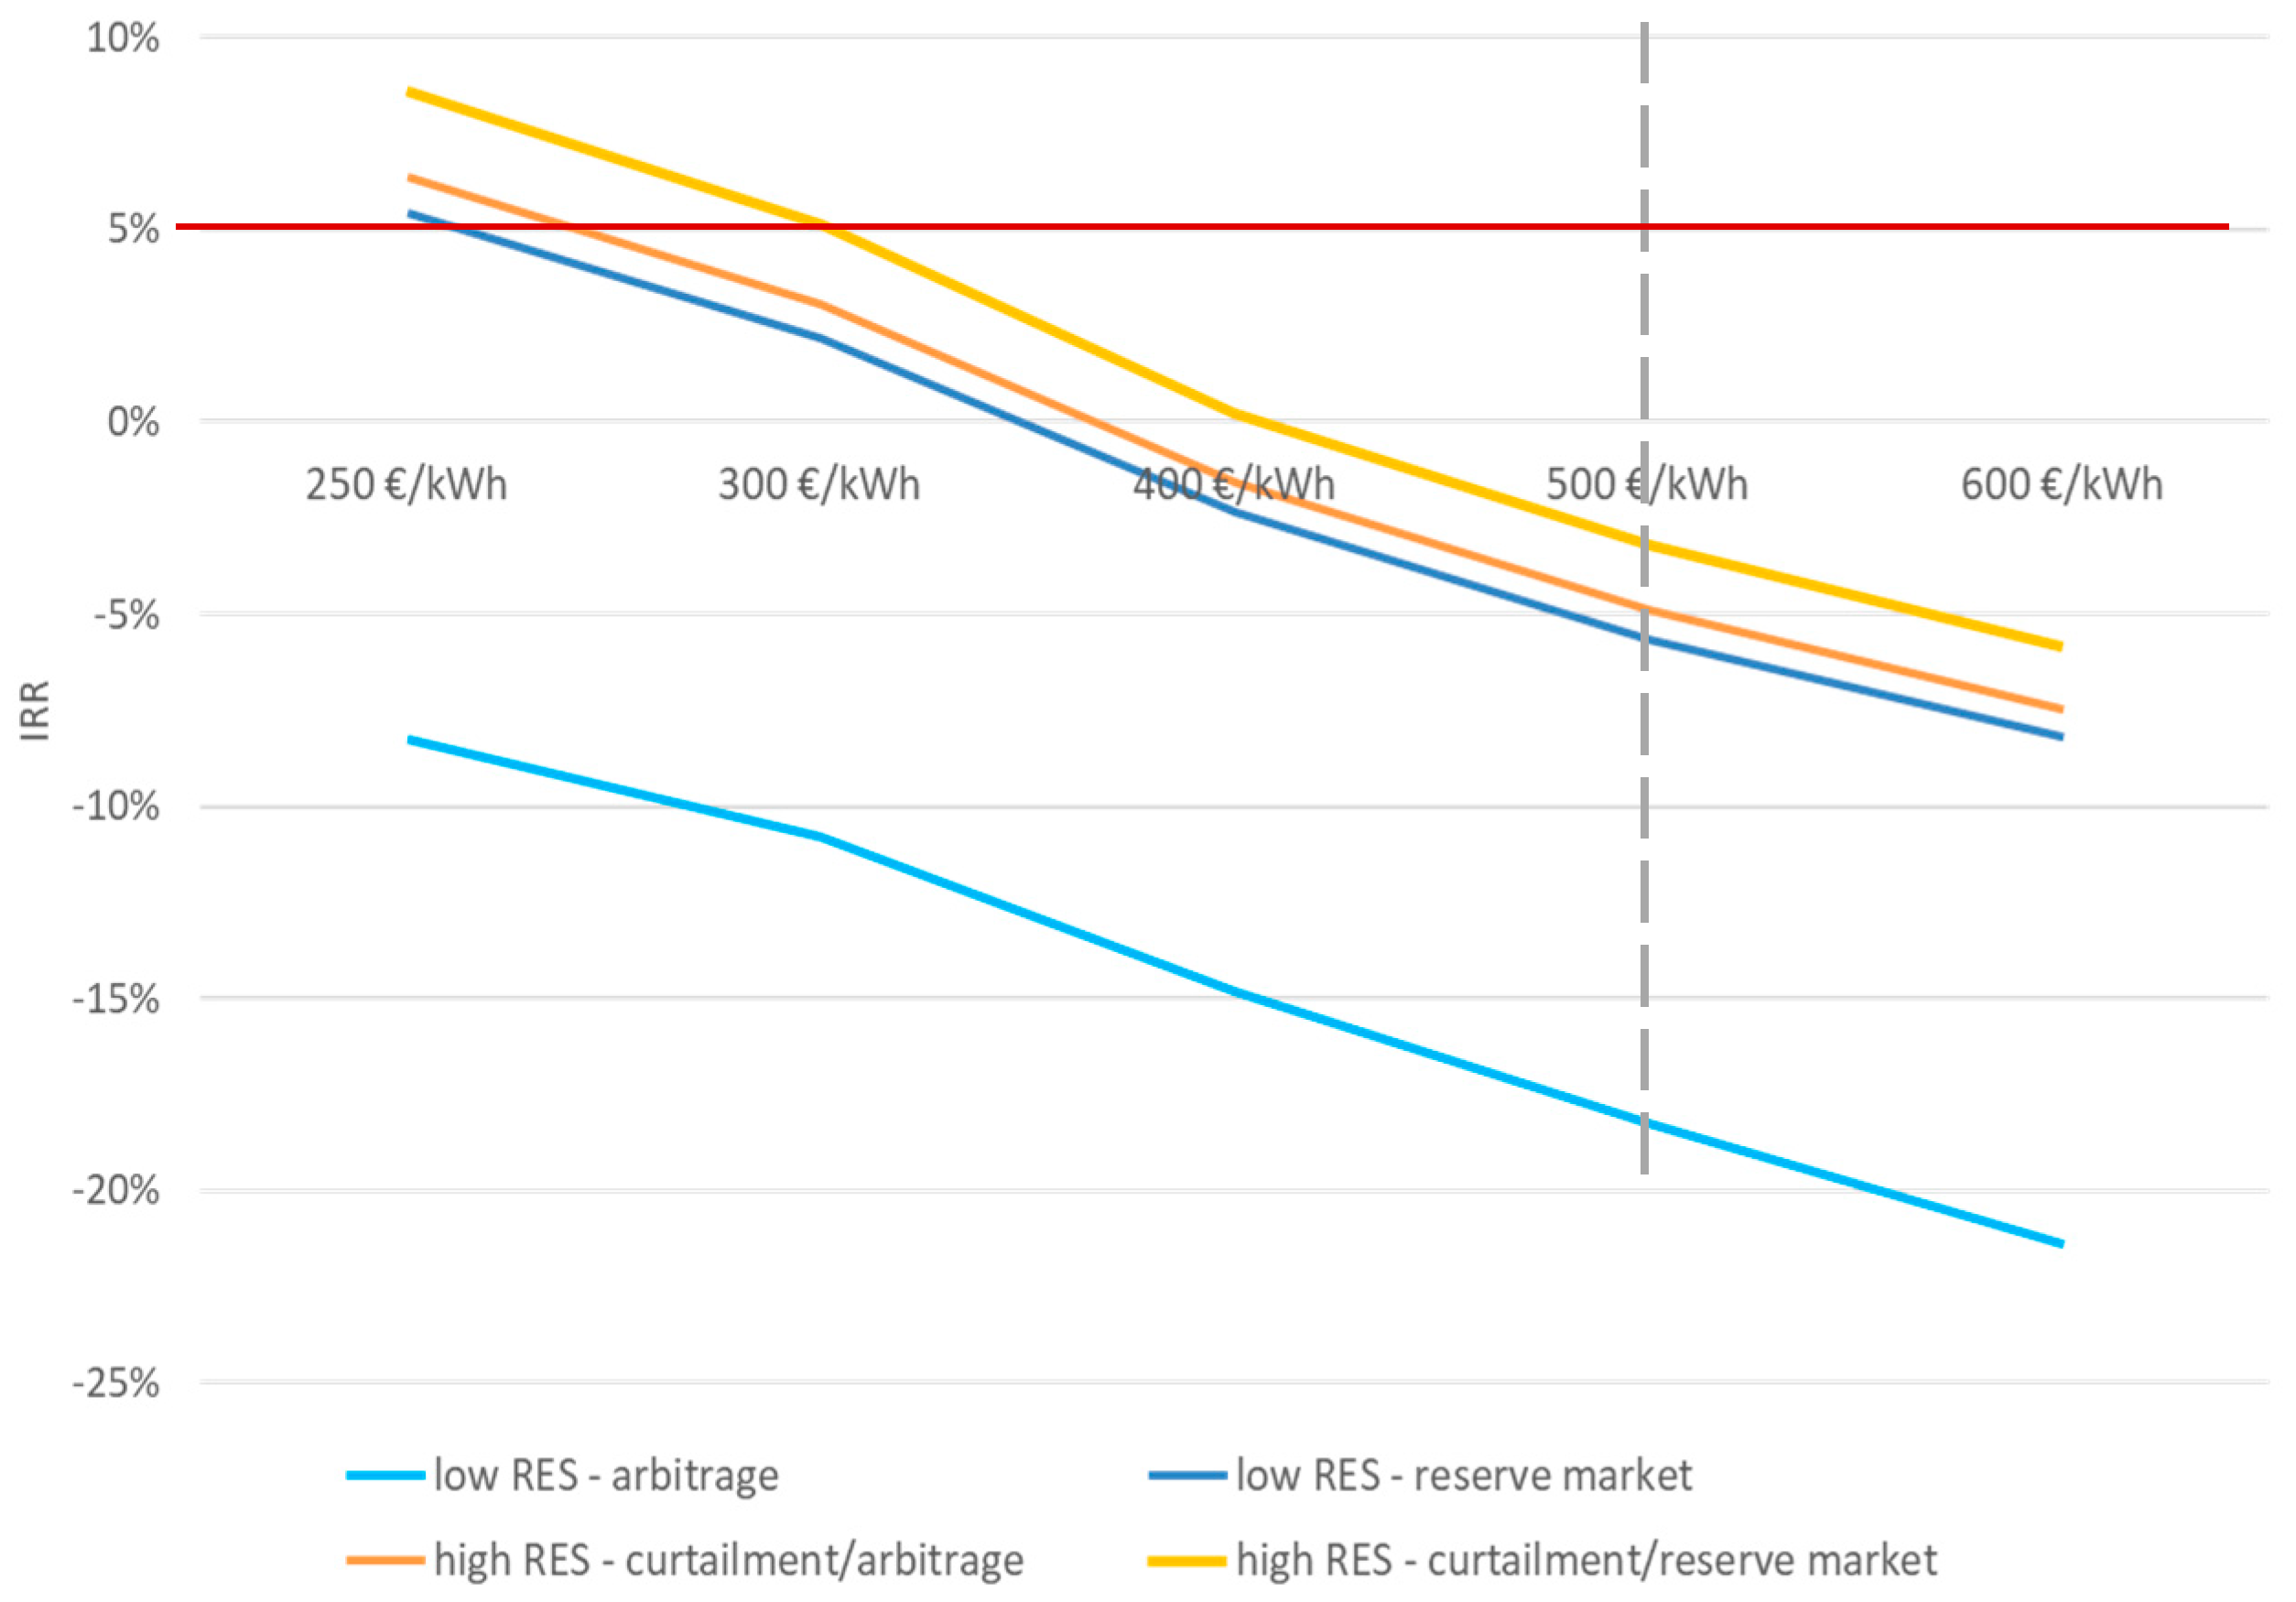
In the economic analysis, the same scenarios (low RES/high RES) as for the environmental analysis were considered. In all use cases a BESS system is in place. It is either used for arbitrage (charge in low tariff hours, discharge in high tariff hours) and to minimize curtailment or it is used to provide flexibilities on the manual frequency restoration reserve (mFRR) market for a reservation price of 4.43 €/MWh and an activation price of 249.5 €/MWh. It is activated 21 times/year and no capacity minimum is assumed. The price for recharging the battery is 30 €/MWh. Storage costs add up to 500 €/kWh and a feed-in tariff of 0.0462 €/kWh as well as a weighted average cost of capital (WACC) of 5% is used. As almost no curtailment takes place in the low RES scenario the storage is mostly used for arbitrage, which does not provide a positive business case (light blue line). The darker blue line represents the case where storage is used on the reserve market, which would make it economically feasible if storage costs drop to about 250 €/kWh. In the high RES scenario storage provides further revenues as it minimizes curtailed RES electricity. In this scenario, part of the storage capacity is used on the reserve market, 60% of the total storage capacity is used in winter, 0% in spring, 40% in summer, and 50% in fall while the remaining part is reserved to minimize curtailment. To become an attractive option storage costs need to decrease to 300 €/kWh (Figure 4).
4.3. Technical Analysis
This demo case highlights valuable technical benefits of storage implementation on the grid as shown in Table 3 for June. In the low/high RES scenario the peak power at the transformer station is reduced by 42%/45% on the positive (demand) peak side and by 49%/34% on the negative side respectively. Grid losses are reduced by 7% in the low RES and by 21% in the high RES scenario. Moreover, the energy consumption from the main grid is reduced by 20% for both scenarios, as the consumption of locally produced energy is increased. The battery operation in this demo location proved to be potentially beneficial to involved actors. Grid operators (DSO) could use a battery as a delay or deferral of grid reinforcements, while the community gains enhanced production of local PV units and increased local self-sufficiency and self-consumption levels.
5. Demo Case III—Multi-Energy Grid in Belgium
A 1.6 MWth wood-fired boiler in combination with a 90 kWe Organic Rankine Cycle has been installed at a factory in Belgium. In addition, one medium temperature storage tank (50 m3) and one low-temperature storage tank (20 m3) have been set up. The high temperature produced by the waste wood boiler is either directly used for factory processes or fed into the Organic Rankine Cycle (ORC) producing electricity. This electricity is then used by the factory or fed into the power grid and the waste heat can be stored/used for office heating (Figure 5). The demonstration focuses on the active control of the ORC through the use of thermal storage, aiming to reduce the peak power demand and analyse the possibility to sell waste heat to neighbouring companies.
5.1. Environmental Analysis
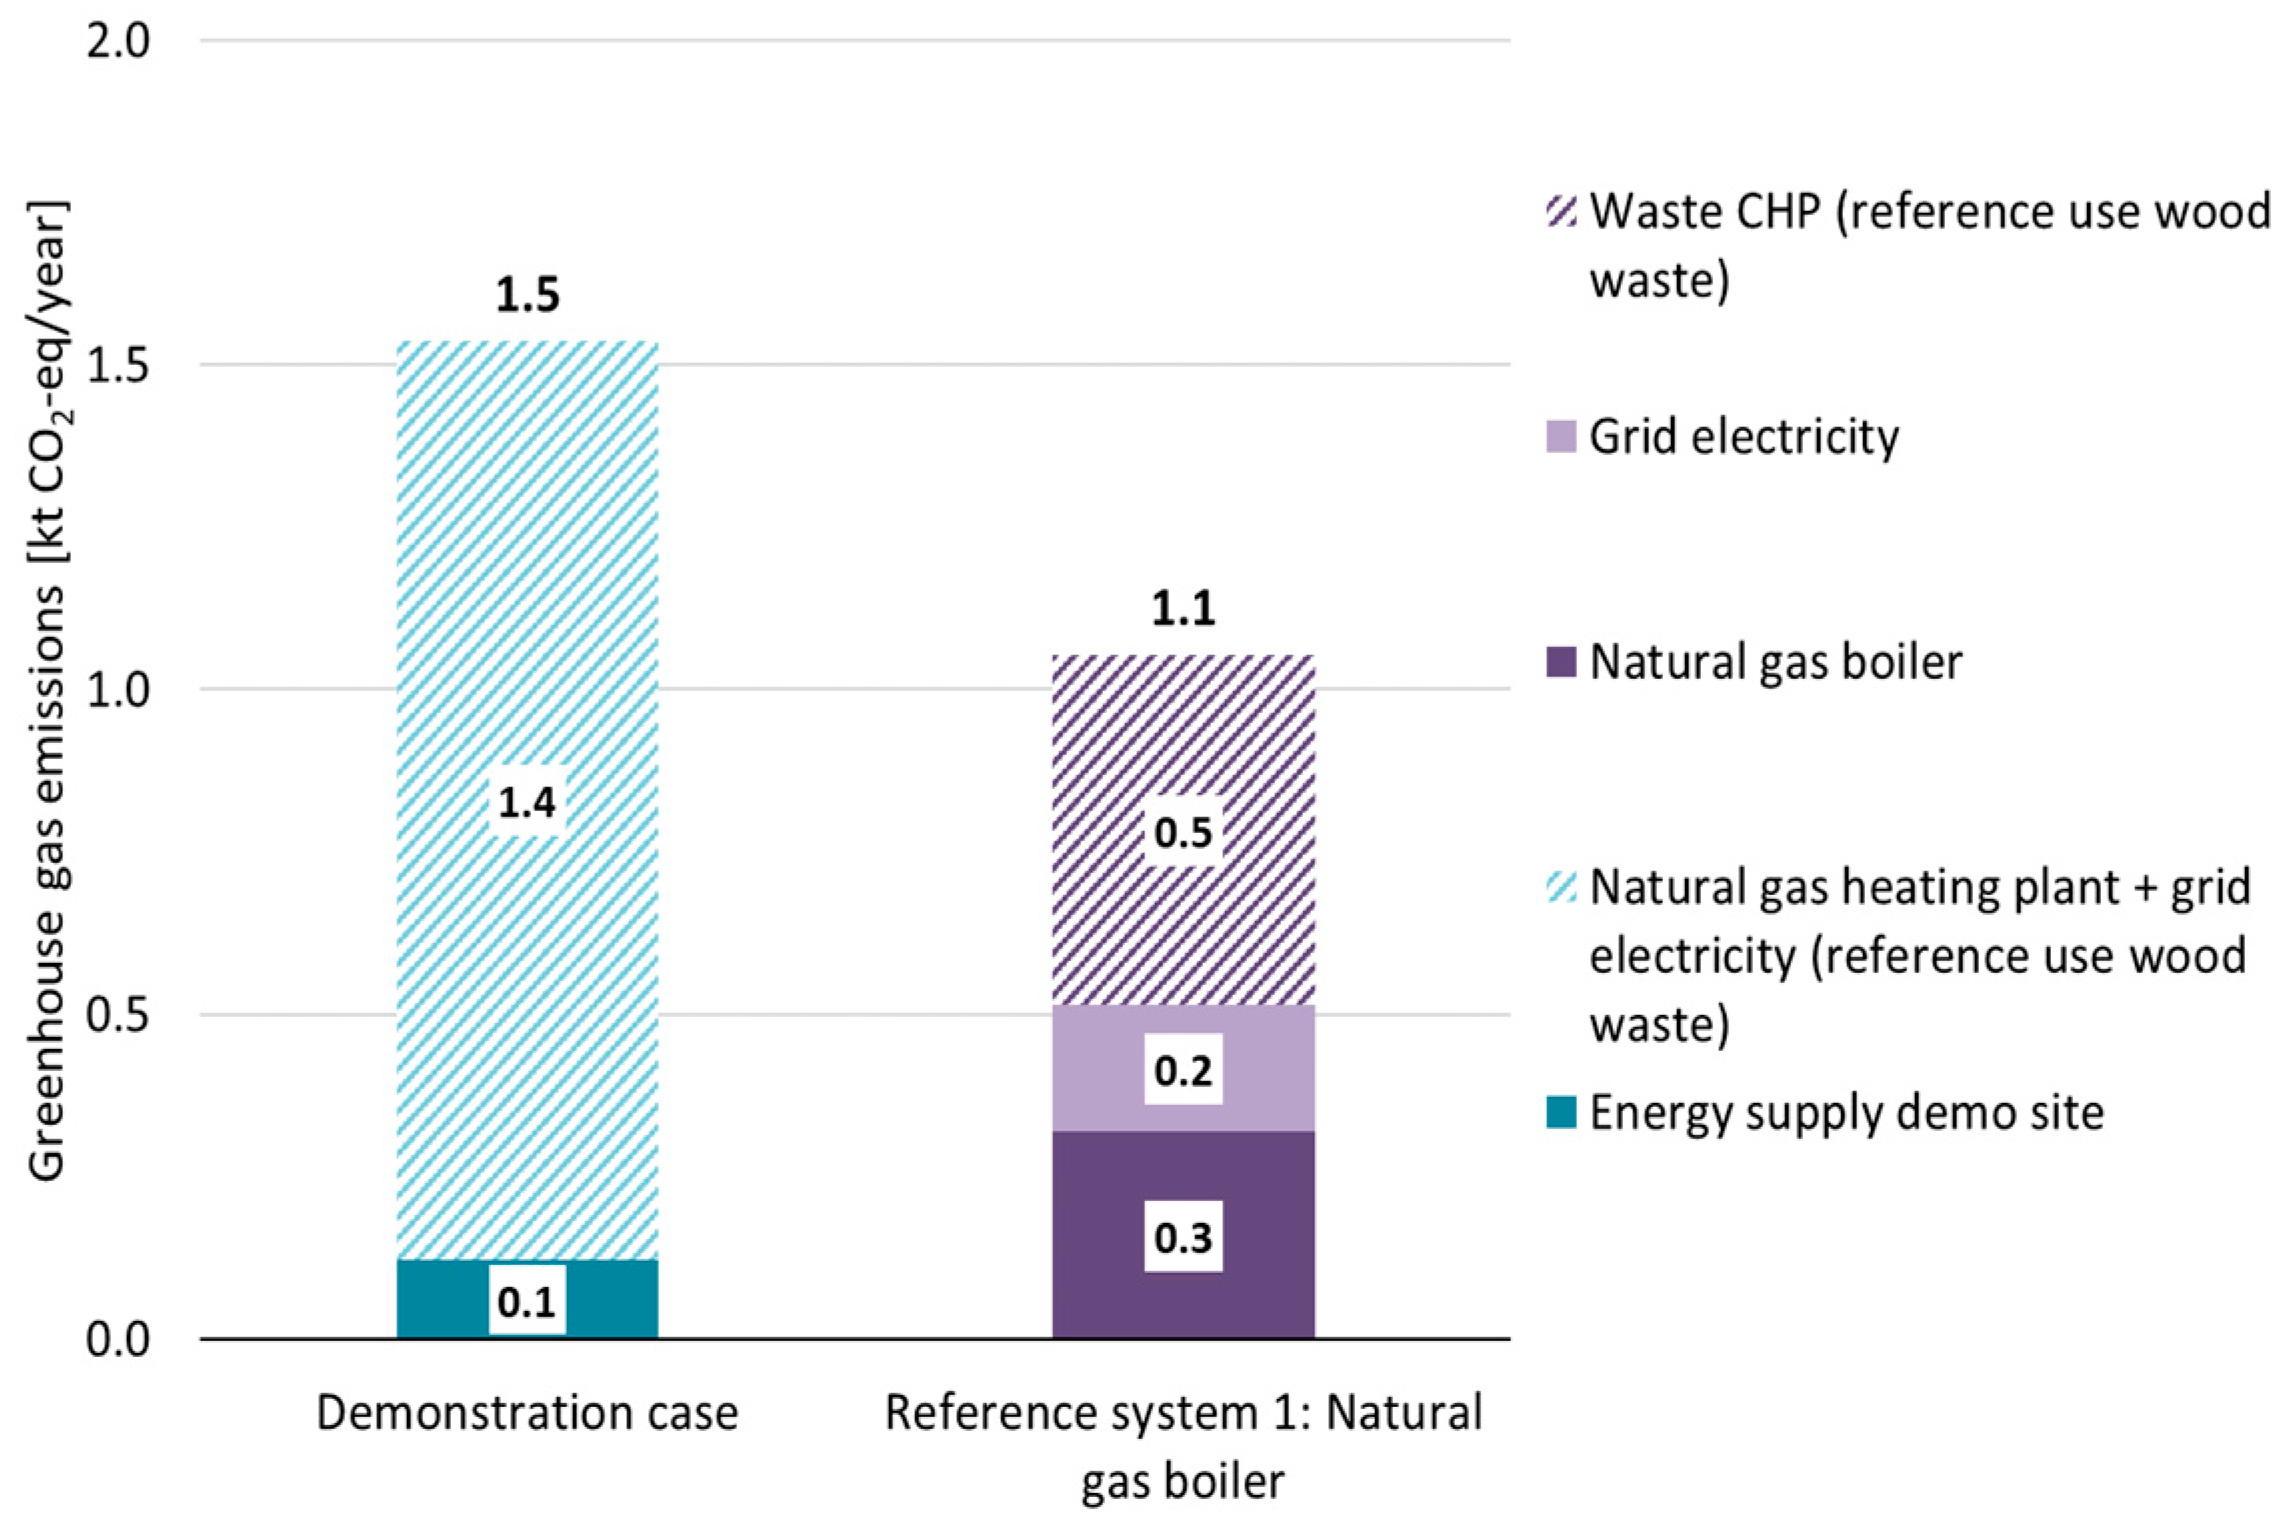
For the environmental analysis the afore described demonstration set-up was compared to a reference case, where the necessary heat is produced by a natural gas boiler and electricity is taken from the grid. The wood that is used in the waste wood boiler in the demonstration case is assumed to be transferred to a combined heat and power plant in the reference case where it produces heat as well as electricity. Figure 6 visualizes the GHG emissions in the demonstration (1.5 kt CO2-eq./year) and the reference case (1.1 kt CO2-eq./year). Only 0.1 kt are linked directly to the energy supply at the demo site, while the other 1.4 kt are due to the need to produce a comparable amount of heat and electricity as the wood does in the reference system. Therefore the 1.4 kt relate to additional heat produced by a natural gas boiler and electricity from the grid. Regarding the actual energy supply, the demonstration set-up comes with lower GHG emission, but considering the entire system, lower emissions, higher efficiency for the reference wood waste use and higher heat use benefit the reference system. A higher heat use is facilitated in the demonstration case under the assumption that produced heat is also used by neighbouring companies (approx. 527 MWh). This would diminish the GHG gap between the demonstration and the reference case. If more than 1500 MWh/year of additional unused heat are used, the reference case GHG emissions exceed the demonstration set-up.
5.2. Economic Analysis
Table 4 presents the results of the economic analysis under the following assumptions: the ORC was about 860,000 € and the extra cost for a compatible boiler for the ORC is 125,000 €. Operation and maintenance costs of 1% of the capital expenditure were assumed. A WACC of 5% was chosen. Electricity is fed into the grid for market prices (0.0352 €/kWh). There is the possibility to sell waste heat to neighbouring companies for which we assumed the equivalent gas price (0.036 €) and that electricity is sold to neighbours for 10 c/kWh. The costs for the thermal microgrid costs add up to 95,000 €. Scenario 1 looks at the current demonstration set-up and is on the edge of providing a positive business case. In Scenario 2, 527 MWh/year of before unused heat is sold to neighbouring companies, which already exceeds the needed minimum amount of 254 MWh/year to make the set-up economically feasible. Scenario 3 and Scenario 4 consider the possibility of also selling electricity to neighbours, which would generate higher revenues than simply selling excess electricity at market prices and therefore these scenarios further increase the economic viability of the demonstration.
The environmental and economic analysis shows that the break-even points to achieve positive economic and environmental impacts are different, with more heat supply for the neighbors needed to reach GHG reductions.
6. Conclusions
While the large-scale simulations showed that storage systems cause higher GHG emissions than injecting renewables into the grid, the demo results show a different picture. They illustrate that if storage is tailored to a specific purpose such as mitigating curtailment it can outweigh potential negative GHG impacts that might occur in case of a wide roll-out. Storage can also have an important role in facilitating RES deployment by delaying infrastructure reinforcement or improving power quality. However, break-even points from an economic and an environmental perspective might differ and therefore should deliberately be considered to generate benefit for both investors and society.
Figure 1.
Results of the large-scale environmental impact analysis.

Figure 2.
Environmental assessment for storage in a factory.

Figure 3.
Environmental assessment of community storage in a residential neighborhood.

Figure 4.
Economic analysis for a community battery in a residential neighbourhood.

Figure 5.
Demonstration set-up at a factory in Belgium.

Figure 6.
Environmental impact in a multi-energy grid in Belgium.


Table 1.
Network development scenarios (percentage values refer to 30 MVA nominal power of the high voltage/medium voltage transformer).
Table 1.
Network development scenarios (percentage values refer to 30 MVA nominal power of the high voltage/medium voltage transformer).
| Scenario | Photovoltaic—Installed Power | Electric Vehicles—Installed Capacity | Storage Installed Capacity (Unit Type) |
|---|---|---|---|
| Low PV_no Batt | 40% | 5% | 0% |
| Low PV_low Batt_Household | 40% | 5% | 15% (Household) |
| Low PV_medium Batt_Household | 40% | 5% | 30% (Household) |
| High PV_no Batt | 110% | 40% | 0% |
| High PV_low Batt_Grid | 110% | 40% | 15% (Grid) |
| High PV_medium Batt_Household | 110% | 40% | 30% (Household) |
| High PV_high Batt_Household | 110% | 40% | 80% (Household) |
| High PV_high Batt_Grid | 110% | 40% | 80% (Grid) |
Table 2.
Peak period demand charge reduction in a factory in Spain.
| Jan | Feb | Mar | Average Reduction | Sept | Oct | Nov | Average Reduction | |
|---|---|---|---|---|---|---|---|---|
| Loads (€) | 384 | 367 | 430 | 365 | 447 | 486 | ||
| Loads-PV (€) | 384 | 366 | 429 | −0.24% | 265 | 353 | 488 | −14.80% |
| Loads-PV+Bat (€) | 356 | 358 | 399 | −5.87% | 316 | 359 | 488 | −10.37% |
Table 3.
Technical impact of storage implementation.
| Low renewable energy source penetration (June) | High renewable energy source penetration (June) | |
| Peak power change | 42% positive, 49% negative | 45% positive, 34% negative |
| Grid loss reduction | −7% | −21% |
| Main grid energy consumption | +20% | +20% |
Table 4.
Economic analysis of a multi-energy grid in Belgium.
| NPV | IRR | |
|---|---|---|
| S1–Current use case | −40 144 € | 4.6% |
| S2–Heat to neighbours | 134 699 € | 6.3% |
| S3–Electricity to neighbours | 419 811 € | 9.1% |
| S4–Heat and electricity to neighbours | 594 656 € | 10.3% |
Publisher’s Note: MDPI stays neutral with regard to jurisdictional claims in published maps and institutional affiliations. |
© 2021 by the authors. Licensee MDPI, Basel, Switzerland. This article is an open access article distributed under the terms and conditions of the Creative Commons Attribution (CC BY) license (http://creativecommons.org/licenses/by/4.0/).
Share and Cite
MDPI and ACS Style
Neumann, C.; Pucker-Singer, J.; Türk, A.; Zupančič, J.; Gubina, A. The Role of Storage Systems in Industrial and Residential Environments. Proceedings 2020, 65, 25. https://doi.org/10.3390/proceedings2020065025
AMA Style
Neumann C, Pucker-Singer J, Türk A, Zupančič J, Gubina A. The Role of Storage Systems in Industrial and Residential Environments. Proceedings. 2020; 65(1):25. https://doi.org/10.3390/proceedings2020065025
Chicago/Turabian StyleNeumann, Camilla, Johanna Pucker-Singer, Andreas Türk, Jernej Zupančič, and Andrej Gubina. 2020. "The Role of Storage Systems in Industrial and Residential Environments" Proceedings 65, no. 1: 25. https://doi.org/10.3390/proceedings2020065025