Improving Packaging Design Using Virtual Reality in the Market Research Process †

Computer Science Graduate Program, University of Costa Rica, Montes de Oca, San Jose 11801, Costa Rica
*
Author to whom correspondence should be addressed.
†
Presented at the 13th International Conference on Ubiquitous Computing and Ambient Intelligence UCAmI 2019, Toledo, Spain, 2–5 December 2019.
Proceedings 2019, 31(1), 12; https://doi.org/10.3390/proceedings2019031012
Published: 20 November 2019
(This article belongs to the Proceedings of 13th International Conference on Ubiquitous Computing and Ambient Intelligence UCAmI 2019)
Abstract
:Market research is important because every company wants to stand out from their competitors. However, there are well-known weaknesses of traditional market research methods. This research presents a virtual reality system that aims to improve the quality of the data collected in marketing research. The system was designed and developed using Human–Computer Interaction techniques like iterative design, storyboards and prototypes. One hundred and twenty eight participants were involved in this research. Thirty five computer science graduate students, and twelve marketing professors validated the idea through a storyboard. Adjectives like innovative, useful and interesting were used by the participants to refer to the idea presented. Furthermore, eighty one marketing graduate students validated the prototype’s user experience and usability using the AttrakDiff survey. Unquestionably, 100% of the participants agreed that the prototype could help improve market studies of product packaging design. In addition, 99% of the participants said that they would use the prototype when executing market research of product packaging design.
1. Introduction
Market research analyzes and collects information about what current and future customers may need and want. Some traditional market research methods are focus groups, surveys, personal interviews, and field trials [1]. Each traditional method has its advantages. However, if companies only stick to one method, they will probably miss a lot of quality data [2]. Also, there are known disadvantages of traditional research methods [3]. In the first place, they are costly. Companies have to spend much money on incentives to get participants. In the case of focus groups, several phases are required [4], and data collecting is very cumbersome. In general, market research methods are outdated [3]. The way people interact with technology has notably changed; so, should not research methods do so too?
Another critical point is data quality, which is frequently not fully trustable [5]. For instance, survey participation is low, and sometimes, the target audience is not covered by the participants, resulting in low-quality data [5]. Conversely, new market techniques such as gathering emotion information, provides very high-quality data, as it predicts key success metrics such as brand recall and purchase intent [6].
Prior to this research, a literature review was made regarding the use of non-traditional interfaces in market research [7]. The goal was to determine if the use of non-traditional interfaces have had any impact on the traditional processes of market research. As a result of this literature review, our general research question was stated: Is it possible to improve how market research information is collected using non-traditional interfaces?
In market research, some interesting findings are the support for our underlining hypotheses. For example, the more realistic the situation is, the more accurately will marketers be able to study how people behave [6]. Moreover, 70% of the consumer’s decisions are made inside the store [6]. It has also been proven that effective package design can encourage customers to make a purchase [8]. Thus, doing packaging design research in a real setting makes sense. However, doing so may be very difficult and costly.
Furthermore, creating new package prototypes or physical product versions may also be very costly. Thus, the main goal of this paper is to design and validate a prototype based on virtual reality that enables the user to observe and interact with a product as realistically as possible, in order to determine if it is feasible to improve the quality of data collected. One hundred and twenty eight participants were involved in this research, 35 Computer Science graduate students, and 12 Marketing professors validated the idea. Furthermore, 81 Marketing graduate students validated the prototype’s user experience and provided feedback. They issued their opinion on if a prototype like this could improve the quality of the data collected in a market research process.
This paper is structured to present the design, evaluation, and results of the idea and the virtual reality prototype. In Section 2, the background is presented; valuables findings from the literature review are covered. Section 3 presents the methodology, Section 4 describe the design of the idea (Storyboard) and the design of the prototype. The evaluation and results are detailed in Section 5. Finally, in Section 6, the discussion and main conclusions are presented.
2. Background
Packages are the presentation letter of the product. They must capture the attention of consumers and are a window of communication to the user. In an increasingly competitive market, packaging design acquires relevance, positioning itself as the best marketing tool [9]. Even though there are new technologies, market research is still very traditional. Some efforts have been made to implement non-traditional interfaces using Virtual Reality to create a more significant impact in retailing, through virtual stores [10].
A non-traditional tool that has had a significant impact on market research is Affdex for Market Research by Affectiva [11], a cloud-based solution that uses emotion recognition software. It is simple, easy, and highly accurate. Affdex for Market Research measures the user moment-by-moment facial expressions of emotions. The results are aggregated and displayed in an easy-to-use dashboard [11].
The most crucial finding of the literature review was related to market research and different non-traditional interfaces developed with Virtual Reality (VR). VR has gotten marketers interest because it can get consumers attention creative and ingenious way [12].
Marketing literature has demonstrated that a more vivid representation gets positive feedback in the consumer in terms of attitudes [10], that is why Virtual Reality has started to be implemented in VR Experience Marketing. The use of Virtual Reality in marketing practice is still somewhat limited. Nevertheless, affordable Virtual Reality headsets like Samsung Gear VR are reaching consumer markets. Recently, even reachable low-cost alternatives, such as Google Cardboard and Daydream have become available for general customers [10].
3. Methodology
The main goal of this research is to design and validate a prototype based on virtual reality that enables the user to interact with one product, in order to prove if it is feasible to improve the quality of data collected in a product label design process.
We followed a design science methodology [13] to design the prototype in an iterative fashion, and quasi-experiments to validate the two prototypes. Two design cycles were performed. In the first, a storyboard was created and evaluated. In the second, a virtual reality prototype was built and evaluated. The recruitment of the participants for both evaluation processes was based on convenience samples. The general evaluation process is presented in Table 1 for the storyboard and in Table 2 for the prototype.
4. General Idea and Prototype
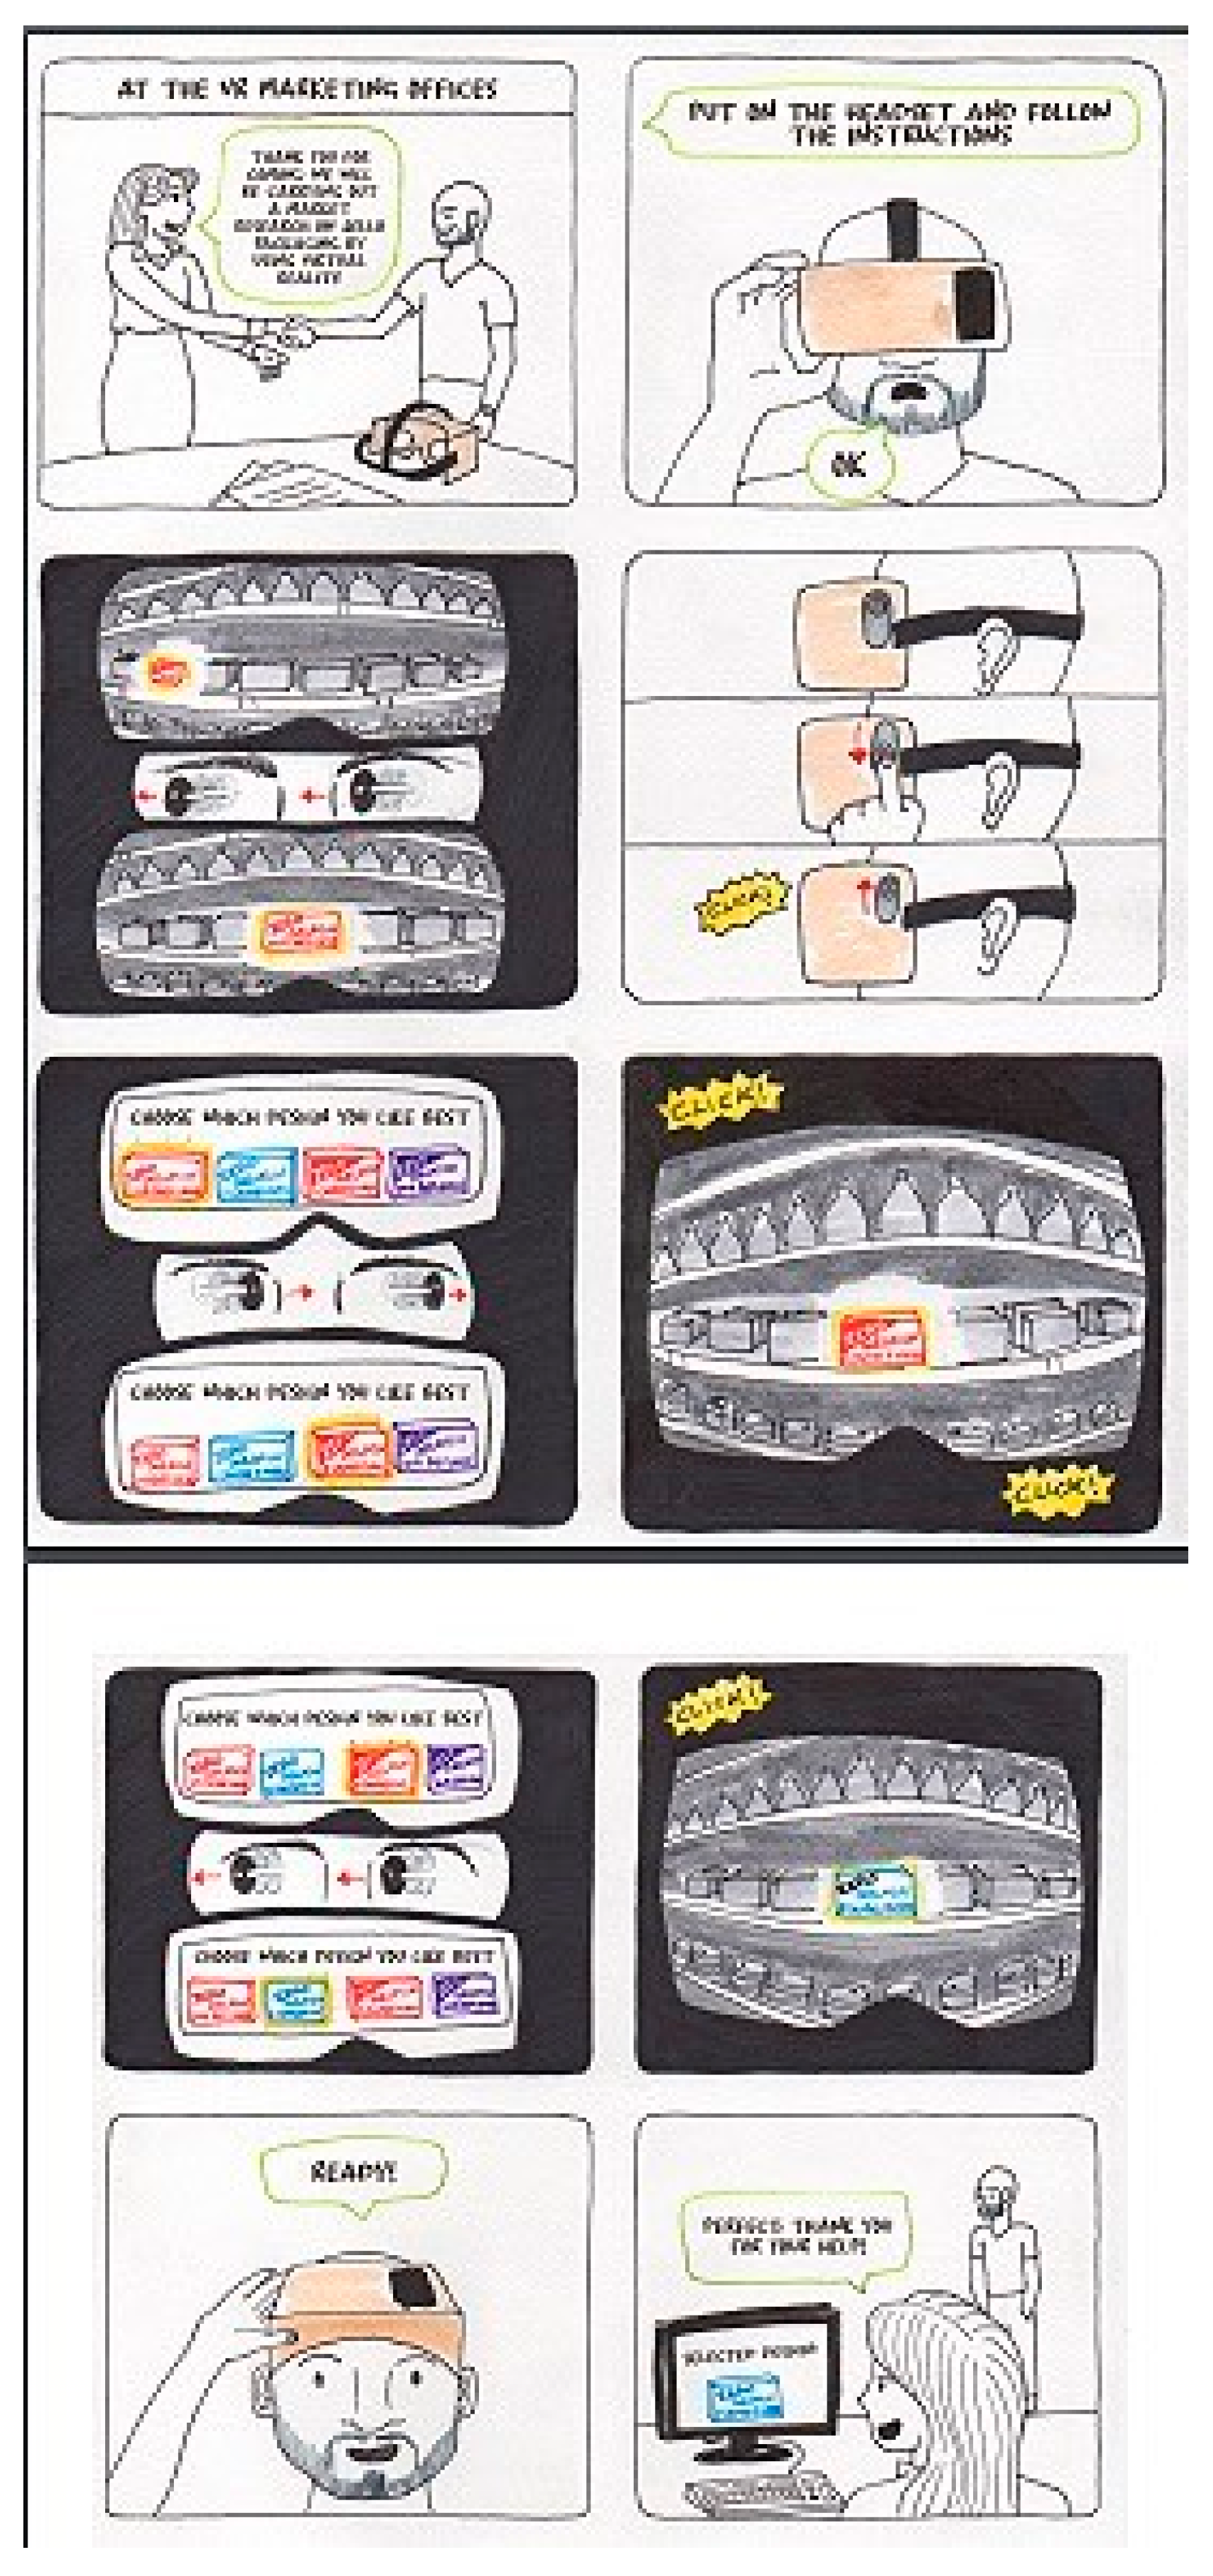
As mention in the methodology, to evaluate the proposed idea, a storyboard was used. Figure 1 shows the storyboard used in this research.
4.1. Storyboard
The storyboard shows a market research event in which, instead of using a real product, a virtual reality headset is used. The main goal of this is to provide more options of products and environments to improve the participants experience during the evaluation.
The first step of the process is to gain knowledge of the type of supermarket that the participant visits. With this information the context is setup. Once in the virtual supermarket, the participant can navigate an aisle to find the product being evaluated and select it. Upon selection the system prompts the user to choose between different versions of the product. Each selection is shown in the aisle and the process can be repeated as necessary.
4.2. Virtual Reality Prototype
To improve user experience the potential users were actively engaged in the design process since its early design stages [12]. Iterative prototyping was also used to observe and examine different product alternatives, with diverse levels of detail, and then compare them with the defined requirements [14].
The main technology used in the development was Unreal Engine Platform. VR requires complex scenes rendered at very high framerates. With Unreal you can build content on all VR platforms—from PC to console to mobile [15].
The Blueprints Visual Scripting was used to develop the prototype´s functionality. It is a complete gameplay scripting system based on the concept of using a node-based interface to create gameplay elements from within Unreal Editor [16]. It is used to define object-oriented (OO) classes or objects in the engine. To create the supermarket environment, assets from Unreal Engine Platform were used. Also, the packages designs were created using Adobe Photoshop and later imported to Unreal Engine. The prototype’s application was deployed in Android and the headset used was Google Daydream.
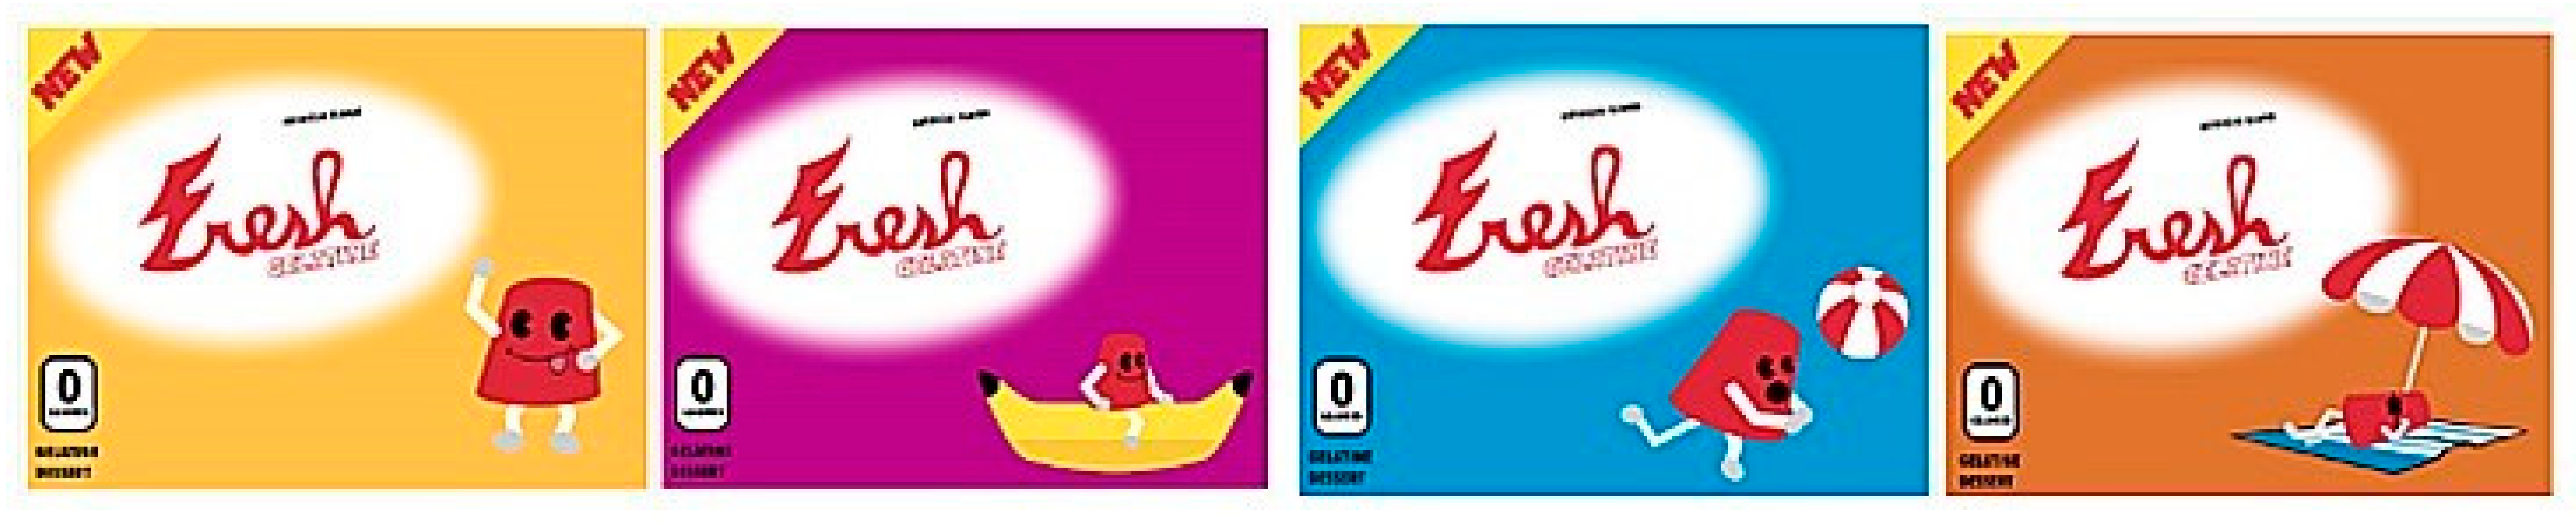
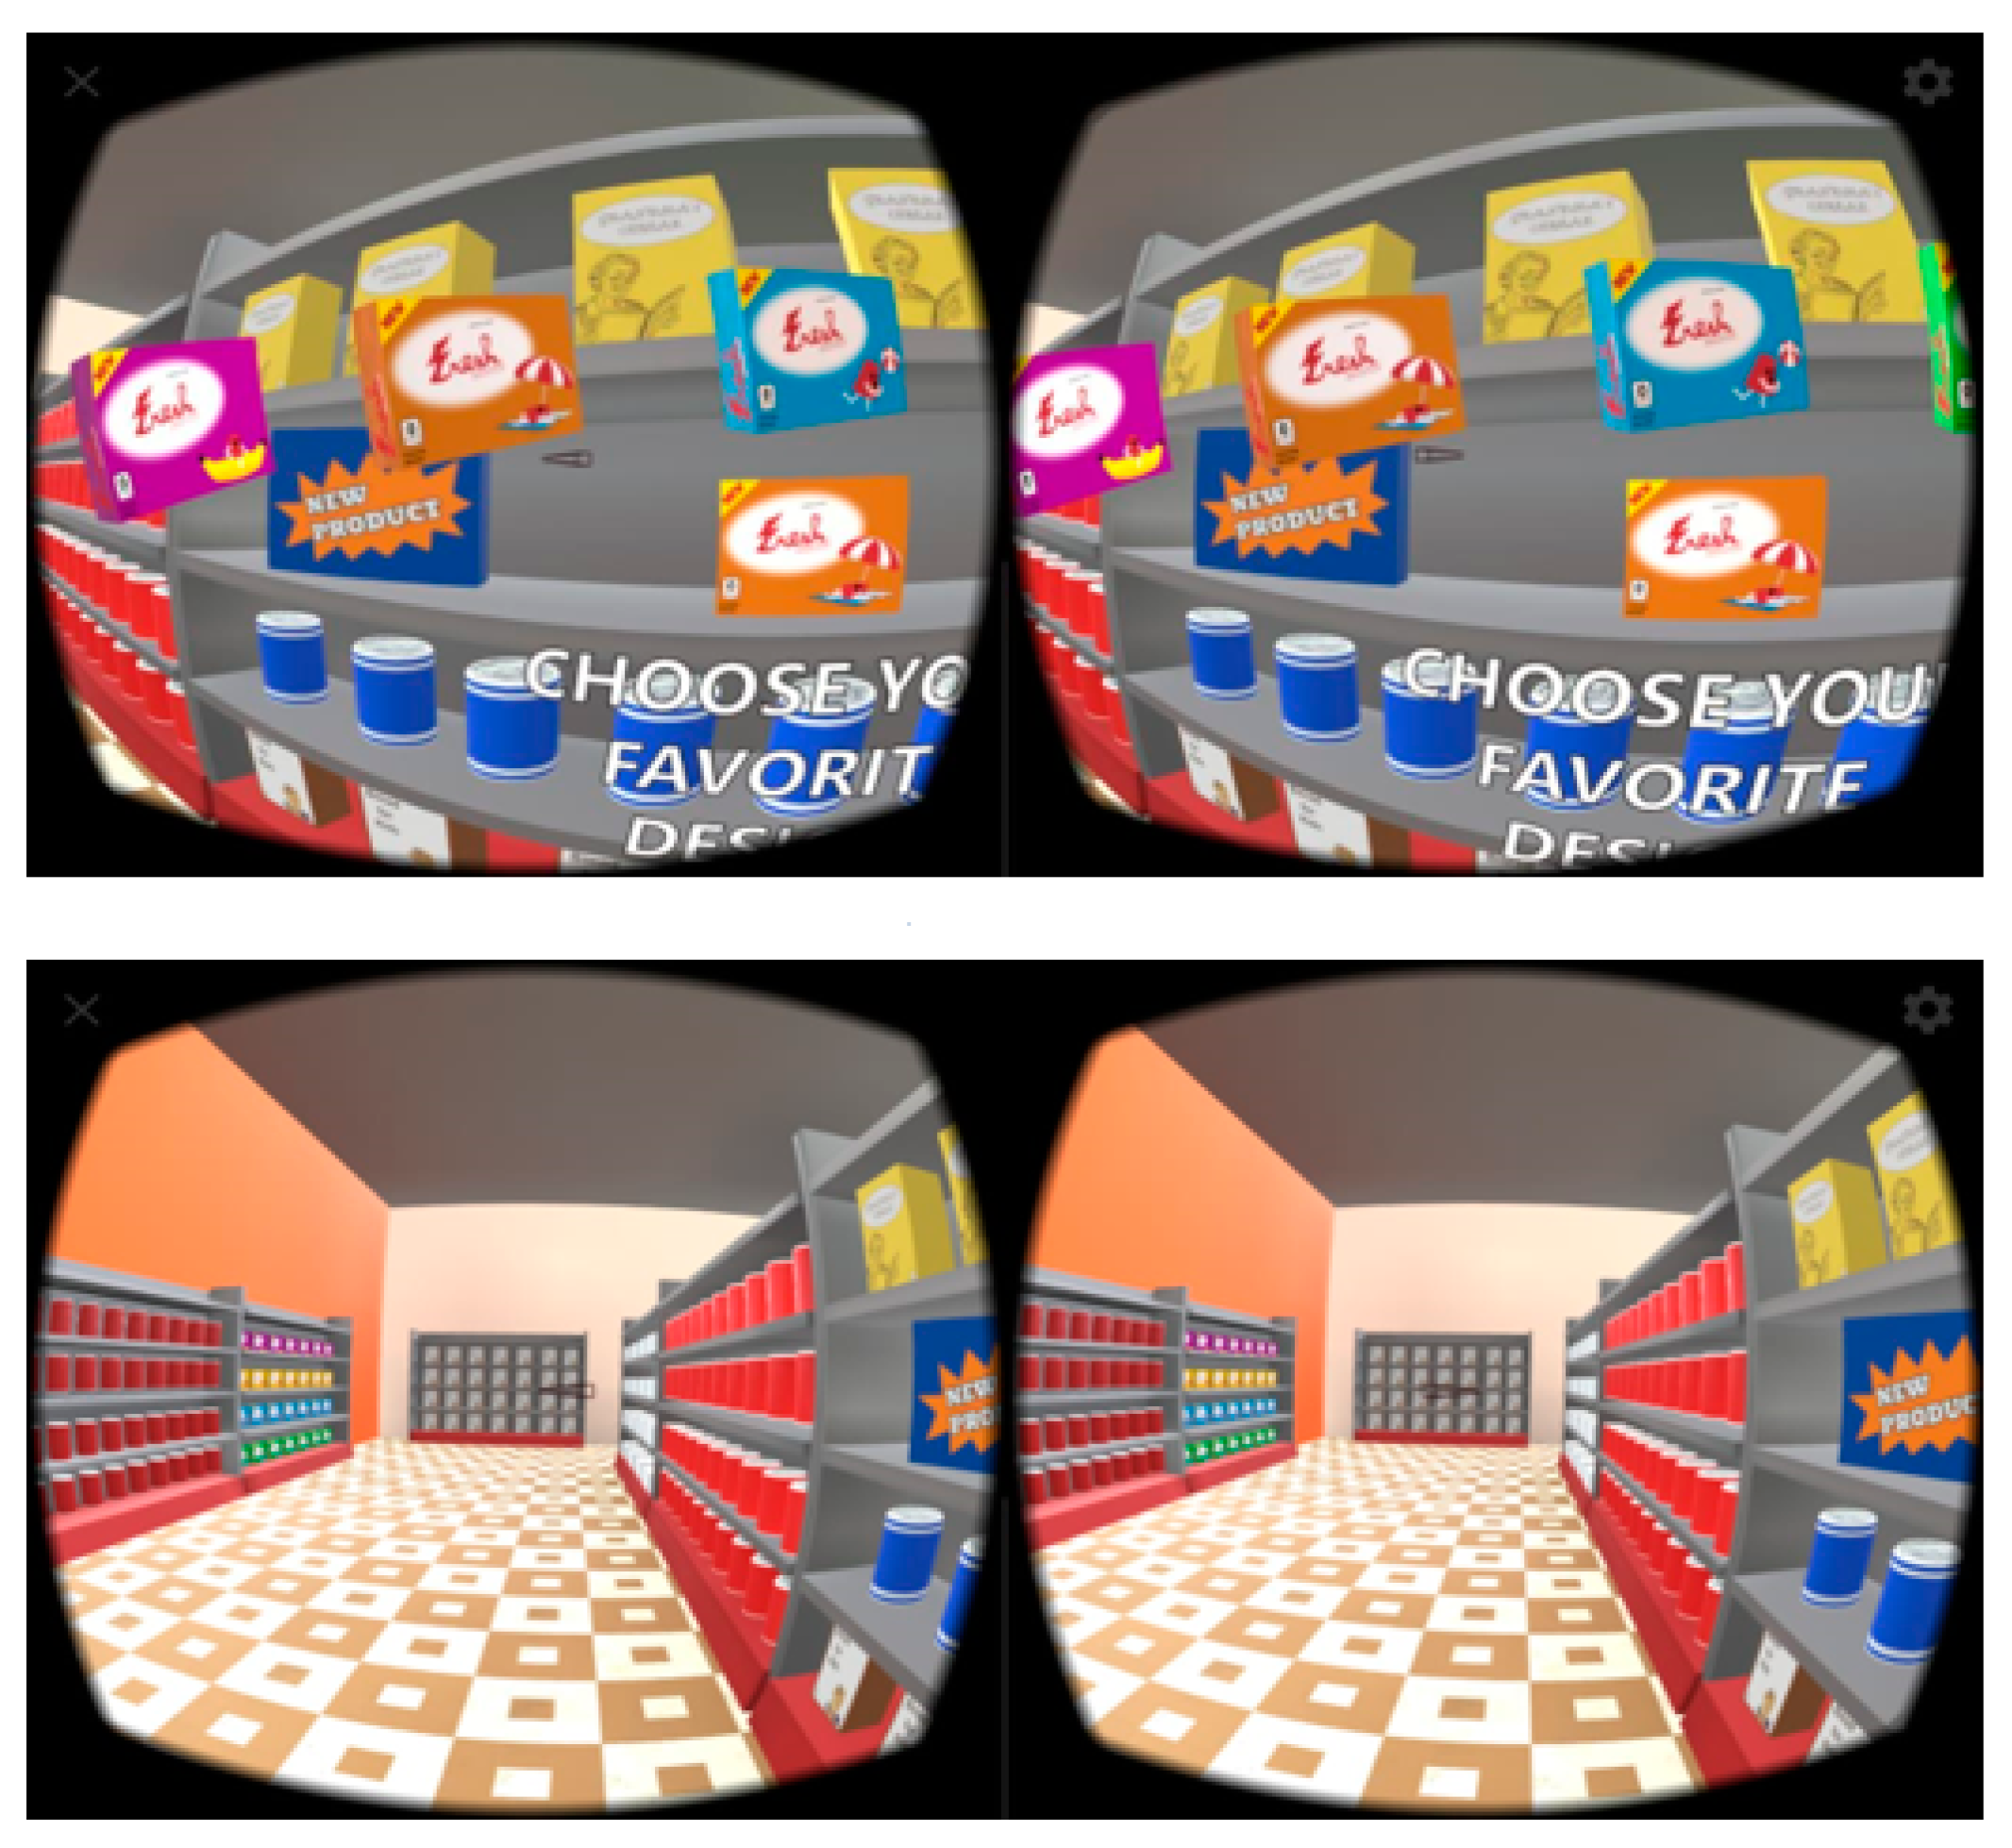
It was necessary to create four different label designs that are shown in Figure 2. The main differences between the label designs are the background color and the activity the character is performing. The different scenarios covered in the storyboard like selecting new designs and simulating a supermarket interface were created in the application as shown in Figure 3.
5. Evaluation
The first evaluation conducted was on the idea. This evaluation was executed with 47 participants from marketing and computer science. The idea was presented through a Storyboard. The prototype evaluation was conducted with 81 marketing experts. Both evaluations were qualitative and used surveys.
5.1. Idea Evaluation
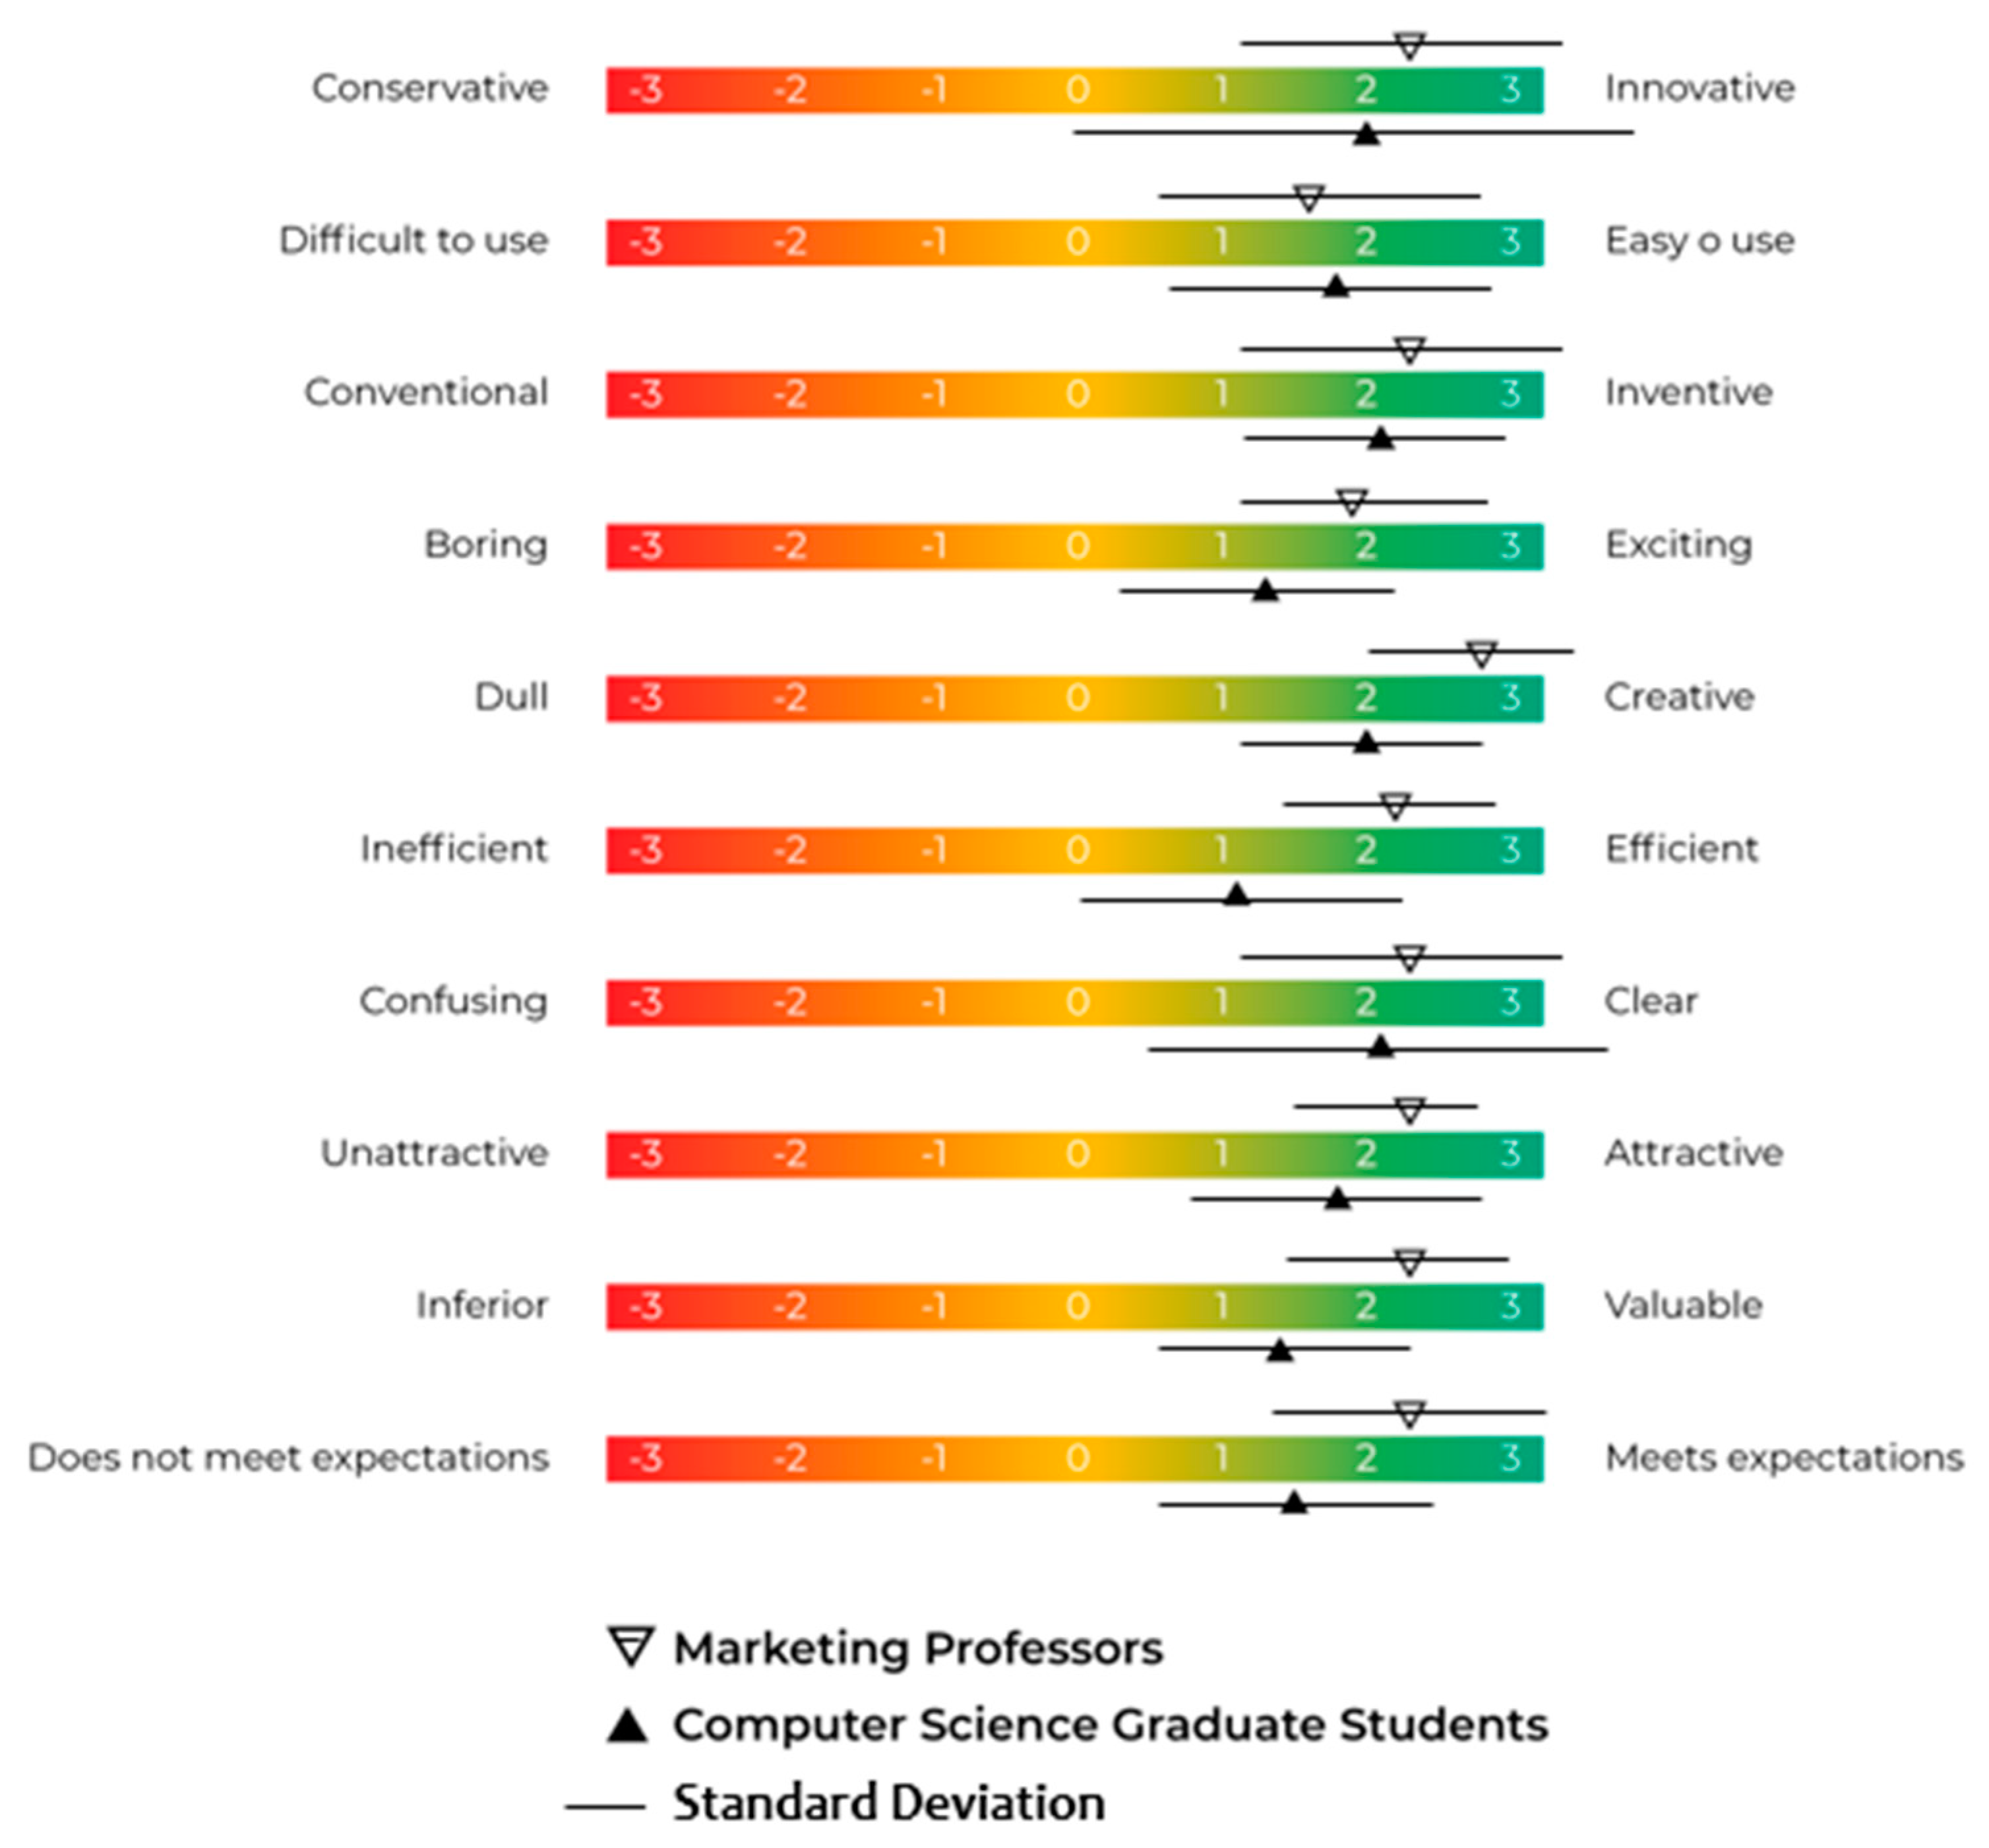
In the survey, ten characteristics of the proposed idea were evaluated: innovation, easiness to use, originality, exactingness, creativity, efficiency, attractiveness, value-added, clearness and if it meets their expectations. All of these characteristics were measured using 7 points semantic differentials. Participants were also asked to mention three words that describe the idea of the prototype and if they would be interested in participating in market research using a prototype like this. A general comments section was also available.
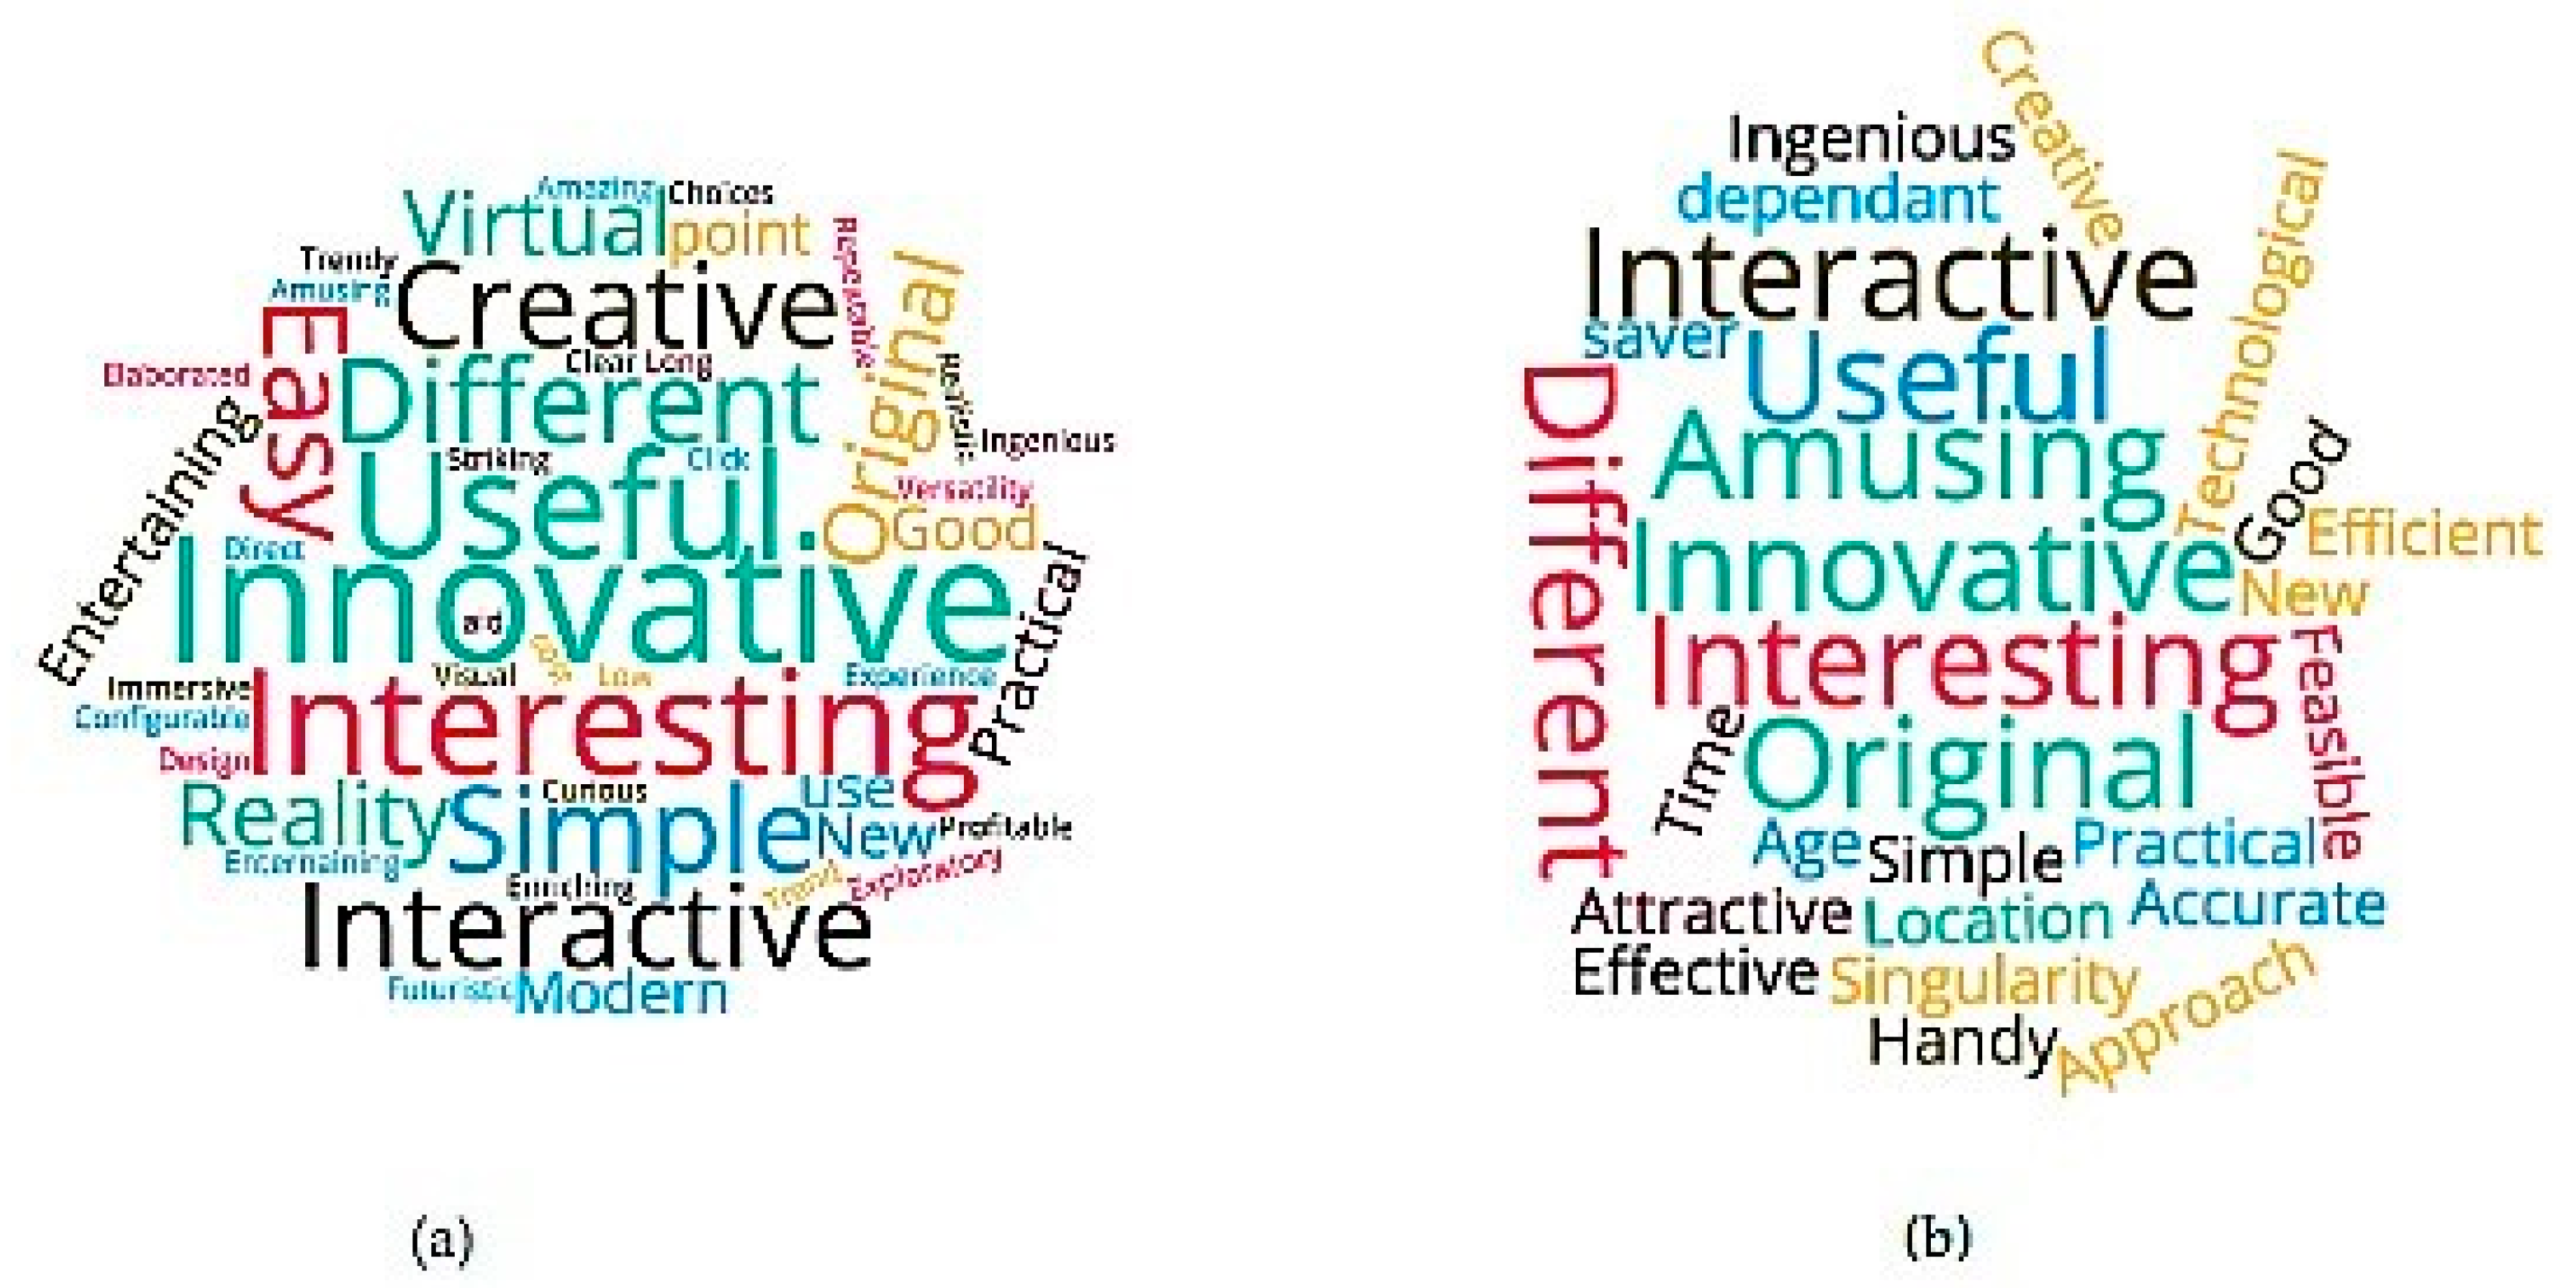
The survey participants distribution is explained in Table 3. Results from both areas were separated to compare both opinions. In the survey, each participant had to provide three words to describe the idea. The corresponding word clouds are presented in Figure 4: (a) Computer Science students and (b) Marketing professors. Innovative, Interesting, Interactive and Useful were the most repeated words for both populations.
Furthermore, ten characteristics of the proposed idea were evaluated, and the results are summarized in Figure 5. Results between Computer Science graduate students and Marketing professors were different mostly in terms of excitement, creativeness, efficiency and value. Furthermore, the standard deviation indicates a downward trend.
General comments received from the participants are shown in Table 4.
At the end, 100% of the marketing professors were interested in participating in a market research using this prototype and 80% of the computer science students were interested as well. As the idea evaluation results were a success, a real VR prototype was developed.
5.2. Prototype Evaluation
To evaluate the prototype’s usability and user experience the AttrakDiff questionnaire was used. AttrakDiff is an instrument for measuring the attractiveness of an interactive product. Users can indicate how they experience the product using pairs of opposite adjectives [17]. This instrument was selected because it is applicable once prototype or system is available, enabling the user to interact and experience the product [18].
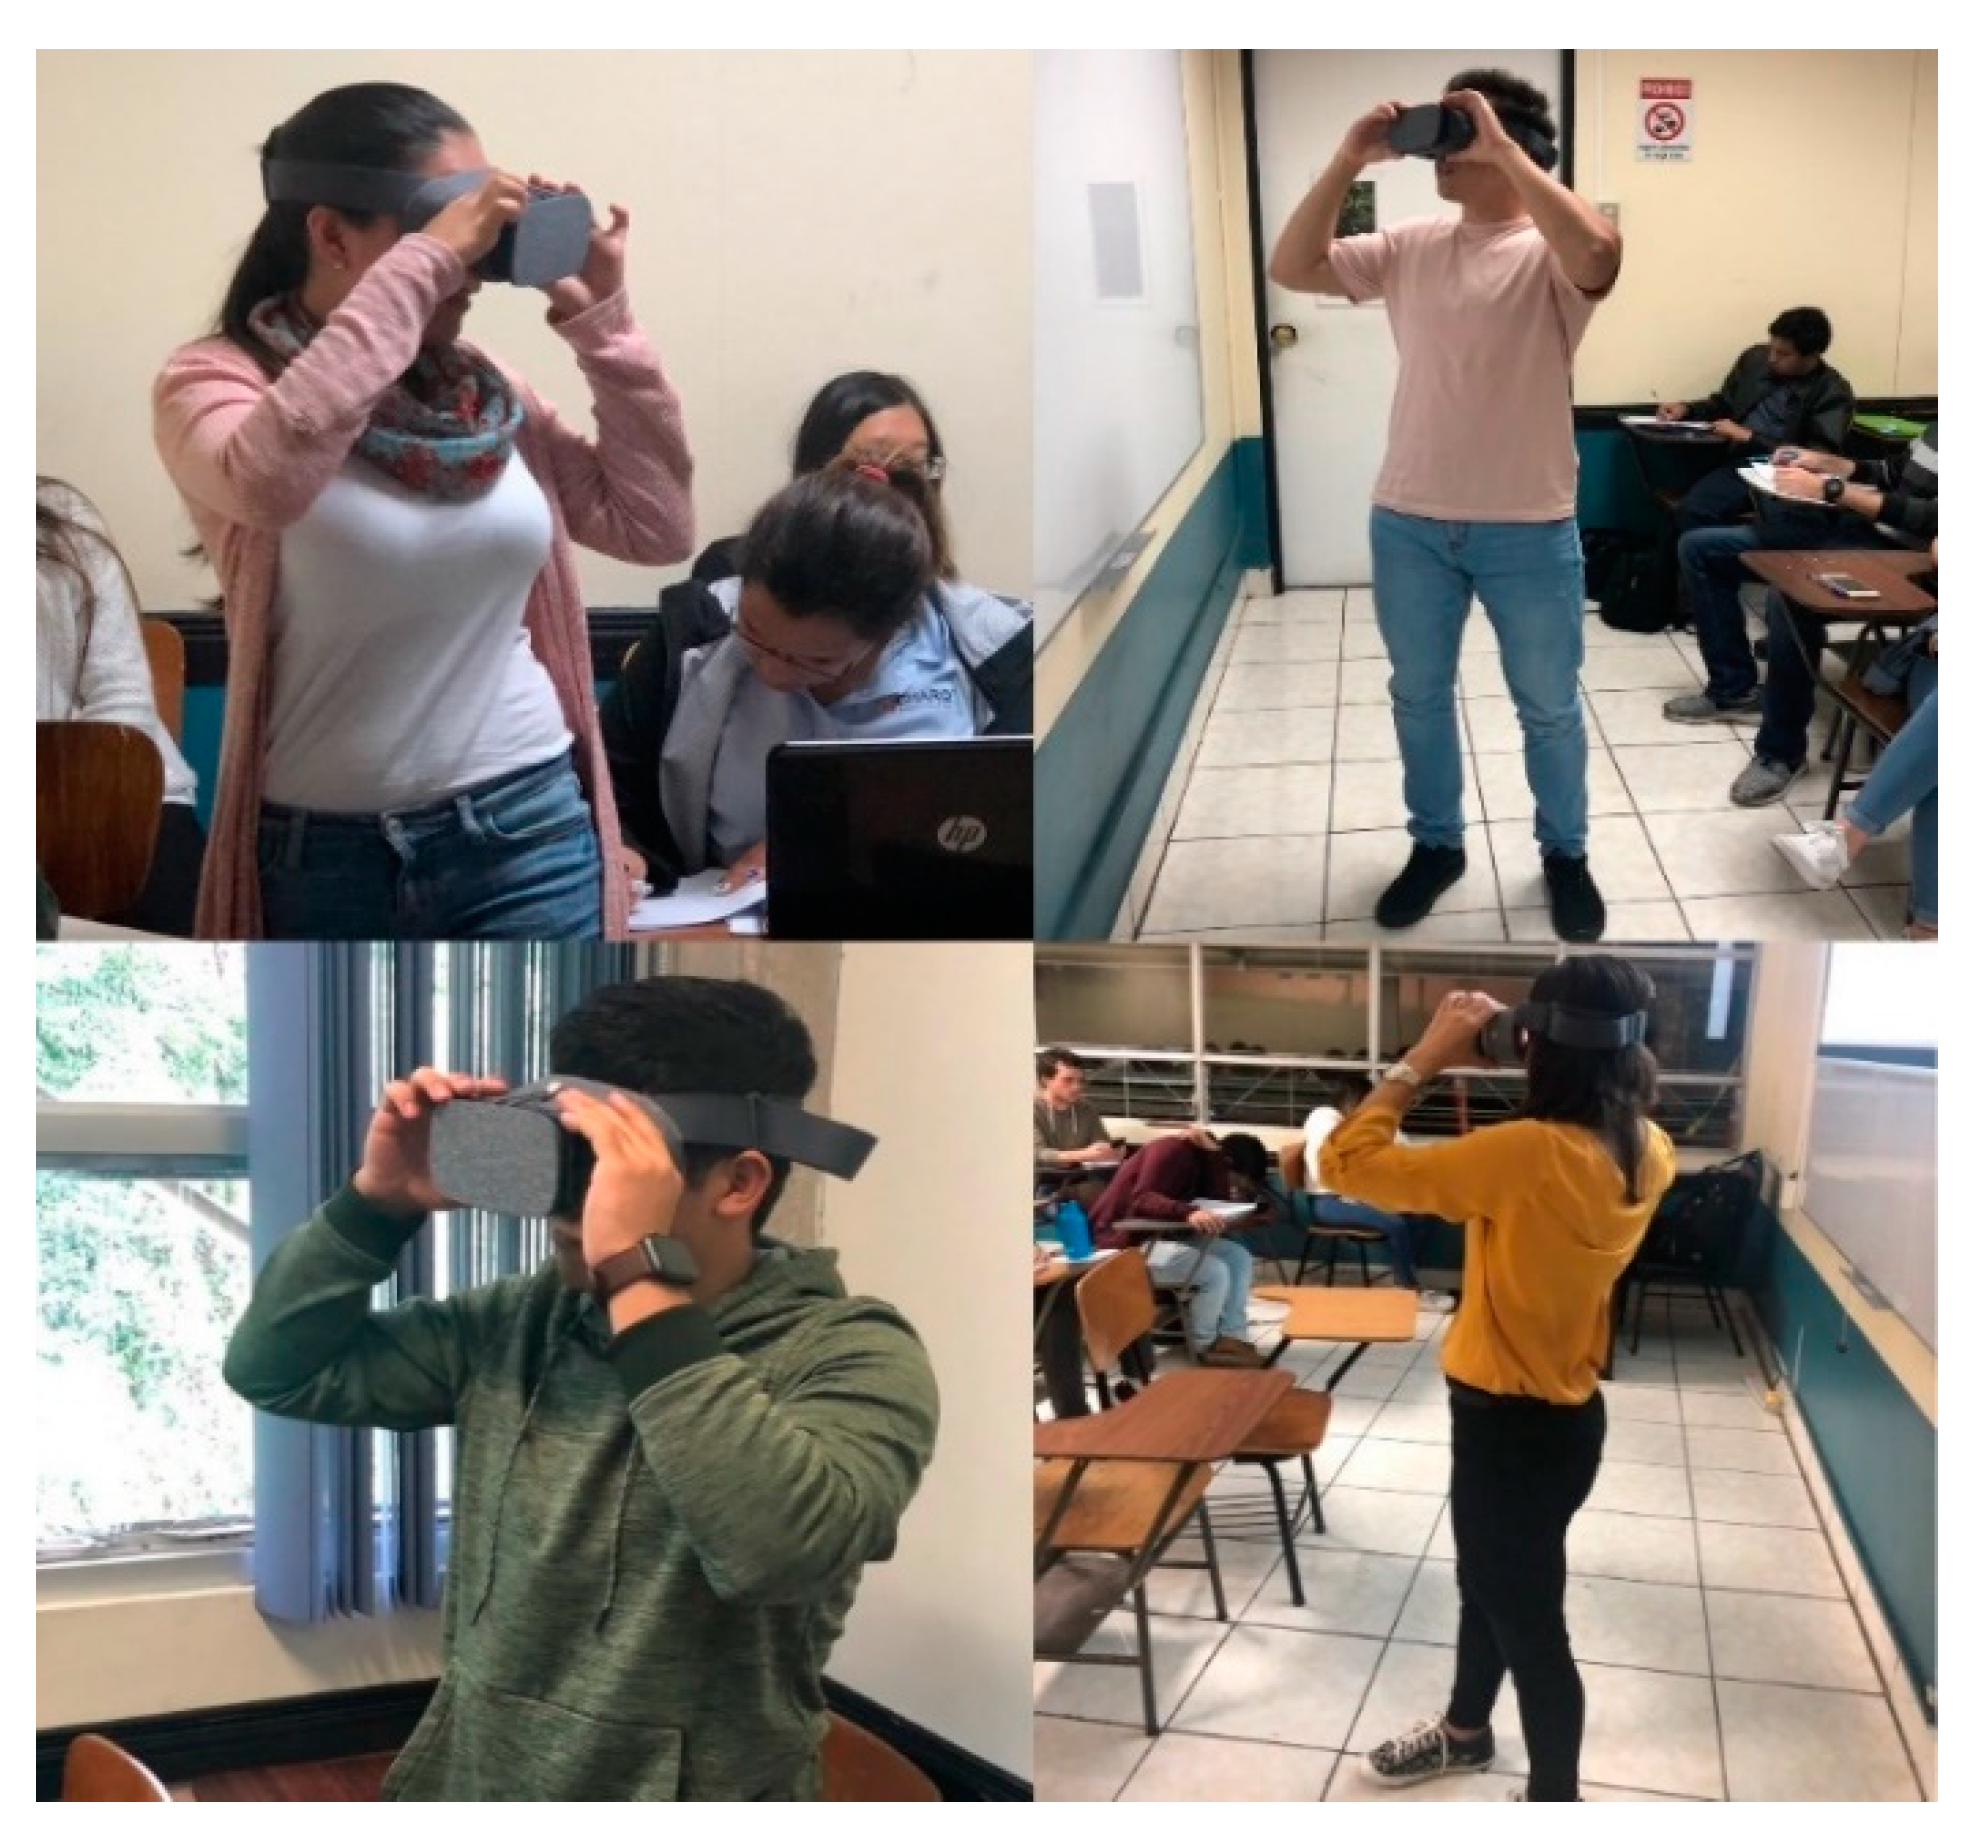
In Figure 6 is shown the participants testing the prototype. The age range was 20–40 years, and the gender distribution were 55% women (45 participants) and 45% men (36 participants).
AttrakDiff evaluations distinguish between pragmatic quality (PQ) and hedonic quality (HQ). Pragmatic factors are, for example, usefulness and usability. Hedonic factors include emotional needs, such as curiosity and identification. The resulting attractiveness is based on the combination of pragmatic and hedonic factors [17].
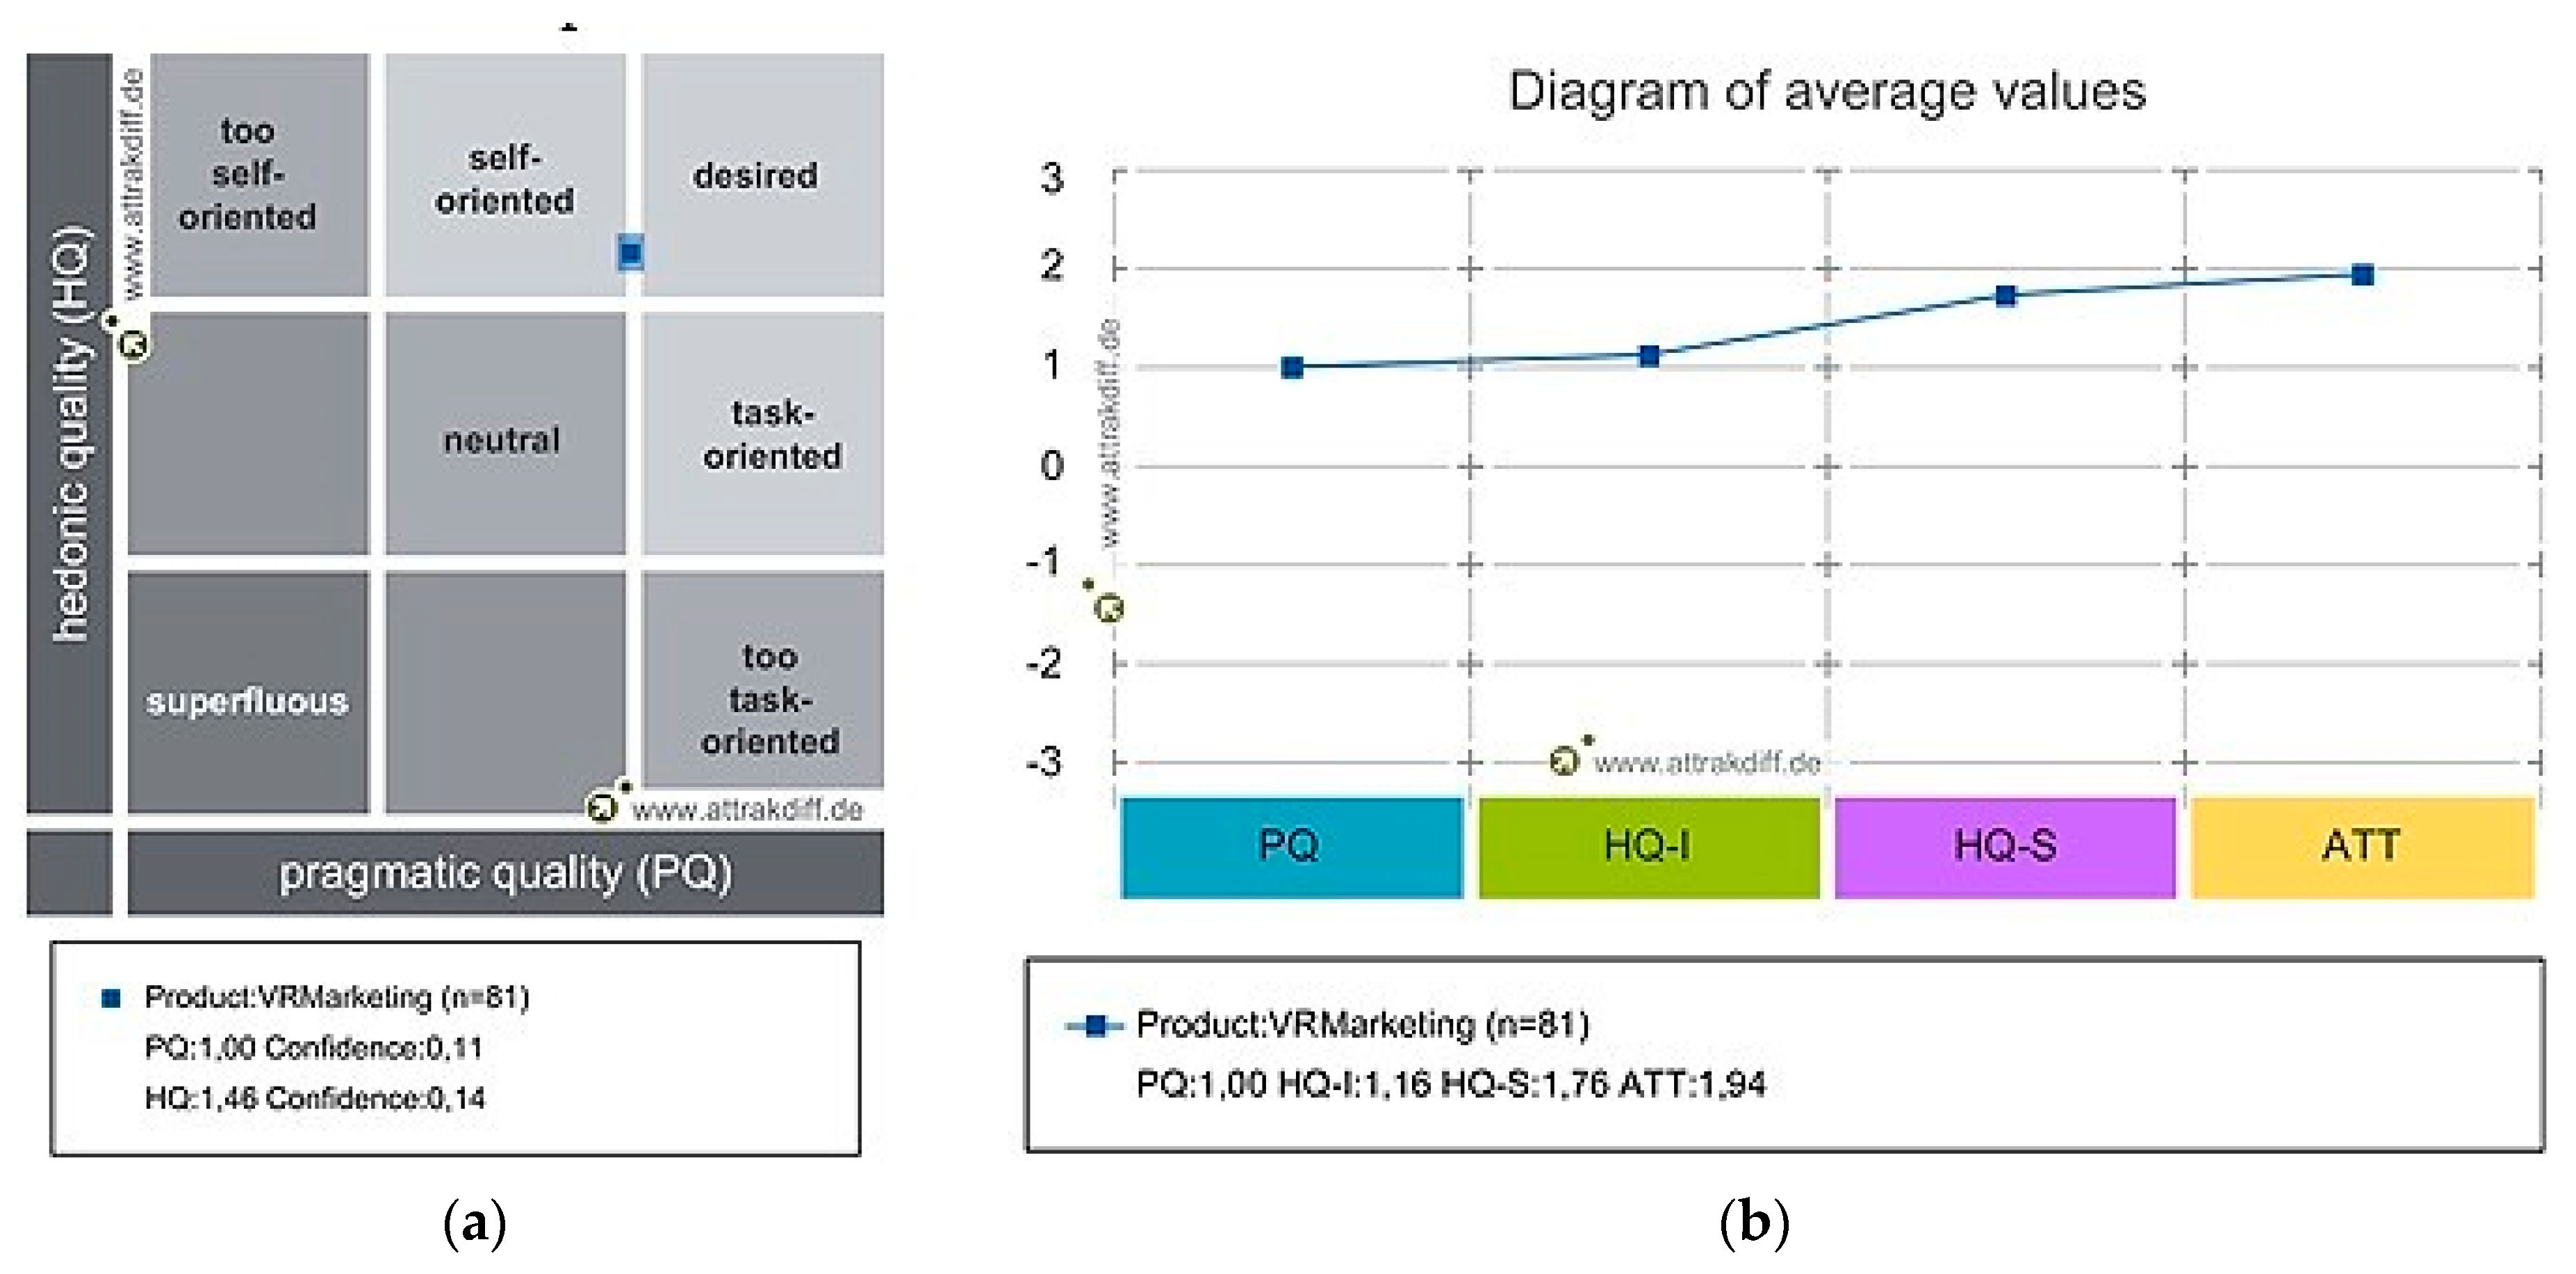
Figure 7a shows the overall results of the evaluation. The confidence rectangle shows that according to user consensus, the hedonic quality almost equal to the pragmatic quality. Furthermore, the confidence rectangle is small, showing little variability among participants. The solution cannot be clearly classified as desirable. However, since this paper present a prototype, we believe that the full product will achieve this state.
The diagram of average values of the AttrakDiff dimensions for the Virtual Reality prototype are plotted in Figure 7b. The diagram distributes the mean values assigned by the participants in the dimensions Pragmatic Quality (PQ), Hedonic Quality—Identity (HQ-I), Hedonic Quality—Stimulation (HQ-S) and Attractiveness (ATT).
The Pragmatic Quality (PQ) indicates the degree of success in achieving the objectives. Figure 7b shows a score of 1.00 in the user experience, indicating that in general, the result is positive but could improve.
On the other hand, Hedonic Quality—Identity (HQ-I) indicates the level of identification of the user with the prototype and obtained a score of 1.16, which is considered acceptable. The Hedonic Quality—Stimulus (HQ-S), which measures whether the experience is original, interesting and stimulating, obtained a score of 1.76, the second highest. Attractiveness (ATT), which indicates how attractive the product is to the user, scored 1.94, the highest classification among the categories.
The results shown in Figure 7b demonstrate that the prototype is attractive and provides an overall stimulant experience to users. However, the pragmatism of the prototype could be improved.
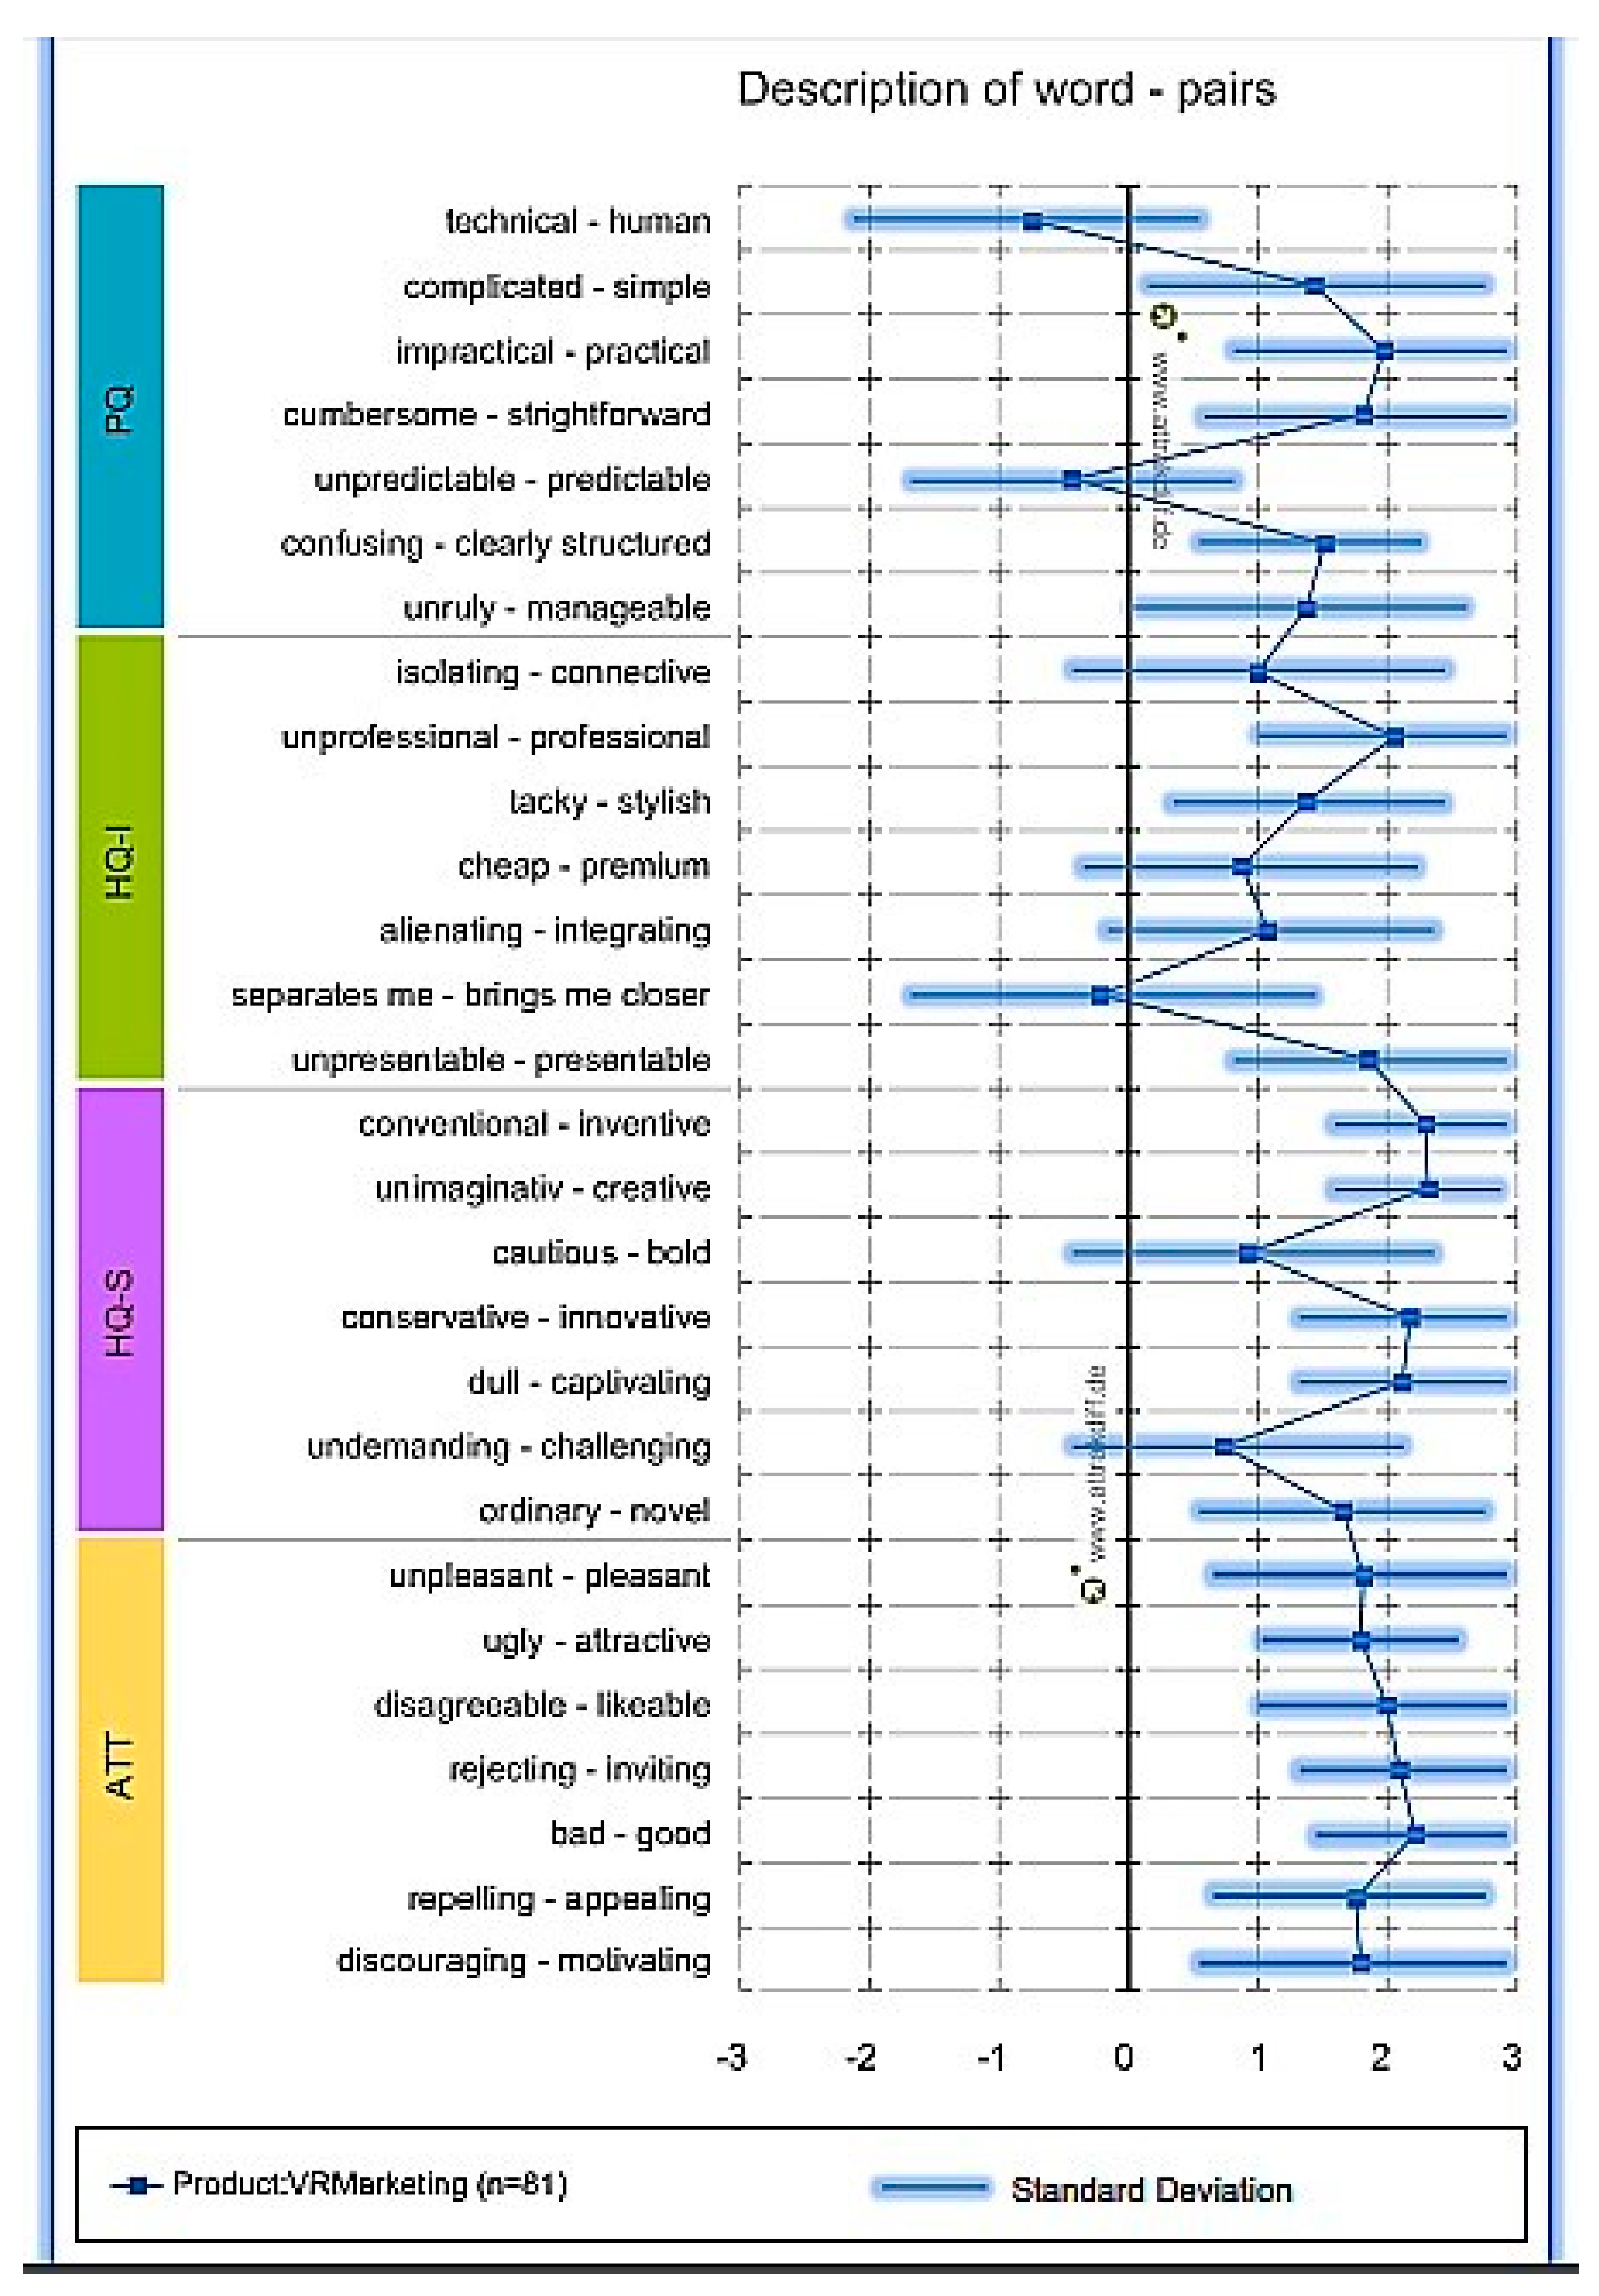
The mean values of the word pairs are presented in Figure 8. Extreme values show which characteristics are critical or are well-resolved. Regarding the prototype´s user experience, Figure 8 shows that the overall results are good or excellent.
Only three dimensions show a possible problem (i.e., “technical-human”, “unpredictable-predictable” and “separates me-brings me closer”). Two of these results were expected. The technicality of the prototype is clear as it introduces technology in a traditionally human field. This also explains that participants believe that the prototype separates them from people.
The unexpected result was the unpredictability of the prototype. However, this could be explained due to the evaluation with participants that are unfamiliar to this type of technologies and are used to a particular way of conducting packaging evaluations. Table 5 shows a summary of the highlighted participant comments.
Unquestionably, 100% of the participants agreed that the prototype could help to improve a market study of product packaging design. In addition, 99% of the participants said that they would use the prototype when executing a market research of product packaging design.
6. Discussion and Conclusions
The main goal of this paper was to design and validate a prototype based on virtual reality, to prove if it is feasible to improve the quality of data collected in a label design process. A storyboard was made to evaluate the idea and a survey based on AttrakDiff was used to evaluate prototype’s user experience and usability. Additionally, questions regarding if the prototype will improve the results of focus group were made. At the end, 128 persons participated in the investigation.
Based on the results from the storyboard’s evaluation, we can certainly conclude that the idea of using a non-traditional interface in label design market research has a lot of potential. The results between Computer Science students and Marketing professors were different in characteristics like excitement, creativeness and efficiency. One of the reasons is because computer science students are used to work with emerging technologies, but also tend to have a more concrete thought, and therefore, they probably didn’t see the potential beyond the storyboard flow. In contrast, Marketing professors could imagine the impact and different uses the prototypes may have in a market research, more than just the flow presented. But both populations agreed that the idea is very innovative and useful.
Besides the product being analyzed, this proposal can be suitable for almost every product, selling toys for kids could be an interesting experiment, to measure their behavior and decisions in a very interactive way.
Additionally, the prototype’s survey results show that the prototype obtained very good rates in pragmatic and hedonic quality. It can be concluded that the prototype’s user experience and usability was quite positive.
In a nutshell, participants mentioned that traditional market research are often tedious and may have a high margin of error. Also, that integrating this prototype will reduce costs of implementation in focus groups or product tests which are normally very expensive.
Furthermore, they affirmed that the prototype will provide a whole context of the product’s environment which possibly enriches the final decision. Most of the participants said that this could revolutionize market research in products and services. Besides, instead of trying to imagine a wrong design, potential customers could concentrate efforts on comparing and choosing right designs. Comments like “I can really see how my product will stand out with the competition” was one of the most relevant. The participants said that creating anticipated experiences about a real product, allows collecting reactions and feedback before launch, which will add a lot of value in market research.
Considering this is the prototype’s first iteration, the results were very satisfactory overall, but a lot of future work can be done after this research. To include sensors, audio and simulate more realistic images are just three of the opportunity areas mentioned by the participants. Also it would be interesting to test the prototype with elderly people who have never used VR before.
As mentioned in the results, 100% of the participants agreed that this prototype will improve the results of label design research in terms of quality of the data collected, which answered the research question that is if it is possible to improve how market research information is collected using non-traditional interfaces. Traditional market research methods like focus groups are good but talking to people in a room is different from understanding how they might behave if they are actually surrounded by the right stimulus. In this case, the right stimulus can be achieved through VR [19].
Author Contributions
Conceptualization, A.B., G.L. and G.M.-R.; Methodology, A.B.; Software, A.B.; Validation, A.B., G.L. and G.M.-R.; Formal Analysis, A.B.; Investigation, A.B.; Resources, A.B., G.L. and G.M.-R.; Data Curation, A.B.; Writing-Original Draft Preparation, A.B.; Writing-Review & Editing, G.M.-R. and G.L.; Visualization, A.B.; Supervision, G.M.-R. and G.L.; Project Administration, A.B.
Acknowledgments
Special thanks to Alejandra López, MBA.
Conflicts of Interest
The authors declare no conflict of interest.
References
- Hague, P.; Harrison, M.; Cupman, J.; Truman, O. Market Research in Practice; Kogan Page: London, UK, 2016; p. 3-1. [Google Scholar]
- Hamersveld, M.; Bont, C. Market Research Handbook, 5th ed.; J. Wiley & Sons: Chichester, UK, 2008; pp. 381–401. [Google Scholar]
- Mansell, I.; Bennett, G.; Northway, R.; Mead, D.; Moseley, L. The learning curve: the advantages and disadvantages in the use of focus groups as a method of data collection. Nurse Res. 2004, 11, 79–88. Available online: https://journals.rcni.com/nurse-researcher/the-learning-curve-the-advantages-and-disadvantages-in-the-use-of-focus-groups-as-a-method-of-data-collection-nr2004.07.11.4.79.c6217 (accessed on 10 March 2019). [CrossRef] [PubMed]
- Breen, R. A Practical Guide to Focus-Group Research. J. Geogr. High. Educ. 2006, 30, 463–475. [Google Scholar] [CrossRef]
- McDaniel, C.; Gates, R. Marketing Research, 9th ed.; John Wiley & Sons Inc.: New York, NY, USA, 2012; pp. 130–132. [Google Scholar]
- Sethna, Z.; Blythe, J. Consumer Behaviour, 3rd ed.; SAGE Publications: London, UK, 2016; pp. 426–427. [Google Scholar]
- Brenes, A. Non-Traditional Interfaces Used in Market Research: A Literature Review, JOCICI. Available online: https://revistas.tec.ac.cr/index.php/memorias/article/view/4521/4092 (accessed on 25 September 2019).
- Suzuki, K.; Nishiuchi, N.; Park, M.K. Modeling of Purchasing Behavior for Application on Merchandise Display and Package Design. In Proceedings of the HCI International 2011, Orlando, FL, USA, 9–14 July 2011; Springer: Berlin/Heidelberg, Germany, 2011. [Google Scholar]
- Raheem, A.R.; Vishnu, P.; Ahmed, A.M. Impact of Product packaging on consumer’s buying behavior. Eur. J. Sci. Res. 2014, 122, 125–134. Available online: https://www.researchgate.net/publication/263652021_IMPACT_OF_PRODUCT_PACKAGING_ON_CONSUMER’S_BUYING_BEHAVIOR (accessed on 9 March 2019).
- Van Kerrebroeck, H.; Brengman, M.; Willems, K. When brands come to life: experimental research on the vividness effect of Virtual Reality in transformational marketing communications. Virtual Real. 2017, 21, 177–191. [Google Scholar] [CrossRef]
- Affdex for Market Research. Available Online: http://www.affectiva.com/product/affdex-for-market-research (accessed on 17 March 2019).
- Ayanoğlu, H.; Rebelo, F.; Duarte, E.; Noriega, P.; Teixeira, L. Using Virtual Reality to Examine Hazard Perception in Package Design. In Design, User Experience, and Usability; Marcus, A., Ed.; Springer: Berlin/Heidelberg, Germany, 2018. [Google Scholar]
- Vaishnavi, V.; Kuechler, W. Design Science Research Methods and Patterns, 2nd ed.; CRC Press: Boca Raton, FL, USA, 2015. [Google Scholar]
- Truong, K.; Hayes, G.; Abowd, G. Storyboarding: an empirical determination of best practices and effective guidelines. In Proceedings of the 6th Conference on Designing Interactive Systems, University Park, PA, USA, 26–28 June 2006; ACM: New York, NY, USA, 2006. [Google Scholar]
- Unreal Engine. Available online: https://www.unrealengine.com/en-US/ (accessed on 17 April 2019).
- Blueprints Visual Scripting. Available Online: https://docs.unrealengine.com/en-US/Engine/Blueprints/index.html (accessed on 23 September 2019).
- AttrakDiff. Available online: http://www.attrakdiff.de/ (accessed on 17 April 2019).
- Bogdan, C.; Gulliksen, J.; Sauer, S.; Forbrig, P.; Winckler, M.; Johnson, C.; Palanque, P.; Bernhaupt, R.; Kis, F. (Eds.) Human-Centered and Error-Resilient Systems Development. In Proceedings of the 6th International Conference on Human-Centered Software Engineering, Stockholm, Sweden, 29–31 August 2016. [Google Scholar]
- How Virtual Reality Will Change Market Research. InterQ Research. Available online: http://interq-research.com/how-virtual-reality-will-change-market-research/ (accessed on 12 May 2019).
Figure 1.
Storyboard made to represent the idea and the future prototype interaction flow.

Figure 2.
Label designs options to select in the prototype.

Figure 3.
Prototype´s interface: The images at the top show how the label design selection looks like, also the images at the bottom show the supermarket environment.
Figure 3.
Prototype´s interface: The images at the top show how the label design selection looks like, also the images at the bottom show the supermarket environment.

Figure 4.
Word cloud created with the characterization given by participants in the idea’s evaluation. (a) Computer Science Graduate Students word cloud; (b) Marketing professors word cloud.
Figure 4.
Word cloud created with the characterization given by participants in the idea’s evaluation. (a) Computer Science Graduate Students word cloud; (b) Marketing professors word cloud.

Figure 5.
Storyboard Evaluation Results.

Figure 6.
Prototype evaluation.

Figure 7.
AttrakDiff General Result. (a) Portfolio of results; (b) Diagram of average values.

Figure 8.
AttrakDiff Individual Results for each dimension.


Table 1.
Storyboard evaluation structure.
| Participants | Stimuli | Procedure |
|---|---|---|
| Thirty five Computer Science graduate students first and then, in a separate session, with 12 Marketing professors of the University of Costa Rica. Participants were selected from these two populations due to their expertise in IT and in Marketing. |
|
|
Table 2.
Prototype evaluation structure.
| Participants | Stimuli | Procedure |
|---|---|---|
| Eighty one Business Administration graduate students as the potential final users. |
| The evaluation was conducted with three different groups in the same day (one in the morning, one in the afternoon and one at night).
|
Table 3.
Distribution of Participants in the Idea Evaluation.
| Type of Participant | # Participants | Average Age | Standard Deviation | Women | Men |
|---|---|---|---|---|---|
| Computer Science Students | 35 | 25 | 6 | 17% | 83% |
| Marketing Professors | 12 | 46 | 8 | 58% | 42% |
Table 4.
Summary of participant comments.
| Type of Participant | Comments |
|---|---|
| Computer science students |
|
| Marketing professors |
|
Table 5.
Summary of participant comments.
| Main Idea | Comments |
|---|---|
| Comparison with traditional market research |
|
| Prototype’s strengths |
|
| Prototype’s improvement opportunities |
|
Publisher’s Note: MDPI stays neutral with regard to jurisdictional claims in published maps and institutional affiliations. |
© 2019 by the authors. Licensee MDPI, Basel, Switzerland. This article is an open access article distributed under the terms and conditions of the Creative Commons Attribution (CC BY) license (https://creativecommons.org/licenses/by/4.0/).
Share and Cite
MDPI and ACS Style
Brenes, A.; Marín-Raventós, G.; López, G. Improving Packaging Design Using Virtual Reality in the Market Research Process. Proceedings 2019, 31, 12. https://doi.org/10.3390/proceedings2019031012
AMA Style
Brenes A, Marín-Raventós G, López G. Improving Packaging Design Using Virtual Reality in the Market Research Process. Proceedings. 2019; 31(1):12. https://doi.org/10.3390/proceedings2019031012
Chicago/Turabian StyleBrenes, Ana, Gabriela Marín-Raventós, and Gustavo López. 2019. "Improving Packaging Design Using Virtual Reality in the Market Research Process" Proceedings 31, no. 1: 12. https://doi.org/10.3390/proceedings2019031012