
Separation and Rectification of Chloroacetyl Chloride from TiCl4


1
College of Materials and Chemistry & Chemical Engineering, Chengdu University of Technology, Chengdu 610059, China
2
State Key Laboratory of Vanadium and Titanium Resources Comprehensive Utilization, Pangang Group Research Institute Co. Ltd., Panzhihua 617000, China
3
National Engineering Laboratory for Vacuum Metallurgy, Kunming University of Science and Technology, Kunming 650093, China
*
Authors to whom correspondence should be addressed.
Processes 2021, 9(2), 287; https://doi.org/10.3390/pr9020287
Submission received: 22 December 2020
/
Revised: 28 January 2021
/
Accepted: 29 January 2021
/
Published: 2 February 2021
(This article belongs to the Section Process Control and Monitoring)
Abstract
:Titanium tetrachloride (TiCl4) is an important intermediate material for the preparation of titanium products. The organic impurities in TiCl4 are easily accumulated during the production of titanium sponges due to the problems of imperfect detection methods and the lack of effective control methods, resulting in a poor quality of sponge titanium. Among all impurities, chloroacetyl chloride (CAC) is the most important in TiCl4. Herein, the determination of the CAC content in TiCl4 solution, with a low detection limit of 0.633 ppm, was established by the standard addition method using Fourier transform infrared (FTIR) spectrometry. This test method presented good repeatability, excellent accuracy, and moderate precision. Furthermore, the influencing factors of CAC separation in the continuous rectification process, including the heating power (the ratio of total heating power to feed rate), reflux temperature, top tower pressure, and feed temperature were optimized based on an orthogonal experimental design. The experimental data demonstrated that the average CAC removal rate reached 78.94% ± 1.00% under the optimal distillation conditions, with 72.21% of the CAC removed via the off-gas system. Therefore, excellent control of the negative pressure of the tail gas is highly desirable for the removal of CAC impurities.
1. Introduction
Titanium tetrachloride (TiCl4) is an important raw material for the production of titanium dioxide (TiO2) and metallic titanium (Ti) [1,2,3,4]. Currently, the industrial production of TiCl4 is mainly realized by the molten salt chlorination and fluid bed chlorination processes [5,6]. However, TiCl4 products (crude TiCl4, CTT) cannot be directly applied to produce TiO2 or metallic Ti due to the presence of impurities. Based on their boiling points, the impurities in CTT can be divided into three categories: high-, low-, and close-boiling-point compounds. High-boiling-point substances such as FeCl3 and AlCl3 can be removed by distillation or sedimentation, whereas low-boiling-point substances such as SiCl4 can be separated by rectification. The removal of close-boiling-point substances such as VOCl3 requires chemical reaction and purification under distillation conditions [7,8,9,10].
However, the traces of carbonaceous and oxygenic impurities such as chloroacetyl chloride (CAC), dichloracetyl chloride (DCAC), trichloroacetyl chloride (TCAC), carbon disulfide (CS2), titanium oxychloride (TiOCl2), and carbon dioxide (CO2) in purified TiCl4 are difficult to detect by the existing methods, because TiCl4 can easily react with moisture in the air to form corrosive hydrogen chloride gas. These impurities are accumulated during the production of Ti sponges and severely affect the product quality. Thus, it is necessary to strictly control the content of carbon and oxygen in purified TiCl4, requiring the development of novel methods to detect the content of these impurities.
It has been reported that most carbonaceous and oxygenic impurities can be determined by infrared spectroscopy (IR). For instance, Bruno et al. [11] and Song et al. [12] have employed IR to measure the content of TiOCl2 in TiCl4 solution. Similarly, the contents of CO2, CAC, DCAC, and TCAS can also be determined by IR [13,14,15]. However, the IR-based measurement systems are still disadvantageous in terms of device design and accuracy. Moreover, the separation behavior and influencing factors of the impurities during the purification process are still unclear.
Herein, we propose a simple and cost-effective CAC detection system, and evaluate the separation behavior of CAC during refinement. The results reveal that the CAC content in TiCl4 can be rapidly and accurately determined by Fourier transform infrared spectroscopy (FTIR), and the major portion of CAC can be removed during the rectification process. Under optimal processing conditions, the CAC impurities in purified TiCl4 were found to be 7.16 ppm, making it a high-quality feedstock for the production of titanium sponges.
2. Experimental Section
2.1. Standard Sample Preparation
Firstly, 0.2 g of CAC (Sinopharm Chemical Reagent Co., Ltd., Shanghai, China) was weighed and added into 1000 g of TiCl4 (Analytical grade, Daomao Chemical Reagent Factory, Tianjin, China) to prepare a standard solution with a CAC concentration of 200 ppm. Then, the as-prepared solution was diluted to the CAC concentrations of 6.25 ppm, 12.50 ppm, 25.0 ppm, 50 ppm, and 75 ppm, using pure TiCl4.
2.2. Determination of CAC in TiCl4 Solution
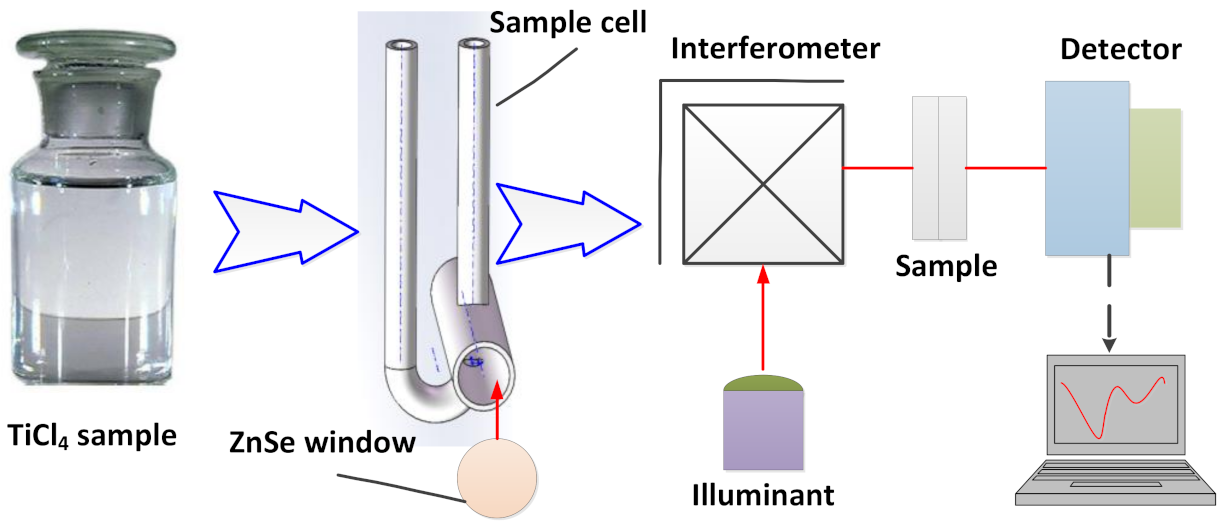
The sample cell was composed of a quartz tube, with an inner diameter of 8 mm and a length of 50 mm, and two pieces of ZnSe window, each with a diameter of 10 mm and a thickness of 2 mm. There were two thin tubes for both feeding and exhaust, each with an inner diameter of 1 mm. Dried ZnSe windows were glued to both ends of the quartz tube with AB glue, while ensuring the glue did not contaminate the sample. To prevent the influence of AB glue on the test, excessive amounts of AB glue should not be used. After natural drying for 30 min, 5 mL of as-prepared solution was added into the sample cell to check for sealing. Since there was no leaking, 5 mL of as-prepared solution was further added into the sample cell, and cotton balls were used to block the feeding and exhaust ports to prevent hydrolysis; otherwise, the sample cell would have required modification.
The CAC content in TiCl4 solution was determined by Fourier transform infrared spectrometer (FTIR, Nicolet iS50, Thermo Fisher Scientific, Massachusetts, USA), and data processing was performed using OMNIC 8 software. The spectral resolution, data spacing, and scanning range were 4 cm−1, 2 cm−1, and 1000–4000 cm−1, respectively. A background scan was measured with the blank sample cell. Then, the IR spectra of different CAC concentrations were determined. The schematic diagram of the equipment is shown in Figure 1.
According to the Lambert–Beer law [16], the relationship between the characteristic peak intensity and concentration of CAC can be given as:
where A represents the characteristic peak intensity, denotes the absorption coefficient, b refers to the length of sample cell, and c corresponds to CAC content.
2.3. Separation of CAC Impurities
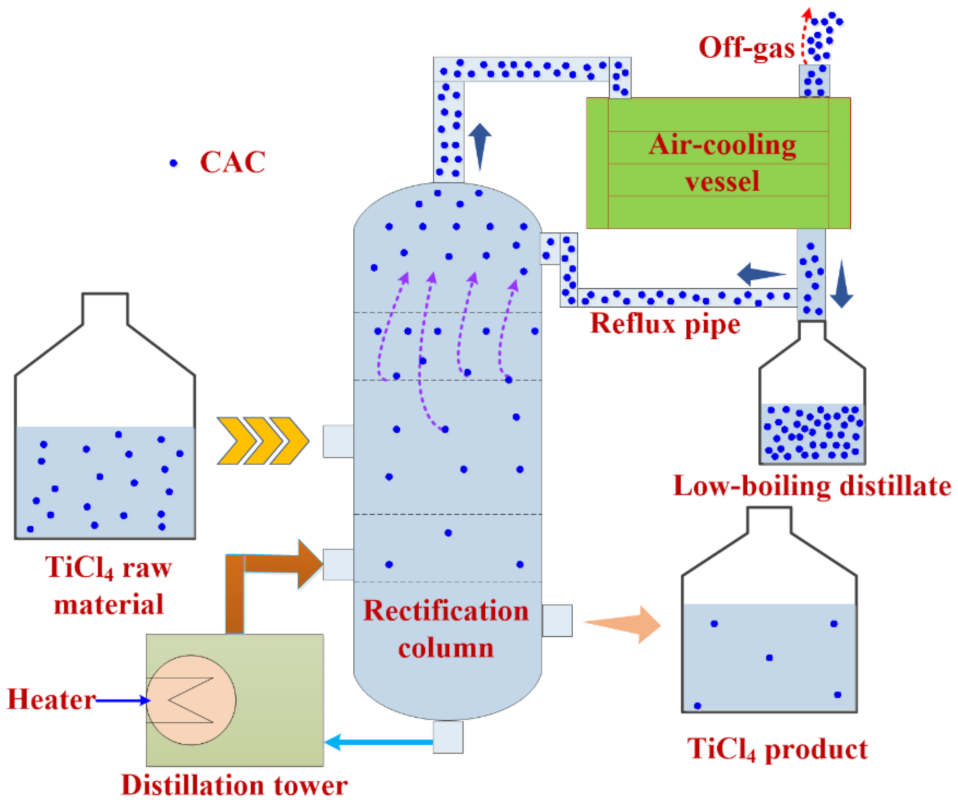
Distillation is an important and energy-consuming process used to separate liquid mixtures. Herein, the removal of CAC impurities was carried out using an industrial-scale rectification system. This equipment consisted of several major components, including an evaporation tower, a rectification column, an air-cooling vessel, and a low-boiling distillate (LBD) collecting tank. The holding capacity and installation power of the distillation tower were 8.83 m3 and 1200 kW, respectively. The main purpose of the electric heater is to form vertical upward steam during the rectification process. When the feed rate of TiCl4 reached 12 t/h, the heat power of the heater was controlled at 1200 kW, which means the ratio of total heating power to feed rate was 100 kW t−1. The rectification column, with a diameter of 1200 mm and a height of 15,740 mm, contained 44 pieces of sieving plates, with the feeding port located on the 22nd plate. The air-cooling vessel, with an area of 32 m2, possessed a capacity of 2 m3. The schematic diagram of the equipment is shown in Figure 2.
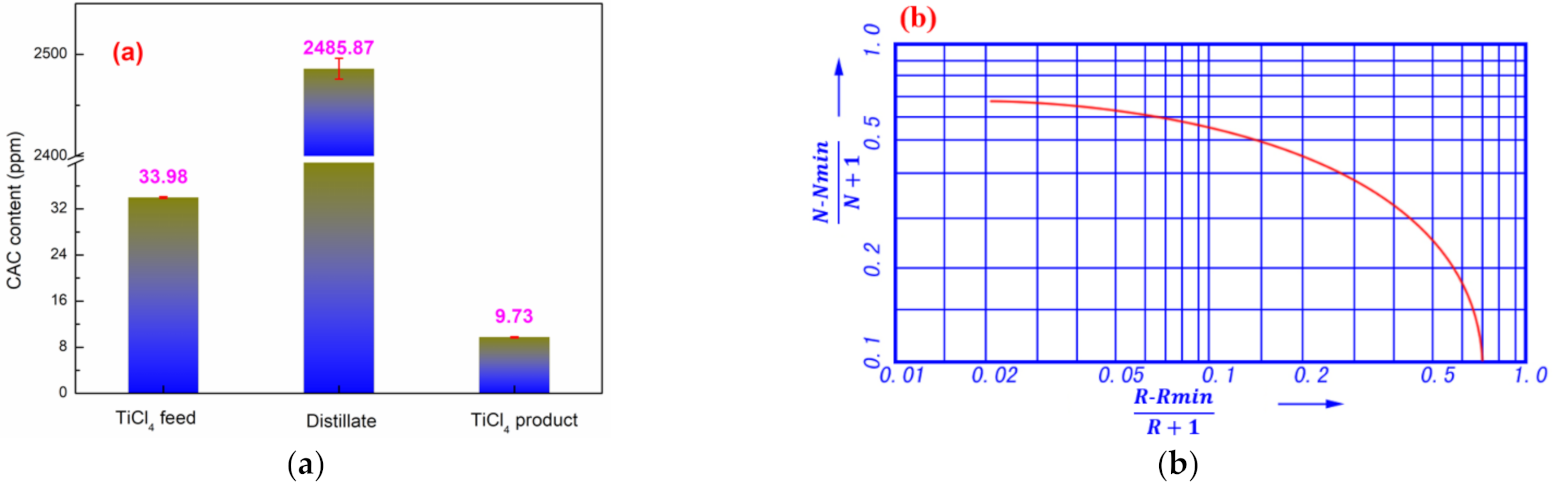
The boiling point of TiCl4 is higher than that of CAC, which is suitable for the distillation process. The separation coefficient of CAC to TiCl4, however, is relatively small (3.8) [17,18]. Thus, it was necessary to estimate whether the sieving plates could meet the requirements for CAC removal. Figure 3a shows that when the process of chlorination and purification remained stable, the CAC content in TiCl4 feed, distillate, and TiCl4 product were 33.98 ± 0.15 ppm, 2485.87 ± 10.20 ppm, and 9.73 ± 0.11 ppm, respectively.
The reflux ratio and theoretical plate number of rectification column can be given as [19,20]:
where , , and represent the mole fraction of CAC in TiCl4 raw material, distillate, and TiCl4 product, respectively; , , and denote the mass fraction of CAC in TiCl4 raw material, distillate, and TiCl4 product, respectively; , , and denote the mass fraction of CAC in TiCl4 raw material, distillate, and TiCl4 product, respectively; , , and refer to the mass fraction of TiCl4 in raw material, distillate, and product, respectively; and denote the molar mass of CAC and TiCl4, respectively; represents the mole fraction of CAC in the gas phase during the vapor–liquid equilibrium; and denotes the separation coefficient of CAC to TiCl4. K represents reflux excessive coefficient, 1.5; denotes the minimum number of theoretical plates; represents the actual reflux ratio, and corresponds to the minimum reflux ratio.
Some calculation results for Equations (2)–(8) are shown in Table 1. Combining these with the Gillian correlation diagram (Figure 3b), the theoretical plate number of the rectification column is 7.31. On the basis of production experience [17], the plate efficiency is approximately 0.25, and the total number of trays is 7.31/0.25 ≈ 30, which is much less than 44. This suggests that the rectification column could satisfy the requirements of production; however, distillation efficiency is low. In general, the removal efficiency of the low-boiling-point substances, including CAC, is affected by the quality of raw materials, feed rate, reflux ratio (the ratio of reflux flow to outlet flow on the top of the tower), reflux pipe temperature, heating power, top pressure of the rectification tower, and feed temperature [21,22,23,24]. The reflux pipe temperature and top pressure were controlled by the air-cooling vessel and the tail gas fan, respectively. Therefore, an orthogonal design, based on an efficient, fast, and cost-effective experimental method [25], was employed to investigate the removal efficiency of CAC. The whole test was designed with an orthogonal array of L16 (45), which indicates that the experiment consisted of 4 levels, 5 factors, and 16 orthogonal tails (i.e., heating power per ton of TiCl4 (50, 65, 85, and 100 kW t−1), reflux ratio (30%, 40%, 50%, and 60%), reflux temperature (90, 100, 110, and 120 °C), top pressure of rectification tower (−2, 0, 2, and 4 kPa), and feed temperature (80, 95, 110, and 125 °C)). Each group of experiments was stably operated for 8 h and samples were collected every 2 h.
As the CAC concentration of the LBD was very high, it was diluted twice with a certain amount of pure TiCl4. The removal efficiency of CAC can be given as:
where represents the removal efficiency, refers to the CAC content in the raw material, and denotes the CAC content in the rectification product.
3. Results and Discussion
3.1. CAC Determination
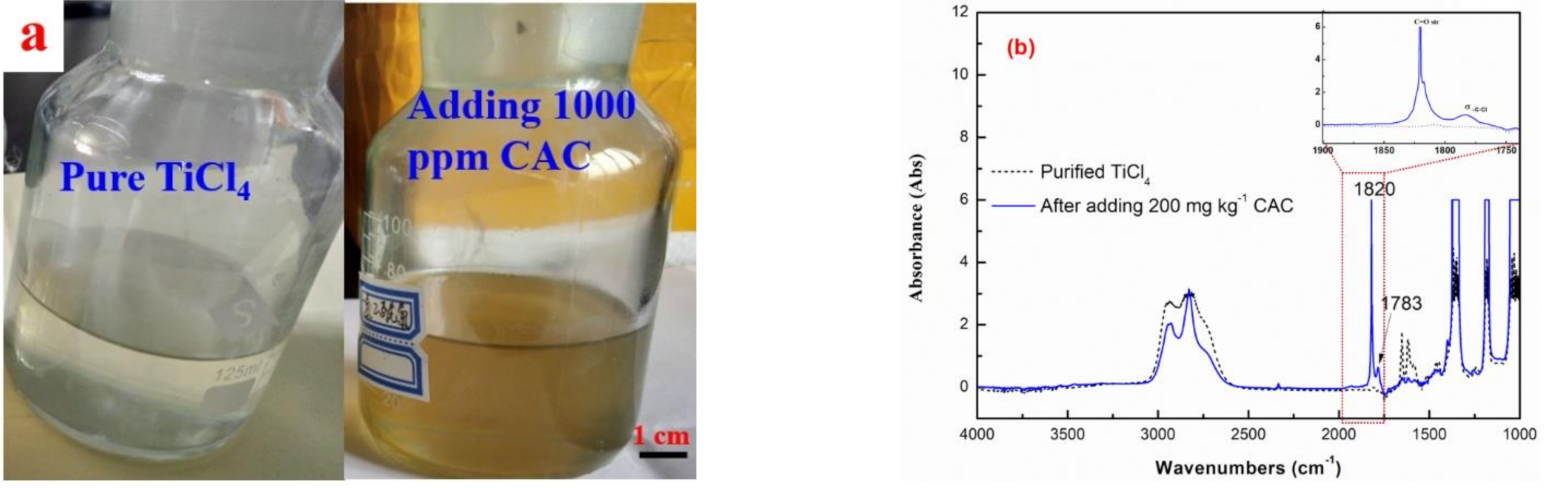
In order to study the effect of CAC impurity on the color of TiCl4 solution, a certain amount of CAC was added into pure TiCl4. It was found that the color of TiCl4 product changed from transparent to yellowish after the addition of 1000 ppm CAC (shown in Figure 4a). This suggests that CAC impurities have a significant impact on the color of TiCl4 products, because CAC impurity has good chemical stability in TiCl4 solution and does not decompose easily under ordinary light and heat conditions, as reported by Yang et al. [11]. Figure 4b shows that the intensity of characteristic peaks, located at 1820 cm−1 and 1783 cm−1, increased significantly after the addition of CAC (200 ppm) into pure TiCl4. However, the intensity of the peak at 1783 cm−1 is only 0.65 Abs, much smaller than that of the peak at 1820 cm−1. This is because the first peak at 1820 cm−1 is the C=O stretching vibration of CAC, while the second peak at 1783 cm−1 is the result of Fermi resonance interaction between the C=O and =C-Cl stretching vibrations [26]. Hence, the peak at 1820 cm−1 was used as a characteristic peak for CAC detection.
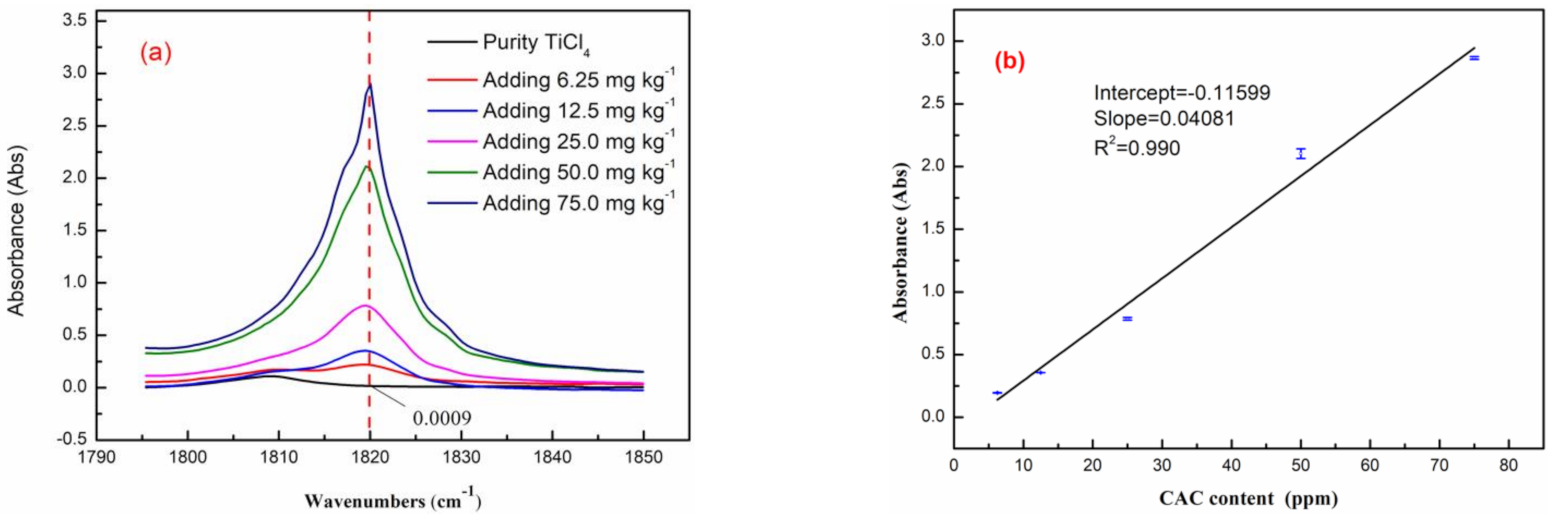
Figure 5a presents the influence of CAC content on FTIR spectra. Overall, the intensity of the characteristic peak, located at 1820 cm−1, increases with increasing CAC content. Since the characteristic peak intensity of pure TiCl4 is close to zero (0.009 Abs), all the determination results of CAC peak intensity are based on zero. The relationship between the characteristic peak intensity and CAC concentration is presented in Figure 5b, which shows that the CAC content (x) is linearly related to the characteristic peak intensity (y), as given below:
According to the Lambert–Beer law (Equation (1)), y ~ x should be a straight line passing through the origin. However, the y-intercept value of −0.11599 indicates that other impurities in pure TiCl4 may affect the results.
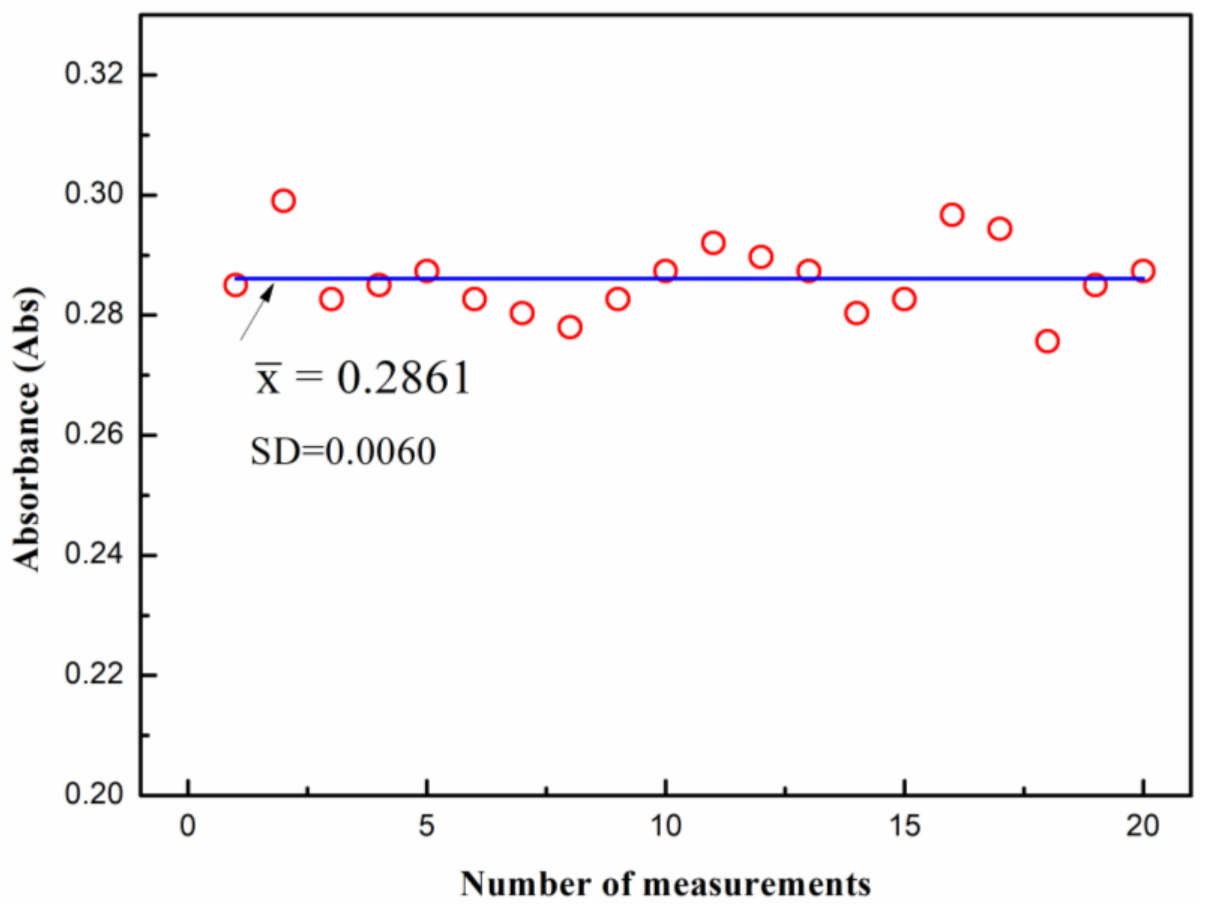
A TiCl4 sample containing 10 ppm of CAC, was prepared, and the measurements were repeated 20 times to determine the detection limit. Figure 4 shows that the characteristic peak intensity of CAC was relatively stable with increasing measurement times. The fluctuation of the peak intensity values may have been caused by experimental error. The detection limit of CAC can be calculated according to Equation (11) [27]:
where CL represents the detection limit, SD refers to the standard deviation, C denotes the CAC content in TiCl4, and represents the average values of repeated measurements.
Based on Figure 6 and Equation (11), the detection limit of CAC was found to be 0.633 ppm. To determine the precision of the proposed method, three batches of production samples were analyzed by FTIR. Table 2 shows that the relative standard deviation (RSD) remained lower than 2%, which indicates good repeatability and moderate precision [28,29].
To further evaluate the accuracy of the detection limit, the standard addition–recovery test was carried out using the refined TiCl4. The results are shown in Table 3, where the mass ratio of the sample to the CAC standard solution was 1:1. The recovery of added standard can be calculated via Equation (12):
where represents the recovery rate, denotes the mass fraction of CAC in TiCl4 standard solution, refers to the added amount of CAC standard solution, represents the mass fraction of TiCl4 sample, denotes the CAC sample weight, and corresponds to the CAC content after addition of the standard solution.
It can be seen from Table 3 that the recovery rate of the standard addition–recovery test ranged from 95.2% to 105.3%. Recovery rates exceeding 100% are most likely caused by detection and operation error. Thus, this method has excellent accuracy [30].
Table 4 shows the comparison results of CAC detection in TiCl4 between this work and other literature reports. The correlation coefficient and detection limit in this work are better than those reported by Yang et al [13], though both studies used the same characteristic peak. However, the characteristic peak has obvious differences between IR and FTIR, although the detection limits are close. The above results suggest that the CAC determination method proposed in this work has good repeatability, excellent accuracy, and moderate precision.
3.2. Factors Influencing CAC Removal
Table 5 shows the factors and levels of the orthogonal design of the experiment for CAC removal efficiency. K1, K2, K3, and K4 are the average values of the specific removal efficiency during different test conditions, and R corresponds to the extreme difference analysis, where a large value of R represents the large contribution of a certain factor to CAC removal efficiency and vice versa [31]. Table 4 shows that the CAC removal efficiency is mainly influenced by the heating power, followed by reflux temperature, feed temperature, and tower top pressure.
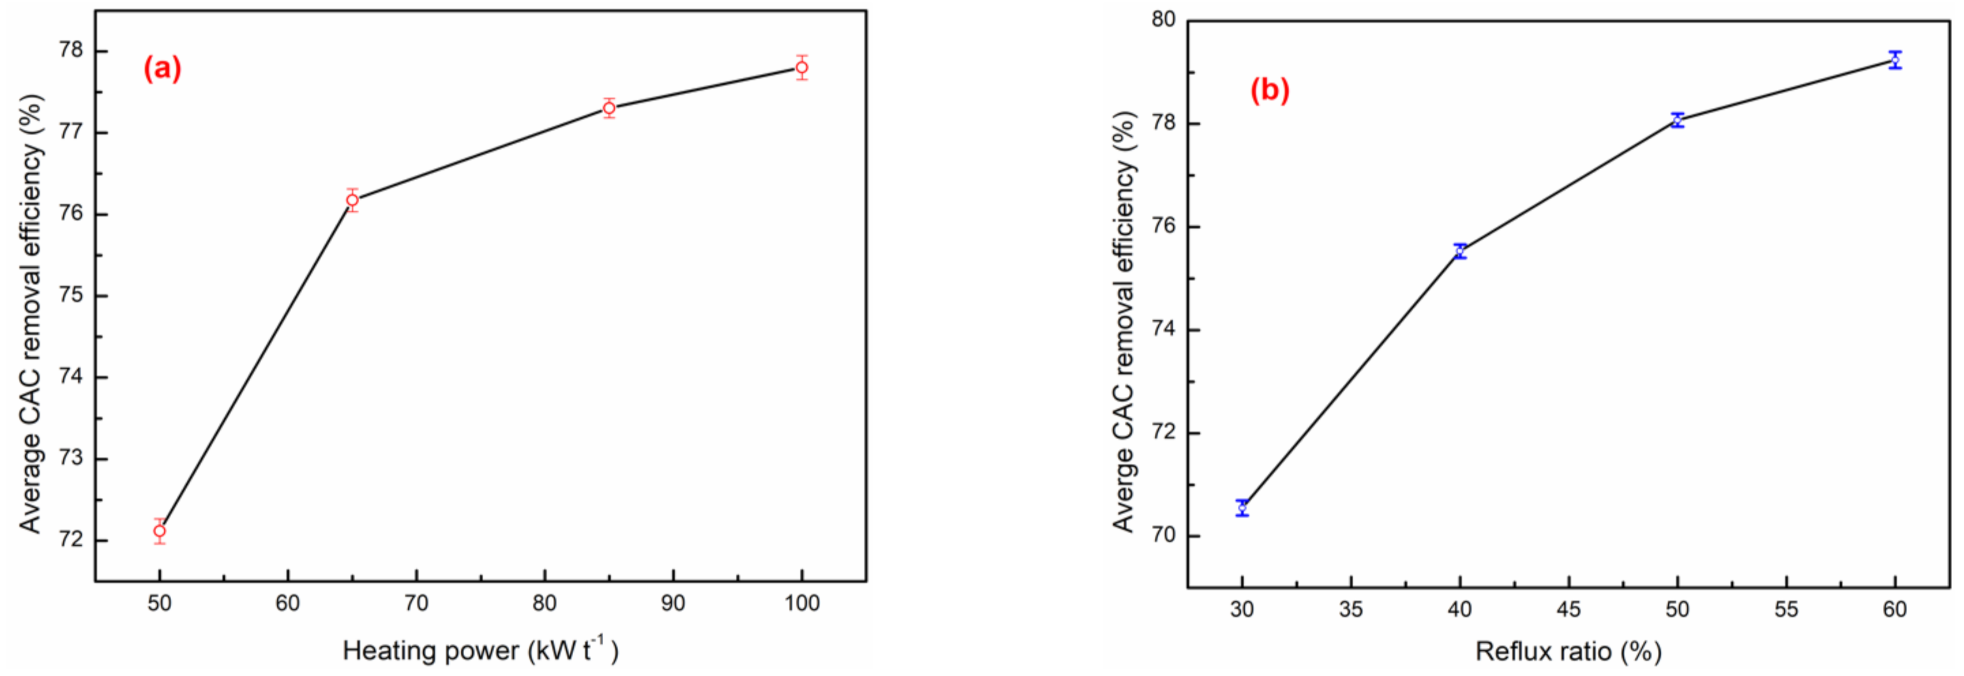
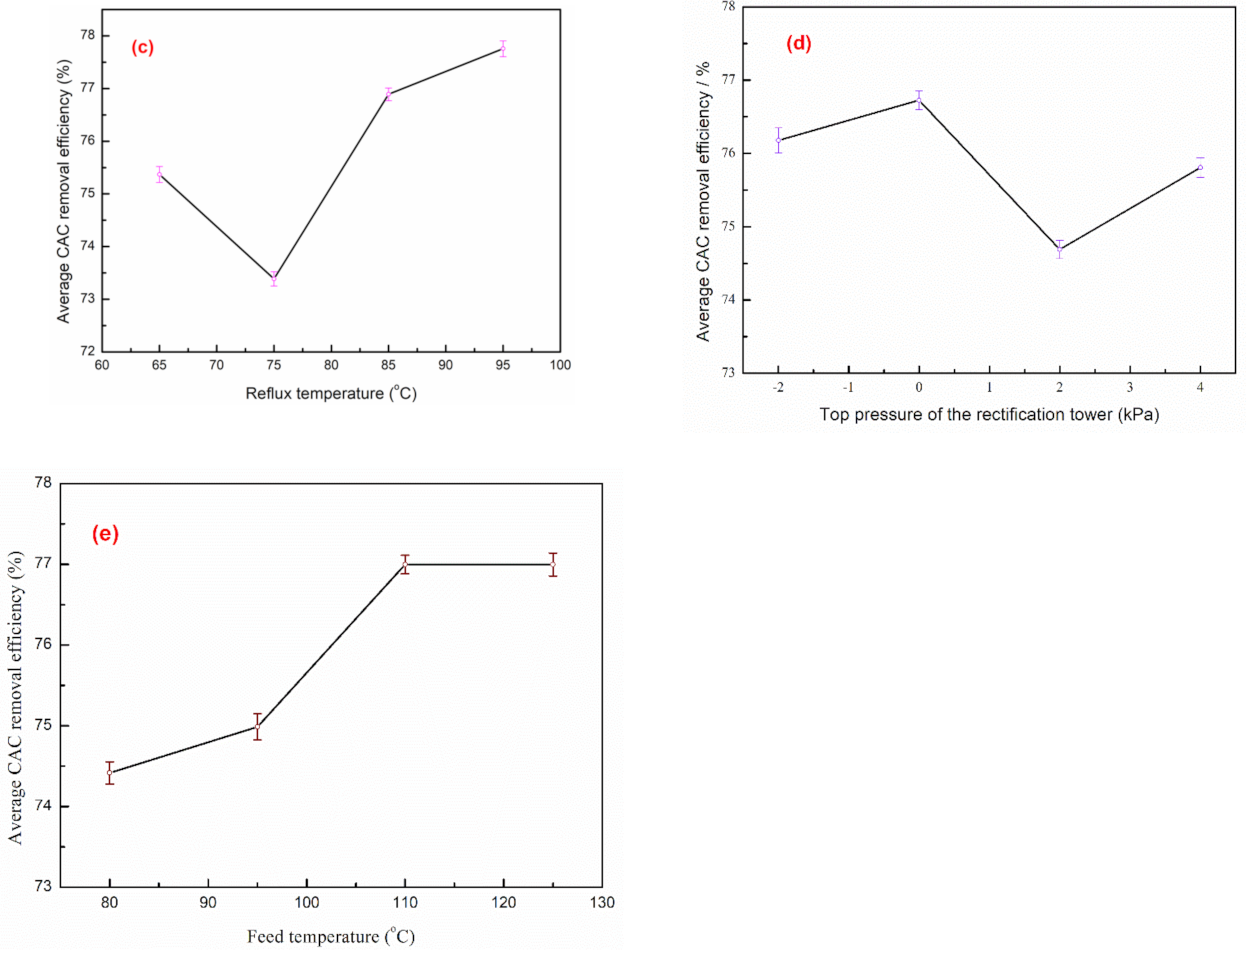
Based on the range analysis, the influence of four factors on CAC removal efficiency is shown in Figure 7. As shown in Figure 7a, the CAC removal rate in TiCl4 gradually increased with the increase in heating power per ton of TiCl4. However, when the heating power increased from 85 to 100 kW t−1, the average removal efficiency increased by only 0.5%. Hence, the optimum heating power is 85 kW t−1. Figure 7b shows the effect of reflux ratio on the CAC removal rate, which increased with increasing reflux ratio. However, note that an excessively high reflux ratio inevitably reduces the distillation efficiency. When the reflux ratio increased from 50% to 60%, the CAC removal rate exhibited a relatively small increase of ≈1.2%. Thus, the optimal reflux ratio is 50%. Furthermore, Figure 7c shows that the average removal efficiency of CAC initially increased with increasing reflux temperature, followed by a gradual decrease. Herein, the minimum removal rate of CAC was found to be 73.4% at the reflux temperature of 75 °C, which can be ascribed to gaseous SiCl4, because a large amount of SiCl4 was removed from the raw material due to its low boiling point (57.6 °C). However, the CAC removal rate increased with a further increase in reflux temperature and reached 77.8% at 95 °C. Figure 7d shows that the CAC removal rate remained constant when the tower top pressure was below zero. However, the CAC removal rate decreased under positive pressure because the gaseous CAC overflow was blocked. However, too small a negative pressure can increase TiCl4 loss and decrease TiCl4 yield. Thus, the optimal tower top pressure ranges from −2 to 0 kPa. Figure 7e shows that the CAC removal rate gradually increased with the increase of feed temperature. However, the increment was very small after 110 °C because the temperature was higher than the boiling point of CAC (106 °C). Hence, 110 °C is the optimal feed temperature.
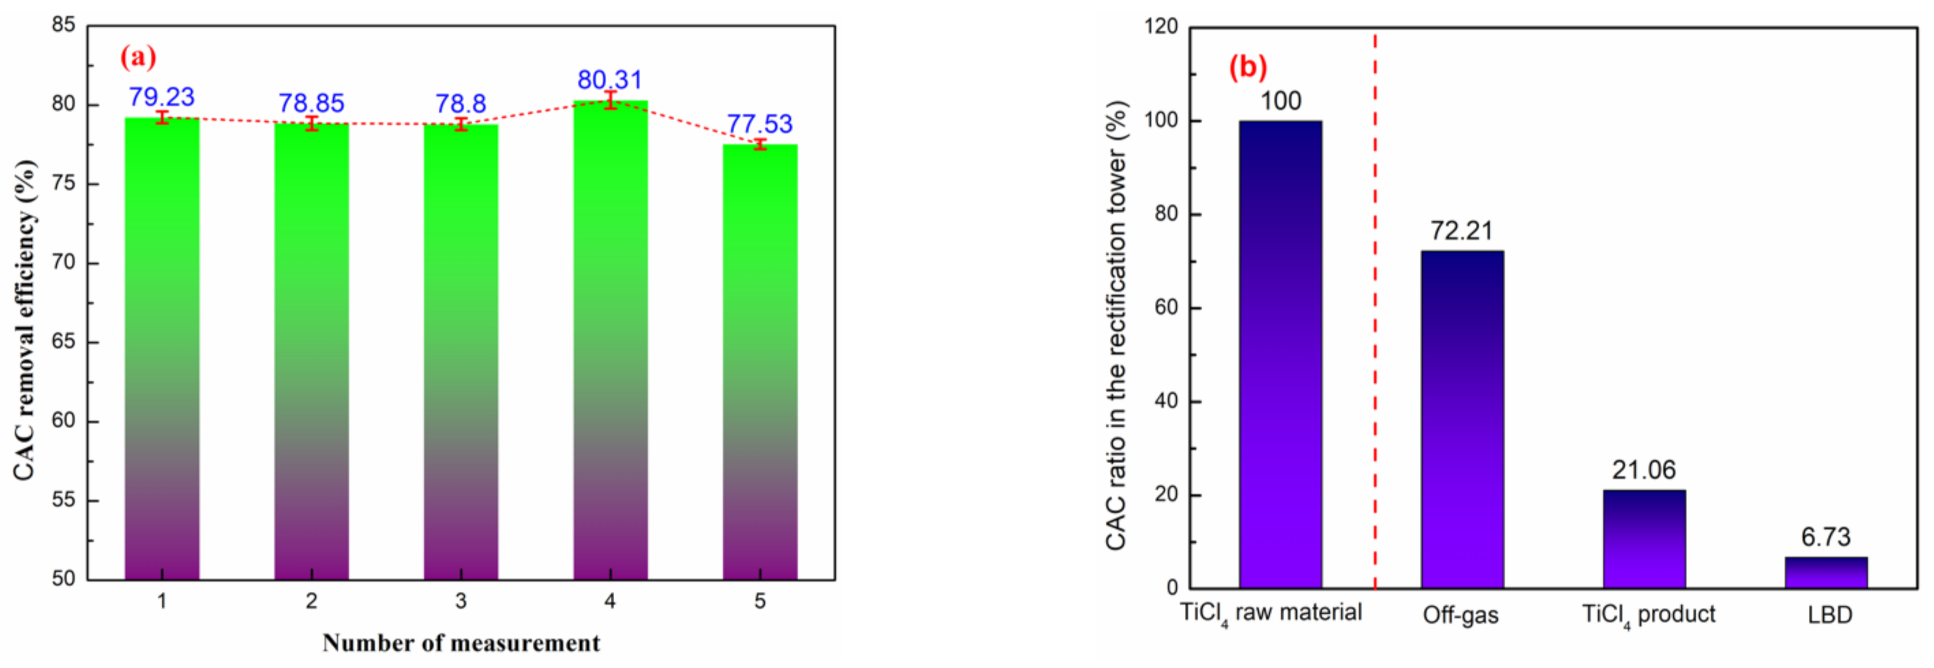
To verify the stability of optimal processing conditions, the stability experiment was carried out at the heating power of 85 kW t−1, reflux ratio of 50%, reflux temperature of 95 °C, top tower pressure of −2 to 0 kPa, and feed temperature of 110 °C. Figure 8a shows that the average removal rate of CAC from TiCl4 reached 78.94% ± 1.00% under optimal distillation conditions. The relatively low CAC removal efficiency can be ascribed to the fixed tray number in the continual rectifier. In addition, the CAC impurities are difficult to separate from TiCl4 compared with other low-boiling-point impurities, such as SiCl4. Figure 8b shows that the main outlet of CAC was the off-gas system, which could remove 72.21% of CAC impurities, followed by LBD. However, 21.06% of the CAC impurities were still left in the end product. Therefore, the negative pressure of the tail gas should be actively controlled for the efficient removal of CAC impurities.
4. Conclusions
The current study established a method for determining CAC content in TiCl4 solution and demonstrated the separation behavior of CAC during rectification via FTIR analysis. The results revealed that the characteristic IR peak of CAC was located at 1820 cm−1, and the characteristic peak intensity (y) linearly increased with increasing CAC content (i.e., . Moreover, an orthogonal design of experiments was utilized to investigate the CAC removal efficiency and obtain the optimal parameters. Herein, the heating power of 85 kW t−1, reflux ratio of 50%, reflux temperature of 95 °C, top tower pressure of −2 to 0 kPa, and feed temperature of 110 °C resulted in an average CAC removal rate of 78.94% ± 1.00%, with 72.21% of CAC impurities removed via the off-gas system. It is worth emphasizing that the negative pressure of the tail gas should be controlled to achieve excellent CAC removal efficiency.
Author Contributions
Conceptualization, F.Z., K.Q., and Z.M.; methodology, F.Z.; investigation, F.Z. and L.L.; formal analysis, F.Z., L.L., and S.M.; writing—original draft, F.Z.; writing—review and editing, D.Z., K.Q.; data curation, D.Z., S.M., and Z.M.; supervision, K.Q.; project administration, K.Q; funding acquisition, F.Z and L.L. All authors have read and agreed to the published version of the manuscript.
Funding
This work was funded by the National Basic Research and Development Program of China, Grant No. 2013CB632600; Science and Technology Planning Project of Sichuan Province, China, Grant No. 2019YJ0687; Directed Transfer Payment Program of Sichuan Province, China, Grant No.2017GZYZF0039.
Institutional Review Board Statement
Not applicable.
Informed Consent Statement
Not applicable.
Data Availability Statement
This study did not report any data.
Conflicts of Interest
The authors declare no conflict of interest.
References
- Wang, T.H.; Navarrete-López, A.M.; Li, S.G.; Dixon, D.A.; Gole, J.L. Hydrolysis of TiCl4: Initial Steps in the Production of TiO2. J. Phys. Chem. A 2010, 114, 7561–7570. [Google Scholar] [CrossRef] [PubMed]
- Jiang, B.Y.; Weng, Y.H.; Zhang, S.H.; Zhang, Z.; Fu, Z.S.; Fan, Z.Q. Kinetics and mechanism of ethylene polymerization with TiCl4/MgCl2 model catalysts: Effects of titanium content. J. Catal. 2018, 360, 57–65. [Google Scholar] [CrossRef]
- Li, L.; Liu, D.C.; Wan, H.L.; Li, K.H.; Deng, J.H.; Jiang, W.L. Removal of chloride impurities from titanium sponge by vacuum distillation. Vacuum 2018, 152, 166–172. [Google Scholar] [CrossRef]
- Tang, S.Y.; Liu, T.; Duan, S.P.; Guo, J.J.; Tang, A.J. Comparison of Growth Characteristics and Properties of CVD TiN and TiO2 Anti-Coking Coatings. Processes 2009, 7, 574. [Google Scholar] [CrossRef] [Green Version]
- Liu, S.Y.; Wang, L.J.; Chou, K.C. A Novel Process for Simultaneous Extraction of Iron, Vanadium, Manganese, Chromium, and Titanium from Vanadium Slag by Molten Salt Electrolysis. Ind. Eng. Chem. Res. 2016, 55, 12962–12969. [Google Scholar] [CrossRef]
- Xiong, S.F.; Yuan, Z.F.; Xu, C.; Xi, L. Composition of off-gas produced by combined fluidized bed chlorination for preparation of TiCl4. Trans. Nonferrous Met. Soc. China 2010, 20, 128–134. [Google Scholar] [CrossRef]
- Rowe, L.W.; Opie, W.R. Production and Purification of TiCl4. JOM 1955, 7, 1189–1193. [Google Scholar] [CrossRef]
- Wang, X.W.; Zhang, L.P.; Shang, G.H.; Zhang, G.Q.; Yuan, J.W.; Gong, S.C. Processing copper–vanadium precipitate formed from crude TiCl4 in titania and titanium sponge production. Hydrometallurgy 2009, 99, 259–262. [Google Scholar] [CrossRef]
- Kusamichi, H.; Yukawa, T.; Toda, H.; Kaji, H. Study on the purification of TiCl4. J. Jpn. I. Met. 1955, 15, 66–69. [Google Scholar] [CrossRef] [Green Version]
- Lynch, D.C. Conversion of VOCl3 to VOCl2 in liquid TiCl4. Metall. Mater. Trans. B 2002, 33, 142–146. [Google Scholar] [CrossRef]
- Bruno, L.A.; Beard, B.C. Application of Infrared Spectroscopy for the Determination of TiOCl2 in TiCl4. Appl. Spectrosc. 1997, 51, 131–132. [Google Scholar] [CrossRef]
- Song, G.L.; Luo, Y.J.; Li, J.Q.; Zhan, B.L.; Tan, H. Determination of Titanium Oxychloride in Refined Titanium Tetrachloride by Infrared Spectroscopy. Adv. Mat. Res. 2014, 997, 475–479. [Google Scholar] [CrossRef]
- Yang, B.; Wang, Y.; Tan, H.; He, J.; Song, G. Infrared spectroscopy for a quantitative determination of CH3−nClnCOCl in TiCl4. IOP Conf. Ser. Mater. Sci. Eng. 2015, 103, 012027. [Google Scholar] [CrossRef] [Green Version]
- Johannesen, R.B.; Gordon, C.L.; Stewart, J.E.; Raleigh, G. Application of infrared spectroscopy to the determination of impurities in titanium tetrachloride. J. Res. Natl. Inst. Stand. 1954, 53, 197–200. [Google Scholar] [CrossRef]
- Song, G.L.; Luo, Y.J.; Li, J.Q.; Tan, H. Determination of Carbon Dioxide in Refined Titanium Tetrachloride by Infrared Spectroscopy. Spectrosc. Spect. Anal. 2015, 35, 626–630. [Google Scholar] [CrossRef]
- Haaland, D.M.; Easterling, R.G.; Vopicka, D.A. Multivariate Least-Squares Methods Applied to the Quantitative Spectral Analysis of Multicomponent Samples. Appl. Spectrosc. 1985, 39, 73–84. [Google Scholar] [CrossRef]
- Deng, G.Z. Titanium Metallurgy; Metallurgical Industry Press: Beijing, China, 2010; pp. 153–161. ISBN 9787502453367. (In Chinese) [Google Scholar]
- Speight, J.G. Lange’s Handbook of Chemistry, 16th ed.; CD&W Inc.: Laramie, WY, USA, 2004; Volume 2, p. 110. ISBN 0-07-143220-5. [Google Scholar]
- Magaril, E.; Magaril, R. Effect of pressure on the rectification sharpness in rectifying sections of tray distillation columns in oil and gas refining. Sep. Purif. Technol. 2019, 223, 49–64. [Google Scholar] [CrossRef]
- Perry, R.H.; Green, D.W. Perry’s Chemical Engineers’ Handbook, 7th ed.; McGraw-Hill: New York, NY, USA, 1997; Volume 13, p. 97. ISBN 0-07-049841-5. [Google Scholar]
- Liu, B.Y.; Lin, H.; Liao, J.J.; Tian, Y.J. Purification of SiCl4 as the Byproduct of Titanium Tetrachloride Refining. Int. J. Environ. Sci. 2013, 8, 601–606. [Google Scholar]
- Chen, Q. Simulation of Citronellal Extraction Tower Based on Aspen Plus Software. Adv. Mat. Res. 2015, 1090, 148–153. [Google Scholar] [CrossRef]
- Long, N.V.D.; Lee, M. Review of retrofitting distillation columns using thermally coupled distillation sequences and dividing wall columns to improve energy efficiency. J. Chem. Eng. Jpn. 2014, 47, 87–108. [Google Scholar] [CrossRef] [Green Version]
- Vorotyntsev, V.M.; Shablykin, D.N.; Vorotyntsev, I.V.; Petukhov, A.N.; Trubyanov, M.M. Concentration and temperature dependences of the liquid-vapor separation factor for ammonia with impurities of hydrocarbons and permanent gases. Russ. J Appl. Chem. 2013, 86, 1197–1203. [Google Scholar] [CrossRef]
- Hou, P.Q.; Yang, L.; Wang, Y.F.; Wang, L.X.; Li, S.N.; Luo, S.H. Optimize hydrothermal synthesis and electrochemical performance of Li2FeTiO4 composite cathode materials by using orthogonal experimental design method. Ionics 2020, 26, 1657–1662. [Google Scholar] [CrossRef]
- Garcia, M.V.; Tiemblo, P. Kinetic study of the reaction between ethanol and chloroacetyl chloride in chloroform: A laboratory experiment using Fourier transform infrared spectroscopy. J. Chem. Educ. 1992, 69, 841. [Google Scholar] [CrossRef]
- Ziémons, E.; Goffin, E.; Lejeune, R.; Angenot, L.; Thunus, L. FT-IR measurement of agitinine C after solvent extraction from Tithonia diversifolia. Talanta 2004, 62, 383–387. [Google Scholar] [CrossRef] [PubMed]
- Pérez-Palacios, D.; Armenta, S.; Lendl, B. Flow-Through Fourier Transform Infrared Sensor for Total Hydrocarbons Determination in Water. Appl. Spectrosc. 2009, 63, 1015–1023. [Google Scholar] [CrossRef]
- Naarendorp, F.; Rice, K.S.; Sieving, P.A. Summation of Rod and S Cone Signals at Threshold in Human Observers. Vision Res. 1996, 36, 2681–2688. [Google Scholar] [CrossRef] [Green Version]
- Dors, G.C.; Primel, E.G.; Fagundes, C.A.A.; Mariot, C.H.P.; Badiale-Furlong, E. Distribution of Pesticide Residues in Rice Grain and in its Coproducts. J. Braz. Chem. Soc. 2011, 22, 1921–1930. [Google Scholar] [CrossRef] [Green Version]
- Qiang, E.J.; Han, D.D.; Qiu, A.; Zhu, H.; Deng, Y.W.; Chen, J.W.; Zhao, X.H.; Zuo, W.; Wang, H.C.; Chen, J.M.; et al. Orthogonal experimental design of liquid-cooling structure on the cooling effect of a liquid-cooled battery thermal management system. Appl. Therm. Eng. 2018, 132, 508–520. [Google Scholar] [CrossRef]
Figure 1.
Schematic illustration of the chloroacetyl chloride (CAC) measurement equipment.

Figure 2.
Schematic illustration of the TiCl4 rectification.

Figure 3.
(a) The CAC content in different parts of the rectifying column and (b) the Gillian correlation diagram.
Figure 3.
(a) The CAC content in different parts of the rectifying column and (b) the Gillian correlation diagram.

Figure 4.
(a) Digital photographs and (b) FTIR spectra of TiCl4 before and after CAC addition.

Figure 5.
(a) The changes in characteristic peaks of FTIR spectra with increasing CAC content and (b) the relationship between the peak intensity and CAC content.
Figure 5.
(a) The changes in characteristic peaks of FTIR spectra with increasing CAC content and (b) the relationship between the peak intensity and CAC content.

Figure 6.
The stability of the CAC determination system.

Figure 7.
The influence of different factors on CAC removal efficiency: (a) heating power, (b) reflux ratio, (c) reflux temperature, (d) top pressure of the rectification tower, and (e) feed temperature.
Figure 7.
The influence of different factors on CAC removal efficiency: (a) heating power, (b) reflux ratio, (c) reflux temperature, (d) top pressure of the rectification tower, and (e) feed temperature.


Figure 8.
(a) The stability of CAC removal efficiency and (b) distribution of CAC impurities during the rectification process.
Figure 8.
(a) The stability of CAC removal efficiency and (b) distribution of CAC impurities during the rectification process.


Table 1.
Some calculation results for the theoretical plate numbers.
| Classification | Calculation Results | Classification | Calculation Results |
|---|---|---|---|
| 5.707 × 10⁻⁵ | 24.73 | ||
| 4.168 × 10⁻³ | 37.10 | ||
| 1.634 × 10⁻⁵ | 4.15 | ||
| 2.168 ×10⁻⁴ | 0.32 |
Table 2.
The precision of CAC determination (n = 5).
| Batch Number | 1# (ppm) | 2# (ppm) | 3# (ppm) | 4# (ppm) | 5# (ppm) | Mean Value (ppm) | RSD (%) |
|---|---|---|---|---|---|---|---|
| No. 1 | 4.83 | 4.86 | 4.92 | 4.77 | 4.85 | 4.85 | 1.12 |
| No. 2 | 12.48 | 12.3 | 12.41 | 12.35 | 12.55 | 12.42 | 0.80 |
| No. 3 | 44.72 | 44.25 | 44.51 | 44.66 | 44.59 | 44.55 | 0.41 |
Table 3.
The standard recovery rate for CAC determination.
| Batch Number | Before Standard Solution Addition (ppm) | CAC Content in Standard Solution (ppm) | After Standard Solution Addition (ppm) | Recovery Rate (%) |
|---|---|---|---|---|
| No. 1 | 12.48 | 20.00 | 32.55 | 100.6 |
| No. 2 | 18.43 | 30.00 | 49.40 | 105.3 |
| No. 3 | 23.88 | 40.00 | 62.74 | 95.2 |
| No. 4 | 35.69 | 50.00 | 84.46 | 96.6 |
| No. 5 | 42.18 | 20.00 | 62.54 | 100.9 |
| No. 6 | 51.82 | 20.00 | 73.21 | 102.7 |
Table 4.
Comparison of the CAC determination in TiCl4.
| Linear Equation | Correlation Coefficient (R2) | Detection Limit (ppm) | Characteristic Peak Position (cm−1) | Detection Method | Ref. |
|---|---|---|---|---|---|
| y = −0.00001571x + 1.00001785946 | 0.8995 | 3.159 | 1820 | FTIR | [13] |
| - | - | 0.50 | 1802 | IR | [14] |
| y = 0.04081x − 0.11599 | 0.990 | 0.633 | 1820 | FTIR | this work |
Table 5.
L16 (45) orthogonal design of the experiment and results.
| No. | Factors | CAC Removal Efficiency (%) | ||||
|---|---|---|---|---|---|---|
| Heating Powder (kWt−1) | Reflux Ratio (%) | Reflux Temperature (°C) | Top Pressure of the Rectification Tower (kPa) | Feed Temperature (°C) | ||
| 1 | 50 | 30 | 65 | −2 | 80 | 65.23 ± 0.20 |
| 2 | 50 | 40 | 75 | 0 | 95 | 69.35 ± 0.15 |
| 3 | 50 | 50 | 85 | 2 | 110 | 75.37 ± 0.08 |
| 4 | 50 | 60 | 95 | 4 | 125 | 78.52 ± 0.18 |
| 5 | 65 | 30 | 75 | 2 | 125 | 68.40 ± 0.13 |
| 6 | 65 | 40 | 65 | 4 | 110 | 76.48 ± 0.11 |
| 7 | 65 | 50 | 95 | −2 | 95 | 79.77 ± 0.19 |
| 8 | 65 | 60 | 85 | 0 | 80 | 80.05 ± 0.13 |
| 9 | 85 | 30 | 85 | 4 | 95 | 72.14 ± 0.12 |
| 10 | 85 | 40 | 95 | 2 | 80 | 76.30 ± 0.10 |
| 11 | 85 | 50 | 65 | 0 | 125 | 81.07 ± 0.11 |
| 12 | 85 | 60 | 75 | −2 | 110 | 79.71 ± 0.14 |
| 13 | 100 | 30 | 95 | 0 | 110 | 76.43 ± 0.13 |
| 14 | 100 | 40 | 85 | −2 | 125 | 80.00 ± 0.15 |
| 15 | 100 | 50 | 75 | 4 | 80 | 76.09 ± 0.12 |
| 16 | 100 | 60 | 65 | 2 | 95 | 78.69 ± 0.19 |
| K1 | 72.117 | 70.550 | 75.368 | 76.177 | 74.417 | |
| K2 | 76.175 | 75.532 | 73.387 | 76.725 | 74.987 | |
| K3 | 77.305 | 78.075 | 76.890 | 74.690 | 76.998 | |
| K4 | 77.803 | 79.242 | 77.755 | 75.808 | 76.998 | |
| R | 5.686 | 8.692 | 4.368 | 2.035 | 2.581 | |
Publisher’s Note: MDPI stays neutral with regard to jurisdictional claims in published maps and institutional affiliations. |
© 2021 by the authors. Licensee MDPI, Basel, Switzerland. This article is an open access article distributed under the terms and conditions of the Creative Commons Attribution (CC BY) license (http://creativecommons.org/licenses/by/4.0/).
Share and Cite
MDPI and ACS Style
Zhu, F.; Li, L.; Zhang, D.; Ma, S.; Ma, Z.; Qiu, K. Separation and Rectification of Chloroacetyl Chloride from TiCl4. Processes 2021, 9, 287. https://doi.org/10.3390/pr9020287
AMA Style
Zhu F, Li L, Zhang D, Ma S, Ma Z, Qiu K. Separation and Rectification of Chloroacetyl Chloride from TiCl4. Processes. 2021; 9(2):287. https://doi.org/10.3390/pr9020287
Chicago/Turabian StyleZhu, Fuxing, Liang Li, Dafu Zhang, Shangrun Ma, Zhanshan Ma, and Kehui Qiu. 2021. "Separation and Rectification of Chloroacetyl Chloride from TiCl4" Processes 9, no. 2: 287. https://doi.org/10.3390/pr9020287
Note that from the first issue of 2016, this journal uses article numbers instead of page numbers. See further details here.