Article

Significance of Pretreatment in Enhancing the Performance of Dry Anaerobic Digestion of Food Waste: An Insight on Full Scale Implementation Strategy with Theoretical Analogy

by
Vijayalakshmi Arelli
1,2,
Sudharshan Juntupally
1,2,
Sameena Begum
1 and
Gangagni Rao Anupoju
1,2,*
1
Bio Engineering and Environmental Sciences (BEES) Group, Department of Energy and Environmental Engineering (DEEE), CSIR-Indian Institute of Chemical Technology (IICT), Hyderabad 500007, India
2
Academy of Scientific and Innovative Research (AcSIR), Ghaziabad 201002, India
*
Author to whom correspondence should be addressed.
Processes 2020, 8(9), 1018; https://doi.org/10.3390/pr8091018
Submission received: 31 July 2020 / Revised: 17 August 2020 / Accepted: 18 August 2020 / Published: 20 August 2020
(This article belongs to the Special Issue Anaerobic Digestion for Bioenergy and Biochemicals Production)

Abstract

:
The aim of this study was to treat food waste containing 25% total solids (TS) through dry anaerobic digestion (dry AD) process at various pressures (0.5 to 2.5 kg/cm2) and different time duration (20 to 100 min) to understand the impact of pretreatment in enhancing the methane generation potential along with insights on scale up. The findings revealed that vs. reduction and methane yield of 60% and 0.25 L CH4/(g VSadded) can be achieved with pretreated food waste at two kilograms per square centimeter, while pretreatment of food waste at 2 kg/cm2 for 100 min enhanced the vs. reduction from 60% to 85% and methane yield from 0.25 to 0.368 L CH4/(g VSadded). However, the net energy indicated that 40 min of pre -treatment at two kilograms per square centimeter can be a suitable option as methane yield and vs. reduction of 0.272 L CH4/(g VSadded) and 70%, respectively was achieved. The vs. reduction and the methane yield of 45% and 0.14 L CH4/(g VSadded), respectively was obtained from untreated food waste which illustrated that pretreatment had significantly impacted on the enhancement of methane generation and organic matter removal which can make the dry AD process more attractive and feasible at commercial scale.

Graphical Abstract

1. Introduction

Huge quantities of municipal solid waste (MSW) are accumulating in most of the developed and developing countries due to rapid industrialization and urbanization, which needs a sustainable treatment solution [1,2,3]. However, questions related to the final disposal and treatment of municipal solid waste (MSW) constitutes one of the most serious problems of contemporary societies. About 50%–60% of MSW is usually composed of biodegradable organic waste such as food waste, garden waste, paper and cardboard waste, referred to as the organic fraction of MSW (OFMSW) [1,4,5]. Anaerobic digestion (AD) has proven to be promising for the treatment of organic waste streams, supporting renewable energy generation, while avoiding the risks of uncontrolled greenhouse gas emissions that results from landfilling [6]. Food waste—a part of the OFMSW which includes cooked and uncooked food—is generated from various sources, such as canteens, hotels, households, gated communities, function halls and various food processing industries, etc [7]. If this is treated in a decentralized manner at source using best possible AD technology, then it becomes remunerative [1] and the diversion of food waste to landfills could be arrested to a great extent [8]. The AD process is classified into three configurations based on the concentration of total solids (TS) in the organic waste, namely wet AD (TS ≤ 10%), semi dry AD (TS between 10%–15%) and dry AD (TS > 15%) [9,10,11]. dry AD, also referred to as solid-state digestion is a favorable technology, owed to several advantages compared to wet AD (TS < 10%) making it particularly attractive for the treatment of organic fraction of MSW, agricultural wastes and food waste. However, wet AD is very common in practice in developing countries like India, while dry AD is predominantly practiced in developed countries of European union from where the AD technologies such as DRANCO, VALORGS, KOMPOGAS have originated [12]. There has been an in the installations of dry AD plants to the tune of 40% to 50% particularly in Europe and China whereas in India most of new installations are based on wet AD [1,13,14]. Recently, research on dry AD has gained considerable interest due to its advantages compared to wet AD. Advantages of dry AD that significantly impact the techno-economics of the entire AD unit includes lower water consumption for feed preparation, compact digester volumes resulting in lower footprint area, very tolerant for contaminants such as sand, fibers, etc., less critical equipment such as pumps, agitation systems, feeding equipment required and lower water content in the digestate compared to wet AD [9,15]. In addition to these, dry AD is 20%–40% more advantageous in terms of biogas volume and methane yield, substrate handling and input energy requirement compared wet AD [16]. It is known that majority of commercial biogas plants installed for the treatment of food waste are based on wet AD which were found to be working satisfactorily [1,13,14]. However, requirement of dilution water to the tune of 1:1 (food waste: Water) and transportation of diluted anaerobically digested slurry (total solids (TS) in the range of 1% to 2%) for purposeful utilization is still a great challenge in these plants to make it attractive. In order to expedite the implementation of the decentralized AD systems at source, minimization of fresh water requirement and foot print area for installation of the plant are highly essential without compromising on the process efficiency and therefore, extensive research on the dry AD is required to make it commercially implementable.
Substrates such as food waste, agricultural waste, organic fraction of MSW are the suitable substrates for dry AD as the TS concentration in these wastes by itself would be in the range of 15%–65%. Therefore, there arises less water or sometimes no water requirement at all for feed preparation to operate in dry AD conditions. However, studies reported on dry AD of food waste are limited which may be one of the reasons that is deterring its implementation at industrial scale [15]. Extensive research on the dry anaerobic co-digestion of food waste with waste activated sludge, agriculture waste, pig manure, paper waste, cardboard waste, etc. have been investigated [17,18,19,20,21]. Abundant literature is available on the wet AD of food waste showing the impact of different type of pretreatments (thermal, mechanical, chemical) on the process performance; for instance, A study investigated by Habarakada Liyanage and Babel [22], demonstrated the AD of food waste with thermal pretreatment resulted in the highest cumulative methane yield of 113.19 mL/g vs. which was 11% more that untreated food waste. In another study carried out by Linyi et al. [23] with alkali (1% CaO) pretreatment of food waste results showed that alkali pretreatment enhanced the organic matter solubilization and the maximum biogas yield of 829 mL/g vs. was obtained with a methane concentration of 65.48%. Biologic pretreatment of food waste for the production of methane in an up flow anaerobic sludge blanket reactor was studied and the results showed that 95% more soluble COD removal efficiency was obtained with a methane yield of 0.35 L-CH4/g-soluble COD [24]. Another study showed that with mechanical pretreatment (using bead mill) of food waste, the particle size decreased from 0.843 mm to 0.391 mm due to the increased solubilization of total COD by 40% and an improvement in methane yield by 28% [25].
However, only a few reports can be found on the study of dry AD of food waste alone and a study investigated by Cho et al. [26] on dry AD of food waste at mesophilic temperature in a 60-L reactor demonstrated that the average production rate of methane with methane concentration in the range of 2.51 ± 0.17 m3/m3/d and 66% ± 2.1%. However, the impact of pretreatment on the process performance in dry AD of food waste has not yet been investigated. It is known that pretreatment accelerates the hydrolysis phase of the AD with a significant impact on the reduction of residence times [27]. The lower the residence time, the lower is the reactor volume required—which leads to lower capital costs per unit. Although, the food waste with low solids does not require any pretreatment step, but the food waste with solids > 15% may be pretreated to investigate the impact of pretreatment on the hydrolysis efficiency and the overall performance of the AD. Therefore, the present study is aimed to investigate the impact of pressure driven thermal pretreatment of food waste at varying pressures and time durations on the variation in the operating conditions (VFA and pH profile), biogas and methane yield along with organic matter removal rates. The impact of pretreatment under different operating conditions on the physicochemical characteristics and the morphologic changes in the food waste is explained. A comparative assessment of biogas production profile and organic matter removal rates achieved from pretreated food waste was compared to that of untreated food waste to investigate the effect of pretreatment on the input energy required and the net energy generation. The obtained data were fit to the modified Gompertz model equation to obtain the lag phase of the dry AD process.

2. Materials and Methods

2.1. Substrate and Composition

The substrate, food waste used for experimentation was collected from departmental canteen of CSIR—Indian Institute of Chemical Technology (IICT), Hyderabad, India. The food waste is heterogeneous in nature as it comprised of cooked food waste (a mix of leftover cooked rice, pulses, curries, etc.) and uncooked food waste (vegetable peels, spoiled vegetables, etc.). Equal quantity of cooked food waste and uncooked food waste was grounded into fine paste, characterized for various parameters as described in the subsequent sections and used as substrate for experiments.

2.2. Inoculum

Mixed microbial consortia (MMC) was collected from the working anaerobic digester being operated in CSIR-IICT, Hyderabad for the treatment of food waste. The MMC was initially characterized for TS and volatile solids (VS) of TS found to be 8.7% and 67.8%, respectively.

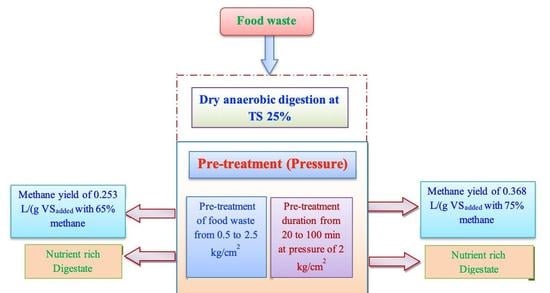
2.3. Pretreatment of Food Waste

The pretreatment of food waste was carried out in an autoclave (Equitron, SLE Series, Mumbai, Maharashtra, India) in a phased manner. In the first phase, the food waste was pretreated with varying pressure and constant time, i.e., five different pressures starting from 0.5 kg/cm2 to 2.5 kg/cm2 (at its saturated temperature) with an interval of 0.5 kg/cm2 for 20 min each. In the second phase, food waste was pretreated at constant pressure of 2 kg/cm2 with varying time intervals of 20, 40, 60, 80 and 100 min. All the pretreated samples were characterized for various parameters, dry AD experiments were carried out with each of the pretreated sample separately and the pretreatment conditions of the substrate along with bioreactor designations is summarized in Table 1.

2.4. Experimental Set up and Operational Procedure

Dry AD of food waste experiments were organized in 1000-mL anaerobic batch reactors with proper gas collection and closing systems with an active volume of 800 mL (Table 1). Based on pretreatment step as explained in Section 2.2, a total of twelve batch reactors were organized; ten reactors for pretreated food waste, one for untreated food waste and one blank reactor operated with mixed microbial consortia. The cumulative biogas generated from microbial consortia was subtracted from the cumulative biogas generated from each reactor so that biogas generation is only due to substrate. A control reactor with untreated food waste was set up to compare the results between food waste without pretreatment and with pretreatment. All ten reactors were filled with required volume of pretreatment food waste and microbial mixed consortia (MMC) and the reactor with untreated food waste was also filled with same amount of mixed microbial consortia. All the reactors were sealed with rubber stoppers and sparged with nitrogen to ensure the anaerobic conditions. All the reactors were kept in orbital shaker with the RPM of 100 where gentle mixing is in place and temperature of the same is maintained in the mesophilic range (37 ± 2 °C) for 45 days until biogas production was terminated. Initially, pH in all the reactors was adjusted to 7 ± 0.2 using milk of lime (MOL) as buffering agent and subsequently, pH in all the reactors were also measured on alternate days and adjusted to neutral using MOL if required, every time nitrogen gas was sparged to confirm the anaerobic environment. The methane content in the biogas generated was estimated by using GC. All the experiments were organized in triplicates and results were taken in average basis. Samples from (~5 g) every reactor was collected for every 5 days and analyzed to know about the TS, VS, COD and VFA. The reduction of vs. due to the sampling was taken into consideration, while calculating the methane yield.

2.5. Analytical Methods

The food waste and pretreated food waste was initially characterized for pH, total solids (TS), volatile solids (VS), moisture content (MC), chemical oxygen demand (COD), soluble COD (sCOD), alkalinity (Alk) and biologic oxygen demand (BOD) as per the standard procedures mentioned in APHA [28]. Carbon (C), hydrogen (H), nitrogen (N) and sulfur (S) was analyzed using CHNS analyzer (PERKIN Elmer, 2400 Series) having thermal conductivity detector (TCD) with helium as carrier gas. During dry AD experiments, pH of each reactor is being checked on daily basis. The biogas generated from all the reactors measured using wet gas flow meter and analyzed for its composition using gas chromatography (GC) (GC-2010, Shimadzu, Columbia, Maryland, U.S.A). The GC was equipped with TCD detector, where Q plot column at 38 °C temperature with 1.0-mL of injection volume and nitrogen gas as the carrier. Diluted samples (10 times) were centrifuged (Sigma 2-16 KL) at an RPM of 10,000 for 10 min and the supernatant was separated and analyzed for volatile fatty acids (VFA) by using high performance liquid chromatography (HPLC) (Model LC 10A vp, Shimadzu, Columbia, Maryland, U.S.A), which was coupled with UV detector (210 nm); and having ODS column and 0.01 M and 90% H2SO4 buffer in acetonitrile. The morphologic changes observed after pretreatment of food waste were analyzed using a scanning electron microscope (SEM). After completion of experiments, the final digestate was tested for N, P2O5 and K2O by using inductively coupled plasma mass spectrometry (ICPMS) instrument (model number ICAP6500DU0, Perkin Elmer, South Main St, Akron, OH, USA). All estimations were carried in duplicate and average values were represented here. All the chemicals which are used for the experiments and analysis were of AR grade reagents (supplier-Sigma Aldrich, Hyderabad, India).
In order to determine the soluble COD, each sample was centrifuges at rpm of 400 for time of 15 min and then the supernatant was filtered by using Whatman filter paper and filtrate was analyzed for COD [29]. The effect of pretreatment on COD was determined by using the percentage of solubilization. The increase in soluble COD of the pretreated food waste was considered as improved solubilization of organic compounds due to pretreatment and as mentioned in the work of Yeshanew et al. [29], Arun et al. [30], the solubilization of COD was calculated for each case as per the below formula:
COD   Solubilization   ( % )   = ( S o l u b l e   C O D   o f   P r e t r e a t e d   f o o d   w a s t e ( g L ) ) ( T o t a l   C O D   o f   p r e t r e a t e d   f o o d   w a s t e   ( g L ) × 100 %

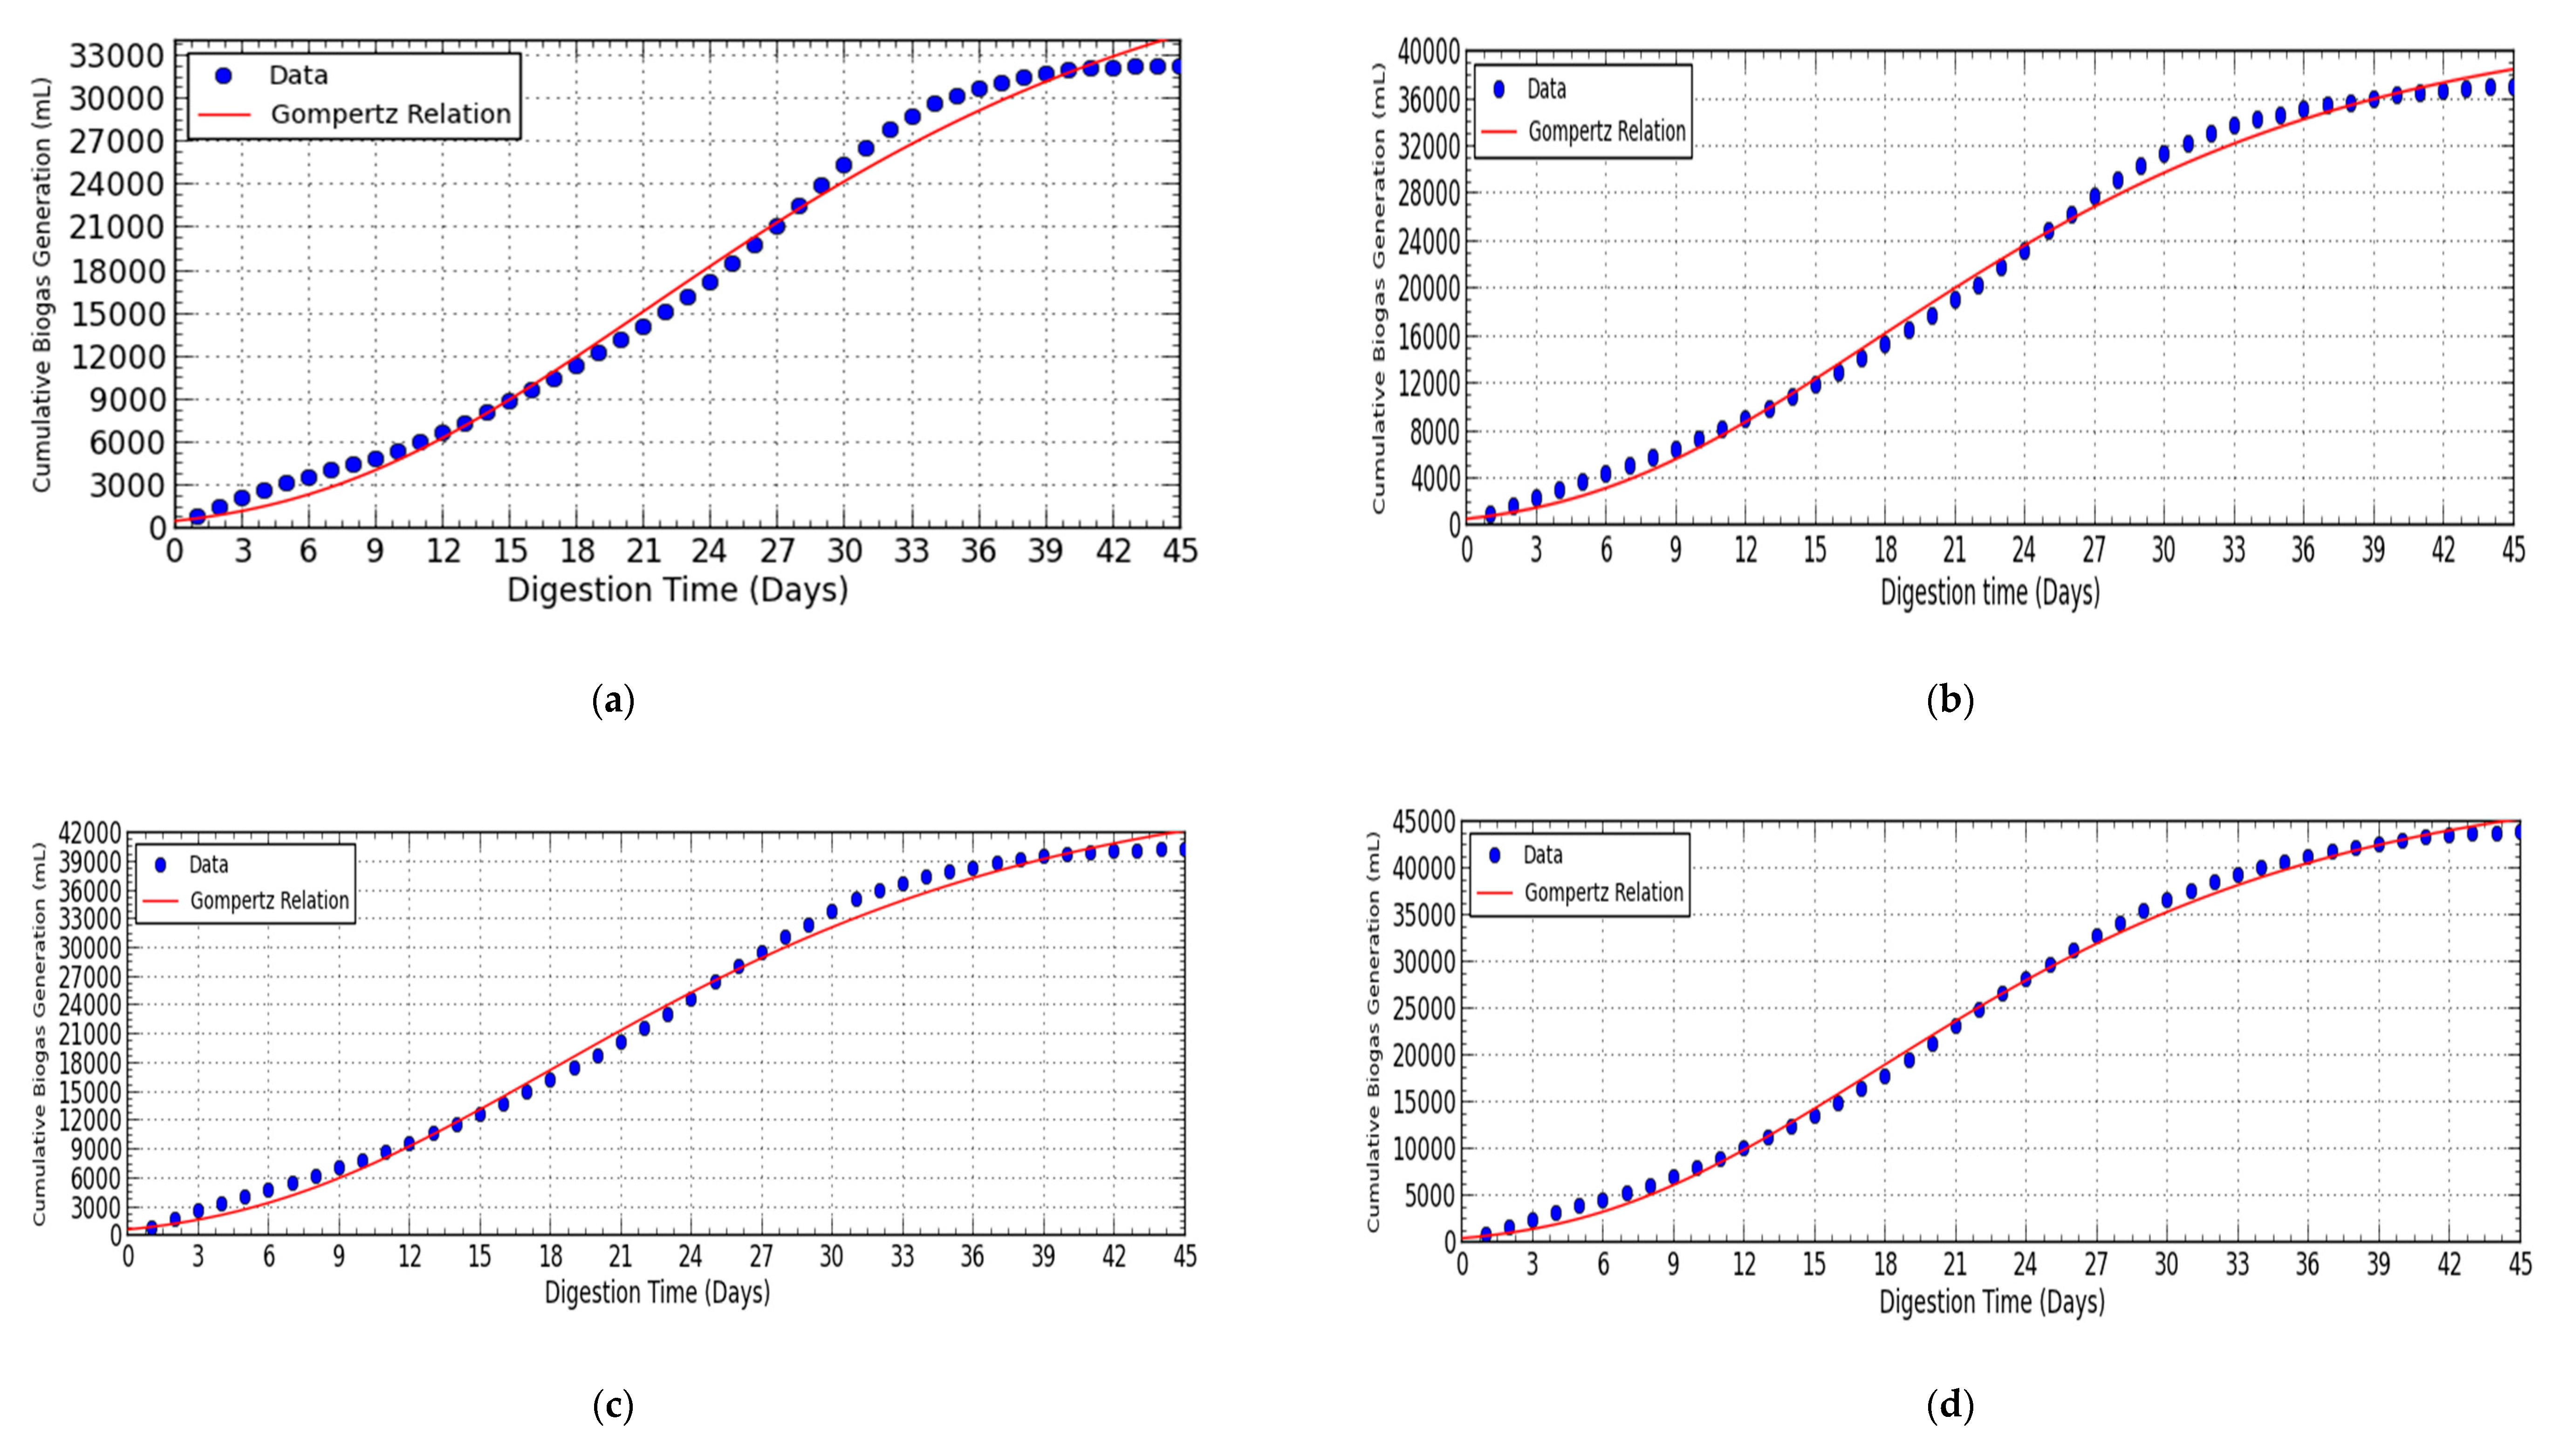
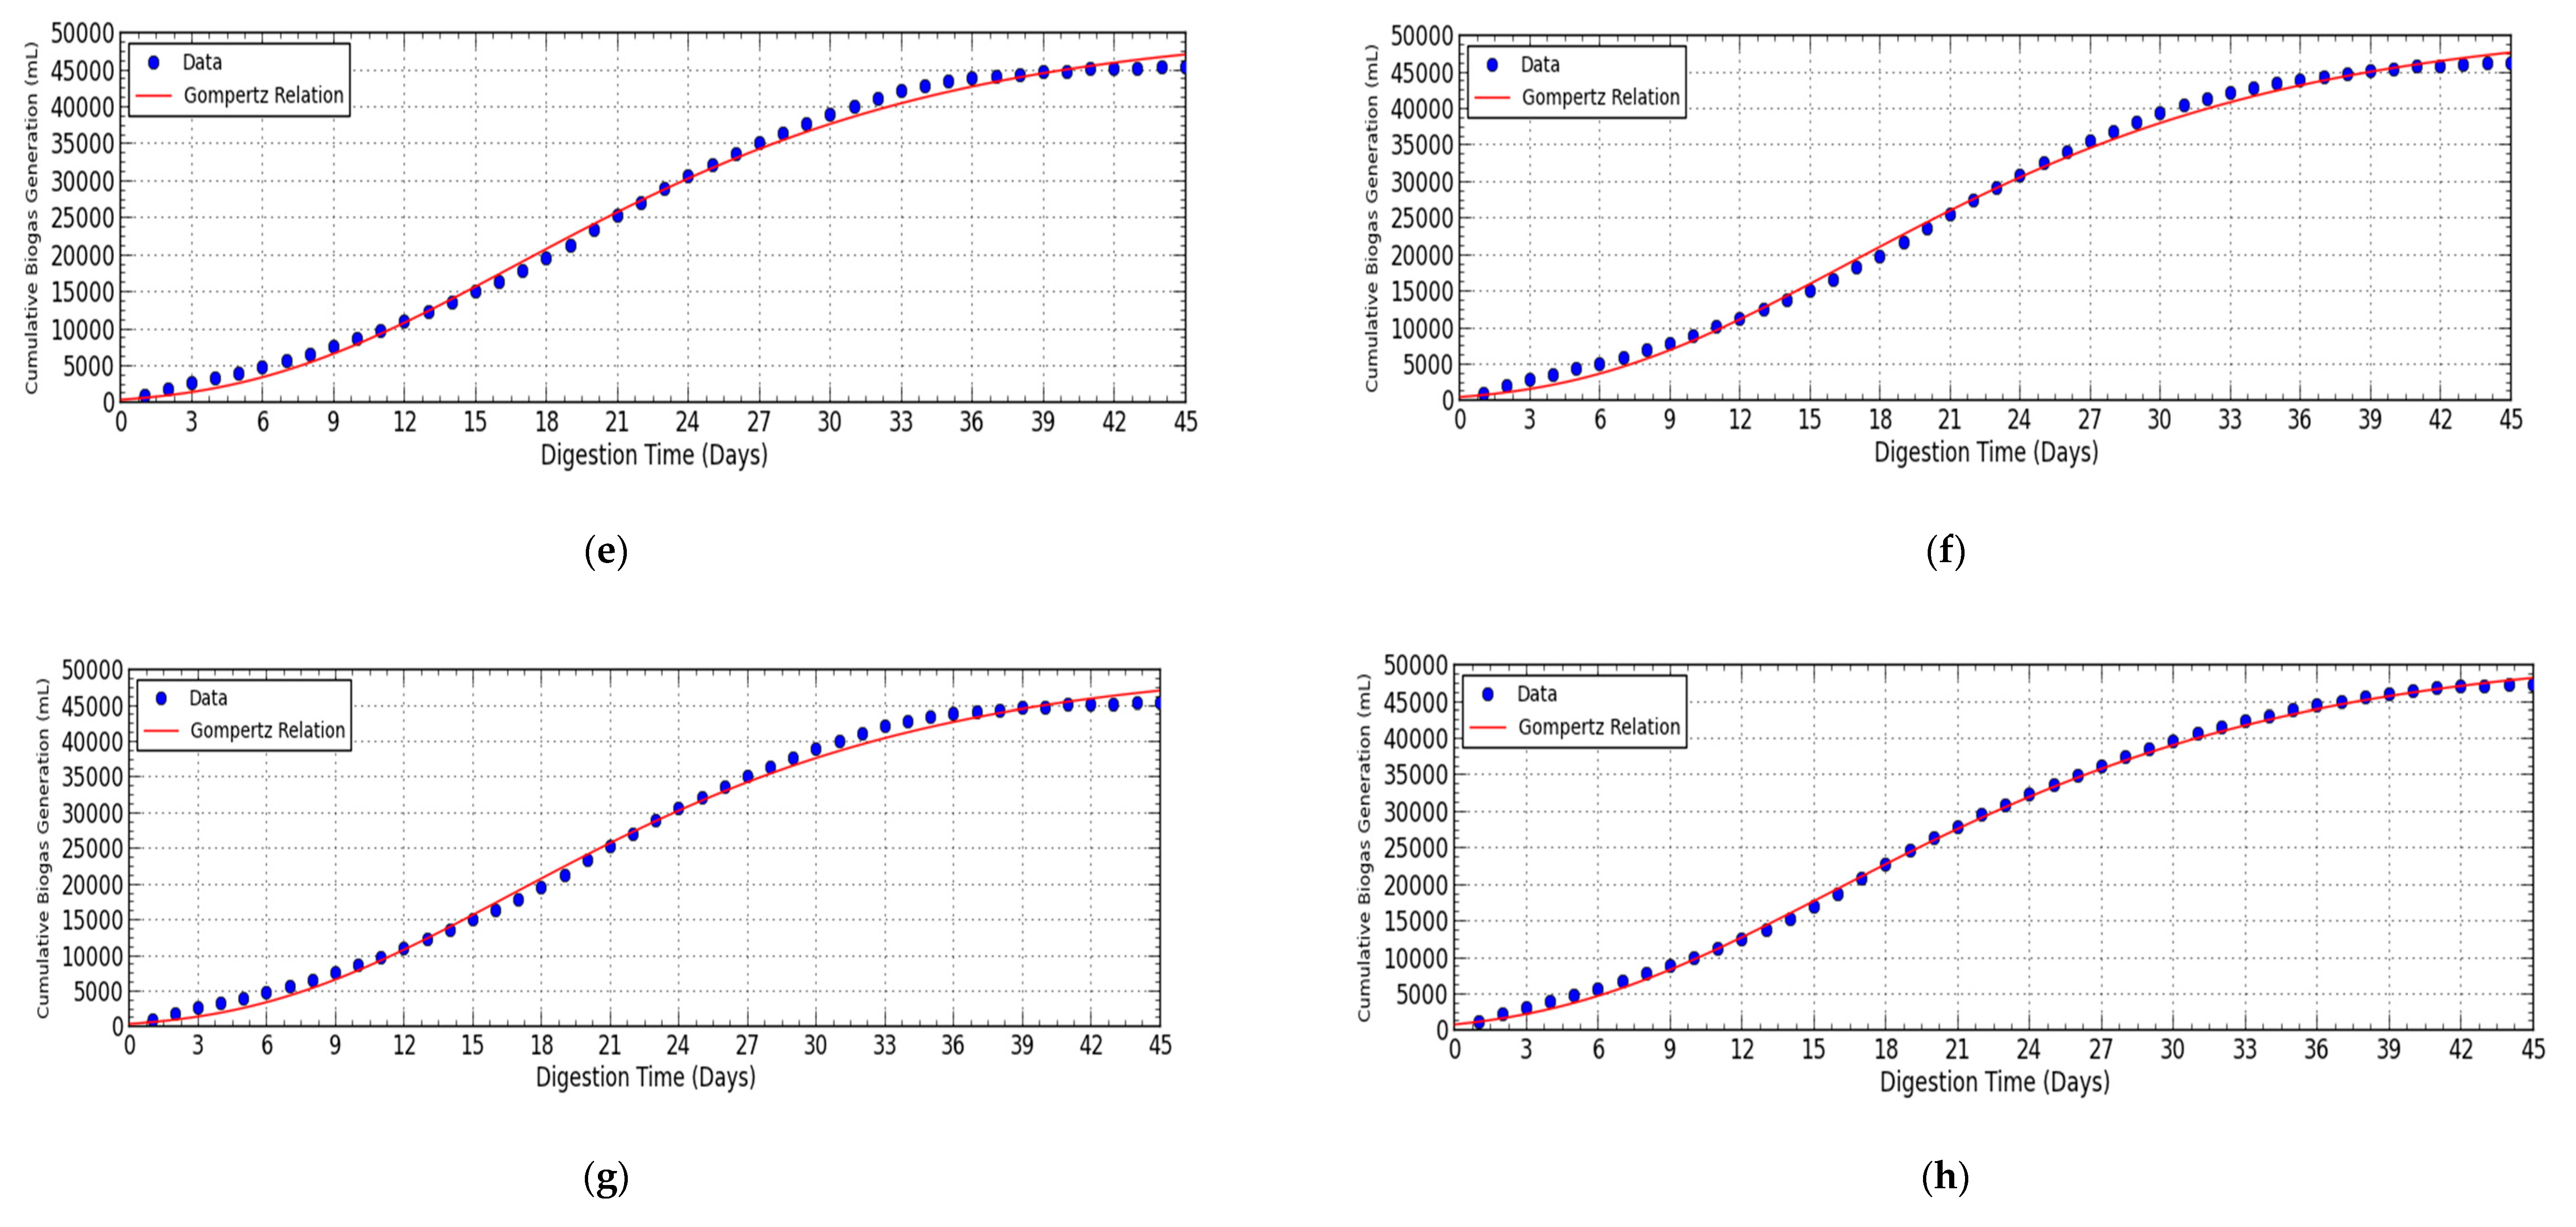
2.6. Kinetic Model for Biogas Generation

Researchers have improved and enriched the models of AD of different organic substrates. Basically, modeling of AD used to find out the different parameters and operating conditions such as temperature, pressure, pH, TS, etc. which are achievable theoretically and also it is used to determine the different process parameters. The biogas obtained from dry AD of food waste with pretreatment in two different phased (pretreatment of food waste at 0.5-,1-, 1.5-, 2-, 2.5-kg/cm2 pressure and pretreatment of food waste at 120 °C and 2-kg/cm2 pressure for 20, 40, 60, 80 and 100 min) experiments was mathematically modeled by using modified Gompertz equation, which has been established as empirical nonlinear regression model and it is developed by Zwietering [31] in order to determine the kinetics of specific growth rate of methanogenic bacteria in the reactor for the biogas production. The Gompertz equation is basically used in sigmoidal growth curves [32,33] and the equation of modified Gompertz model is described in the Equation (2). The determination coefficient (R2) was calculated for modified Gompertz model in order to compare the correctness of the used model [33] and higher value of R2 shows the good fit of the studied kinetic model [33].
Y = Y 0 exp { exp [ ( R m e Y 0 ) ( λ t ) + 1 ] }
where Y represents the cumulative biogas generation by anaerobic digestion time t (mL/day);
Y0 represents the highest biogas generation obtained in mL biogas;
Rm represents the maximum biogas generation rate in L biogas/day;
λ represents the lag phase period between the VFA generation happening and adaption of microbial consortia;
t represents the operation time period in days;
e is the Euler’s constant and the value of the e is 2.7183.

3. Results and Discussion

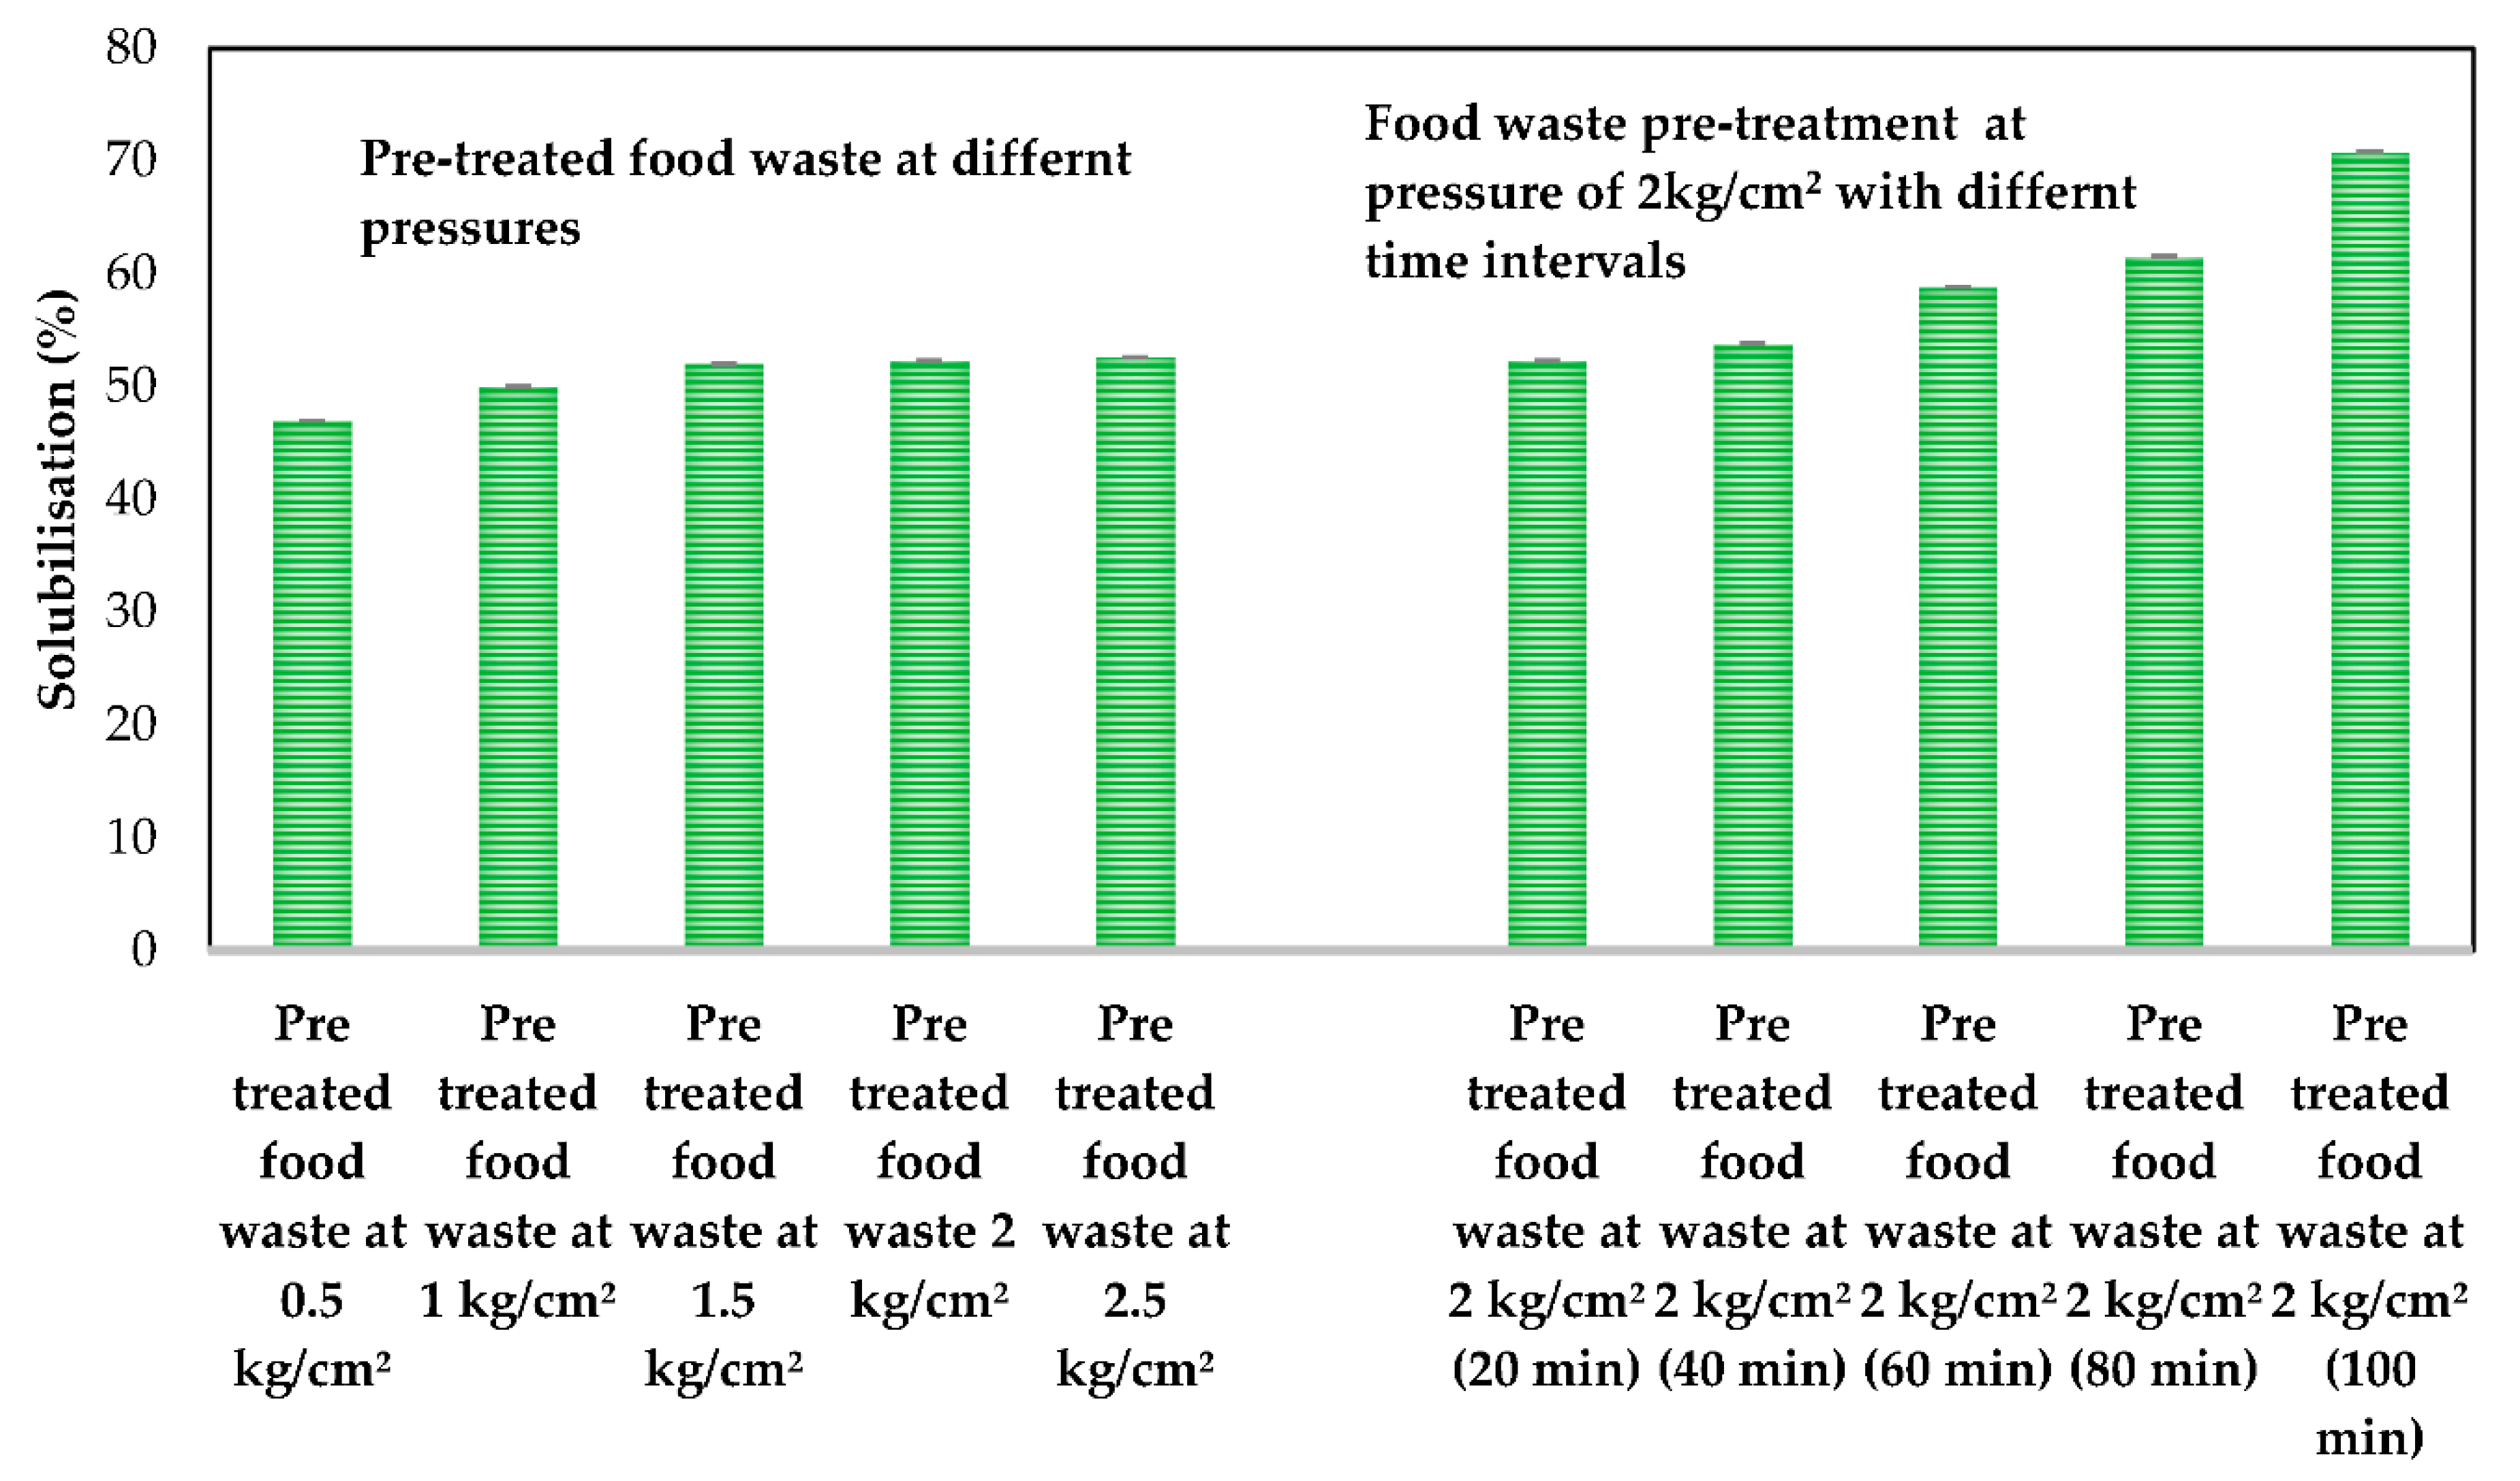
3.1. Effect of Pressurized Pretreatment on Physio Chemical Characteristics of the Food Waste

The characteristics of the food waste were tabulated and shown in Table 2. It could be observed from Table 2 that the pH of the food waste is less than 5, but VS/TS ratio is 0.8 which essentially means that the organic matter present in the substrate is comparatively higher than that of any other biodegradable substrates [4,34,35]. The high COD and favorable ratio of BOD to COD present in the substrate divulges the fact that microbial consortia could use this organic matter under anaerobic conditions for the generation of VFA and biogas [4]. The C/N ratio of the raw food waste is 24, which is optimum for the effective anaerobic digestion [36]. Food waste as such is a highly suitable substrate for the dry AD [21], but in the present study, the effect of pretreatment is studied to understand the value addition of the same in terms of methane yield, vs. reduction, overall scale up implications, etc. The characteristic of the pretreated food waste at different pressure is shown in Table 3, whereas the characteristic of the same at constant pressure (2 kg/cm2) for different time intervals (20 min to 100 min) is presented in Table 4. It can be noted from Table 3 and Table 4 that the change in composition of TS, VS and VFA is marginal whereas it is very significant in the case of soluble COD. It could be understood from these results that even though total organic matter which is represented in terms of vs. remained the same, but good amount of the organic matter solubilized resulting in increase of soluble COD depending on the pretreatment condition. This clearly shows that pretreatment is successful in converting higher chain carbon compounds into soluble compounds [29].
Increased soluble COD with its solubilization rate were evaluated before and after pretreatment and results were represented in Figure 1. It could be understood from Figure 1 that by increasing the pressure and duration of pretreatment, soluble COD of the food waste also increased due to the lysis of the cell wall that occurred due to the exposure of complex molecules such as carbohydrates, lipids and proteins to high pressure and temperature [37]. It could be observed from Figure 1 that by increasing the pressure the soluble COD also increased linearly and a maximum soluble COD of 60 ± 0.8 g/L was recorded in the phase I experiments at a pressure of 2.5 kg/cm2. However, in the phases, a soluble COD of 85 ± 0.1 g/L was recorded even at a pressure of 2.5 kg/cm2, when the duration of the pretreatment is 100 min. The solubilization to the extent of 71% could be attributed to the fact that macro molecules are getting liquefied and released to the solution and hence soluble COD is getting increased due to pressurized pretreatment [38]. The huge difference in the soluble COD is due to the release of organic macromolecules in to the liquid form due to pressurized pretreatment [38]. In this context, it is worthwhile to examine, whether soluble COD that is increased due to pretreatment would be available to the microbial consortia to yield higher methane and carbon removal.

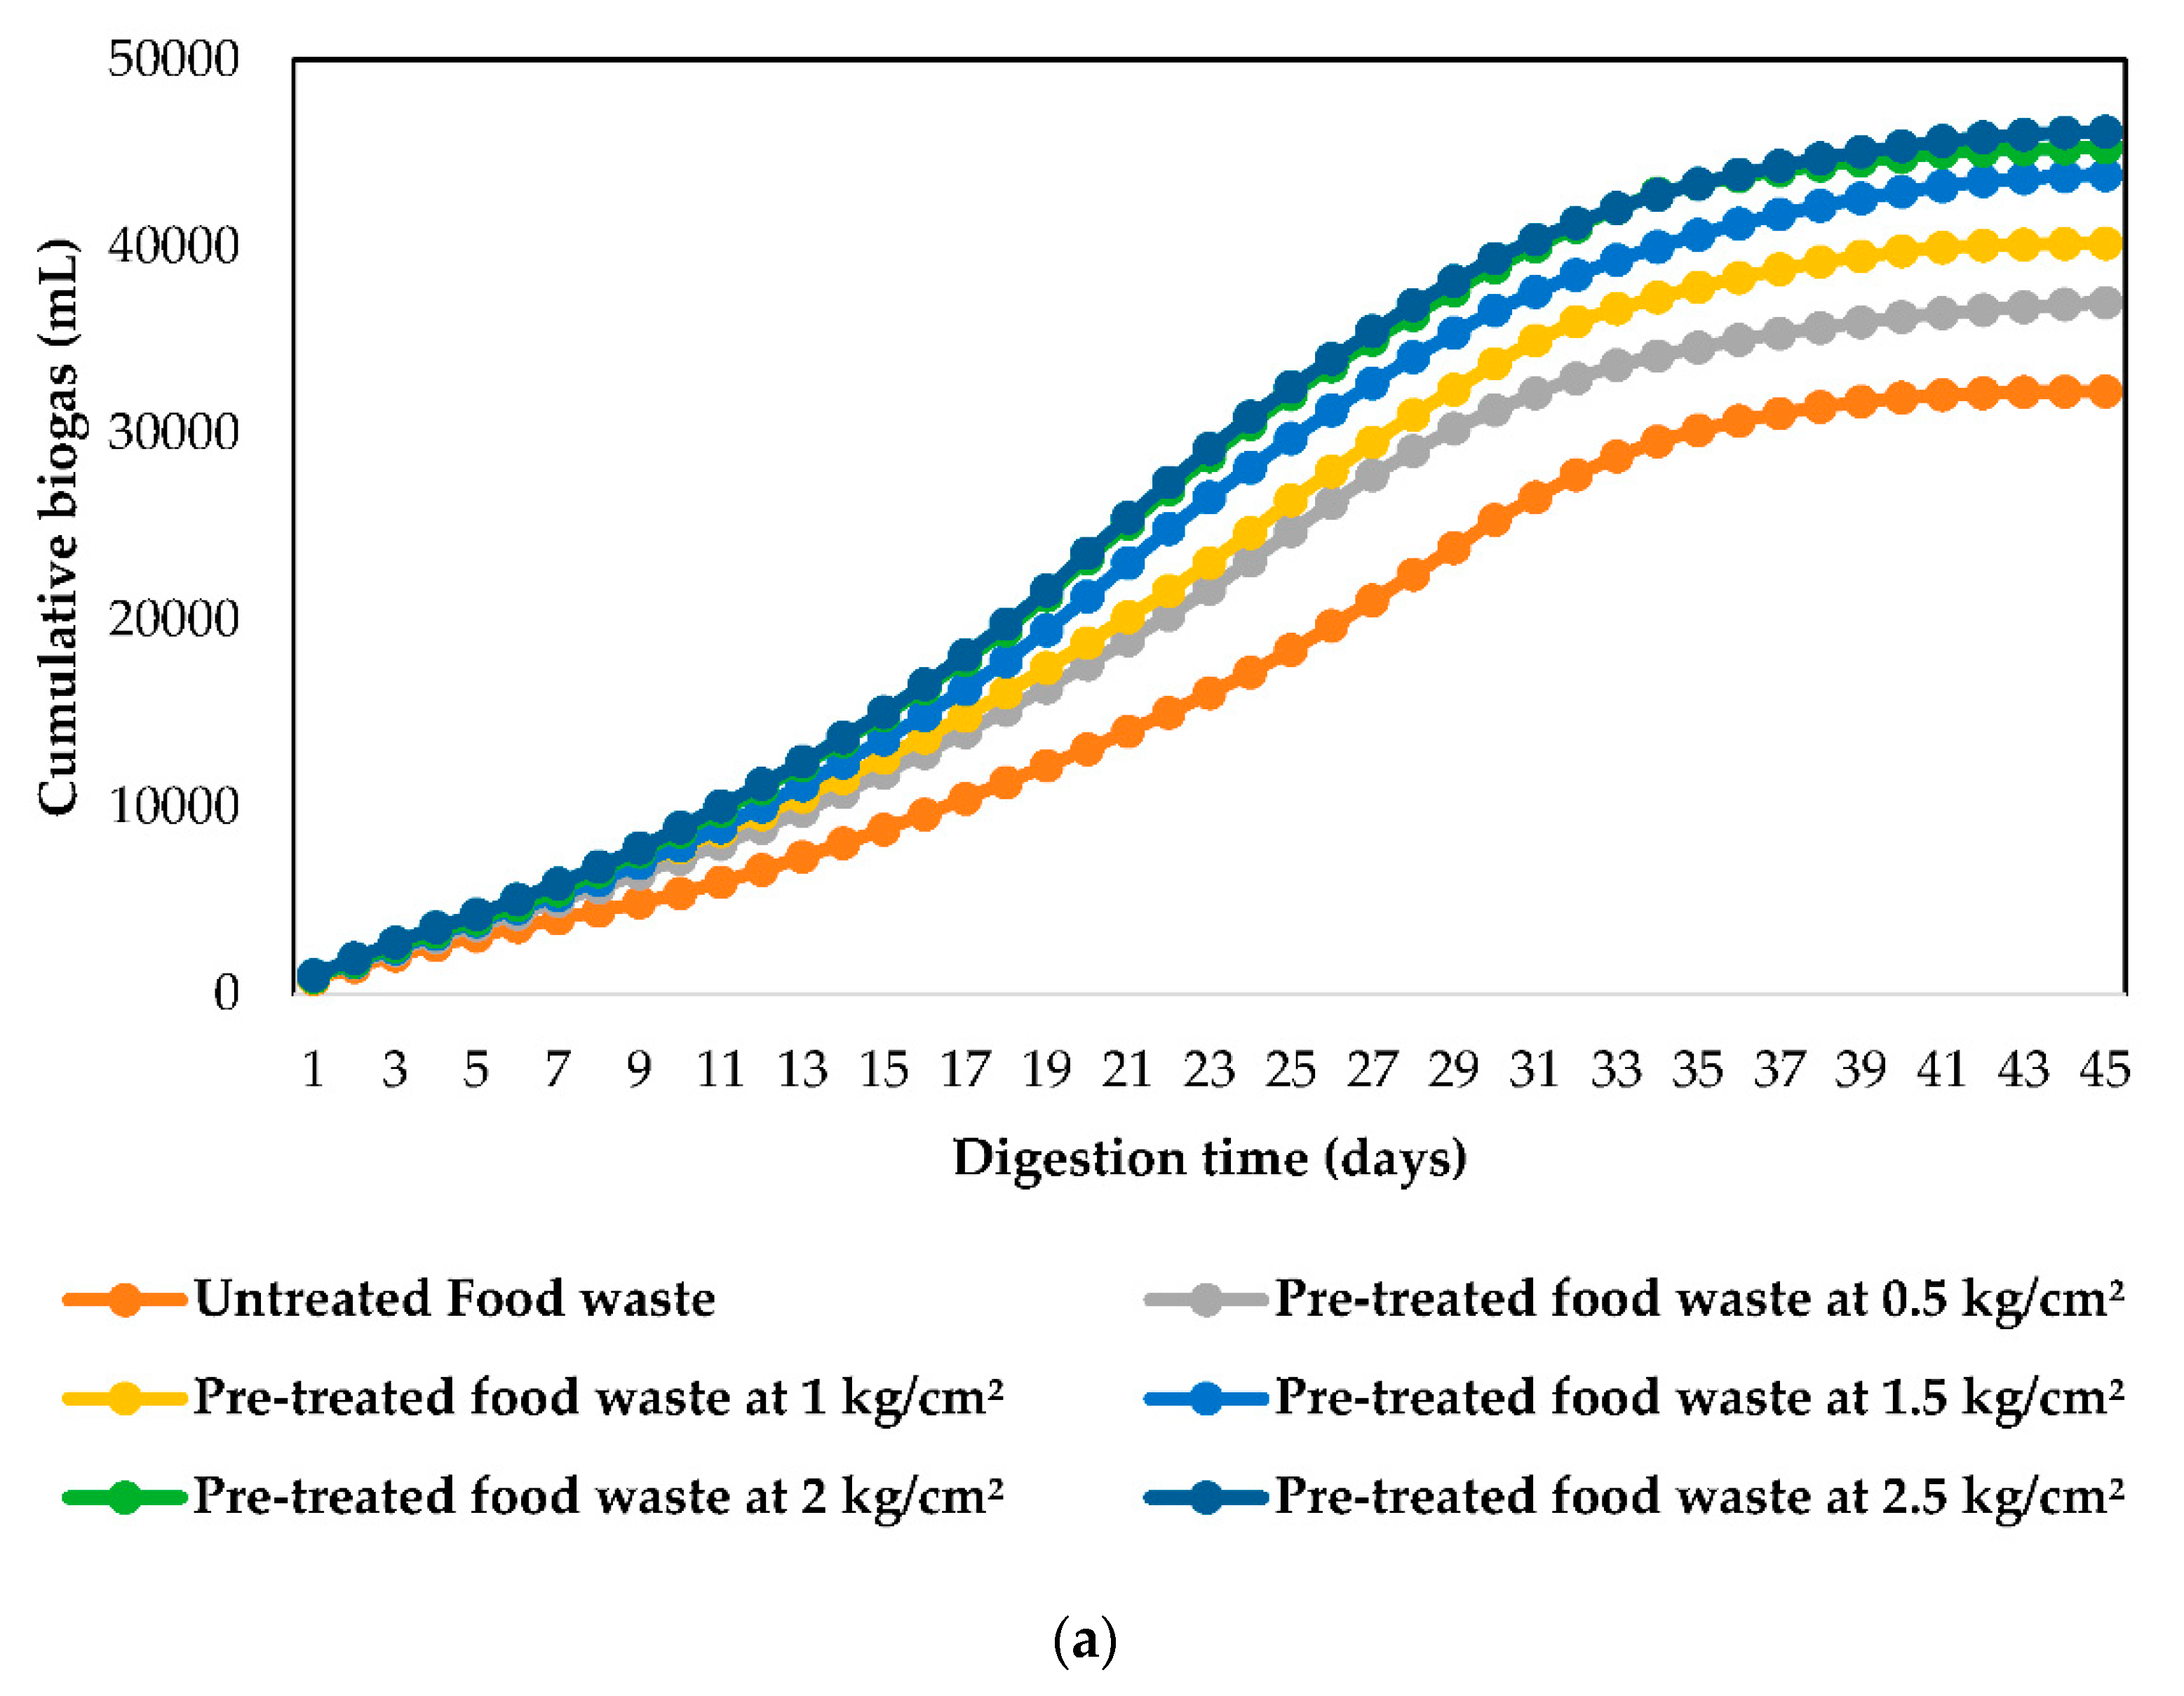
3.2. Impact of Pretreatment at Different Pressures on Biogas Generation

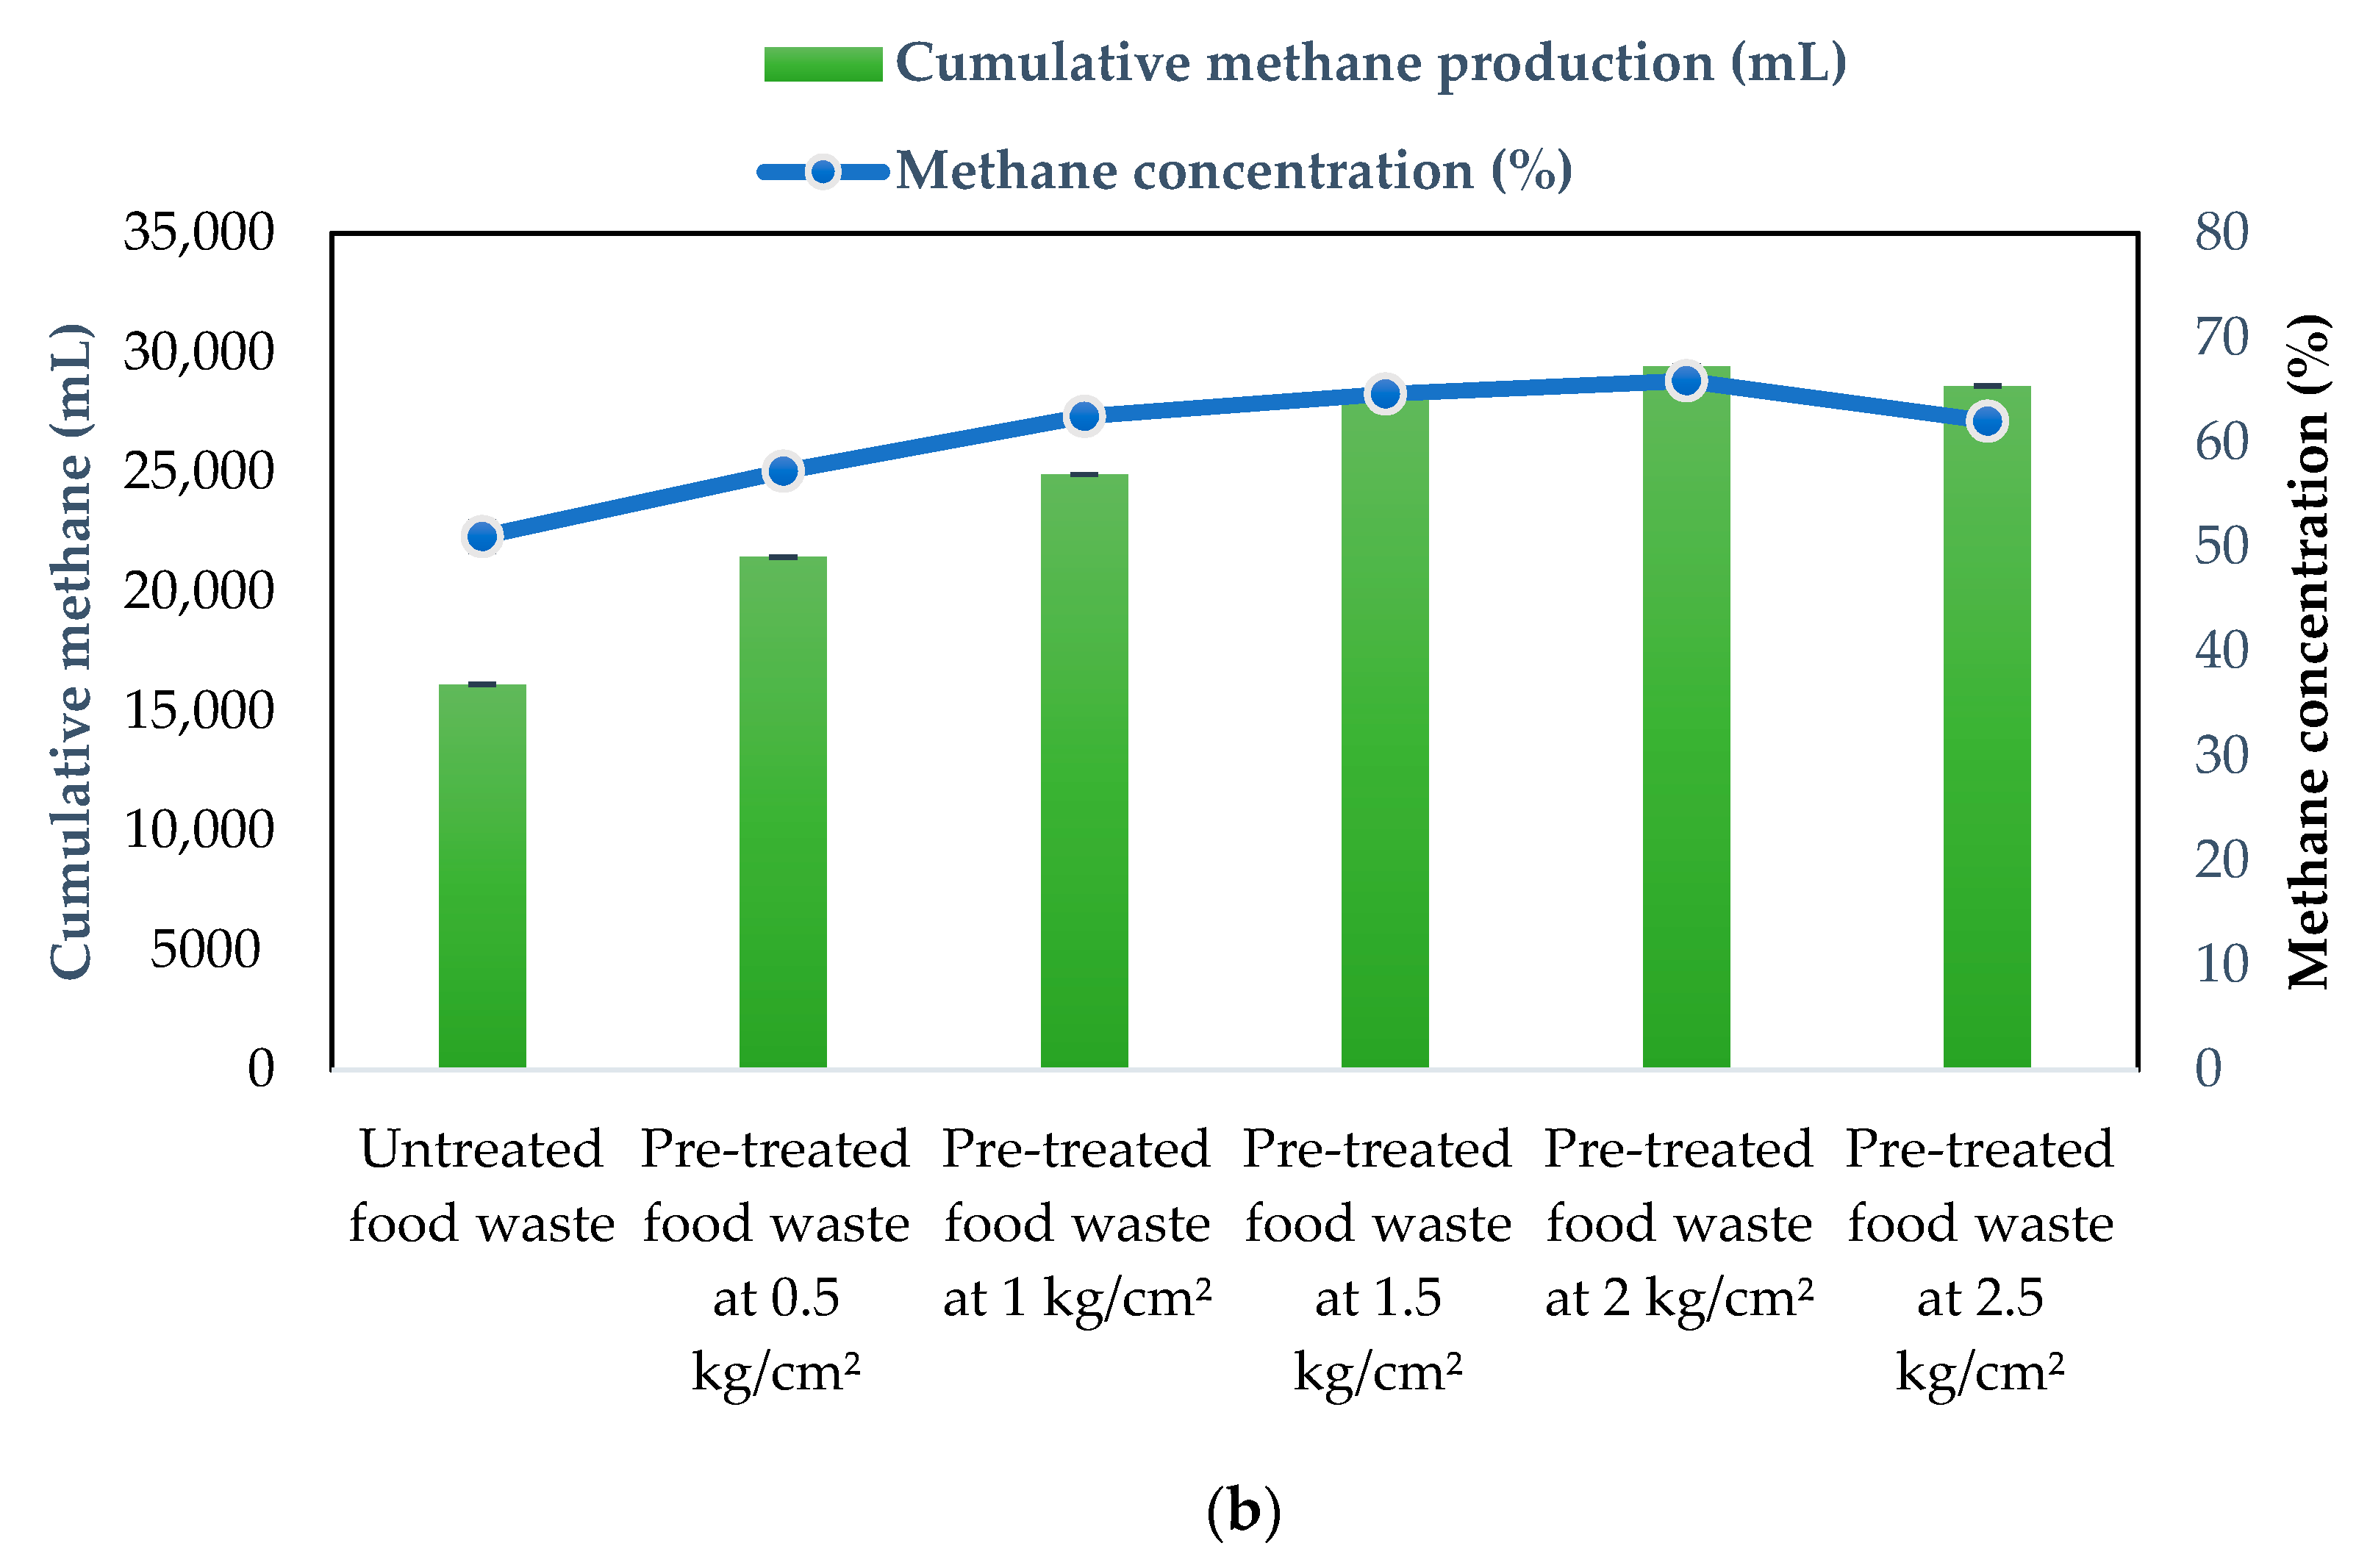
3.2.1. Cumulative Biogas and Methane Generation

The cumulative biogas generation profile of the dry AD reactors operated for a period of 45 days with pretreated food waste at different pressures along with untreated food waste is plotted graphically and shown in Figure 2a. It could be observed from Figure 2 that—in anaerobic batch reactors with 0.5-kg/cm2, 1-kg/cm2, 1.5-kg/cm2, 2-kg/cm2 and 2.5-kg/cm2 pressure pretreatment—the cumulative biogas generation of 37,000 mL, 40,175 mL, 43,840 mL, 45,300 mL and 46,150 mL was obtained, respectively. However, cumulative biogas of only 32,240 mL was generated from untreated food waste. It is interesting to note that the cumulative biogas generated in pretreated food waste at a pressure of 0.5 kg/cm2 with respect to same in untreated food waste is shown an improvement of only 14.7%, whereas it is remarkably good in the reactors operated with pretreated food waste at pressures of 1, 1.5, 2 and 2.5 kg/cm2 showing an increase of 25%, 40%, 40.5% and 43%, respectively. This could be attributed to the fact that pretreatment of food waste at different pressures resulted in conversion of organic matter to soluble COD which eventually resulted in generation of more biogas. The cumulative methane generation with methane concentration profile of pretreated food waste anaerobic batch reactors at different pressures along with untreated food waste is plotted graphically and shown in Figure 2b. It can be observed from Figure 2b that cumulative methane generation and methane concentration of 21,460 mL and 58%, 24,909 mL and 62%, 28,058 mL and 64%, 29,445 mL and 65% and 28,613 mL and 62% were obtained for pretreated food waste at pressures of 0.5, 1, 1.5, 2 and 2.5 kg/cm2, respectively, whereas for untreated food waste it is only 16,120 mL and 50%. The improvement in the methane concentration in case of pretreated food waste compared to untreated food waste is in the range of 15%–28% and cumulative methane is in the range of 33% to 83% (Figure 2b). However, it could be noted that cumulative methane generation dropped in the case of pretreated food waste at 2.5 kg/cm2 in comparison to 2.0 kg/cm2 with a reduction in methane generation by 832 mL due to the drop in methane concentration from 65% to 62%. It could be derived from these results that pretreatment beyond 2-kg/cm2 pressure may not be required as the methane concentration is getting decreased. It is understood from the previous work reported by Merkle et al. [39] that—when the pressure is enhanced to certain limit—it results in the generation of other gases such as N2 that would reduce the methane in biogas. Therefore, it can be disclosed that biogas generation along with methane content in biogas could be enhanced by pretreatment of food waste up to the pressure of 2 kg/cm2 only.

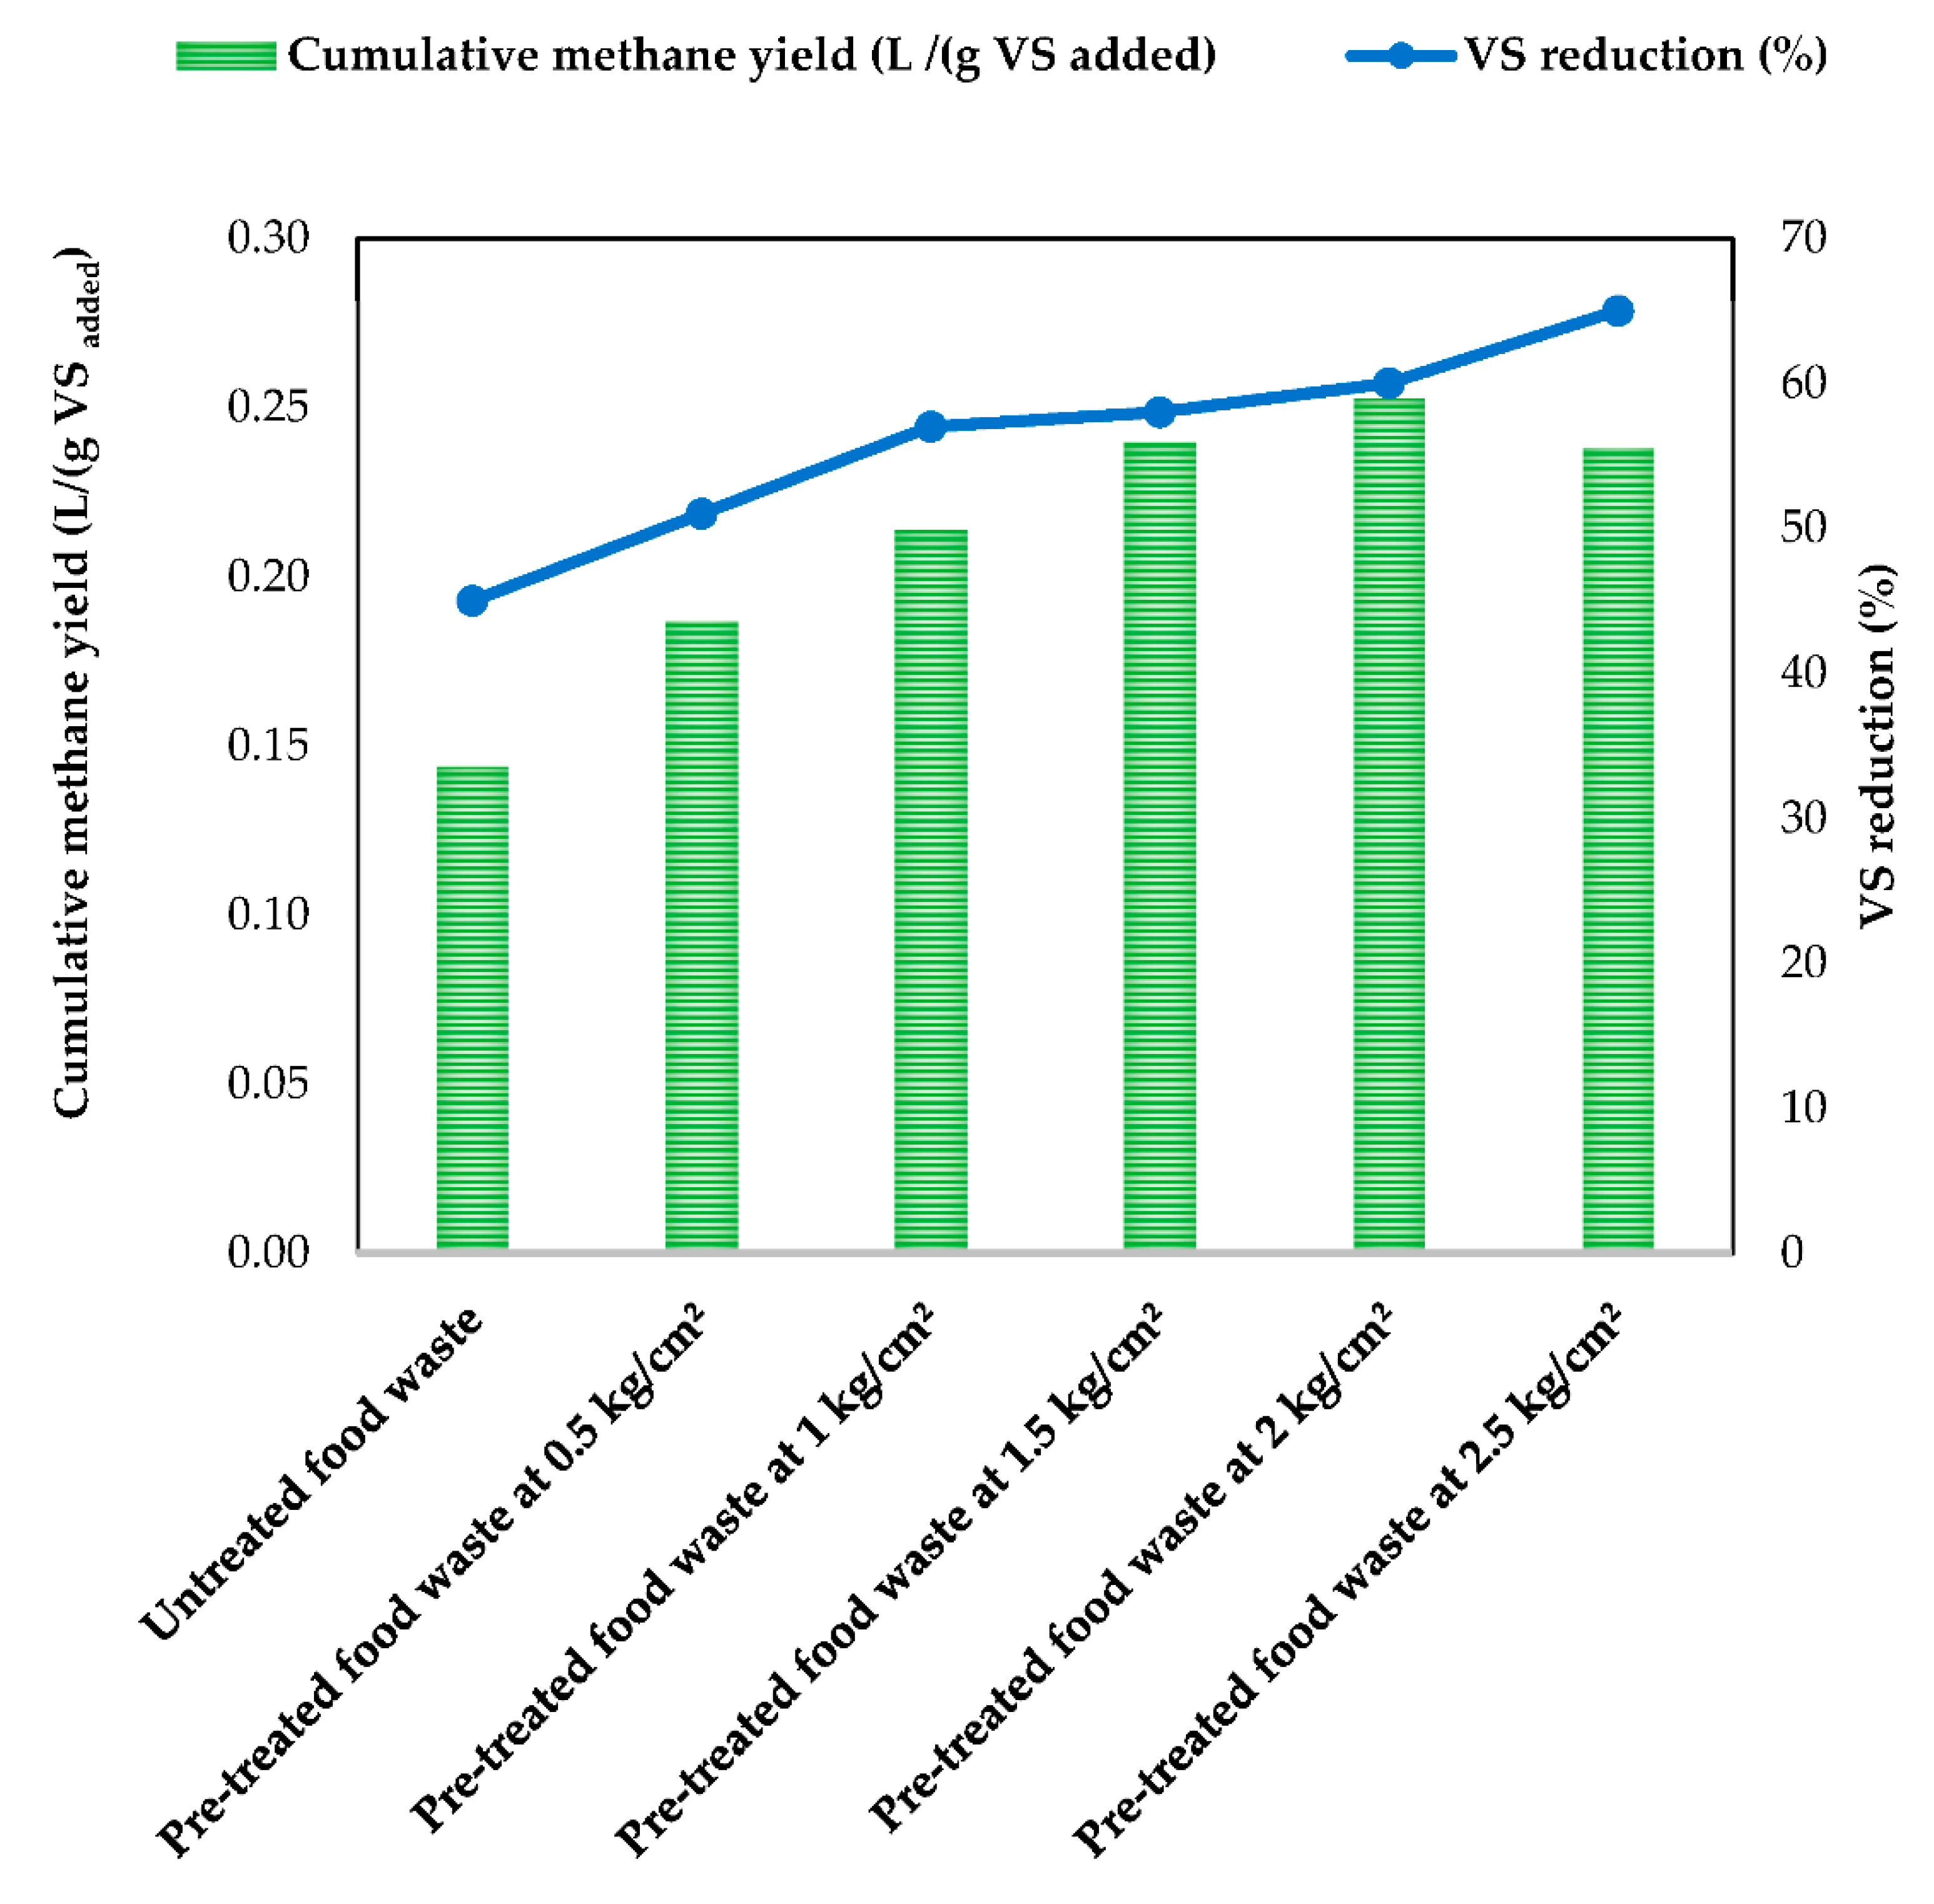
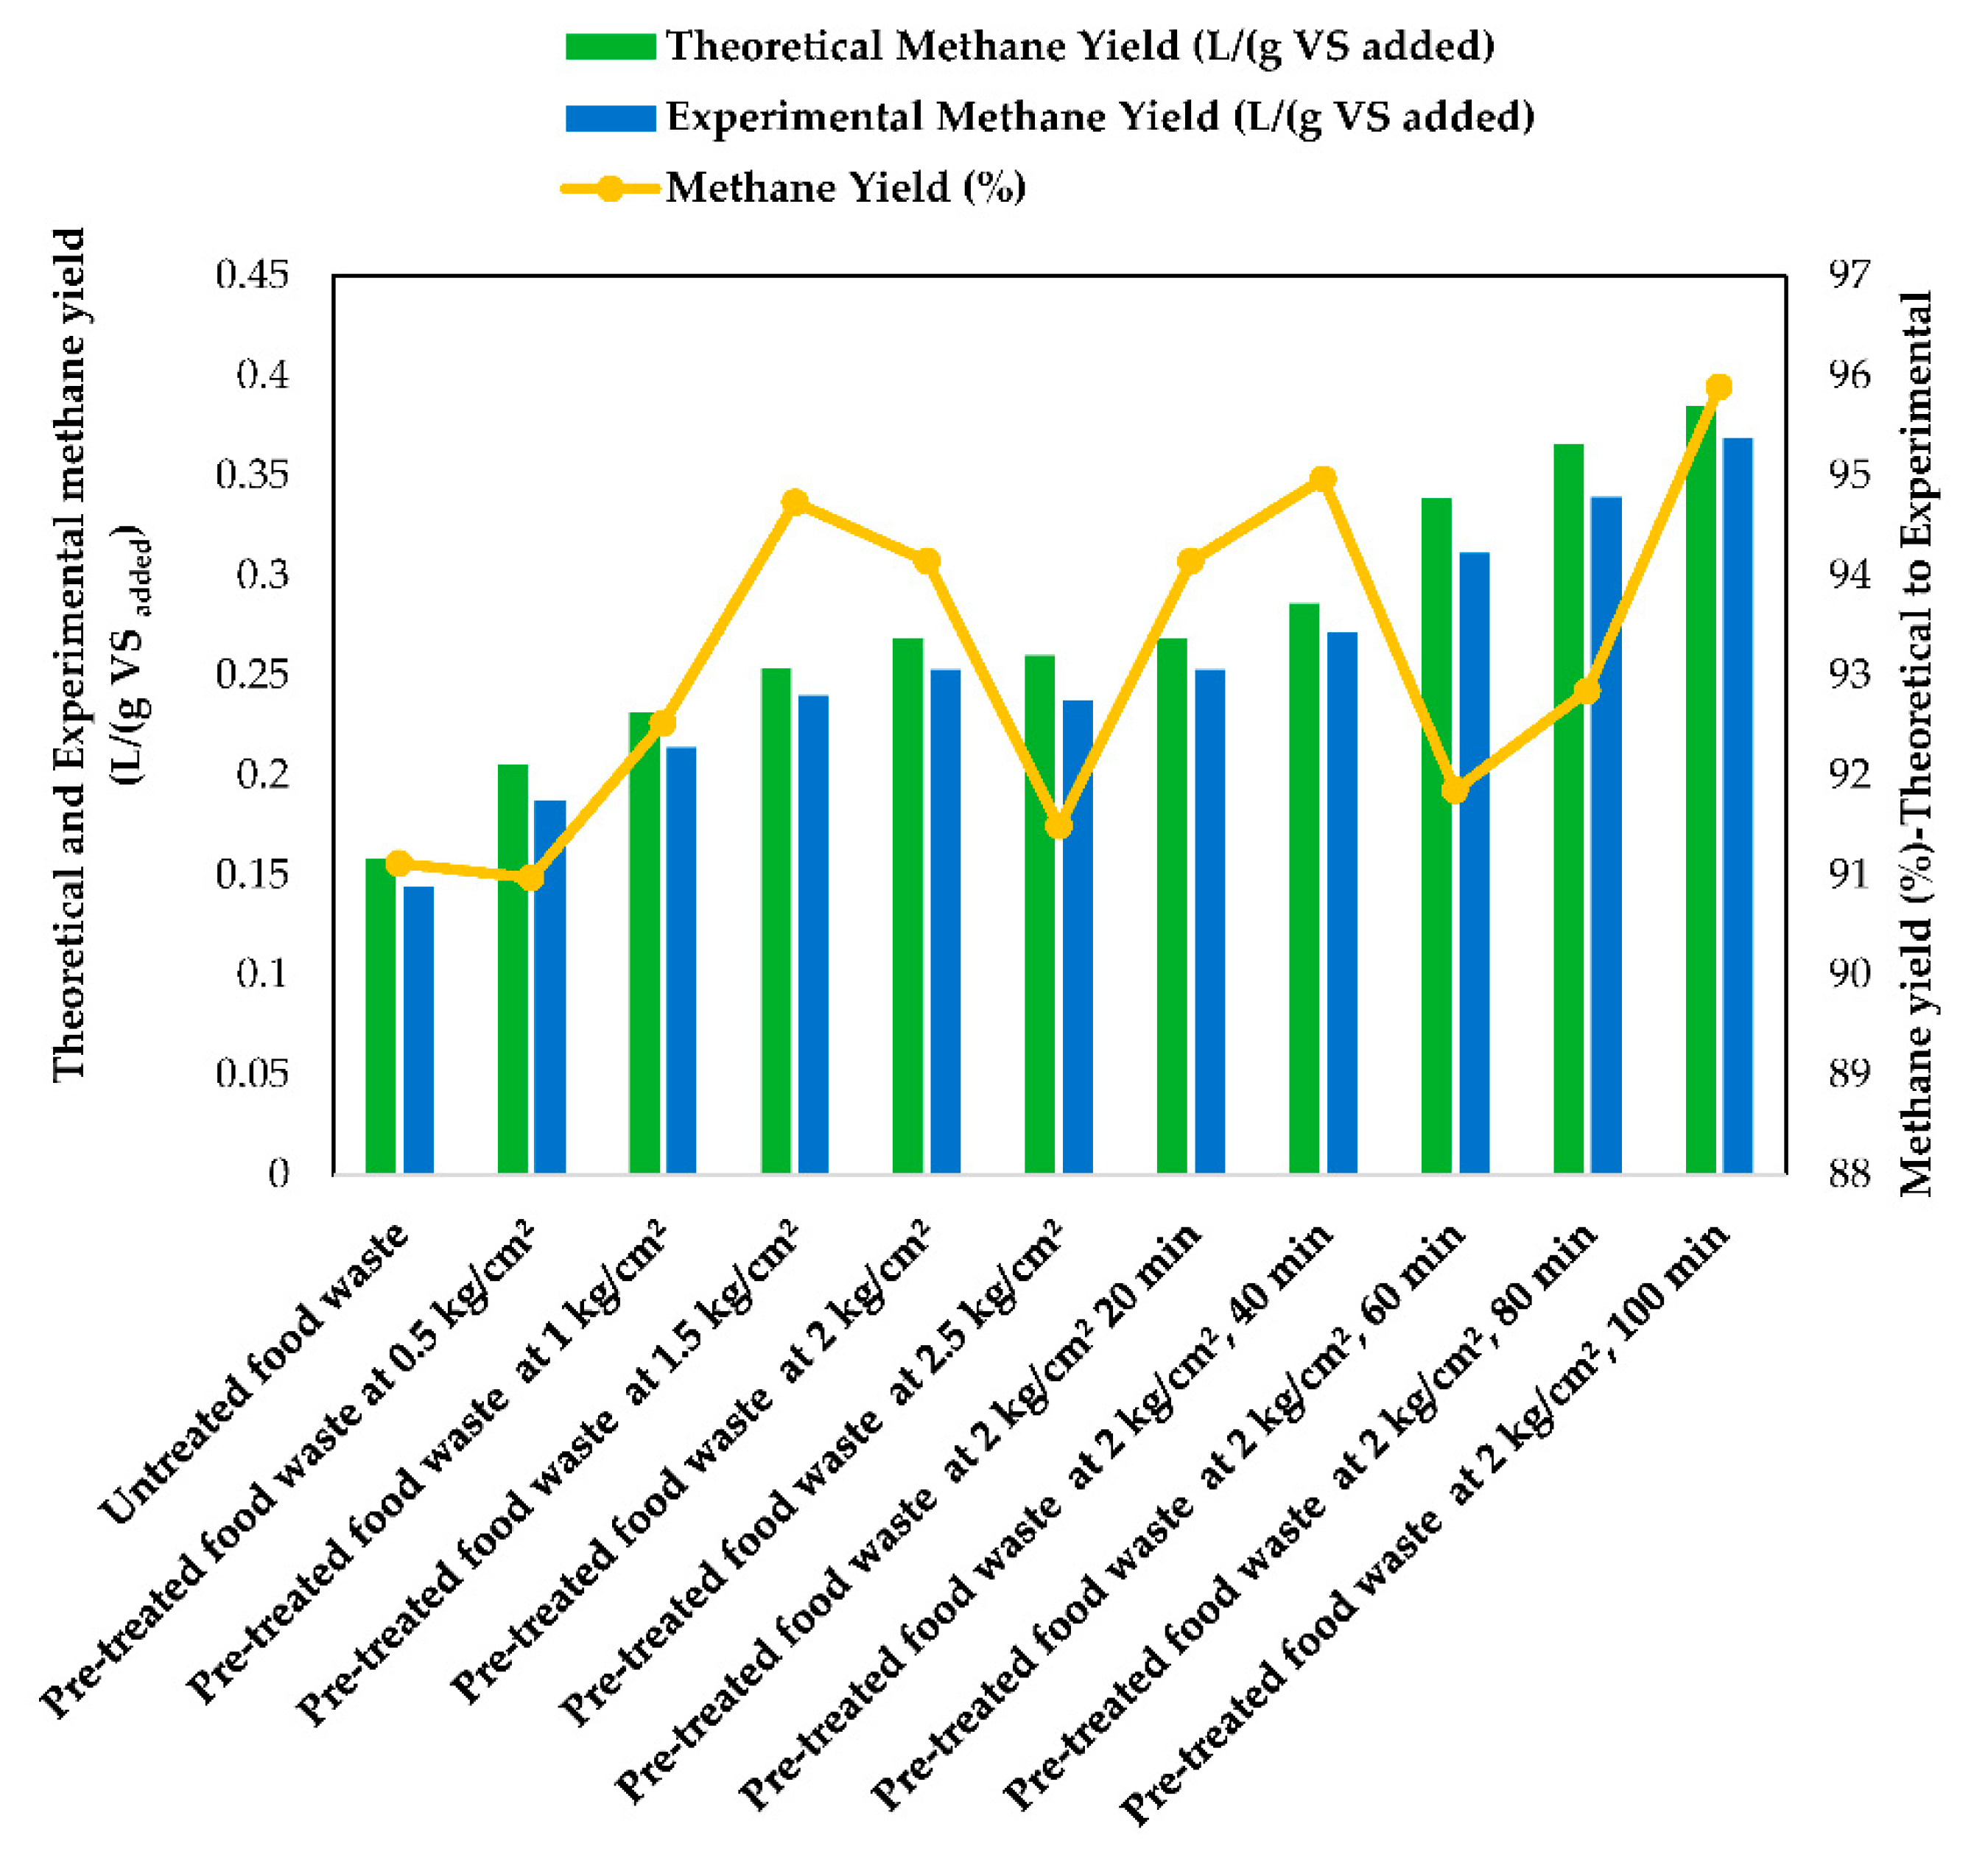
3.2.2. Methane Yield and Volatile Solids Reduction

The gross methane yield and vs. reduction (%) of untreated and pretreated food waste at different pressures of 0.5, 1, 1.5, 2 and 2.5 kg/cm2 is depicted graphically and shown in Figure 3. It can be noticed from Figure 3 that the methane yield and vs. reduction of 0.187 L CH4/(g vs. added) and 51%, 0.214 L CH4/(g vs. added) and 57%, 0.240 L CH4/(g vs. added) and 58%, 0.253 L CH4/(g vs. added) and 60% and 0.238 L CH4/(g vs. added) and 65% was obtained, respectively, for pretreated food waste at pressures of 0.5, 1, 1.5, 2 and 2.5 kg/cm2. In contrast, the gross methane yield and vs. reduction for untreated food waste is 0.14 L CH4/(g vs. added) and 45% only (Figure 3). Hence, it could be ascertained from these results that the pretreatment of food waste enhances the gross methane yield as well as vs. reduction. It is worthwhile to note that the vs. reduction (%) gradually increased from 51% to 65%, when the pressure is increased from 0.5 to 2.5 kg/cm2 reiterating the fact that the pretreatment of food waste enhanced the soluble COD in the substrate and the same was easily available for the methanogens to consume and produce biogas [40]. Although, all the reactors with pretreated food waste showed increasing trends of cumulative methane yield, but the highest cumulative methane yield of 0.253 L CH4/(g vs. added) is obtained for the pretreated food waste at 2-kg/cm2 pressure even though vs. reduction is more (65%) for pretreated food waste at 2.5 kg/cm2. Therefore, it could be ascertained from these results that the pretreatment of food waste at 2-kg/cm2 pressure at which saturation temperature is 120 °C could be better in comparison with pretreatment at other pressures (0.5-, 1-, 1.5-, 2- and 2.5-kg/cm2 pressure). Now, it is imperative to understand the optimum time duration of pretreatment at 2-kg/cm2 pressure and 120 °C for enhanced methane yield and vs. reduction.

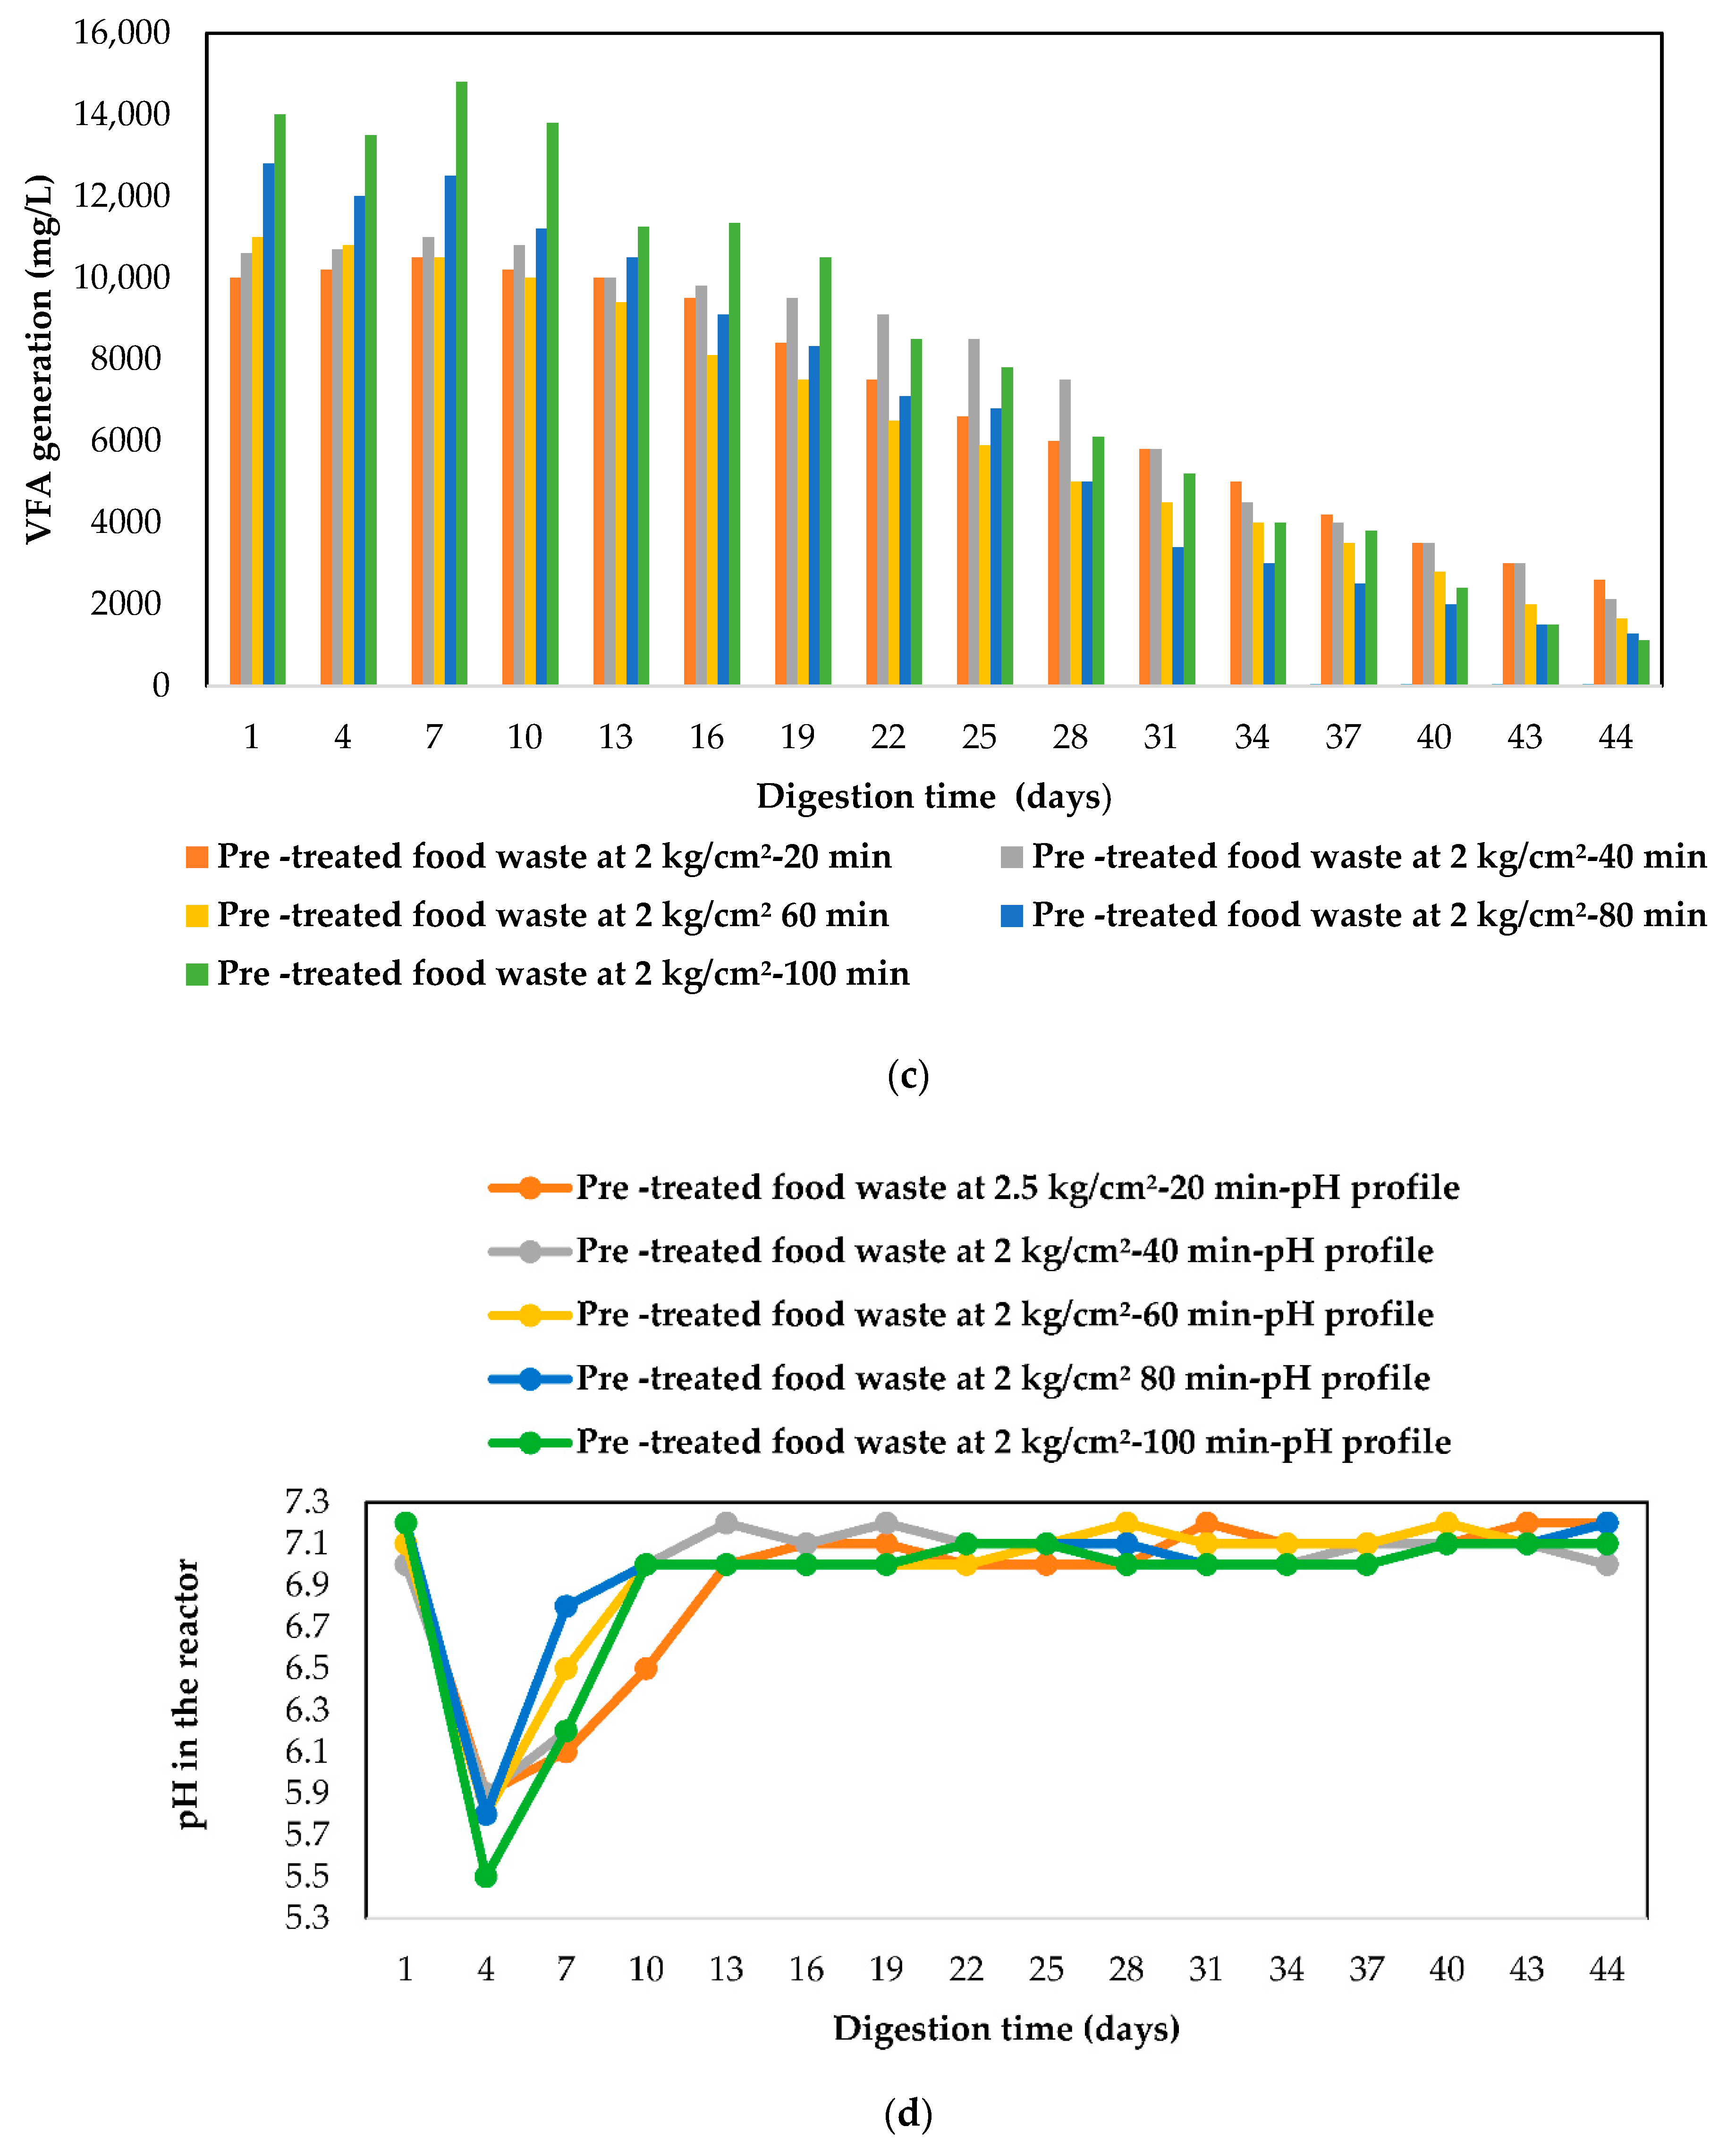
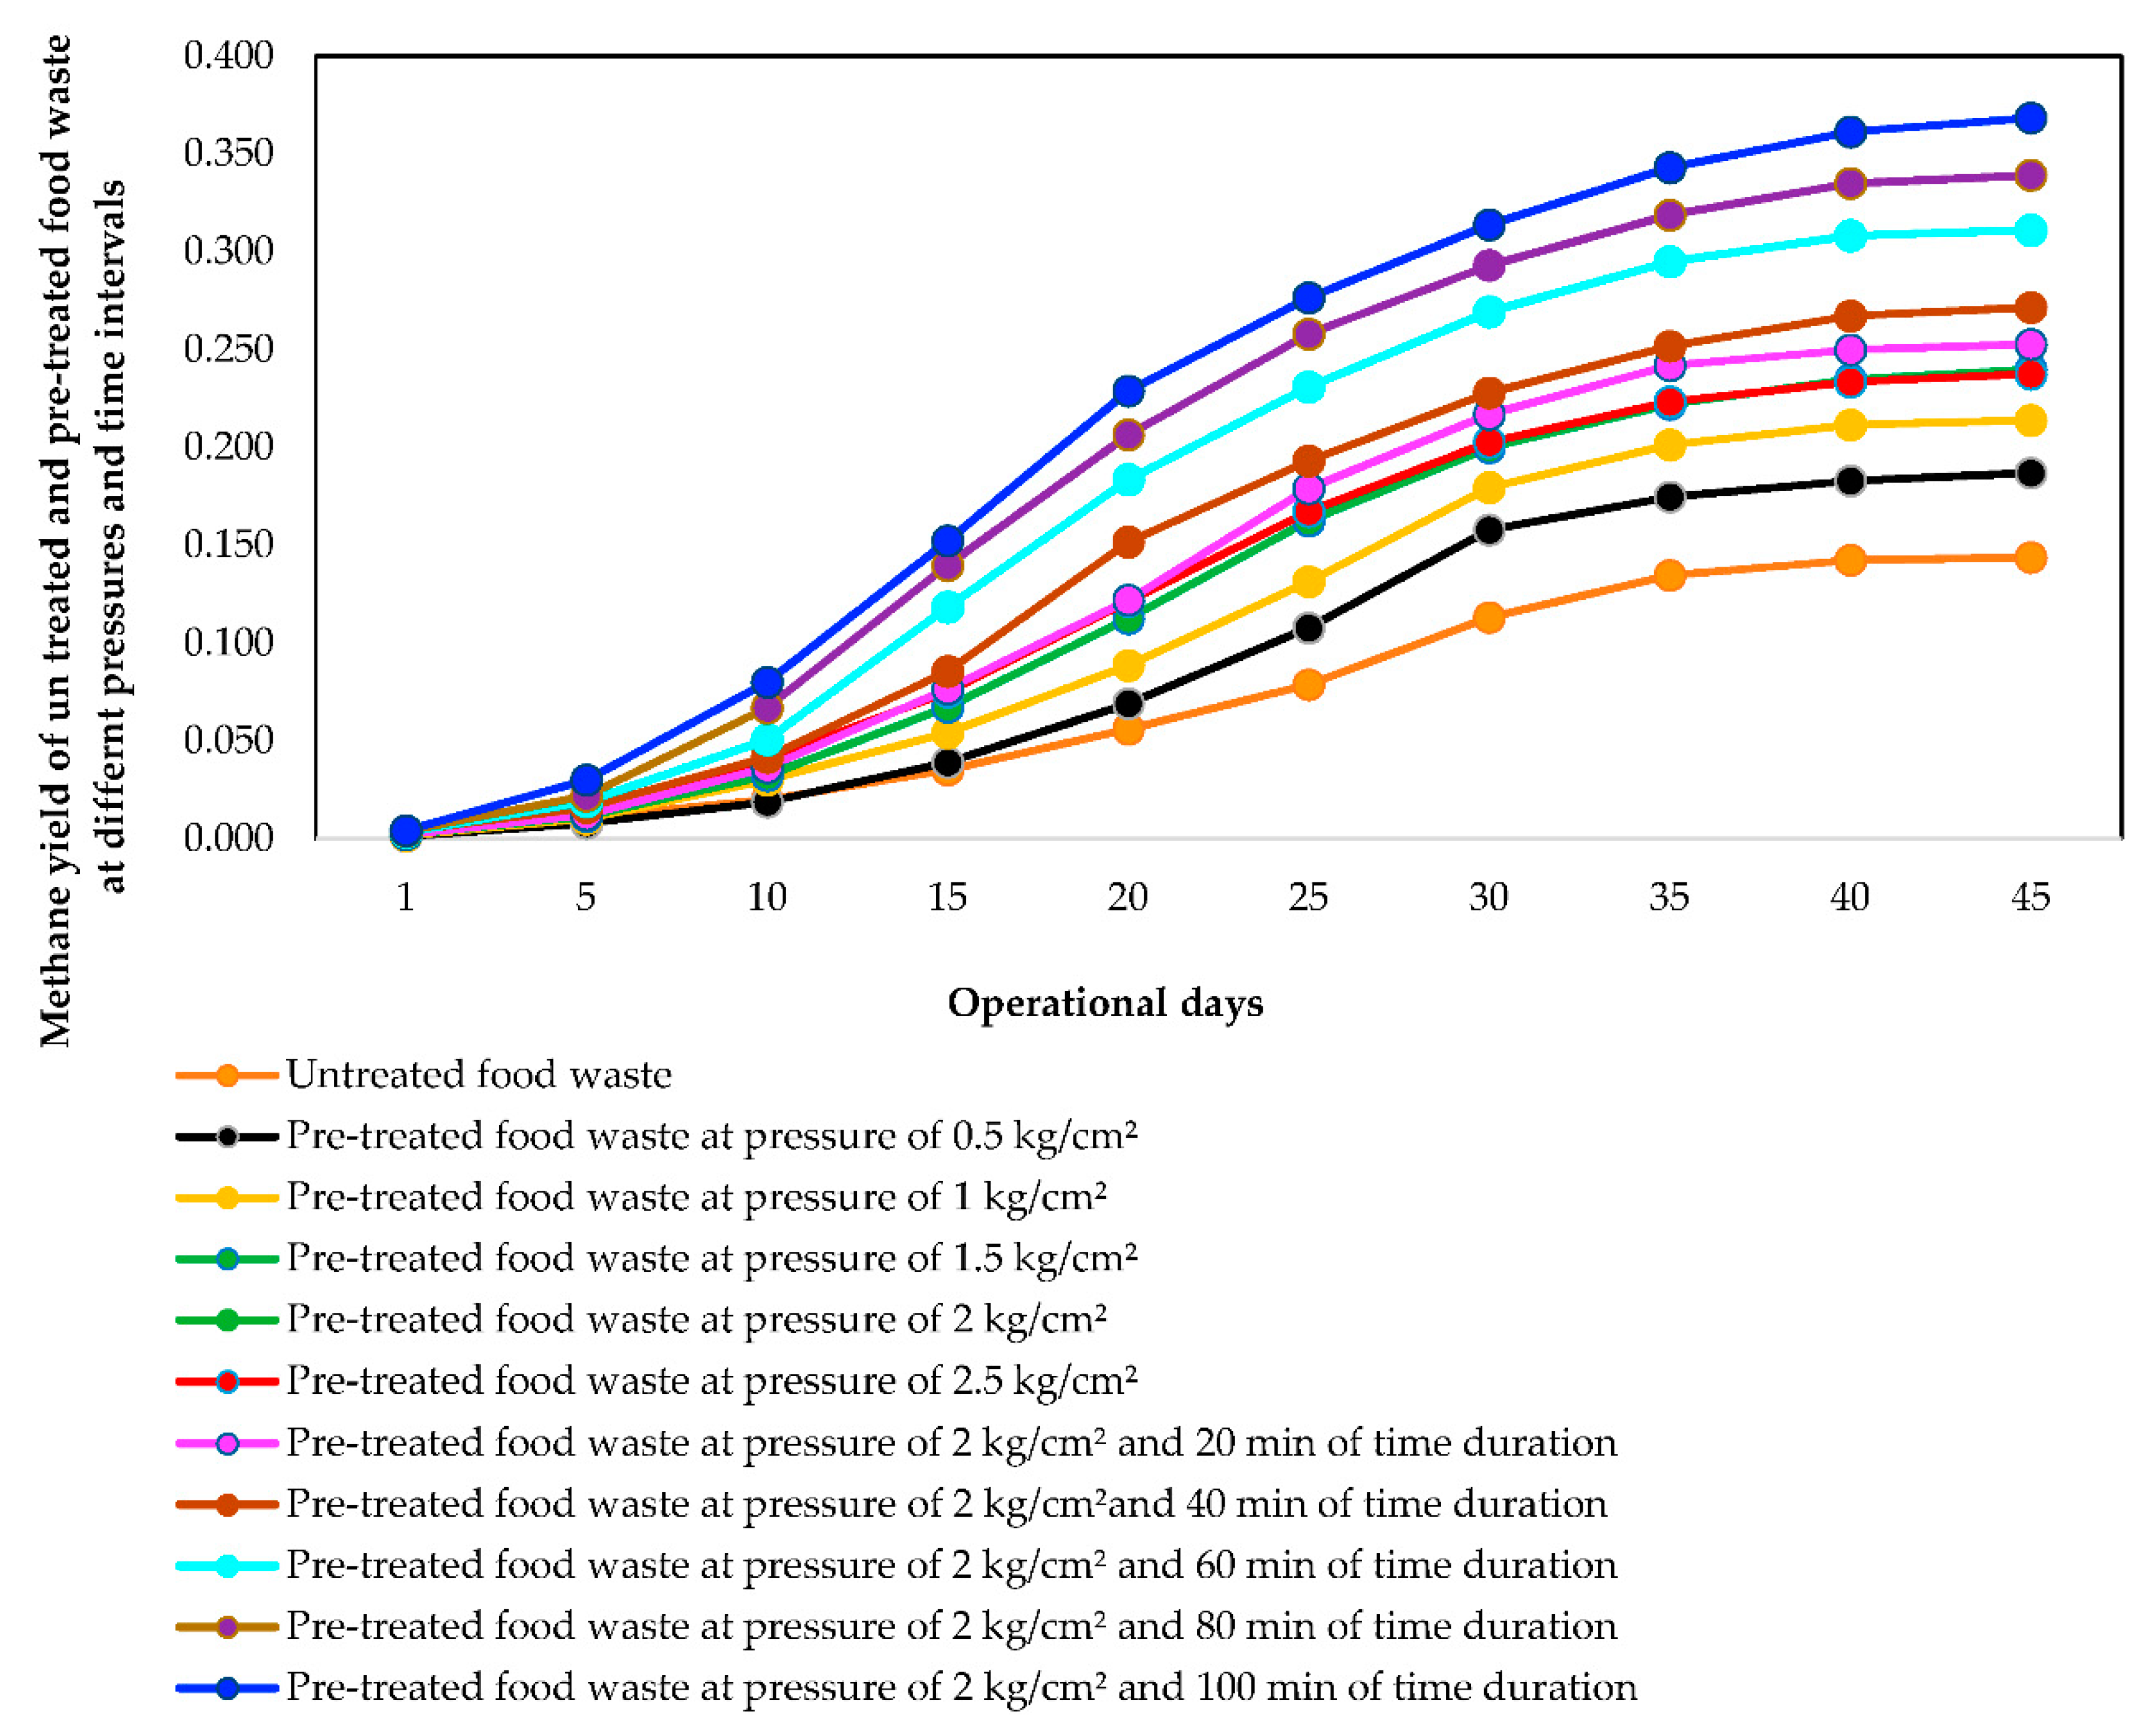
3.3. Impact of Time of Pretreatment at 2-kg/cm2 Pressure on Cumulative Biogas Generation and Methane Concentration

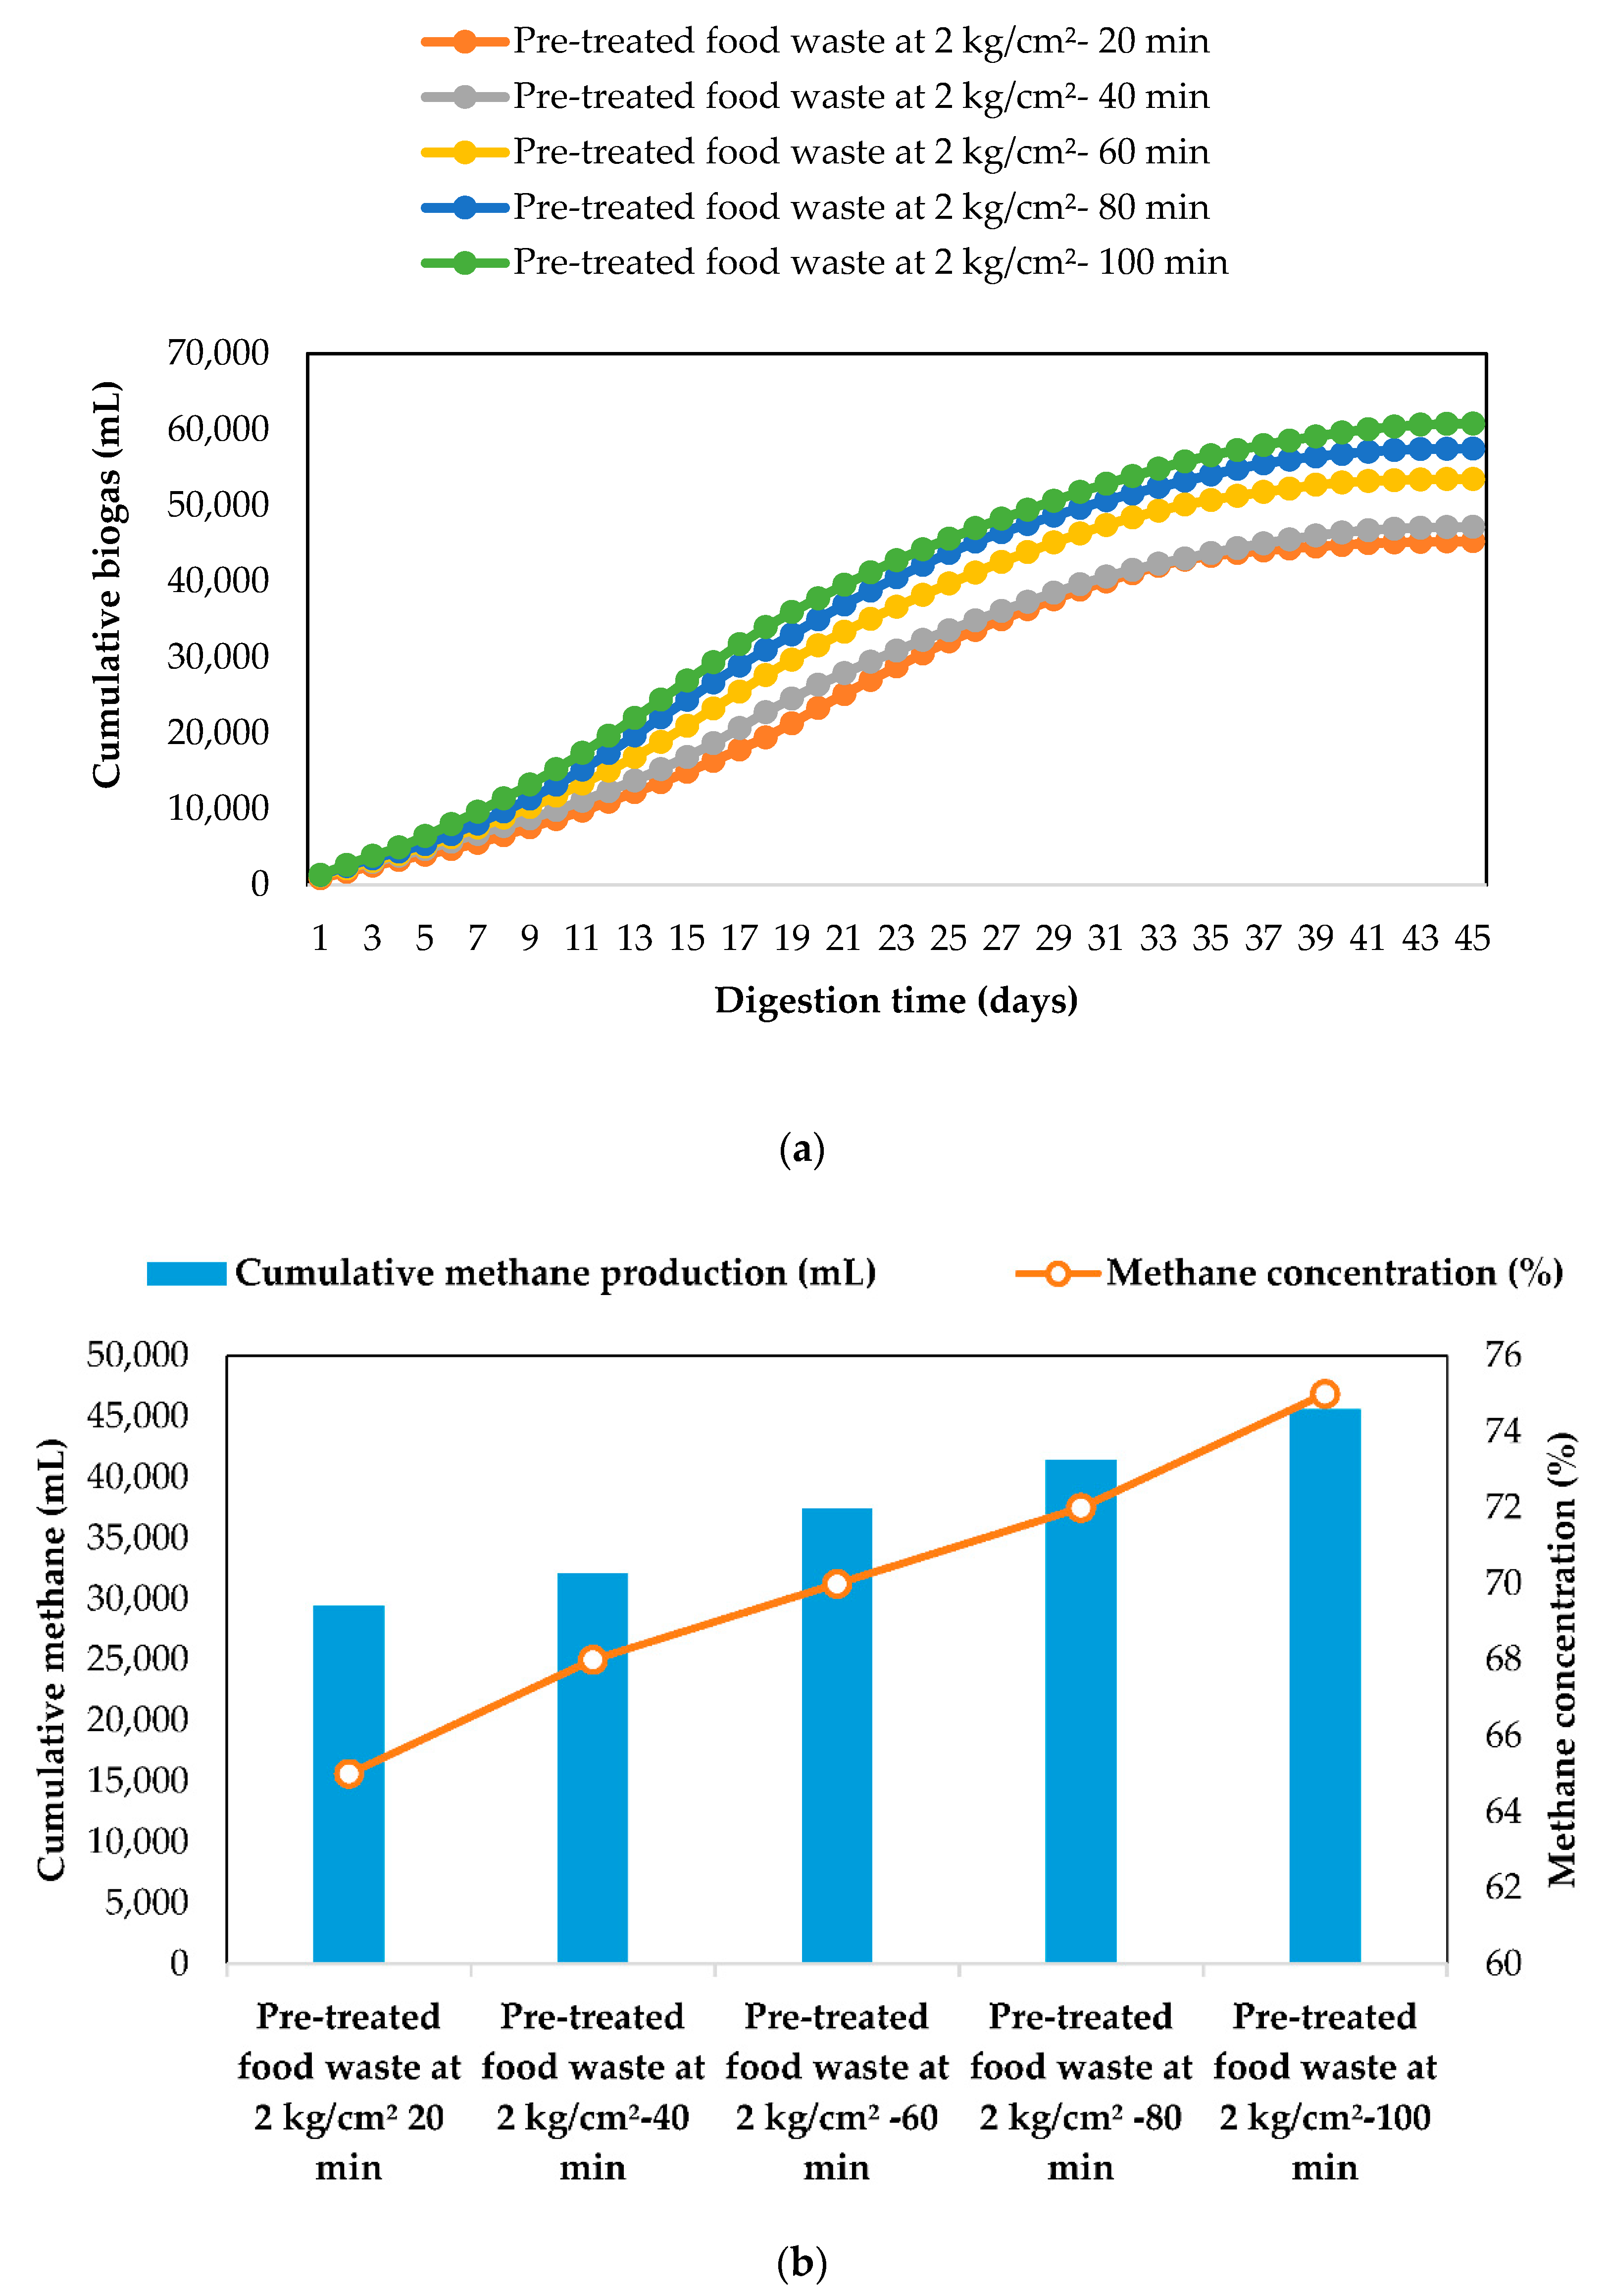
3.3.1. Cumulative Biogas and Methane Generation

The daily biogas generation profile of the pretreatment of food waste (2 kg/cm2) at different durations of pretreatment is plotted graphically and shown in Figure 4a. It could be observed from the Figure 4 that the cumulative biogas in the pretreated food waste at different time durations of 20 min, 40 min, 60 min, 80 min and 100 min is 45,300 mL, 47,200 mL, 53,500 mL, 57,502 mL and 60,800 mL, respectively. It is interesting to note that the biogas generation increased in the pretreated food waste with increased pretreatment time duration and an overall increase in the biogas in the reactors from duration of 20 to 100 min compared to untreated food waste was in the range of 40–88% which is quite significant. Cumulative biogas generation along with methane concentration in biogas (%) for pretreated food waste (2 kg/cm2) for different durations of pretreatment is plotted graphically and shown in Figure 4b. It could be observed from the Figure 4b that—in the reactors where pretreatment of food waste is for duration of 20 min, 40 min, 60 min, 80 min and 100 min—the cumulative methane generation and methane concentration of 29,445 mL and 65%, 32,096 mL and 68%, 37,450 mL and 70%, 41,401 mL and 72% and 5600 mL and 75% was obtained respectively. Therefore, it can be disclosed that the biogas generation could be enhanced by pretreatment of food waste at different pretreatment time intervals, while enhancing the methane content in the biogas. It was reported in the previous work that substrate containing higher organic matter like pig manure with pretreatment at 125 °C and above recorded the maximum of 29% increase in the methane yield [41] and also a study done by Prabhudessai et al. [42] found that 357 mL/(g VS) of methane yield was observed with pretreated cottage cheese solid waste at 120 °C for 20 min. Yeshanew et al. [29] reported that a highest methane yield of 442 (±8.6) mL/gVS added observed after pretreatment of food waste at 80 °C. The results obtained in the present work are also in agreement the results obtained in the previous works as stated above.

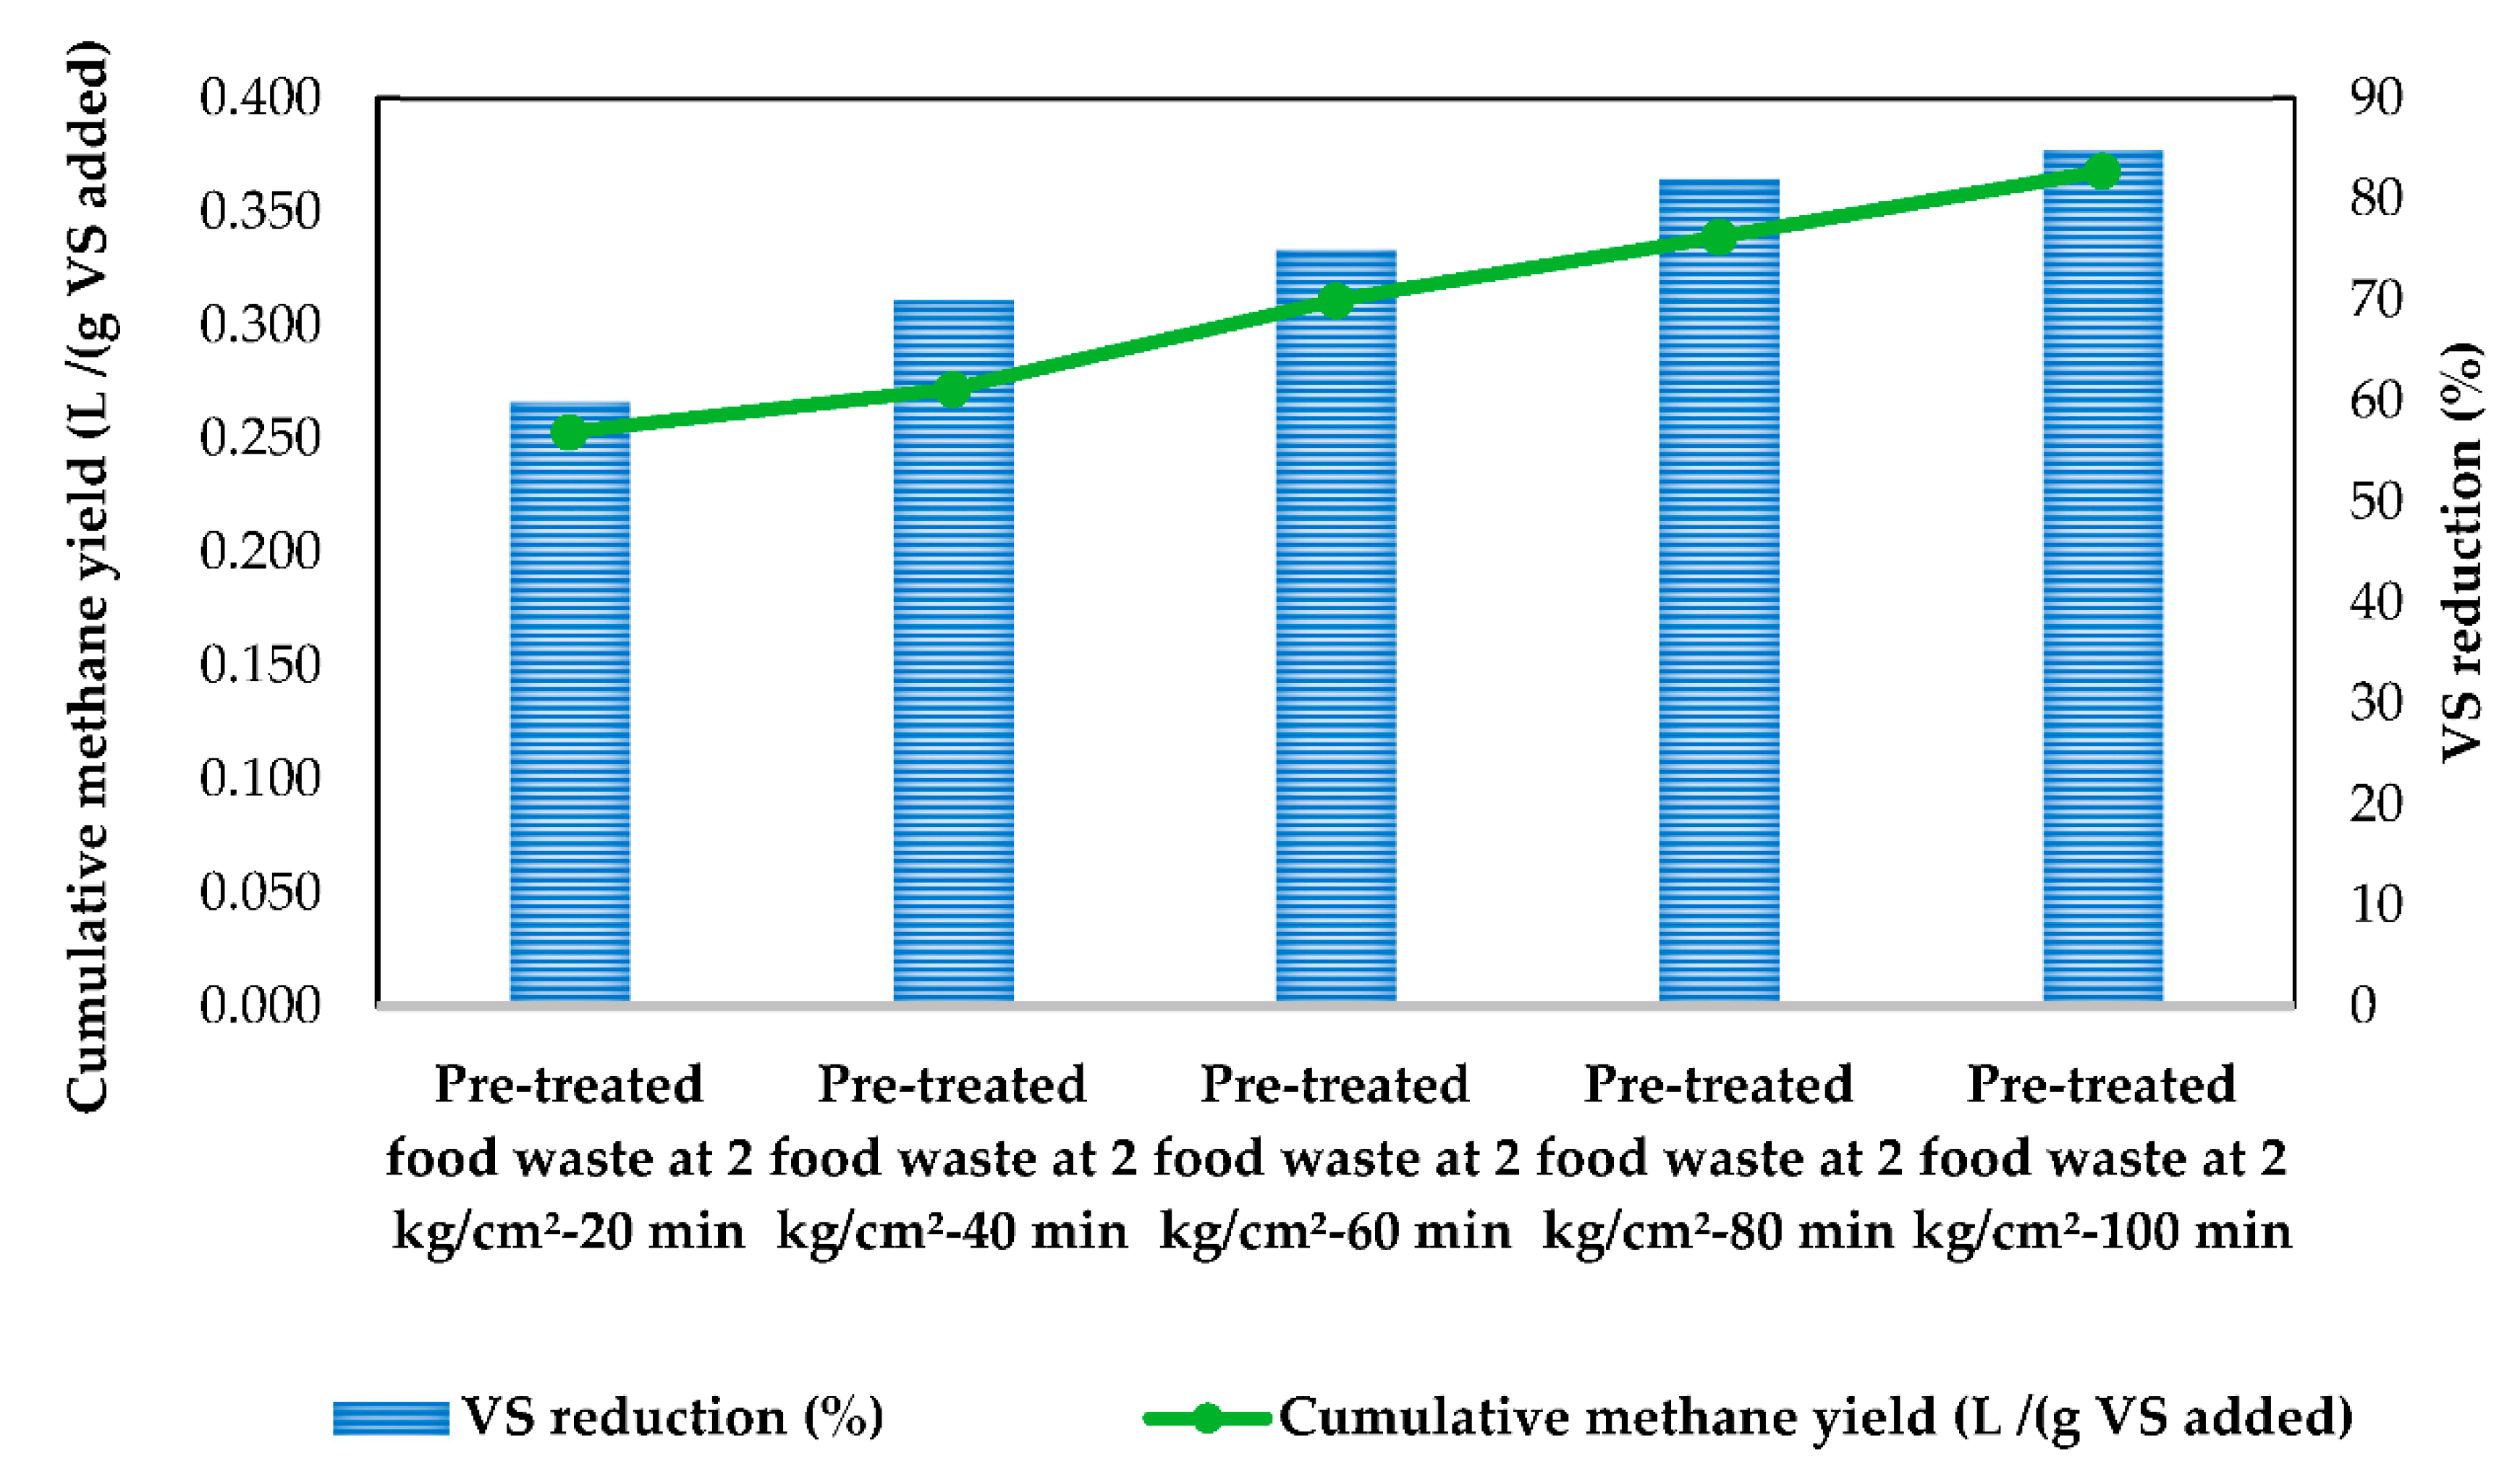
3.3.2. Methane Yield and Volatile Solids Reduction

The methane yield and vs. reduction (%) in the reactors with pretreatment of food waste at 2-kg/cm2 pressure with different pretreatment time durations of 20 min, 40 min, 60 min, 80 min and 100 min is graphically shown in Figure 5. The specific methane yield in the reactors is observed to be 0.253, 0.272, 0.311, 0.339 and 0.36 L CH4/(g vs. added) at a vs. reduction of 60%, 70%, 75%, 82% and 85%, respectively. As the duration of pretreatment increased from 20 min to 100 min, the vs. reduction also increased from 60% to 85%. However, the increase in gross methane yield is marginal when the duration of pretreatment of food waste is from 20 min to 80 min. Nevertheless, the reactor in which food waste was pretreated at 2-kg/cm2 pressure for a duration of 100 min yielded the maximum gross methane yield and vs. reduction of 0.368 L CH4/(g vs. added) and 85%, respectively compared to other reactors where food waste was treated at a pressure of 2 kg/cm2 for a duration of 20 to 80 min. The high pressure pretreatment was aimed at the complete homogenization and hydrolysis of organic matter present in the food waste so that greater amount of biodegradable organic matter is available for the methanogens for rapid consumption resulting in methane rich biogas [43]. Similar results were also obtained by Naran et al. [44], who reported that pretreatment of food waste at 120 °C with a 60-min duration in an autoclave showed improved methane production in the range of 32% compared to untreated food waste. In a study demonstrated by Gnaoui et al. [38], pretreatment of food waste at 100 °C for 30 min showed an increase in methane yield by 23.7% from pretreated compared to untreated food waste. The results from the previous studies indicated that pretreatment improves the methane yield as the pretreatment deflocculates the molecules, by this surface area increases and contact between microorganism and organic matter also increases resulting in higher methane generation [38]. The results obtained in the present work are also in agreement with the previous results.

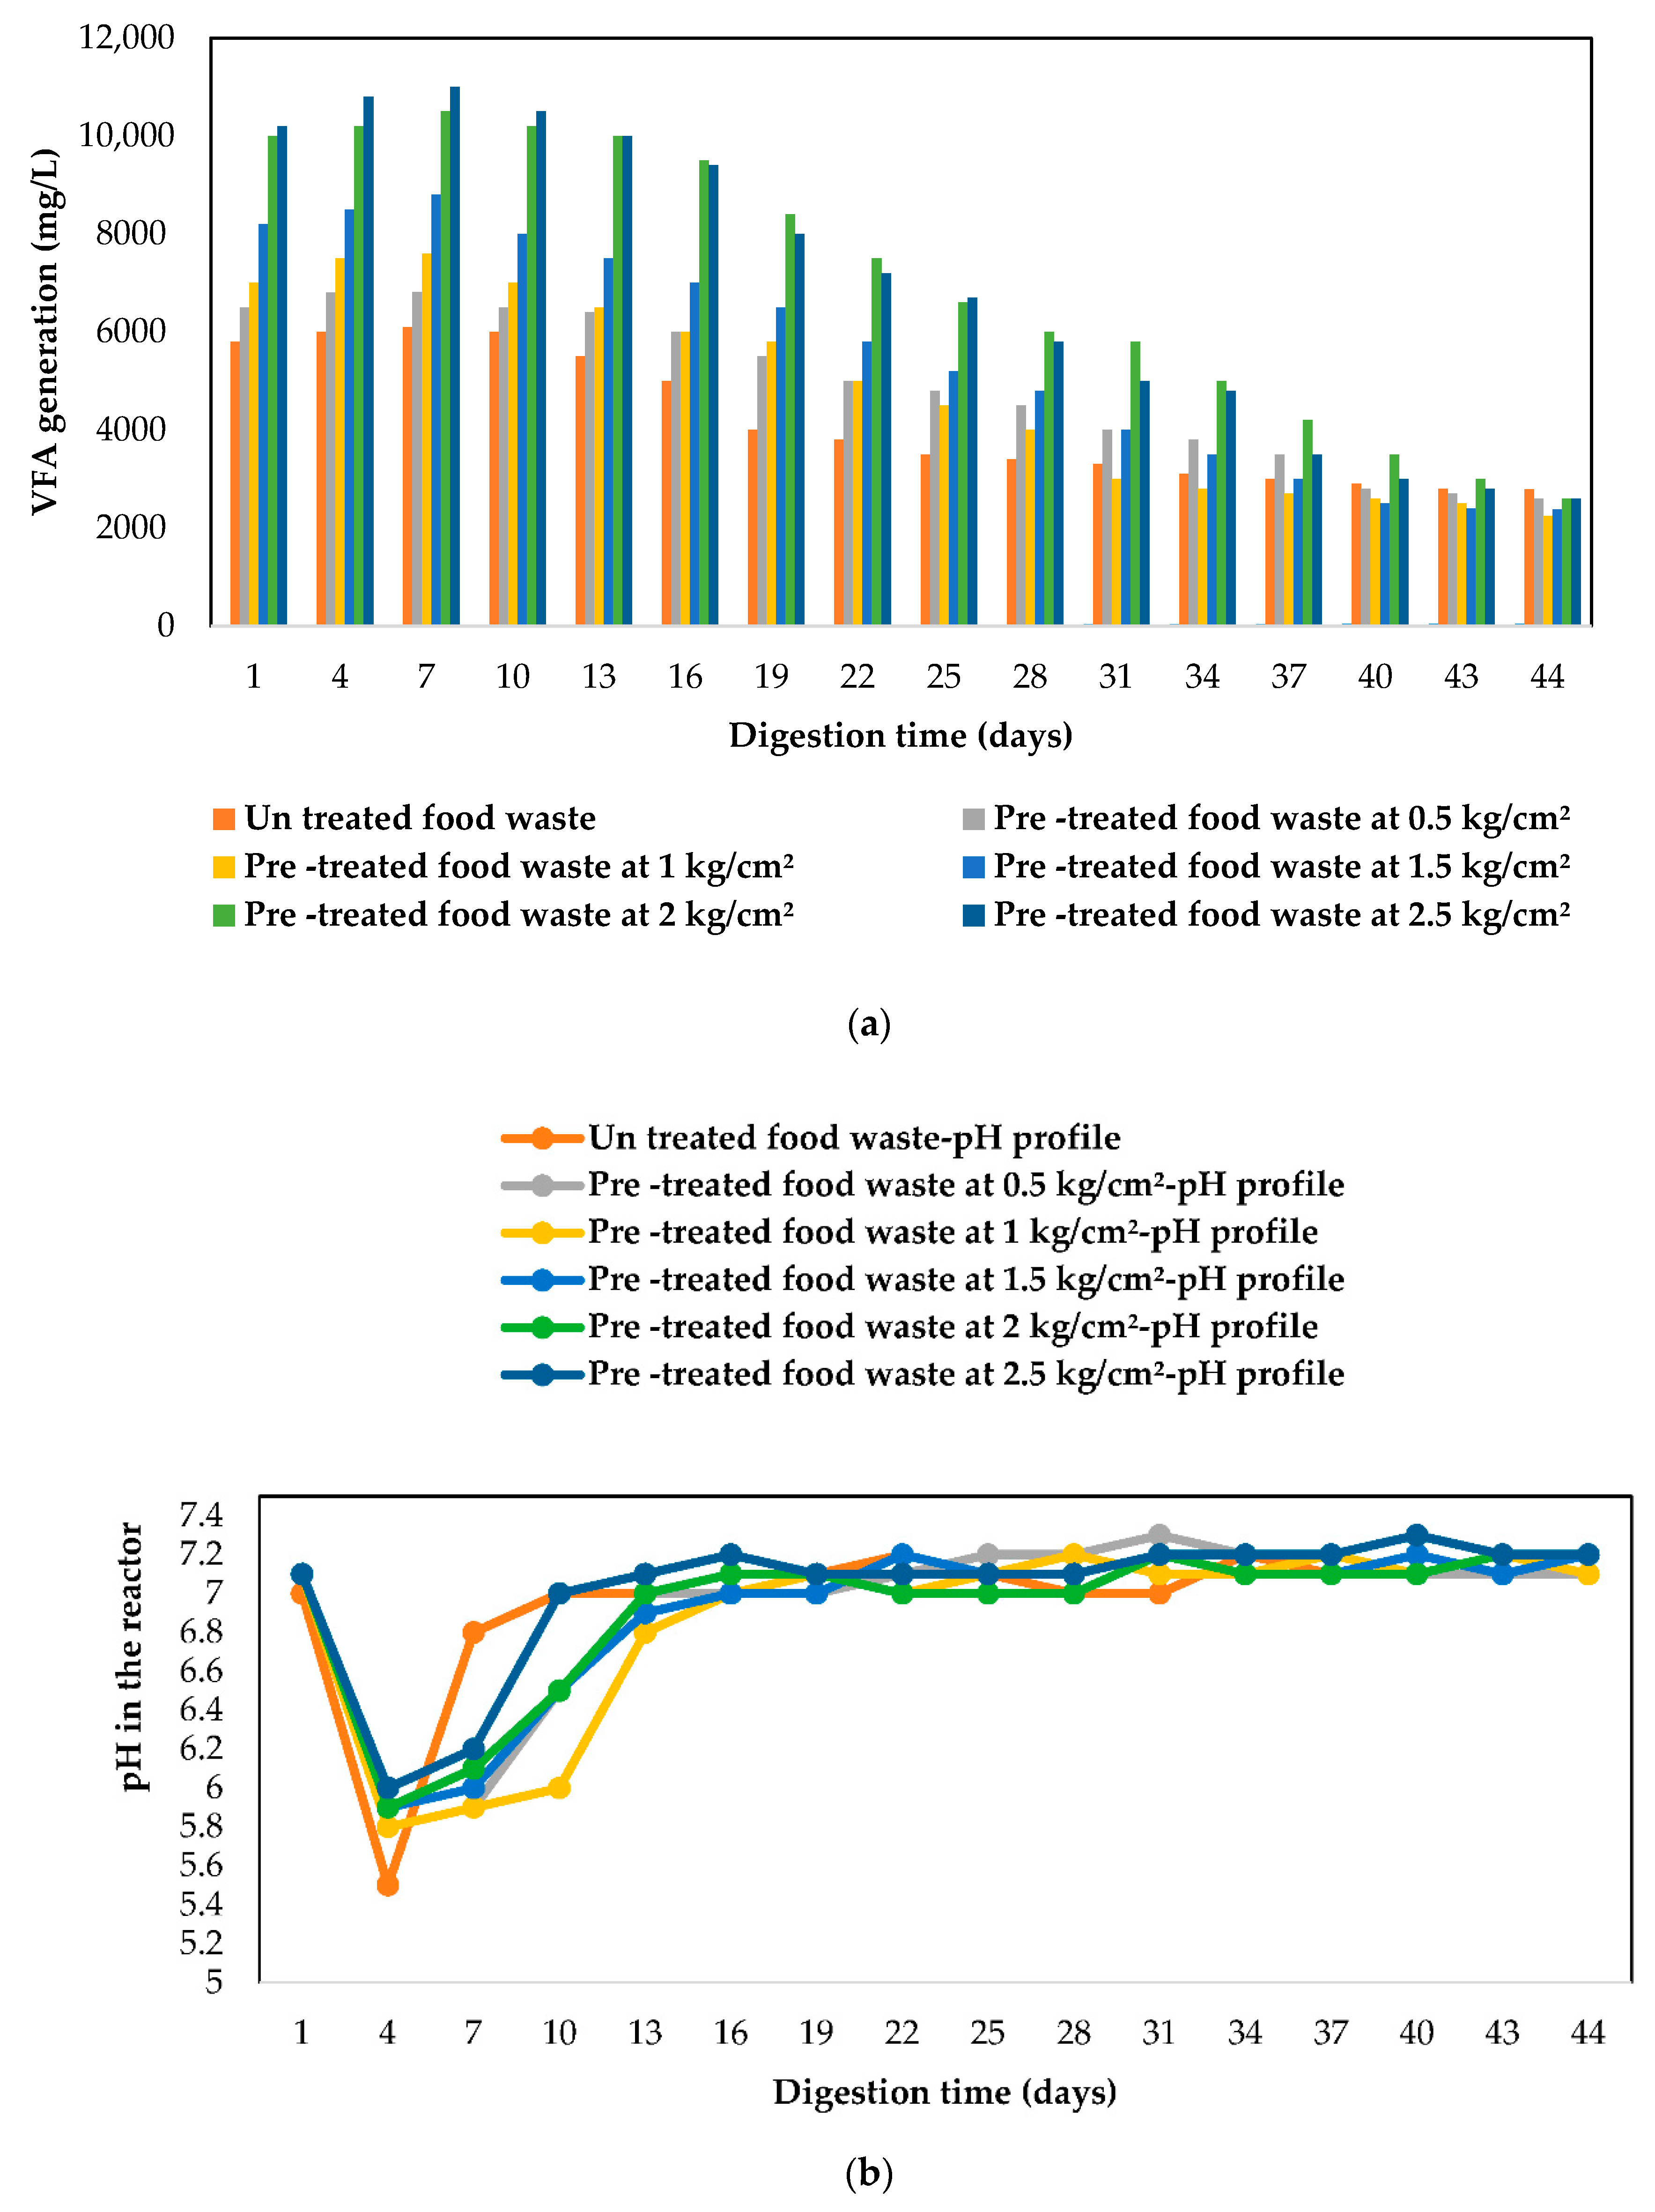
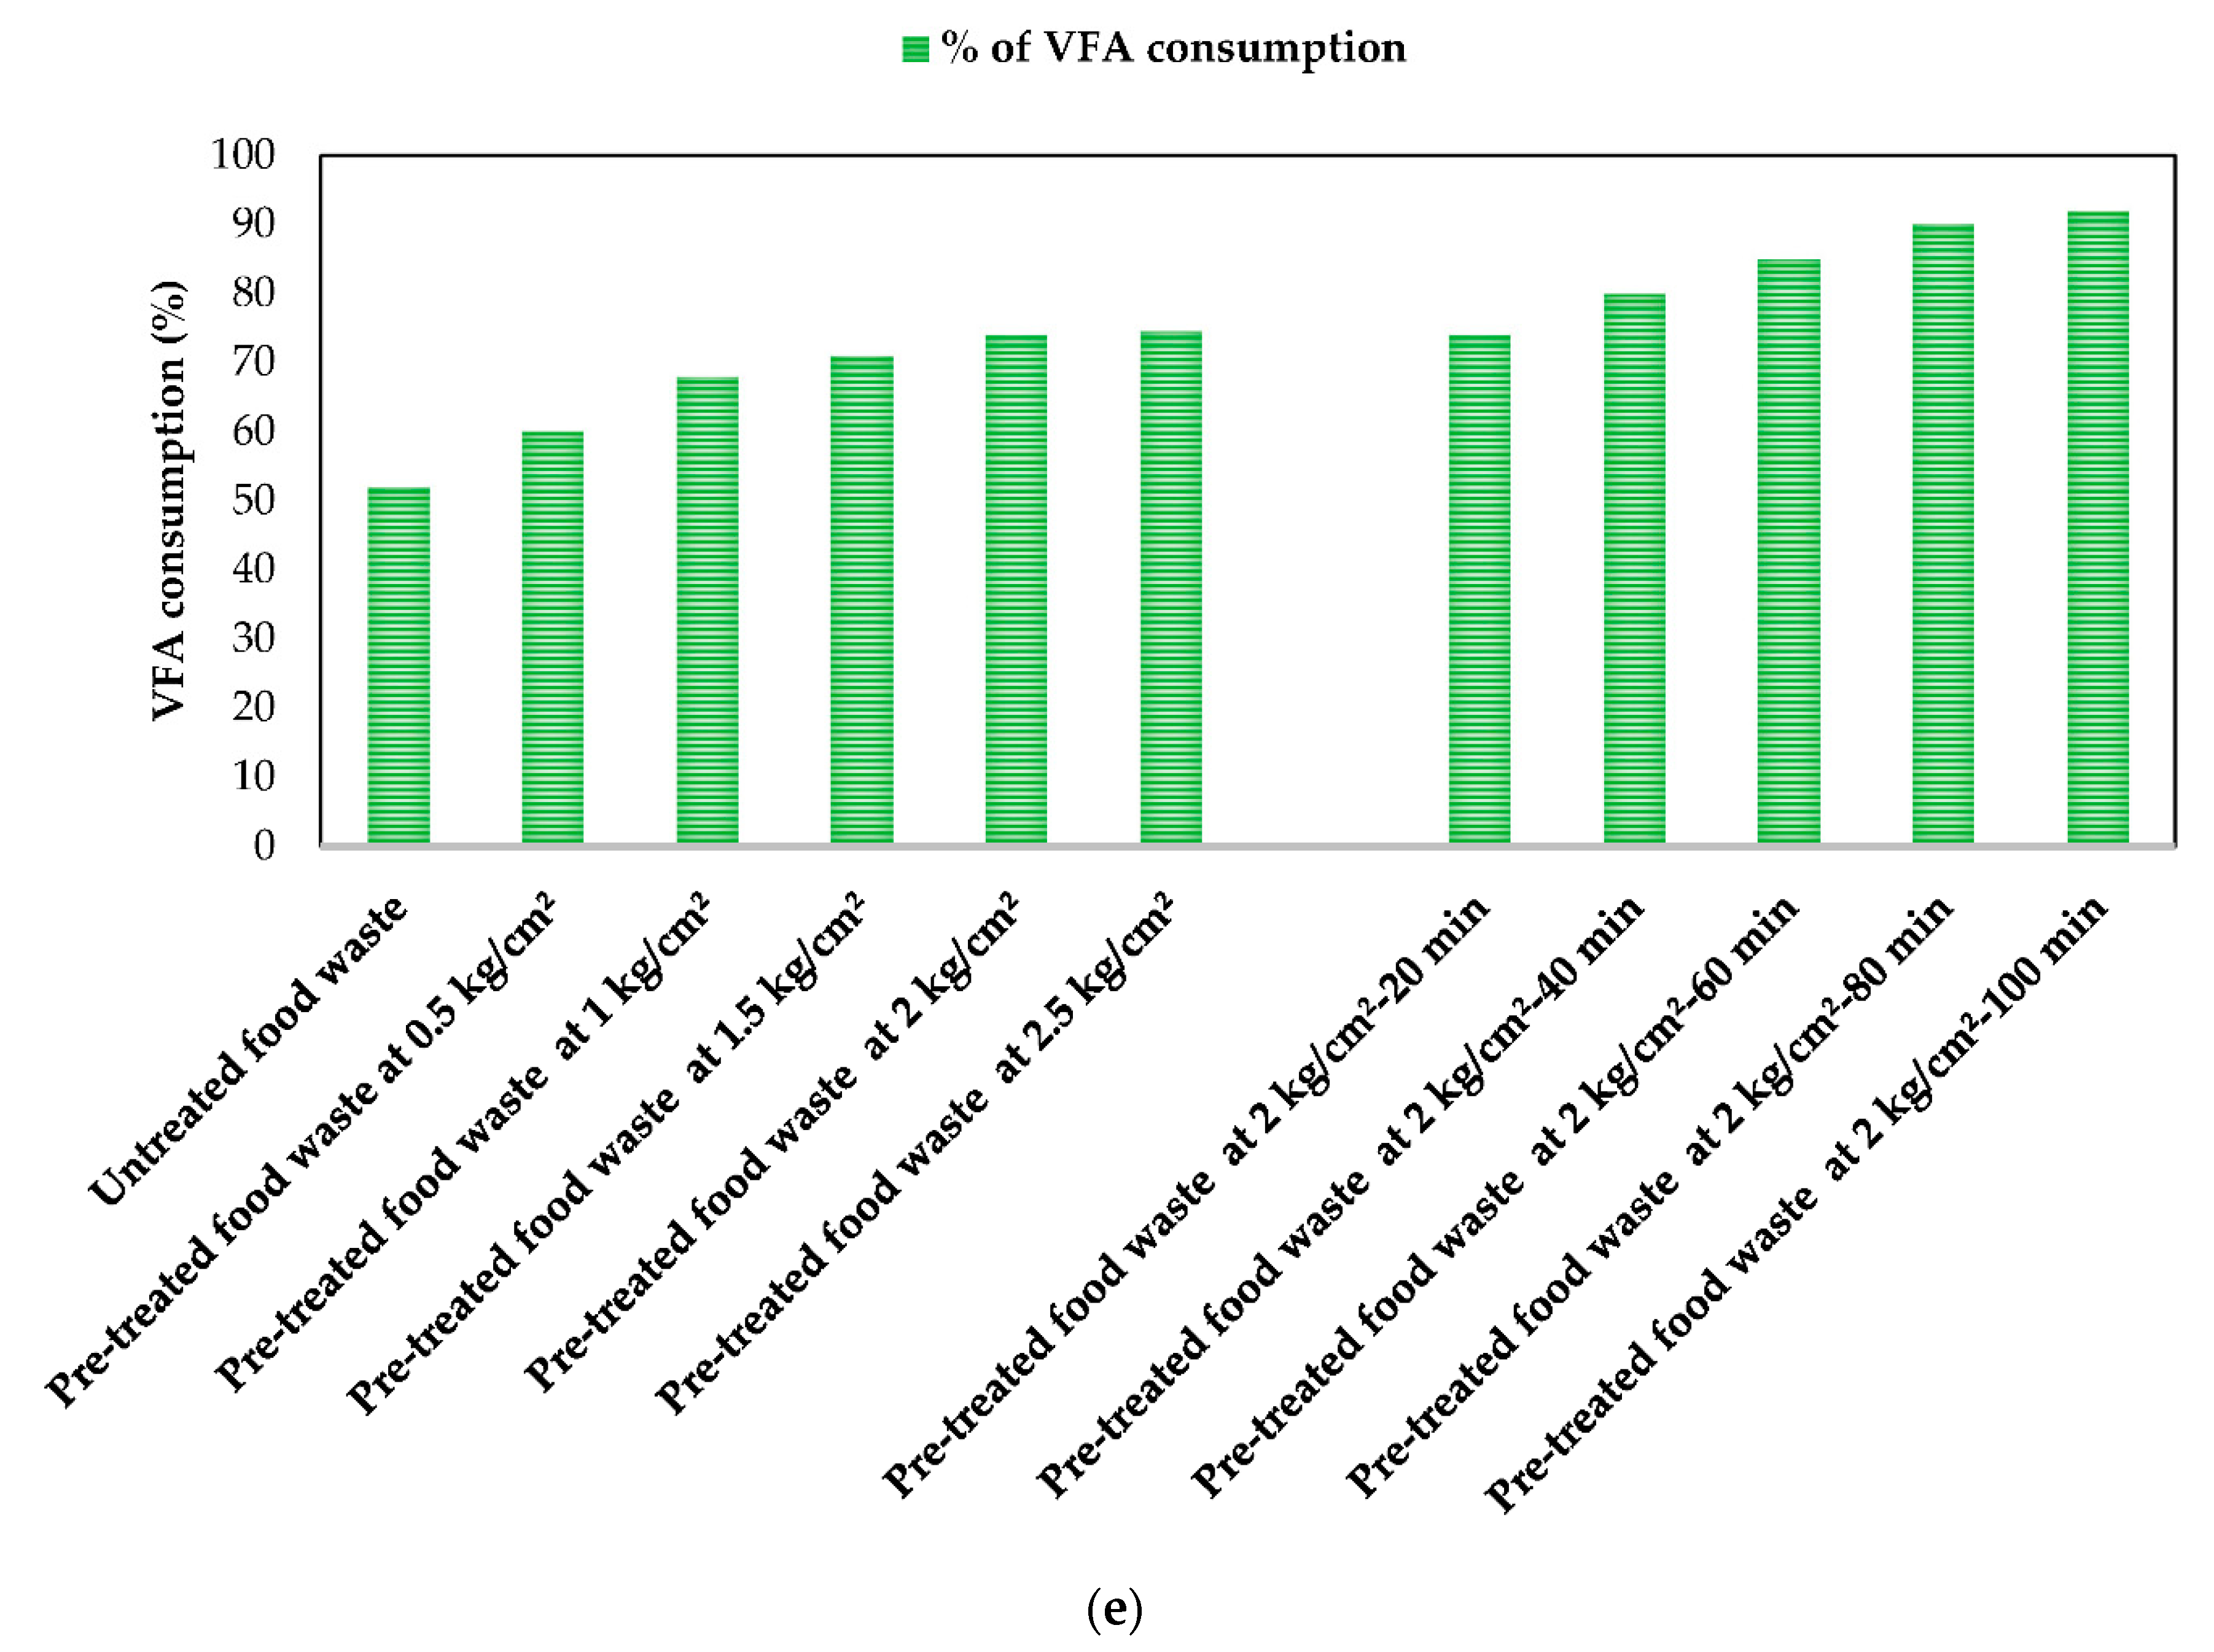
3.4. Effect of Pretreatment on pH and VFA Profile

The impact of pretreatment of food waste on VFA generation, pH profile and VFA consumption is plotted graphically and shown in Figure 6a–e. It could be observed from Figure 6 that the initial VFA concentration in all the dry AD reactors is very high because of which pH declined from 7 to 5.0 within 3 to 6 days of reactor operation. Therefore, during this phase of operation (up to 6 days), reactor pH was being adjusted to 7.0 with the addition of MOL on alternate day basis [45]. However, the addition of MOL was stopped on 4th day in some reactors and 5th and 6th day in some reactors, but MOL was not added in any reactor after 7th Day. This shows that methanogens [46] may have been utilizing VFAs for the generation of biogas which is also evident from the improved generation of biogas generation (Figure 2a and Figure 4a) from the 6th to 7th day onwards in all the reactors. The pH drop during the initial phase of 3 to 6 days could have happened mainly because of rapid acidification phenomena of food waste in dry AD. The authors have reported operation of full scale wet AD plant based on food waste previously [1] and it is mentioned that food waste acidifies very rapidly and addition of milk of lime as neutralizing agent is required on regular basis in continuous plant. However, in the present case, the issue was solved by regularly adjusting the pH to 7.0-with milk of lime during the initial 4 to 5 days when the pre-acidification phenomena observed and subsequently the pH maintained stable at 7.0 throughout the operation of the dry AD experiments without the addition of milk of lime due to the uptake of the VFA’s by methanogens [46]. In the present case, experiments are limited to batch system and hence milk of lime addition was stopped after one week of operations. However, in a continuous system even in the case of dry AD plant with food waste, feed preparation before the main AD reactor is required to adjust the pH as well as pre-acidify the food waste [1]. It could also be noticed that the concentration of VFA in all the reactors gradually decreased till day 45 and the final concentration of VFA in the reactor was <500 mg/L. This ensured that the VFA to a great extent was consumed by the methanogens for the generation of biogas that is rich in methane [47]. It is known that the organic matter present in the waste is measured in terms of COD, VS, VFA, C and polymers such as carbohydrates, proteins and lipids. It is reported by Zhang et al. [48] that the mixed consortia of acidogens consume the VS/COD present in the waste for the production of VFA during acidogenic phase of AD. Hence, it is clear from Figure 6 that the acidogens consumed the vs. present in the food waste resulting in the formation of VFA which could be ensured by the decrease in the VS. It is evident from Figure 6e, is that the 50% of the vs. reduced resulted in the formation of VFA which was later consumed by the methanogens for the generation of biogas. The vs. reduction and VFA consumption in the reactors pretreated at a pressure of 0.5, 1, 1.5, 2 and 2.5 kg/cm2 is in the range of 50%–65% and 60%–75% whereas in the reactors where food waste was pretreated at constant pressure of 2 kg/cm2 and different durations of 20, 40, 60, 80 and 100 min, the vs. reduction and VFA consumption is in the range of 74%–92%. However, in case of untreated food waste, vs. reduction and VFA consumption was limited to 45% and 52% only. It could be concluded that VFA generation and consumption is increased with pressure in the pretreatment at the same time along with time duration of pretreatment. This attributed to the fact that pretreatment of food waste at high pressure for longer duration resulted in higher solubilization of organic matter present in the substrate.

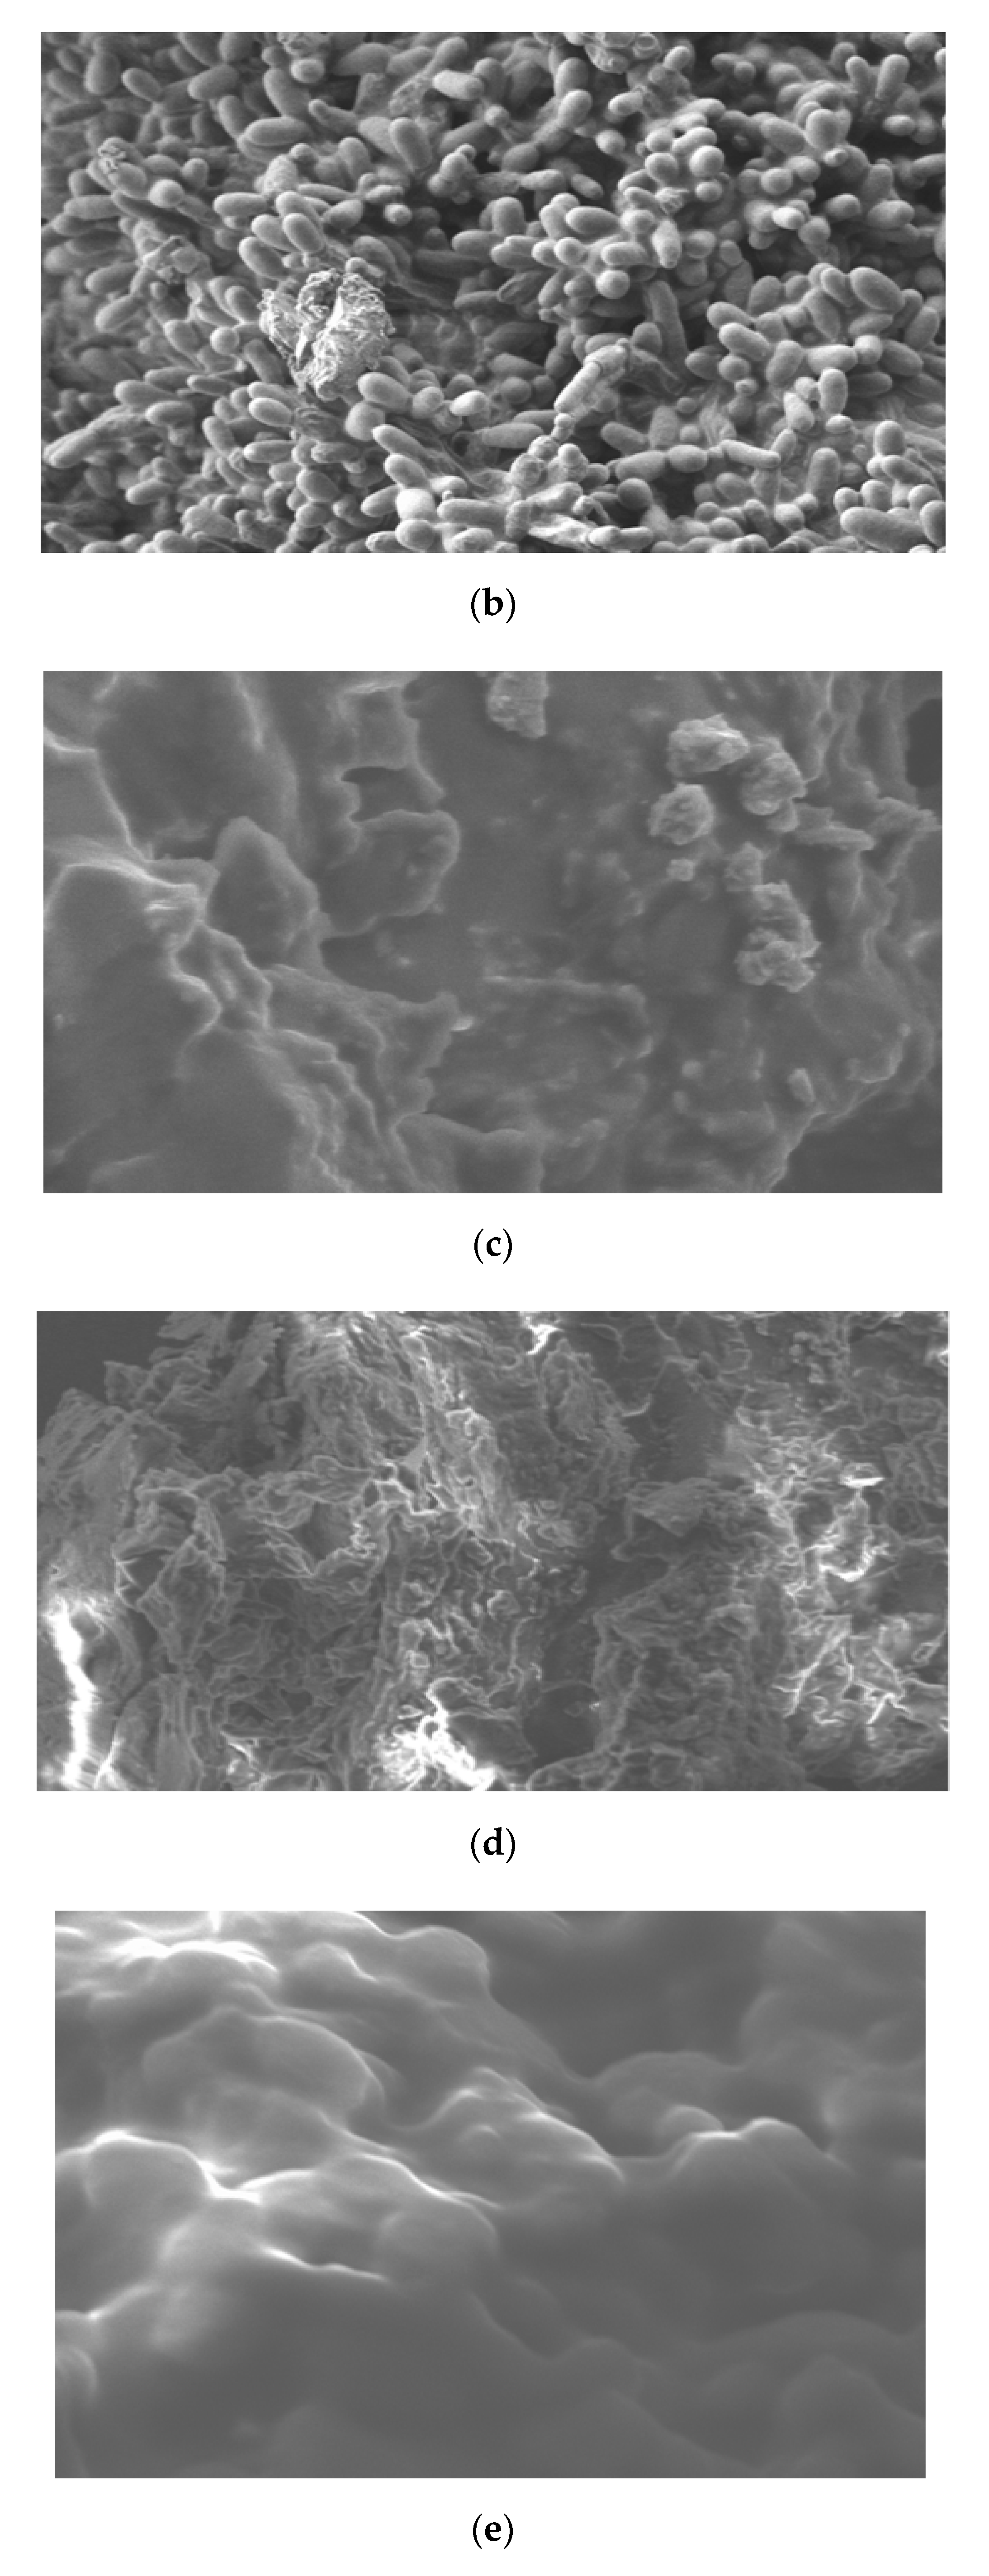
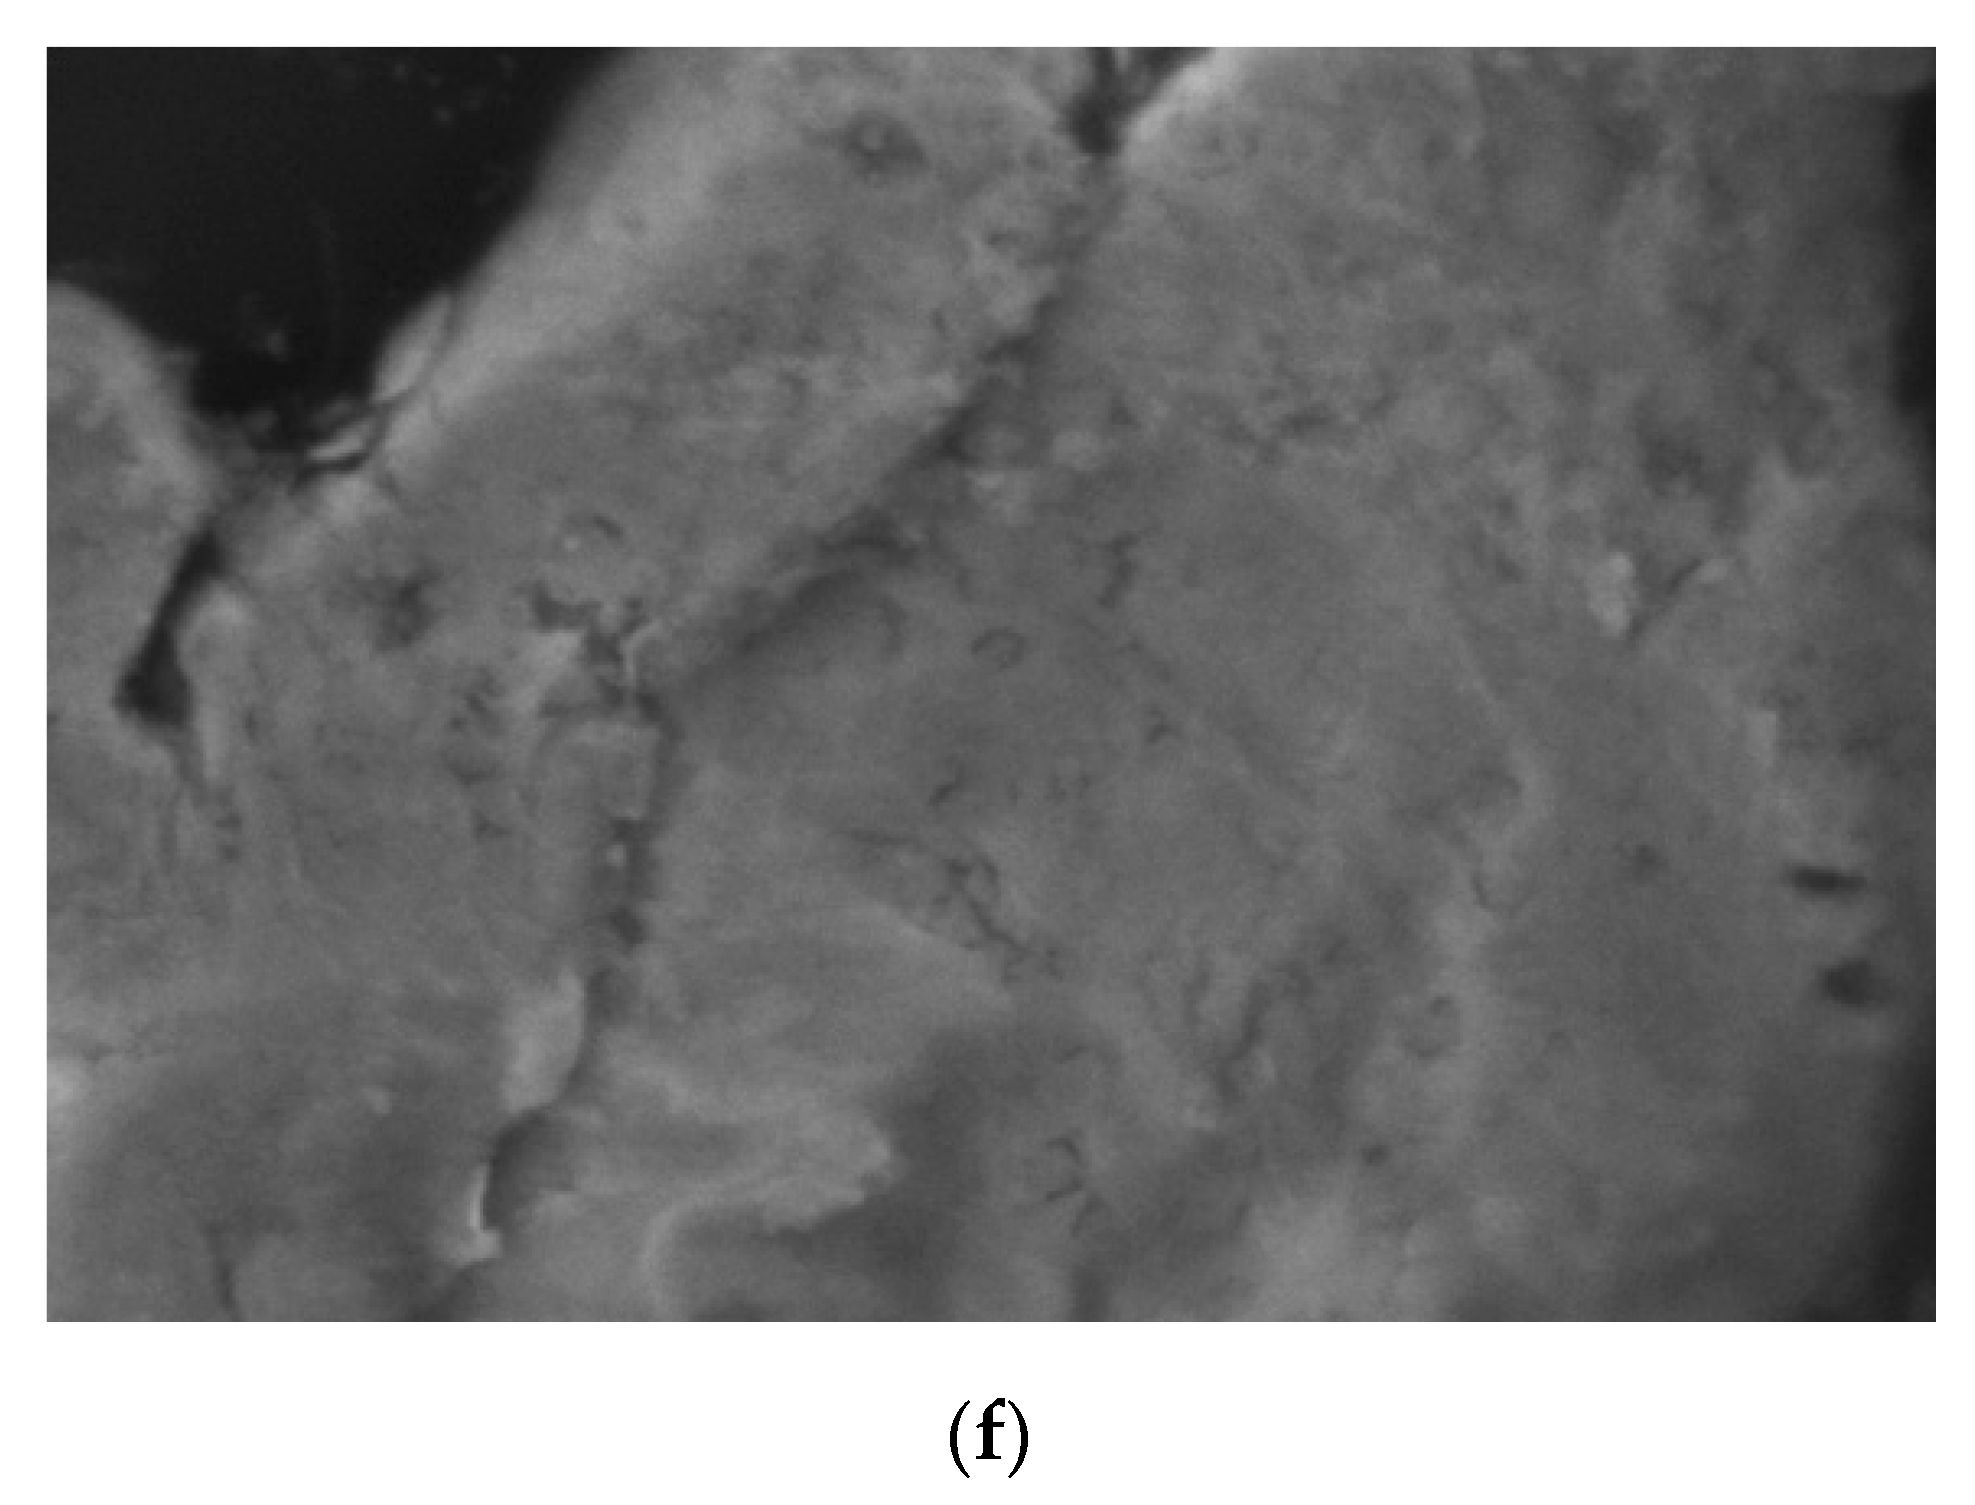
3.5. Morphologic Characterization of Pretreated Food Waste at Different Time Intervals

The complex structure of food waste is converted in to simpler form [40] due to pretreatment. Micro structural properties of the food waste which is pretreated at 120 °C and 2-kg/cm2 pressure for different time intervals is visualized by the analysis of SEM with an acceleration voltage of 15 V and magnification factor of 50X [49]. The SEM images of the untreated food waste along with pretreated food waste at 20, 40, 60, 80 and 100 min time interval are shown in Figure 7. It is observed from Figure 7 that the physical structure, size and shape varied from large particle size to smaller size for the food waste pretreated at 2 kg/cm2 from 20 to 100 min of time interval, respectively which is in concurrence with previous studies [50]. In comparison to pretreated food waste at 100 min time interval to 20 min of time interval contains smoother particles which resulted in a flat surface area and more decomposition by this accessibility of organic matter to microorganisms increases [40]. The size of the particles was between 50 µm to 100 nm depending on the duration of pretreatment from 20 to 100 min, respectively. It could be concluded that pretreatment at 120 °C and 2-kg/cm2 pressure for 100-min resulted in size reduction of food waste which could augment the better contact of substrate and microorganisms for higher biogas production.

3.6. Kinetic Potential

The results obtained from the kinetic study of dry AD digestion experiments with pretreatment using modified Gompertz model was tabulated and shown in Table 5a,b. The predicted cumulative biogas profile is represented in Figure 8. As can be seen from Table 5 that the lag phase of 6.5 day was observed for untreated food waste, while for the phase I experiments (pretreatment of food waste at 0.5 kg/cm2, 1 kg/cm2, 1.5 kg/cm2, 2 kg/cm2 and 2.5 kg/cm2) the lag phase was in the range of 5.3 to 5.8 days where as for Phase-II experiments (pretreatment of food waste at 120 °C and 2 kg/cm2 with time durations of 20 min, 40 min, 60 min, 80 min and 100 min) it was between 3.3 and 5.7 days, respectively. The predicted values of Rm proves that 2-kg/cm2 pressure pretreatment at time duration of 100 min enhanced the biogas generation with lower lag phase compared to other conditions. The reduction in the lag phase can be attributed to the disruption of cell wall and consumption of organic matter (COD, vs. and VFA) to methanogenic bacteria. The R2 values for untreated food waste, Phase-I and Phase-II experiments were in the rage of 0.997 to 0.998 by using modified Gompertz equation. The results illustrate that the modified Gompertz model was a better fit for the experimental results.

3.7. Comparative Analysis of Experimental and Theoretical Methane Yield

It could be stated that methane yield is the one of the important parameter that describes the efficiency of the process. The efficiency of the present work of dry AD of food waste is also evaluated by methane yield obtained in experiments and same is elaborated in previous sections (Figure 3 and Figure 5). However, it is essential to compare the experiment yield with theoretical yield so that the results obtained in the present work could be ratified. The theoretical yield of methane during the AD of organic substances was calculated by using Buswell’s equation [51] as per the numeric model shown in Equation (3), considering the composition of elements such as C, H, N, S and O of pretreated and untreated food waste in each case. The values of theoretical methane obtained as per the aforesaid calculation and values of methane yield obtained in experiments (Figure 3 and Figure 5) of the all the reactors are graphically shown in Figure 9. It could be observed from Figure 9 that the theoretical methane yield obtained for pretreated food waste at 0.5 kg/cm2, 1 kg/cm2, 1.5 kg/cm2, 2 kg/cm2 and 2.5 kg/cm2 is 0.205, 0.231, 0.253, 0.269 and 0.260 L CH4/(g vs. added), respectively, whereas theoretical methane yield of 0.269, 0.286, 0.339, 0.365 and 0.384 L CH4/(g vs. added) was obtained for pretreated food waste at constant pressure of 2 kg/cm2 with varying time durations of 20 min, 40 min, 60 min, 80 min and 100 min, respectively. The theoretical methane yield for untreated food waste is 0.158 L CH4/(g vs. added). It could be observed that the difference in the experimental and theoretical methane yield is very less in each case. It is worth mentioning here that about 91% to 96% of theoretical methane yield is achieved experimentally calculated using Equation (4). This shows that pretreatment of food waste in dry AD could yield highest methane compared to the methane yield obtained for food waste in our previous study [9].
C a H b O c N d S e + [ 1 4 ( 4 a b 2 c + 3 d 2 e ) ] H 2 O     [ 1 8 ( 4 a b + 2 c + 3 d + 2 e ) ] C O 2 + [ 1 8 ( 4 a + b 2 c 3 d 2 e ) ] C H 4 + [ d ] N H 3 + [ e ] H 2 S
Methane   Yield   ( % )   =   T h e o r e t i c a l   m e t h a n e   y i e l d E x p e r i m e n t a l   m e t h a n e   y i e l d

3.8. Enhanced Methane Yield in Dry AD Due to Pretreatment: Inferences

Generally, in wet AD, the amount of methane in biogas ranges between 50%–60% with the rest being CO2 and other gases [52]. The methane content in biogas could be increased to the tune of 90% to 95% through external absorption purification system of CO2 in water at a pressure of 10 kg/cm2 [53]. In dry AD, the water content in the digester is less compared to wet AD [9] and hence dissolution of CO2 is also less in these digesters resulting in instantaneous generation of more CO2 in these digesters than in wet digesters. Therefore, the CO2 that is being generated instantaneously would be reacting with H2 to form CH4 resulting in more methane in the biogas due to the inbuilt buffering capacity of the reactor. It is possible that the excess CO2 instantaneously formed in digester gets dissolved [54,55] in liquid phase followed by the consumption of same by the homoacetogenic bacteria along with H2 [56] to form methane via Wood–Ljungdahl pathway (homoacetogenesis) [57]. The dissolved CO2 is a common electron acceptor; acetate acts as a readily available simplistic carbon source for the methanogenic bacteria to increase their population and to generate CH4 [58]. In addition to this, the reactors would have been stabilizing in methanogenic phase even though continuously shifting between acidogenesis and methanogenesis, since the pH is being maintained in the neutral range through the addition of MOL till stabilization up to 7th day. It was observed in our experiments that the methane content in the biogas is in the range of 60% to 75% when the substrate in the reactors are pretreatment at high pressure in the range of 2 to 2.5 kg/cm2. The pretreatment of the substrate was also one of the reasons due to which the short chain carboxylic acids were readily available for the methanogens to generate more methane. The pH and VFA were the two important indicators that determine the health of the reactors. In order to achieve better biogas and methane yield, the reactors should always be monitored for pH and VFA concentration to enable efficient dry AD [59] which were well balanced in the present cased through continual utilization of VFA as discussed in the subsequent section. Therefore, it could be derived that pretreatment in combination dry AD could had been the reason for more methane (%) in biogas, better methane yield, higher biogas generation at enhanced vs. reduction.

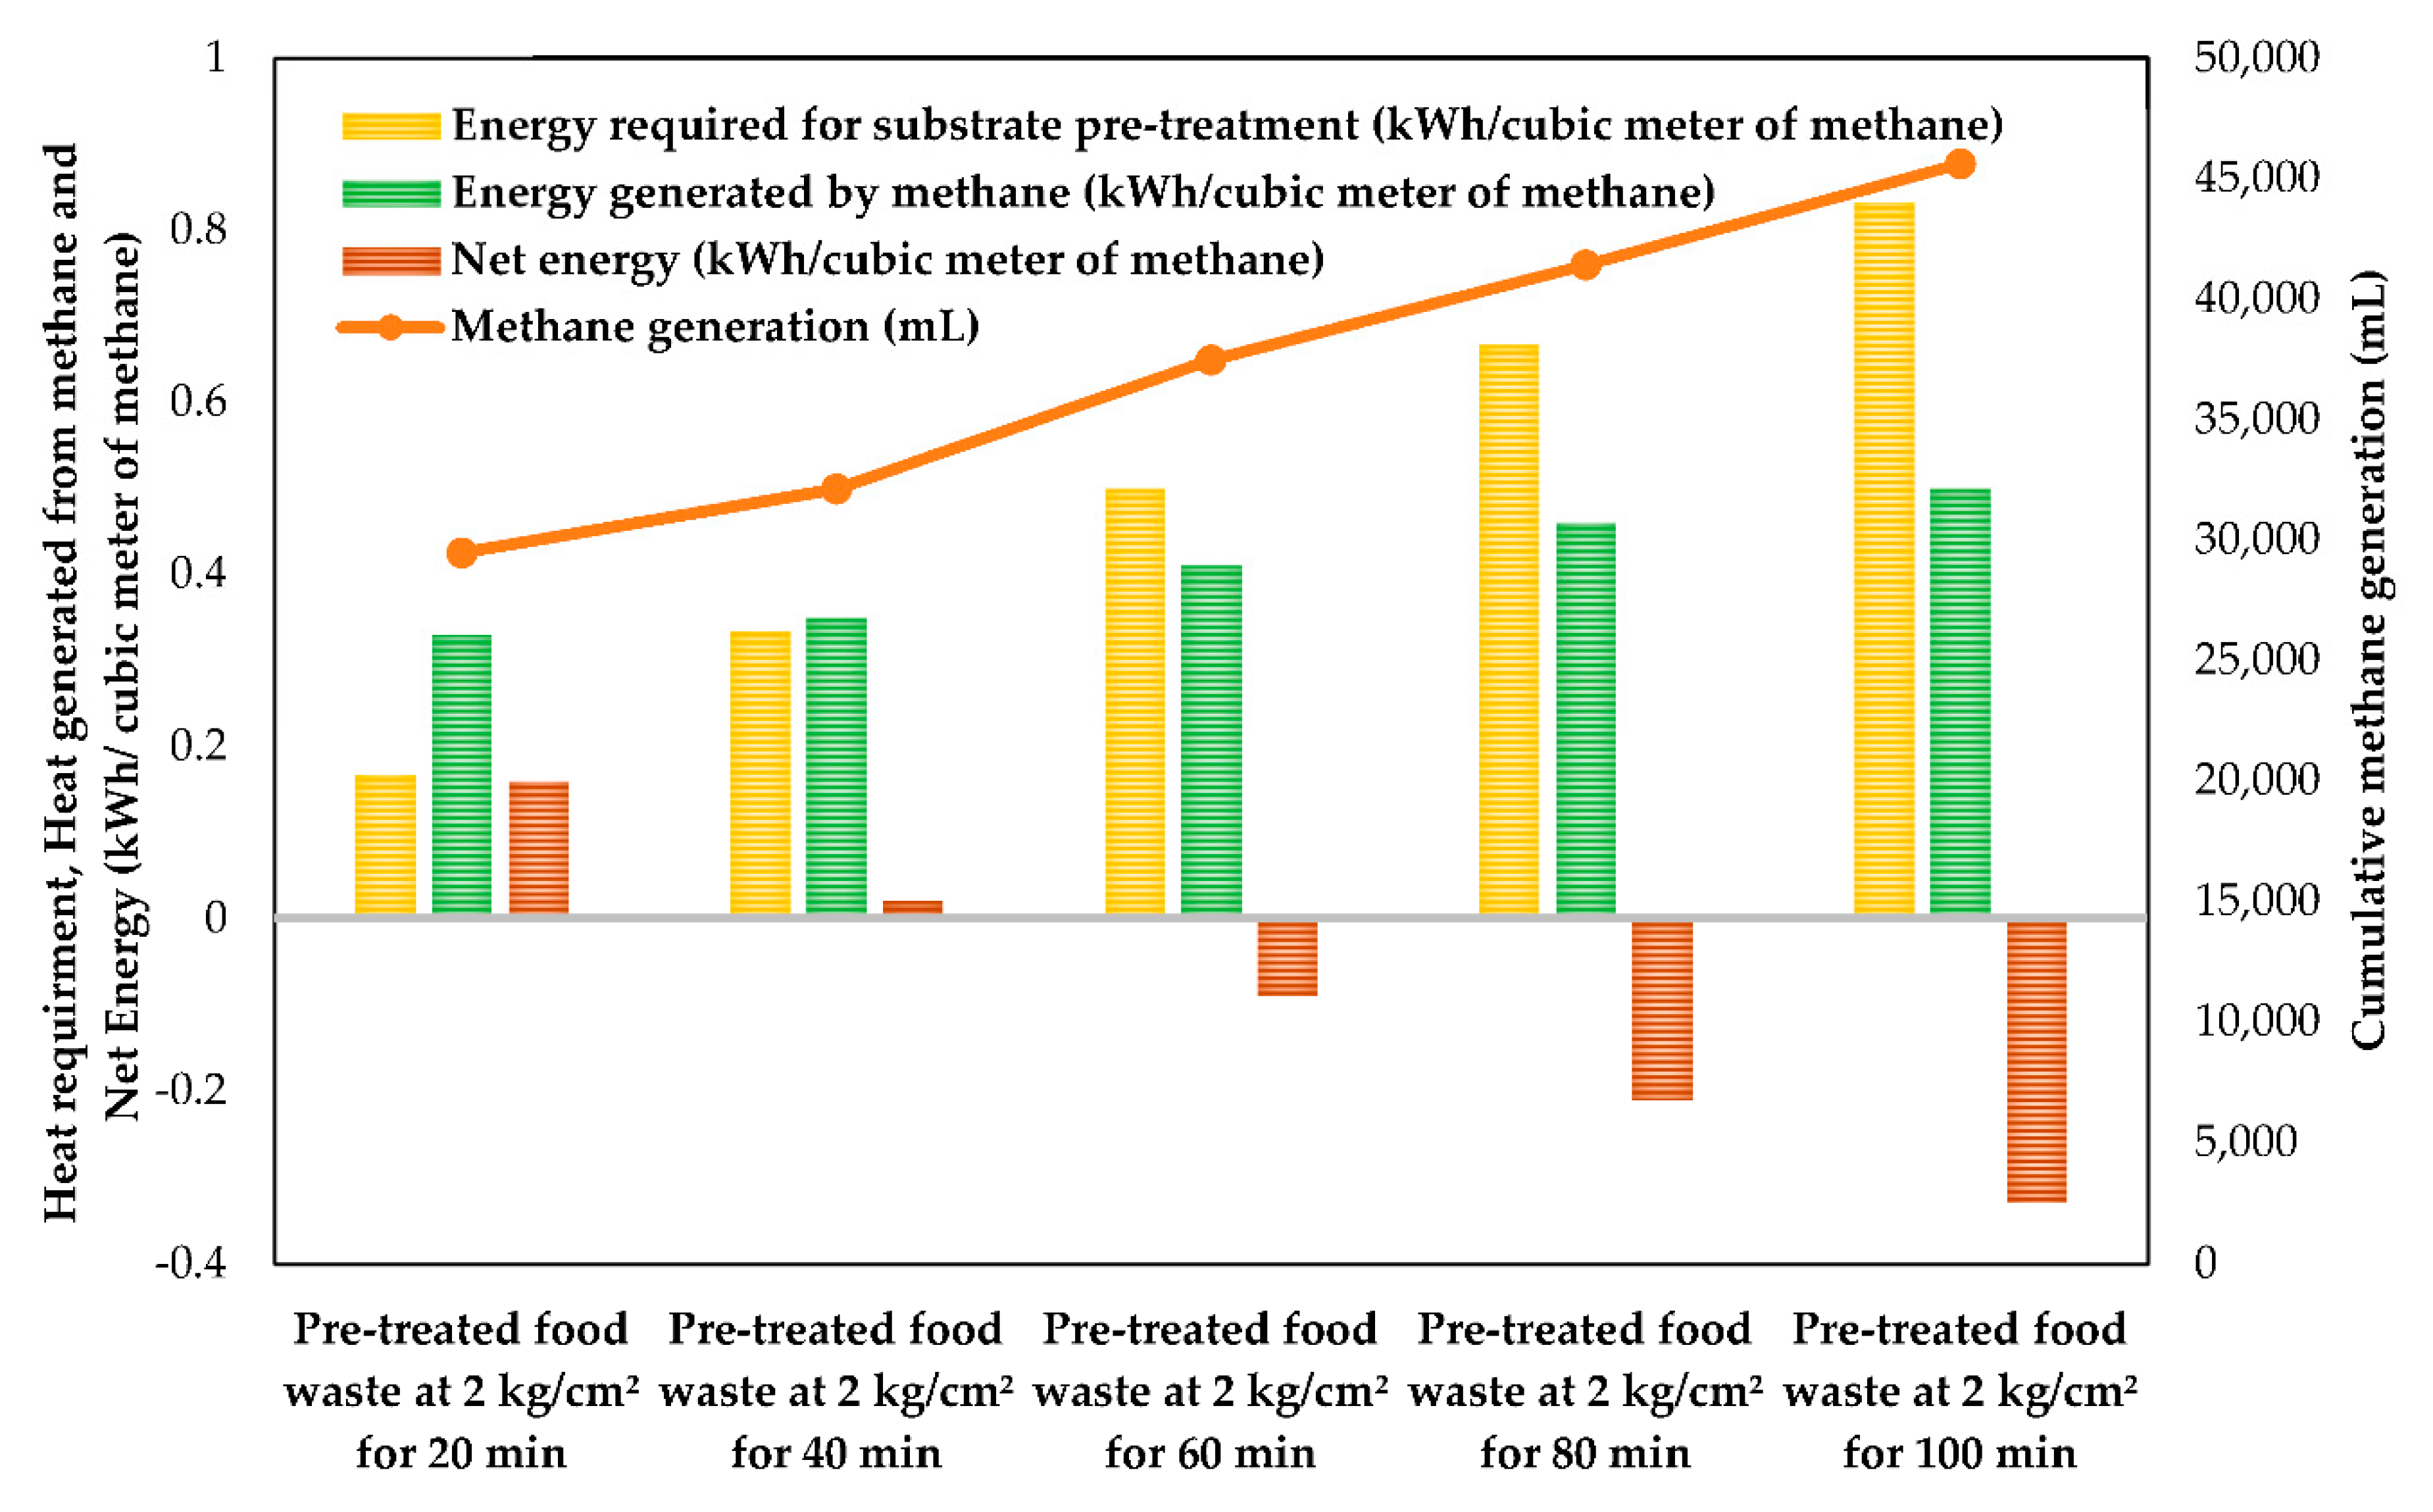
3.9. Pretreatment of Food Waste in Dry AD and Energy Balance: Boon or Bane?

In the present work, studies on dry AD of pretreated food waste were carried out in two phases. In the first phase, pressure increased from 0.5 to 2.5 kg/cm2 and in the second phase duration of pretreatment is increased from 20 to 100 min. In both the cases, increased methane yield was observed in comparison with untreated food waste albeit highest methane is obtained when the pretreatment was carried out at 2-kg/cm2 pressure for 100 min. The heat required for pretreatment in each case depended on duration of pretreatment. Therefore, in order to evaluate the optimum duration of pretreatment, heat required for pretreatment [60], additional methane/energy generated due to pretreatment along with net additional energy generation due to pretreatment at 2 kg/cm2 with different time durations of 20 min, 40 min, 60 min, 80 min and 100 min is calculated [61] and graphically represented. This is shown in Figure 10. It can be observed from Figure 10 that the net energy generation is on positive side if the duration of pretreatment is limited to only 40 min. Therefore, it can be understood from these results that it is better to pretreat the substrate at 2-kg/cm2 pressure for a period of 40 min only. However, the choice of time duration can be made depending on the full scale applications, availability of waste heat energy in the specific location that could be used for pretreatment, disposal guidelines of digestate, etc.

3.10. Digestate Characteristics (N, P and K) after dry AD of Food Waste

The digestate obtained from the reactors after termination of dry AD experiments was analyzed for solids and nutrients. It was observed that the TS in the digestate in all the reactors with pretreated food waste reduced to 8.5% ± 0.5% whereas in the untreated food waste, it was 10% ± 0.15%. This elucidated that the pretreatment of the food waste at different operating conditions resulted in the complete homogenization that is reflected in the solids content of digestate [62]. The digestate from dry AD of pretreated and untreated food waste with 8.5% ± 0.5% and 10% ± 0.15% TS, respectively could be further utilized to reclaim reusable water [63] or it could be used as raw material for added value products generation such as ethanol and micro algae [64] or it could be used as a liquid fertilizer as it contained about ~6.2% ± 0.09%, ~3.52% ± 0.06%, ~4.8% ± 0.05% of N, P2O5 and K2O, respectively for all the reactors [19]. According to the standards specified by the fertilizer control order (FCO) of India [65], any organic fertilizer must contain a minimum of 2.18%, 3.25%, 4.12% N, P, K nutrient value. The nutrient value in the digestate obtained from these reactors with pretreated food waste has the nutrient value as specified by FCO. It could be calculated from the experiments organized in the batch scale that a full scale plant based on dry AD treating one ton per day of food waste would generate one ton per day of digestate with TS concentration in the range of 8% to 10% since there is no addition of water. In contrast, the wet AD plant treating similar kind of waste with same capacity would generate 2 tons per day of digestate with TS concentration in the range of ~2% to 4%, as 1 m3 (for 1:1 dilution) of fresh water is required to be added in case of wet AD. If the digestate is required to be transported to another place for utilization, it is easy to handle 1 ton of digestate than handling 2 tons. In addition to this, fresh water requirement in dry AD is negligible and the energy required for maintaining the digesters could be reduced. The results revealed that dry AD is more advantageous when compared to wet AD in terms of methane yield, energy balance, digestate management and economic performance which is also supported by previous work in this area [66]. This study also added good value to the existing work on dry AD as dry AD plants could offer essential advantages such as; it can accept any kind of organic waste which is having higher TS concentration, lower retention time, no water usage during feed preparation, lower volume of reactor per kg of waste, higher methane yield, less volume of digestate, etc., as proclaimed by previous researchers [9,66].

3.11. Insights on Implications at Full Scale Based on Laboratory Investigations

The experimental results obtained from the present research work are notable in terms of biogas and methane yield due to the pretreatment of food waste. In addition to this, the results also revealed the fact that time of reaction could be reduced considerably due to the pretreatment which means that reactors could be designed at lower hydraulic retention time (HRT) for pretreated food waste than raw food waste. All the anaerobic batch reactors were operated for 45 days and methane yield of all the reactors from 5th day to 45th day with an interval of 5 days is graphically plotted and shown in Figure 11. It could be understood from Figure that methane yield is much higher in pretreated food waste than the untreated food waste on every day (starting from 5th to 45th) during entire period of operation of reactors for 45 days. This clearly showed that batch residence time (BRT) of pretreated food waste is less than untreated food waste. However, the methane yield was varying within the pretreated food waste depending on the pressure and duration of pretreatment which is explained in previous session. This information is highly useful in understanding the design of full-scale dry AD plants based on food waste. In the full scale design, if the HRT is fixed as 35 days, then it could be anticipated that the methane yield would be 0.135, 0.175, 0.201, 0.222, 0.242, 0.223, 0.252, 0.295, 0.319 and 0.343 L CH4/(g of vs. added) for untreated food waste, Pretreated food waste at pressure of 0.5 kg/cm2, 1.0 kg/cm2, 1.5 kg/cm2, 2.0 kg/cm2 and 2.5 kg/cm2 along with pretreated food waste at 2.0 kg/cm2 for the duration of 20 min, 40 min, 60 min, 80 min and 100 min, respectively. Therefore, from these data it can be advisable to pretreat the food waste at a pressure of 2.0 kg/cm2 for the duration of 100 min to obtain a methane yield of 0.343 L CH4/(g of vs. added). However, if the waste heat is not available for the pretreatment of food waste, then it is advisable to pretreat the food waste at a pressure of 2.0 kg/cm2 for the duration of 40 min only. The same analogy is applicable for other cases of BRT depending on the designer’s choice of HRT for the full scale plant.

4. Conclusions

It could be concluded that pretreatment of food waste enhanced the process performance in terms of biogas, methane yield and vs. reduction. It could be deduced from the experimental results that by increasing the pressure from 0.5 to 2 kg/cm2, the methane yield increased from 0.187 to 0.253 L CH4/(g vs. added) whereas from 2 to 2.5 kg/cm2, it decreased from 0.253 to 0.238 L CH4/(g vs. added). The methane yield increased from 0.253 to 0.368 L CH4/(g vs. added) with increased methane content from 65%–75% in biogas when the pretreatment duration was increased from 20 to 100 min. The pretreatment of food waste at 2-kg/cm2 pressure for the time duration of 40 min would be the best choice considering heat requirement for pretreatment and net energy generation from the digester.

Author Contributions

V.A.: methodology, formal analysis, investigation, writing—original draft, visualization; S.J.: Investigation; S.B.: writing—review and editing; G.R.A.: supervision, writing—review and editing, conceptualization, project administration. All authors have read and agreed to the published version of the manuscript.

Funding

No external funding was received to carry out this research work.

Acknowledgments

The authors are grateful to the Director-CSIR-Indian Institute of Chemical Technology (IICT) for his encouragement (IICT/Pubs./2019/416) in carrying out this work. The authors are grateful to Department of Science and Technology (DST) for funding the project entitled “Integrated and sustainable sewage and organic solid waste treatment for decentralized applications,” under which this research work is accomplished. The authors are thankful to Council of Scientific and Industrial Research (CSIR) for providing scholarship (Senior Research Fellowship—31/014(2795)/2019) to Vijayalakshmi.

Conflicts of Interest

The author does not have any conflict of interest.

References

  1. Kuruti, K.; Begum, S.; Ahuja, S.; Anupoju, G.; Juntupally, S.; Gandu, B.; Ahuja, D. Exploitation of rapid acidification phenomena of food waste in reducing the hydraulic retention time (HRT) of high rate anaerobic digester without conceding on biogas yield. Bioresour. Technol. 2017, 226, 65–72. [Google Scholar] [CrossRef] [PubMed]
  2. Omran, A.; Gavrilescu, M. Municipal solid waste managementin developing countries: A perspective on vietnam. Environ. Eng. Manag. J. 2008, 7, 469–478. [Google Scholar] [CrossRef]
  3. Zohoori, M.; Ghani, A. Municipal Solid Waste Management Challenges and Problems for Cities in Low-Income and Developing Countries. Int. J. Sci. Eng. Appl. 2017, 6, 039–048. [Google Scholar] [CrossRef]
  4. Begum, S.; Golluri, K.; Anupoju, G.; Ahuja, S.; Gandu, B.; Kuruti, K.; Maddala, R.; YerramsettiVenkata, S. Cooked and uncooked food waste: A viable feedstock for generation of value added products through biorefinery approach. Chem. Eng. Res. Des. 2015, 107, 43–51. [Google Scholar] [CrossRef]
  5. Ranjith, A.K. Sustainable Solid Waste Management in India. In Waste-to-Energy Research and Technology Council (WTERT); Columbia University: New York, NY, USA, 2012. [Google Scholar]
  6. Anukam, A.; Mohammadi, A.; Naqvi, M.; Granström, K. A Review of the Chemistry of Anaerobic Digestion: Methods of Accelerating and Optimizing Process Efficiency. Processes 2019, 7, 504. [Google Scholar] [CrossRef] [Green Version]
  7. Paritosh, K.; Kushwaha, S.; Yadav, M.; Pareek, N.; Chawade, A.; Vivekanand, V. Food Waste to Energy: An Overview of Sustainable Approaches for Food Waste Management and Nutrient Recycling. BioMed Res. Int. 2017, 2017, 1–19. [Google Scholar] [CrossRef]
  8. Jain, S. Global Food Waste Management: An Implementation Guide for Cities|Urban Food Actions Platform|Food and Agriculture Organization of the United Nations. Available online: http://www.fao.org/urban-food-actions/knowledge-products/resources-detail/en/c/1136010/ (accessed on 6 May 2020).
  9. Arelli, V.; Begum, S.; Anupoju, G.; Kuruti, K.; Shailaja, S. Dry anaerobic co-Digestion of food waste and cattle manure: Impact of total solids, substrate ratio and thermal pre treatment on methane yield and quality of biomanure. Bioresour. Technol. 2018, 253, 273–280. [Google Scholar] [CrossRef]
  10. Abbassi-Guendouz, A.; Brockmann, D.; Trably, E.; Dumas, C.; Delgenes, J.; Steyer, J.; Escudie, R. Total solids content drives high solid anaerobic digestion via mass transfer limitation. Bioresour. Technol. 2012, 111, 55–61. [Google Scholar] [CrossRef]
  11. Madsen, M.; Holm-Nielsen, J.; Esbensen, K. Monitoring of anaerobic digestion processes: A review perspective. Renew. Sustain. Energy Rev. 2011, 15, 3141–3155. [Google Scholar] [CrossRef] [Green Version]
  12. Kothari, R.; Pandey, A.; Kumar, S.; Tyagi, V.; Tyagi, S. Different aspects of dry anaerobic digestion for bio-energy: An overview. Renew. Sustain. Energy Rev. 2014, 39, 174–195. [Google Scholar] [CrossRef]
  13. Holliger, C.; Fruteau de Laclos, H.; Hack, G. Methane Production of Full-Scale Anaerobic Digestion Plants Calculated from Substrate’s Biomethane Potentials Compares Well with the One Measured On-Site. Front. Energy Res. 2017, 5. [Google Scholar] [CrossRef] [Green Version]
  14. Begum, S.; Ahuja, S.; Anupoju, G.; Ahuja, D.; Arelli, V.; Juntupally, S. Operational strategy of high rate anaerobic digester with mixed organic wastes: Effect of co-Digestion on biogas yield at full scale. Environ. Technol. 2018, 41, 1–9. [Google Scholar] [CrossRef] [PubMed]
  15. Forster-Carneiro, T.; Perez, M.; Romero, L. Influence of total solid and inoculums contents on performance of anaerobic reactors treating food waste. Bioresour. Technol. 2008, 99, 6994–7002. [Google Scholar] [CrossRef] [PubMed]
  16. Luning, L.; van Zundert, E.; Brinkmann, A. Comparison of dry and wet digestion for solid waste. Water Sci. Technol. 2003, 48, 15–20. [Google Scholar] [CrossRef] [PubMed]
  17. Capson-Tojo, G.; Rouez, M.; Crest, M.; Trably, E.; Steyer, J.-P.; Bernet, N.; Delgenes, J.-P.; Escudie, R. Kinetic study of dry anaerobic co-Digestion of food waste and cardboard for methane production. Waste Manag. 2017, 69, 470–479. [Google Scholar] [CrossRef] [PubMed]
  18. Gu, J.; Liu, R.; Cheng, Y.; Stanisavljevic, N.; Li, L.; Djatkov, D.; Peng, X.; Wang, X. Anaerobic co-Digestion of food waste and sewage sludge under mesophilic and thermophilic conditions: Focusing on synergistic effects on methane production. Bioresour. Technol. 2020, 301, 122765. [Google Scholar] [CrossRef]
  19. Jansson, A.; Patinvoh, R.; Sárvári Horváth, I.; Taherzadeh, M. Dry Anaerobic Digestion of Food and Paper Industry Wastes at Different Solid Contents. Fermentation 2019, 5, 40. [Google Scholar] [CrossRef] [Green Version]
  20. Jiang, Y.; Dennehy, C.; Lawlor, P.; Hu, Z.; McCabe, M.; Cormican, P.; Zhan, X.; Gardiner, G.E. Exploring the roles of and interactions among microbes in dry co-Digestion of food waste and pig manure using high-throughput 16S rRNA gene amplicon sequencing. Biotechnol. Biofuels 2019, 12. [Google Scholar] [CrossRef] [Green Version]
  21. Rocamora, I.; Wagland, S.; Villa, R.; Simpson, E.; Fernández, O.; Bajón-Fernández, Y. Dry anaerobic digestion of organic waste: A review of operational parameters and their impact on process performance. Bioresour. Technol. 2020, 299, 122681. [Google Scholar] [CrossRef]
  22. Habarakada Liyanage, T.; Babel, S. Thermal, ultrasonic and electrochemical pretreatment methods to enhance the solubilization of organic substance and methane generation in food waste. J. Mater. Cycles Waste Manag. 2020. [Google Scholar] [CrossRef]
  23. Chen, L.; Qin, Y.; Chen, B.; Wu, C.; Zheng, S.; Chen, R.; Yang, S.; Yan, L.; Liu, Z. Enhancing degradation and biogas production during anaerobic digestion of food waste using alkali pretreatment. Environ. Res. 2020, 188, 109743. [Google Scholar] [CrossRef]
  24. Moon, H.; Song, I. Enzymatic Hydrolysis of FoodWaste and Methane Production Using UASB Bioreactor. Int. J. Green Energy 2011, 8, 361–371. [Google Scholar] [CrossRef]
  25. Izumi, K.; Okishio, Y.; Nagao, N.; Niwa, C.; Yamamoto, S.; Toda, T. Effects of particle size on anaerobic digestion of food waste. Int. Biodeterior. Biodegrad. 2010, 64, 601–608. [Google Scholar] [CrossRef]
  26. Cho, S.; Im, W.; Kim, D.; Kim, M.; Shin, H.; Oh, S. Dry anaerobic digestion of food waste under mesophilic conditions: Performance and methanogenic community analysis. Bioresour. Technol. 2013, 131, 210–217. [Google Scholar] [CrossRef] [PubMed]
  27. Zielinski, M.; Dębowski, M.; Grala, A.; Dudek, M.; Kupczyk, K.; Rokicka, M. The effect of pressure and temperature pretreatment on the biogas output from algal biomass. Environ. Technol. 2014, 36, 693–698. [Google Scholar] [CrossRef] [PubMed]
  28. APHA-AWWA-WPCF. Standard Methods for the Examination of Water and Wastewater; American Public Health Association: Washington, DC, USA, 1998. [Google Scholar]
  29. Yeshanew, M.; Frunzo, L.; Lens, P.; Pirozzi, F.; Esposito, G. Mass Loss Controlled Thermal Pretreatment System to Assess the Effects of Pretreatment Temperature on Organic Matter Solubilization and Methane Yield from Food Waste. Front. Environ. Sci. 2016, 4. [Google Scholar] [CrossRef] [Green Version]
  30. Arun, C.; Sivashanmugam, P. Solubilization of waste activated sludgeusing a garbage enzyme produced from different pre-consumer organic waste. RSC Adv. 2015, 5, 51421–51427. [Google Scholar] [CrossRef]
  31. Liu, Y.; Huang, T.; Li, X.; Huang, J.; Peng, D.; Maurer, C.; Kranert, M. Experiments and Modeling for Flexible Biogas Production by Co-Digestion of Food Waste and Sewage Sludge. Energies 2020, 13, 818. [Google Scholar] [CrossRef] [Green Version]
  32. Oda, V.; Korkmaz, M.; Özkurt, E. Some sigmoidal models used in estimating the growth curve and biological parameters obtained:Von Bertalanffy pattern sample. Ordu Univ. J. Sci. Tech. 2016, 6. Available online: https://dergipark.org.tr/tr/donload/article-file/227497 (accessed on 28 May 2020).
  33. Pramanik, S.; Suja, F.; Porhemmat, M.; Pramanik, B. Performance and Kinetic Model of a Single-Stage Anaerobic Digestion System Operated at Different Successive Operating Stages for the Treatment of Food Waste. Processes 2019, 7, 600. [Google Scholar] [CrossRef] [Green Version]
  34. Xu, F.; Li, Y.; Ge, X.; Yang, L.; Li, Y. Anaerobic digestion of food waste–Challenges and opportunities. Bioresour. Technol. 2018, 247, 1047–1058. [Google Scholar] [CrossRef] [PubMed]
  35. Song, C.; Zhang, Y.; Xia, X.; Qi, H.; Li, M.; Pan, H.; Xi, B. Effect of inoculation with a microbial consortium that degrades organic acids on the composting efficiency of food waste. Microb. Biotechnol. 2018, 11, 1124–1136. [Google Scholar] [CrossRef] [PubMed] [Green Version]
  36. Dioha, I.J.; Ikeme, C.H.; Nafiu, T.; Soba, N.I.; Yusuf, M.B.S. Effect of carbon to nitrogen ratio on biogas production. Int. Res. J. Nat. Sci. 2013, 3, 1–10. [Google Scholar]
  37. Morales-Polo, C.; del Mar Cledera-Castro, M.; Moratilla Soria, B. Reviewing the Anaerobic Digestion of Food Waste: From Waste Generation and Anaerobic Process to Its Perspectives. Appl. Sci. 2018, 8, 1804. [Google Scholar] [CrossRef] [Green Version]
  38. Gnaoui, Y.; Karouach, F.; Bakraoui, M.; Barz, M.; Bari, H. Mesophilic anaerobic digestion of food waste: Effect of thermal pretreatment on improvement of anaerobic digestion process. Energy Rep. 2019, 6, 417–422. [Google Scholar] [CrossRef]
  39. Merkle, W.; Baer, K.; Haag, N.; Zielonka, S.; Ortloff, F.; Graf, F.; Lemmer, A. High-Pressure anaerobic digestion up to 100 kg/cm2: Influence of initial pressure on production kinetics and specific methane yields. Environ. Technol. 2016, 38, 337–344. [Google Scholar] [CrossRef]
  40. Deepanraj, B.; Sivasubramanian, V.; Jayaraj, S. Effect of substrate pretreatment on biogas production through anaerobic digestion of food waste. Int. J. Hydrog. Energy 2017, 42, 26522–26528. [Google Scholar] [CrossRef]
  41. Raju, C.; Sutaryo, S.; Ward, A.; Møller, H. Effects of high-Temperature isochoric pre-treatment on the methane yields of cattle, pig and chicken manure. Environ. Technol. 2013, 34, 239–244. [Google Scholar] [CrossRef] [Green Version]
  42. Prabhudessai, V.; Salgaonkar, B.; Braganca, J.; Mutnuri, S. Pretreatment of Cottage Cheese to Enhance Biogas Production. BioMed Res. Int. 2014, 2014, 374562. [Google Scholar] [CrossRef] [Green Version]
  43. Ariunbaatar, J.; Panico, A.; Esposito, G.; Pirozzi, F.; Lens, P. Pretreatment methods to enhance anaerobic digestion of organic solid waste. Appl. Energy 2014, 123, 143–156. [Google Scholar] [CrossRef]
  44. Naran, E.; Toor, U.A.; Kim, D.J. Effect of pretreatment and anaerobic co-Digestion of food waste and waste activated sludge on stabilization and methane production. Biodegradation 2016, 113, 17–21. [Google Scholar] [CrossRef]
  45. Achinas, S.; Li, Y.; Achinas, V.; Euverink, G. Biogas Potential from the Anaerobic Digestion of Potato Peels: Process Performance and Kinetics Evaluation. Energies 2019, 12, 2311. [Google Scholar] [CrossRef] [Green Version]
  46. Kalle, G.; Nayak, K.; De Sa, C. An approach to improve methanogenesis through the use of mixed cultures isolated from biogas digester. J. Biosci. 1985, 9, 137–144. [Google Scholar] [CrossRef]
  47. Qian, M.; Zhang, Y.; Li, R.; Nelles, M.; Stinner, W.; Li, Y. Effects of Percolate Recirculation on Dry Anaerobic Co-Digestion of Organic Fraction of Municipal Solid Waste and Corn Straw. Energy Fuels 2017, 31, 12183–12191. [Google Scholar] [CrossRef]
  48. Zhang, J.; Liu, M.; Zhang, J.; He, Q.; Yang, K.; Wang, H.; Li, W. The Response of Biogas Production and Methanogenic Community to the Variation of Intermediate Vfas Produced During the Anaerobic Digestionof Food Waste. J. Bioremediation Biodegrad. 2017, 8. [Google Scholar] [CrossRef]
  49. Juntupally, S.; Begum, S.; Allu, S.; Nakkasunchi, S.; Madugula, M.; Anupoju, G. Relative evaluation of micronutrients (MN) and its respective nanoparticles (NPs) as additives for the enhanced methane generation. Bioresour. Technol. 2017, 238, 290–295. [Google Scholar] [CrossRef]
  50. Gandhi, P.; Paritosh, K.; Pareek, N.; Mathur, S.; Lizasoain, J.; Gronauer, A.; Bauer, A.; Vivekanand, V. Multicriteria Decision Model and Thermal Pretreatment of Hotel Food Waste for Robust Output to Biogas: Case Study from City of Jaipur, India. BioMed Res. Int. 2018, 2018, 1–13. [Google Scholar] [CrossRef] [Green Version]
  51. Buswell, A.; Mueller, H. Mechanism of Methane Fermentation. Ind. Eng. Chem. 1952, 44, 550–552. [Google Scholar] [CrossRef]
  52. Da Costa Gomez, C. Biogas as an Energy Option: An Overview. In The Biogas Handbook; Elsevier Science: Burlington, MA, USA, 2013; pp. 1–16. [Google Scholar] [CrossRef]
  53. Liu, J.; Wang, S.; Zhao, B.; Tong, H.; Chen, C. Absorption of carbon dioxide in aqueous ammonia. Energy Procedia 2009, 1, 933–940. [Google Scholar] [CrossRef] [Green Version]
  54. Lemmer, A.; Merkle, W.; Baer, K.; Graf, F. Effects of high-Pressure anaerobic digestion up to 30 kg/cm2 on pH-value, production kinetics and specific methane yield. Energy 2017, 138, 659–667. [Google Scholar] [CrossRef]
  55. Ma, X.; Abe, Y.; Kaneko, A.; Fujimoto, S.; Murakami, C. Study on Dissolution Process of Liquid CO2 into Water under High Pressure Condition for CCS. Energy Procedia 2017, 114, 5430–5437. [Google Scholar] [CrossRef]
  56. Saady, N. Homoacetogenesis during hydrogen production by mixed cultures dark fermentation: Unresolved challenge. Int. J. Hydrog. Energy 2013, 38, 13172–13191. [Google Scholar] [CrossRef]
  57. Ragsdale, S.; Pierce, E. Acetogenesis and the Wood–Ljungdahl pathway of CO2 fixation. Biochim. Biophys. Acta (BBA) Proteins Proteom. 2008, 1784, 1873–1898. [Google Scholar] [CrossRef] [PubMed] [Green Version]
  58. Enzmann, F.; Mayer, F.; Rother, M.; Holtmann, D. Methanogens: Biochemical Background and Biotechnological Applications. In AMB Express; Springer: New York, NY, USA, 2018; Volume 8. [Google Scholar]
  59. Rabii, A.; Aldin, S.; Dahman, Y.; Elbeshbishy, E. A Review on Anaerobic Co-Digestion with a Focus on the Microbial Populations and the Effect of Multi-Stage Digester Configuration. Energies 2019, 12, 1106. [Google Scholar] [CrossRef] [Green Version]
  60. Thorin, E.; Olsson, J.; Schwede, S.; Nehrenheim, E. Co-Digestion of sewage sludge and microalgae–Biogas production investigations. Appl. Energy 2018, 227, 64–72. [Google Scholar] [CrossRef] [Green Version]
  61. Engineeringtoolbox.com. Steam Heating Process-Load Calculating. 2019. Available online: https://www.engineeringtoolbox.com/steam-heating-process-d_437.html (accessed on 15 October 2019).
  62. Fang, W.; Zhang, P.; Shang, R.; Ye, J.; Wu, Y.; Zhang, H.; Liu, J.; Gou, X.; Zeng, G.; Zhou, S. Effect of high pressure homogenization on anaerobic digestion of the sludge pretreated by combined alkaline and high pressure homogenization. Desalin. Water Treat. 2017, 62, 168–174. [Google Scholar] [CrossRef]
  63. Gao, T.; Li, X. Using thermophilic anaerobic digestate effluent to replace freshwater for bioethanol production. Bioresour. Technol. 2011, 102, 2126–2129. [Google Scholar] [CrossRef]
  64. Uggetti, E.; Sialve, B.; Latrille, E.; Steyer, J. Anaerobic digestate as substrate for microalgae culture: The role of ammonium concentration on the microalgae productivity. Bioresour. Technol. 2014, 152, 437–443. [Google Scholar] [CrossRef] [Green Version]
  65. Available online: http://fert.nic.in/what-fertilizer-control-order (accessed on 18 January 2020).
  66. Angelonidi, E.; Smith, S. A comparison of wet and dry anaerobic digestion processes for the treatment of municipal solid waste and food waste. Water Environ. J. 2015, 29, 549–557. [Google Scholar] [CrossRef]
Figure 1. Solubilization of food waste due to pretreatment with different pressures and different time durations.
Processes 08 01018 g001
Figure 2. Effect of pressure pretreatment on cumulative biogas profile and methane profile with respect to methane concentration. (a) Cumulative biogas generation with pretreated food waste; (b) methane concentration profile for pretreated food waste at different pressures.
Processes 08 01018 g002aProcesses 08 01018 g002b
Figure 3. Cumulative methane yield in the reactors operated with untreated and pretreated food waste at different pressures.
Processes 08 01018 g003
Figure 4. Biogas and methane profile for pretreated food waste at different time duration at 2-kg/cm2 pressure. (a) Cumulative biogas generation profile at different time duration of pretreatment; (b) cumulative methane generation profile along with methane concentrations.
Processes 08 01018 g004
Figure 5. Cumulative methane yield with respect to vs. reduction (%).
Processes 08 01018 g005
Figure 6. Volatile fatty acids (VFA) generation, VFA consumption and pH profile for pretreated food waste at different pressures and time durations. (a) VFA profile for pretreated food waste experiments at differ pressures; (b) pH profile for pretreated food waste experiments at different pressures; (c) VFA profile for pretreatment of food waste experiments at different time intervals; (d) pH profile for pretreated food waste experiments at different time intervals; (e) VFA consumption profile of pretreated food waste at different pressure.
Processes 08 01018 g006aProcesses 08 01018 g006bProcesses 08 01018 g006c
Figure 7. SEM analysis of the pretreated food waste at different time intervals. (a) Untreated food waste; (b) pretreated food waste at 20 min; (c) pretreated food waste at 40 min; (d) pretreated food waste at 60 min; (e) pretreated food waste at 80 min; (f) pretreated food waste at 100 min.
Processes 08 01018 g007aProcesses 08 01018 g007bProcesses 08 01018 g007c
Figure 8. The cumulative biogas profile for experimental and predicted values by using Gompertz model for pretreated food waste at different pressures and time intervals. (a) Untreated food waste; (b) pretreatment at 0.5 kg/cm2; (c) pretreatment at 1 kg/cm2; (d) pretreatment at 1.5 kg/cm2; (e) pretreatment at 2 kg/cm2; (f) pretreatment at 2.5 kg/cm2; (g) pretreatment for 20 min; (h) pretreatment for 40 min; (i) pretreatment for 60 min; (j) pretreatment for 80 min; (k) pretreatment for 100 min.
Processes 08 01018 g008aProcesses 08 01018 g008bProcesses 08 01018 g008c
Figure 9. Comparison of theoretical and experimental methane yield.
Processes 08 01018 g009
Figure 10. Heat energy required and generated along with net energy for pretreatment of food waste at 2-kg/cm2 pressure and different time durations.
Processes 08 01018 g010
Figure 11. Effect of pretreated food waste on batch residence time (BRT).
Processes 08 01018 g011
Table 1. Pretreatment conditions with bioreactor designations.
S. NoBio ReactorPretreatment Conditions
(Temperature and Pressure)
Time Interval
1Batch reactor with mixed microbial consortiaNANA
2Batch Reactor with untreated food wasteNo pretreatmentNA
Pretreatment (Phase I): Pretreatment at different pressures
3Batch reactor0.5 kg/cm2 (81.3 °C)20 min
4Batch reactor1 kg/cm2 (99.6 °C)20 min
5Batch reactor1.5 kg/cm2 (111.3 °C)20 min
6Batch reactor2 kg/cm2 (120 °C)20 min
7Batch reactor2.5 kg/cm2 (127 °C)20 min
Pretreatment (Phase II): Pretreatment at 2-kg/cm2 pressure and 120 °C for different time intervals
8Batch reactor120 °C, 2 kg/cm220 min
9Batch reactor120 °C, 2 kg/cm240 min
10Batch reactor120 °C, 2 kg/cm260 min
11Batch reactor120 °C, 2 kg/cm280 min
12Batch reactor120 °C, 2 kg/cm2100 min
NA-not applicable.
Table 2. Physicochemical characteristics of raw food waste.
ParameterUnitFood Waste
pHNA4.5 ± 0.01
TS%25 ± 0.7
VS%20 ± 0.7
MC%75 ± 0.7
VS/TSNA0.8 ± 0.01
CODg/L102 ± 7.07
Soluble CODg/L51 ± 7.07
BODg/L70 ± 3
BOD/CODNA0.68 ± 0.00
VFAg/L5.5 ± 2.12
Alkalinityg/L6.3 ± 0.7
VFA/AlkalinityNA0.8 ± 0.01
C%45.5 ± 0.14
H%7.1 ± 0.01
N%1.9 ± 0.07
S%0.085 ± 0.01
O%37 ± 0.08
C/NNA24.1 ± 1.02
NA—not applicable.
Table 3. Physicochemical characteristics of pretreated food waste at different pressures (0.5, 1, 1.5, 2 and 2.5 kg/cm2).
Parameter0.5 kg/cm21 kg/cm21.5 kg/cm22 kg/cm22.5 kg/cm2
pH4.02 ± 0.014.22 ± 0.014.07 ± 0.024.21 ± 0.014.25 ± 0.01
TS (%)25 ± 0.3525.6 ± 0.0725.6 ± 0.1425.8 ± 0.2126.2 ± 0.3
VS (%)20.5 ± 0.0720.8 ± 0.0720.9 ± 0.220.8 ± 0.0721.5 ± 0.1
MC (%)75 ± 0.3574.4 ± 0.0774.4 ± 0.1474.2 ± 0.2173.8 ± 0.3
VS/TS0.82 ± 0.010.81 ± 0.010.81 ± 0.0040.8 ± 0.010.82 ± 0.1
Soluble COD (g/L)52 ± 1.4155 ± 3.5358 ± 1.4158.6 ± 3.5360.1 ± 0.70
C/N24 ± 0.1424 ± 0.1423.9 ± 0.1423.2 ± 0.1523.2 ± 0.14
Table 4. Physicochemical characteristics of pretreated food waste at 120 °C and 2 kg/cm2 for different time intervals.
Parameter20 min40 min60 min80 min100 min
pH4.21 ± 0.014.25 ± 0.014.01 ± 0.023.95 ± 0.013.8 ± 0.02
TS (%)25.8 ± 0.2126 ± 0.326.4 ± 0.1426.5 ± 0.226.5 ± 0.21
VS (%)20.8 ± 0.0721.1 ± 0.0721.5 ± 0.0721.8 ± 0.022.1 ± 0.07
MC (%)74.2 ± 0.2174 ± 0.373.6 ± 0.1473.5 ± 0.273.5 ± 0.21
VS/TS0.79 ± 0.010.81 ± 0.010.814 ± 0.0020.82 ± 0.010.83 ± 0.01
Soluble COD (g/L)58.6 ± 3.562 ± 4.068 ± 2.572 ± 1.485 ± 1.4
C/N23.2 ± 0.1423 ± 0.1423.5 ± 0.1422.9 ± 0.1522.4 ± 0.14
Table 5. (a) Parameters obtained after application of modified Gompertz equation for pretreated food waste at different pressures; (b) parameters obtained after application of modified Gompertz equation for pretreated food waste at different time intervals.
(a)
Untreated Food Waste0.5 kg/cm21 kg/cm21.5 kg/cm22 kg/cm22.5 kg/cm2
Cumulative biogas generation
(Y) from the experiment (mL)
32,24037,00040,17543,840453,0046,150
Cumulative biogas generation (P) from the Gompertz relation (mL)41,80042,80047,60049,80050,80051,700
Maximum methane yield production rate(Rm), mL/day106112751383157417061698
Lag phase period (λ), days6.55.35.45.85.75.5
R20.9950.9970.9970.9980.9980.998
(b)
20 min40 min60 min80 min100 min
Cumulative biogas generation
(Y) from the experiment (mL)
45,30047,20053,50057,50260,800
Cumulative biogas generation (P) from the Gompertz relation (mL)50,80052,10057,80060,90064,000
Maximum methane yield production rate(Rm), mL/day17061692205222402284
Lag phase period (λ), days5.74.44.44.13.3
R20.9980.990.990.990.99

