

Biosand Reactors for Municipal and Industrial Wastewater Treatment: Status Quo, Challenges and Opportunities

Applied Microbial and Health Biotechnology Institute, Cape Peninsula University of Technology, Bellville Campus, Symphony Way Bellville, Cape Town 7530, South Africa
Processes 2024, 12(4), 641; https://doi.org/10.3390/pr12040641
Submission received: 8 March 2024
/
Revised: 19 March 2024
/
Accepted: 21 March 2024
/
Published: 23 March 2024
(This article belongs to the Special Issue Advances in Wastewater and Solid Waste Treatment Processes)
Abstract
:Biosand reactors (BSRs), alternatively known as slow or biological sand filters, are passive systems that are used to remove contaminants from domestic wastewater, industrial wastewater and drinking water. This review focuses specifically on their application for remediation of industrial effluent and sewage-containing municipal and household effluent. The relationships between the physicochemical characteristics of the sand grains (size, size distribution, shape, chemical composition) and the hydraulic conductivity of the sand employed in BSFs are critically discussed in relationship to the achievable loading rates and hydraulic retention times. The modes of operation and influence of the functional microbial biomass as well as biodegradable and recalcitrant particulates on these parameters is comprehensively reviewed. Finally, the bioremediation of sewage-based and industrial wastewater is examined. This includes an account of the biotic and abiotic removal mechanisms and the limitations of BSRs for removal of pollutants such as phosphorus/phosphate and nitrates/nitrites. The removal mechanisms and removal efficiencies of macronutrients, micropollutants, fecal indicators and other microorganisms such as antibiotic-resistant bacteria in BSRs are discussed.
1. Introduction
For decades, sand-based systems have been used ubiquitously for improving the quality of raw water for drinking purposes and for remediating municipal greywater and sewage from households or small communities [1,2,3,4,5]. More recently, they have been investigated and applied for remediation of industrial and agri-industrial wastewaters (WW) because of their longevity, low capex and running costs, low energy requirements, tolerance of seasonal input fluxes and ability to retain efficient performance after lengthy shut-down periods [6,7]. Different terms have been used to describe these fixed-film sand-based systems for WW treatment, including biosand filters [2], sand filters [8], biological sand filters [9] and biosand reactors (BSRs) [10]. The term ‘filter’ implies that the primary function is physical filtration, but removal of potential pollutants via substrate binding, precipitation [11,12], physicochemical catalytic breakdown of organics [13,14] and bioremediation [10] can also take place. As with most secondary WW treatment systems, the latter is arguably the most important removal mechanism. The term BSR is therefore used preferentially to describe the array of secondary and tertiary fixed-film sand-based WW treatment systems included in this review.
The main functions of the sand particles in BSRs are to trap solids and provide large surface areas and robust biofilm attachment sites for the microbial communities responsible for biodegradation of pollutants in WW [15]. It has been shown that the extensive rough surfaces of sand grains promote biofilm growth more effectively than synthetic biofilm attachment alternatives [15]. In BSRs, contact between the microbial communities and the pollutants takes place as the WW passively permeates through the interpore spaces in the sand [16]. In contrast, active fluidization of sand particles is applied to enhance mass transfer between microbial populations and the WW in fluidized bed reactors that can also incorporate sand as a microbial support medium [17].
Similar passive principles of operation apply to BSRs and constructed/treatment wetlands (CW/TWs), most notably those containing sand as the primary matrix/medium [18]. The major difference is that CW/TWs contain plant species that may contribute to WW treatment via phyco-remediation [18]. The functional role of plants is incumbent on many factors, including the mode of operation viz. vertical flow (VF), horizontal subsurface flow (HSSF) or sub-surface flow (SSF), the organic loading rate (OLR), the hydraulic loading rate (HLR), the depth of the CW/TW, the type of WW, the type/s of plant/s and the climate [19,20]. Although there are many benefits associated with the addition of plants, their presence does not necessarily improve removal of solids, organics and/or macronutrients [8,20,21]. In some instances, plants are not desirable, for instance, if the WW is phytotoxic, dead plants will need to be removed to prevent nutrients leaching into the TW/CWs when they decay [19,20]. Another drawback is that the root systems of plants can contribute to surface clogging and/or cause ‘short-circuiting’ of WW due to the creation of preferential flow paths within the sand matrix [22,23].
This review focuses on BSRs applied for secondary and tertiary bioremediation of sewage, septic tank effluent, municipal and industrial wastewater and excludes fluidized bed reactors and CW/TWs, which have already been widely reviewed in the literature. The SCOPUS database was used to select the manuscripts for review using “sand bioreactor” and/or “sand filter” and/or “biosand reactor” and/or “slow sand filter” and/or “sand” and or “wastewater” and/or “effluent” in the article title, abstract and keywords. Manuscripts describing treatment of raw water for drinking purposes and treatment of irrigation or household grey water were excluded. It must also be noted that the performance of BSRs may be improved by mixing sand with other substrates [24,25]. However, the intent of this review is to compare results from studies using sand as the primary physical substrate, so the literature describing the use of alternative substrates was largely excluded.
2. Hydraulic Performance of Biosand Reactors
During the start-up period, the achievable flow rates in BSRs are incumbent on the intrinsic hydraulic conductivity (HC) of the sand. The HC decreases during operation due to the formation of functional microbial biofilm that protrudes into the pore spaces of the sand matrix [16,26].
2.1. Sand Characteristics and Hydraulic Conductivity
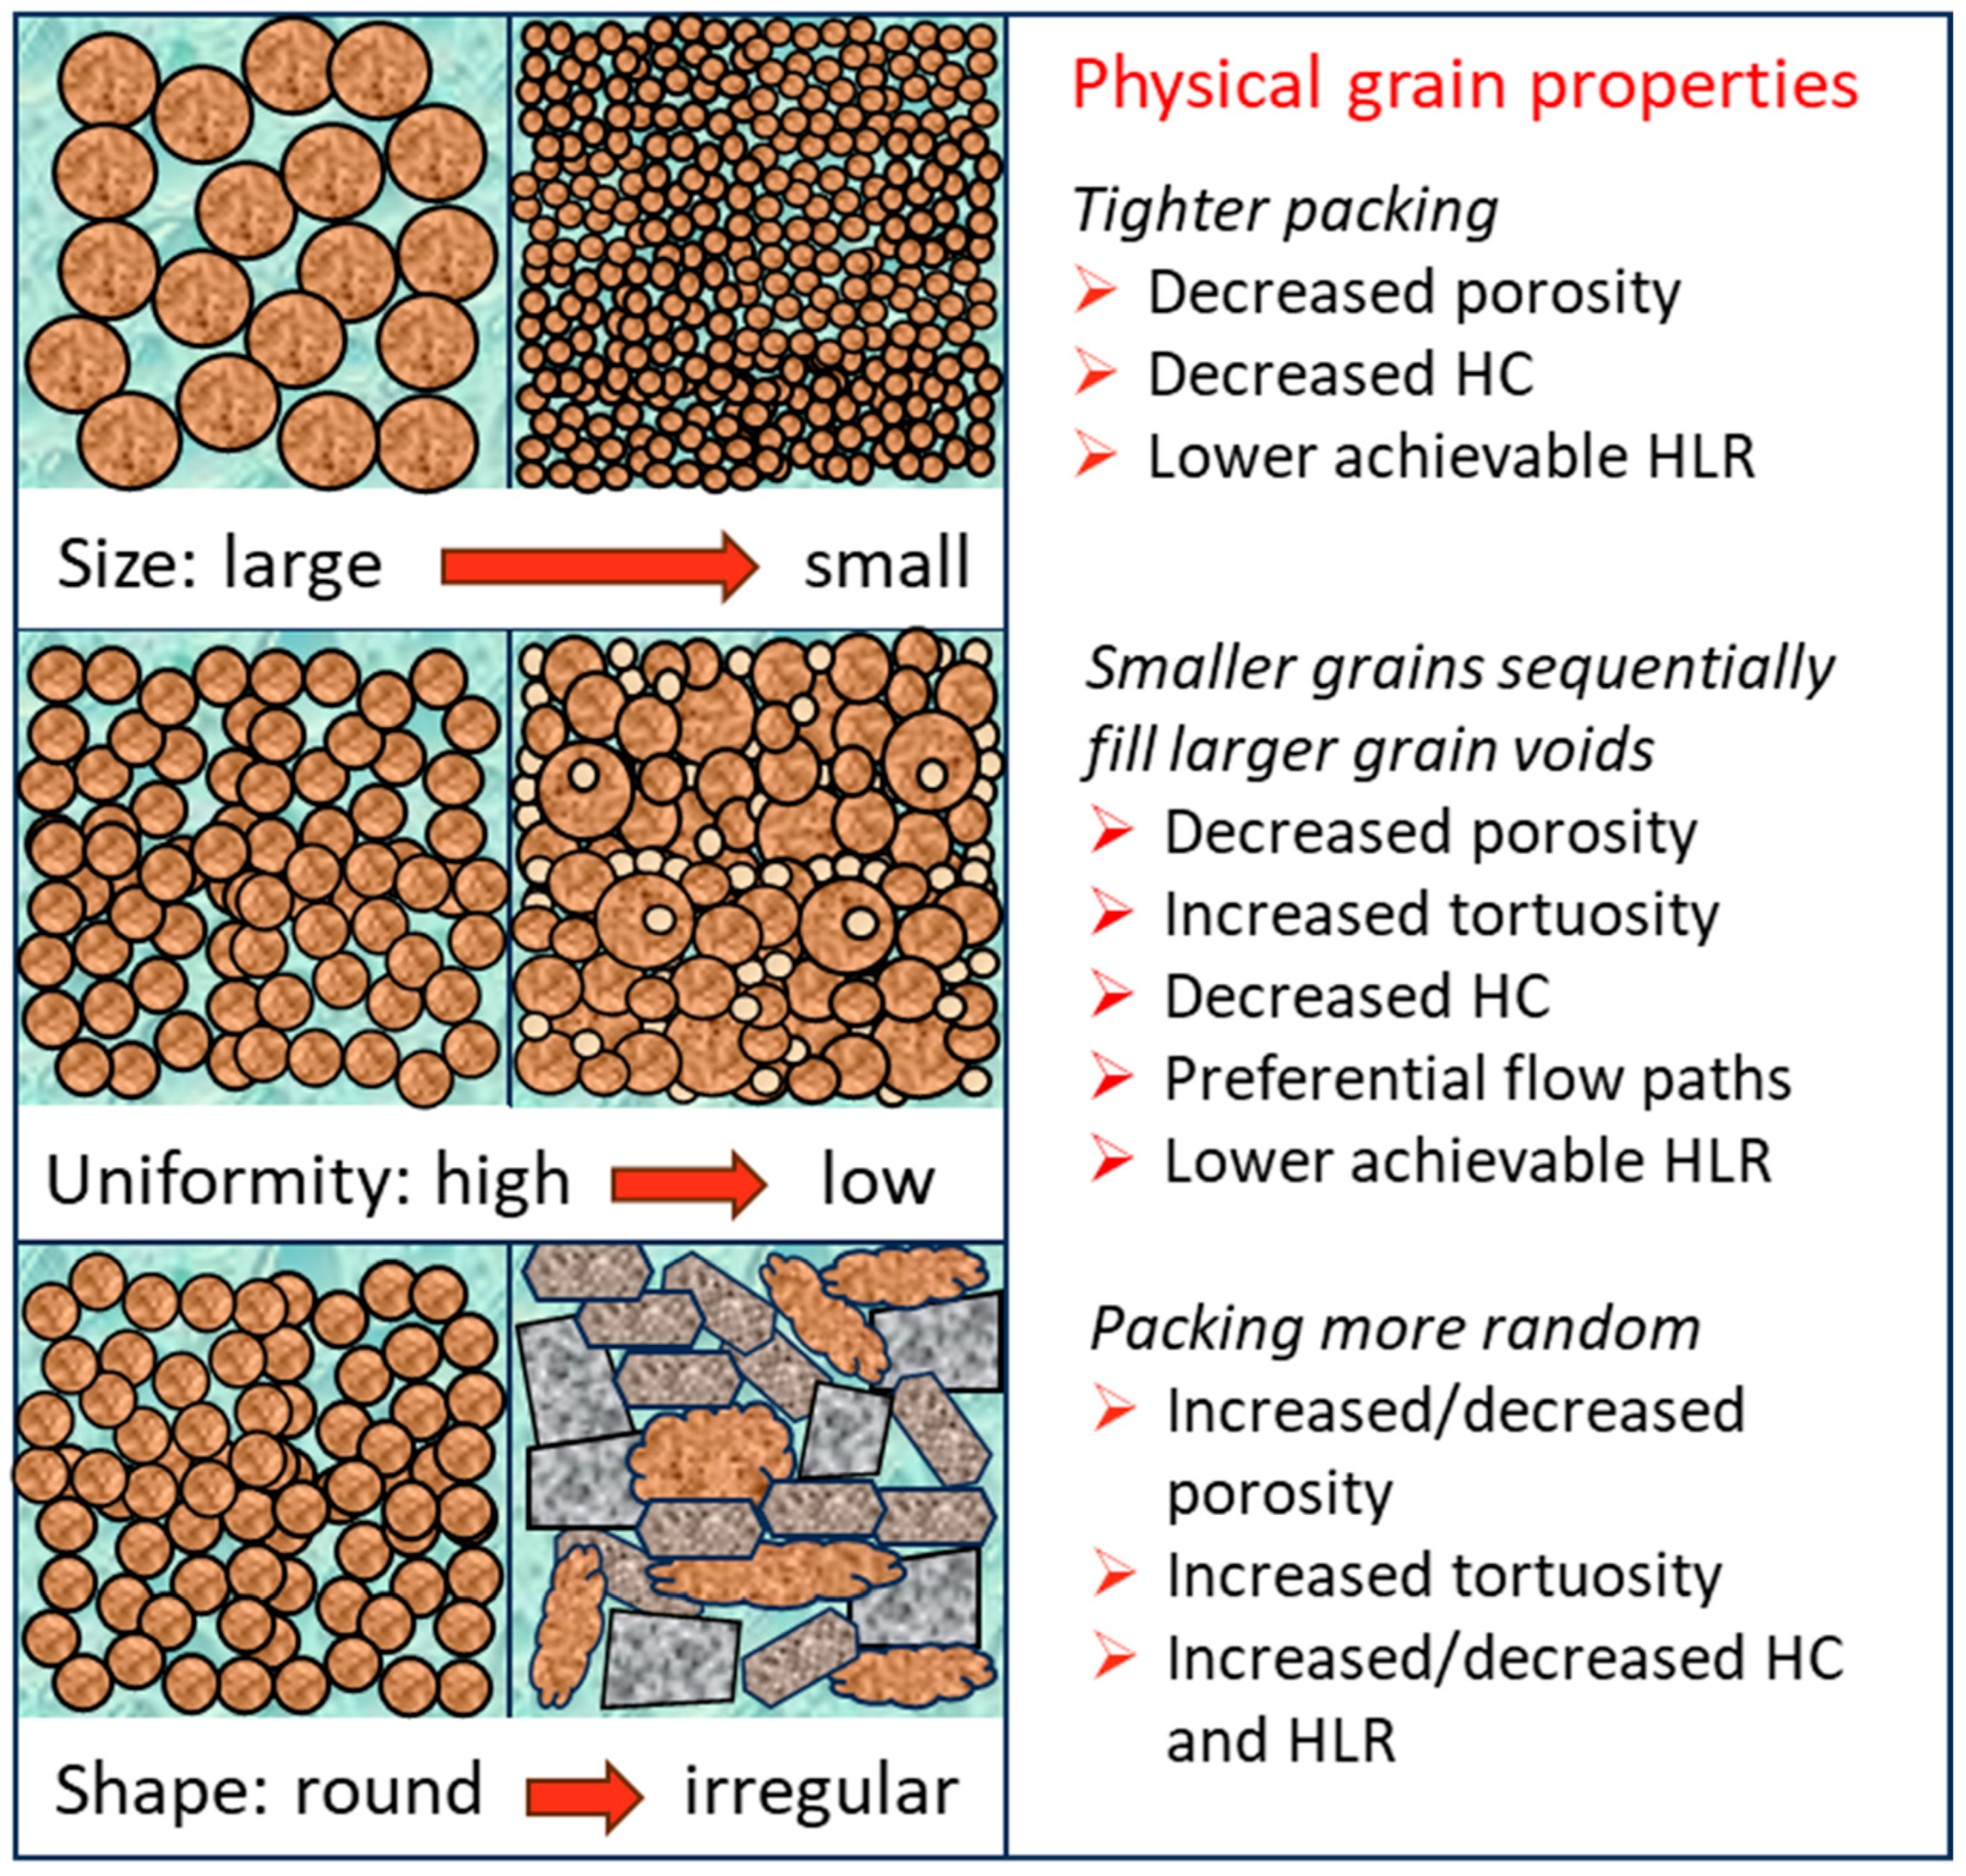
It is challenging to capacitate BSRs during the design process. Not only is it difficult to predict the necessary changes in flow rates due to loss of HC after start-up, but models used to determine the HC of sands are typically based on particle size distributions and assume that the sand grains are perfectly spherical in nature, which is rarely the case [27,28]. The macroscopic features of grains that affect the flow in BSRs are shown in Figure 1. Particles that are ideal for modelling purposes are chemically inert, round, non-porous and uniform in size, in which case there are high positive and negative correlations between the porosity and grain size and grain size distributions, respectively [16,29,30]. If the grain size distribution is uniform, the particles pack together quite consistently and the geometry of the inter-grain pore channels (tortuosity) and hence flow of wastewater through the sand medium are relatively even [31,32]. Conversely, in sands with low uniformity, smaller grains sequentially fill the voids created by larger grains. This results in reduced overall porosity as well as blocking of flow channels (throats) between some grains, especially in the presence of fine particles [16,29,30]. Increased tortuosity created by uneven grain packing may result in the establishment of preferential flow paths and ‘short-circuiting’ [33]. If the flow through the sand matrix is not consistent, the hydraulic retention time (HRT) of the incoming wastewater can vary in different spatial areas, negatively affecting operational performance [16,33]. The situation becomes more complex when other factors are also considered, most notably the grain shape, porosity and chemical make-up. These can have significant effects on the HC and flow paths of BSRs, rendering models based on particle sphericity inaccurate [16,31,32,33,34,35]. The shape of sand particles depends on their etiology viz. mineralogy, formation mechanisms and effect/s of weathering [32,33] and can be measured with indices such as circularity, curvature, angularity and roundness [16,29,32,36]. Non-spherical particles generally create more random packing arrangements, having a knock-on effect on the tortuosity of the void fraction [32,37,38,39]. The impact is variable, depending on the type/s of shapes and uniformity of the grains [32]. The mineral composition can also affect the HC of sand in BSRs because hydrated inter-particle bonds can be formed between grains composed of cementitious minerals and/or clays under certain conditions [31]. The chemical bonding processes affecting porosity, tortuosity and HC are complex, and a detailed discussion is beyond the scope of this review. Lastly, compaction processes can affect the HC, and water permeation may be unbalanced if compaction is not homogenous [40].
The gap between theoretical and actual efficiency of BSRs can benefit from applying detailed knowledge of sand characteristics during the design process. Of the thirty-one studies analyzed in this review, six reported on the origin of the sand (one beach sand, two river sand, two dune sand), five reported on the dominant mineralogy of the sand (quartz) and only one reported more detailed mineralogy. In terms of grain size, one manuscript reported only descriptors (fine, medium, coarse sand), six reported the range only, while seven provided only one grain size with no range and did not qualify whether this was an average or whether the sand had been specifically sieved to obtain this exact sand fraction (which seems unlikely). Two manuscripts included only the d10 results viz. the size at which 10% of the grains have a finer grain diameter (⌀). The thirteen remaining studies all included the average grain ⌀ (d50) or d60 sizes, and five of these also provided the grain ⌀ ranges. Eleven studies reported the d60/d10 ratio or uniformity coefficient (U) and two of these did not provide any additional grain data. Notably, only two studies included in Table 1 [10,29] reported particle shape indices. While the d50 is a useful parameter, the d10 provides valuable information on the fine particles that can block flow paths. The U value indicates how well-graded (uniform) sands are, with an ideal value of 1 if all the grains ⌀ are the same [41]. Ideally, all these values should be included as a minimum in manuscripts pertaining to BSRs.
Most BSR experiments have been conducted using laboratory columns (Table 1 and Table 2). These are typically gravity-fed and naturally mimic simple VF BSR systems. In the column experiments included in this review, the d50 of the grains ranged from 0.3 mm to 1.34 mm [42,43,44]. In pilot VF and HSSF BSR studies, the d50 ranges of the grain ⌀ were typically smaller than in the column experiments (Table 1). Only a few studies have compared the effect of grain characteristics on hydraulic and/or operational performance of BSRs. Wang et al. [29] compared two different batches of river sands (d50 = 0.82 mm and 2.26 mm, d10 = 0.38 mm and 1.60 mm, U =2.78 and 1.75, for fine and coarse sands, respectively) and crushed aggregates (d50 = 1.60 mm and 1.36 mm, d10 = 0.44 mm and 1.60 mm U = 5 and 10, for larger and smaller aggregates, respectively). The theoretical saturated HC (T-HCSAT) was predicted using porosity results determined from infiltration tests as 0.825–0.953 mm/s, 0.279–0.288 mm/s and 0.749–0.973 mm/s for fine river sand, fine crushed aggregate and coarse crushed aggregate, respectively. Although the same HLR infiltration rates (HLRIR) were applied in the comparative experiments, the large differences in HC resulted in different HRTs in the gravity-fed systems containing the different substrates, confounding comparison of performance results, discussed in more detail in Section 2.2 and Section 3, respectively. In pilot BSR columns packed with sand to 130 cm (h), researchers [45] found that the model optimal HLRIR for 98% removal of Escherichia coli was high and similar for sand with grain ⌀ of 0.3 mm and 0.5 mm (5.28–8.4 × 103 mm/day and 4.56–8.64 × 103 mm/day, respectively), but no other performance observations were made. In another study, researchers found that the measured HCSAT of raw dune sand increased 9-fold, from 0.285 mm/s to 2.50 mm/s by removing all grains <0.425 mm [10]. These results support the recommendation that d10 of sand grains in BSRs should range from 0.2 to 0.4 mm [30]. In another study, only low theoretical unsaturated HC (T-HCUNSAT) of 0.077 mm/s was measured in gravity-fed columns, which also translated into low HLRIR of 16–83 mm/day [46]. Unfortunately, only the d50 (1.2 mm) of the sand used in this study was provided.
The U values for five of the sands used in the BSR column experiments included in this review fell within the range (2–3) for beach sand, while five exhibited lower values, indicating that they were particularly well-graded. However, notably higher values of 5.85 [47] and 4.0 [48] have also bee n reported. In the latter, the poorly graded fine sand was packed to 46 cm (h) in the columns and then covered with 15 cm of more uniform coarse grains (U = 1.3). The high U and low d50 of the fine sand translated into low HLRIR (60 mm/day) in full-scale HSSF systems containing the same sand [49]. Despite the poor hydraulic performance, the systems were kept hydraulically functional by rotationally resting BSR modules. In a semi-continuously operated pilot HSSF containing river sand with a U value of 8, porosity of 0.17 and large d50 (3.2 mm), another group of researchers [50] also obtained a low HLRIR (110–130 mm/day) and high HRT (1.7 days). The results indicate that sizeable reactors with large spatial footprints would be required to treat the high volumes of effluent expected from industries in BSRs with such low HLRIR.
Depending on the shape, sand containing mainly non-spherical grains may have higher or lower HC values than sand containing spherical grains. For example, higher HC values were predicted for sand containing more concave and less spherical grains [32]. In a study comparing two sands (river and dune) with similar sizes and grain size distributions in BSR column experiments, significant (p < 0.05) differences in M-HCSAT were obtained (river = 0.154 mm/s and dune = 0.284 mm/s) [16]. It was found that these differences were mainly due to macro- and microscopic differences in the shapes of the grains. The dominant mineral in both sands was quartz, but it was present in higher amounts in the river sand (98%) than in the dune sand (81%), and the quartz grains in the river sand were more porous, more angular and less round than those in the dune sand [16]. The dune sand also contained 18% calcite grains which were more angular and less round than the quartz grains [16].
In summary, high HCs afforded by larger grain ⌀ and/or more uniform grain size distributions, among other properties, translate into greater treatment capacities and mitigate against clogging. However, at high HLR, unless there are mechanisms in place to manipulate flow rates [10,26], the HRT may be too low for effective remediation [29]. This is discussed in more detail in Section 2.2. Going forward, it is recommended that researchers always conduct and report all simple grain size analysis results (d50, d60, U and range). If possible, the origin of the sand should be included, and the elemental and mineralogical composition should be determined wherever feasible. Researchers should consider determining shape indices for more in-depth studies. It is highly recommended that M-HCSAT values be obtained using simulated operational studies to assist in correctly capacitating full-scale BSR systems [16].
2.2. Operation Modes, Hydraulic Loading Rates and Hydraulic Retention Times
Eighteen of the twenty laboratory BSR column experiments reviewed were gravity-fed, while the remaining two were operated in upflow mode using pre-oxygenated WW (Table 1). Upflow mode minimizes bubble formation and allows more effective hydraulic control [51,52,53]. However, the energy costs of this type of operation in comparison to energy-neutral gravity flow need to be carefully considered at scale. Most of the laboratory column experiments and pilot BSR systems were operated intermittently or semi-continuously to mimic the inflow patterns of the WW in the ‘real world’ or to facilitate oxygenation. It has been shown in CW/TWs and BSRs that ingress of oxygen (O2) via artificial aeration or intermittent operation promotes aerobic biodegradation and nitrification [42,54]. For instance, Ha and Ong [52] used artificial aeration and effluent recycling to create oxic (5 mg/L dissolved O2) and anoxic zones for effective nitrification and denitrification, respectively. As with HC, the sand characteristics play a role in oxygenation of BSRs. During intermittent operation of laboratory column BSRs treating synthetic septic tank effluent, researchers found that the O2 concentrations in the upper 35 cm remained close to ambient in columns containing coarser sand (d10 = 0.8 mm), while levels dropped to <2% after 10 of 14 cycles in columns containing finer sand (d10 = 0.42 mm) [40]. The existence of redox gradients within BSRs can be advantageous for removal of organics and total nitrogen (TN), as some organics are degraded preferentially under anaerobic/anoxic conditions, while others are more degradable under oxic conditions [55,56]. In high-COD WW, continuous operation may be preferable when the removal of the organics is higher under anoxic conditions [52,55]. For example, in pilot BSRs treating winery effluent, the HC, HLR and OLR were higher when the BSR systems were operated in continuous mode than when operated in pulse mode [7] (Table 1 and Table 2).
Resting BSRs provides time for oxidation of residual organic matter and excess biofilm that could potentially cause clogging [8,26,49]. This can be achieved naturally in systems where WW generation is seasonal in nature [26] or systems can be designed with additional BSR modules that can be rested on a rotational basis [42,49]. It is also recommended that the surface layer be periodically removed or disturbed during resting periods to improve WW inflow [48,49].
The choice of VF or HSSF mode of operation depends on the type and volume of WW being treated. The maximum achievable HLRs in HSSF systems are lower than in VF systems containing the same substrate [7,26]. The hydrodynamics of a full-scale VF BSR was investigated using computational fluid dynamics and it was established that the WW moved down the BSR in plug flow with no preferential flow paths [57]. Dead zones were found at the base, but constituted <3% of the BSR volume, and were reduced even further by using BSRs with smaller diameters operated in continuous rather than intermittent mode [57]. However, more studies are required, as these results cannot be confidently extrapolated to BSRs containing different sand, for reasons outlined in Section 2.1. If VF systems contain sand with high HC and are not prone to excessive clogging, high HLRs can be achieved (Table 1), which is an ideal scenario when large volumes of WW require remediation [26]. Such systems can also offer a high degree of operational flexibility if there are mechanisms in place to increase the HRT if required, For example, a novel BSR design with an inner and outer chamber filled with sand connected at the bottom via perforations where the height of the outlet, located in the outer chamber, can be adjusted to increase or decrease the hydraulic head according to flow requirements [26]. The capacity to treat large volumes of WW logically also translates into lower spatial, capex and operational requirements. Remediation efficiency can also be improved by decreasing the HLR in BSRs. For example, researchers found that removal rates of total suspended solids (TSS), chemical oxygen demand (COD) and coliforms improved when the HLRIR was decreased from 269 mm/day to 134 mm/day [47]. Ultimately, for each BSR system, there will be an ideal balance between the functional flow rates and the HRT required for effective remediation of constituents present in influent WWs. In passively fed VF systems with no outlet flow control mechanism, higher HRTs can be achieved by compacting the sand [40] or increasing the filter depth [29], but the latter may be impractical at scale and neither of these strategies enable hydraulic flexibility. In addition, lower layers of BSRs may be functionally obsolete in some systems [58].
In the literature, the HLR used in BSRs has been expressed in three different ways. To avoid confusion, these have been defined for the purposes of this review as follows: (i) the HLRIR, which has been standardized to mm/day; (ii) the surface loading rate (HLRSUR), which is the volume of wastewater applied per unit sand surface area per unit time, standardized in L/m2sand·day−1; (iii) the volumetric loading rate (HLRVOL), which is the volume of wastewater applied per unit sand volume per unit time, standardized in L/m3sand·day−1. For BSRs where most of the remediation takes place at the surface, the HLRSUR may be relevant. However, the value will be the same for both deep and shallow systems, so it is useful to also know the HLRVOL in reactors where a significant portion of remediation takes place under the surface. Currently, either the HLRIR or the HLRSUR is standardly applied to describe the HLR in BSRs. Of the thirty reviewed studies, nine reported HLRIR, eleven reported the HLRSUR, while two reported both the HLRIR and HLRVOL, and one reported the HLRSUR and HLRVOL. Of concern is that seven studies provided no HLR values. Given the simplicity of the calculations involved, it would be prudent for researchers to include all three values for readers to properly compare system functionalities. In addition, the overall HLR is skewed if BSRs are not operated in continuous mode, so it is important to also know the HLR during individual dosing episodes to make sure the systems are not transiently overloaded [5].
There were wide ranges in the HLRIR and HLRSUR reported for the laboratory column BSR experiments: from 16 mm/day [46] to 9360 mm/day [59] and 18 L/m2sand·day−1 [53] to 28,800 L/m2sand·day−1 [52]. The latter was operated using sand with large grains and a pump to force the WW upwards through the sand substrates, explaining the high HLRSUR value that was obtained. The lower rates were all reported for intermittently operated systems, but the actual flow rates achieved during feeding were not provided. With continuous gravity-fed operation, rates of 288 mm/day using sand with ⌀ = 0.77 mm [60] and 1200 mm/day using well-graded sand (U = 1.47) with high d10 (0.86 mm) were reported [61]. Although more comprehensive sand grain characteristics were not included in these manuscripts, from the values that were provided, it may be assumed that the differences in the HLRIR were related to the physical properties of the sand.
2.3. Temporal Changes in Flow Rates
After start-up, the HC and flow rates in BSRs can decrease due to (i) compaction of the sand and/or (ii) the formation of functional biofilm/biomass and/or (iii) collection of organic or inorganic particulates in the pore spaces of the sand matrix. Mechanical compaction may be performed deliberately when systems are being installed [40], but some unavoidable natural compaction also takes place over time [10,40].
The microbial biomass is the most important biotic component of BSRs [18,56]. Although the functional biomass can significantly reduce the HC of BSRs, this should arguably not be labelled as “clogging” unless the HC is reduced to below functional levels [16,18,56]. The biomass-associated reduction in HC is negatively correlated with the OLR because the heterotrophic microorganisms are reliant on organic substrates for growth [16,26,46,54]. Reductions in HC can therefore be reversed during periods of low organic loading [16,26]. There is an inflection point where the loading rates become insufficient to support microbial growth in the deeper layers of BSRs [54]. In systems operated at high OLR/HLR, substrate availability and biomass abundance are found in a continuum from the surface downwards [54,62]. Conversely, in BSRs operated with low HLR, such as those treating household sewage, the biolayer is formed on the surface [2,3,4,46,54]. This ‘schmutzdecke’ decreases ingress of WW into the substratum but can also increase and stabilize removal performance. In BSRs with high intrinsic HC where flow rates rely purely on gravity percolation, the WW treatment capacity is increased at high HLR, but the HRT may be insufficient for effective bioremediation [54]. This is not problematic in more sophisticated systems where the HRT can be adjusted according to need [26].
Researchers have measured similar losses in HC and/or flow rates due to build-up of functional biomass in BSRs. Reductions of 35–40% in flow rates were found after treating turkey processing WW in laboratory column experiments conducted over 2 years [48]. During remediation of pre-settled winery WW at OLR of 4326 gCOD/m3 sand·day−1, the M-HCSAT was reduced by 56% (from 0.285 mm/s to 0.129 mm/s) and 55% (from 2.50 mm/s to 1.11 mm/s), respectively, in BSR columns filled with raw sand and fractionated sand (≥0.425 mm grains only) [10]. In well-replicated experiments, researchers found that the M-HCSAT of pilot intermittently operated BSFs treating pre-coagulated dairy WW reduced by 40% after 280 days when operated at high OLR (110 ± 10 gCOD/m2 sand·day−1) and HLRVOL (20 ± 4 L/m2 sand·day−1) [62].
Entrainment of recalcitrant total suspended solids (TSS) may cause ‘true’ clogging which can be avoided or ameliorated by using primary treatment to remove or reduce the TSS before secondary treatment in the BSRs [50,62]. Primary settling is an obvious choice if the particles are settleable within a reasonable period, but other methods may be required if the particles remain suspended. Researchers showed that the reduction in M-HCSAT could be improved from 85% to 40% by pre-coagulating dairy WW (440 mgFe/L dairy WW) to remove particulates [62]. The authors calculated a significantly lower spatial footprint (145 m2 vs. 600 m2) and capex and operational costs for the hybrid (pre-coagulation) system (EUR 7920 and 1618, respectively) when compared with the conventional BSR treating raw, uncoagulated WW (EUR 32,845 and 4800, respectively). However, disposal of spent sludge was not accounted for and the possible impact of the increase in Cl after coagulation (155 ± 66 mg/L to 833 ± 145 mg/L) was not discussed.
When assessing the possible effects of TSS on flow rates, it is important to differentiate between organic and inorganic particulates because the latter do not degrade and can irreversibly reduce the HC [26,48,49]. Conversely, particulates in organic-rich WW such as winery WW [26] and turkey processing WW can mineralize within BSRs [49]. Intermittent feeding or resting can provide time for microorganisms to break down organic particulates [8,42,54]. A novel approach for restoring HC in BSRs is the use of burrowing earthworms at the surface to consume excess organic matter and create burrows for water infiltration [63], although it may be argued that the burrows could create preferential flow paths for the incoming WW.
In essence, efficient flow rates in BSRs can be maintained by using properly compacted sand containing grains with desirable flow characteristics, by employing primary removal of TSS relevant to the type of WW and applying operational parameters that have been optimized for each BSR system and type of WW [10,29,30,40,48]. Reduction in HC due to biomass formation should be factored in during the design phase [10]. By applying these considerations, BSRs can remain hydraulically functional for many years with no need to replace the sand or backwash the systems [7,26].
3. Wastewater Remediation Performance
Removal of organic and inorganic molecules in BSRs takes place via three major mechanisms, namely bioremediation, adsorption, and entrainment of WW particulates or precipitates. Biological sand reactors are not recommended for removal of recalcitrant particulates via entrainment because it can lead to irreversible clogging.
3.1. Abiotic Remediation and Removal Mechanisms
3.1.1. Adsorption and Entrainment
Molecules may adsorb onto the surface of sand particles or become part of the biofilms in BSRs. A few studies have shown increased pollutant removal when alternative adsorptive materials are mixed with sand. In laboratory column experiments, for example, biochar has been shown to improve the removal of macronutrients, chemicals, potential pathogens [61], TN [64] and pharmaceuticals [65]. As with entrainment, degradable molecules can be removed by both adsorption and biodegradation [14]. When these mechanisms are combined, increased removal of organics such as phenolics [14] and ammonia (NH3) [66,67] can theoretically take place.

Table 1.
Sand characteristics, operational and hydraulic parameters.
| Laboratory Studies: Column Experiments | |||
| Sand Characteristics and Porosity | Reactor Dimensions, Operation Mode and Retention Time | Hydraulic Loading Rates | Ref. |
| Beach sand: 14.2% FS, 66.5% MS, 18.2% CS DNP (size) | Columns: ⌀ = 25 cm, sand h = 60 cm Gravity-fed, intermittent operation (1:3 (feed:rest) days) | * HLRSUR = 26 L/m2sand·day−1 * HLRVOL = 8.4 L/m3sand·day−1 | [8] |
| Grain ⌀ d60 = 1.07 mm, d10 = 0.49 mm, U = 2.19 | Columns: ⌀ = 25 cm, sand h = 20 cm Gravity-fed, intermittent operation at 0.5 L/h during feeding | NDP | [68] |
| Grain ⌀ d50 = 1.34 mm (1.0–2.0 mm) * Fine (d10 = 0.25 mm) vs. coarse (d10 = 0.86 mm) | Columns: ⌀ = 15 cm, sand h = 80 cm Gravity-fed, intermittent operation | HLRIR: 70 mm/day | [43,44] |
| Quartz sand grain ⌀ = 0.210–0.297 mm Porosity 0.36 | Columns: ⌀ = 5 cm, sand h = 29 cm Upflow continuous mode, HRT 4–35 h | * HLRSUR = 288 L/m2sand·day−1 | [51] |
| Grain ⌀ = 0.7 mm | Columns: ⌀ = 4.4 cm, sand h = 23 cm Gravity-fed, continuous mode | HLRIR: 288 mm/day | [60] |
| Quartz sand grain ⌀ d50 = 1.2 mm | Columns: ⌀ = 10 cm, sand h = 100 cm Gravity-fed, intermittent operation | HLRIR: 16, 41, 83 mm/day T-HCUNSAT = 0.077 mm/s | [46] |
| Fine sand grain ⌀ d50 = 0.3 mm U = 2.8 | Columns: ⌀ NG, sand h = 76 cm Gravity-fed, intermittent operation | HLRSUR = 40 L/m2sand·day−1 | [42] |
| Grain ⌀ = 10 mm (anoxic zone), 5 mm (oxic zone, porosity = 0.43, 0,36, respectively | Column: ⌀ = 10.4 cm, h = 249 cm Upflow partially aerated, HRT 3 h, recirculation rate 200–300% | * HLRSUR = 7200–28,800 L/m2sand·day−1 | [52] |
| Fractionated Dune sand Grain ⌀ d50 = 0.7 mm (0.48–1.1 mm) U = 1.7 | Columns ⌀ = 10.5 cm, sand h = 145 cm Gravity-fed, batch mode | HLRVOL = 2163 L/m3sand·day−1 HLRIR = 4110 mm/day (at high OLR) M-HCSAT = 2.50, 1.15 mm/s (t = 0, 130 days) | [10] |
| Quartz sand grain ⌀ d10 = 0.86 mm U = 1.47 | Columns ⌀ = 5 cm, sand h = 80 cm Gravity-fed, continuous: saturated and anaerobic | HLRIR = 1200 mm/day | [61] |
| Grain ⌀ = 0.93 mm (fine), 2.40 mm (coarse) U = 1.50 (fine) 1.35 (coarse) | Columns ⌀ = 14.5 cm, sand h = 61 cm (46/15 coarse/fine) Gravity-fed, intermittent operation (hourly) | HLRSUR = 264, 132, 66 L/m2·day−1 | [69] |
| U = 1.07 Porosity = 0.494 | Columns ⌀ = 7.6 cm, h = 60 cm Gravity-fed NDP | NDP | [70] |
| Quartz sand grain ⌀ d50 = 0.8 mm (0.6–1.2 mm) U = <2.0 | Columns ⌀ = 12 cm, sand h = 80 cm Gravity-fed, aerated–anoxic in series | HLRSUR = 2000–4000 L/m2.h−1 (for system), * 4.8–9.2 × 10⁴ L/m2sand·day−1 | [71] |
| Fine sand grain ⌀ < 1 mm | Columns ⌀ = 9 cm, sand h = 2, 12, 22 cm Gravity-fed, batch operation (once-off) | HLRIR = 6240, 7440, 9360 mm/day | [59] |
| Grain ⌀ = 0.3 mm (fine), 2.4 mm (coarse) U = 4.0 (fine), 1.3 (coarse) | Columns ⌀ = 14.5 cm, sand h = 61 cm (15/46 coarse/fine) Gravity-fed, intermittent operation (72 times/day) | HLRSUR = 66 L/m2sand·day−1 | [48] |
| Grain ⌀ = d10 = 0.42 mm (fine), 0.8 mm (coarse) d50 (from GSD plot) = 1.0 mm (coarse), 0.65 mm (fine) | Columns ⌀ = 36 cm, sand h = 50 cm Gravity-fed, intermittent operation (1:3 (feed:rest) days) HRT = 5–6 h (fine), 2–3 h (coarse) | HLRSUR = 3400 L/ m2sand·day−1 (during feeding) | [40] |
| Grain d10 = 0.15–0.30 mm, d50 = 0.45–1.18 mm, d60 = 0.60–1.20, U < 4.0, porosity 0.38 | Columns ⌀ = 7.5 cm, sand h = 15 cm Gravity-fed, intermittent operation (every 3 h), HRT= 2.8 days | HLRSUR 20.5 L/m2sand·day−1 | [72] |
| River sand grain ⌀ d10 = 0.41 mm U = 5.85 | Columns ⌀ = 10 cm, sand h = 25 cm Gravity-fed, intermittent operation (1 dose 5–6 h/day) | HLRIR = 134, 204, 269 mm/day | [47] |
| River sand 1 d10 = 0.38 mm, d50 = 0.82 mm River sand 2 d10 = 1.60 mm, d50 = 2.26 mm | Columns ⌀ = 30 cm, sand h = 15, 30, 70 cm Gravity-fed, intermittent operation (8 doses/day every 3 h) HRT (for 70 cm (h) columns) = 12, 35 h | HLRIR = 120, 200 mm/day Sand 1: T-HCSAT 0.825–0.953 mm/s Sand 2: NDP | [29] |
| Quartz sand grain ⌀ = 0.210–0.297 mm Porosity = 0.469 | Column ⌀ = 2.5 cm, sand h = 33 cm Upflow, continuous feeding, HRT = 12 h | HLRSUR 18 L/m2sand·day−1 | [53] |
| Laboratory studies: vertical and horizontal flow and hybrid systems | |||
| Sand characteristics and porosity | Reactor dimensions, operation mode and retention time | Hydraulic loading rates | Ref. |
| Particle ⌀ = 0.25–0.42 mm | HSSF BSR 32 × 13 cm (L × W), sand h = 60 cm | NDP for HSSF | [25] |
| Particle ⌀ = 1.9, 1.6, 65, 0.45 mm (bottom to top) | VF BSR: sand h = 80 cm | NDP | [73] |
| Grain ⌀ = 1.7–2.0 mm (sieved) | VF BSR: ⌀ = 36 cm, sand h = 16 cm HRT = 8, 12, 16, 20 24 h (UASB-BSR) | HLR: NDP | [74] |
| Pilot studies | |||
| Sand characteristics and porosity | Reactor dimensions, operation mode and retention time | Hydraulic loading rates | Ref. |
| River sand grain ⌀ d50 = 3.2 mm, U = 8, Porosity = 0.17 | HSSF bed, L × W DNP, sand h = 110 cm Semi-continuous operation, HRT 1.7 days | HLRIR = 110–130 mm/day | [50] |
| Grain ⌀ d50 (i) 0.35 mm (ii) 0.7 mm (iii) 0.8 mm | HSSF BSR 800 × 150 cm (L × W), sand h = 20–70 cm HRT 4–8 days | NDP | [75] |
| Grain ⌀ = 0–3 mm | VF BSR L × W NG, h = 85 cm Intermittent operation (I h intervals) | HLRSUR = 96 L/m2sand·day−1 | [76] |
| Dune sand 81% quartz, 18% calcite Grain ⌀ d50 = 0.9 mm (0.003–2.2 mm) | VF BSR 1and2: ⌀ = 200 cm (inner chamber = 140 cm) Sand h = 1800 cm (outer chamber = 100 cm) Continuous operation | HLRIR = 206 mm/day 102–208 L/m3sand·day−1 M-HCSAT = 0.140 mm/s (operational) | [16,26] |
| Fine sand grain ⌀ = d10 = 0.17 mm U = 2 | VF BSR: ⌀ = 50 cm, sand h = 65 cm Gravity-fed, intermittent operation (4 times/day) | HLRSUR = 10 ± 2 L/ m2sand·day−1 T-HCSAT = 0.310 mm/s (t = 0) | [62,77] |
| Full-scale studies | |||
| Sand characteristics and porosity | Reactor dimensions, operation mode and retention time | Hydraulic loading rates | Ref. |
| Grain ⌀ d50 = 0.3 mm (fine), 2.4 mm (coarse) U = 4.0 (fine), 1.3 (coarse) | 12× HSSF: 55 × 25 m (L × W), sand h = 60 cm (45/15 fine/coarse) Rotational feed and rest cycles between modules | HLRIR = 60 mm/day 5.11 × 10⁵ L/day inflow for system | [49] |
| Grain ⌀ = 0.25–4.0 mm | HSSF BSR 27.5 × 6.9 m (L × W), sand h = 10–15 cm Gravity-fed during rainfall or irrigation, HRT = 4 days | HLR: DNP | [78] |
* calculated from data provided in manuscript. NDP = no data provided; FS = fine sand; MS = medium sand; CS = coarse sand; UC = uniformity coefficient; HSSF = horizontal subsurface flow; L = length; W = width; ⌀ = diameter; h = height of sand in reactor/column; IR = infiltration rate; HLRSUR = surface hydraulic loading rate; HLRVOL = volumetric hydraulic loading rate; HLRIR = hydraulic loading rate infiltration rate (HLR reported in many studies has been changed to infiltration rate (IR, which is the infiltration velocity) in order to distinguish from HLRsur and HLRvol); T-HCSAT = theoretical saturated hydraulic conductivity; T-HCUNSAT = theoretical unsaturated hydraulic conductivity; M-HCSAT = measured saturated hydraulic conductivity. All units have been converted to the same units for comparative consistency. Where a range of parameters were compared, the operational parameters for the optimal performance results are provided.
In the case of NH3, the hypothesis is that in cold climates, adsorption of NH3 by materials such as zeolite [66] or clinopatilolite [67] in winter may be followed by increased nitrification with the advent of warmer weather going into spring. Studies detailing combined adsorption–biodegradation removal in BSRs are limited, and the subject merits further investigation.
In the case of TSS, these may be adsorbed onto the surface of sand particles or become entrained in the pores of the sand matrix in BSRs. As previously discussed, this is particularly problematic if the solids cannot be mineralized. Many factors influence removal of TSS, including the biodegradability of the materials, the sand characteristics and the HLR and OLR [40]. Many researchers have reported on removal efficiencies (RE) for TSS. The TSS concentrations and RE of primary and secondary wastewater/sewage and septic tank effluent reported in the literature range from 0.039 ± 0.011 g/L (RE 65–100%) in septic tank effluent [29] to 0.21 ± 0.19 g/L (RE 56%) in municipal sewage WW [47], with RE ranging from 56% [29] to 93% (influent TSS 0.086 g/L) in synthetic septic tank effluent [40] (Table 2). The TSS concentrations and RE of industrial WW reported in the literature are typically higher, with concentrations ranging from 0.17–1.5 g/L in turkey processing WW [49] to as much as 1.5 g/L (range: 0.6–2.0 g/L) with 76% RE (range 65–92%) in diluted olive mill WW [8] (Table 3). The number of variables involved in removal of TSS, including the operational parameters, the nature of the solids and the characteristics of the sand, makes it impossible to generically predict removal of TSS in BSFs, as each system is unique.
In contrast to readily biodegradable chemicals, recalcitrant elements that are removed by adsorption can leach from BSRs when finite binding sites become saturated and/or there are changes in redox status and/or pH and/or the biomass degrades [75]. This makes BSRs unsuitable for long-term removal of such chemicals, which includes total phosphorus (TP). Many studies have reported on removal of TP and/or phosphates (PO43-) in BSRs. This may be misguided because P cannot be mineralized and will eventually leach from the systems [5,18,75]. In a pilot study focused on determining P removal from activated sludge effluent in BSRs, researchers obtained maximum removal rates of 9% and found that the P concentration in the treated effluent increased from the influent values in 33% of the samples [79]. At low HLRs, good P removal was obtained from WW from a septic tank (97%), a biofiltration tank (77%) and Polonite filter bag (92%) [75]. However, there was a >99.99% risk of leaching associated with simulated rainfall to the columns and almost all the P eventually leached into the column effluent. A meta-analysis of 329 samples from 10 studies of full-scale on-site BSR WW treatment systems in Finland and Sweden showed that while excellent organic removal rates were obtained, the effluent did not comply with discharge standards for P [1]. A previous meta-study on BSRs in Denmark yielded similar results (23–90% P removal), with good P removal (70–90%) only being found when the sand contained high concentrations of Fe [5]. The principal mechanism for removal of P occurs via binding of P to ferric oxides (FeO), calcium (Ca) or clay particles [80]. Unexpectedly, in a laboratory BSR column study comparing non-coated sand with sand coated with FeO, no significant differences in P removal efficiencies were noted, and the authors proposed that the electrostatic forces between the P and Fe were too weak [47].
In essence, if P removal is important for the type of WW being treated or to comply with discharge requirements, stand-alone BSRs cannot be relied on for consistent and long-term removal. In addition, because P is becoming depleted as a natural resource, recovery of TP from wastewater using physicochemical processes is becoming essential [81]. Pre- or post-coagulation or other means of capturing P for reuse supports a circular economy and has the advantage of rendering the treated effluent suitable for discharge to aquatic environments with minimal risk of eutrophication [62,77,81].
Table 2.
Organic and nitrogenous removal performance of biosand reactors treating primary and secondary wastewater/sewage (real and synthetic) and septic tank effluent.
Table 2.
Organic and nitrogenous removal performance of biosand reactors treating primary and secondary wastewater/sewage (real and synthetic) and septic tank effluent.
| Descriptive Term for BSR Study Type and Working Volume | Wastewater (WW) Time: Run and (Start-Up) | Selected Parameters | Reduction/Outcome | Ref. |
|---|---|---|---|---|
| Intermittent sand filter Laboratory scale (7.9 L) | Settled, filtered municipal WW Duration not provided | Operational HC 0.1, 0.05, 0.02 HC Biofilm ‘clogging’ | Inadequate denitrification at low HC Reduced surface ponding at low HC | [46] |
| Intermittent sand bioreactor Laboratory scale (NG) | Seawater salinity sewage 21 months | TOC: 0.11 ± 0.061 g/L NH4+: 32 (range: 14–63) mg/L | TOC: 94 ± 6% NH4+: 99 ± 2% | [42] |
| Partially aerated biological filter Laboratory (21 L) | Synthetic raw municipal WW NG (60 days) | CODs: 0.30 g/L NH4+: 25 mg/L TN: 35 mg/L | CODs: 96% NH4 +: 96% TN: 75% | [52] |
| Anaerobic biofilter Laboratory (1.6 L) | Municipal WW 70 days (0 days) | CODt: 509 ± 173 g/m3sand·day−1 NH4+: 42 ± 19 mg/L | CODt: 62 ± 12% NH4+: 5% | [61] |
| Biological filter Laboratory (2.7 L) | Synthetic saline sewage WW 7 weeks (0 days) | CODt: 0.65–0.66 g/L NaCl: 0.66–1.49 g/L | COD: >80% | [70] |
| O/A two-stage BSF Laboratory (27 L) | Secondary municipal effluent Duration unclear (0 days) | TN: 22 (range: 20–26) mg/L | TN: <50% | [71] |
| Sand filter Laboratory (NG) | Synthetic septic tank effluent 1 week (0 days) | TSS: 0.086 g/L CODt: 0.46 g/L NH4+: 56 mg/L | TSS: 93% CODt: 97% NH4+: 62% | [40] |
| Sand filter Laboratory (0.65) | Synthetic septic tank effluent 40 days (acclimated sand used) | TN: 138 mg/L @ 0.28 mgN/cm2·day−1 COD/N ratio: 6.2 Alk/NH4+ ratio: 7.1:1 | Complete nitrification in upper 15 cm @ 17.0 gN/m3·day−1 | [72] |
| Slow sand filter Laboratory (2.0 L) | Municipal sewage WW 100 days (0) | TSS: 0.21 ± 0.19 g/L CODt: 0.16 ± 0.11 g/L | TSS: 56% CODt: 56% | [47] |
| Packed bed reactor Laboratory (49 L) | Septic tank effluent 360 days | TSS: 0.039 ± 0.011 g/L CODt: 0.37 ± 0.10 g/L NH4+: 46 ± 21 mg/L | TSS: 65–100% CODt: 81–98% NH4+: 67–100% | [29] |
| Semi-saturated sand bed mesocosm Pilot (2.2 × 10³ L) | Urban pond WW “multi-seasonal” | TSS: 0.12 g/L CODt: 0.29 g/L TN: 39 mg/L | TSS: 81 ± 6% CODt: 82 ± 15% TN: 48 ± 15% | [50] |
Where a range of parameters were tested, only the performance results from the ‘optimal’ reactor are provided in the table. Where necessary, further results are given in the text. In some instances, values have been extrapolated from figures or data provided in the manuscripts. NG = not given; TSS = total suspended solids; CODt = total chemical oxygen demand; CODs = soluble chemical oxygen demand; TOC = total organic carbon; TN = total nitrogen.
3.1.2. Increase in pH of Acidic Wastewater
It has been shown that the pH of acidic WW can be increased in BSRs. For example, the pH of simulated landfill leachate increased from influent to effluent in a BSR, while the effluent from a landfill bioreactor remained acidic [73]. Similarly, Achak et al. [8] found an increase in pH of olive mill WW ranging from 4–6 up to 7–9 in a BSR operated in front of a VF CW. Neither the elemental nor mineralogical composition of the sand was determined in either of these studies, but it was postulated that the consistent increase in electrical conductivity (EC) from influent to effluent (average 5.9–8.7 ms/cm) indicated that carbonates in the sand were mineralized [8]. This was supported by results obtained in a pilot HSSF BSR [7] and a VF BSR [26], where consistent increases in EC and pH were also measured during remediation of acidic winery WW. The major mechanism responsible for the increase in pH was later experimentally verified as being via dissolution of calcite [82,83]. This mineral form of calcium carbonate (CaCO3) constituted 18% of the sand grains, and dissolution did not affect the hydraulic properties of the sand [83]. The theoretical abiotic neutralization capacity of the BSRs treating WW was predicted to be 37 years, which is beyond the projected lifespan of the system. An added advantage of calcite dissolution is that the presence of divalent calcium (Ca2+) in the BSR effluent also protects receiving environments from sodicity from saline WW [26,82].
Microbial mechanisms of pH adjustment have also been seen in BSRs. In a study by Holtman et al. [83], it was found that while calcite dissolution was responsible for 95.5 ± 0.16% of the increase in pH, the remaining 4.5 ± 0.13% was due to biotic mechanisms. Interestingly, complete neutralization of highly acidic synthetic acidic mine drainage (pH 2) was also demonstrated in HSSF BSRs containing river sand with 98% quartz and only 0.1% calcite [9]. In this study, the synthetic acid mine drainage was supplemented with a carbon (C) source for biological sulfate reduction and the authors identified microbial sulfate and iron reduction and precipitation of Fe and S as the main neutralization mechanisms.
3.2. Bioremediation
3.2.1. Selection and Acclimation of Microbial Communities
The composition and function of microbial communities in BSRs are influenced by the type of WW being treated, climatic conditions, the physicochemical properties of the sand and the WW chemistry and redox status of spatial niches within BSR [9,55,84]. Examples of the character of the influent on the microbial composition include the selection of biological sulfate reducing bacteria [9] and diazotrophic bacteria [85,86] in BSRs treating acid mine drainage and high C to nitrogen (N) WW, respectively. In BSRs that are not overloaded, nutrient concentrations and hence microbial biomass typically decrease with depth in VF systems and depth and length in HSSF systems [55,72,87].
It has been recommended that BSRs be allowed to acclimate to the intended WW for around 100 days to allow the functional microbial communities to establish and stabilize before conducting experiments [88]. Applying WW in incremental concentrations during the acclimation phase has also been shown to have a positive effect on BSR performance [89]. However, many researchers do not factor in acclimation times, or they apply acclimation periods that could be considered insufficient (Table 2, Table 3 and Table 4). Of the 31 studies reviewed for bioremediation using BSRs, 10 did not allow any acclimation period. Three studies applied acclimation times that may be considered insufficient (1 = 4–6 days, 1 = 20 days, 1 = 3 weeks), while five applied acclimation periods ≥2 months. Thirteen studies did not report acclimation times, but nine of these were conducted for long periods (≥1 year), so it is unlikely that those results would be skewed due to lack of acclimation.
3.2.2. Bioremediation of Organics and Nitrogenous Compounds
Primary and Secondary Wastewater/Sewage and Septic Tank Effluent
Parameters used to assess nutrient removal performance in BSRs are inconsistent between studies, making inter-study comparisons challenging. Due to the relative simplicity and reproducibility of COD over other analytical methods such as biological oxygen demand (BOD) and total organic carbon (TOC), the former is commonly used as a proxy for determining removal of organics in WW. Of the eleven studies reporting removal performance of BSRs treating sewage-based WW (Table 2), eight reported on COD removal, one reported total organic carbon (TOC) removal and two only focused on nitrogen (N) removal. Nine studies reported on nitrification and/or denitrification.
Total COD (CODt) was the most common parameter used for analyzing organic removal performance, being used in five of the studies. The remaining three analyzed organic removal using either soluble COD (CODs,) COD/N ratio or COD loading (gCOD/m3sand·day−1). The influent CODt values ranged from 0.16 ± 0.11 g/L (RE = 56%) in municipal sewage [47] to 0.66 g/L (RE > 80%) in synthetic saline sewage [70] and high COD RE values were found in most of the studies (Table 2).
Many VF BSRs that have been extensively used to treat domestic WW (sewage and greywater) have a conventional design consisting of gravel at the bottom, coarse sand in the middle and fine sand in the top layer. Most of the degradative processes take place in the top layer, which also controls the passive flow rate, making the lower layers somewhat obsolete [58]. Researchers studied the influence of grain size (Table 1) on CODt RE and nitrification in intermittently fed laboratory columns treating synthetic septic tank effluent [40]. At lower HLRIR (130 mm/day), COD removal efficiencies were similar (87–91%), but at higher HLR (300 mm/day), COD RE was higher in the columns containing the finer grains than in those containing the larger grains because the HRT was insufficient in the latter, a phenomenon already alluded to in Section 2.2. Nitrification was also higher (46–62%) in the columns containing fine sand than in those containing coarse sand (7%), despite lower O2 (9–20%) being measured at 35 cm depth in the former than in the latter (17–21%). This was because the O2 increased again to around 20% during the resting period. However, after the 10th feeding cycle, the O2 in the columns containing fine sand decreased to around 1% at the end of the feeding cycle, suggesting that high nitrification rates may not be sustainable over time in BSRs containing fine sand. This is supported by historical data from full-scale BSRs treating domestic WW in Denmark where nitrification rates were found to be higher in systems containing coarser grains, ostensibly due to superior O2 ingress, and nitrification rates decreased with increases in HLR [5]. Shahraki et al. [72] also demonstrated decreased nitrification efficiency with increased HLR, or when there was insufficient alkalinity. The authors measured O2 partial pressures, not just at one depth, but at 6 cm, 14 cm, 22 cm and 30 cm in columns treating synthetic septic tank effluent with notably lower HLRSUR (20.5 L/m2sand·day−1 [72] vs. 3400 L/m2sand·day−1) [40] and higher HRT of 2.8 days [72] vs. 5–6 h [40] under various N loading rates, alkalinities and HLR. They found O2 concentrations comparable with atmospheric levels at all depths, albeit with a slight drop due to microbial utilization after dosing. At the low HLRSUR applied, complete nitrification at 17.0 gN/m3·day−1 took place in the upper 15 cm.
The presence of both oxic zones (for nitrification) and anoxic zones (for denitrification) is needed to ensure high TN removal rates in BSRs. In gravity-fed systems, denitrification may be promoted by using sand with smaller grain sizes to induce anoxic conditions, but this could then negatively affect nitrification [29]. Sea water is being used in water-stressed countries for toilet flushing [70]. A study reported reduced organic removal performance in BSRs operated when the salinity was increased from 0.065% to 0.265%; however, no replicates were included, and significant differences were not reported [70]. In contrast, high organic RE (94 ± 6%, influent TOC 0.11 ± 0.061 g/L) and nitrification (99 ± 2%, influent NH3 32 mg/L (14–63) mg/L) were achieved in gravity-fed, intermittently operated BSR column experiments with periodic resting and treating seawater salinity sewage with higher salt concentrations (3% NaCl) over a 21-month period [42]. Of concern was that denitrification was poor or non-existent (influent 0.1 ± 0.0 mg/L, effluent 43 ± 17 mg/L) [42]. The authors did not discuss denitrification and performance was not compared with non-saline controls, but denitrification is typically quite poor in small BSRs treating domestic WW. For example, only 30–45% removal of TN was noted in full-scale systems in Denmark [5] and good nitrification but only negligible denitrification were obtained in BSR column experiments containing sand from an operational BSR treating septic tank effluent (Table 2) [72]. In column experiments treating low-strength municipal WW, there was also inefficient nitrate degradation and concentrations 2.9 ± 2.2 mg/L higher were measured in the effluent than in the influent [47]. While denitrification should theoretically be supported by the anoxic environment in the deeper layers of BSRs, this can only take place if there is an adequate supply of electron donors [56]. In some instances, denitrification can be retarded if levels of O2 favor heterotrophic utilization of carbon substrates [54]. If there is sufficient biomass and the OLR is high enough, there should theoretically be sufficient soluble carbon electron donors available in the anoxic layers for denitrification [54], but it appears that this is difficult to achieve. To try and overcome limitations, Li et al. [71] applied a two-stage oxic/anoxic laboratory BSR with two aerated columns for nitrification followed by one anoxic column for denitrification of low-strength (COD average 41 mg/L) secondary municipal effluent at various HLR and C:N ratios for denitrification and did not manage to obtain >50% removal of TN. However, it did not appear that any acclimation phase was included in the study, and further investigations are needed to see if this strategy is a viable option for secondary treatment of higher-strength WW.
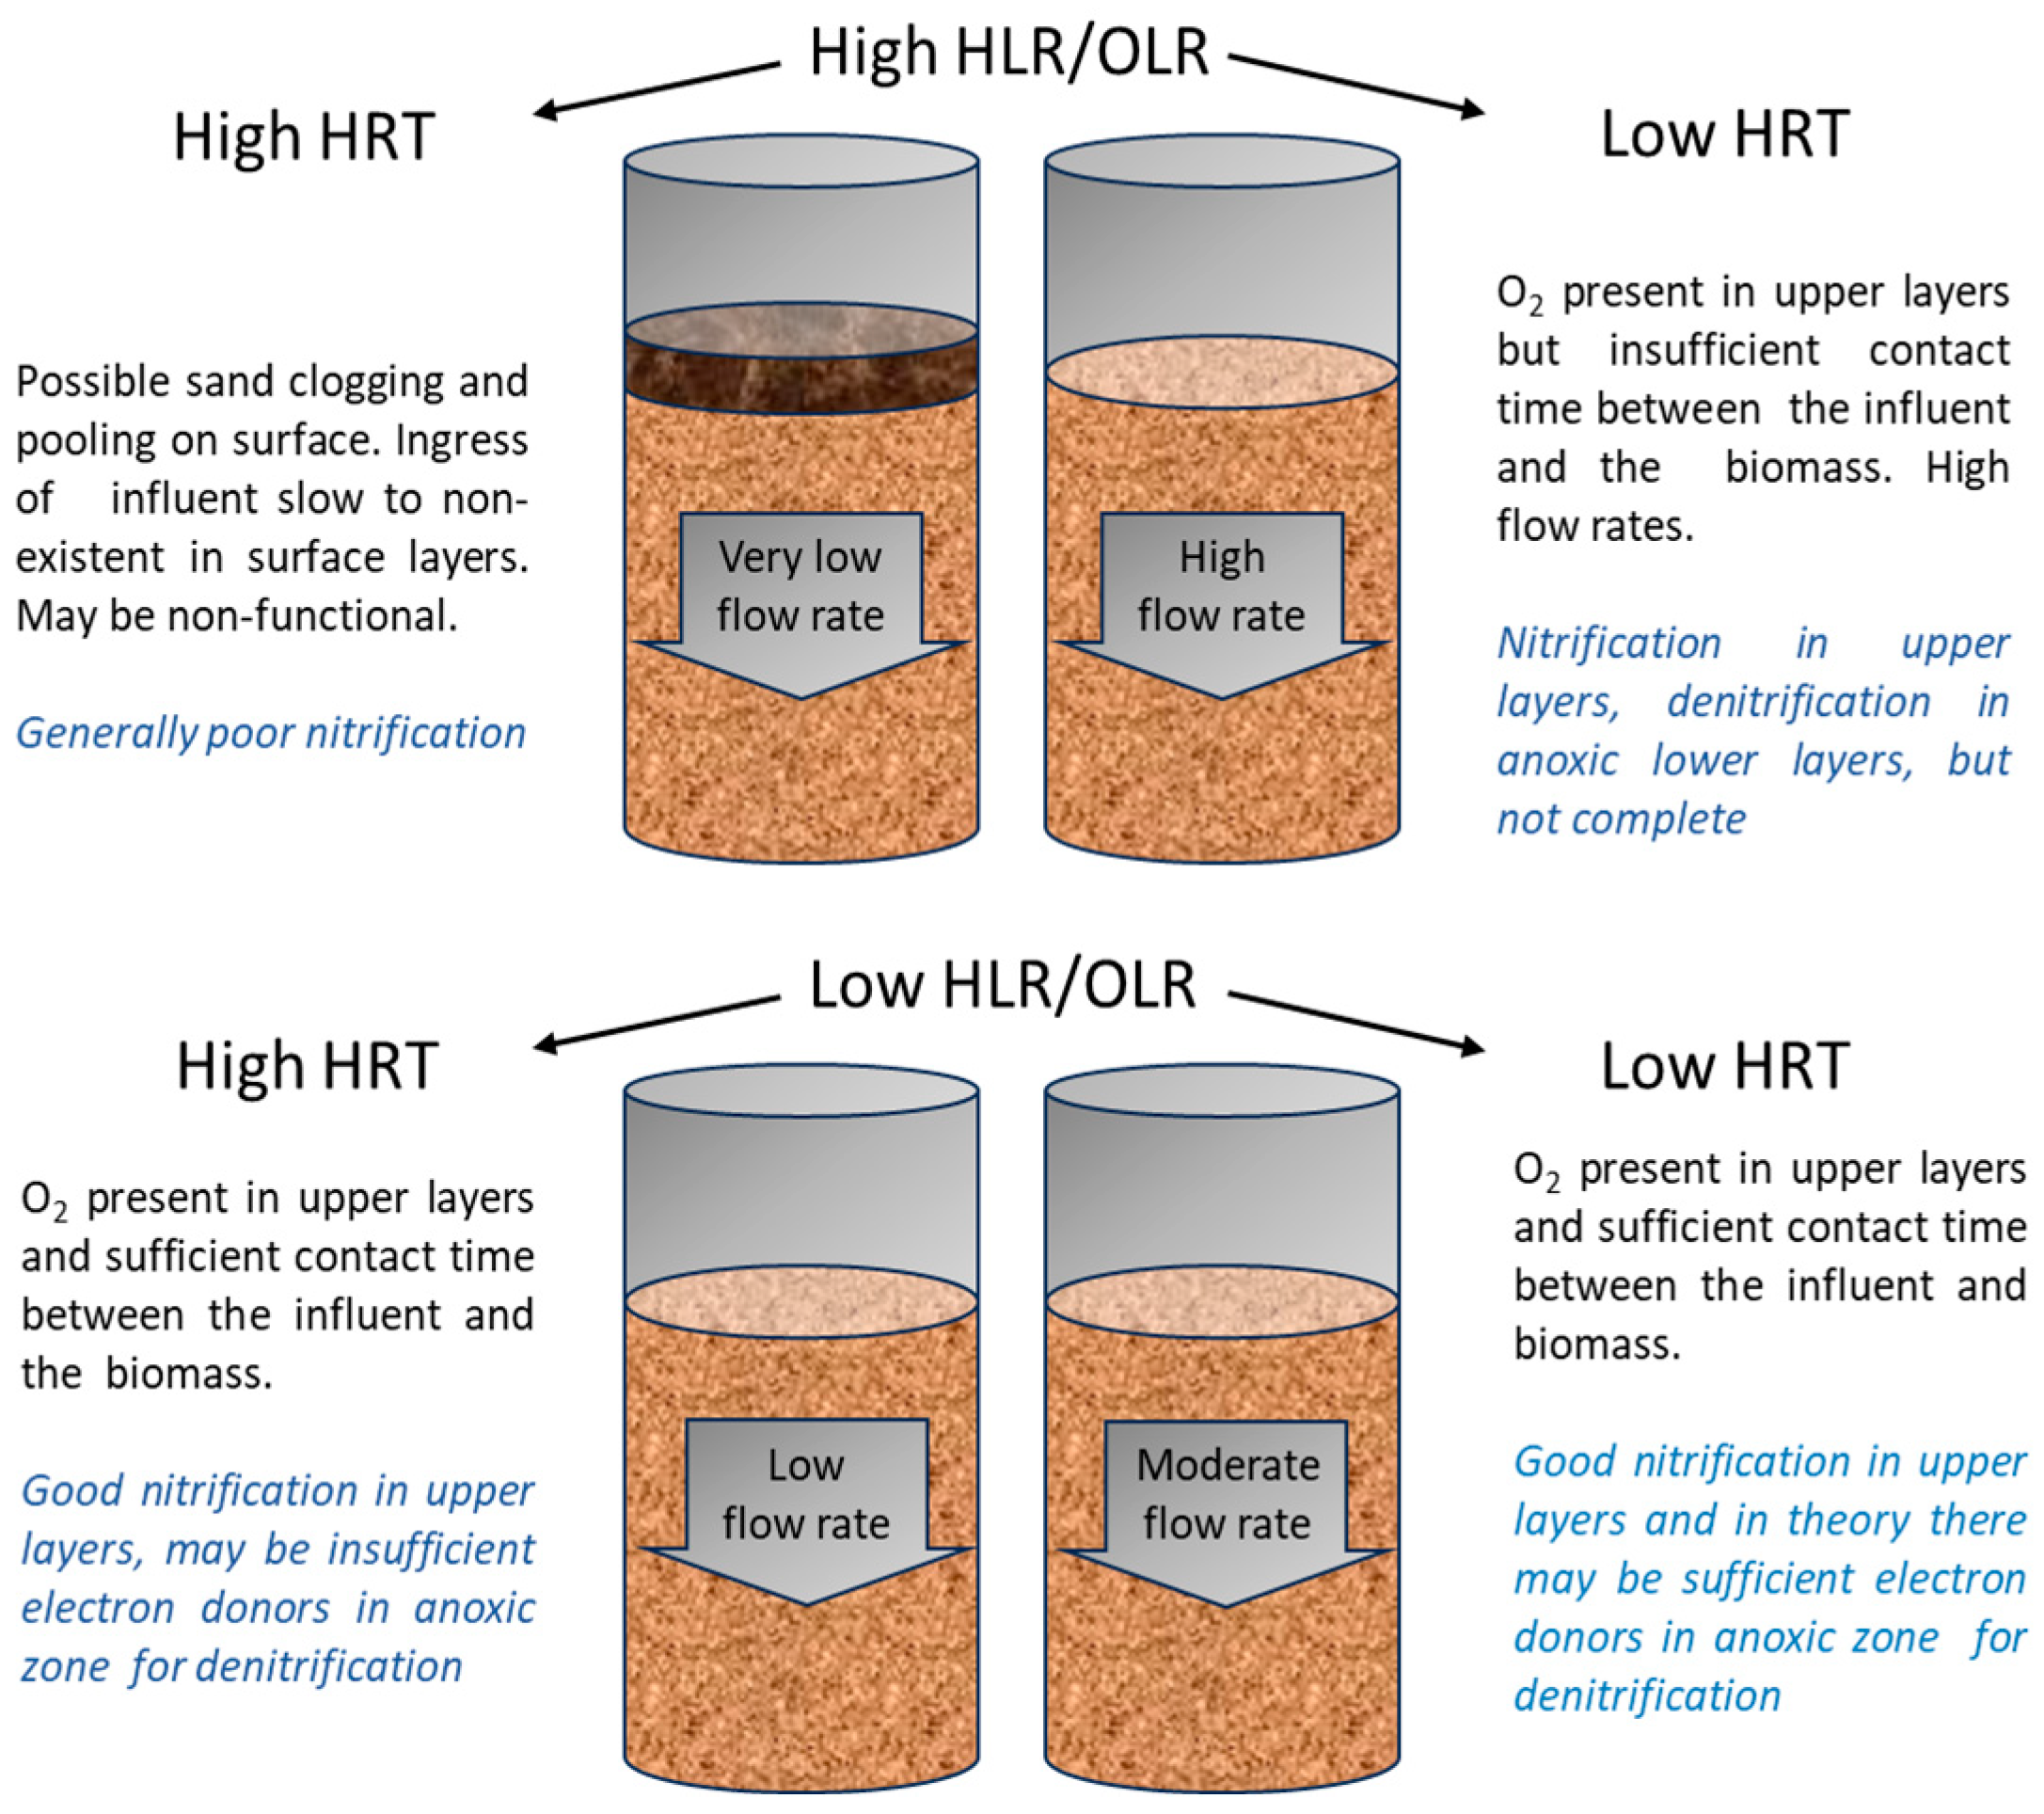
Overall, the study results demonstrate that there is a critical balance in each individual BSR system between the sand that is used, the attainable HRT and other operational parameters such as O2 concentration on the RE of organics, nitrification and denitrification of sewage-based WW. Assuming typical organic loads and C:N ratios, the principles of how the hydraulic function of BSRs may affect nitrification and denitrification in gravity-fed VF BSRs with no flow-retarding mechanism are presented in Figure 2. As described in Section 2, the initial HRT is related to the HC afforded by the characteristics and packing of the sand grains, while after start-up, the HRT increases due to build up of biomass and entrainment of particulates. This typically occurs at higher rates in systems with high OLR/HLR. The HRT can therefore be manipulated to some extent by applying different HLR in systems with higher HC.
Industrial Wastewater
Biosand reactors are slowly gaining traction as passive systems for remediation of industrial and agri-industrial wastewater. Laboratory column experiments, pilot and full-scale studies have been conducted (Table 3). In the reviewed studies, the organic loads in olive mill WW [8], winery WW [10,16], turkey processing WW [48,49,69], dairy wastewater [62,77] and synthetic landfill leachate [73] were considerably higher (Table 3) than those in sewage-based WW (Table 2). Long-term pilot studies yielded good organic removal rates over extended periods: 70% RE removal from winery WW (OLR: 279 gCODt.m3sand·day−1) over 2 years [26], 98% RE from dairy WW (OLR: CODt: 110 ± 10 g/m2·day−1) over 301 days [62,77] and 88% RE from synthetic landfill leachate (influent CODt: 32 g/L) over 18 months [73]. In addition, the BOD5 in the effluent of a full-scale BSR treating turkey processing WW was reduced to <0.010 g/L (influent 0.57–2.0 g/L) over 2.5 years [49]. The high fat content of turkey processing WW can negatively affect secondary WW treatment systems, but good removal of fats, oil and grease (FOG) was obtained in full-scale BSRs [49] (Table 3). Overall, the study results indicate that BSRs are sustainable and effective options for remediation of certain types of organic-rich industrial WW. Research on other types of WW, including agri-industrial and food industry WW, is merited.
In addition to organic RE, the RE of other constituents relevant to the type of industrial WW has been determined. For example, good RE of potentially phytotoxic total (poly)phenolics (TPP) in olive mill and winery WW was obtained: 92% (influent 7.5 g/L (range: 6.0–8.2 g/L)) [8] and 75% (influent 40 mgGAE/L) [26], respectively, and 99.9% removal of fish pathogens (Pseudomonas fluorescens, Aeromonas hydrophila, Aeromonas salmonicida subsp. Salmonicida and Yersinia ruckeri) from fish farm WW [43,44].
The optimal operation and performance of BSRs treating industrial WW can differ considerably from those treating sewage-based WW and other industrial WW in different climates. For example, ion exchange was added to counter the reduction in nitrification during cold winters in BSRs treating turkey processing WW to comply with the 30-day discharge limit of 3 mg/L in Ohio, USA [49]. Contrary to treatment of sewage-based WW, higher winery WW COD loading rates were achieved with similar RE in VF BSRs operated in continuous mode when compared to intermittent (pulse) mode (Table 3) [26]. In the case of high-C:N wastewater, it has been shown that nitrogen-fixing bacterial species are selected over time, and that this natural nutrient balancing stimulates bioremediation of winery WW [86]. This nutrient self-regulation capability of BSRs may be relevant to other high-C:N wastewater types, and is an advantage advocating the use of BSRs over other secondary WW treatment systems.
Table 3.
Organic and nitrogenous removal performance of biosand reactors treating industrial wastewater.
Table 3.
Organic and nitrogenous removal performance of biosand reactors treating industrial wastewater.
| Laboratory Studies: Column Experiments | ||||
| Descriptive Term for BSR Study Type and Working Volume | Wastewater Time: Run and (Start-Up) | Selected Parameters | Reduction/Outcome | Ref. |
| Sand filter Laboratory scale (1.18 × 10² L) | Diluted (50%) olive mill WW 1 year (NG) | TSS: 1.5 (range: 0.6–2.0) g/L CODt: 28.0 (range: 25.6–30.8) g/L CODs: 20.7 (range: 17.0–24.3) g/L TPP: 7.5 (range: 6.0–8.2) g/L | TSS: 76% (range: 65–92%) CODt: 78% (range: 68–90%) CODt: 75% (range: 59–92%) TPP: 92% (range: 85–95%) | [8] |
| Sand intermittent filter Laboratory scale (9.8 L) | Mixed industrial WW NG (4–6 days) | TSS: 0.31 ± 0.09 g/L CODt: 0.32 ± 0.09 g/L | TSS: 67% CODt: 39% | [68] |
| Biological sand filer Laboratory scale (18 L) | Fish farm WW 24 days (10 weeks) | NH4+: 0.27 ± 0.16 mg/L | Fish pathogens: 99.9% | [43,44] |
| Biosand reactor Laboratory (1.3 × 10² L) | Winery wastewater 133 days (3 weeks, inoculated) | COD: 4326 g/m3sand·day−1 | COD: 95% | [10] |
| Coarse/fine sand filter Laboratory (10.1 L) | 40% Turkey processing WW 81 days (0 days) | CODt: 548 ± 314 g/m3sand·day−1 CODt: 274 ± 157 g/m3sand·day−1 CODt: 137 ± 78 g/m3sand·day−1 | TOC: 70% (overloaded) TOC: 77% (overloaded) TOC: >97% | [69] |
| Sand bioreactors Laboratory (10.1 L) | Turkey processing WW 784 days | CODt: 0.84–3.9 g/L BOD5: 0.46–2.26 g/L | CODt: >95% BOD5: >99% | [48] |
| Pilot and full-scale studies | ||||
| Descriptive term for BSR Study type and working volume | Wastewater (WW) Time: Run and (start-up) | Selected parameters | Reduction/outcome | Ref. |
| Biosand reactor Pilot (4.4 × 10³ L) | Winery WW 2 yrs (3 months) | Continuous: 279 gCODt.m3sand·day−1 Intermittent: 179 gCODt. m3sand·day−1 TPP: 40 mgGAE/L | COD: 70% COD: 70% TPP: 75% | [26] |
| Conventional intermittent sand filter Pilot (1.3 × 10² L) | Dairy WW 301 days | TSS: 1.80 g/L CODt: 110 ± 10 g/m2·day−1 | TSS: 97% CODt: 98% | [62,77] |
| Sand channel Laboratory (NG) | Synthetic landfill leachate 18 months | CODt: 32.0 g/L NH4+: 1435 mg/L | CODt: 88% NH4+: accumulation | [73] |
| Slow sand filter Laboratory (16.2 L) | Pulp and paper mill UASB effluent 6 weeks (0 days) | BOD, CODt, TSS, SO42- (Influent to BSR: values NG) | Hybrid UASB-BSR increased removal in comparison to UASB alone | [74] |
| Sand bioreactor Full-scale (8.3 × 10⁷ L) × 12 units | Turkey processing WW 2.5 yrs | BOD5: 0.57–2.0 g/L TSS: 0.17–1.5 g/L FOG: 42–374 mg/L NH4+: 18–44 mg/L | Effluent BOD5: < 0.010 g/L Effluent TSS: < 0.015 g/L Effluent FOG: 5 mg/L Effluent NH4+: 0–3.8 mg/L | [49] |
Where a range of parameters were tested, only the performance results from the ‘optimal’ reactor are provided in the table. Where necessary, further results are given in the text. In some instances, values have been extrapolated from figures or data provided in the manuscripts. NG = not given; WW = wastewater; TSS = total suspended solids; CODt = total chemical oxygen demand; CODs = soluble chemical oxygen demand; TPP = total (poly)phenolics; TOC = total organic carbon; TN = total nitrogen; BOD = biological oxygen demand; FOG = fats, oil and grease; UASB = upflow anaerobic sludge blanket.
3.2.3. Removal of Fecal Indicator Organisms, Antibiotic-Resistant Bacteria and Micropollutants
It has been shown that BSRs can effectively reduce the number of fecal indicator organisms (Escherichia coli, coliforms), other enteric pathogens and micropollutants in sewage-based WW (Table 4). The RE of bacteria and micropollutants may be comparable with CW/TWs because researchers have found that plants have no significant effect on RE of E. coli in a variety of planted and unplanted VF and HSSF systems [76] and addition of root exudates does not improve the RE of micropollutants [60]. Good removal of bacteria resistant to sulfamethoxazole, tetracycline and erythromycin as well as the genes encoding for resistance to these antibiotics has been achieved in BSRs [90]. Notably, in this study, the authors determined that the removal mechanisms were a combination of entrainment and biodegradation. Based on the results obtained from a predictive model validated with historical literature data for VF BSRs with different sand grain ⌀, HLRIR, depths and periods of resting, Sadiq et al. [45] cautioned that effluent from BSRs may not comply with standards for irrigation or groundwater recharge in terms of E. coli and fecal coliforms. They found that the risk of exceeding a fecal coliform standard of ≥100 most probable number/100 mL was approximately 50% at a 95% confidence level, and that the effluent would require tertiary disinfection for unrestricted agricultural use in Saudi Arabia. In a comprehensive array of laboratory, modelling and field experiments using fine, medium and coarse sand, residual heterotrophic bacteria were present in the treated septic tank effluent, albeit with a 1–2.5 log reduction in the heterotrophic bacterial count [90].
As with nutrient RE, it may be expected that the RE of enteric bacteria will be positively correlated with HRT, and that this is incumbent on the height of VF BSRs and the HC of the sand employed, as discussed in preceding sections of this review. This premise has been experimentally validated. In one such study, municipal sewage WW treated in VF BSRs only complied with WHO and US-EPA discharge guidelines for total and fecal coliforms when the height of sand was increased to 22 cm [59]. Although this study was short-term (30 days) and conducted with no acclimation period, the results are supported by additional research. A more in-depth study reported the removal rates of E. coli and MS2 virus in BSRs with different heights (13.2 cm and 54.5 cm) and containing sand with different average grain ⌀. Only a low HLRIR (0.2 mm/h) could be achieved in the 13.2 cm columns containing fine sand. This was 4.5-fold less than the HLRIR in the 54.5 cm columns containing coarse sand. Despite the difference in height, the HRT in the former was significantly higher and translated into higher RE of both E. coli (99.5% compared with 62.8%) and MS2 virus (73.9% compared with 27.6%) [58].
Remediation in BSRs has been proposed as a polishing step for the removal/reduction in micropollutants from domestic WW [53]. Removal efficiencies have been quite comprehensively studied, with different results being found for different chemicals. The micropollutant concentrations in the effluent of upflow BSRs operated in continuous mode were measured [51] and the highest REs were achieved at the highest HRT (range: 4–35 h) at a HLRSUR of 288 L/m2sand·day−1 (Table 1). Under these operational conditions, the REs of diclofenac, propranolol, iopromide, iohexol and iomeprol were 41%, 94%, 58% and 57%, respectively. When comparing the rates of degradation of micropollutants in pre-settled raw municipal WW spiked with pharmaceutical standards, Nord and Bester [91] recommended an HRT of 10–30 h for 90% removal of pharmaceuticals. The authors found that increases in OLR either increased (e.g., β-blockers metoprolol, propranolol and atenolol), decreased (e.g., iohexol) or had no effect (e.g., sulfamethizole, sulfamethoxazole, trimethoprim, iomeprol and carbamazepinerate) on the degradation rate. In contrast, the results of another study suggest that removal of some micropollutants may not be HRT-dependent, as found with tebuconazole (59% RE) and propiconazole (21% RE) [51]. Lastly, the effects of oxygenation and acetate addition (as a carbon source to stimulate microbial growth and activity) on the degradation of micropollutants in BSRs have been investigated [53]. Three different responses were noted; degradation of atenolol and iohexol was initially enhanced by the addition of acetate, while metoprolol, iomeprol, diclofenac, propranolol and sulfamethizole were aerobically degraded and inhibited at acetate C concentrations >60 mg/L, and sulfadiazine, sulfamethoxazole and trimethoprim were removed independently of O2 and acetate addition. Notably, carbamazepine, ditriazoic acid, iopromide, tramadol and venlavaxine were not removed.
4. Conclusions
Biosand reactors are simple, passive systems that have low capex and maintenance costs, do not require skilled operation and can adapt to variations in WW quality. They are well-suited to the intermittent flows of household sewage and seasonal agri-industrial WW and do not require lengthy start-up periods after being inactive. Provided the intrinsic HC of the chosen sand is high enough to allow reasonable achievable flow rates after the necessary accumulation of functional biomass, and the systems are not extensively used to remove recalcitrant particulates via entrainment, BSRs can operate effectively for many years with minimal intervention. With the application of optimized OLR/HLR and HRT for each system and WW type, excellent nitrification and organic RE can be achieved. Based on laboratory studies, the systems have also been proposed for tertiary treatment of WW for removal of various micropollutants and have shown effective reduction in ARB, ARG and some microbial pathogens in pilot or full-scale systems. However, denitrification rates may be insufficient to attain complete N removal and further research is required to mitigate against the presence of nitrates in BSR effluent. In addition, P removal rates can fluctuate, and because P is removed via adsorption only, it can leach into the effluent at any point. The systems are therefore not recommended when consistent P removal from WW is required, for instance, when the effluent is discharged into sensitive aquatic environments. The addition of ancillary processes to recapture this limited nutrient is an option that merits further investigation.
Table 4.
Removal of pathogens, antibiotic-resistant bacteria, micropollutants and pharmaceuticals.
| Descriptive Term for BSR Study Type and Working Volume | Wastewater (WW) Time: Run and (Start-Up) | Selected Parameters | Reduction/Outcome | Reference |
|---|---|---|---|---|
| Biofilm reactor/slow sand filter Laboratory scale (0.14 L) | Final municipal WW effluent 1 month (3 months) | Recalcitrant micropollutants | Micropollutants: 21–85% | [51] |
| Slow sand filter Laboratory scale (0.35 L) | Final municipal WW effluent 14 days (3 months) | Recalcitrant micropollutants | Root exudate addition: no effect | [60] |
| Biosand filter Laboratory (1.3 L) | Municipal sewage 30 days (0 days) | Total and fecal coliforms: 2.56–3.04 × 10⁸ CFU/mL | Total and fecal coliforms: 99% | [59] |
| Slow sand filter Laboratory (2.0 L) | Municipal sewage WW 100 days (0) | Total/fecal coliforms (MPN/100 mL) | Total/fecal coliforms: (90/99%) | [47] |
| Slow sand filter Laboratory (25 L) | Rough filtered municipal WW 20 days (20 days) | Total coliforms | Max 99% removal | [25] |
| Laboratory columns | Secondary municipal effluent Time = unclear | 27 pharmaceuticals | Acetate improved degradation of some chemicals | [53] |
| Lateral flow sand filter Pilot (NG) | Septic tank effluent Operational since 2004 | Antibiotic-resistance genes (ARG) Antibiotic-resistant bacteria (ARB) | 2.2–5.5 log10 reduction, but ARG and ARB still present in effluent | [90] |
| Subsurface flow ecotechnologies Pilot (various) | Domestic sewage 16 months | Escherichia coli | 1.5–2.1 log10 reduction, Effluent 4.5 × 10⁴ to 1.7 × 10⁵ MPN/100 mL | [76] |
| Horizontal slow sand filter Full-scale (2.3 × 10⁷ L) | Horticulture leachate 15 yr operation, snapshot study | Fusarium oxysporum f.sp. lycopersici propagules | 99.9% | [78] |
MPN = most probable; CFU = colony forming units; ARG = antibiotic-resistance genes; ARB = antibiotic-resistant bacteria.
Funding
This research received no external funding.
Data Availability Statement
Not applicable.
Conflicts of Interest
The author declares no conflicts of interest.
Abbreviations
Biosand reactor (BSR), constructed wetland (CW), diameter (⌀), horizontal subsurface flow (HSSF), hydraulic conductivity (HC), hydraulic infiltration rate (HLRIR), measured saturated hydraulic conductivity (M-HCSAT), treatment wetland (TW), saturated HC (HCSAT), surface hydraulic loading rate (HLRSUR), theoretical saturated hydraulic conductivity (T-HCSAT), theoretical unsaturated hydraulic conductivity (T-HCUNSAT), removal efficiency (RE), uniformity coefficient (U), vertical flow (VF), volumetric hydraulic loading rate (HLRVOL), wastewater (WW)
References
- Kinnunen, J.; Rossi, P.M.; Herrmann, I.; Ronkanen, A.-K.; Heiderscheidt, E. Factors affecting effluent quality in on-site wastewater treatment systems in the cold climates on Finland and Sweden. J. Clean. Prod. 2023, 404, 136756. [Google Scholar] [CrossRef]
- Ahammed, M.M.; Davra, K. Performance evaluation of biosand filter modified with iron oxide-coated sand for household treatment of drinking water. Desalination 2011, 276, 287–293. [Google Scholar] [CrossRef]
- Aiken, B.A.; Stauber, C.E.; Ortiz, G.M.; Sobsey, M.D. An Assessment of Continued Use and Health Impact of the Concrete Biosand Filter in Bonao, Dominican Republic. Am. J. Trop. Med. Hyg. 2011, 85, 309–317. [Google Scholar] [CrossRef]
- Arnold, N.; Archer, A.; Barkdoll, B. Bacterial adaptation and performance of household biosand water filters in differing temperatures. Water Sci. Technol. 2016, 16, 794–801. [Google Scholar] [CrossRef]
- Nielsen, J.; Lynggaard-Jensen, A.; Hasling, A. Purification efficiency of Danish biological sand filter systems. Water Sci. Technol. 1993, 28, 89097. [Google Scholar] [CrossRef]
- Christen, E.W.; Quayle, W.C.; Marcoux, M.A.; Arienzo, M.; Jayawardane, N.S. Winery wastewater treatment using the land filter technique. J. Environ. Manag. 2010, 91, 1665–1673. [Google Scholar] [CrossRef] [PubMed]
- Holtman, G.A.; Haldenwang, R.; Welz, P.J. Biological sand filter system treating winery effluent for effective reduction in organic load and pH neutralization. J. Water Process Eng. 2018, 25, 118–127. [Google Scholar] [CrossRef]
- Achak, M.; Boumya, W.; Elamraoui, S.; Asdiou, N.; Taoufik, N.; Barka, N.; Aboulkas, A.; Lamy, E. Performance of olive mill wastewater treatment using hybrid system combining sand filtration and vertical flow constructed wetlands. J. Water Process Eng. 2023, 53, 103737. [Google Scholar] [CrossRef]
- Ramond, J.-B.; Welz, P.J.; Le Roes-Hill, M.; Tuffin, M.I.; Burton, S.G.; Cowan, D.A. Selection of Clostridium spp. In Biological Sand Filters Neutralizing Synthetic Acid Mine Drainage. FEMS Microbiol. Ecol. 2014, 87, 678–690. [Google Scholar] [CrossRef]
- Holtman, G.A.; Haldenwang, R.; Welz, P.J. Biosand reactors for remediation of winery effluent in support of a circular economy and the positive effect of sand fractionation on hydraulic and operational performance. J. Water Process Eng. 2023, 53, 103849. [Google Scholar] [CrossRef]
- Cation Ratio of Soil Structural Stability (CROSS). In Proceedings of the 19th World Congress of Soil Science 2010, Brisbane, Australia, 1–6 August 2010; Marchuk, A.G.; Rengasamy, P. (Eds.) CSIRO Publishing: Clayton, VIC, Australia, 2010. [Google Scholar]
- Lai, X.; Zhao, Y.; Pan, F.; Yang, B.; Wang, H.; Wang, S.; He, F. Enhanced optimal removal of nitrogen and organics from intermittently aerated vertical flow constructed wetlands: Relative COD/N ratios and microbial responses. Chemosphere 2020, 244, 125556. [Google Scholar] [CrossRef] [PubMed]
- Polubesova, T.; Eldad, S.; Chefetz, B. Adsorption and oxidative transformation of phenolic acids by Fe (III)-montmorillonite. Environ. Sci. Technol. 2010, 44, 4203–4209. [Google Scholar] [CrossRef] [PubMed]
- Welz, P.; Ramond, J.-B.; Cowan, D.; Burton, S. Phenolic removal processes in biological sand filters, sand columns and microcosms. Bioresour. Technol. 2012, 119, 262–269. [Google Scholar] [CrossRef] [PubMed]
- Al-Amshawee, S.K.A.; Yunus, M.Y.B.M.; Alalwan, H.A.; Lee, W.H.; Dai, F. Experimental investigation of biofilm carrier of varying shapes, sizes, and materials for wastewater treatment in fixed bed biofilm reactor: A qualitative study of biocarrier performance. J. Chem. Technol. Bioechnol. 2021, 97, 2592–2606. [Google Scholar] [CrossRef]
- Welz, P.J.; Mbasha, W.; Smith, I.; Holtman, G.; Terblanche, G.; Le Roes-Hill, M. The influence of grain physicochemistry and biomass on hydraulic conductivity in sand-filled treatment wetlands. Ecol. Eng. 2018, 116, 21–30. [Google Scholar] [CrossRef]
- Bello, M.M.; Raman, A.A.A.; Purushothaman, M. Applications of fluidized bed reactors in wastewater treatment – A review of the major design and operational parameters. J. Clean. Prod. 2017, 141, 1492–1514. [Google Scholar] [CrossRef]
- Mader, A.E.; Holtman, G.A.; Welz, P.J. Treatment wetlands and phyto-technologies for remediation of winery effluent: Challenges and opportunities. Sci. Total Environ. 2022, 807, 150544. [Google Scholar] [CrossRef]
- Kulshreshtha, N.M.; Verma, V.; Soti, A.; Brighu, U.; Gupta, A.B. Exploring the contribution of plant species in the performance of constructed wetlands for domestic wastewater treatment. Bioresour. Technol. Rep. 2022, 18, 101038. [Google Scholar] [CrossRef]
- Jesus, J.M.; Danko, A.S.; Fiúza, A.; Borges, M.-T. Effect of plants in constructed wetlands for organic and nutrient removal: A review of experimental factors contributing to higher impact and suggestions for future guidelines. Environ. Sci. Pollut. Res. 2018, 25, 4149–4164. [Google Scholar] [CrossRef]
- Manios, T.; Stentiford, E.I.; Millner, P. Removal of total suspended solids from wastewater in constructed horizontal flow subsurface wetlands. J. Environ. Sci. Health Part A Toxic/Hazard. Subst. Environ. Eng. 2003, 38, 1073–1085. [Google Scholar] [CrossRef]
- Nivala, J.; Knowles, P.; Dotro, G.; García, J.; Wallace, S. Clogging in subsurface-flow treatment wetlands: Measurement, modeling and management. Water Res. 2012, 46, 1625–1640. [Google Scholar] [CrossRef]
- Min, J.-H.; Wise, W.R. Simulating short-circuiting flow in a constructed wetland: The implications of bathymetry and vegetation effects. Hydrol. Process. 2009, 23, 830–841. [Google Scholar] [CrossRef]
- Fitriani, N.; Mohamed, R.M.S.R.; Affandi, M.; Nurdin, R.R.; Kurniawan, S.B.; Ni’matusahroh. Performance of intermittent show sand filter processing units in treating food court wastewater. J. Ecol. Eng. 2023, 24, 117–139. [Google Scholar] [CrossRef]
- Fitriani, N.; Ni’matusahroh O’Marga, T.T.N.; Mohamed, R.M.S.R.; Wahyudianto, F.E.; Imron, M.F.; Isnadina, D.R.M.; Soedjono, E.S. Optimization of slow sand filtation for the raw municipal wastewater treatment by using the bold cockle (Anadara granosa) shell as an alternative filter media through response surface methodology. J. Ecol. Eng. 2022, 23, 100–111. [Google Scholar] [CrossRef] [PubMed]
- Holtman, G.A.; Haldenwang, R.; Welz, P.J. Comparison of continuous and pulse mode of operation of pilot biosand reactors treating winery effluent. Ecol. Eng. 2022, 182, 106706. [Google Scholar] [CrossRef]
- Cho, G.-C.; Dodds, J.; Carlos Santamarina, J. Particle shape effects on packing density, stiffness and strength: Natural and crushed sands. J. Geotech. Geoenviron. Eng. 2006, 132, 591–602. [Google Scholar] [CrossRef]
- Salarashayeri, A.F.; Siosemarde, M. Prediction of soil hydraulic conductivity from particle-size distribution. Int. J. Geol. Environ. Eng. 2012, 61, 454–458. [Google Scholar]
- Wang, C.; Bourven, I.; Lakel, A.; Baudu, M. Comparison of wastewater treatment efficiencies in packed bed bioreactors according to the nature of materials. J. Water Process Eng. 2019, 29, 100790. [Google Scholar] [CrossRef]
- Liénard, H.; Guellaf, H.; Boutin, S. Choice of sand for sand filters used for secondary treatment of wastewater. Water Sci. Technol. 2001, 44, 189–196. [Google Scholar] [CrossRef]
- Cardoso, R. Porosity and tortuosity influence on geophysical properties of an artificially cemented sand. Eng. Geol. 2016, 211, 198–207. [Google Scholar] [CrossRef]
- Zheng, W.; Hu, X.; Tannant, D.D.; Zhou, B. Quantifying the influence of grain morphology on sand hydraulic conductivity: A detailed pore-scale study. Comput. Geotech. 2021, 135, 104147. [Google Scholar] [CrossRef]
- Jarrar, Z.A.; Al-Raoush, R.I.; Hannun, J.A.; Alshibli, K.A. New model for estimating geometric tortuosity of variably saturated porous media using 3D synchrotron microcomputed tomographs imaging. Soil Phys. Hydrol. 2021, 85, 1867–1879. [Google Scholar] [CrossRef]
- Bruch, I.; Alewell, U.; Hahn, A.; Hasselbach, R.; Alewell, C. Influence of soil physical parameters on removal efficiency and hydraulic conductivity of vertical flow constructed wetlands. Ecol. Eng. 2014, 68, 124–132. [Google Scholar] [CrossRef]
- Pedescoll, A.; Uggetti, E.; Llorens, E.; Granés, F.; García, D.; García, J. Practical method based on saturated hydraulic conductivity to assess clogging in subsurface flow constructed wetlands. Ecol. Eng. 2009, 35, 1216–1224. [Google Scholar] [CrossRef]
- Little, L.; Becker, M.; Wiese, J.; Mainza, N. Auto-SEM particle shape characterisation: Investigating fine grinding of UG2 ore. Miner. Eng. 2015, 82, 92–100. [Google Scholar] [CrossRef]
- Morin, R.H. Negative correlation between porosity and hydraulic conductivity in sand and gravel aquifers at Cape Cod, Massachusetts, USA. J. Hydrol. 2006, 316, 43–52. [Google Scholar] [CrossRef]
- Narsilio, G.A.; Yun, T.S.; Kress, J.; Evans, T.M. Hydraulic and thermal conduction phenomena in soils at the particle-scale: Towards realistic FEM simulations. Mater. Sci. Eng. 2010, 10, 012086. [Google Scholar] [CrossRef]
- Urumović, K.; Urumović Sr, K. The effective porosity and grain size relations in permeability functions. Hydrol. Earth Syst. Sci. 2014, 11, 6675–6714. [Google Scholar] [CrossRef]
- Rolland, L.; Molle, P.; Liénard, A.; Bouteldja, F.; Grasmik, A. Influence of the physical and mechanical characteristics of sands on the hydraulic and biological behaviors of sand filters. Desalination 2009, 248, 998–1007. [Google Scholar] [CrossRef]
- Monkul, M.M.; Etaminan, E.; Senol, A. Influence of coefficient of uniformity and base sand gradation on static liquefaction of loose sands with silt. Soil Dyn. Earthq. Eng. 2016, 89, 185–197. [Google Scholar] [CrossRef]
- Conroy, K.M.; Mancl, K.M. Treatment of seawater salinity sewage with intermittent sand bioreactors. Water Sci. Technol. 2021, 84, 10–11. [Google Scholar] [CrossRef]
- Bomo, A.-M.; Husby, A.; Stevil, T.K.; Hanssen, J.F. Removal of fish pathogenic bacterial in biological sand filters. Water Res. 2003, 37, 2618–2626. [Google Scholar] [CrossRef]
- Bomo, A.-M.; Ekeberg, D.; Stevik, T.K.; Hanssen, J.F.; Frostegård, Å. Retention and removal of the fish pathogenic bacterium Yersinia ruckeri in biological sand filters. J. Appl. Microbiol. 2004, 97, 598–608. [Google Scholar] [CrossRef]
- Sadiq, R.; Husain, T.; Al-Zahrani, A.M.; Sheikh, A.K.; Faroq, S. Secondary effluent treatment by slow sand filters: Performance and risk analysis. Water Air Soil Pollut. 2003, 143, 41–63. [Google Scholar] [CrossRef]
- Chen, S.; Dougherty, M.; Chen, Z.; Zuo, X.; He, J. Managing biofilm growth and clogging to promote sustainability in an intermittent sand filter (ISF). Sci. Total Environ. 2021, 755, 142477. [Google Scholar] [CrossRef]
- Verma, S.; Daverey, A.; Sharma, A. Wastewater treatment by slow sand filters using uncoated and iron-coated fine sand: Impact of hydraulic loading rate and media depth. Environ. Sci. Pollut. Res. 2019, 26, 34148–34156. [Google Scholar] [CrossRef]
- Guar, R.S.; Mancl, K.M.; Tuovinen, O.H. Treatment of turkey processing wastewater using sand and textile bioreactors. Appl. Eng. Agric. 2015, 31, 605–609. [Google Scholar] [CrossRef]
- Mancl, K.M.; Kopp, R.; Tuovinen, O.H. Treatment of meat-processing wastewater with a full-scale, low- cost sand/gravel bioreactor system. Appl. Eng. Agric. 2018, 34, 403–409. [Google Scholar] [CrossRef]
- Ennabili, A.; Cadelli, D. Semi-saturated sand and pebble beds use in secondary treatment of urban wastewater. Int. J. Environ. Res. 2023, 17, 15. [Google Scholar] [CrossRef]
- Casas, M.E.; Bester, K. Can Those Organic Micro-Pollutants That are Recalcitrant in Activated Sludge Treatment be Removed from Wastewater by Biofilm Reactors (Slow Sand Filters)? Sci. Total Environ. 2015, 506–507, 315–322. [Google Scholar] [CrossRef] [PubMed]
- Ha, J.H.; Ong, S.K. Nitrification and denitrification in partially aerated biological aerated filter (BAF) with dual size sand. Water Sci. Technol. 2007, 1–2, 9–17. [Google Scholar] [CrossRef] [PubMed]
- Zhang, L.; Carvalho, P.N.; Bollmann, U.E.; El-taliawy, H.; Brix, H.; Bester, K. Enhanced removal of pharmaceuticals in a biofilter: Effects of manipulating co-degradation by carbon feeding. Chemosphere 2019, 236, 134303. [Google Scholar] [CrossRef] [PubMed]
- Chen, S.; Chen, Z.; Dougherty, M.; Zuo, X.; He, J. The role of clogging in intermittent sand filter (ISF) performance in treating rural wastewater retention pond effluent. J. Clean. Prod. 2021, 294, 126309. [Google Scholar] [CrossRef]
- Welz, P.J.; Le Roes-Hill, M. Biodegradation of organics and accumulation of metabolites in experimental biological sand filters for the treatment of synthetic winery wastewater: A mesocosm study. J. Water Process Eng. 2014, 3, 155–163. [Google Scholar] [CrossRef]
- Wu, Z.; Dougherty, M.; Chen, Z.; Zhou, Y.; Zuo, X.; He, J. Interaction between bioaccumulation and the efficiency of intermittent sand filters in wastewater treatment. J. Clean. Prod. 2022, 335, 130303. [Google Scholar] [CrossRef]
- Hojo, L.Y.C.P.; de Paul Rezende, R.; Lautenschlager, S.R.; Sabogal-Paz, L.P. Household slow sand filter operating in continuous and intermittent flows: Computational fluid dynamics simulation and validation experiments. Chem. Eng. Sci. 2022, 247, 117058. [Google Scholar] [CrossRef]
- Phillips, J.A.; Smidt, S.J. Modeling improved performance of reduced-height biosand water filter designs. Water 2020, 12, 1337. [Google Scholar] [CrossRef]
- Mulugeta, S.; Helmreich, B.; Drewes, J.G.; Nigussie, A. Consequences of fluctuating depth of filter media on colifrom removal performance and effluent reuse opportunities of a bio-sand filter in municipal wastewater treatment. J. Environ. Chem. Eng. 2020, 8, 104135. [Google Scholar] [CrossRef]
- Casas, M.E.; Larzabal, E.; Mataoros, V. Exploring the usage of artificial root exudates to enhance the removal of contaminants of emerging concern in slow sand filters: Synthetic vs. real wastewater conditions. Sci. Total Environ. 2022, 824, 153978. [Google Scholar] [CrossRef]
- Kaetzl, K.; Lübken, M.; Nettman, E.; Krimmler, S.; Wichern, M. Slow sand filtration of raw wastewater using biochar as an alternative filtration media. Sci. Rep. 2020, 10, 1229. [Google Scholar] [CrossRef]
- Mohamed, A.Y.A.; Tuohy, P.; Healy, M.G.; Ó hllacháin, D.; Fenton, O.; Siggins, A. Effects of wastewater pre-treatment of clogging of an intermittent sand filter. Sci. Total Environ. 2023, 876, 162605. [Google Scholar] [CrossRef]
- Gilibert, O.; Gerino, M.; Costa, D.-T.; Sauvage, S.; Juline, F.; Capowiez, Y.; Orange, D. Denisity effect of Eisenia sp. epigeic earthworms on the hydraulic conductivity of sand filters for wastewater treatment. Water 2022, 14, 1048. [Google Scholar] [CrossRef]
- Dalahmeh, S.; Ahrens, L.; Gros, M.; Wiberg, K.; Pell, M. Potential of biochar filters for onsite sewage treatment: Adsorption and biological degradation of pharmaceuticals in laboratory filters with active, inactive and no biofilm. Sci. Total Environ. 2018, 612, 192–201. [Google Scholar] [CrossRef]
- Perez-Mercado, L.F.; Lalander, C.; Berger, C.; Dalahmeh, S.S. Potential of biochar filters for onsite wastewater treatment: Effects of biochar type, physical properties and operating conditions. Water 2018, 10, 1835. [Google Scholar] [CrossRef]
- Akratos, C.S.; Tatoulis, T.I.; Tekerlekopoulou, A.G. Biotreatment of winery wastewater using a hybrid system combining biological trickling filters and constructed wetlands. Appl. Sci. 2020, 10, 619. [Google Scholar] [CrossRef]
- Skornia, K.; Safferman, S.I.; Rodriguez-Gonzalez, L.; Ergas, S.J. Treatment of winery wastewater using bench-scale columns simulating vertical flow constructed wetlands with adsorption media. Appl. Sci. 2020, 10, 1063. [Google Scholar] [CrossRef]
- Bhutiani, R.; Ahamad, F.; Ruhela, M. Effect of composition and depth of filter-bed on the efficiency of sand-intermittent-filter treating the industrial wastewater at Haridwar, India. J. Appl. Nat. Sci. 2021, 13, 88–94. [Google Scholar] [CrossRef]
- Kang, Y.W.; Mancl, K.M.; Tuovinen, O.H. Treatment of turkey processing wastewater with sand fitration. Bioresour. Technol. 2007, 98, 1460–1466. [Google Scholar] [CrossRef] [PubMed]
- Khengaoui, K.; Mahammed, M.H.; Touil, Y.; Amrane, A. Influence of secondary salinity wastewater on the efficiency of biological treatment of sand filter. Energy Procedia 2015, 74, 398–403. [Google Scholar] [CrossRef]
- Li, S.; Miao, B.; Shi, Z.; Zhang, W. Study on denitrification effect of O/A two-stage biological sand filter. In Proceedings of the 2010 International Conference on Mechanic Automation and Control Engineering, Wuhan, China, 26–28 June 2010; pp. 1706–1709. [Google Scholar] [CrossRef]
- Shahraki, Z.M.; Wang, M.; Wlaker, H.W.; Russo, F.; Gobler, C.; Heufelder, G.; Mao, X. A mechanistic understanding of the nitrification and sand layer performance in a nitrogen removing giofilter (NRB) treating onsite wastewater. Ecol. Eng. 2021, 168, 106271. [Google Scholar] [CrossRef]
- Olisa, E.; Sapari, N.; Malakahmad, A.; Ezechi, E.H.; Riahi, A.; Orji, K.U.; Alex-Ohunyon, O.; Ibrahim, S.U. Performance of sand channel as a pre-treatment for anaerobic landfill bioreactor leachate and biogas generation. J. Environ. Sci. Technol. 2016, 9, 100–110. [Google Scholar] [CrossRef]
- Mishra, T.; Ramola, S.; Kumar, A.; Shankhwar, A.K.; Rabha, A.K.; Srivastava, R.K. Pulp and paper mill effluent treatment by hybrid anaerobic upflow fixed-bed bioreactor combined with slow sand filter. Desalination Water Treat. 2015, 1–9. [Google Scholar] [CrossRef]
- Hamisi, R.; Renman, A.; Renman, G.; Wörman, A.; Thunvik, R. Long-term phosphorus sorption and leaching in sand filters for onsite treatment systems. Sci. Total Environ. 2022, 833, 155254. [Google Scholar] [CrossRef] [PubMed]
- Headley, T.; Nivala, J.; Kassa, K.; Olsson, L.; Wallace, S.; Brix, H.; van Afferden, M.; Müller, R. Escherichia coli removal and internal dynamics in subsurface flow ecotechnologies: Effects of design and plants. Ecol. Eng. 2013, 61, 564–574. [Google Scholar] [CrossRef]
- Mohamed, A.Y.A.; Siggins, A.; Healy, M.G.; Fenton, O.; Ó hUllacháin, D.; Tuohy, P. A novel coagulation-intermittent sand filter for the treatment of dairy wastewater. J. Clean. Prod. 2022, 369, 133234. [Google Scholar] [CrossRef]
- Prenafeta-Boldú, F.X.; Trillas, I.; Viñas, M.; Guivernau, M.; Cáceres, R.; Marfà, O. Effectiveness of a full-scale horizontal slow sand filter for controlling phytopathogens in recirculating hydroponics: From microbial isolation to full microbiome assessment. Sci. Total Environ. 2017, 599–600, 780–788. [Google Scholar] [CrossRef] [PubMed]
- Papp, L.-A.; Carnidanli-Rezende, J.; de Souza Júdice, W.A.; Sanchez, M.B.; Araújo, W.L. Low biological phosphorus removal from effluent treated by slow sand filters. Appl. Microbiol. Biotechnol. 2022, 106, 5797–5809. [Google Scholar] [CrossRef]
- Morvannou, A.; Masson, M.; Gautier, M.; Bisone, S.; Richard, L.; Boutin, C.; Forquet, N. Fate of phosphorus from treated wastewater in soil-based constructed wetlands. Sci. Total Environ. 2022, 816, 151589. [Google Scholar] [CrossRef] [PubMed]
- Manoukian, L.; Metson, G.S.; Hernández, E.M.; Vaneeckhaute, C.; Frigon, D.; Omelon, S. Forging a cohesive path: Integrating life cycle assessments of primary-origin phosphorus fertilizer production and secondary-origin recovery from municipal wastewater. Resour. Conserv. Recycl. 2023, 199, 107260. [Google Scholar] [CrossRef]
- Holtman, G.A.; Haldenwang, R.; Welz, P.J. Calcite dissolution and bioneutralization of acidic wastewater in biosand reactors. Water 2022, 14, 3482. [Google Scholar] [CrossRef]
- Holtman, G.A.; Haldenwang, R.; Welz, P.H. Effect of particle character and calcite dissolution on the hydraulic conductivity and longevity of biosand filters treating winery and other acidic effluents. Water 2022, 14, 2603. [Google Scholar] [CrossRef]
- Rodriguez-Caballero, A.; Ramond, J.-B.; Wlez, P.J.; Cowan, D.A.; Odlare, M.; Burton, S.G. Treatment of high ethanol concentration wastewater by biological sand filters: Enhanced COD removal and bacterial community dynamics. J. Environ. Manag. 2012, 109, 54–60. [Google Scholar] [CrossRef] [PubMed]
- Ramond, J.-B.; Welz, P.J.; Tuffin, M.I.; Burton, S.G.; Cowan, D.A. Selection of diazotrophic bacterial communities in biological sand filter mesocosms used for the treatment of phenolic-laden wastewater. Microb. Ecol. 2013, 66, 563–570. [Google Scholar] [CrossRef] [PubMed]
- Welz, P.J.; Ramond, J.-B.; Braun, L.; Vikram, S.; Le Roes-Hill, M. Bacterial nitrogen fixation in sand bioreactors treating winery wastewater with a high carbon to nitrogen ratio. J. Environ. Manag. 2018, 207, 192–202. [Google Scholar] [CrossRef]
- Ramond, J.-B.; Welz, P.J.; Tuffin, M.; Burton, S.G.; Cowan, D.A. Assessment of temporal and spatial evolution of bacterial communities in a biological sand filter mesocosm treating winery wastewater. J. Appl. Microbiol. 2013, 115, 91–101. [Google Scholar] [CrossRef]
- Ramond, J.-B.; Welz, P.J.; Cowan, D.A.; Burton, S.G. Microbial community structure stability, a key parameter in monitoring the development of constructed wetland mesocosms during start-up. Res. Microbiol. 2012, 163, 28–35. [Google Scholar] [CrossRef]
- Welz, P.J.; Ramond, J.B.; Cowan, D.A.; Prins, A.; Burton, S.G. Ethanol degradation and the value of incremental priming in pilot scale constructed wetlands. Ecol. Eng. 2011, 37, 1453–1459. [Google Scholar] [CrossRef]
- Hayward, J.L.; Huang, Y.; Hansen, L.T.; Yost, C.K.; Lake, C.; Jamieson, R.C. Fate and distribution of determinants of antimicrobial resistance in lateral flow sand filters used for treatment of domestic wastewater. Sci. Total Environ. 2021, 767, 145481. [Google Scholar] [CrossRef]
- Nord, N.B.; Bester, K. Can the removal of pharmaceuticals in biofilters be influenced by short pulses of carbon? Sci. Total Environ. 2020, 707, 135901. [Google Scholar] [CrossRef]
Figure 1.
Diagram showing the effects of the primary physical characteristics of grains on the flow properties of biosand reactors. HC = hydraulic conductivity, HLR = hydraulic loading rates.
Figure 1.
Diagram showing the effects of the primary physical characteristics of grains on the flow properties of biosand reactors. HC = hydraulic conductivity, HLR = hydraulic loading rates.

Figure 2.
Basic principles showing how hydraulic loading rate (HLR), flow rate and related hydraulic retention time (HRT) typically affect nitrification and denitrification in gravity-fed biosand reactors treating primary and secondary sewage-based effluents.
Figure 2.
Basic principles showing how hydraulic loading rate (HLR), flow rate and related hydraulic retention time (HRT) typically affect nitrification and denitrification in gravity-fed biosand reactors treating primary and secondary sewage-based effluents.

Disclaimer/Publisher’s Note: The statements, opinions and data contained in all publications are solely those of the individual author(s) and contributor(s) and not of MDPI and/or the editor(s). MDPI and/or the editor(s) disclaim responsibility for any injury to people or property resulting from any ideas, methods, instructions or products referred to in the content. |
© 2024 by the author. Licensee MDPI, Basel, Switzerland. This article is an open access article distributed under the terms and conditions of the Creative Commons Attribution (CC BY) license (https://creativecommons.org/licenses/by/4.0/).
Share and Cite
MDPI and ACS Style
Welz, P.J. Biosand Reactors for Municipal and Industrial Wastewater Treatment: Status Quo, Challenges and Opportunities. Processes 2024, 12, 641. https://doi.org/10.3390/pr12040641
AMA Style
Welz PJ. Biosand Reactors for Municipal and Industrial Wastewater Treatment: Status Quo, Challenges and Opportunities. Processes. 2024; 12(4):641. https://doi.org/10.3390/pr12040641
Chicago/Turabian StyleWelz, Pamela Jean. 2024. "Biosand Reactors for Municipal and Industrial Wastewater Treatment: Status Quo, Challenges and Opportunities" Processes 12, no. 4: 641. https://doi.org/10.3390/pr12040641
Note that from the first issue of 2016, this journal uses article numbers instead of page numbers. See further details here.