Article

Determination of Five Phosphodiesterase-5 Inhibitors in Multiple Honey-Based Consumer Products by Chromatographic Technique in Rat Plasma

1
Faculty of Pharmacy, Mutah University, Al-Karak 61710, Jordan
2
Faculty of Pharmacy and Medical Sciences, University of Petra, Amman 11196, Jordan
3
Faculty of Science, Al-Balqa Applied University, Al-Salt 19117, Jordan
4
Faculty of Pharmacy, Al-Zaytoonah University of Jordan, Amman 11733, Jordan
5
Faculty of Pharmacy, Al-Ahliyya Amman University, Amman 19328, Jordan
6
Faculty of Pharmacy, Zarqa University, Al Zarqa 13110, Jordan
7
Pharmacological and Diagnostic Research Centre, Faculty of Pharmacy, Al-Ahliyya Amman University, Amman 19328, Jordan
8
Planning and Resource Development Department, Al Anbar Health Directorate, Ministry of Health, Al Anbar 31001, Iraq
9
Faculty of Pharmacy, Middle East University, Amman 11831, Jordan
*
Authors to whom correspondence should be addressed.
These authors contributed equally to this work.
Processes 2023, 11(10), 3019; https://doi.org/10.3390/pr11103019
Submission received: 15 September 2023 / Revised: 4 October 2023 / Accepted: 18 October 2023 / Published: 20 October 2023

Abstract

:
This study aimed to develop and verify a simple HPLC-based quantitative approach to simultaneously determine the phosphodiesterase-5 inhibitors (PDE5Is) sildenafil, vardenafil, udenafil, avanafil, and tadalafil in a tablet dosage form mixed with honey obtained form Jordanian market in rat plasma. PDE5Is block phosphodiesterase-5 (PDE-5). This blockage, in turn, triggers vasodilation by phosphorylating downstream effector molecules. Chromatographic separation was performed on a HypersilTM C18 column (150 mm × 4.6 mm, 5 µm, Thermo Fisher Inc., Waltham, MA, USA). An acetonitrile:10% Triethylamine solution (57:43) at pH 5.5 (adjusted with orthophosphoric acid), 20 µL injection volume, 1 mL/min flow rate, 25 °C temperature, and eluent monitoring at 250 nm was used to execute the current approach. Linearity was observed in the 9.6–14.4 µg/mL concentration ranges for sildenafil, udenafil, avanafil, and tadalafil, and 2.4–3.6 µg/mL for vardenafil. Each dosage form was recovered within acceptable limits at three distinct concentrations, and the assay selectivity indicated no interference from the inactive substances in the formulation. Sildenafil, vardenafil, udenafil, avanafil, and tadalafil had retention times of 3.5, 4.3, 6.2, 9.7, and 12.8 min, respectively, and tadalafil was 12.8 min. The present analytical method is comprehensive and universal for measuring the five drugs. Such an analytical method can be routinely used to detect the combination of these drugs.

1. Introduction

The inability to get or keep an erection capable of sexual performance is called erectile dysfunction (ED) [1]. ED has become a widespread problem, with an estimated 320 million people suffering by 2025 [2]. The Massachusetts Male Aging Study found that up to 52% of men aged 40–70 struggle with ED [3]. The discovery of phosphodiesterase-5 inhibitors (PDE5Is) for inducing penile erections was a side effect of testing their capacity to cure hypertension and angina. PDE5Is are routinely used to treat ED [4,5]. Multiple studies have shown that ED results from cardiovascular diseases and other health problems, such as smoking, high blood pressure, high cholesterol, metabolic syndrome, and diabetes. However, it can also be caused by (i) neurological (deficit in nerve signaling to the “corpora cavernosa”), (ii) psychological (depression, stress, or anxiety), or (iii) endocrinologic (low testosterone levels or other hormone imbalances) factors [6,7,8,9]. Several PDE5Is are currently on the market, including the FDA-approved medications sildenafil, vardenafil, tadalafil, and avanafil, as well as the non-FDA-approved medications lodenafil, udenafil, and mirodenafil [10].
Several procedures have been developed to analyze PDE5Is. HPLC with diode array detection and liquid chromatography-electrospray ionization tandem mass spectrometry has been used to analyze phosphodiesterase-5 inhibitors (PDE5Is) in dietary supplements and in pre-mixed bulk powders for dietary supplements, respectively [11], PDE5I quantification in dietary supplements using liquid chromatography-high-resolution mass spectrometry (LC-HRMS) [12], HPLC with diode array method [13], High-Performance Liquid Chromatography with Ultraviolet Detection [14], and many others. Therefore, this study’s novelty lies in applying chromatographic techniques to measure PDE-5 inhibitors in multiple honey-based consumer products, thereby providing valuable information for regulatory agencies and consumers regarding the safety and quality of these products.
Capillary electrophoresis with contactless conductivity detection (CE-C4D) is a quick, sensitive, and adaptable method for determining drugs in clinical samples. It is especially well-suited for analyzing low molecular weight biogenic substances, such as inorganic cations and anions, amino acids, amines, low molecular weight organic acids, saccharides, and many drugs, such as antibiotics, analgesics, anesthetics, or antiepileptics [15,16]. A method based on CE-C4D is presented for determining two important PDE5Is (sildenafil and vardenafil) [17].
Honey is a well-known and widely used natural product for enhancing sexual functions worldwide, including in Jordan. Some honey sellers, however, do adulterate honey with PDE5Is without the customers’ knowledge to demonstrate the high quality of their honey. Consumers should know the potential health concerns of adding PDE5Is to several dietary supplements (including honey) to obtain the intended sexual results [18,19]. Various methods have been used to examine the pharmaceutical PDE5Is in honey and other food products. Three liquid chromatographic techniques with distinct detectors were developed and validated in one study to evaluate nutraceuticals (NTCs, honey, and tablets with herbal extracts), where a fluorescence detector (FLD) showed better sensitivity and selectivity with lower LOQs and LODs [20]. Another study examined several PDE5Is and their counterfeits using HPLC-UV and UPLC-MS/MS [21]. UV detection was precisely set at 230 nm, and the total run times for both methods were 11 and 6 min, respectively. The linearity ranges for drugs similar to ours were wider [21]. Another study optimized and validated the LC-HRMS method using 23 target analytes representing different ED drugs with structural similarities [22]. The method demonstrated good specificity and linearity, with a 10–70 ng/mL detection limit and a quantification limit of 80 ng/mL [22].
Compared with other methods, the current method is more versatile and sensitive, with a wider linearity range for the simultaneous measurement of five PDE5Is mixed with honey in rat plasma, and it requires less sample preparation than other methods.
This study aimed to develop and verify a simple, novel, and reliable reversed-phase high-performance liquid chromatography (RP-HPLC) technique for the simultaneous measurement of sildenafil, vardenafil, udenafil, avanafil, and tadalafil mixed with honey in rat plasma, which is better than several current methods in terms of simplicity, sensitivity, and accuracy.

2. Method

2.1. Materials

Sildenafil (Dar al Dawa, Jordan, purity 99.95%), tadalafil (Dar al Dawa, Jordan, purity 99.85%), vardenafil (Dar al Dawa, Jordan, purity 99.85%), and carbamazepine (Dar al Dawa, Jordan, purity 99.14%) were kindly gifted by Dar al Dawa, Jordan. Avanafil (purity 99.64%; Mart, India) was purchased from IndiaMart (IndiaMart, Noida, India). Undanafil (purity:99.71%, Sigma-Aldrich, Taufkirchen, Germany) was purchased from Sigma-Aldrich (Germany). Fischer Scientific (Winsford, UK) was used for HPLC-grade acetonitrile, methanol (acetonitrile and methanol purity 99.9%), and EDTA. HPLC-grade triethylamine was obtained from TEDIA Software (St. Louis, MO, USA). Phosphoric acid was purchased from Medex (Medex, Fort Lauderdale, FL, USA). The rat plasma was obtained from the University of Petra (Amman, Jordan). This study used regular honey obtained from Jordanian markets (south of Amman, north of Amman, west of Amman, east of Amman, downtown, Ajloun, Jerash, Irbid, Karak, and Tafila).

2.2. Instrumentation

An HPLC system was used for chromatographic analysis, including a vacuum degasser, oven, pump (LC Pump plus, Thermo Finnigan, San Jose, CA, USA), UV-visible detector, and the standard autosampler, pump, and Thermo Finnigan Surveyor UV/Vis PLUS Detector (Surveyor PDA Plus). A HypersilTM C18 column (150 mm × 4.6 mm, 5 µm, Thermo Fisher Inc., Waltham, MA, USA) was used for separation. A digital scale was used for all measurements. Chrom Quest 4.2.34 was used to analyze the chromatographic results, Supplementary Table S1: Chromatographic Conditions.

2.3. Sample Preparation and Methodology Validation

2.3.1. Chromatographic Conditions

The temperature for chromatographic separation was set to 25 °C, and the detection wavelength was set to 250 nm with a flow rate of 1 mL/min. The length of the analysis was limited to 15 min. The drug solution was injected into the column after the mobile phase had been circulated for 60 min to equilibrate the system. The injection volume was 20 µL. The mobile phase was analyzed using a 57:43 acetonitrile:10% Triethylamine (TEA) (pH 5.5) solution and a HypersilTM C18 column (150 mm × 4.6 mm, 5 µm, Thermo Fisher).

2.3.2. Preparation of Plasma Samples with a PDE-5 Inhibitor

A 0.1 mg/mL concentration was obtained by dissolving 10 mg of the active pharmaceutical component in 100 mL of (distilled water 1:1 plasma).

2.3.3. Preparation of Standard Solutions

Stock solutions of sildenafil, udenafil, avanafil, tadalafil (480 µg/mL), and vardenafil (concentration equal to 200 µg/mL) were prepared in the same mobile phase. Working solutions of sildenafil, udenafil, avanafil, tadalafil (12 µg/mL), and vardenafil (3 µg/mL) were prepared by diluting the stock solution daily with the mobile phase.
A stock solution of carbamazepine (used as the Internal Standard for verifying identity, IS) was prepared in acetonitrile at a 100 µg/mL concentration. Working IS solutions (20 ng/mL) were prepared by diluting stock solutions with acetonitrile daily.

2.3.4. Quantification and Method Validation

Linearity, precision, specificity/selectivity, accuracy, sensitivity (lower limit of detection and lower limit of quantification), sample stability, and robustness were prioritized throughout the validation of the method following the ICH criteria [23]. The standard addition method was used for quantification, in which several constant volume samples of the PDE-5 sample solutions to be analyzed were added to an increment volume of standard solution, mixed well, and analyzed. Then, the PDE-5 concentration in the original sample was calculated [24].

2.4. Methodology Validation

2.4.1. Linearity

Calibration curves were created for 80–120% of the standard working concentration in the mobile phase. These points were used to assess the linearity of the proposed procedure. Calibration curve ranges for sildenafil, udenafil, avanafil, and tadalafil were 9.6–14.4 µg/mL, while for vardenafil, the range was 2.4–3.6 µg/mL. Using the least-squares technique of regression analysis, the peak area of each analyte was compared with its concentration, and the slope (a), intercept (b), and correlation coefficient (r) were calculated.

2.4.2. Sensitivity

The lower limits of detection (LOD) and quantification (LOQ; also known as the quantification limit, QL) were calculated for each analyte to assess the method’s sensitivity. The signal-to-noise ratio (S/N) was determined using the linearity calibration curve and methods supplied by the ICH guidelines.
L D = 3.3 × σ S a n d   Q L = 10 × σ S
where σ is the standard deviation of the response (calculated y-intercepts), and S is the slope of the calibration curve. The y-intercepts were calculated as [y-intercept = Avg. area − (slope × conc.)].

2.4.3. Recovery and Accuracy

The accuracy of the HPLC method can affect the reliability of the results [25]. Some studies have reported high accuracy of PDE5Is, whereas others have reported discrepancies between HPLC and other analytical methods. For example, one study reported that the HPLC method could accurately quantify sildenafil citrate in a pharmaceutical formulation [26], whereas another study reported that the HPLC method had lower accuracy than a liquid chromatography-tandem mass spectrometry method [27].
Nine samples of the five tablets with placebo were prepared at three different concentrations (80, 100, and 120%), and their results were compared with the standard working solution. The percent recovery was used to determine the accuracy and reliability of the proposed method.
The absolute recovery was calculated by comparing the peak areas of API and internal standard from a plasma sample prepared according to the analysis method to the peak areas of pure standards prepared in the mobile phase with a concentration of drug or internal standard ensuring 100 percent recovery. Plasma samples with concentrations of (200 ng/mL), (1000 ng/mL), and (2600 ng/mL) were prepared in triplicate. The relative standard deviation should not exceed 15% at any concentration level. (Percentage RSD).
Spiking honey samples calculated percent recovery at three appropriately nominated concentrations (9.6, 12, and 14.2 µg/mL) of sildenafil, udenafil, avanafil, and tadalafil and (2.4, 3, and 3.6 µg/mL) of vardenafil each concentration three times. Percent recovery was also calculated by spiking placebo samples in triplicate at three appropriately nominated concentrations of 9.6, 12, and 14.2 µg/mL of sildenafil, udenafil, avanafil, and tadalafil and 2.4, 3, and 3.6 µg/mL of vardenafil; each concentration was performed three times. The relative standard deviation (RSD) should not exceed 15% at any concentration level.

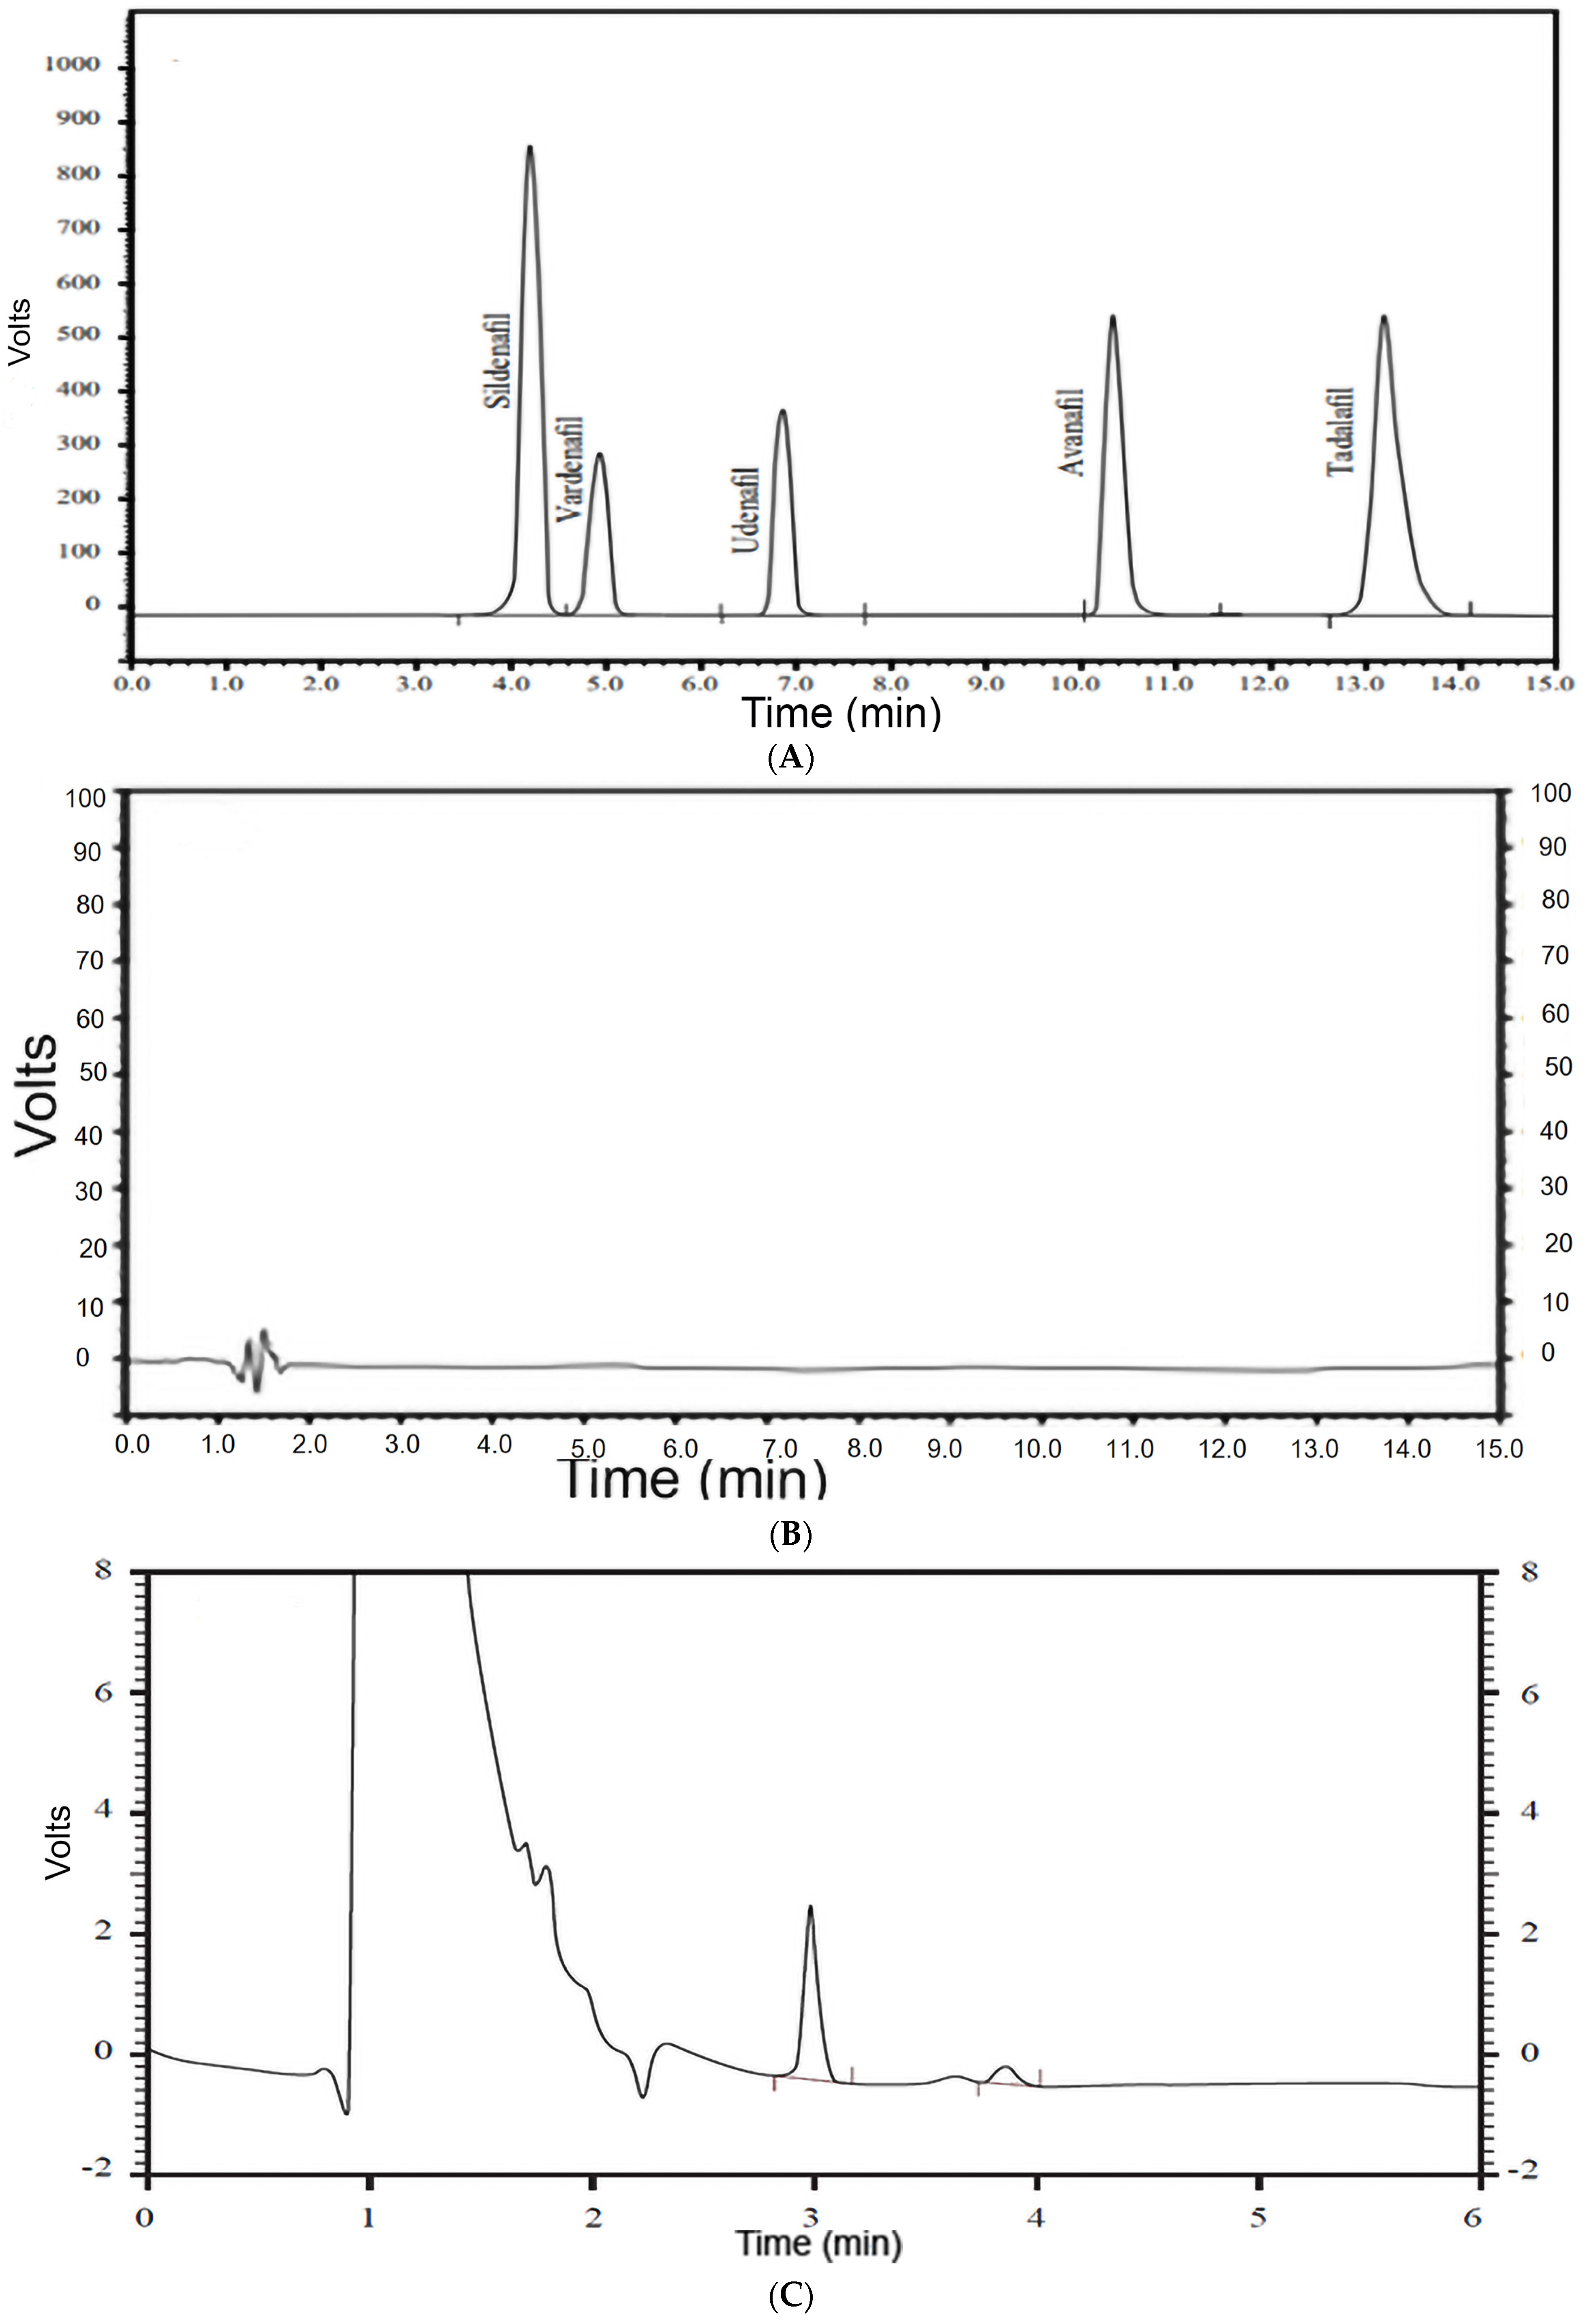
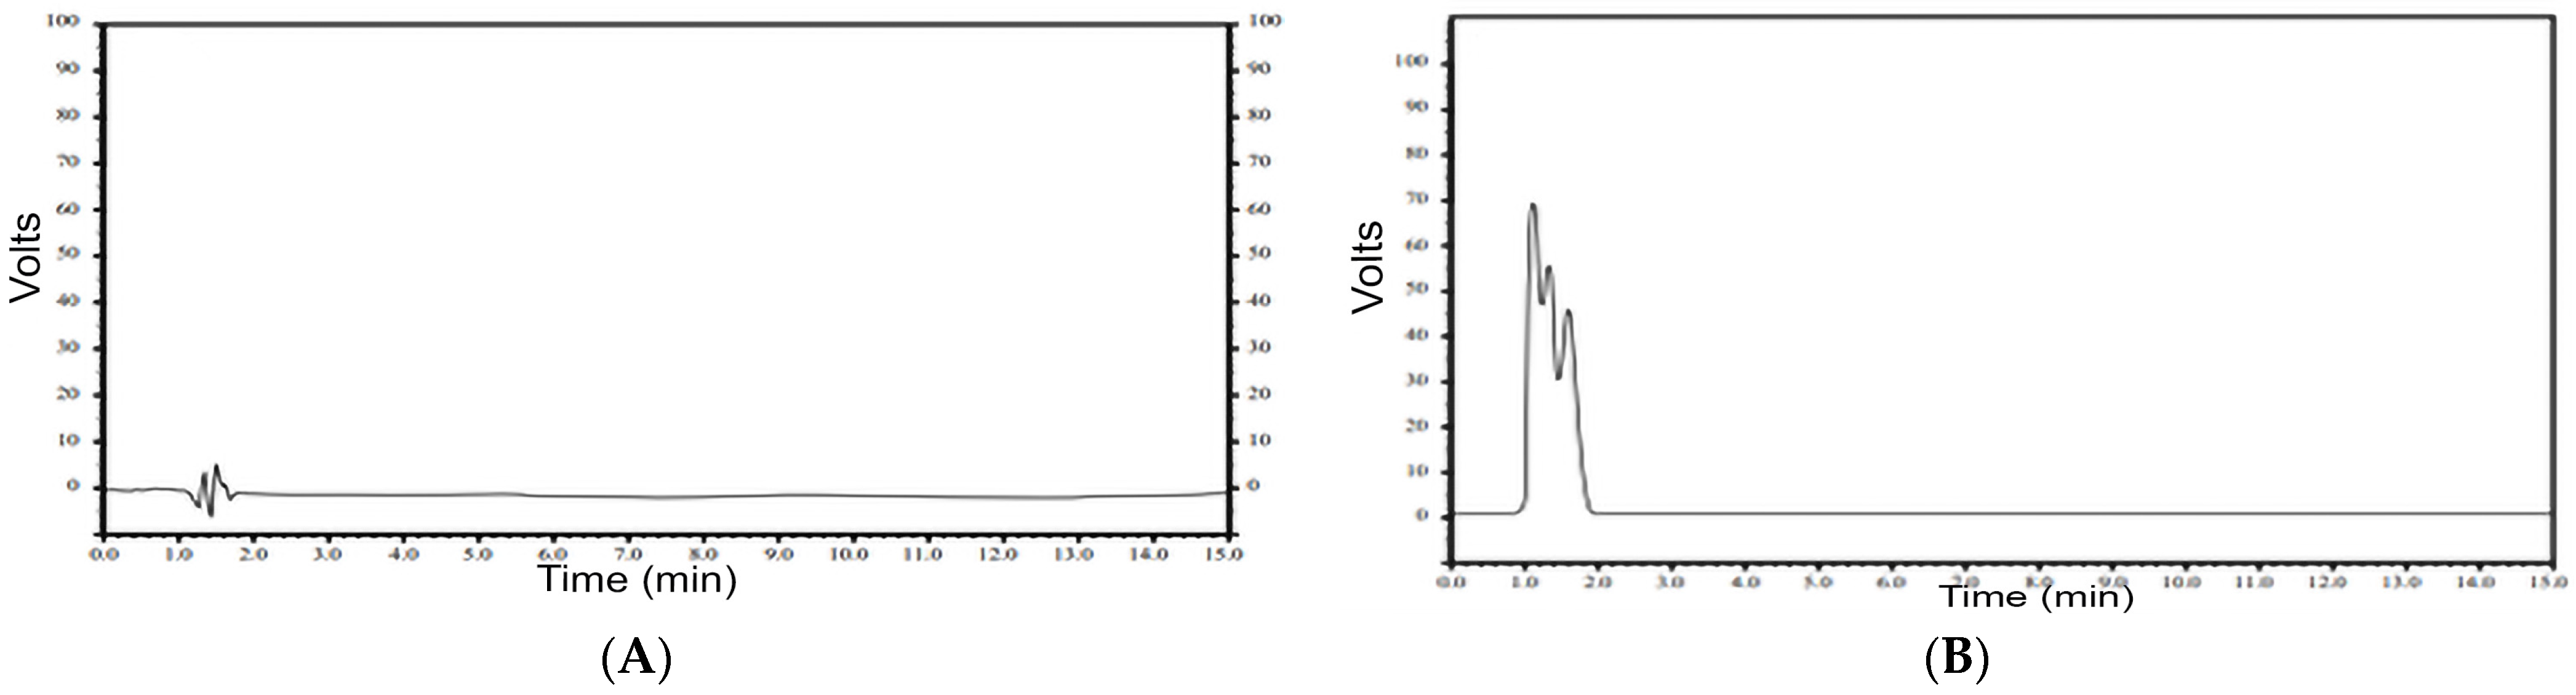
2.4.4. Specificity and Selectivity

The specificity of the analytical method lies in its capacity to precisely measure analytes despite the presence of other components in the sample. Testing the specificity of the method ensured that the peaks of the medicines and IS could be distinguished in the standard solutions, placebos, and pure honey.

2.4.5. Sample Stability

The stability of the analytes was measured at room temperature. The analyte samples’ 12- and 24-hour room-temperature storage preceded the subsequent analyses.

2.4.6. Robustness Test

The method’s stability was evaluated by studying peak area, height, and retention time under various experimental conditions. The stability of the analytical procedure was tested by systematically altering several chromatographic conditions, such as the column oven temperature (±2 °C), detector wavelength (±2 nm), mobile phase composition (±3% acetonitrile), mobile phase flow rate (±0.2 mL/min), mobile phase pH (±0.1), and the organic solvent (acetonitrile) composition (±3%) [28].

2.4.7. System Suitability

The system used ten replicates of 12 µg/mL of sildenafil, udenafil, avanafil, and tadalafil, and 6 µg/ml of vardenafil for suitability tests. Parameters including peak area, retention time, resolution, capacity factor, and asymmetry were determined.

2.4.8. Sample Preparation

Placebo Selectivity Test

In a 100 mL volumetric flask, 80, 46, 180, 118, and 33 mg of placebo sildenafil, vardenafil, avanafil, udenafil, and tadalafil were dissolved. After adding 80 mL of diluent and sonicating for 10 min with shaking every 5 min, the sample was diluted to volume with diluent and filtered through a 0.45 µm nylon syringe filter (Millipore, Bedford, MA, USA). The sample was injected into the HPLC system using the proposed method to test for possible placebo interactions with any drug.

Honey Selectivity Test

One milliliter of honey was dissolved in a 100 mL volumetric flask. After adding 80 mL of diluent and sonicating for 15 min with shaking every 5 min, the sample was diluted to the mark with diluent and filtered through a 0.45 µm nylon membrane syringe filter (Millipore, Bedford, MA, USA). This sample was injected into the HPLC system using the described approach to test for potential medication interactions with the honey.

3. Application of the Method in PDE5Is Quantifications in Tablets and Honey Samples

3.1. Honey Mixture Sample Preparation

Honey samples were collected from different governorates in Jordan (Supplementary Table S2). They are used as boosters of the immune system.
Honey mixtures were transferred into a 100 mL volumetric flask separately, dissolved in the diluent, and then the volume was made up to mark. The samples were subjected to ultrasonic treatment for 15 min and then filtered using a 0.45 µm nylon syringe (Millipore, Bedford, MA, USA).

3.2. Assay Test for Pharmaceutical Tablets

Supplementary Table S3 shows the results of weighing and finely powdering 20 tablets representing various dose types. Diluents (30 mL) were added to a 100 mL volumetric flask containing powdered sildenafil, udenafil, avanafil, tadalafil, and vardenafil tablets, and the mixture was sonicated for 15 min while being shaken intermittently. A 0.45 µm nylon syringe (Millipore, Bedford, MA, USA) was used to purify the solution.

4. Results and Discussion

Sildenafil, tadalafil, vardenafil, avanafil, and undanafil were analyzed simultaneously, using carbamazepine as an internal standard. Several experimental parameters were fine-tuned, and the ICH standards verified the procedure. Within 15 min, the suggested approach successfully separated all analytes. The best separation was obtained using a HypersilTM C18 column (150 mm × 4.6 mm, 5 µm, Thermo Fisher) and a mobile phase consisting of acetonitrile:10% TEA solution (57:43), adjusted to a pH of 5.5 with ortho-phosphoric acid, and pumped at a flow rate of 1 mL/min at 25 °C.

4.1. Quantification and Method Validation

The proposed analysis method was validated according to standard selectivity, sensitivity, recovery, precision, and robustness guidelines.

4.1.1. Linearity

The linearity of the method was determined by plotting the analyte concentrations against the matching peak regions. Linearity with a good regression coefficient was observed in the 9.6–14.4 µg/mL concentration for sildenafil, udenafil, avanafil, and tadalafil, and a concentration range of 2.4–3.6 µg/mL for vardenafil, separately for the standard mixture. Linearity ranges in HPLC procedures are often one order of magnitude or more, particularly if the method analyzes analytes in materials such as honey. Nevertheless, one of the weaknesses of our study is that the linearity ranges are quite limited (9.6–14.4 µg/mL and 2.4–3.6 µg/mL).
The regression equation and correlation coefficient values were computed from the calibration curves of the drugs and are presented in Table 1.
According to ICH, the regression factors (R2) for sildenafil, vardenafil, udenafil, avanafil, and tadalafil were 0.999, 0.999, 0.999, 0.999, and 0.999, respectively, indicating that the method was linear at these concentrations. Figure 1 depicts an overlay of the spiked chromatograms of sildenafil, vardenafil, udenafil, avanafil, and tadalafil (A), spiked honey (B), and spiked rat plasma. When it comes to comparing our results with other results, the retention times found in this paper for sildenafil, vardenafil, udenafil, avanafil, and tadalafil were 3.5, 4.3, 6.2, 9.7, and 12.8 min, respectively. In contrast, comparatively short retention times for another study [29] for sildenafil acid, vardenafil acid, and tadalafil were found at 1.93, 2.47, and 9.62, respectively. Tadalafil has a longer retention time than sildenafil, vardenafil, udenafil, and avanafil due to pka differences. Sildenafil has a pka of 8.7, vardenafil 4.72 and 6.21 (because it is a tertiary amine), udenafil 11.07, avanafil 13.71 and 6.54, and tadalafil 3.52 and 3.44. Another reason for the longer retention time for tadalafil is its larger chemical structure compared to other drugs. Tadalafil has the lowest water solubility and is difficult to extract from plasma.

4.1.2. Sensitivity

The sensitivity of HPLC can affect the detection and quantification limits of PDE5Is. Some studies have reported detection limits for sildenafil citrate in human plasma as low as 1.80 ng/mL [30]; others have reported vardenafil concentrations of around 0.25 [31]. These variations can be attributed to the differences in the sample preparation method, detector sensitivity, and injection volume. Table 2 displays the results of the LOD and LOQ calculations based on the signal-to-noise ratio. The results showing low LOD and LOQ validate the high sensitivity of the procedure.
This study’s results had higher LOD and LOQ accuracy when compared to other studies. Another study [29] discovered that the LOD for sildenafil acid, vardenafil acid, and tadalafil was 1.70, 2.16, and 1.03 mg/L, and the LOQ was 5.65, 7.21, and 3.42 mg/L, respectively.

4.1.3. Recovery and Accuracy

The refined HPLC technique was validated using the standard addition method to estimate the percentage recovery tested at 70, 100, and 130%. Table 3 displays the average % of the recovery for each medication. The method’s accuracy was further tested by a tiny percent relative inaccuracy (Table 3) [20,21].
Table 4 displays the results of the honey recovery study, demonstrating the reliability of the optimized HPLC procedure.
When compared to other methods of analysis for the detection of PDE5Is, some researchers used HPLC-UV-ESI-MS, with recovery ranging from 93.3 to 106.1% and relative standard deviation ranging from 2.0 to 5.6% (n = 6) [32]. In another study, the HPLC-UV method was used to determine vardenafil, sildenafil, and tadalafil in Honey-Mixed Herbal Sachets, yielding recoveries in the range of 93.0–103.3% at spike levels of 50–150 mg/kg with RSDs less than 10% [29]. Another study combined LC with quadrupole-TOF-MS/MS, yielding a low detection limit of 1.63–9.81 ng/g and relative standard deviations of less than 7.72% [33]. Another study used the LC-MS/MS assay to analyze human plasma and discovered that vardenafil had the lowest recovery at 73.63% (LQC) [34].

4.1.4. Specificity and Selectivity

The selectivity test was carried out by preparing a solution of a standard sample of the medications dissolved in the mobile phase, adding the placebo solution, and injecting it into the column. A selectivity test was performed to maximize separation and detection while ensuring no interaction between the analytes and non-analyte components, Supplementary Tables S4–S8 shows specificity test—loss in potency for the used drugs.

4.1.5. Sample Stability

The standard working solution was examined immediately after preparation to assess the stability of the target chemicals in the solution. It was then stored at room temperature for 12 h and 24 h before being evaluated and compared to itself at the start.

4.1.6. Robustness

Robustness tests were performed by changing the flow rate (±0.2 mL/min), detection wavelength (±2 nm), column oven temperature (±2 °C), mobile phase pH (±0.1), and composition of the organic solvent (acetonitrile) (±3%). Table 5 summarizes the results of the RSD of the robustness test (Table 5). Each adjustment was made by thoroughly examining the appropriate characteristics of the system. The method’s resistance to shifts in chromatographic conditions and the mobile phase shown in Table 5 indicate that the method was robust for drug analysis, results are shown in Supplementary Figures S6–S11.

4.1.7. Precision

The interday and intraday variations in the RSD results for sildenafil, udenafil, avanafil, tadalafil, and vardenafil are shown in Table 6.

4.1.8. Interference Test

Using the described approach, the drugs and honey were injected into an HPLC system to look for evidence of medication interactions with the honey. The results showed that the placebo and honey did not interact with the analytes. The results are shown in Figure 2.
The results of published HPLC methods for detecting PDE5Is can vary depending on several factors, and researchers may need to evaluate the advantages and limitations of different methods and optimize the analytical conditions according to their specific needs. Comparing the results of different published HPLC methods can help to identify the most reliable and accurate method for analyzing PDE5Is in a given sample.
Table 7 summarizes the results, which show a high match to the theoretical values indicated on the medicine packages, indicating that the method used allows for the extraction and analysis (separation efficiency) of the quantity in the medicine tablet.
This method is suitable for routine rat plasma PDE5I analysis. As a result, the method can be used to study PDE5I pharmacokinetics in rats to develop new and better treatments. On the other hand, the method can identify and quantify PDE5Is in adulterated products, protecting consumers. As a recommendation, other analyses, like HPLC-MS, could use the method to boost method sensitivity and selectivity. Finally, as the method could detect and quantify PDE5Is in contaminated products, it would aid in protecting consumers.

5. Conclusions

In this study, a simple and validated HPLC-based quantitative method for determining the PDE5Is sildenafil, vardenafil, udenafil, avanafil, and tadalafil in a tablet dosage form mixed with honey was developed. The separation was performed on a HypersilTM C18 column (150 mm × 4.6 mm, 5µm). The method was carried out using an acetonitrile:10% TEA solution (57:43) at pH 5.5 (adjusted with orthophosphoric acid), 20 µL injection volume, 1 mL/min flow rate, 25 °C temperature, and eluent monitoring at 250 nm. Linearity was reported in the concentration ranges of 9.6–14.4 µg/mL for sildenafil, udenafil, avanafil, and tadalafil and for vardenafil in the 2.4–3.6 µg/mL range. Each dosage form was recovered within acceptable limits at three different concentrations, and the test selectivity revealed no interference from the formulation’s inactive ingredients. Sildenafil, vardenafil, udenafil, avanafil, and tadalafil exhibited retention times of 3.5, 4.3, 6.2, 9.7, and 12.8 min, respectively. This analytical procedure can be employed regularly to detect the combination of these medications.

Supplementary Materials

The supporting information can be downloaded at: https://www.mdpi.com/article/10.3390/pr11103019/s1.

Author Contributions

Conceptualization, W.A.D. and A.A.R.; Data curation, W.A.D., I.A.-A., Z.Z., S.M.M., and E.S.M.A.-N.; Formal analysis, W.A.D., L.N.A., I.A.-A., Z.Z., A.A.D. and S.M.M.; Funding acquisition, W.A.D.; Investigation, W.A.D., A.A.R., M.H., L.N.A., and E.S.M.A.-N.; Methodology, W.A.D., A.A.D. and A.A.R.; Project administration, W.A.D. and M.H.; Resources, W.A.D., R.K., L.N.A., I.A.-A., E.A. and Z.Z.; Software, W.A.D., A.A.R., R.K., S.M.M., B.M., E.A. and E.S.M.A.-N.; Supervision, W.A.D. and E.S.M.A.-N.; Validation, W.A.D., L.N.A., I.A.-A., S.M.M., and E.S.M.A.-N.; Visualization, W.A.D. and I.A.-A.; Writing—original draft, W.A.D.; Writing—review and editing, W.A.D. and M.H. All authors have read and agreed to the published version of the manuscript.

Funding

This research received no external funding.

Data Availability Statement

All data are included in the article.

Conflicts of Interest

The authors declare no conflict of interest.

References

  1. The National Institutes of Health (NIH). Consensus Development Program; NIH: Bethesda, MD, USA, 1997. [Google Scholar]
  2. Aytaç, I.A.; McKinlay, J.B.; Krane, R.J. The Likely Worldwide Increase in Erectile Dysfunction between 1995 and 2025 and Some Possible Policy Consequences. BJU Int. 1999, 84, 50–56. [Google Scholar] [CrossRef]
  3. Feldman, H.A.; Goldstein, I.; Hatzichristou, D.G.; Krane, R.J.; McKinlay, J.B. Impotence and Its Medical and Psychosocial Correlates: Results of the Massachusetts Male Aging Study. J. Urol. 1994, 151, 54–61. [Google Scholar] [CrossRef] [PubMed]
  4. Almansour, M.; Jarrar, Y.; Jarrar, B.M. Rol Protector Del Propóleo Contra Las Alteraciones Morfológicas, Hormonales, Bioquímicas e Histológicas Inducidas Por Sobredosis de Sildenafil. Int. J. Morphol. 2016, 34, 533–540. [Google Scholar] [CrossRef]
  5. Kitta, T.; Shmohara, N. PDE5 Inhibitor. Jpn. J. Clin. Urol. 2016, 70, 404–410. [Google Scholar] [CrossRef]
  6. Fibigr, J.; Šatínský, D.; Solich, P. Current Trends in the Analysis and Quality Control of Food Supplements Based on Plant Extracts. Anal. Chim. Acta 2018, 1036, 1–15. [Google Scholar] [CrossRef]
  7. Maiorino, M.I.; Bellastella, G.; Esposito, K. Lifestyle Modifications and Erectile Dysfunction: What Can Be Expected? Asian J. Androl. 2015, 17, 5–10. [Google Scholar] [CrossRef]
  8. Goldstein, I.; Burnett, A.L.; Rosen, R.C.; Park, P.W.; Stecher, V.J. The Serendipitous Story of Sildenafil: An Unexpected Oral Therapy for Erectile Dysfunction. Sex. Med. Rev. 2019, 7, 115–128. [Google Scholar] [CrossRef]
  9. Bianco, G.; Foti, L.; Pascale, R.; Lelario, F.; Coviello, D.; Brienza, M.; Bufo, S.A.; Scrano, L. Phosphodiesterase-5 (Pde-5) Inhibitors as Emergent Environmental Contaminants: Advanced Remediation and Analytical Methods. Water 2021, 13, 2859. [Google Scholar] [CrossRef]
  10. Ahmed, W.S.; Geethakumari, A.M.; Biswas, K.H. Phosphodiesterase 5 (PDE5): Structure-Function Regulation and Therapeutic Applications of Inhibitors. Biomed. Pharmacother. 2021, 134, 111128. [Google Scholar] [CrossRef]
  11. Zou, G.; Liu, Y. Simultaneous Determination of Synthetic Phosphodiesterase-5 Inhibitors Found in a Dietary Supplement and Pre-Mixed Bulk Powders for Dietary Supplements Using High-Performance Liquid Chromatography with Diode Array Detection and Liquid Chromatography–Electrospray Ionization Tandem Mass Spectrometry. J. Chromatogr. A 2006, 1104, 113–122. [Google Scholar] [CrossRef]
  12. Strano-Rossi, S.; Odoardi, S.; Castrignanò, E.; Serpelloni, G.; Chiarotti, M. Liquid Chromatography-High Resolution Mass Spectrometry (LC-HRMS) Determination of Stimulants, Anorectic Drugs and Phosphodiesterase 5 Inhibitors (PDE5I) in Food Supplements. J. Pharm. Biomed. Anal. 2015, 106, 144–152. [Google Scholar] [CrossRef] [PubMed]
  13. Baker, M.M.; Belal, T.S.; Mahrous, M.S.; Ahmed, H.M.; Daabees, H.G. High-Performance Liquid Chromatography with Diode Array Detection Method for the Simultaneous Determination of Seven Selected Phosphodiesterase-5 Inhibitors and Serotonin Reuptake Inhibitors Used as Male Sexual Enhancers. J. Sep. Sci. 2016, 39, 1656–1665. [Google Scholar] [CrossRef] [PubMed]
  14. Nickum, E.A.; Flurer, C.L. Determination of Phosphodiesterase-5 Inhibitors and Analogs Using High-Performance Liquid Chromatography with Ultraviolet Detection. J. Chromatogr. Sci. 2015, 53, 38–46. [Google Scholar] [CrossRef] [PubMed]
  15. Tůma, P. Progress in On-Line, at-Line, and in-Line Coupling of Sample Treatment with Capillary and Microchip Electrophoresis over the Past 10 Years: A Review. Anal. Chim. Acta 2023, 1261, 341249. [Google Scholar] [CrossRef]
  16. Tůma, P. Monitoring of Biologically Active Substances in Clinical Samples by Capillary and Microchip Electrophoresis with Contactless Conductivity Detection: A Review. Anal. Chim. Acta 2022, 1225, 340161. [Google Scholar] [CrossRef]
  17. Rajh Vidal, D.T.; Augelli, M.A.; Lucio Do Lago, C. Determination of Sildenafil and Vardenafil by Capillary Zone Electrophoresis Using Capacitively Coupled Contactless Conductivity Detection. Anal. Methods 2013, 5, 2041–2045. [Google Scholar] [CrossRef]
  18. Asharari, K.S.; Alali, N.M.; Magliyah, M.S.; Al-Dhibi, H.A.; Almarek, F.A.; Albalawi, H.B. Central Serous Chorioretinopathy Following Oral Use of Adulterated Honey Mixed with Tadalafil: A Case Report. Int. Med. Case Rep. J. 2021, 14, 773–776. [Google Scholar] [CrossRef]
  19. Santillo, M.F. Recent Applications of Phosphodiesterase (PDE5) Inhibition Assays for Detecting Adulterated Sexual Enhancement Products. Drug Test. Anal. 2022, 14, 757–761. [Google Scholar] [CrossRef]
  20. Aboras, S.I.; Korany, M.A.; Abdine, H.H.; Ragab, M.A.A. HPLC/Fluorescence-Diode Array Detection for Rapid and Reliable Determination of Illegal Synthetic Drugs in Male Sexual Herbal and Honey Remedies: Comparative Study with UFLC-MS. J. AOAC Int. 2022, 105, 1288–1298. [Google Scholar] [CrossRef]
  21. Abdelshakour, M.A.; Abdel Salam, R.A.; Hadad, G.M.; Abo-ElMatty, D.M.; Abdel Hameed, E.A. HPLC-UV and UPLC-MS/MS Methods for the Simultaneous Analysis of Sildenafil, Vardenafil, and Tadalafil and Their Counterfeits Dapoxetine, Paroxetine, Citalopram, Tramadol, and Yohimbine in Aphrodisiac Products. RSC Adv. 2021, 11, 8055–8064. [Google Scholar] [CrossRef]
  22. Mohd Yusop, A.Y.; Xiao, L.; Fu, S. Liquid Chromatography-High-Resolution Mass Spectrometry Analysis of Erectile Dysfunction Drugs and Their Analogues in Food Products. Forensic Sci. Int. 2021, 322, 110748. [Google Scholar] [CrossRef]
  23. European Medicines Agency. ICH Topic Q 2 (R1) Validation of Analytical Procedures: Text And Methodology Step 5 Note For Guidance on Validation of Analytical Procedures: Text and Methodology (CPMP/ICH/381/95) APPROVAL BY CPMP November 1994 DATE FOR COMING INTO OPERATION; European Medicines Agency: Amsterdam, The Netherlands, 1995. [Google Scholar]
  24. Burns, D.T.; Walker, M.J. Origins of the Method of Standard Additions and of the Use of an Internal Standard in Quantitative Instrumental Chemical Analyses. Anal. Bioanal. Chem. 2019, 411, 2749–2753. [Google Scholar] [CrossRef] [PubMed]
  25. Habash, I.W.; Al-Shdefat, R.I.; Hailat, M.M.; Dayyih, W.A.; Abu Dayyih, W. A Stability Indicating RP-HPLC Method Development for Simultaneous Estimation of Alogliptin, Pioglitazone, and Metformin in Pharmaceutical Formulations. Acta Pol. Pharm. Drug Res. 2020, 77, 549–562. [Google Scholar] [CrossRef] [PubMed]
  26. Tripathi, A.S.; Sheikh, I.; Dewani, A.P.; Shelke, P.G.; Bakal, R.L.; Chandewar, A.V.; Mazumder, P.M. Development and Validation Of RP-HPLC Method For Sildenafil Citrate in Rat Plasma-Application To Pharmacokinetic Studies. Saudi Pharm. J. 2013, 21, 317–321. [Google Scholar] [CrossRef]
  27. Aydin, A.F.; Mikailova, P.; Omer, B.; Gene, S. Evaluation of High Performance Liquid Chromatography and Liquid Chromatography-Tandem Mass Spectrometry Methods for 25 (OH) D3 Assay. Clin. Lab. 2016, 62, 1017–1022. [Google Scholar] [CrossRef] [PubMed]
  28. Alkather, Z.; Hailat, M.; Al-Shdefat, R.; Abu Dayyih, W. Development and Validation of HPLC Method for Five Gliptins in Pharmaceutical Dosage Forms in Finished Marketed Products. Curr. Pharm. Anal. 2020, 17, 1263–1271. [Google Scholar] [CrossRef]
  29. Sirhan, A.Y.; Alrashdan, Y.; Abbasi, N.U.; Mostafa, A.; Abudayeh, Z.; Talhouni, A.; Al-Ebini, Y. Optimization and Validation of HPLC-UV Method for the Determination of Vardenafil, Sildenafil, and Tadalafil in Honey-Mixed Herbal Sachets Using a Design of Experiment. Jordan J. Pharm. Sci. 2023, 16, 148–162. [Google Scholar] [CrossRef]
  30. Reddy, B.P.K.; Reddy, Y.R. Validation and Stability Indicating RP-HPLC Method for the Determination of Sildenafil Citrate in Pharmaceutical Formulations and Human Plasma. E-J. Chem. 2008, 5, 1117–1122. [Google Scholar] [CrossRef]
  31. Kakumani, K.K.; Chimalakonda, K.R.; Yarram, R.K.R.; Khagga, M. A Validated Rapid Stability-Indicating Method for the Determination of Related Substances in Vardenafil Hydrochloride by Ultra-Performance Liquid Chromatography. Am. J. Anal. Chem. 2012, 03, 59–66. [Google Scholar] [CrossRef]
  32. Zhu, X.; Xiao, S.; Chen, B.; Zhang, F.; Yao, S.; Wan, Z.; Yang, D.; Han, H. Simultaneous Determination of Sildenafil, Vardenafil and Tadalafil as Forbidden Components in Natural Dietary Supplements for Male Sexual Potency by High-Performance Liquid Chromatography-Electrospray Ionization Mass Spectrometry. J. Chromatogr. A 2005, 1066, 89–95. [Google Scholar] [CrossRef]
  33. Öztürk Er, E.; Özbek, B.; Bakırdere, S. Accurate and Sensitive Determination of Sildenafil, Tadalafil, Vardenafil, and Avanafil in Illicit Erectile Dysfunction Medications and Human Urine by LC with Quadrupole-TOF-MS/MS and Their Behaviors in Simulated Gastric Conditions. J. Sep. Sci. 2019, 42, 475–483. [Google Scholar] [CrossRef] [PubMed]
  34. de Souza Madeira, C.R.; Millan Fachi, M.; Concentino, V.; de Fátima Cobre, A.; Leal Badaró Trindade, A.C.; Gonçalves, A.G.; Pontarolo, R. A Validated LC-MS/MS Assay for the Quantification of Phosphodiesterase-5 Inhibitors in Human Plasma. J. Chromatogr. B Anal. Technol. Biomed. Life Sci. 2021, 1179, 122829. [Google Scholar] [CrossRef] [PubMed]
Figure 1. Overlay of spiked chromatograms. (A) Response (in volts) versus retention time (in minutes) for all drugs were identified by overlaying spiked chromatograms of stock solutions of 480 µg/mL sildenafil, udenafil, avanafil, tadalafil, and 200 µg/mL vardenafil with equal dilutions, (B) spiked honey, there are no peaks visible in the spiked honey, and (C) spiked rat plasma.
Processes 11 03019 g001
Figure 2. Interference test for (A) placebo and (B) honey with no interactions between them and analytes.
Processes 11 03019 g002
Table 1. Linearity, slope, intercept, and regression factors for sildenafil, udenafil, avanafil, tadalafil, and vardenafil.
Linearity
SildenafilUdenafilAvanafilTadalafilVardenafil
Linearity range µg/mL9.6–14.49.6–14.49.6–14.49.6–14.42.4–3.6
Slope (absorbance/ µ g m L )1814.8912.391500.21727.21854.7
Intercept (mAU)−317.88−164.34−262.78−304.36−80.2
Regression coefficient (r2)0.99980.99980.99980.99980.9998
Table 2. LOD and LOQ values for sildenafil, udenafil, avanafil, tadalafil, and vardenafil.
Sensitivity
SildenafilUdenafilAvanafilTadalafilVardenafil
LOD (ng/mL)100330100100100
LOQ (ng/mL)290980250250250
Table 3. Recovery study for different tablets: accuracy of the optimized HPLC method.
Recovery
DrugAmount of the
Drug (mg)
Amount Found
Mean (n = 3) ± SD
% Recovery
Sildenafil9.69.64 ± 0.02199.53
1212.17 ± 0.16101.10
14.214.33 ± 0.1699.26
Mean:
%RSD:
100.03
0.54
Udenafil9.69.81 ± 0.059101.8
1212.13 ± 0.1499.7
14.214.36 ± 0.16100.23
Mean
%RSD
100.58
1.36
Avanafil9.69.73 ± 0.058101.7
1211.86 ± 0.05899.57
14.213.93 ± 0.37997.8
Mean:
%RSD:
99.69
1.108
Tadalafil9.69.13 ± 0.05895.77
1212.13 ± 0.058102.73
14.214.33 ± 0.152101.83
Mean:
%RSD:
100.11
1.76
Vardenafil2.42.33 ± 0.05696.33
32.93 ± 0.05897.2
3.63.47 ± 0.05696.43
Mean:
%RSD:
96.65
0.69
Table 4. A recovery study of honey confirmed the accuracy of the optimized HPLC method.
Recovery
DrugAmount of the
Drug (mg)
Amount Found
Mean (n = 3) ± SD
% Recovery
Sildenafil9.69.73 ± 0.01101.3
1212.01 ± 0.07100.4
14.214.25 ± 0.0198.96
Mean
%RSD
100.24
1.41
Udenafil9.69.91 ± 0.15100.07
1211.71 ± 0.3997.03
14.214.15 ± 0.2198.33
Mean
%RSD
98.47
1.69
Avanafil9.69.43 ± 0.1599.37
1212.2 ± 0.26103.27
14.214.57 ± 0.21103.46
Mean
%RSD
102.03
1.29
Tadalafil9.69.53 ± 0.306100.07
1211.57 ± 0.15397.00
14.213.97 ± 0.15399.37
Mean
%RSD
99.11
1.12
Vardenafil2.42.47 ± 0.058101.03
33.00 ± 0.0098.27
3.63.43 ± 0.058100.2
Mean
%RSD
99.83
2.14
Table 5. Summary of RSD for the robustness test.
ID for APIModified Organic SolventModified pHModified ColumnModified WavelengthModified Flow Rate
Sildenafil Assay0.06%0.12%0.32%0.32%0.15%
Vardenafil Assay0.46%0.15%0.60%0.59%0.06%
Udenafil Assay0.12%0.41%0.21%0.01%0.25%
Avanafil Assay0.55%0.55%0.10%0.10%0.30%
Tadalafil Assay0.15%0.15%0.15%0.44%0.10%
Table 6. Precision results for drugs using the optimized HPLC method.
DrugAmount of the
Drug (mg)
InterdayIntraday
% RSD% RSD
Sildenafil240.800.42
Udenafil240.560.54
Avanafil241.410.41
Tadalafil241.380.35
Vardenafil61.300.44
Table 7. Separation efficiency achieved by the HPLC-UV method.
SildenafilUdenafilAvanafilVardefanilTadalafil
Percentage Separation Efficiency
99.92%101.36%100.30%100.71%100.31%
Disclaimer/Publisher’s Note: The statements, opinions and data contained in all publications are solely those of the individual author(s) and contributor(s) and not of MDPI and/or the editor(s). MDPI and/or the editor(s) disclaim responsibility for any injury to people or property resulting from any ideas, methods, instructions or products referred to in the content.

