Article

Numerical Simulation of Fluidization Behavior and Chemical Performance for Hydrochlorination of Silicon Tetrachloride in a Fluidized Bed Reactor

1
Yunnan Key Laboratory of Metal-Organic Molecular Materials and Device, School of Chemistry and Chemical Engineering, Kunming University, Kunming 650214, China
2
Yunnan Chihong Resources Comprehensive Utilization Co., Ltd., Qujing 655001, China
3
Kunming Metallurgical Research Institute Co., Ltd., Kunming 650031, China
*
Authors to whom correspondence should be addressed.
Processes 2023, 11(10), 2979; https://doi.org/10.3390/pr11102979
Submission received: 30 August 2023 / Revised: 5 October 2023 / Accepted: 12 October 2023 / Published: 14 October 2023

Abstract

:
Exploring the fluidization behaviors and chemical performance in silicon tetrachloride (SiCl4) hydrochlorination processes within a fluidized bed reactor (FBR) poses significant challenges. In this study, we developed an Eulerian-granular model (EGM) by integrating the Eulerian–Eulerian two-fluid model with the kinetic theory of granular flow (KTGF). The effect of fluidization velocities on the flow regime, heat transfer, and chemical reaction performance were investigated. The applicability of the simulation method and the validity of the model were confirmed through comprehensive comparisons, including the simulated values of the maximum bed expansion height (Hmax) with theoretical values derived from empirical formulas and the simulated gas temperature profile with Hsu’s experimental data. The results indicate that the present EGM can be feasible to describe the variation of the flow regime within the FBR. An increase in bed voidage over time, coinciding with transitions in the flow regime, can be observed. Particularly noteworthy was the attainment of a more uniform distribution of SiCl4 under the bubbling fluidization state. Furthermore, the FBR possess high heat transfer characteristics, and the reaction gas can reach the set temperature of the bed after entering a small distance (about 10 mm). The presence of circulating bubbles within the FBR enhances the mixing uniformity of the SiCl4 reaction gas and silicon particles, particularly in the central and upper regions of the bed under the bubbling fluidization state. As a result, the predicted highest concentration of SiHCl3 was 13.08% and the conversion rate of SiCl4 was 28.97% under the bubbling fluidization state. Our results can provide a theoretical basis for further understanding of the hydrochlorination process of SiCl4 within the FBR.

1. Introduction

Polycrystalline silicon plays a crucial role as the primary raw material in the production of monocrystalline silicon substrates for semiconductor devices and as a substrate for solar cell manufacturing [1,2]. At present, the popular technique for producing polysilicon is the Siemens method [3], by which the high-purity polysilicon rods are prepared by chemical vapor deposition (CVD) of purified SiHCl3 and H2 in a Siemens reactor. The production process is well-established, stable, and consistently yields high-quality products [4]. However, it is worth noting that for every ton of polysilicon produced, approximately 15 to 20 tons of by-products, specifically silicon tetrachloride (SiCl4), are generated [5]. If SiCl4 is not effectively utilized, it not only represents a waste of silicon-rich chemical resources but also poses potential risks to human health and environmental quality [6,7]. Therefore, finding effective solutions for handling SiCl4 has emerged as a significant challenge in this field.
Nowadays, the most effective approach for managing SiCl4 involves the utilization of hydrogenation technology to transform SiCl4 into SiHCl3. This not only yields the desired SiHCl3 feedstock but also mitigates the risk of secondary pollution stemming from SiCl4. The central apparatus for SiCl4 hydrogenation [8] is the fluidized bed reactor (FBR), and the primary chemical reaction is depicted in Equation (1). Furthermore, the hydrochlorination process [9], which represents an optimized hydrogenation technology, introduces HCl as an additional reactant. This process offers notable advantages, including high conversion rates and low energy consumption [10]. The principal chemical reaction in hydrochlorination is illustrated in Equation (2). As such, it holds immense significance to investigate the structural stability of the FBR, ensure a uniform flow distribution, assess the heat transfer efficiency, and evaluate the chemical performance. These endeavors are essential for enhancing the hydrochlorination process and maximizing the conversion rate of SiCl4.
3 SiCl 4 + 2 H 2 + Si = 4 SiHCl 3
2 SiCl 4 + H 2 + Si + HCl = 3 SiHCl 3
To date, the research on the chemical reaction process of converting SiCl4 into SiHCl3 has mainly focused on the thermodynamics and kinetics of the FBR at a laboratory scale. Lee et al. [11] investigated the hydrogenation of SiCl4 to SiHCl3 using a carbon-based catalyst with the experimental method, and the results showed that the yield of SiHCl3 can be improved by retarding the reverse reaction rate of SiHCl3 and HCl. Jain et al. [12] studied the hydrochlorination of Si to produce SiHCl3 under experimental conditions of the FBR, and the reaction rate constants of the HCl reaction on the Si substrate were obtained. Becker et al. [13] employed a kinetic model to describe the hydrochlorination behavior of SiCl4, and the effects of the operation mode on the SiHCl3 yield were systemically analyzed. It is well known that the chemical reaction is also affected by transfer phenomena; thus, only focusing on the chemical thermodynamics and kinetics is insufficient.
Over the past few decades, many experimental and theoretical investigations of the gas–solid fluidization behavior in the FBR have been performed by researchers [14,15]. Shao et al. [16] systematically investigated the influences of temperature and pressure on the minimum fluidization velocity (Umf) under different particle size distributions. Their results indicated that the Umf decreased with increasing temperature and pressure for both the narrow and wide particle size distributions. Chein et al. [17] employed numerical simulations to examine the chemical performance of a combustion system in the traditional bubbling fluidized bed (BFB) and the BFB combined with internal particle circulation (ICBFB). The results showed that the ICBFB can increase the mixing time of reactants and enhance the chemical reaction performance. Pottimurthy et al. [18] constructed and analyzed 3D images of the mean solid volume fraction distribution in a slugging fluidized bed. The results demonstrated that three zones of bottom fluidization, gas slug, and solid slug co-existed in the bed, and the slugging fluidization velocity had a significant effect on the maximum length of the gas slug zone. Liu et al. [19,20] employed an Eulerian–Eulerian two-fluid model, coupled with population balance equations, to simulate the progression of silicon particle growth through the chemical vapor deposition of silane pyrolysis in a slugging fluidized bed reactor using FLUENT. The simulation of particle growth, which takes into account surface deposition, cluster scavenging, aggregation, and wall deposition, was conducted following the verification of the flow and heat transfer characteristics using widely accepted correlations. There have also been many other studies on fluidization characteristic parameters, including fluidization velocity [21,22], bed expansion height [23,24], solid volume fraction, and voidage [25,26], etc. Nevertheless, there have been limited numerical investigations into the fluidization behavior associated with SiCl4 hydrochlorination for the production of SiHCl3. Colomb et al. [27,28] developed a fluidized bed model based on the Kunii–Levenspiel fluidization framework, which can accurately predict the reaction performance of the hydrochlorination process. However, the effects of the fluidization behavior on the chemical reaction performance were ignored in the above-proposed model. Liu et al. [29] applied the computational fluid dynamics (CFD) method to investigate the influence of baffles on the hydrogenation process of SiCl4 in an FBR. Their results showed that the louver baffles can improve the reaction performance of SiCl4, and the predicted value of the conversion rate in the FBR with louver baffles was higher than that with channel baffles.
The aforementioned reports have made significant contributions to understanding the flow behaviors and heat transfer characteristics within the FBR. However, the previous studies have inadequately explored the fluidization behaviors specifically related to SiCl4 hydrochlorination processes within the FBR. Additionally, there has been limited investigation into the impact of fluidization behaviors on chemical reaction performance. Hence, in this study, we established an EGM using the CFD approach. We systematically analyzed the effects of fluidization velocities on the flow regimes, heat transfer, and chemical reaction performance. Our primary objective was to offer theoretical insights that can support the enhancement of FBR fluidization stability and the improvement of SiCl4 conversion rates.

2. Model Description

2.1. CFD Model

2.1.1. Eulerian-Granular Model

The Eulerian-granular model (EGM) was established by the Eulerian–Eulerian two-fluid model with the kinetic theory of granular flow (KTGF), which was employed to simulate the flow behaviors between the gas–solids in the FBR [30,31,32]. Considering the granular motion is primarily influenced by particle kinetic theory and direct collisions within the solid fluid, the detailed equations [33,34] of the EGM and KTGF are shown as follows.
The continuity equations are depicted in Equations (3) and (4), where the subscripts g and s represent the gas phase and solid phase, respectively; α is the volume fraction; the arrow represents the vector; ρ represents the density; and mgs and msg are the mass transfer of the interphase mass transfer from gas to solid and solid to gas, respectively.
𝜕 𝜕 t ( α g ρ g ) + ( α g ρ g v g ) = m gs
𝜕 𝜕 t ( α s ρ s ) + ( α s ρ s v s ) = m sg
The momentum equations are depicted in Equations (5)–(8), where the τ is shear stress; p represents the pressure drop; μ represents the viscosity; Kgs and Ksg are the interphase exchange coefficients; λs is solid bulk viscosity and I represents identity matrix.
𝜕 𝜕 t ( α g ρ g v g ) + ( α g ρ g v g v g ) = α g ρ g g + τ g α g p + K gs ( v s v g ) m gs v g
τ g = α g μ g ( v g + v g T )
𝜕 𝜕 t ( α s ρ s v s ) + ( α s ρ s v s v s ) = α s ρ s g + τ s α s p + K sg ( v g v s ) m sg v s
τ s = α s μ s ( v s + v s T ) + α s ( λ s 2 3 μ s ) v s I
The energy equations are depicted in Equations (9)–(11), where the subscript m represents the gas phase and solid phase, respectively; h is the specific enthalpy; Cp represents the heat capacity; k is the turbulence kinetic energy tensor; and T is the temperature.
𝜕 𝜕 t ( α m ρ m h m ) + ( α m ρ m v m h m ) = α m 𝜕 p m 𝜕 t + τ m v m q m ( Q gs + m gs h gs m sg h sg )
h m = T ref T C p , m d T
q m = α m k m T m
The solid pressure and radial distribution function are described in Equations (12) and (13), where Θs is the granular temperature; ess is the particle–particle restitution coefficient; and g0 is the radial distribution function.
P s = α s ρ s Θ s + 2 ρ s ( 1 + e ss ) α s 2 g 0 , ss Θ s
g 0 = [ 1 ( α s α s , max ) 1 / 3 ] 1
The solid shear stress, which includes the collisional viscosity, kinetic viscosity and frictional viscosity is shown in Equations (14)–(17), where μs, μs,col, μs,kin, and μs,fr represent the solid shear stresses, collisional viscosity, kinetic viscosity, and frictional viscosity, respectively; ds represents the diameter of the solid particles.
μ s = μ s , col + μ s , kin + μ s , fr
μ s , col = 4 5 α s ρ s d s g 0 , ss ( 1 + e ss ) Θ s π
μ s , kin = 10 ρ s d s Θ s π 96 α s ( 1 + e ss ) g 0 , ss [ 1 + 4 5 g 0 , ss α s ( 1 + e ss ) ] 2
μ s , fr = p s sin ϕ 2 I 2 D
The granular temperature is shown in Equation (18), the collision dissipation of energy is shown in Equation (19), and the transfer of the kinetic energy of random fluctuations is shown in Equation (20), where γ Θ s is the collisional dissipation of energy fluctuation; ϕ gs is the exchange energy between gas and solid.
0 = ( p s I + τ s ) v s γ Θ s + ϕ gs
γ Θ m = 12 ( 1 e 2 ss g 0 , ss ) d s π α 2 s ρ s Θ s 3 / 2
ϕ gs = 3 K gs Θ s

2.1.2. Turbulent Model

In this work, the RNG k-ε turbulent model and standard wall function were employed to solve the turbulent viscosity. The transient-state transport equations are expressed as follows: Equations (21)–(25), where k is the turbulent kinetic energy tensor, ε represents the turbulent dissipation rate, and Gk represents the generation of turbulence kinetic energy. C, C, Cν and Cμ are constants, and C = 1.44, C = 1.92, Cν = 100, and Cμ = 0.0845; μ represents the gas viscosity and μeff is the effective solid viscosity.
𝜕 𝜕 t ( ρ m k ) + 𝜕 𝜕 x i ( ρ m k v m ) = 𝜕 𝜕 x j [ α k μ eff 𝜕 k 𝜕 x j ] + G k , m ρ m ε
𝜕 𝜕 t ( ρ m ε ) + 𝜕 𝜕 x i ( ρ m ε v m ) = 𝜕 𝜕 x j [ α ε μ eff 𝜕 ε 𝜕 x j ] + C 1 ε ε k G k , m C 2 ε ρ m ε 2 k
d ( ρ 2 k ε μ ) = 1.72 v v 3 1 + C v d v
v = μ e f f μ , C v 100
μ t = ρ C μ k 2 ε , C μ = 0.0845

2.1.3. Drag Model

For this case, the interphase exchange coefficient (Kgs) was described by the empirical drag model proposed by Gidaspow et al. [35], as defined by Equations (26)–(28). Here, CD signifies the drag coefficient of individual spherical particles; Res denotes the Reynolds number of the solid particles.
K gs = 3 4 C D α s α g ρ g | v g v s | d s α g - 2 . 65 ,   α g > 0.8
C D = 24 α g R e s [ 1 + 0.15 ( α g R e s ) 0.687 ]
K gs = 150 α s ( 1 α g ) μ g α g d 2 s + 1.75 α s ρ g | v g v s | d s ,   α g 0.8

2.1.4. Heat Transfer Model

Assuming that the wall radiation was shielded by the erratic movement of particles and that the heating wall remained adiabatic, the heat transfer coefficient (hw) for the wall-to-bed was determined using the following Equation (29), where the heat flux, q, was derived from a simulation, and Tw and Tf represent the temperature of the wall and fluid, respectively.
h w = q T w T f = q 1 H 0 H Δ T d h
For the gas–solid heat transfer, the heat transfer coefficient (hgs) was calculated by the Ranz–Marshall [36] and Guun [37] models. The Ranz–Marshall model equations were given as follows (Equations (30) and (31), respectively). The detailed Guun’s model is expressed as follows (Equations (32)–(35)). In those equations, Nus is the Nusselt number of the solid phase; Pr is the Prandtl number of the gas phase; kg and ks represent the gas and solid thermal conductivity, respectively, and Cp is the heat capacity.
h gs = k s N u s d s
N u s = 2.0 + 0.6 R e s 0 . 5 P r 1 / 3
h gs = 6 k g α s α g N u s d s 2
N u s = ( 7 10 α g + 5 α g 2 ) ( 1 + 0.7 R e s 0 . 2 P r 1 / 3 ) + ( 1.33 2.4 α g + 1.2 α g 2 ) R e s 0 . 7 P r 1 / 3
P r = C p g μ g k g
R e s = ρ g | v g v s | d s μ

2.1.5. Species Transport Model

The mass transport behavior of the reactants within the FBR was solved using the species transport model, which is written as Equation (36), where the subscript n is the species; Yn represents the fraction of each species; Jn represents the mass diffusion; Rn represents the net rate at which a chemical reaction produces a substance; and Sn is the source term.
𝜕 𝜕 t ( ρ Y n ) + ( ρ v Y n ) = J n + R n + S n

2.2. Chemical Reaction Kinetic Model

Finally, the kinetic model of Liu et al. [29] was coupled with the EGM model in our simulation. The chemical reaction rate of the hydrogenation (Rc1) and the hydrochlorination (Rc2) of SiCl4 can be expressed by Equations (37)–(40), respectively, where k0 is the apparent rate constant. The corresponding reaction kinetic parameters are shown in Table 1.
Hydrogenation :   R c 1 = k 0 p SiCl 4 p H 2 ( 1 p SiHCl 3 4 / 3 K p p SiCl 4 p H 2 2 / 3 ) 1 + K 1 p SiCl 4 + P SiHCl 3 1 / 3 P H 2 1 / 3 K 2
Hydrochlorination :   R c 2 = k 0 p SiCl 4 p H 2 p HCl ( 1 p SiHCl 3 2 / 3 K p p SiCl 4 p H 2 1 / 2 p HCl 1 / 2 ) 1 + K 1 p SiCl 4 + P SiHCl 3 1 / 2 P H 2 1 / 2 P HCl 1 / 2 K 2
k 0 = A exp [ E R ( 1 T r 1 T ) ]
K n = K n , 0 exp [ Δ H n R ( 1 T r 1 T ) ] , n = p , 1 , 2

2.3. Numerical Solution Algorithms

In this work, the simulation was carried out in commercial code ANSYS FLUENT 14.5. The computational domain was discretized using a structured mesh of 20,000 grids via the pre-processing module ANSYS Mesh 14.5. All the governing equations were solved using the SIMPLE algorithm, which was used for pressure–velocity coupling and correlation. The first-order upwind scheme was applied for the spatial discretization of the variables. Moreover, the inlet was defined as the velocity inlet and the outlet was the pressure outlet. On the wall, a non-slip boundary condition was set for the gaseous and solid phases. The basic parameter settings and boundary conditions in the present simulations are shown in Table 2 and Table 3.

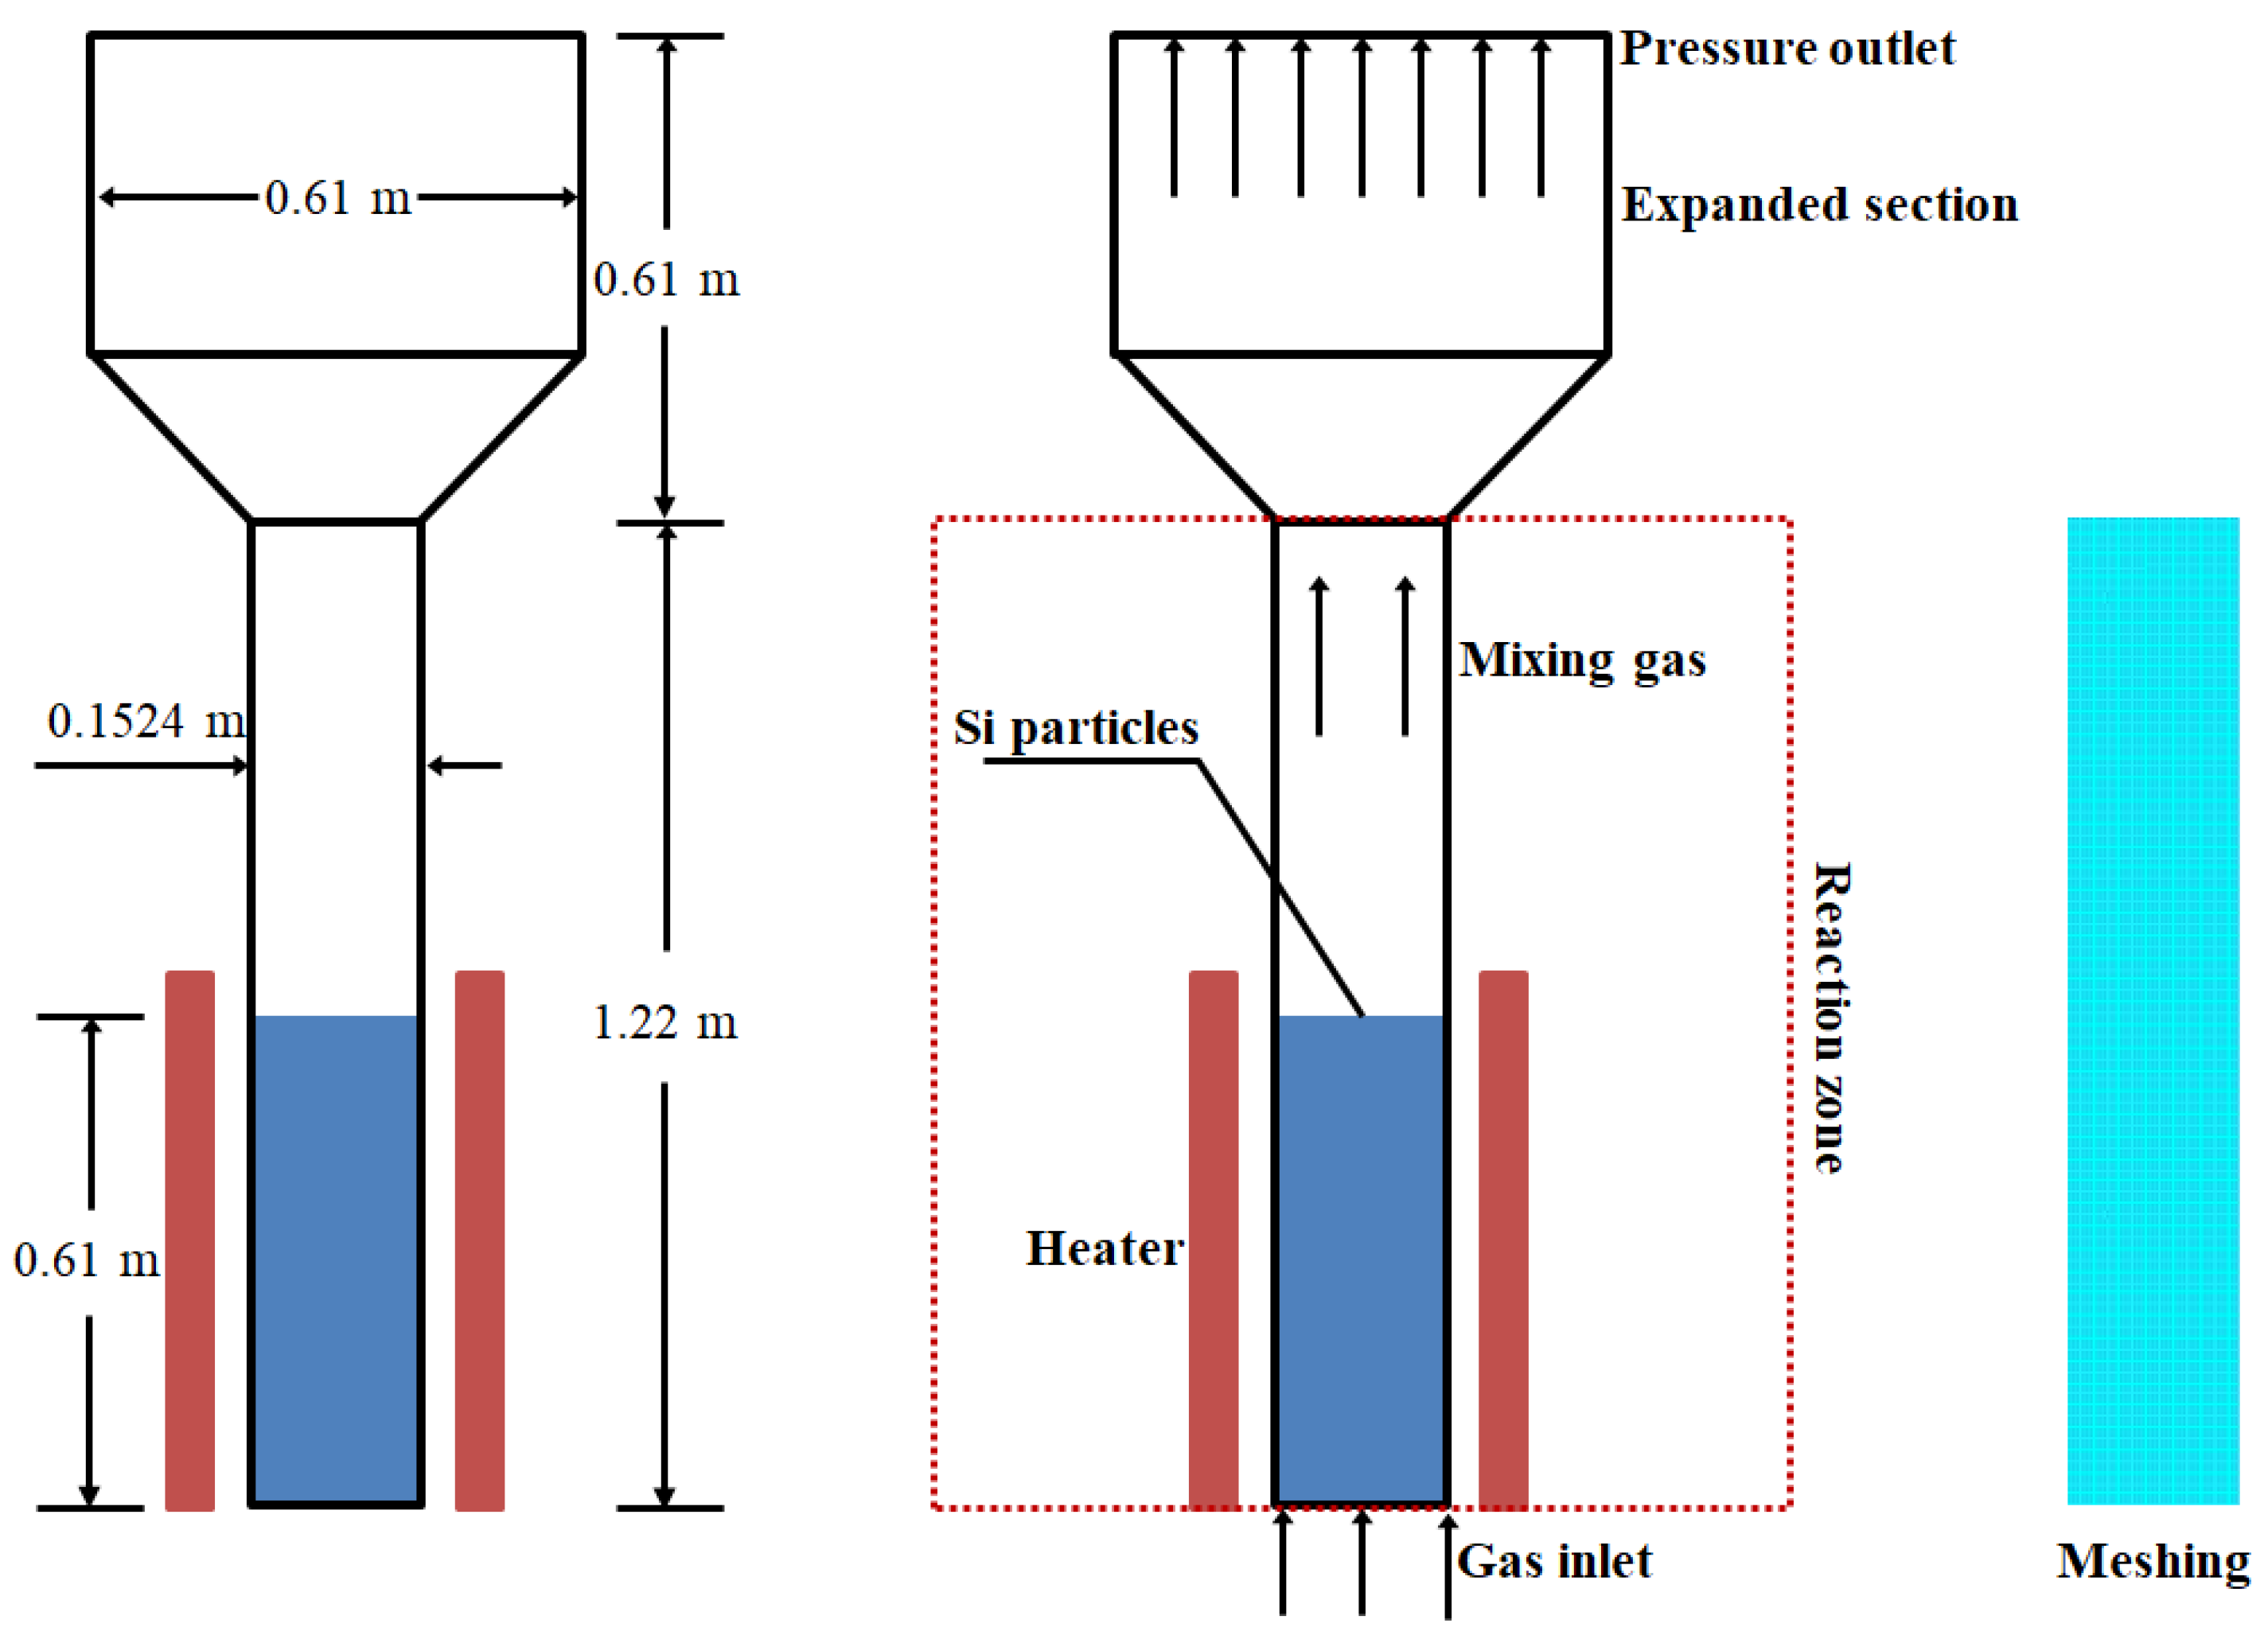
2.4. Geometrical Configuration

In this study, the simulation focused on the FBR prototype as described in reference [38]. The experimental setup primarily consisted of a conveying and metering system, a fluidized bed body, and a pressure signal acquisition system. The schematic representation of the geometric model and meshing can be seen in Figure 1, and the essential parameters for the geometric configuration are detailed in Table 2. The FBR stands at a height of 1.22 m, with a fluidization zone diameter of 0.1524 m. The reaction gases, including SiCl4, H2, and HCl, are introduced from the bottom into the FBR, where silicon particles are fluidized, and the exhaust gases exit from the FBR. To optimize the computational efficiency, we simplified the cylindrical reaction zone into a two-dimensional model and employed a quadrilateral meshing approach [19].

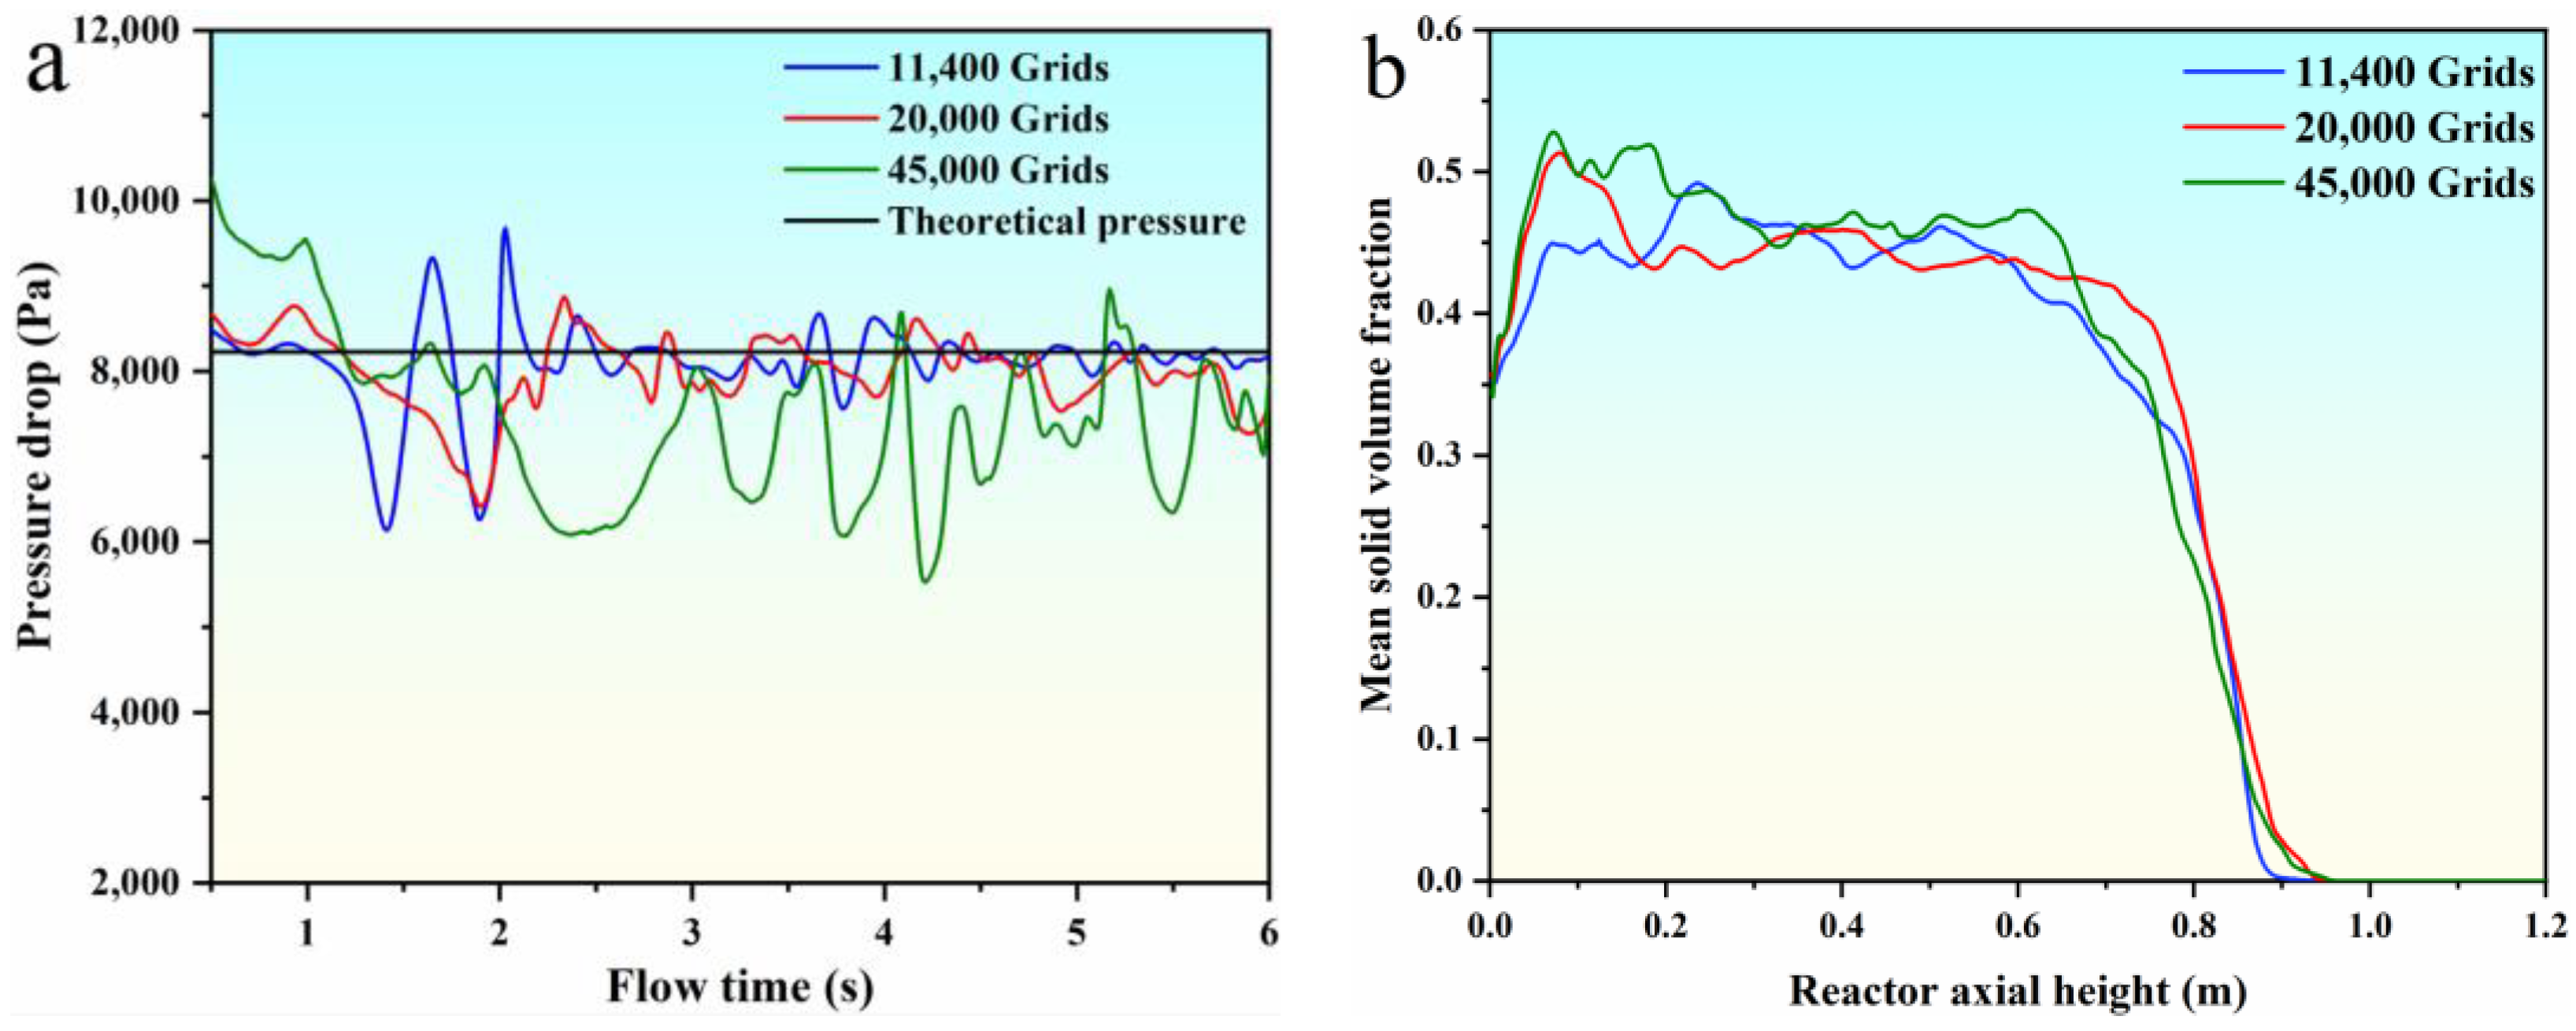
2.5. Grid Independence Verification

The computational domain was meshed three times to verify the independence of the grids. The total elements present in the first, second, and third mesh are 11,400, 20,000, and 45,000, respectively. The pressure drop and mean solid volume fraction for all three meshes are shown in Figure 2. Figure 2 shows that the bed pressure drop oscillates in a certain range with the flow time, and the trend of the mean solid volume fraction is basically the same. The second mesh is adequate to predicate the parameters of the bed pressure drop and mean solid volume fraction. Hence, we adopted the mesh of 20,000 elements in the subsequent analysis.

3. Results and Discussion

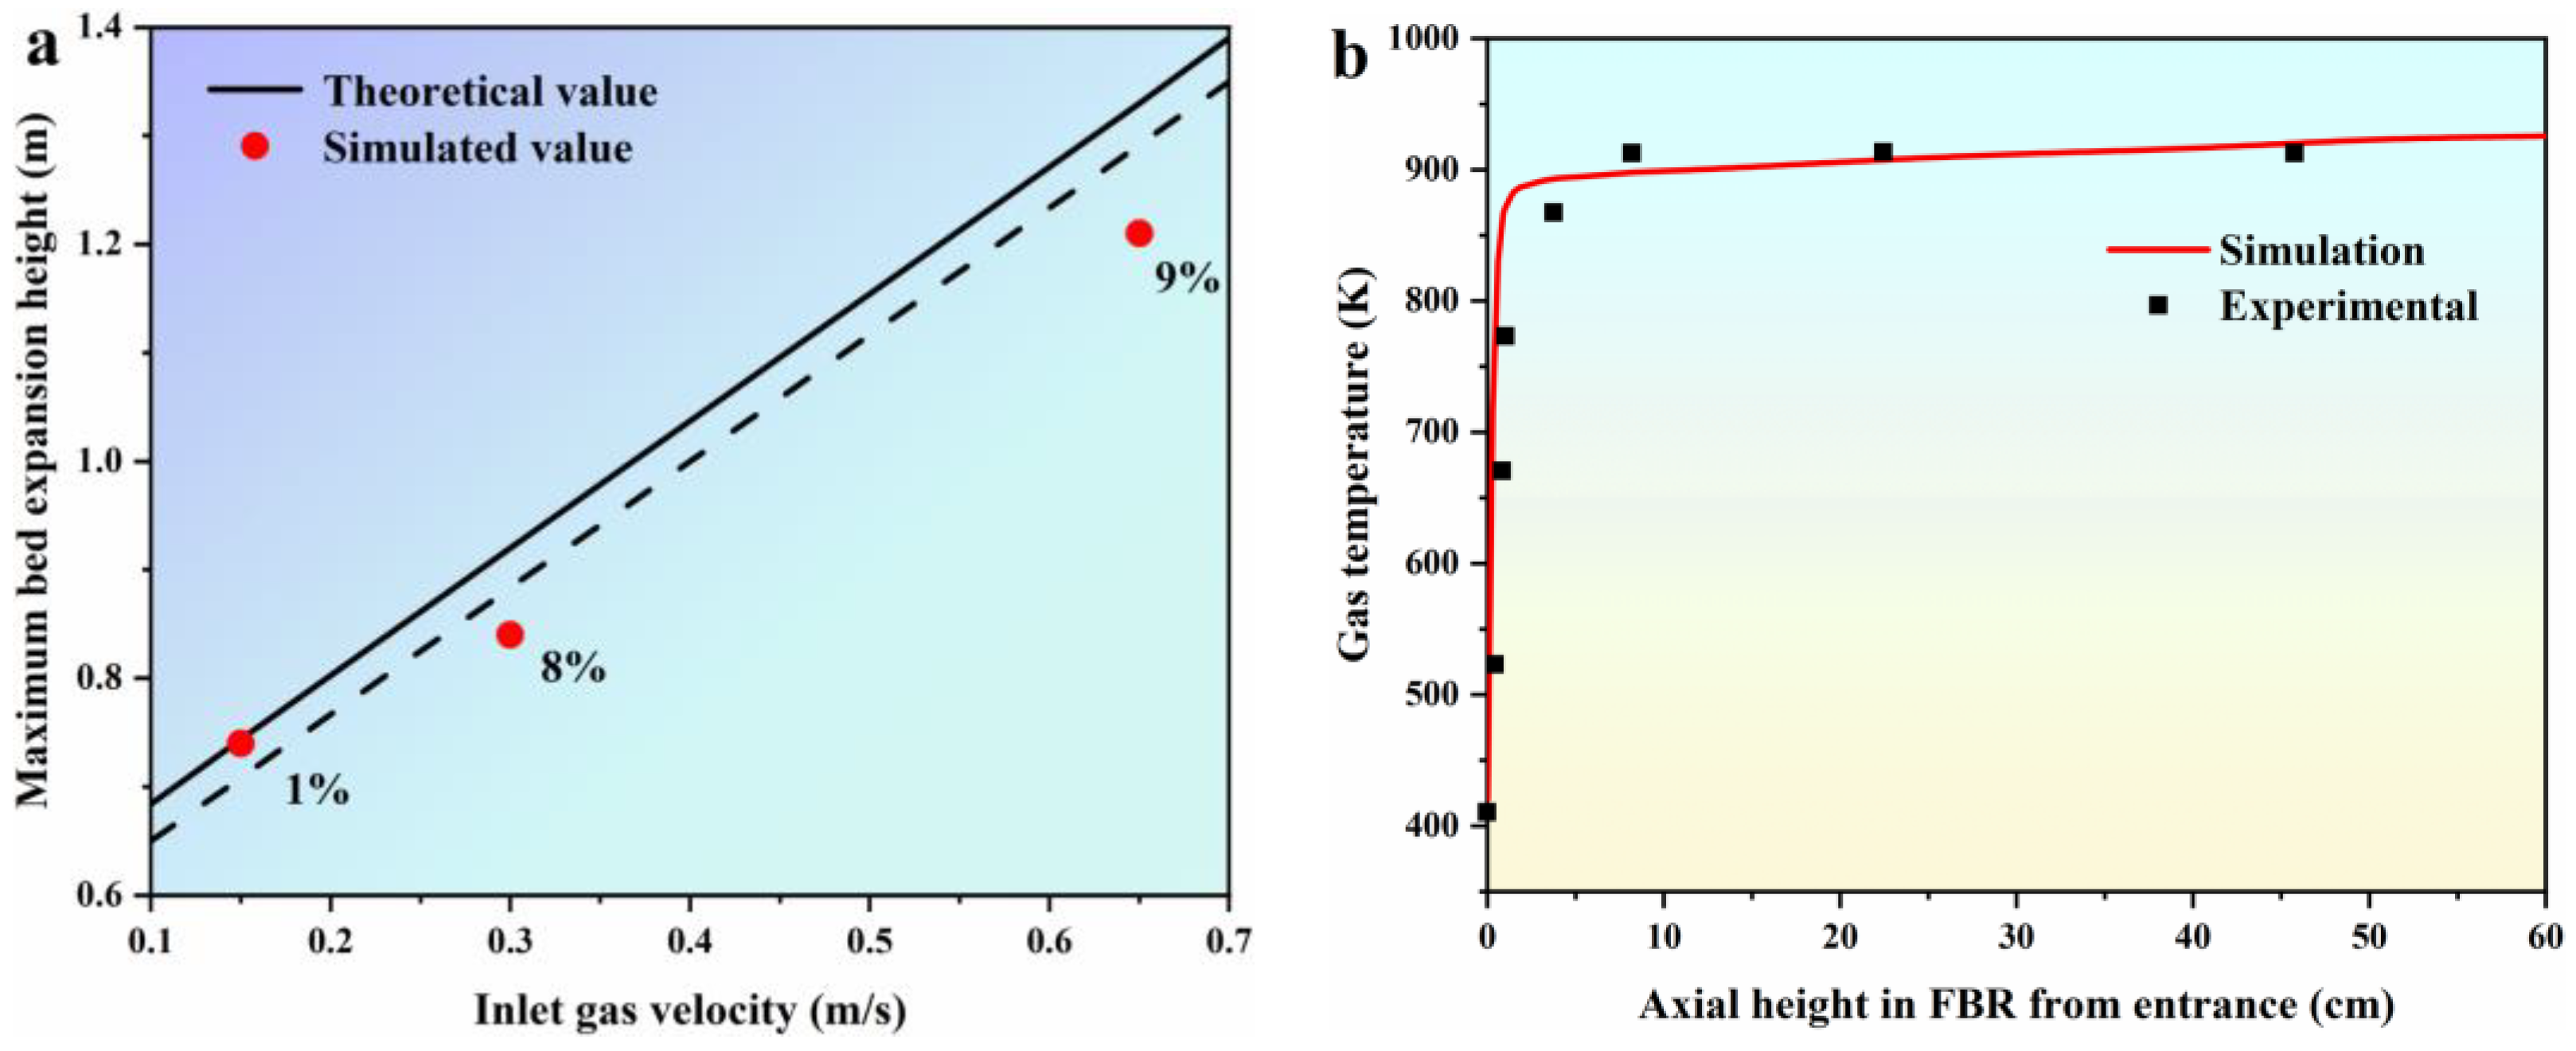
3.1. Model Validation

In this section, we validate the EGM by comparing simulated values of the maximum bed expansion height (Hmax) at various inlet gas velocities with theoretical values obtained from empirical formulas, as illustrated in Figure 3a. The empirical formulas used for comparison are listed in Table 4, and they are sourced from references [39,40]. In these formulas, Umf, Umb, and Ums represent the minimum fluidizing velocity, the minimum bubbling velocity, and the minimum slugging velocity, respectively. Hmf refers to the bed height at minimum fluidization, while Hmax represents the maximum bed expansion height. Remf corresponds to the Reynolds number at minimum fluidization, and αmf denotes the bed voidage at minimum fluidization. Figure 3a demonstrates that the simulated values of Hmax predicted by the EGM exhibit a linear increase with increasing inlet gas velocities. When the inlet gas velocities are set at 0.15 m/s, 0.30 m/s, and 0.65 m/s, the discrepancies in the Hmax between the simulated and theoretical values from the empirical formulas are 1%, 8%, and 9%, respectively. These results indicate that the predicted values from the EGM align well with the theoretical values derived from the empirical formulas. Moving on to Figure 3b, we present a comparison between the simulated and experimental gas temperature profiles within the FBR from the entrance. In accordance with the experimental parameters established by Hsu [38], the inlet temperature is maintained at 300 K, the wall temperature is set to 923 K, and the gas is uniformly introduced into the FBR at an inlet gas velocity of U/Umf = 5. As depicted in Figure 3b, the simulated gas temperature profile shows a rapid increase from 400 K to approximately 910 K, which closely matches the experimental data. This successful alignment between the simulated and experimental results suggests that the proposed EGM is a viable model for describing the fluidization behavior at various stages within the FBR.

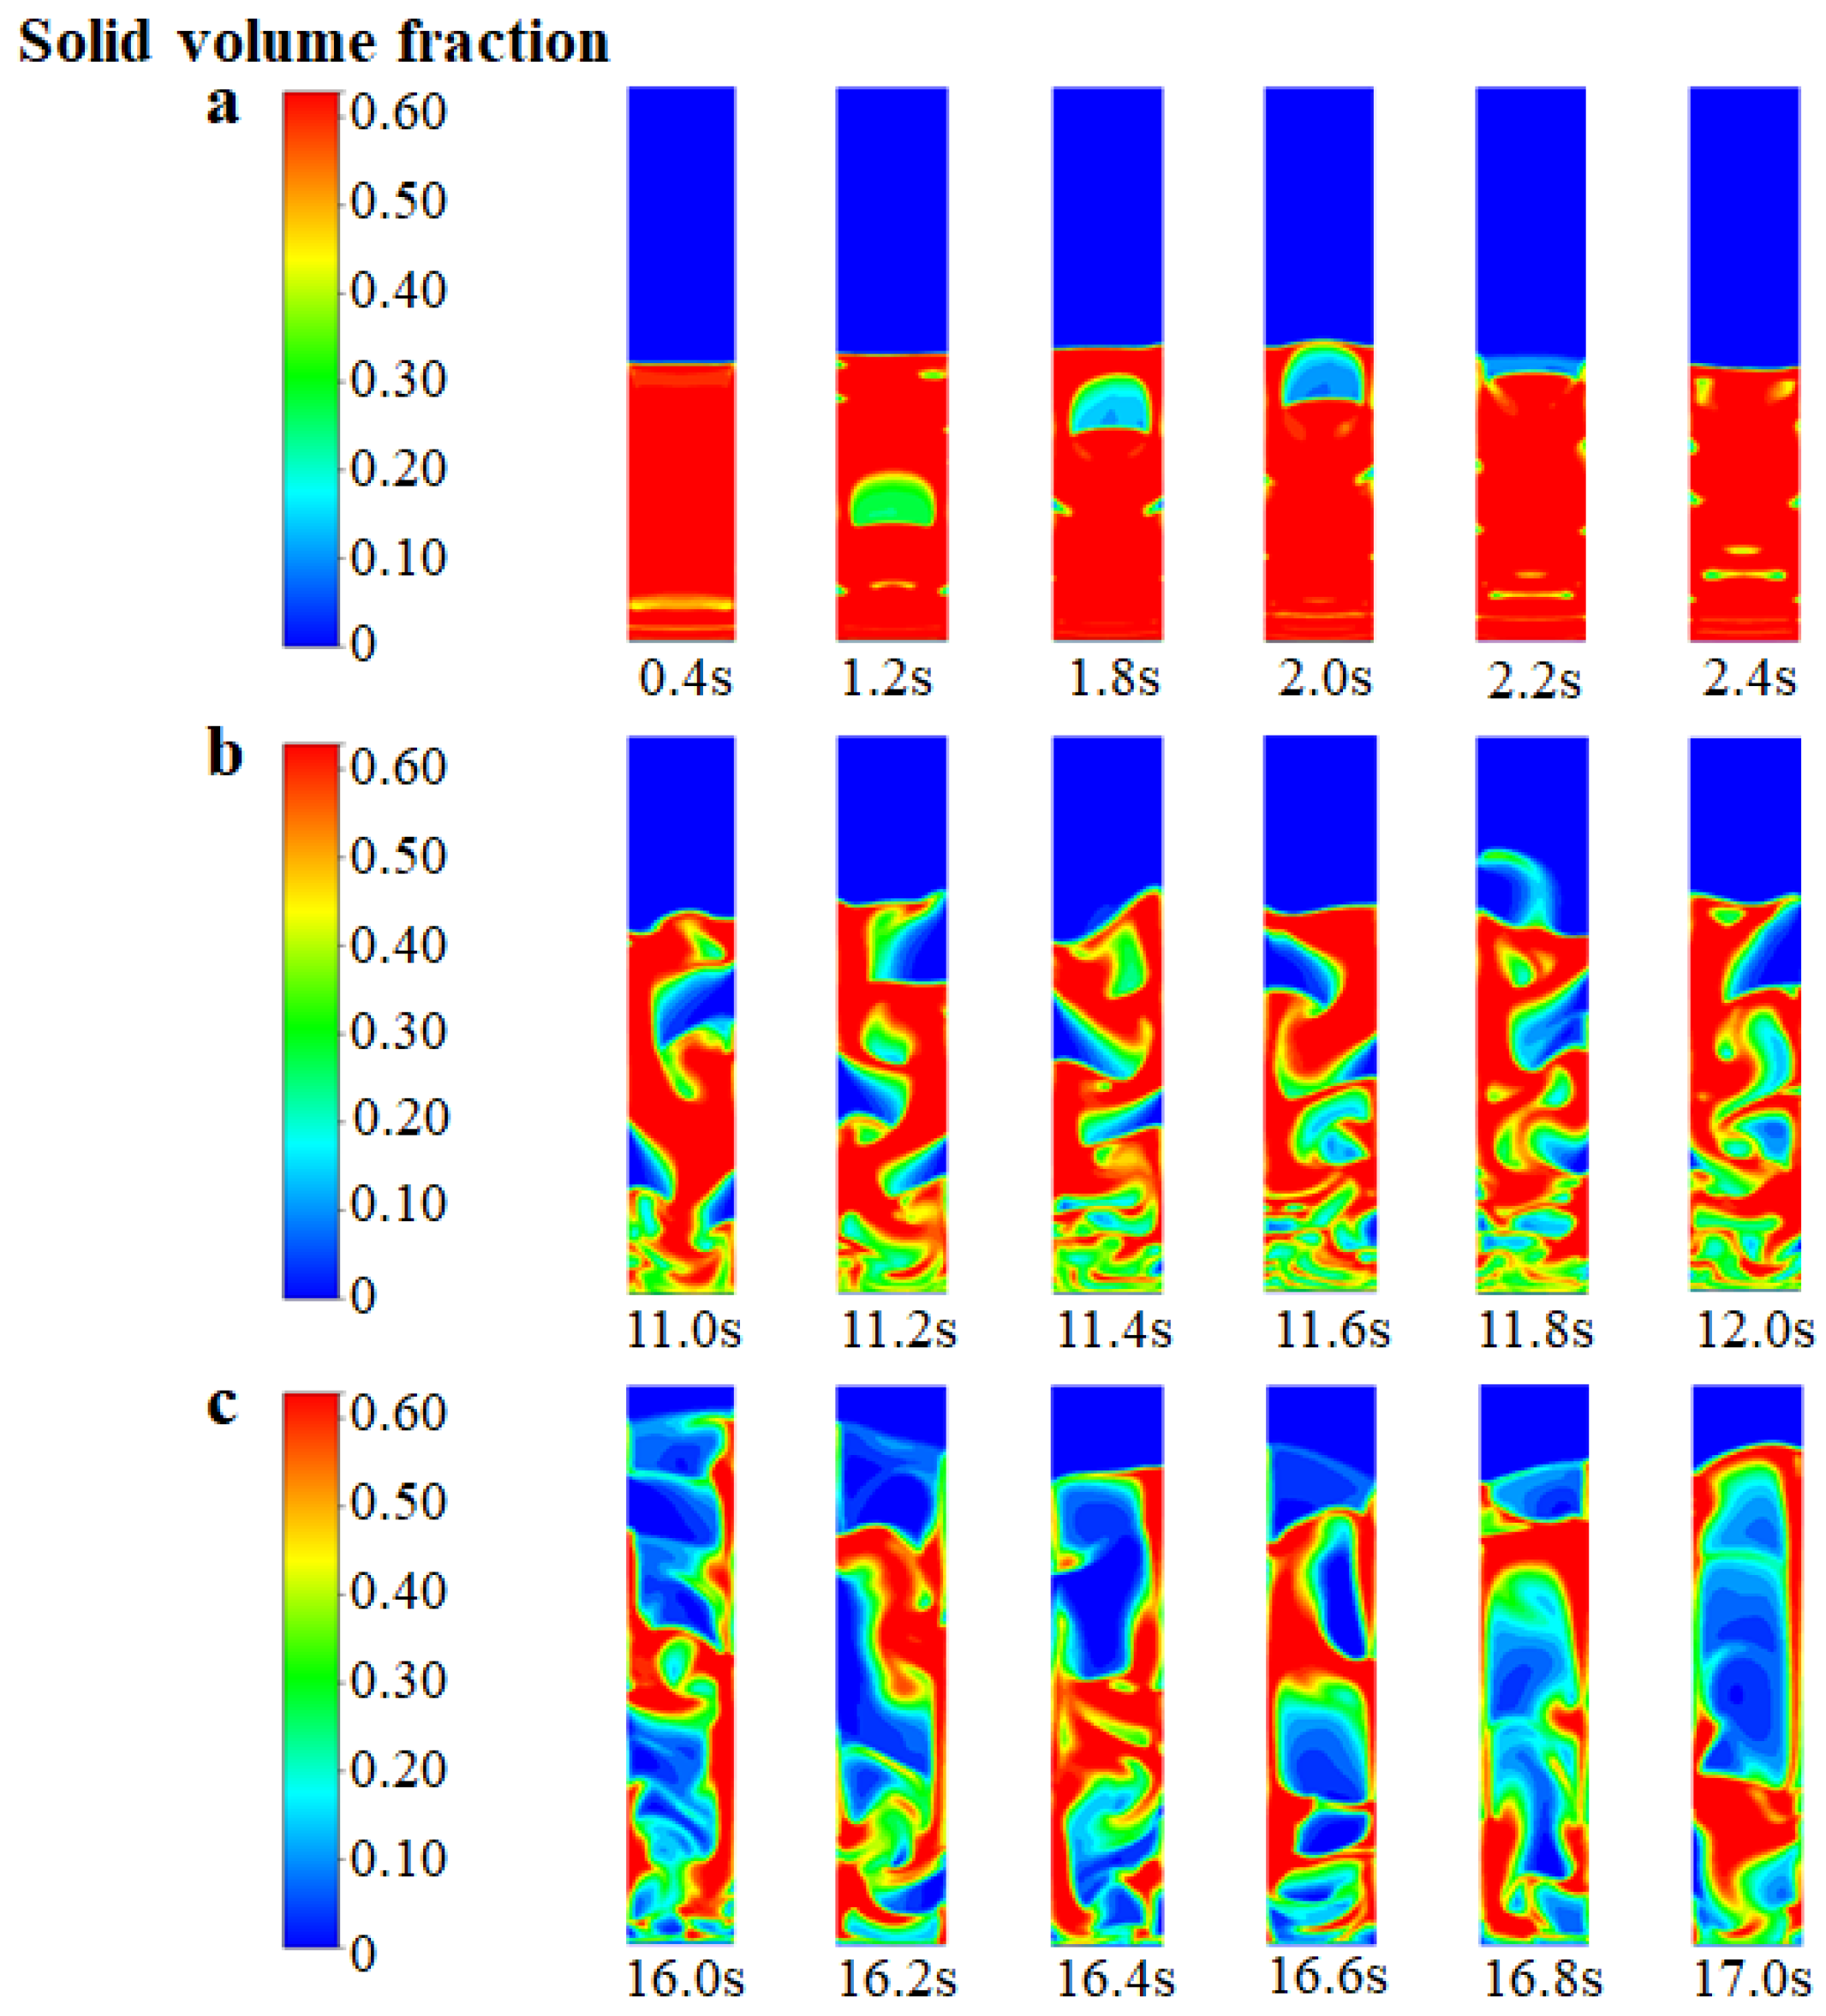
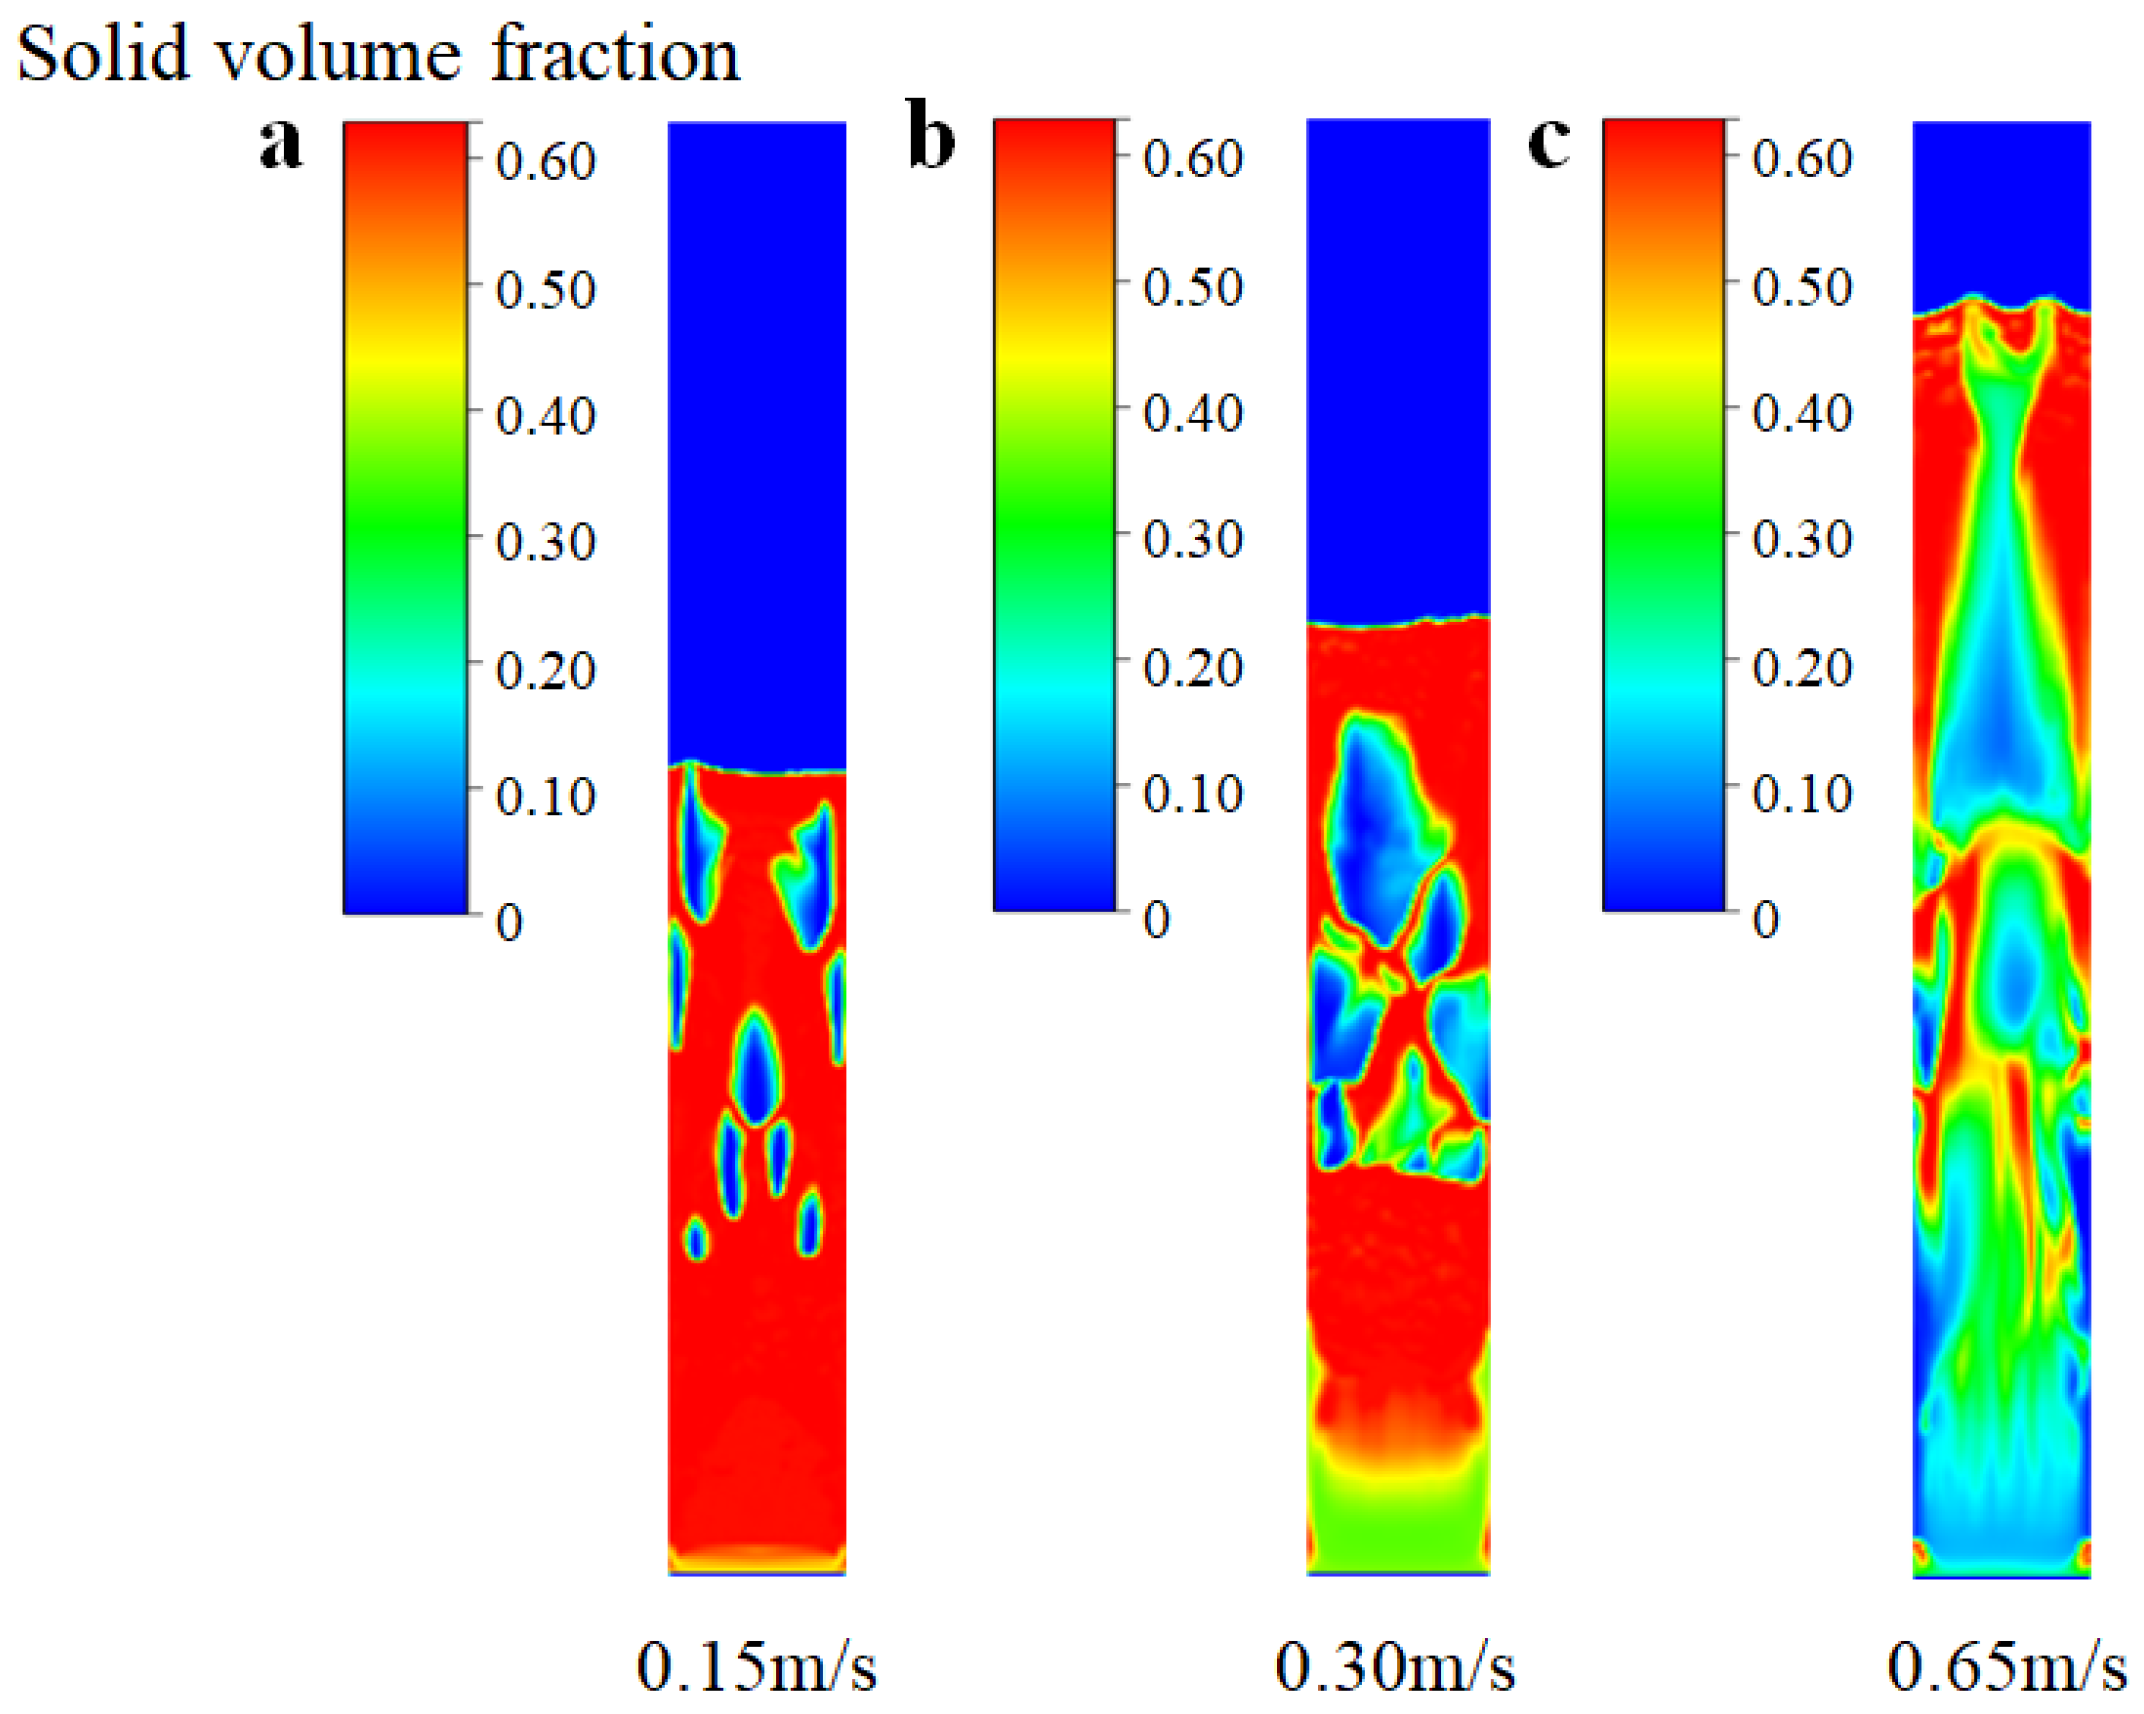
3.2. Flow Pattern and Regime

In Figure 4, the instantaneous solid volume fraction is depicted at various inlet gas velocities. It is important to note that, in this particular analysis, we have not considered chemical reactions and have focused solely on the fluidized bed behavior. It can be seen from Figure 4a that when the inlet gas velocity is 0.15 m/s (which is close to the theoretical initial fluidizing velocity, Umf, of 0.13 m/s), the bed gradually forms a single “bubble” in the center from the state of static and fixed. The bubble gradually rises to the top of the bed and then disappears. After slight expansion, the top of the bed gradually falls back to a certain stable height. When the inlet gas velocity increases to 0.30 m/s (which is close to the theoretical initial bubbling velocity, Umb, of 0.26 m/s), as shown in Figure 4b, the movement of the particle phase tends to be disordered. Small and dense bubbles are generated at the bottom of the bed, and semi-circular bubbles are generated near the wall region. The diameter of the bubbles exceeds about 0.6 times the bed diameter, which indicates that the flow pattern of the FBR is close to the state of bubbling. When the inlet gas velocity reaches 0.65 m/s (which is close to the theoretical initial slugging velocity, Ums, of 0.69 m/s), as shown in Figure 4c, the solid particles flow more intensely and the bubbles disappear at the bottom of the bed. The formation of bubble cutoff layers in the middle of the bed indicates the flow pattern transition to a typical slugging regime. From the detailed analysis above, the developed EGM can be feasible to describe the variation of the flow regime.
Figure 5 illustrates the variation of the bed voidage with the flow time at different inlet gas velocities. It can be seen that the bed voidage increases from 0.40 to 0.60 within the range of the flow time from 0 to 1 s at an inlet gas velocity of 0.15 m/s. At the range of flow time from 1 s to 7 s, the fluctuation in the bed voidage nears the value of 0.60. At this stage, due to the effect of the single “bubble” in the center of the bed (as seen in Figure 4a), the fluidization behavior of the bed is not obvious, but the particle layer has begun to become loose. When the inlet gas velocity reaches 0.30 m/s, the entire bed transitions to the state of bubbling (as seen in Figure 4b), and the movement of the particle phase is obviously affected by the bubble fluctuation. The voidage of the bed increases with the aggregation of the bubble and decreases with the breakage of the bubble. When the inlet gas velocity increases to 0.65 m/s, the entire bed transitions to the state of slugging (as shown in Figure 4c), and the aggregation and breakage of the bubbles become more frequent. Due to the appearance of the bubble cutoff layers within the bed, the voidage of the bed increases rapidly to about 0.70 and then oscillates with the serious fluctuation of the bubbles. Therefore, owing to the transition of the flow pattern and regime, the predicated bed voidage varies with the flow time at different inlet gas velocities.
Figure 6 depicts the distribution of the mean mass fraction of SiCl4 at different inlet gas velocities. When the inlet gas velocity is 0.15 m/s, there is no obvious fluidization of the bed because the drag force of the gas rising is only slightly greater than the particle gravity; thus, SiCl4 is mainly distributed in the middle and lower part of the bed. The entire bed transitions to the bubble stage when the inlet gas velocity increases to 0.30 m/s, and the bubble fluctuations effectively promote the mixing of gas and solid particles. Therefore, SiCl4 is distributed throughout the bed uniformly. However, when the gas velocity is further promoted to 0.65 m/s, SiCl4 gas flows out of the bed with the solid particles owing to the slugging of the bubbles. This outcome results in less SiCl4 distribution in the upper part of the bed. Therefore, it can be concluded that the SiCl4 distribution is more even when the entire bed transitions to the bubbling stage.

3.3. Heat Transfer Characteristics

In this work, two different heat transfer models, namely Guun’s model and the Ranz–Marshall model, were considered to predict the gas–solid heat transfer coefficient. Figure 7 shows a simulated axial distribution of the gas–solid heat transfer coefficients and solid Reynolds number under a transient state. One can see that the axial variation trend of the gas–solid heat transfer coefficient predicted by the two models is consistent with the variation of the solid’s Reynolds number. This outcome demonstrates that the heat transfer between the gas and solids is related to the relative velocity of the two fluids, and the greater the drag force interphase, the higher the heat transfer efficiency. Moreover, the heat transfer coefficient simulated by Guun’s model is higher than that predicted by the Ranz–Marshall model because the Ranz–Marshall model is established for a single sphere particle and underestimates the degree of interphase heat transfer in a dense fluidization system.
Figure 8 displays the axial gas temperature profiles in the FBR from the entrance. It can be seen that when the axial height of the inlet region is Z = 0.05 cm, the average temperature value of the bed section is 369 K, which is close to the set value of the inlet temperature. When the axial height of the bed is Z = 0.2 cm, the average temperature value is 548 K. When the bed axial height is Z = 1 cm, the average temperature rapidly increases to 670 K, which is close to the set value of the FBR’s wall temperature. Our results indicate that the bed quickly reaches the wall temperature of the FBR through a small axial height of 10 mm, and the high heat transfer characteristics of the FBR will facilitate the hydrochlorination reaction performance within the bed.

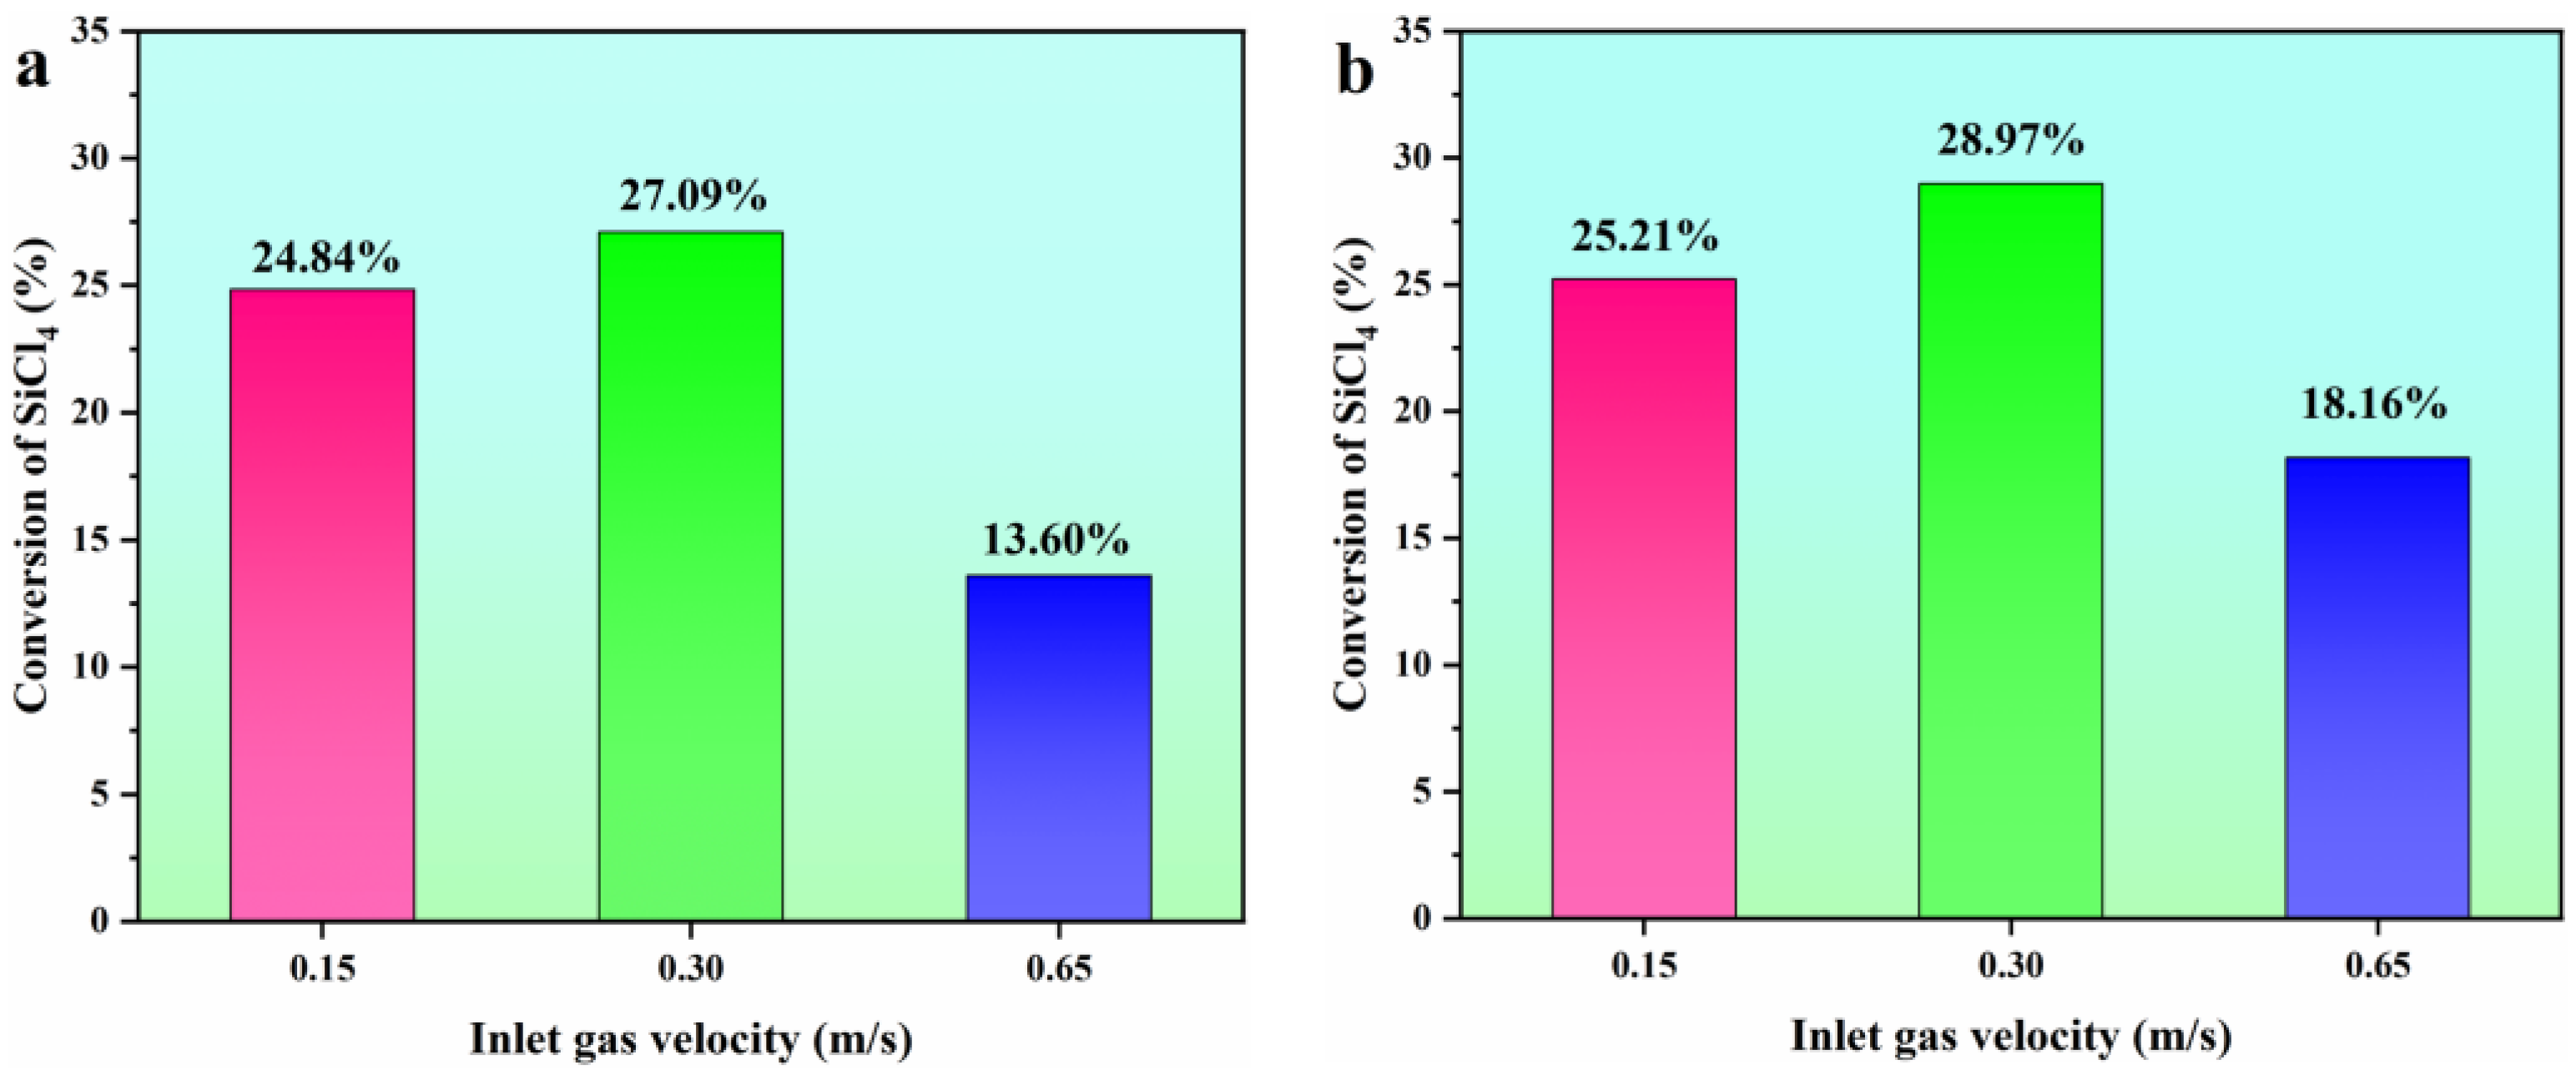
3.4. Chemical Reaction Performance

In this section, the kinetic model of SiCl4 hydrochlorination was coupled with the corresponding CFD model to explore the chemical reaction performance. Figure 9 shows the solid volume fraction of the bed during the hydrochlorination process at different inlet gas velocities. Notably, in this scenario, we introduce a comprehensive coupling of the flow field, heat transfer, and chemical reactions. It can be seen from Figure 9a that when the inlet gas velocity is 0.15 m/s, only a single small bubble is generated in the bed, and there is no significant fluctuation in the whole bed, indicating that the SiCl4 hydrochlorination reaction at this stage mainly occurs in the middle and lower parts of the bed. When the gas velocity at the inlet reaches 0.30 m/s, there is an increase in the expansion height of the bed, leading to a transition of the bed into the bubbling stage. The presence of circulating bubbles within the FBR enhances the mixing uniformity of the SiCl4 reaction gas and silicon particles, particularly in the central and upper regions of the bed under the bubbling fluidization state. When the gas velocity at the inlet further increases to 0.65 m/s, due to the high gas speed, the particles are easy to fluidize, and the particles are quickly brought into the top of the bed and blown out of the bed. In the slugging stage, the voidage of the bed increases due to the aggregation of large bubbles, which prevents the contact of gas–solid and, thus, affects the reaction performance of the hydrochlorination process.
Figure 10 further provides the mass fraction distribution of the SiHCl3 products obtained from SiCl4 hydrochlorination at different inlet gas velocities. One can see that when the inlet gas velocity is 0.15 m/s, the product, SiHCl3, is mainly distributed in the middle and lower parts of the bed due to the entire bed at the minimum fluidization (as shown in Figure 9a), and the average mass fraction of SiHCl3 is predicted to be 8.21%. When the inlet gas velocity is 0.30 m/s, the entire bed is in the bubbling stage (as shown in Figure 9b), and the product, SiHCl3, is mainly distributed in the middle and upper regions of the bed. Due to the good mixing of the gas–solid phase, the SiCl4 hydrochlorination reaction process is promoted; thus, the average mass fraction of SiHCl3 obtained is the highest, which is 13.08%. When the inlet gas velocity is 0.65 m/s, the entire bed is in the slugging stage (as shown in Figure 9c), and the reactant of SiCl4 quickly reaches the top of the bed. Owing to the short gas residence time, the hydrochlorination of SiCl4 is insufficient; therefore, the average mass fraction of SiHCl3 decreases to 10.07%.
The conversion rate of the SiCl4 hydrogenation process (Equation (1)) and the hydrochlorination process (Equation (2)) at different inlet gas velocities was further studied, as shown in Figure 11. One can see that when the FBR is in the bubbling stage, the gas-solid phase exhibits excellent mixing. Consequently, this leads to the highest conversion rate of SiCl4. By incorporating HCl into the hydrogenation process of SiCl4, the chemical performance can be further enhanced, as noted in references [27,28]. This enhancement results in a predicted SiCl4 conversion rate of 28.97% when the reactor is in the bubbling fluidization state.

4. Conclusions

In this study, the fluidization behavior and chemical performance for the hydrochlorination of SiCl4 within the FBR were examined using the EGM. The effect of the fluidization velocities on the flow regime, heat transfer, and chemical reaction performance was studied. The detailed results are as follows:
  • The established EGM can reasonably describe the variation of the flow regime for the hydrochlorination of SiCl4 within the FBR. The effectiveness of the simulation method and the accuracy of the model were validated through comprehensive comparisons, encompassing a simulated Hmax in comparison to theoretical values obtained from empirical formulas and a comparison of the simulated gas temperature profile with data from Hsu’s experiments.
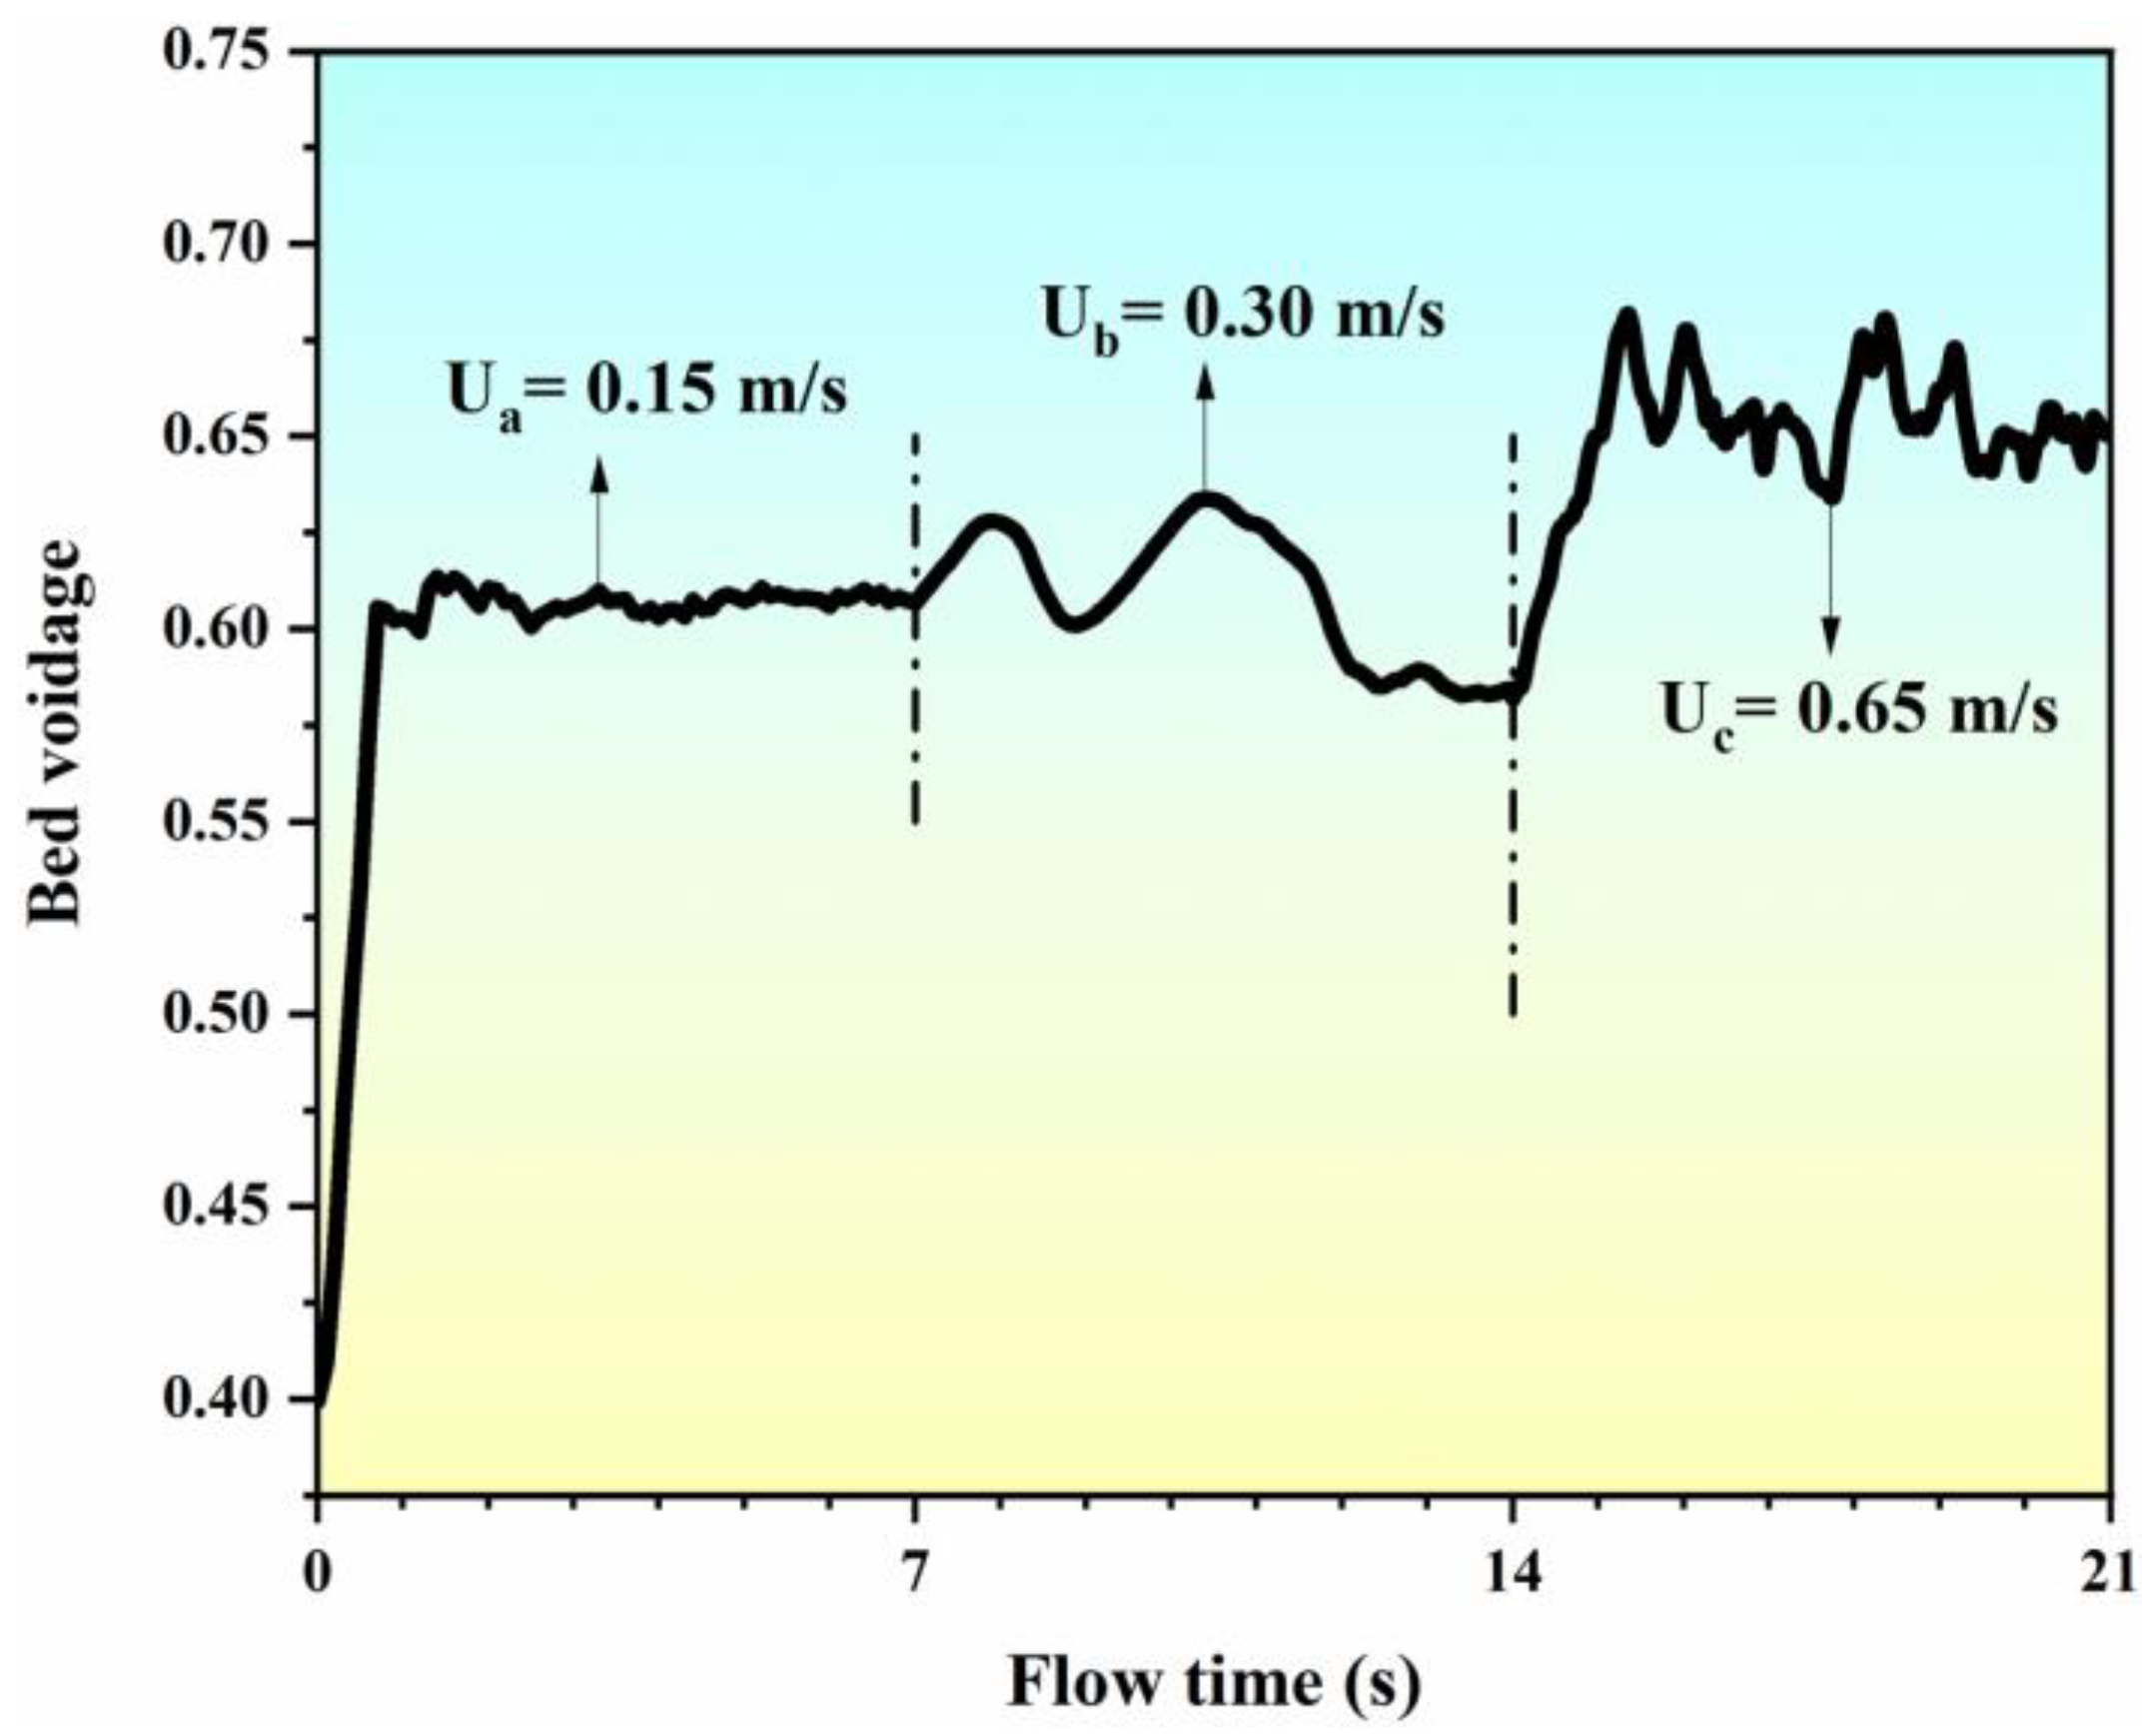
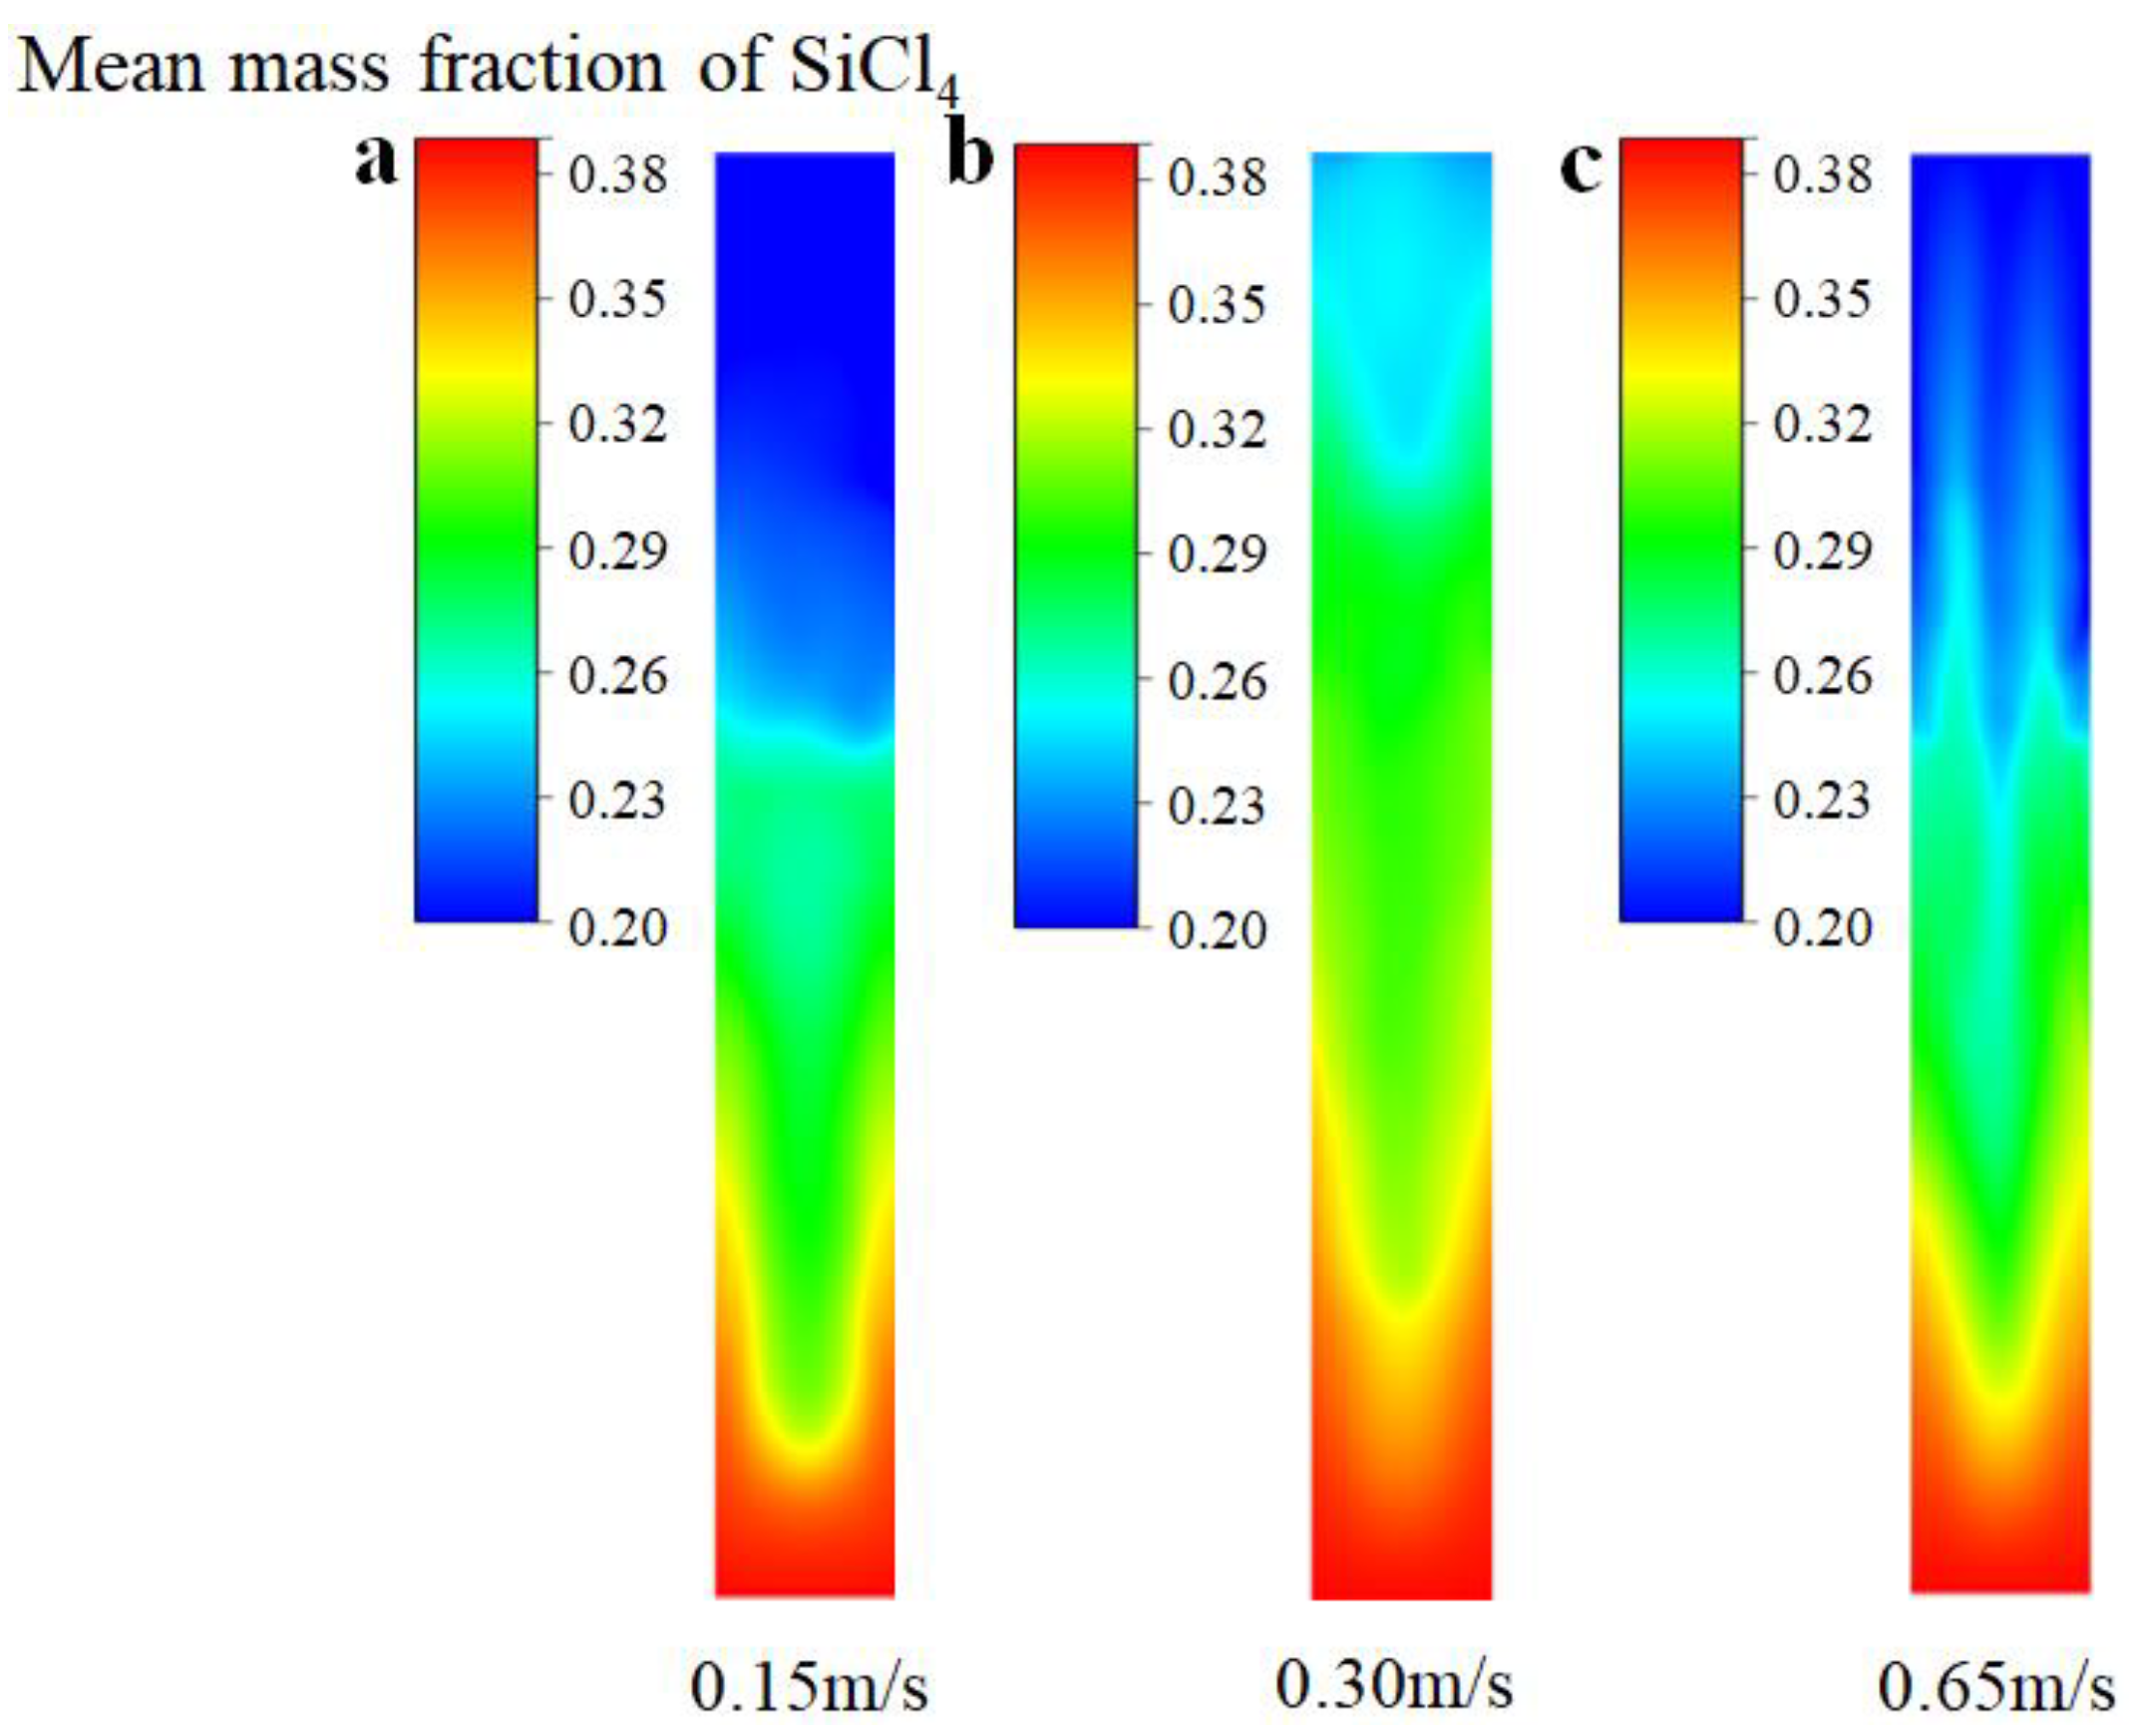
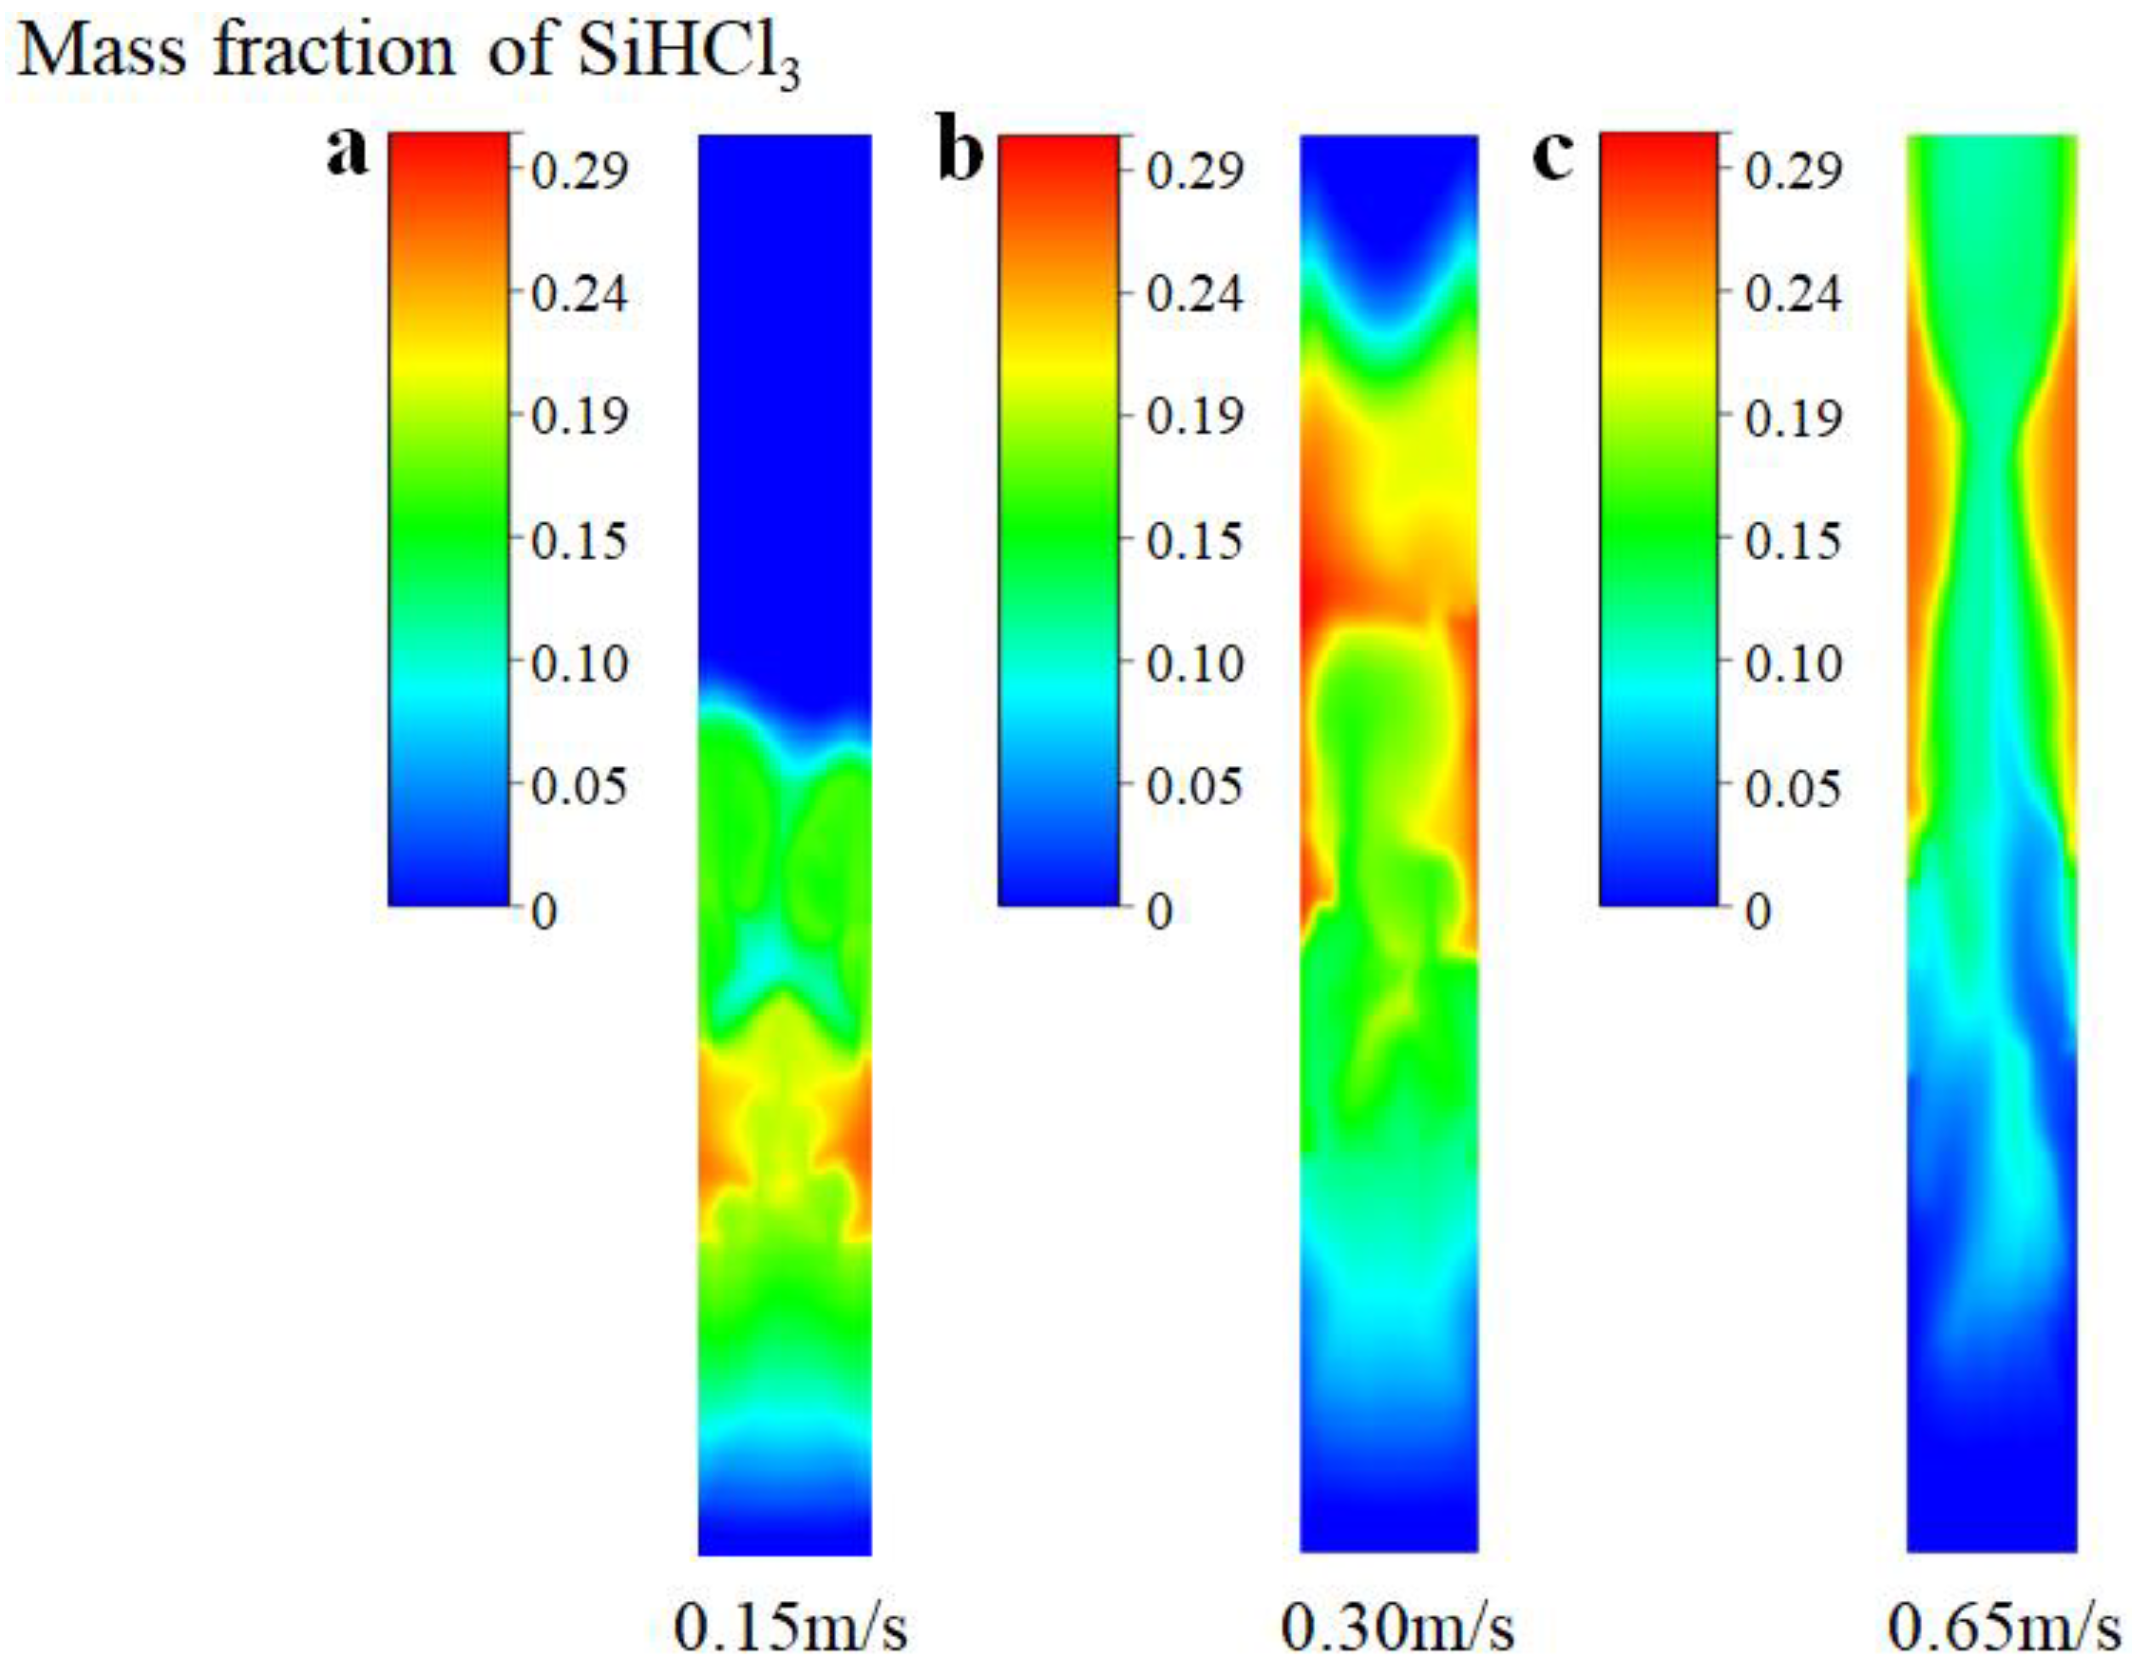
  • The bed voidage increased with the flow time, coinciding with transitions in the flow regime within the FBR. Particularly noteworthy was the attainment of a more uniform distribution of SiCl4 under the bubbling fluidization state.
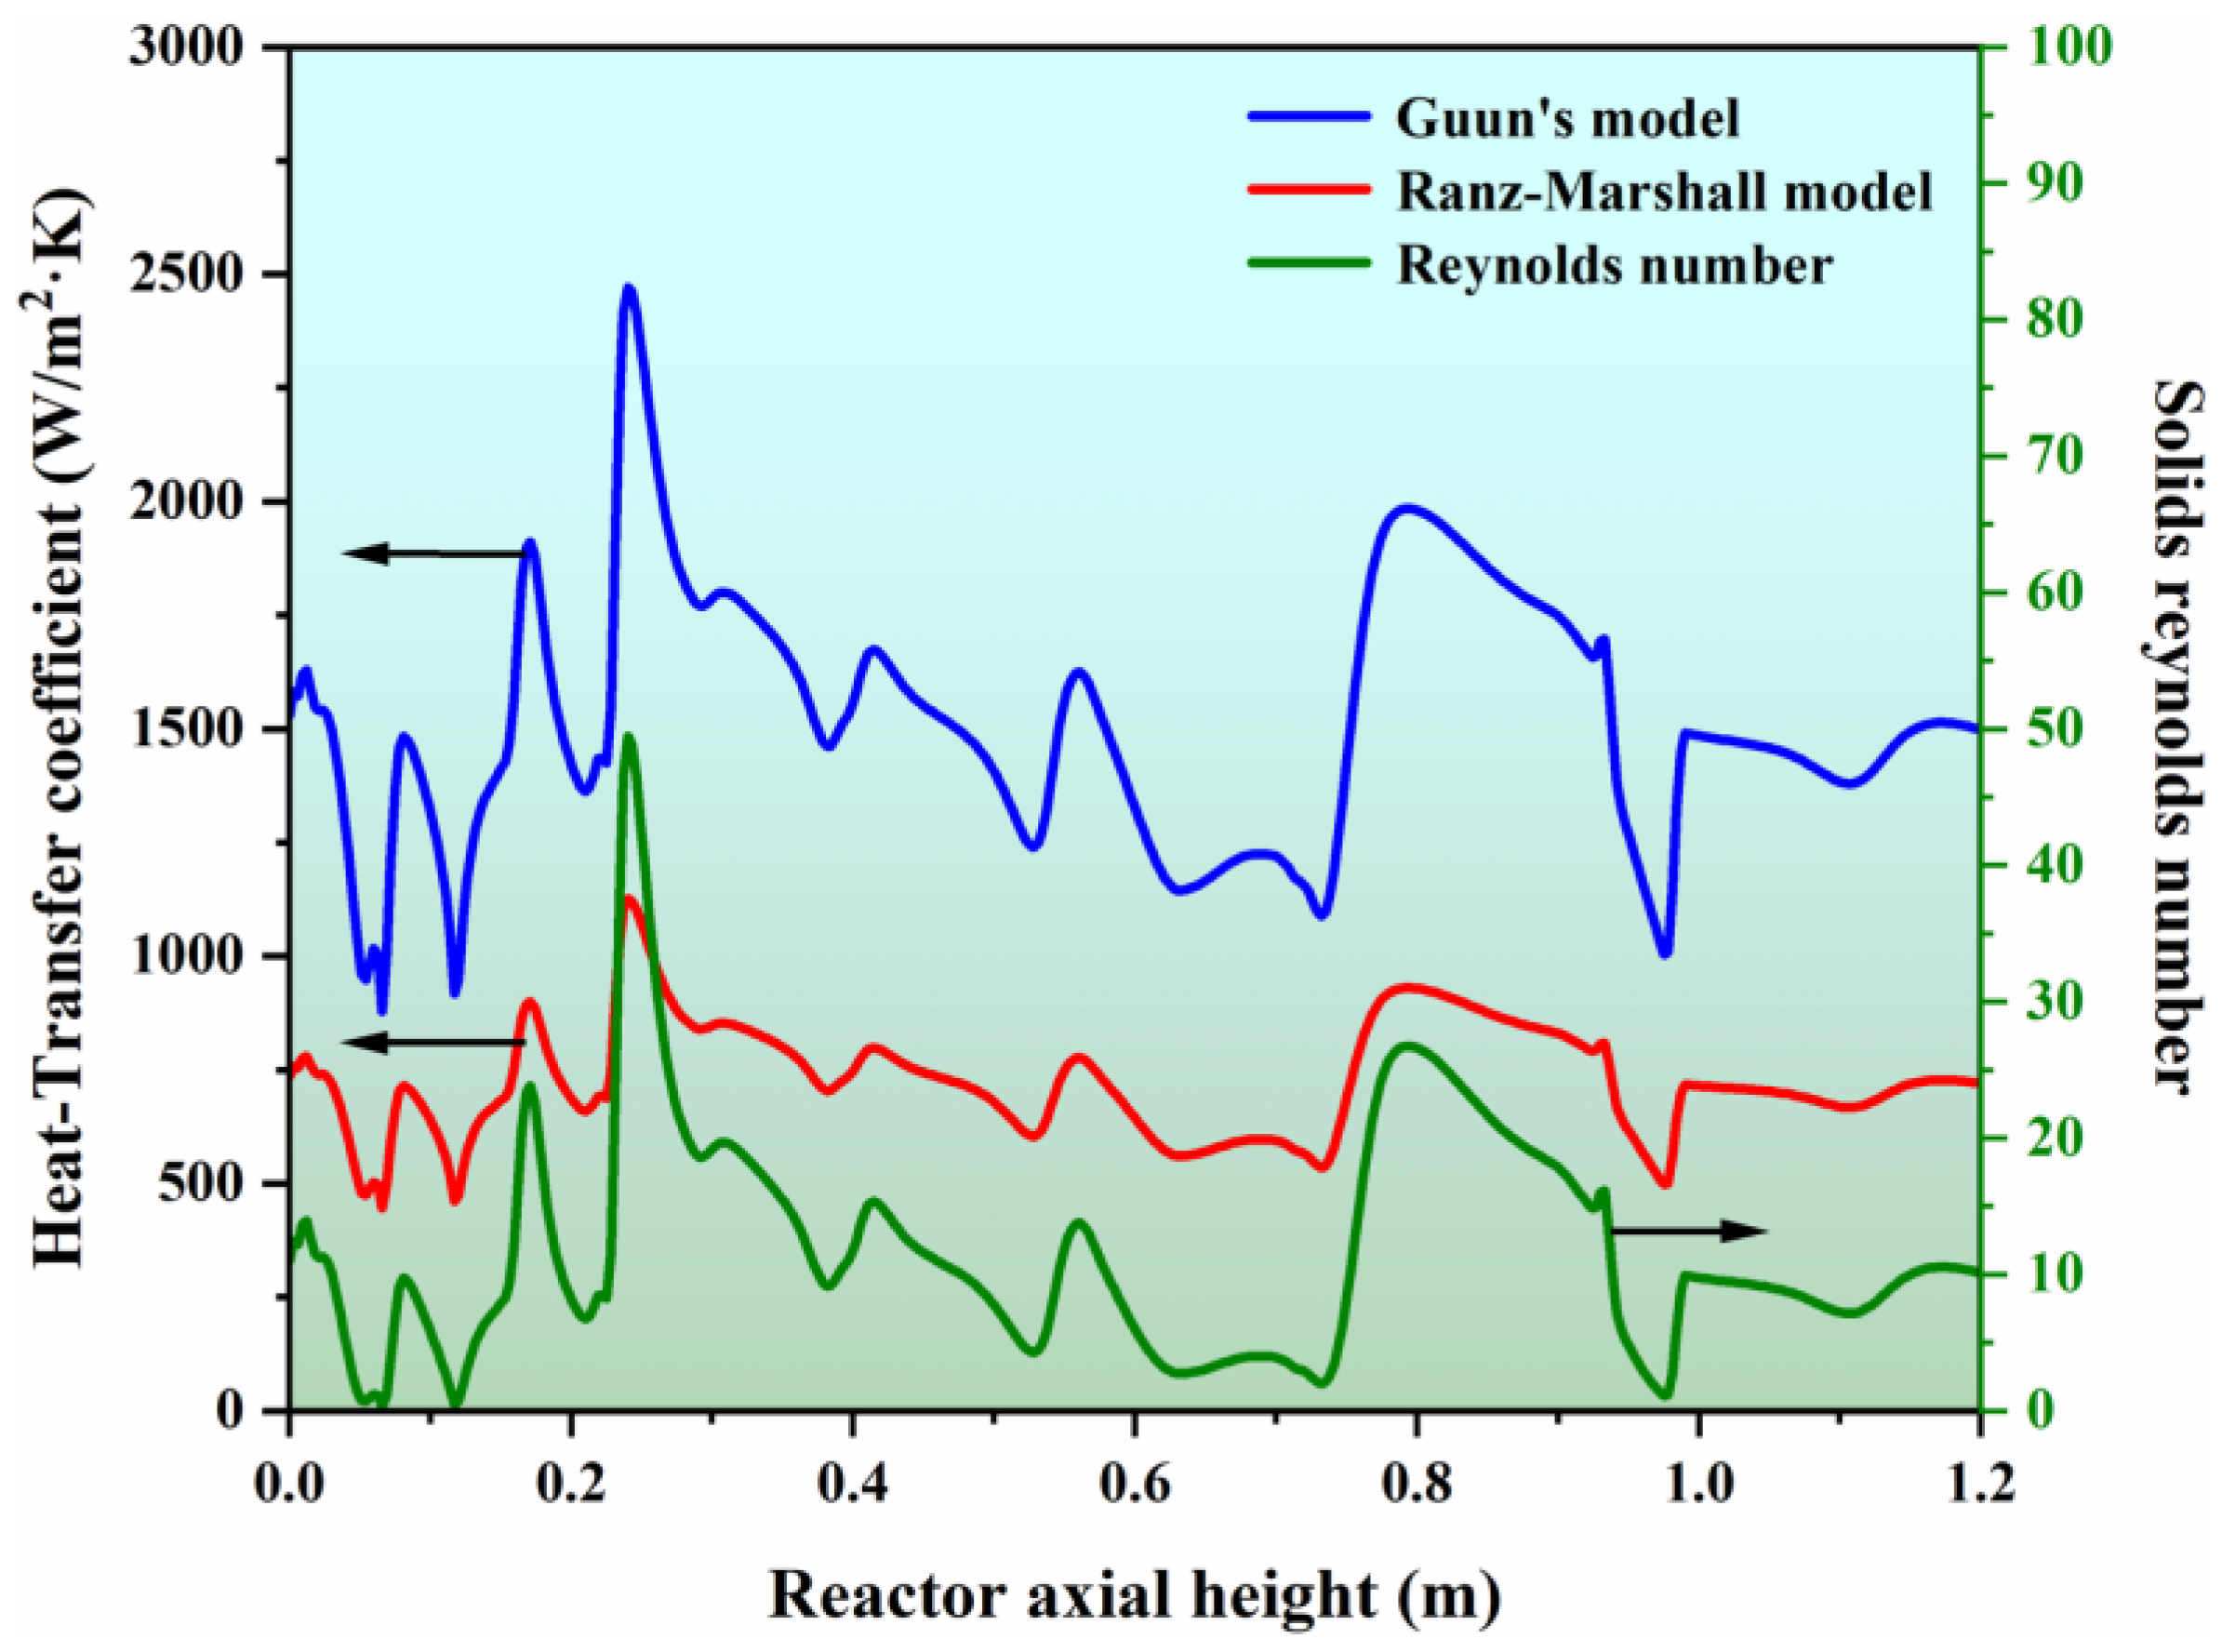
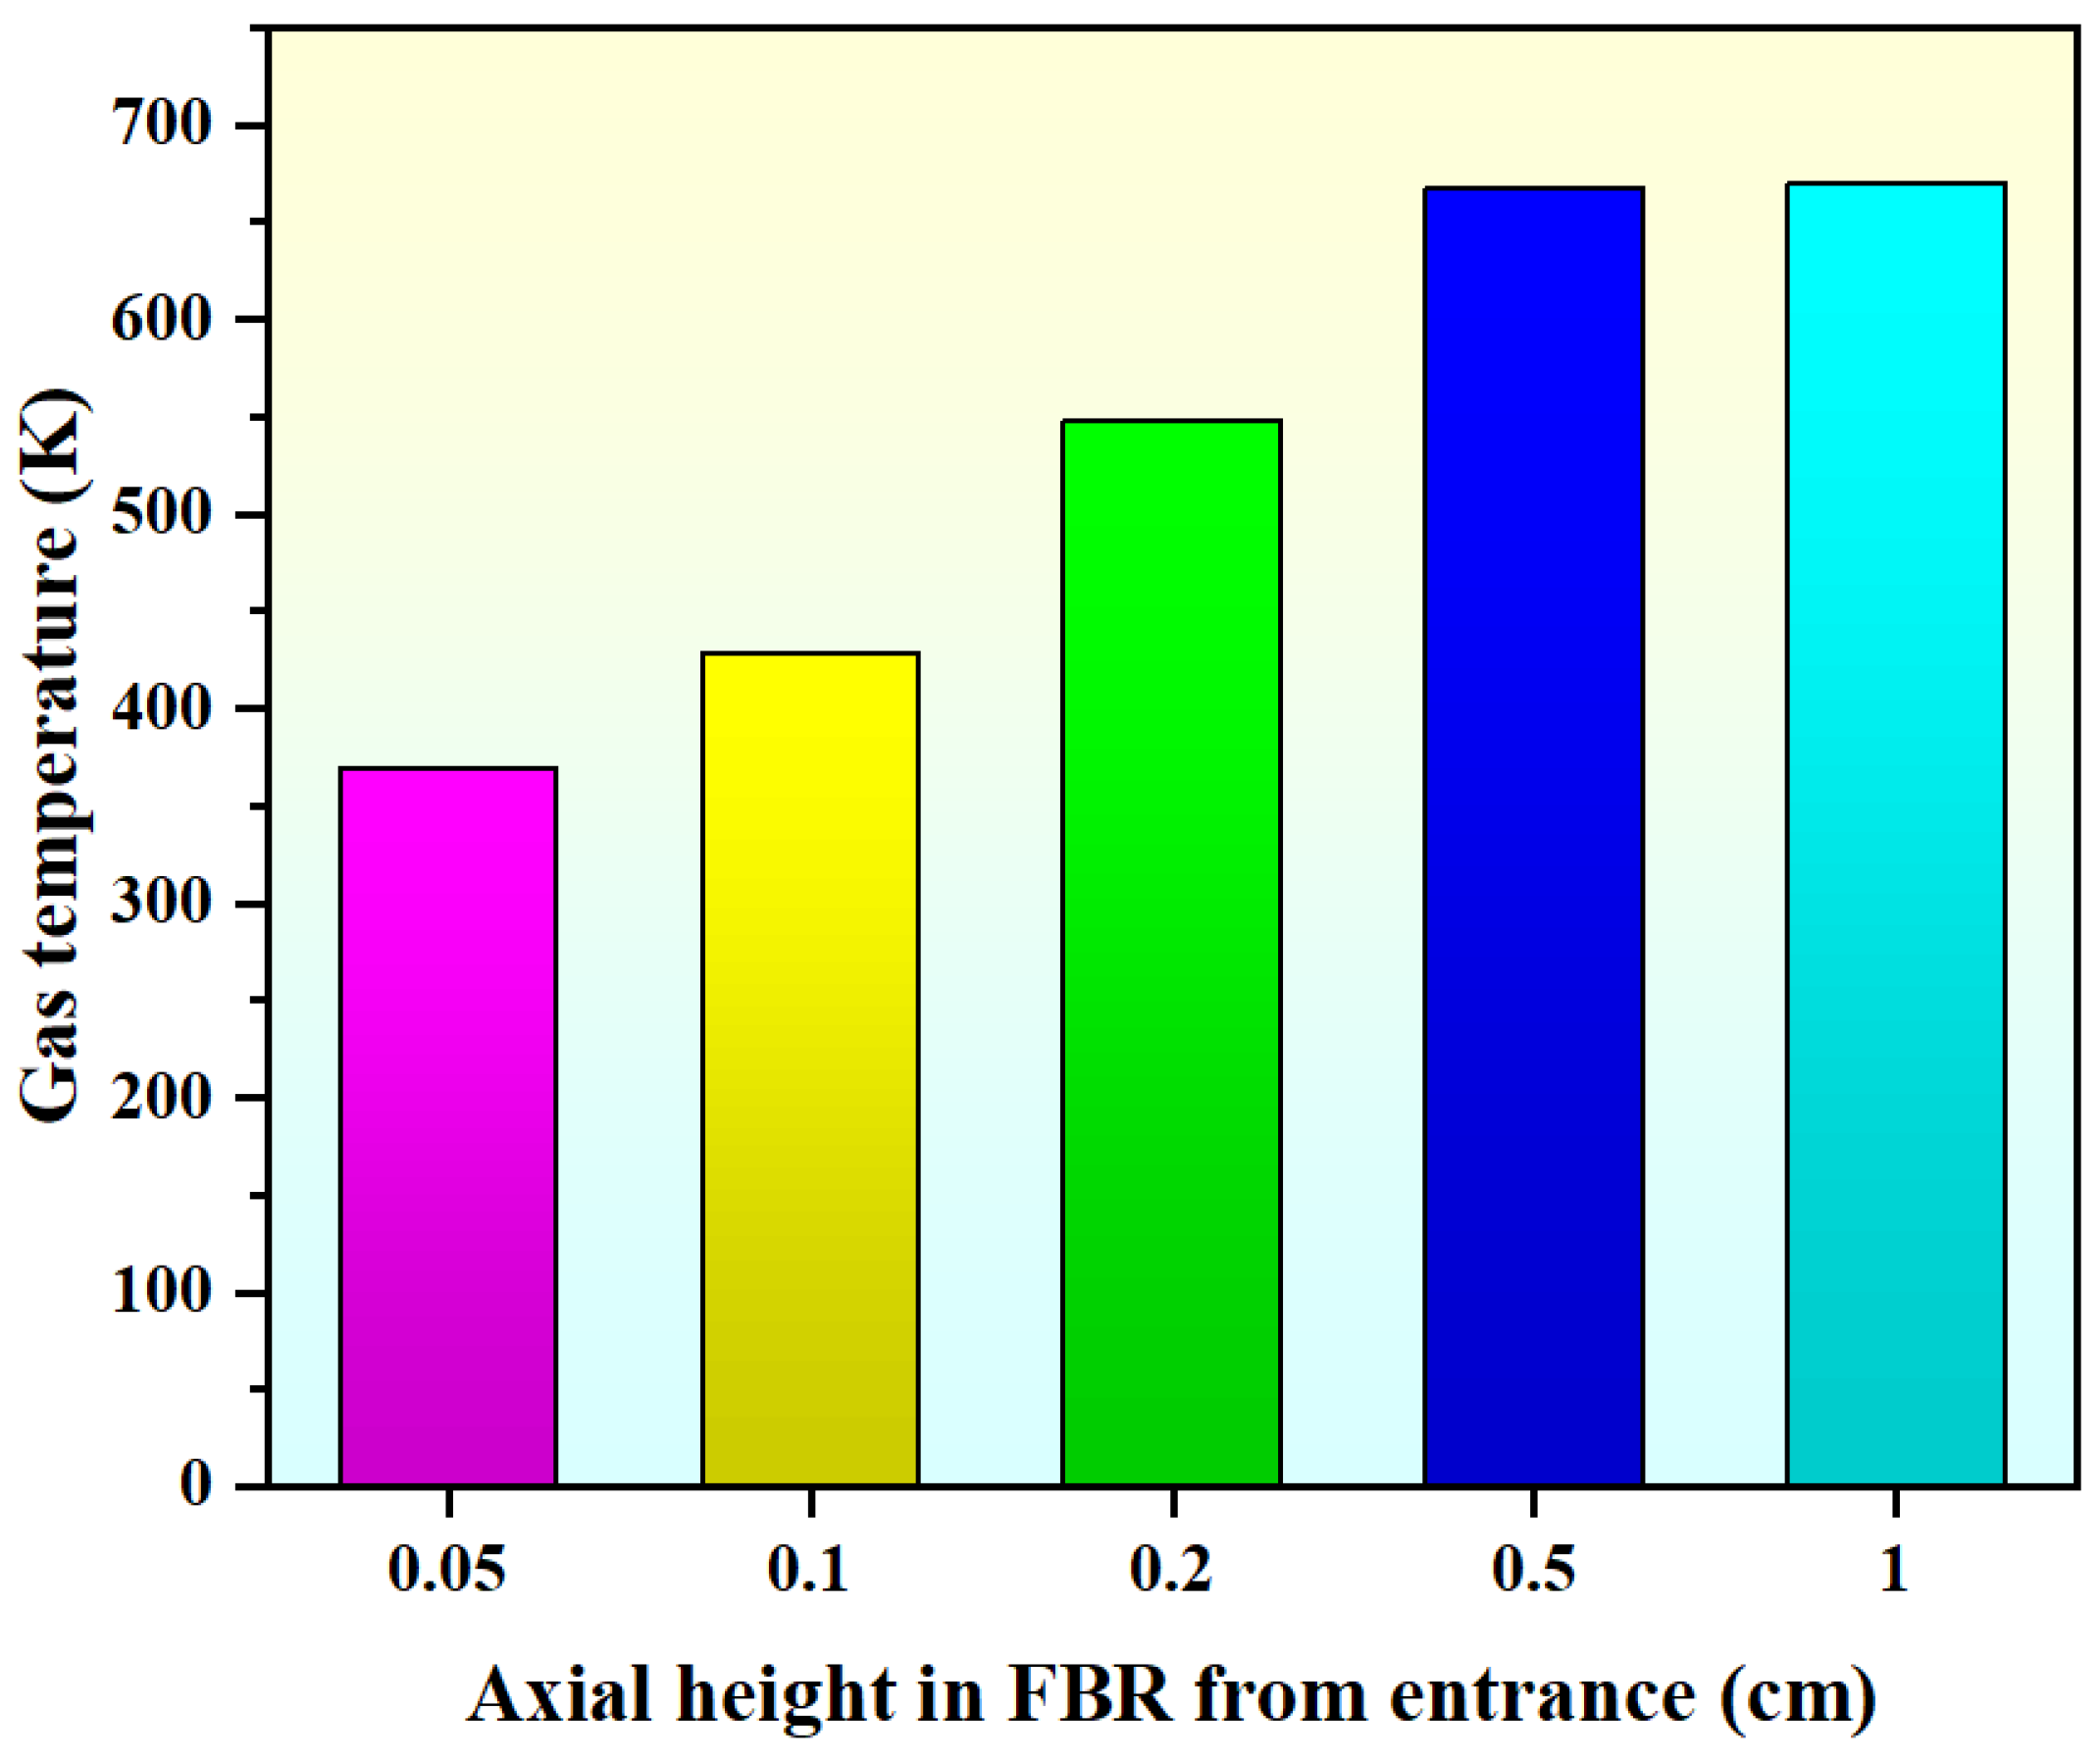
  • The FBR exhibits remarkable heat transfer characteristics, as the reaction gas attains the preset bed temperature within a mere 10 mm from the entrance. Moreover, the presence of circulating bubbles within the FBR greatly enhances the uniform mixing of the SiCl4 reaction gas with silicon particles.
  • When the FBR is in the bubbling stage, it promotes the effective mixing of the gas–solid phases, resulting in the highest conversion rate of SiCl4. Our predictions revealed a peak concentration of SiHCl3 at 13.08%, and a SiCl4 conversion rate of 28.97% was achieved under the conditions of bubbling fluidization.

Author Contributions

Q.G.: Formal analysis, Investigation, and Writing—original draft. E.D.: Methodology and Data curation. S.X.: Visualization. Y.Y.: Supervision. N.Y.: Software and Validation. G.X.: Software and Validation. Z.N.: Conceptualization, Resources, Writing—review and editing, Project administration, and Funding acquisition. All authors have read and agreed to the published version of the manuscript.

Funding

The authors gratefully acknowledge financial support from the National Natural Science Foundation of China (51904137), the Special Basic Cooperative Research Programs of Yunnan Provincial Undergraduate Universities’ Association (202101BA070001-032), the Basic Research Project of Yunnan Province (202201AT070017), and the Scientific Research Funds of the Yunnan Education Department (2022Y750). The authors also thank the High-Level Talent Plans for Young Top-notch Talents of Yunnan Province (YNWR-QNBJ-2020-017) and the High-Level Talent Special Support Plans for Young Talents of Kunming City (C201905002).

Institutional Review Board Statement

Not applicable.

Informed Consent Statement

Not applicable.

Data Availability Statement

The data that support the findings of this study are available from the corresponding authors upon reasonable request.

Conflicts of Interest

The authors report no conflict of interest.

Nomenclature

APre-exponential factor, mol/(g∙s∙atm2)
CDDrag coefficient
CpHeat capacity, J/(mol∙K)
DBed diameter, m
dsSolid diameter, m
essParticle–particle restitution coefficient
GkGeneration of turbulence kinetic energy
gGravitational acceleration, m/s2
g0Radial distribution function
hSpecific enthalpy, J/(kg∙K)
hwWall–bed heat transfer coefficient, W/(m∙K)
hgsGas–solid heat transfer coefficient, W/(m∙K)
HSpecific enthalpy, J/(kg∙K)
ΔHEnthalpy change, kJ
HmaxMaximum bed expansion height, m
HmfBed height at minimum fluidization, m
IIdentity matrix
JnMass diffusion
kTurbulence kinetic energy tensor
k0Apparent rate constant, mol/(g∙s∙atm2)
kgGas thermal conductivity, W/(m∙K)
ksSolid thermal conductivity, W/(m∙K)
K1Adsorption equilibrium constants, atm−1
K2Adsorption equilibrium constants, atm2/3
KpEquilibrium rate constant, mol/(g∙s∙atm2)
KgsInterphase exchange coefficient, (kg∙m2)/s
mgsInterphase mass transfer from gas to solid, kg/(m3∙s)
msgInterphase mass transfer from solid to gas, kg/(m3∙s)
NusNusselt number of solid phase
pPressure drop, Pa
PrPrandtl number
qHeat flux, W/m2
RnNet rate which chemical reaction produces a substance
Rc1Chemical reaction rate of the hydrogenation
Rc2Chemical reaction rate of the hydrochlorination
ResSolid Reynolds number
RemfReynolds number at minimum fluidization
SnSource term
tFlow time, s
TTemperature, K
TwWall temperature, K
TfReference temperature, K
UmfMinimum fluidizing velocity, m/s
UmbMinimum bubbling velocity, m/s
UmsMinimum slugging velocity, m/s
ZFBR axial height, m
Greek symbols
αgVolume fraction of gas phase
αsVolume fraction of solid phase
αmfBed void fraction at minimum fluidization
αs,maxMaximum volume fraction of solid phase
εTurbulence dissipation rate, m2/s3
ΘsGranular temperature, m2/s2
λsSolid bulk viscosity, Pa∙s
μGas viscosity, Pa∙s
μsSolid shear viscosity, Pa∙s
μs,colSolid collision viscosity, Pa∙s
μs,kinSolid kinetic viscosity, Pa∙s
μs,frSolid fractional viscosity, Pa∙s
μs,effEffective solid viscosity, Pa∙s
γ Θ s Collisional dissipation of energy
vVelocity, m/s
ρDensity, kg/m3
τShear stress, N/m2
ϕ gs Exchange energy between gas and solid
Subscripts
gGas phase
sSolid phase
mGas and solid phase, respectively
nSpecies

References

  1. Rabaia, M.K.H.; Semeraro, C.; Olabi, A.G. Recent progress towards photovoltaics’ circular economy. J. Clean. Prod. 2022, 373, 133864. [Google Scholar] [CrossRef]
  2. Deng, R.; Zhuo, Y.T.; Shen, Y.S. Recent progress in silicon photovoltaic module recycling processes. Resour. Conserv. Recycl. 2022, 187, 106612. [Google Scholar] [CrossRef]
  3. Yadav, S.; Chattopadhyay, K.; Singh, C.V. Solar grade silicon production: A review of kinetic, thermodynamic and fluid dynamics based continuum scale modeling. Renew. Sustain. Energy Rev. 2017, 78, 1288–1314. [Google Scholar] [CrossRef]
  4. Nie, Z.F.; Wang, Y.J.; Wang, C.; Guo, Q.J.; Hou, Y.Q.; Ramachandran, P.A.; Xie, G. Mathematical model and energy efficiency analysis of Siemens reactor with a quartz ceramic lining. Appl. Therm. Eng. 2021, 199, 117522. [Google Scholar] [CrossRef]
  5. Zhou, T.; Gong, L.L.; Cheng, X.D.; Pan, Y.L.; Li, C.C.; Zhang, H.P. Preparation and characterization of silica aerogels from by-product silicon tetrachloride under ambient pressure drying. J. Non-Cryst. Solids 2018, 499, 387–393. [Google Scholar] [CrossRef]
  6. Ding, W.J.; Yan, J.M.; Xiao, W.D. Hydrogenation of Silicon Tetrachloride in the Presence of Silicon: Thermodynamic and Experimental Investigation. Ind. Eng. Chem. Res. 2014, 53, 10943–10953. [Google Scholar] [CrossRef]
  7. Ding, W.J.; Wang, Z.B.; Yan, J.M.; Xiao, W.D. CuCl-Catalyzed Hydrogenation of Silicon Tetrachloride in the Presence of Silicon: Mechanism and Kinetic Modeling. Ind. Eng. Chem. Res. 2014, 53, 16725–16735. [Google Scholar] [CrossRef]
  8. Wu, J.; Chen, Z.; Ma, W.; Dai, Y. Thermodynamic estimation of silicon tetrachloride to trichlorosilane by a low temperature hydrogenation technique. Silicon 2017, 9, 69–75. [Google Scholar] [CrossRef]
  9. Wang, Y.; Nie, Z.; Guo, Q.; Song, Y.; Liu, L. Adsorption Behaviors of Chlorosilanes, HCl, and H2 on the Si(100) Surface: A First-Principles Study. ACS Omega 2022, 7, 42105–42114. [Google Scholar] [CrossRef] [PubMed]
  10. Ravasio, S.; Maso, M.; Cavalloti, C. Analysis of the Gas Phase Reactivity of Chlorosilanes. J. Phys. Chem. 2013, 117, 5221–5231. [Google Scholar] [CrossRef] [PubMed]
  11. Lee, J.Y.; Lee, W.H.; Park, Y.K.; Kim, H.Y.; Kang, N.Y.; Yoon, K.B.; Choi, W.C.; Yang, O.B. Catalytic conversion of silicon tetrachloride to trichlorosilane for a poly-Si process. Sol. Energy Mater. Sol. Cells 2012, 105, 142–147. [Google Scholar] [CrossRef]
  12. Jain, M.P.; Sathiyamoorthy, D.; Rao, V.G. Studies on Hydrochlorination of Silicon in a Fluidised Bed Reactor. Indian Chem. Eng. 2010, 53, 61–67. [Google Scholar] [CrossRef]
  13. Becker, F.; Buchholz, S.; Mleczko, L. Kinetic Modeling of the Hydrochlorination of Silicon with SiCl4 and H2. Chem. Ing. Tech. 2001, 73, 686. [Google Scholar] [CrossRef]
  14. Guan, G.Q.; Fushimi, C.; Tsutsumi, A. Prediction of flow behavior of the riser in a novel high solids flux circulating fluidized bed for steam gasification of coal or biomass. Chem. Eng. J. 2010, 164, 221–229. [Google Scholar] [CrossRef]
  15. Wu, Q.; Wang, S.; Zhang, K.; Zhao, Y.H.; He, Y.R. Numerical studies of gas-solid flow behaviors and wall wear in a swirling fluidized bed. Powder Technol. 2021, 388, 233–240. [Google Scholar] [CrossRef]
  16. Shao, Y.J.; Li, Z.Z.; Zhong, W.Q.; Bian, Z.F.; Yu, A.B. Minimum fluidization velocity of particles with different size distributions at elevated pressures and temperatures. Chem. Eng. Sci. 2020, 216, 115555. [Google Scholar] [CrossRef]
  17. Chien, R.Y.; Tseng, W.F.; Wu, K.T. Numerical simulation of fuel reactor for a methanefueled chemical looping combustion using bubbling fluidized bed with internal particle circulation. Int. J. Hydrogen Energy 2021, 47, 37415–37428. [Google Scholar] [CrossRef]
  18. Pottimurthy, Y.; Wang, D.W.; Park, C.; Patil, S.; Tong, A.; Fan, L.S. Three-dimensional dynamic characterization of square-nosed slugging phenomena in a fluidized bed. Particuology. 2022, 67, 35–46. [Google Scholar] [CrossRef]
  19. Liu, S.S.; Xiao, W.D. Numerical simulations of particle growth in a silicon-CVD fluidized bed reactor via a CFD–PBM coupled model. Chem. Eng. Sci. 2014, 111, 112–125. [Google Scholar] [CrossRef]
  20. Liu, S.S.; Xiao, W.D. CFD–PBM coupled simulation of silicon CVD growth in a fluidized bed reactor: Effect of silane pyrolysis kinetic models. Chem. Eng. Sci. 2015, 127, 84–94. [Google Scholar] [CrossRef]
  21. Zhu, X.L.; Dong, P.F.; Zhu, Z.P.; Ocone, R.; Yang, W.Q.; Wang, H.G. Effects of pressure on flow regimes transition velocities and bubble properties in a pilot-scale pressurised circulating fluidised bed. Chem. Eng. J. 2021, 410, 128438. [Google Scholar] [CrossRef]
  22. Cho, Y.J.; Kim, S.J.; Nam, S.H.; Kang, Y.; Kim, S.D. Heat transfer and bubble properties in three-phase circulating fluidized beds. Chem. Eng. Sci. 2001, 56, 6107–6115. [Google Scholar] [CrossRef]
  23. Rashid, T.A.B.; Zhu, L.T.; Luo, Z.H. Comparative analysis of numerically derived drag models for development of bed expansion ratio correlation in a bubbling fluidized bed. Adv. Powder Technol. 2020, 31, 2723–2732. [Google Scholar] [CrossRef]
  24. Agu, C.E.; Torheim, L.A.; Eikeland, M.; Moldestad, B.M.E. Improved models for predicting bubble velocity, bubble frequency and bed expansion in a bubbling fluidized bed. Chem. Eng. Res. Des. 2019, 141, 361–371. [Google Scholar] [CrossRef]
  25. Yu, S.J.; Yang, X.X.; Zhou, H.; Li, Q.H.; Zhang, Y.G. Effects of bed size on the voidage in gas-solid bubbling fluidized beds. Powder. Technol. 2021, 387, 197–204. [Google Scholar] [CrossRef]
  26. Yu, S.J.; Yang, X.X.; Zhou, H.; Li, Q.H.; Zhang, Y.G. Statistical study of the distribution of voidage in a bubbling fluidized bed with a constant section. Chem. Eng. Res. Des. 2021, 171, 305–316. [Google Scholar] [CrossRef]
  27. Colomb, M.; Palanki, S.; Sylvester, N.D. Modeling the hydrochlorination reaction in a laboratory-scale fluidized bed reactor. Powder Technol. 2016, 292, 242–250. [Google Scholar] [CrossRef]
  28. Colomb, M.; Palanki, S.; Sylvester, N.D. Experimental verification of scalable model for the hydrochlorination reaction in a pilot-scale fluidized bed reactor. Powder Technol. 2016, 301, 989–998. [Google Scholar] [CrossRef]
  29. Liu, N.; Liu, X.P.; Wang, F.M.; Xin, F.; Sun, M.S.; Zhai, Y.; Zhang, X.B. CFD simulation study of the effect of baffles on the fluidized bed for hydrogenation of silicon tetrachloride. Chin. J. Chem. Eng. 2021, 45, 219–228. [Google Scholar] [CrossRef]
  30. Brennen, C.E. Fundamentals of Multiphase Flows; Cambridge University Press: Cambridge, UK, 2005. [Google Scholar]
  31. Syamlal, M.; Rogers, W.; O’Brien, T.J. MFIX Documentation, Theory Guide; National Technical Information Service: Springfield, VA, USA, 1993. [Google Scholar]
  32. Lun, C.K.K.; Savage, S.B.; Jeffrey, D.J.; Chepurniy, N. Kinetic theories for granular flow inelastic particles in Couette flow and slightly inelastic particles in a general flowfield. J. Fluid Mech. 1984, 140, 223–256. [Google Scholar] [CrossRef]
  33. Schaeffer, D.G. Instability in the evolution equations describing incompressible granular flow. J. Differ. Equ. 1987, 66, 19–50. [Google Scholar] [CrossRef]
  34. ANSYS. ANSYS Fluent Theory Guide; ANSYS Inc.: Canonsburg, PA, USA, 2022. [Google Scholar]
  35. Gidaspow, D.; Bezburuah, R.; Ding, J. Hydrodynamics of Circulating Fluidized Beds: Kinetic Theory Approach; Illinois Institute of Technology: Chicago, IL, USA, 1991. [Google Scholar]
  36. Ranz, W.E.; Marshall, W.R. Evaporation from drops. Chem. Eng. Prog. 1952, 48, 141–146. [Google Scholar]
  37. Gunn, D. Transfer of heat or mass to particles in fixed and fluidized beds. Int. J. Heat Mass Transfer. 1978, 21, 467–476. [Google Scholar] [CrossRef]
  38. Hsu, G.; Rohatgi, N.; Houseman, J. Silicon particle growth in a fluidized-bed reactor. AIChE J. 1987, 33, 784–791. [Google Scholar] [CrossRef]
  39. Matsen, J.M.; Hovmand, S.; Davidson, J.F. Expansion of fluidized beds in slug flow. Chem. Eng. Sci. 1969, 24, 1743–1754. [Google Scholar] [CrossRef]
  40. Cho, H.; Chung, C.; Han, G. Slugging bed height of polyethylene particles in a fluidized bed with an expanded section. Korean J. Chem. Eng. 2001, 18, 567–570. [Google Scholar] [CrossRef]
Figure 1. Geometric model and meshing pertinent to experimental FBR prototype of Hsu et al. [38].
Processes 11 02979 g001
Figure 2. Grid independence verification. (a) the pressure drop; (b) the mean solid volume fraction.
Processes 11 02979 g002
Figure 3. Model validation. (a) comparison of simulated values of Hmax under different inlet gas velocities with theoretical values of the empirical formulas [39,40]; (b) comparison of simulated and experimental gas temperature profile in FBR from entrance [38].
Processes 11 02979 g003
Figure 4. Instantaneous solid volume fraction at different inlet gas velocities (without chemical reactions). (a) Ua = 0.15 m/s; (b) Ub = 0.30 m/s; (c) Uc = 0.65 m/s.
Processes 11 02979 g004
Figure 5. Simulated bed voidage with flow time at different inlet gas velocities.
Processes 11 02979 g005
Figure 6. The distribution of mean mass fraction of SiCl4 under the different inlet gas velocities. (a) Ua = 0.15 m/s; (b) Ub = 0.30 m/s; (c) Uc = 0.65 m/s.
Processes 11 02979 g006
Figure 7. Simulated gas–solid heat transfer coefficient with different heat transfer models and the predicated solid Reynolds number.
Processes 11 02979 g007
Figure 8. Simulated axial gas temperature profiles in FBR from the entrance (Ub = 0.30 m/s).
Processes 11 02979 g008
Figure 9. Simulated solid volume fraction of SiCl4 hydrochlorination process at different inlet gas velocities (with chemical reactions). (a) Ua = 0.15 m/s; (b) Ub = 0.30 m/s; (c) Uc = 0.65 m/s.
Processes 11 02979 g009
Figure 10. Mass fraction distribution of SiHCl3 products at different inlet gas velocities (with chemical reactions). (a) Ua = 0.15 m/s; (b) Ub = 0.30 m/s; (c) Uc = 0.65 m/s.
Processes 11 02979 g010
Figure 11. Comparison of conversion of SiCl4 at different inlet gas velocities. (a) hydrogenation process; (b) hydrochlorination process.
Processes 11 02979 g011
Table 1. Reaction kinetics parameters [29].
ParametersValues
Pre-exponential factor, A 0.22 mol/(g∙s∙atm2)
Activation energy, E77.01 kJ/mol−1
Reference temperature, Tr773 K
Equilibrium rate constant, Kp0.2645 atm−1/3
Adsorption equilibrium constants, K10.2141 atm−1
Adsorption equilibrium constants, K28.92 atm−1
Enthalpy change, ΔH1 32.45 kJ/mol
Enthalpy change, ΔH2−12.85 kJ/mol
Enthalpy change, ΔHP−36.73 kJ/mol
Table 2. Basic parameter settings [19,38].
ParametersValues
Bed height1.22 m
Bed width0.1524 m
Solid density2330 kg/m3
Particle diameter235 μm
Solid–solid restitution coefficient0.9
Gas density1.225 kg/m3
Gas viscosity1.72 μPa·s
Initial bed height0.60 m
Initial solid volume fraction0.60
Inlet gas velocity0.15/0.30/0.65 m/s
Wall temperature773 K
Inlet temperature300 K
Operating pressure2.0 MPa
SiCl4:H2:HCl1:4:1
Table 3. Boundary conditions in present simulations.
Parameters Values
InletVelocity-inlet
OutletPressure-outlet
Drag modelGidaspow et al. [35]
Heat transfer modelGuun [37]
Granular viscosityGidaspow et al. [35]
Granular bulk viscosityLun et al. [32]
Restitution0.9
Wall-conditionNo-slip
Friction viscositySchaeffer [33]
Table 4. Empirical formulas of fluidization characteristics parameters [39,40].
ParametersFormulas
U mf U mf = R e mf ( μ g ρ g d s ) (41)
U mb U mb = 0.35 g D (42)
U ms U ms = 7 U mf g D + 1.6 10 5 ( 60 × ( 100 D ) 0.175 100 H mf ) 2 (43)
H mf H mf = H ( 1 α ) ( 1 α mf ) (44)
Δ P Δ P = H mf ( 1 α mf ) ( ρ s ρ g ) g (45)
H max H max = H mf + H mf U U mf 0.5 g D (46)
Disclaimer/Publisher’s Note: The statements, opinions and data contained in all publications are solely those of the individual author(s) and contributor(s) and not of MDPI and/or the editor(s). MDPI and/or the editor(s) disclaim responsibility for any injury to people or property resulting from any ideas, methods, instructions or products referred to in the content.

