
A Time-Saving Approach to Parameter Studies in Microwave-Assisted Freeze Drying
1
Institute of Process Engineering in Life Sciences, Food Process Engineering, Karlsruhe Institute of Technology, 76131 Karlsruhe, Germany
2
Institute of Technical Thermodynamics and Refrigeration, Karlsruhe Institute of Technology, 76131 Karlsruhe, Germany
*
Author to whom correspondence should be addressed.
Processes 2023, 11(10), 2886; https://doi.org/10.3390/pr11102886
Submission received: 12 September 2023
/
Revised: 26 September 2023
/
Accepted: 28 September 2023
/
Published: 30 September 2023
(This article belongs to the Section Food Process Engineering)
Abstract
:Microwave-assisted freeze drying (MFD) is particularly suited for drying heat-sensitive materials. However, optimizing process parameters is time-consuming due to lengthy individual experiments. This study investigates the feasibility of partial MFD for parameter studies, with the process being terminated after removing 20 wt% of the water contained. The proposed approach reduces the time required for parameter evaluation by 92.0% compared to complete MFD. It also enables the evaluation of the samples’ drying homogeneity. A subsequent parameter study based on partial MFD was then conducted to evaluate the effects of chamber pressure, microwave power, and microwave frequencies on the drying kinetics and drying homogeneity. Lowering the average chamber pressure from 0.87 mbar to 0.19 mbar reduced the process duration by 18.8%. An increase in the dissipated specific microwave power from 0.048 W/g to 0.143 W/g reduced the duration by 46.7%. The targeted application of frequencies increased the average energy efficiency to as high as 92.4%, contributing to a shortened process duration of up to 51.2%. Only the application of multiple frequencies caused a notable increase in drying homogeneity. In summary, this study demonstrates the feasibility and time-saving benefits of partial drying for parameter studies in MFD and potentially different types of drying processes.
1. Introduction
Freeze drying (FD) is an established method in process engineering, yielding products of a particularly high quality [1]. Recent work on FD covered microwave-assisted freeze drying (MFD) as an approach to process intensification [2,3,4,5,6,7,8,9,10]. In conventional freeze drying (CFD), energy is supplied through the mechanisms of thermal radiation, conduction, and convection [11]. In MFD, by contrast, electromagnetic energy dissipates into heat directly inside the product by interactions of the microwaves with the product as a dielectric [12]. During MFD, the absorption of microwave energy by interactions with bound water accounts for a major part of energy input, whereas frozen water absorbs energy to a minor extent only [9]. Microwave application offers a variety of advantages for drying, such as avoiding heat transfer resistances through the product surface [13], selective generation of heat in product areas containing large amounts of water [14], as well as short process durations and cost savings [15]. Comparing MFD to CFD, the drying time was reduced by about 40% for chunky products, such as sea cucumber [2] and barley grass [5]. Reductions as high as 70% to 80% were reported for viscous products, such as monoclonal antibody formulations [6], lactic acid bacteria cell concentrate [4], and foamed raspberry puree [8]. The quality of the final product obtained was similar or superior to products processed with CFD.
Conventionally, microwaves are generated with magnetrons [16], which are high-power vacuum tubes. While magnetrons are relatively cheap and readily available to supply high microwave power, they offer only limited control of the microwaves generated. Power regulation, for instance, is usually implemented by a simple on–off control. A more advanced control of the magnetron is technically complex, as can be seen, for example, in the study by Yang et al. [17]. In contrast to this, the generation of microwaves by a solid-state microwave generator (SSG) enables the precise and rapid modulation of microwave properties and provides feedback on the reflected and forward power as a function of the product state. For instance, SSGs produce a stable and narrow frequency bandwidth compared to magnetrons [18]. When using several SSGs, the power, frequency, and phase shift of every generator can be controlled individually. In the context of MFD, this enables additional degrees of freedom for process control, as the microwave field can be controlled specifically throughout drying to intensify the process. In comparison, process control in CFD is limited to the regulation of chamber pressure and shelf temperature [11,19,20]. The following sections provide a brief overview of the expected effects of the process parameters of chamber pressure, microwave power, and microwave frequency on MFD.
In theory, a higher chamber pressure should result in lower sublimation rates for CFD due to decreased pressure gradients from the sublimation front to the process chamber [20]. However, this correlation is only valid if the temperature at the sublimation front and, thus, the vapor pressure remain constant. Assegehegn et al. [19] experimentally investigated the impact of chamber pressure on CFD for pharmaceutical model formulations. Increasing the chamber pressure in the range of 0.05 mbar to 0.20 mbar led to higher sublimation rates at a constant shelf temperature. The result can presumably be attributed to the higher product temperature caused by the elevated chamber pressure. The increased product temperature results in a higher pressure gradient through the dried layer where the pressure increase at the sublimation front exceeds that on the product surface, i.e., of the chamber. In line with this, a decrease in the sublimation rate was observed with a higher chamber pressure when regulating the product temperature to a constant value via the shelf temperature. For MFD, Wang and Shi [21] observed no significant effect of chamber pressures of 0.15 mbar and 0.65 mbar on the drying duration. In contrast to this, Ambros et al. [4] noted higher drying rates for increases in chamber pressure in the range of 0.6 mbar to 2.0 mbar in MFD. As in CFD, faster drying correlated with higher product temperature. Regarding product quality, Ambros et al. [4] detected a decrease in survival rate and membrane integrity with increasing chamber pressure for the lactic acid bacteria B. lactis and no effect on these parameters for L. paracasei during MFD. Krokida et al. [22] observed decreasing porosity of agricultural products in CFD with increasing pressure. The proposed cause was an increase in product temperature above the glass transition temperature. In summary, chamber pressure influences mass transfer through the product via the pressure on the product surface and the vapor pressure at the sublimation front. The latter also influences heat transfer by affecting the sublimation temperature. Therefore, the effect of chamber pressure on the drying rate in MFD is not obvious and may vary depending on the product and the process conditions. Care must be taken to ensure that the product quality is not affected by exceeding product-specific temperature limits, e.g., the glass transition temperature. Measuring product temperature, hence, is a useful benchmark for evaluating the stress on the product.
Increases in microwave power in MFD are associated with decreases in process duration for various experimental setups [2,4,5,8,21,23,24,25]. Presumably, this correlation is caused by the increase in product temperature with higher microwave power, as observed in the literature for MFD of sea cucumber [2] and barley grass [5]. The higher temperature increases the vapor pressure at the sublimation front, thereby elevating the gradient, which drives the mass transfer. However, a higher product temperature is generally associated with a deterioration in product quality. Examples presented in the literature include the darker color of banana chips [25], as well as decreases in sensory evaluation scores in a hedonic assessment of instant vegetable soup [23], and reduced microbial survival rates of B. lactis [4]. On the other hand, no effect of microwave power on the survival rate of Lb. paracesei was reported by Ambros et al. [4]. Jiang et al. [24] observed no clear trends in sensory evaluation results of banana chips with different sugar contents on a hedonic scale. Only above a critical power level of 2.2 W/g were the ratings consistently lower. Thus, it depends on the thermal stability of the product investigated and the range of power applied whether changes in the power level lead to any effect on the product at all. As for chamber pressure, power levels in MFD may be increased until a relevant deterioration of the product is reached by an exceedingly high temperature.
Regarding the influence of microwave frequency on MFD, there is only limited literature available. For microwave vacuum drying at frequencies of 915 MHz and 2450 MHz, Li et al. [26] conducted measurements of the dielectric properties and moisture content of Chinese yam. Both frequency and moisture correlated with differences in dielectric properties, which in turn affect the power dissipation and, thus, the drying process. For CFD, Nakagawa and Kono [27] tracked the drying progress using an open-ended coaxial microwave resonator in the frequency range from 3 MHz to 3000 MHz. They observed a shift in peak resonant frequency (RF) to lower frequencies. According to theoretical calculations in the literature [28], this indicates a decrease in dielectric properties during FD. These dependencies of dielectric properties on drying progress and frequency pose a challenge for frequency control in MFD. In a previous study, however, Sickert et al. [9] developed frequency-based control concepts in electromagnetic simulations and applied them successfully to MFD in experiments with an SSG. More homogeneous power dissipation and drying at a similar dissipated microwave power were observed for the application of multiple frequencies. A targeted excitation of energy-efficient RFs led to the highest energy efficiencies. Higher dissipated power, associated with high energy efficiency, correlated with a shorter process duration. More extensive work covered the influence of frequency selection on microwave-assisted heating with SSGs. Targeted excitation of multiple frequencies was found to increase heating homogeneity in simulations [29,30] as well as experiments [31,32,33]. Frequency modulation was also utilized to increase energy efficiency, as indicated by temperature measurements [29,31,32,33]. These findings support the results of Sickert et al. [9], which revealed that frequency is an important process parameter in MFD.
The higher number of process parameters for MFD in comparison to CFD is associated with both opportunities and challenges. While advanced process optimization becomes possible, a non-optimized drying procedure could result in subpar drying performance. Therefore, parameter studies are crucial, but also time- and labor-intensive due to the long drying times of FD ranging from several hours to days. Partial MFD offers an opportunity for time savings, enabling higher experimental throughput in parameter studies. The current work aims to investigate the feasibility of conducting parameter studies with partial MFD, where only 20 wt% of the contained water is removed. This approach has not yet been specifically investigated for the parameter study of any drying process, as far as the authors are aware. The experiments are carried out in a laboratory-scale MFD system with a chunky model product, tylose gel. First, partial and complete MFD runs are compared regarding their drying kinetics and drying homogeneity. Particular emphasis is placed on the potential of partial drying for evaluating drying homogeneity. In partial MFD, differences in residual moisture should be more pronounced than in complete drying where the moisture content converges towards equilibrium. Additionally, the potential time savings achieved with partial drying are quantified. Subsequently, parameter studies on the chamber pressure, microwave power, and microwave frequency are carried out to quantify their influence on drying kinetics and drying homogeneity. Four frequency-based control concepts are investigated, including single frequencies with minimal and maximal energy efficiency as well as six frequencies that provide the maximal energy efficiency or are spaced equidistantly from 2400 MHz to 2500 MHz. To validate the approach proposed for evaluating the effects of process parameters on MFD, the results from the parameter study using partial drying are compared with the literature data for complete drying processes. Based on the literature available, increasing the chamber pressure in the drying process should result in shorter drying times due to the higher product temperature. Similarly, higher microwave power and energy efficiency achieved via frequency control are expected to accelerate drying. For all parameters, it is crucial to keep the product temperature below a product-specific threshold to avoid product impairment. The application of multiple frequencies should lead to higher drying homogeneity. By exploring partial MFD for use in parameter studies and comparing its results with complete MFD, this research contributes to efficient process optimization, shortening the development time and improving the drying efficiency.
2. Materials and Methods
2.1. Model Product
Cuboids of tylose gel were used as a model product in this study. The samples were prepared as previously described [9]. Briefly, cuboids of 12.50 ± 0.05 g and approximately 25 mm × 25 mm × 20 mm in dimension were prepared in a composition of 76.23 wt% demineralized water, 23.77 wt% Tylose MH1000 (Kremer Pigmente, Aichstetten, Germany), and 1.00 wt% L-(+)-ascorbic acid (Carl Roth, Karlsruhe, Germany). Subsequently, the samples were frozen at −30 °C for at least 14 h.
2.2. MFD System
The setup of the laboratory-scale MFD system was identical to that used in a previous study [9]. The process chamber was made of stainless steel and had inner dimensions of 612 mm × 400 mm × 300 mm. Centrally, at the bottom of the process chamber, a plate made of polyether ether ketone with a base area of 200 mm × 200 mm was installed as product support and connected to a PW4MC3/2 kg load cell (Hottinger Brüel & Kjaer, Darmstadt, Germany). A cold trap (UCCT, Vienna, Austria) was attached to the process chamber and set to a temperature of −60 °C in all experiments. A NEO D 65 vacuum pump (Leybold, Cologne, Germany) or a P 65 D vacuum pump (SASKIA, Ilmenau, Germany) was connected to the cold trap during the experiments. Chamber pressure was measured at the top of the process chamber with a CMR363 capacitive pressure sensor (Pfeiffer, Aßlar, Germany). A script in Matlab R2020b (MathWorks, Natick, MA, USA) was used to record the weight of the product as well as to record and control the chamber pressure. A WR340 waveguide was centrally embedded in the top of the process chamber and connected to an HY2020 SSG (TRUMPF, Freiburg im Breisgau, Germany) via a coaxial cable. The SSG could be set to frequencies between 2400 MHz and 2500 MHz with an accuracy of 0.01 MHz and had a maximum output power of 600 W. It was equipped with internal sensors to detect forward and reflected power. A second script in Matlab R2020b controlled forward power and frequency in addition to recording the microwave properties.
2.3. Process Characterization
A total of 24 frozen tylose gel samples were placed centrally on the product support in a 6 × 4 arrangement at a 5 mm distance, as depicted in Figure S1 in the Supplementary Materials. A vacuum was applied to the process chamber 10 min before microwave application. The measurement of process time started when the SSG was activated. Process characterization was carried out to detect the frequency-dependent energy efficiency in the range of 2400 MHz to 2500 MHz in an interval of 0.1 MHz. The forward power was set to the minimally feasible value of 50 W. With each measurement, the forward power and the reflected power were recorded. The energy efficiency was calculated via
This enabled the detection of RFs, which are defined as the frequencies of local maxima in energy efficiency. The dissipated power was calculated using
as the difference between the respective powers. The calculations in Equations (1) and (2) are based on the assumption that all power not reflected to the SSG must dissipate inside the process chamber. The power reflected by the coupling of the coaxial cable with waveguides or dissipated by heat losses in the coaxial cable is not considered. All process characterizations were conducted in triplicate and the arithmetic mean of the RFs was applied in the subsequent drying experiments.
2.4. Drying Procedure
The placement of the samples and the starting procedure of the process were chosen as in the process characterization. Before the start of each experiment, process parameters were set according to the specifications of the respective experiment in the parameter study (see Section 2.5). These were the set chamber pressure as well as the microwave properties of set forward power , control concept for the frequency, and activation ratio . The parameter describes the ratio of the active time of the SSG to the total time of drying , according to
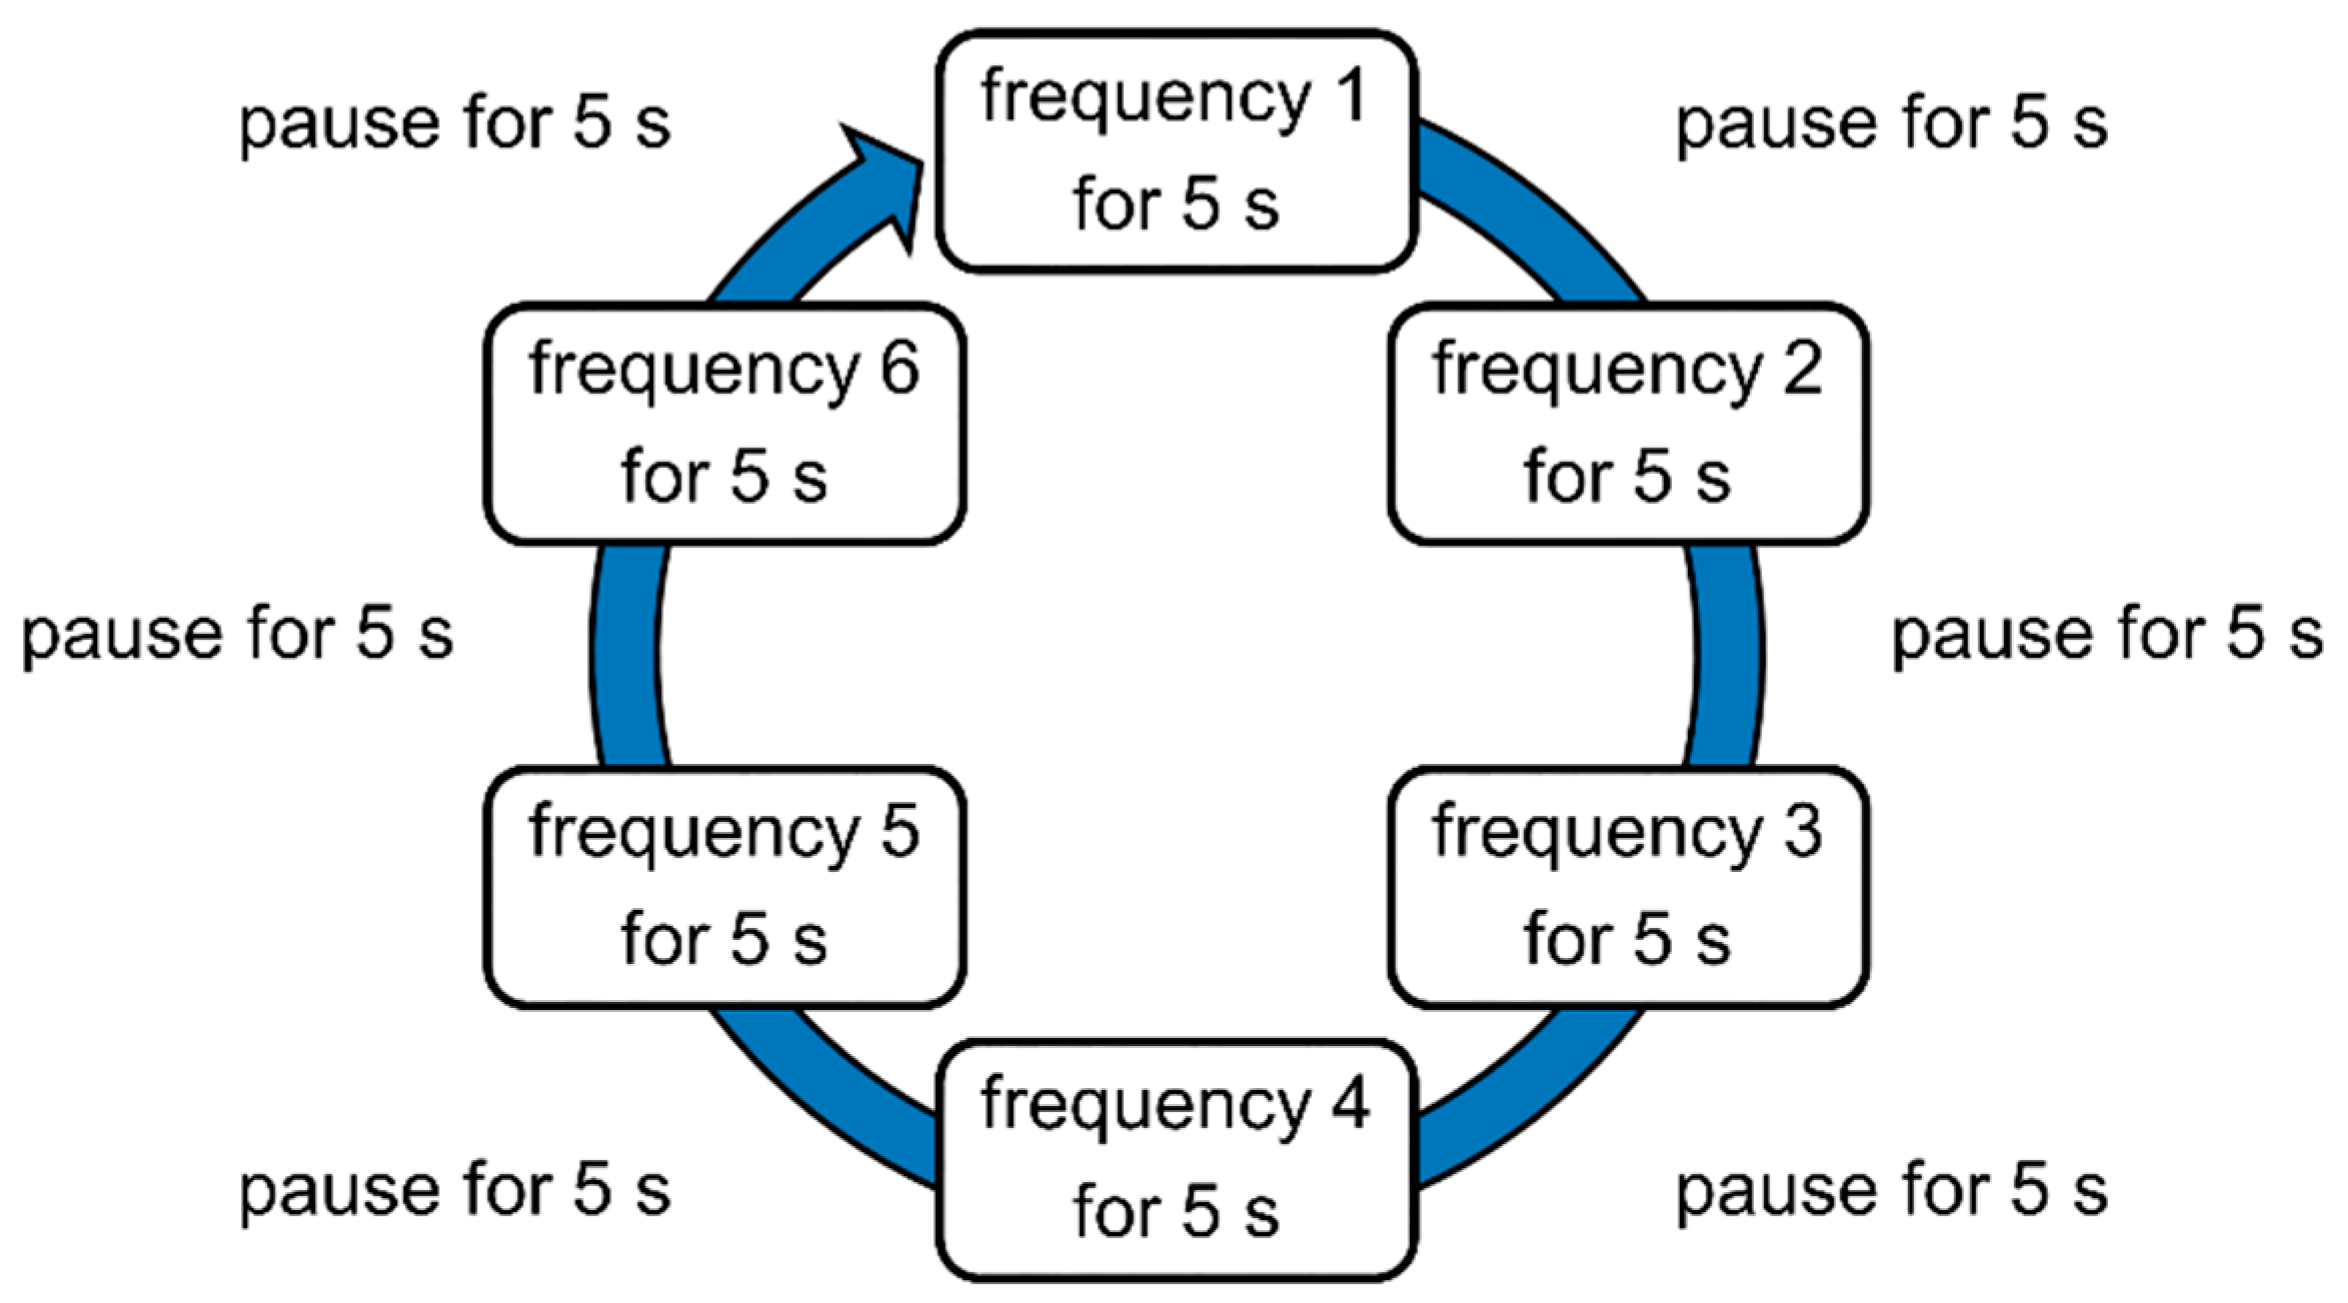
where is the total inactive time of the generator. While was kept constant during all experiments, the value of was adjusted to achieve specific time-averaged power levels. This allowed for the application of a lower time-averaged power level than determined by the minimally feasible value of , and potential nonlinearities that may occur when is changed directly were avoided. Each frequency utilized was applied for 10 s with the respective governing the period during which the microwave generator emitted power. When using multiple frequencies, the microwave application started at the lowest frequency and worked its way up to the highest frequency before starting the next frequency loop. The sequence of a frequency loop is shown in Figure 1 as an example of an arbitrary control concept with six frequencies.
Partial MFD was terminated when 20 wt% of the initially contained water mass was removed. The initial water mass was calculated from the composition and weight of the samples before drying. Complete MFD, conducted as a benchmark process, was terminated when the drying rate was less than 0.25 g/h, calculated over a period of 1 h.
The average specific dissipated power for each experiment was calculated using
as the product of with the arithmetic mean of the dissipated power of n applied frequencies throughout the whole process divided by the sum of the weights of the 24 individual samples . The average specific forward power was calculated in analogy to Equation (4), while the average chamber pressure was calculated as the arithmetic mean of all recorded values of chamber pressure. The average drying rate was determined using
as the weight difference during power application divided by process duration . Experiments in the parameter studies on frequency and pressure were conducted in triplicate. The experiments in the parameter study on power are single experiments since the power variations among experiments are taken into account when evaluating the results.
2.5. Process Parameters
Table 1 provides an overview of the specifications set in the experiments comparing the termination points between partial and complete drying as well as the experiments of the parameter studies. Set chamber pressure was varied from 0.2 mbar to 1.0 mbar in the respective parameter study. The default value in all other experiments was 0.5 mbar. The set forward power of the microwaves was 50 W for all experiments. The power applied in the parameter study on microwave power was varied by modifying the activation ratio between 0.25 and 1, while 0.25 was the default value in the remaining experiments. Microwave frequency was varied by applying different frequency-based control concepts. The required RFs had been identified in advance by process characterization. The frequency-based control concepts used were:
- Single Minimum Frequency (1MF)—frequency displaying the global minimum of energy efficiency;
- Single Resonant Frequency (1RF)—frequency displaying the global maximum of energy efficiency;
- Six Equidistant Frequencies (6EF)—frequencies from 2400 MHz to 2500 MHz at an interval of 20 MHz;
- Six Resonant Frequencies (6RF)—frequencies with the highest local maxima of energy efficiency.
The experiments in the parameter studies on pressure and power were carried out with 6RF, whereas the experiments to compare the termination points took place with 6EF. In all drying experiments, the frequencies of the various control concepts were set at the beginning of the process and kept constant throughout drying. The set values for chamber pressure and forward power deviated from the averaged measured values due to process control. The measured values are shown in Tables S1–S4 in the Supplementary Materials. The frequencies applied and identified in process characterization are shown in Tables S5 and S6 in the Supplementary Materials.
2.6. Sample Analysis
The individual samples were weighed on a Type 1518 balance (Sartorius, Göttingen, Germany) to determine the masses before MFD and after MFD . After cutting the samples in half, they were examined for signs of macroscopic product impairment. To assess the uniformity of drying, the residual moisture of each sample was determined gravimetrically. For this purpose, the freeze-dried samples were dried in a drying oven T6060 (Heraeus, Hanau, Germany) for at least 24 h at 105 °C. The weight of the samples was then determined using a precision balance LS 220A SCS (Precisa, Dietikon, Switzerland) and taken as the dry mass for the calculation of the standardized residual moisture , according to
2.7. Statistical Analysis
A one-way analysis of variance (ANOVA) was used to inspect the experimental results for statistically significant differences. First, a Shapiro–Wilk test was used to check whether the population was distributed normally. Levene’s test was used to test for equal variances, while Tukey’s test was used for the comparison of the means. All significance levels were set to 0.05. Significant differences in means are indicated by different grouping letters when all criteria for performing an ANOVA were met.
3. Results
3.1. Comparison Termination MFD
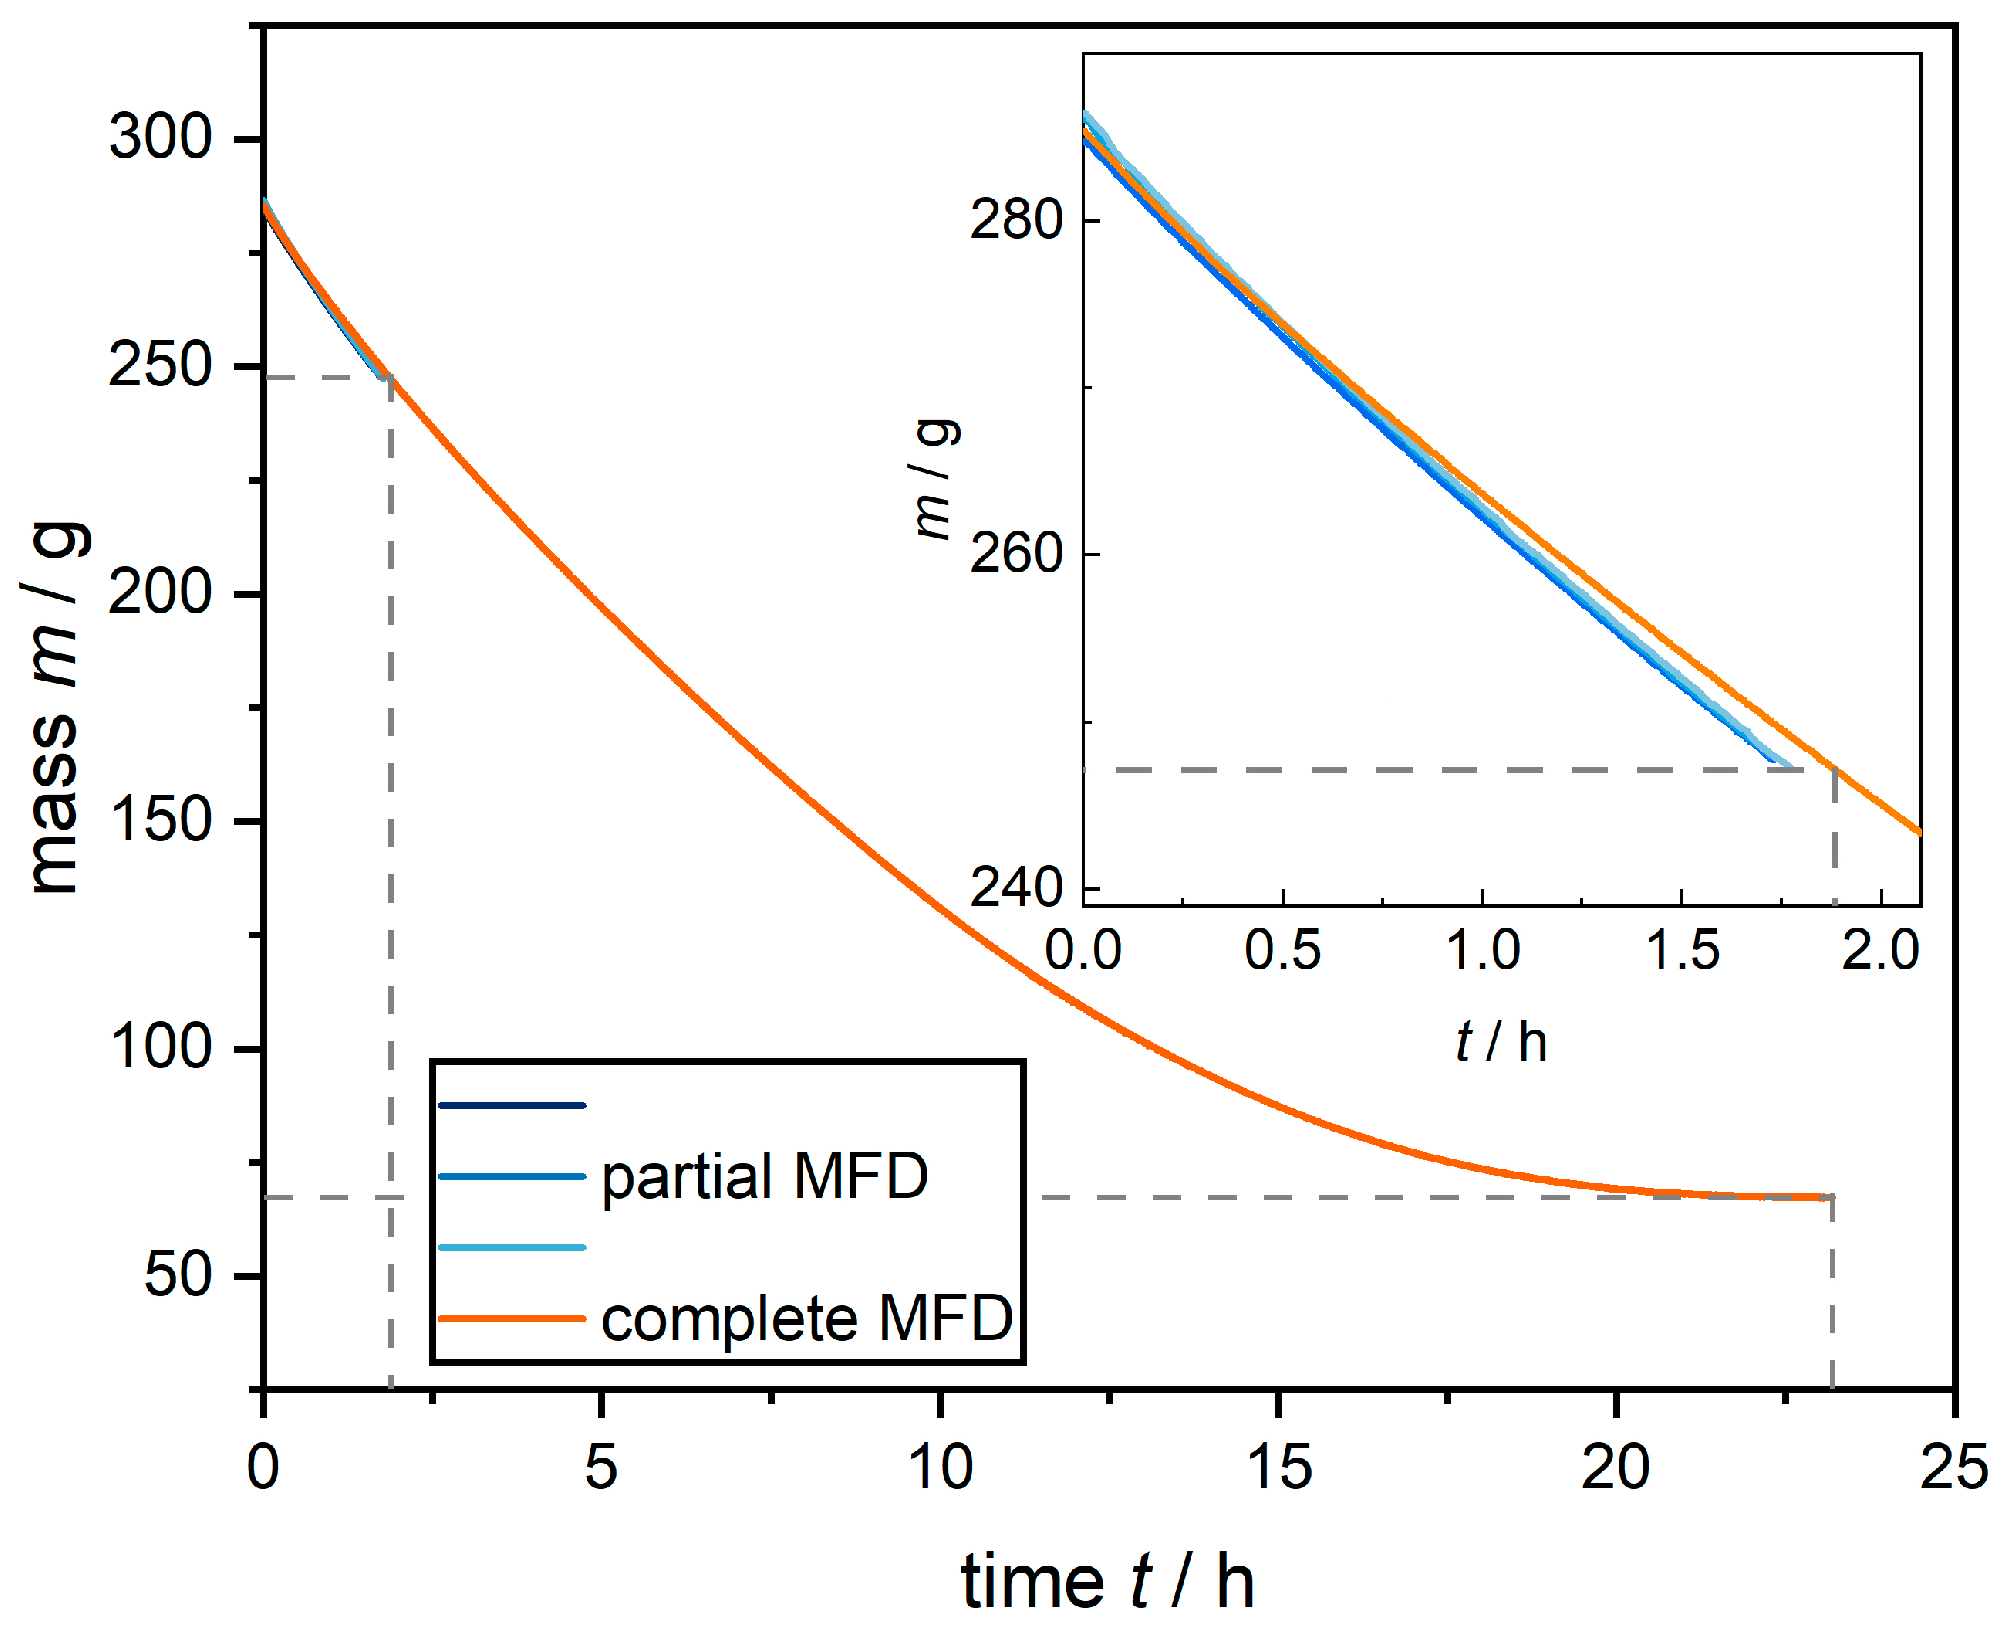
The drying kinetics of partial and complete MFD are depicted in Figure 2. No systematic differences between partial and complete drying were observed. All experiments exhibit the highest drying rate in the initial stage of the process, followed by a gradual decrease as drying progresses. This tendency is consistent with the literature [4,23]. A high reproducibility of drying kinetics is evident for partial MFD experiments. In the case studied, it took 7.0% longer for complete MFD to reach the termination criterion than for partial MFD. The discrepancy might be attributed to a recalibration of the SSG before complete MFD, leading to a slightly lower average specific forward power of 0.072 W/g in comparison to an average of 0.098 W/g for partial MFD. In terms of drying kinetics, partial MFD can therefore be considered representative of the initial part of complete MFD, in line with the anticipated behavior.
Implementing the partial drying termination criterion to complete MFD yields a process duration of approximately 1.9 h, corresponding to a 92.0% reduction compared to the duration of 23.2 h for complete MFD. Therefore, partial drying in parameter studies enables significantly higher experimental throughput, which results in shorter development times or a more customized process due to a higher number of tested parameter combinations. However, it is uncertain whether the results obtained in this early stage of the drying process will be useful when conducting a parameter study.
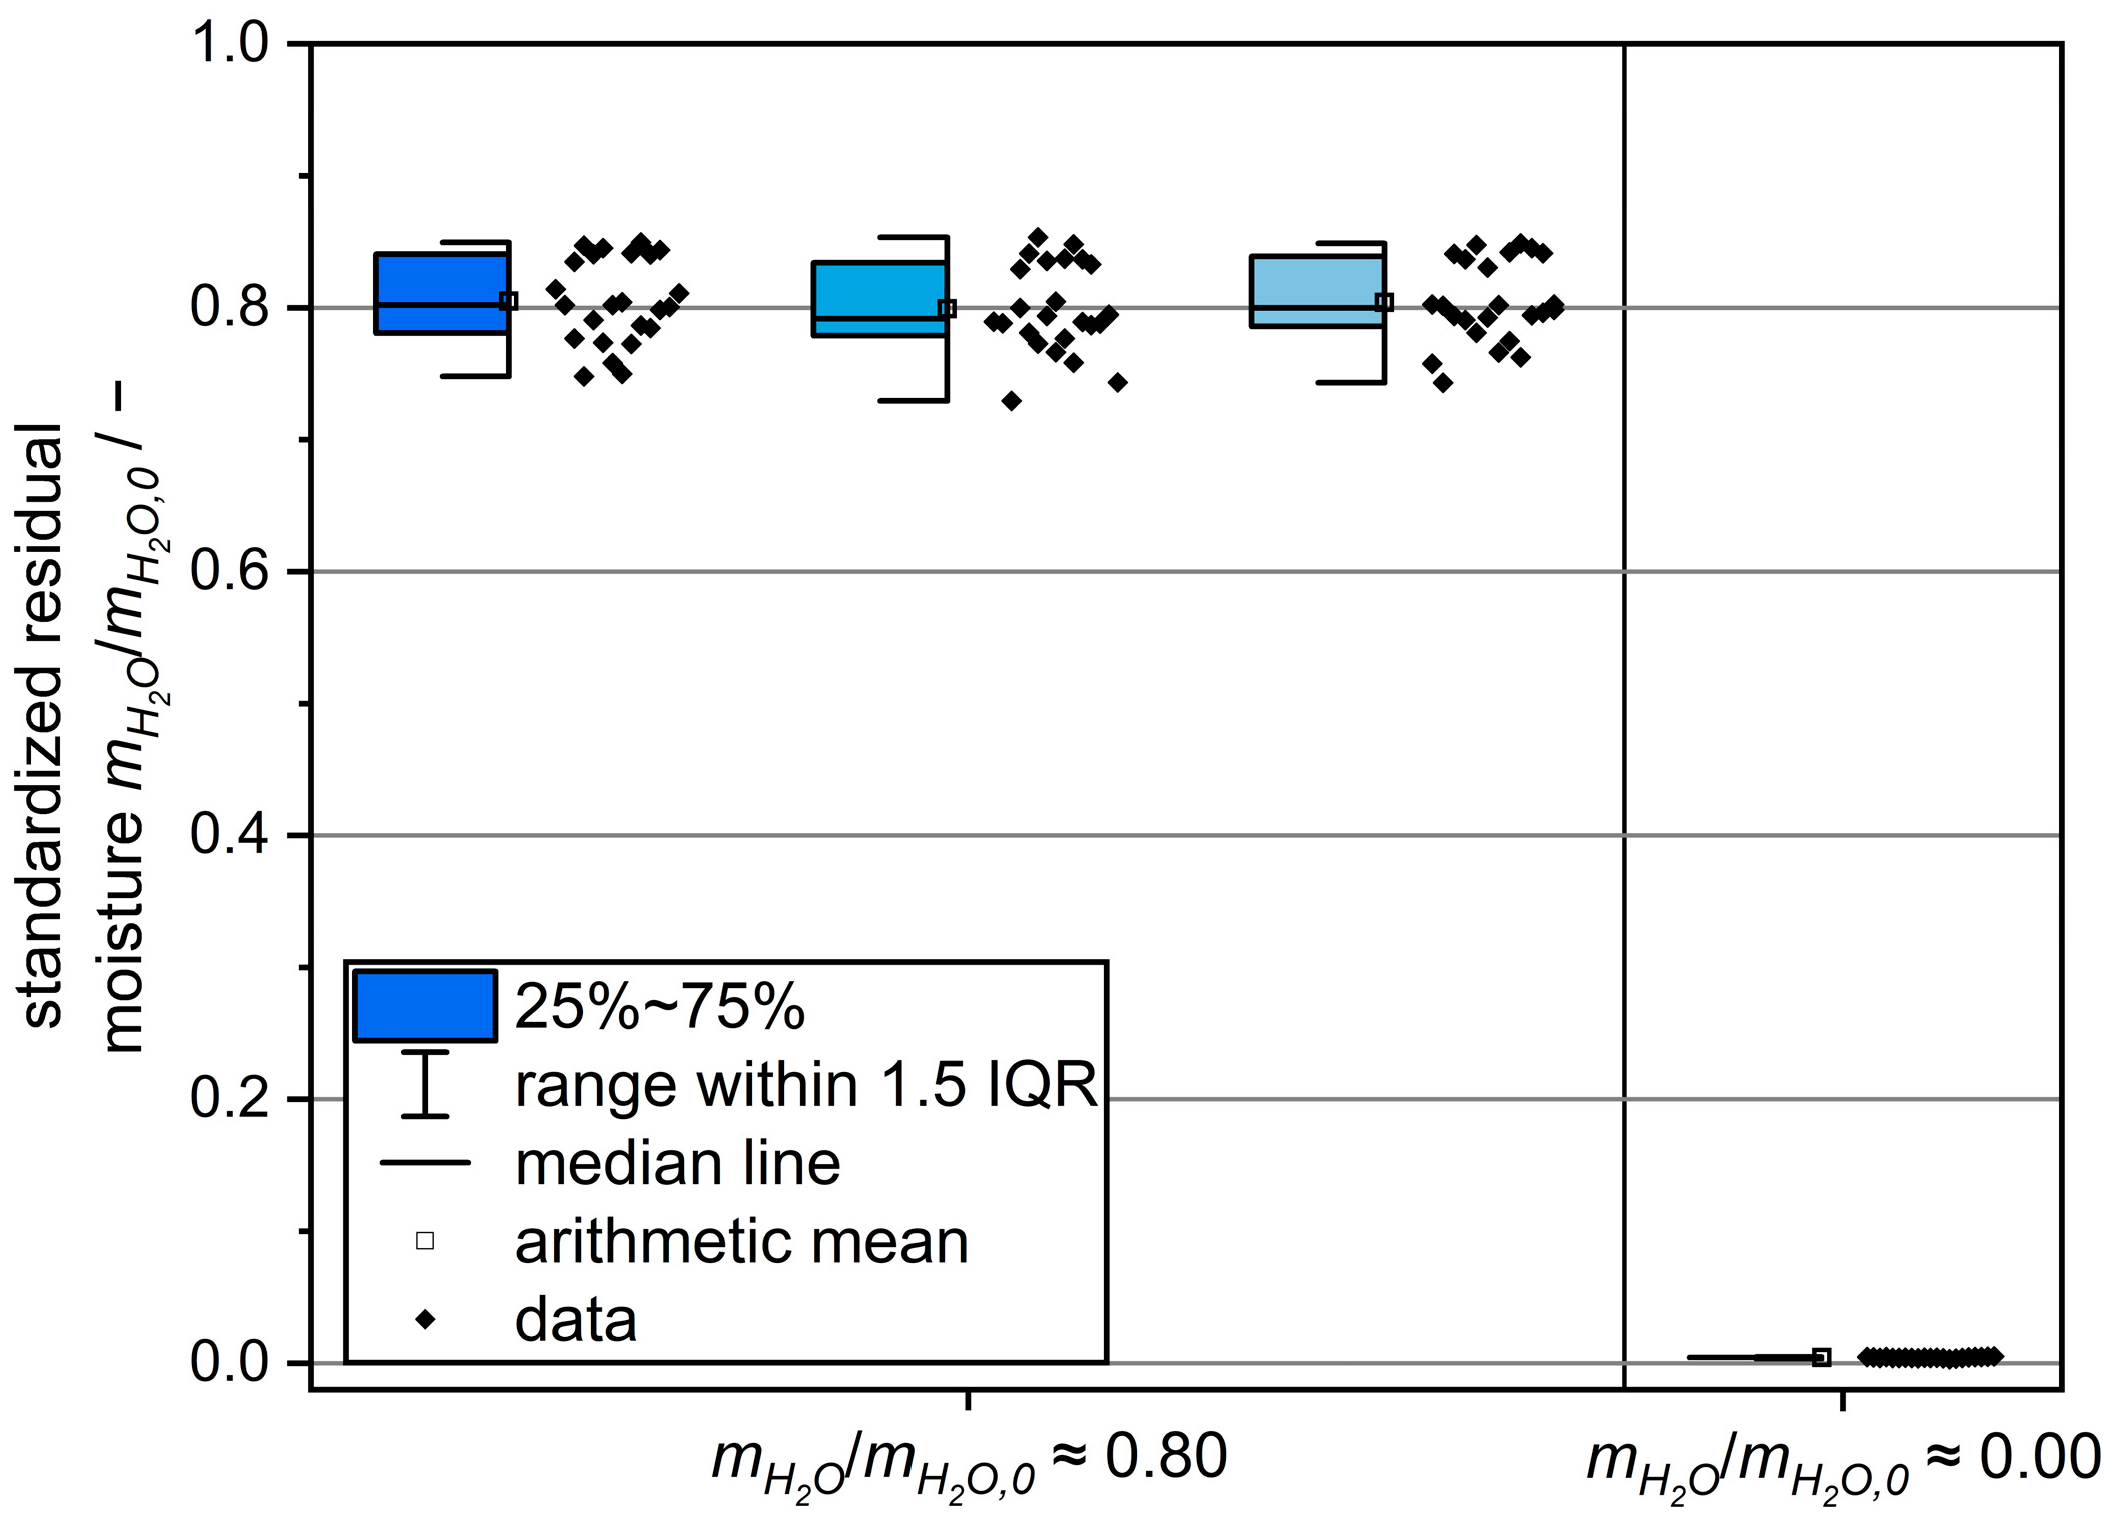
To assess drying homogeneity, Figure 3 shows the standardized residual moistures for complete MFD in comparison to partial MFD. For complete MFD, there were only small variations in residual moisture in the range of 0.004 to 0.005. In contrast to this, partial MFD resulted in residual moistures of the individual samples ranging from 0.753 to 0.848, indicating differences in drying kinetics among the individual samples. The narrow range for complete MFD was presumably caused by a convergence of residual moisture towards equilibrium at the end of drying. Samples that reach residual moisture near equilibrium first have the slowest drying rate at the end of the process, since only small amounts of water remain to be removed. The resulting narrow distribution of residual moisture is not suited for determining the drying homogeneity of the samples. In contrast to this, partial MFD allowed drying homogeneity to be evaluated due to a broader range of residual moisture. This is particularly relevant to evaluating the homogeneity of dissipated microwave power in MFD. A similar approach was used by Assegehegn et al. [19] to determine the drying homogeneity in CFD. Drying was terminated when the primary drying of vials with the highest drying rates was completed. On this basis, the average drying rates for all vials were calculated and the drying homogeneities for different process conditions could be compared. These results support the suitability of partial drying for parameter studies, as its drying kinetics are representative. Partial drying is particularly suitable for studying drying homogeneity.
3.2. Parameter Study
3.2.1. Chamber Pressure
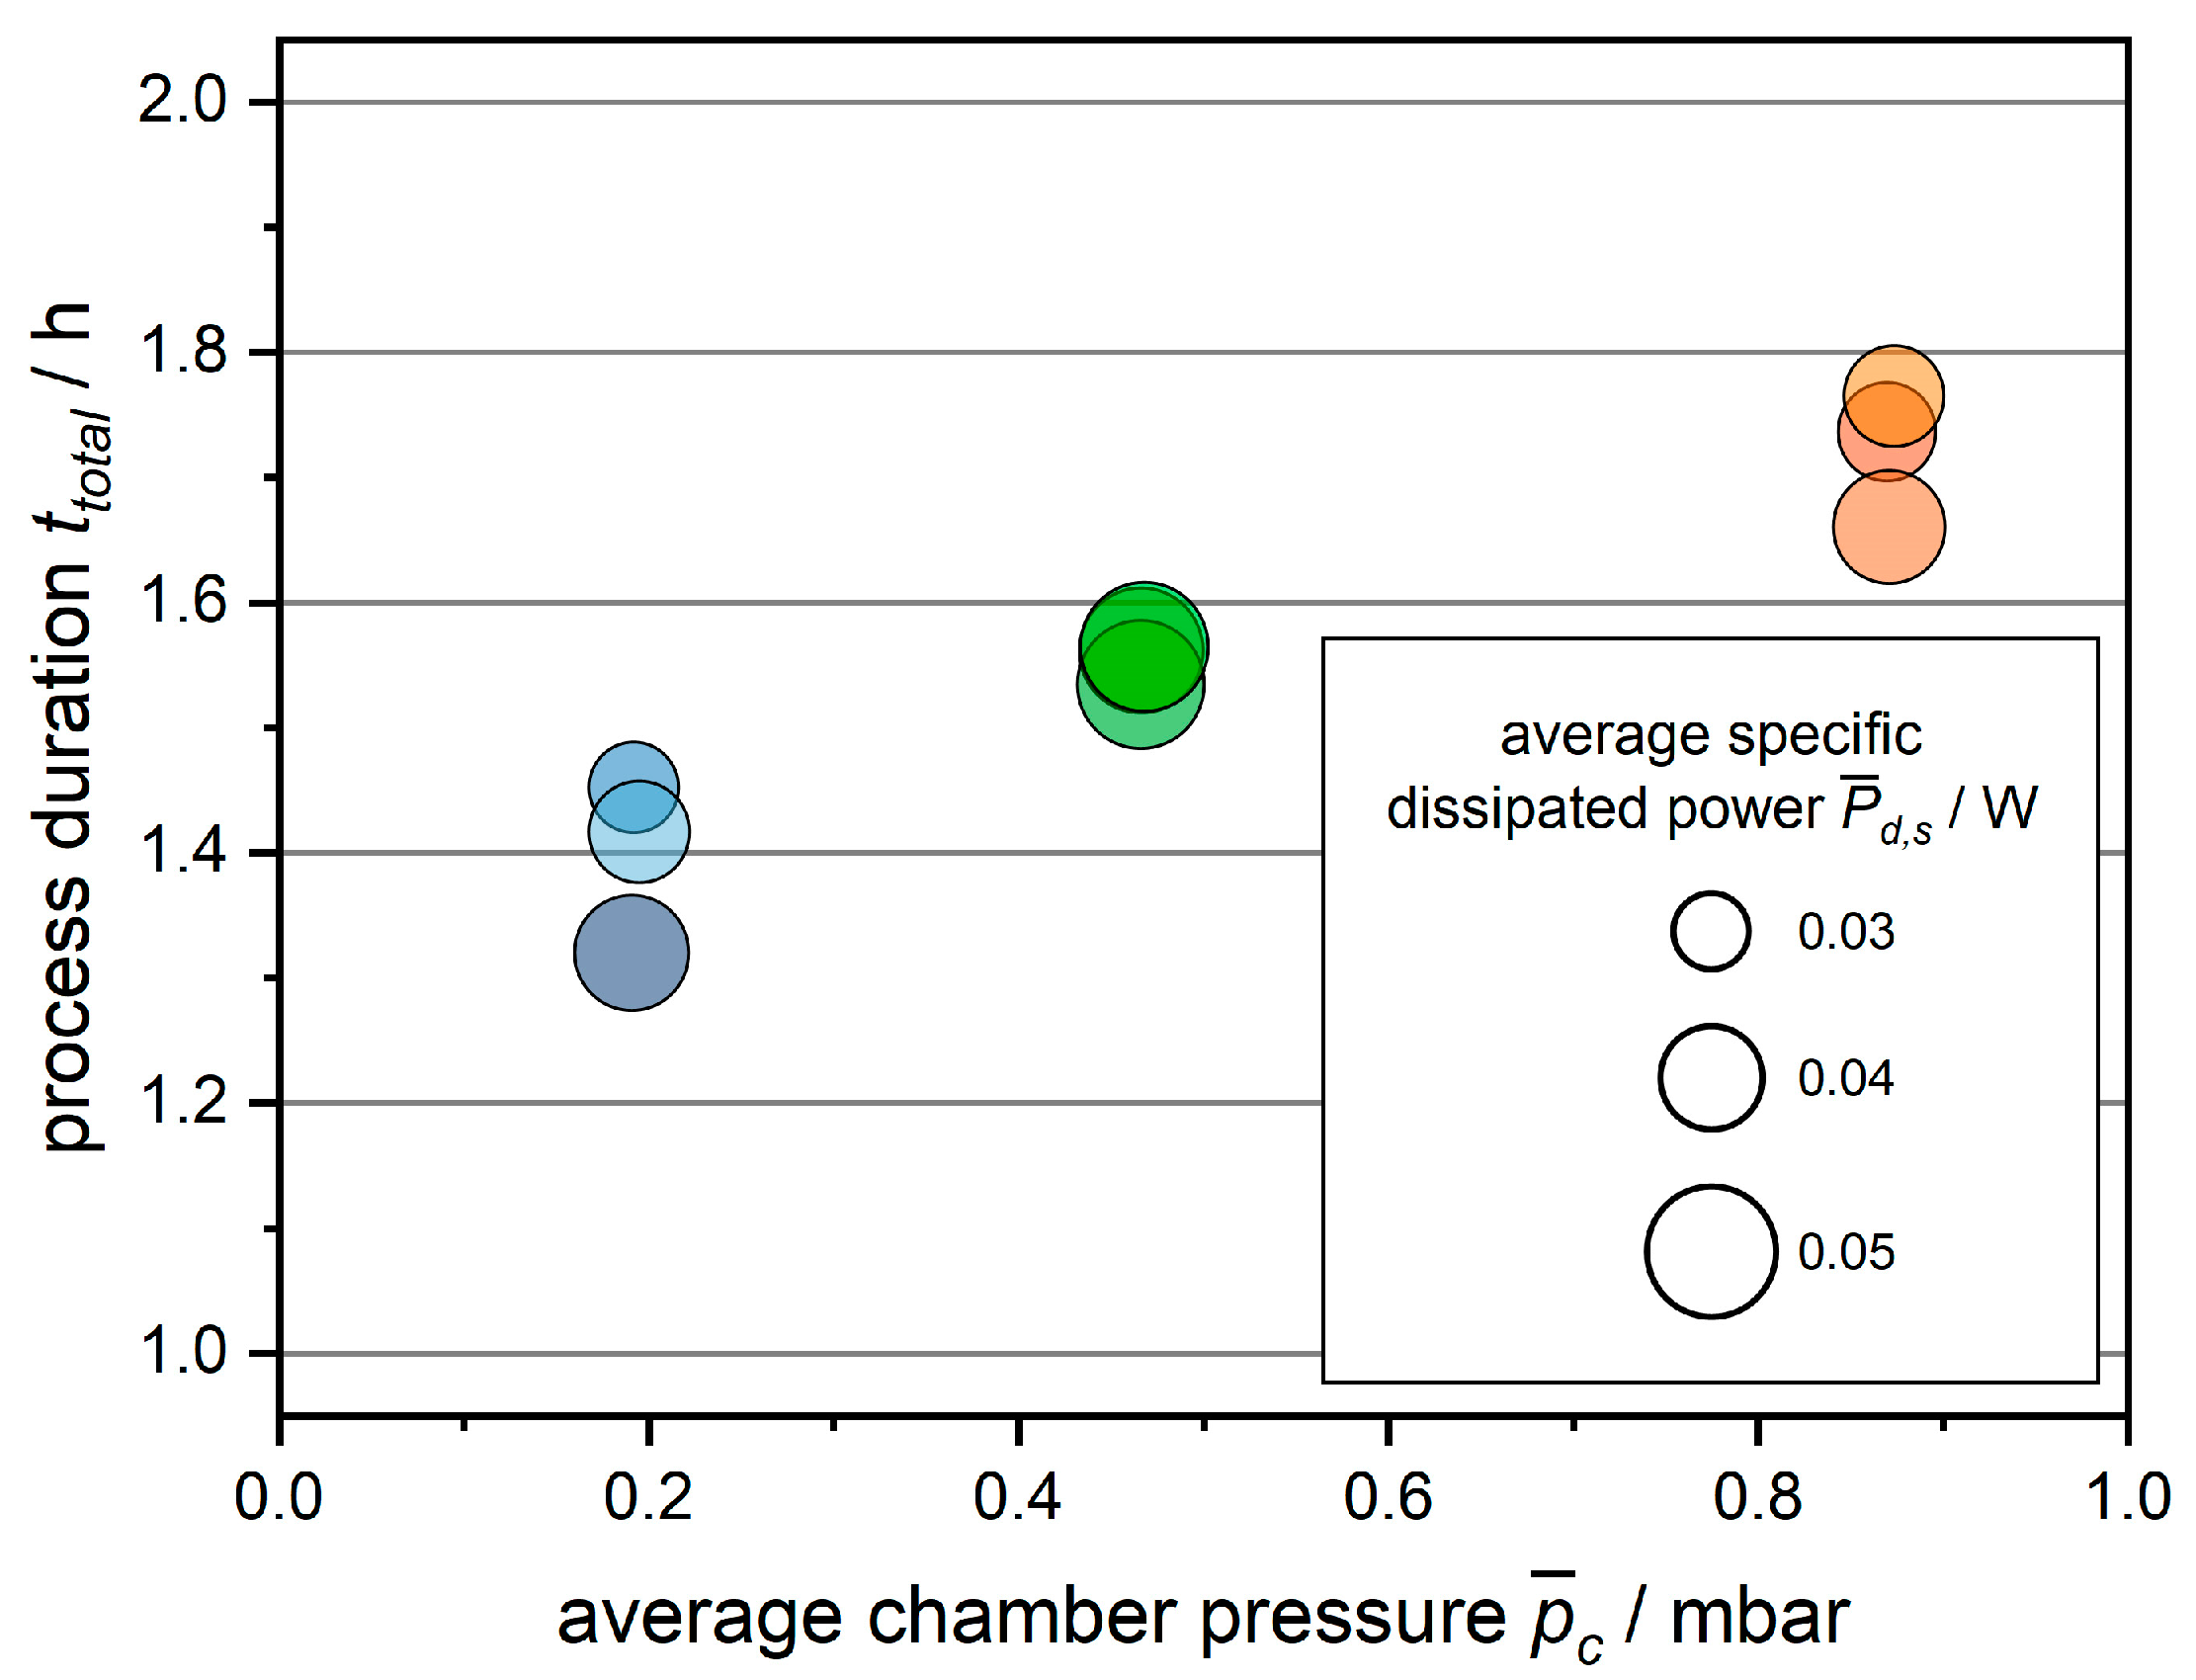
The process duration of partial MFD is plotted in Figure 4 for the chamber pressures investigated and the corresponding specific dissipated power. Figure S2 in the Supplementary Materials provides the drying kinetics in detail. The decrease in average chamber pressure from 0.87 mbar to 0.19 mbar reduced the process duration by 18.8%, indicating a correlation between a lower chamber pressure and a shorter process duration. The differences in the arithmetic means of process duration are statistically significant, as shown in Table 2. In addition to chamber pressure, dissipated power must be taken into account. This is because the chamber pressure influences the frequency and energy efficiency of the applied RF, which leads to differences in power dissipation. Furthermore, specific dissipated powers varied at distinct chamber pressure levels due to differences in forward power among experiments, caused by limitations of the SSG setup used. These constraints are discussed extensively in Section 3.3. In the experiments of the parameter study, higher specific dissipated power should lead to a shorter process duration [2,4,5,8,21,23,24,25]. Accordingly, a trend to shorter process durations with higher dissipated power at the individual chamber pressure levels indicates the suspected influence of the dissipated power. This is particularly visible at 0.19 mbar and 0.87 mbar in Figure 4. However, the correlation of chamber pressure with process duration cannot be explained solely by differences in dissipated power, since the shortest process durations did not occur at the highest levels of dissipated power (see Table 2).
Shorter process durations with lower chamber pressures contradict the literature results for MFD. According to those results, decreases in chamber pressure led to longer drying durations in combination with a lower product temperature [4] or a negligible effect on drying time [21]. To investigate the causes of these contradictions in detail, a one-way ANOVA of several relevant process parameters was conducted. The corresponding results are shown in Table 2. The removed water mass was almost constant at 45.1 g for all chamber pressures. In contrast to this, the water mass removed during the 10 min of creating the vacuum before the application of microwaves was significantly lower for the average chamber pressure of 0.19 mbar than for the remaining pressure levels (compare Figure S2 in the Supplementary Materials). Consequently, less water had to be removed during microwave application, which resulted in a shorter process duration. The lower sublimation temperature at a lower vapor pressure of ice [34] could be the cause of the difference in removed water mass before microwave application. Since the samples were frozen outside the process chamber and heated up during handling before MFD, their temperature presumably dropped to the temperature of sublimation when the vacuum was applied. The temperature of sublimation can be approximated by using the chamber pressure for the vapor pressure of ice when assuming that the atmosphere solely consists of water vapor and that mass transport resistance is negligible at the initial stage of drying. For the average chamber pressures of 0.19 mbar, 0.47 mbar, and 0.87 mbar, the sublimation temperatures are about −36.5 °C, −27.9 °C, and −21.8 °C, respectively [34]. Some of the energy released by cooling the samples may have provided the enthalpy of sublimation, resulting in a loss of ice from the samples. In addition, the lower temperatures of the samples at the lower chamber pressure presumably led to a higher energy input by thermal radiation. Therefore, the result of a higher mass of water removed prior to the application of microwaves with lower chamber pressure is consistent with theoretical considerations.
Moreover, the arithmetic means of the drying rate during power application at the average chamber pressures of 0.19 mbar and 0.47 mbar were significantly higher than for the experiments at 0.87 mbar. This suggests higher drying rates with a lower chamber pressure, contradicting the aforementioned literature [4,21]. However, the relative differences in average drying rates at 0.47 mbar and 0.87 mbar in comparison to 0.19 mbar are relatively small, less than 10%. The higher drying rate at 0.19 mbar compared to 0.87 mbar is particularly informative since the data were obtained at similar average specific dissipated powers. The comparable drying rates between 0.19 mbar and 0.47 mbar may be explained by a slightly higher specific forward power and energy efficiency at 0.47 mbar, leading to a higher specific dissipated power. The cause of the slight rise in drying rate with increasing chamber pressure, contrary to the expectations based on the literature, could be the relatively low applied power. Thus, the process might have been limited by the heat transfer. Mass transfer limitations determined by the chamber pressure might have played a negligible role only. In addition, the relatively thin, porous layer during partial MFD might not be representative of the mass transfer limitations in complete MFD. The implications for the applicability of partial MFD are discussed comprehensively in Section 3.3.
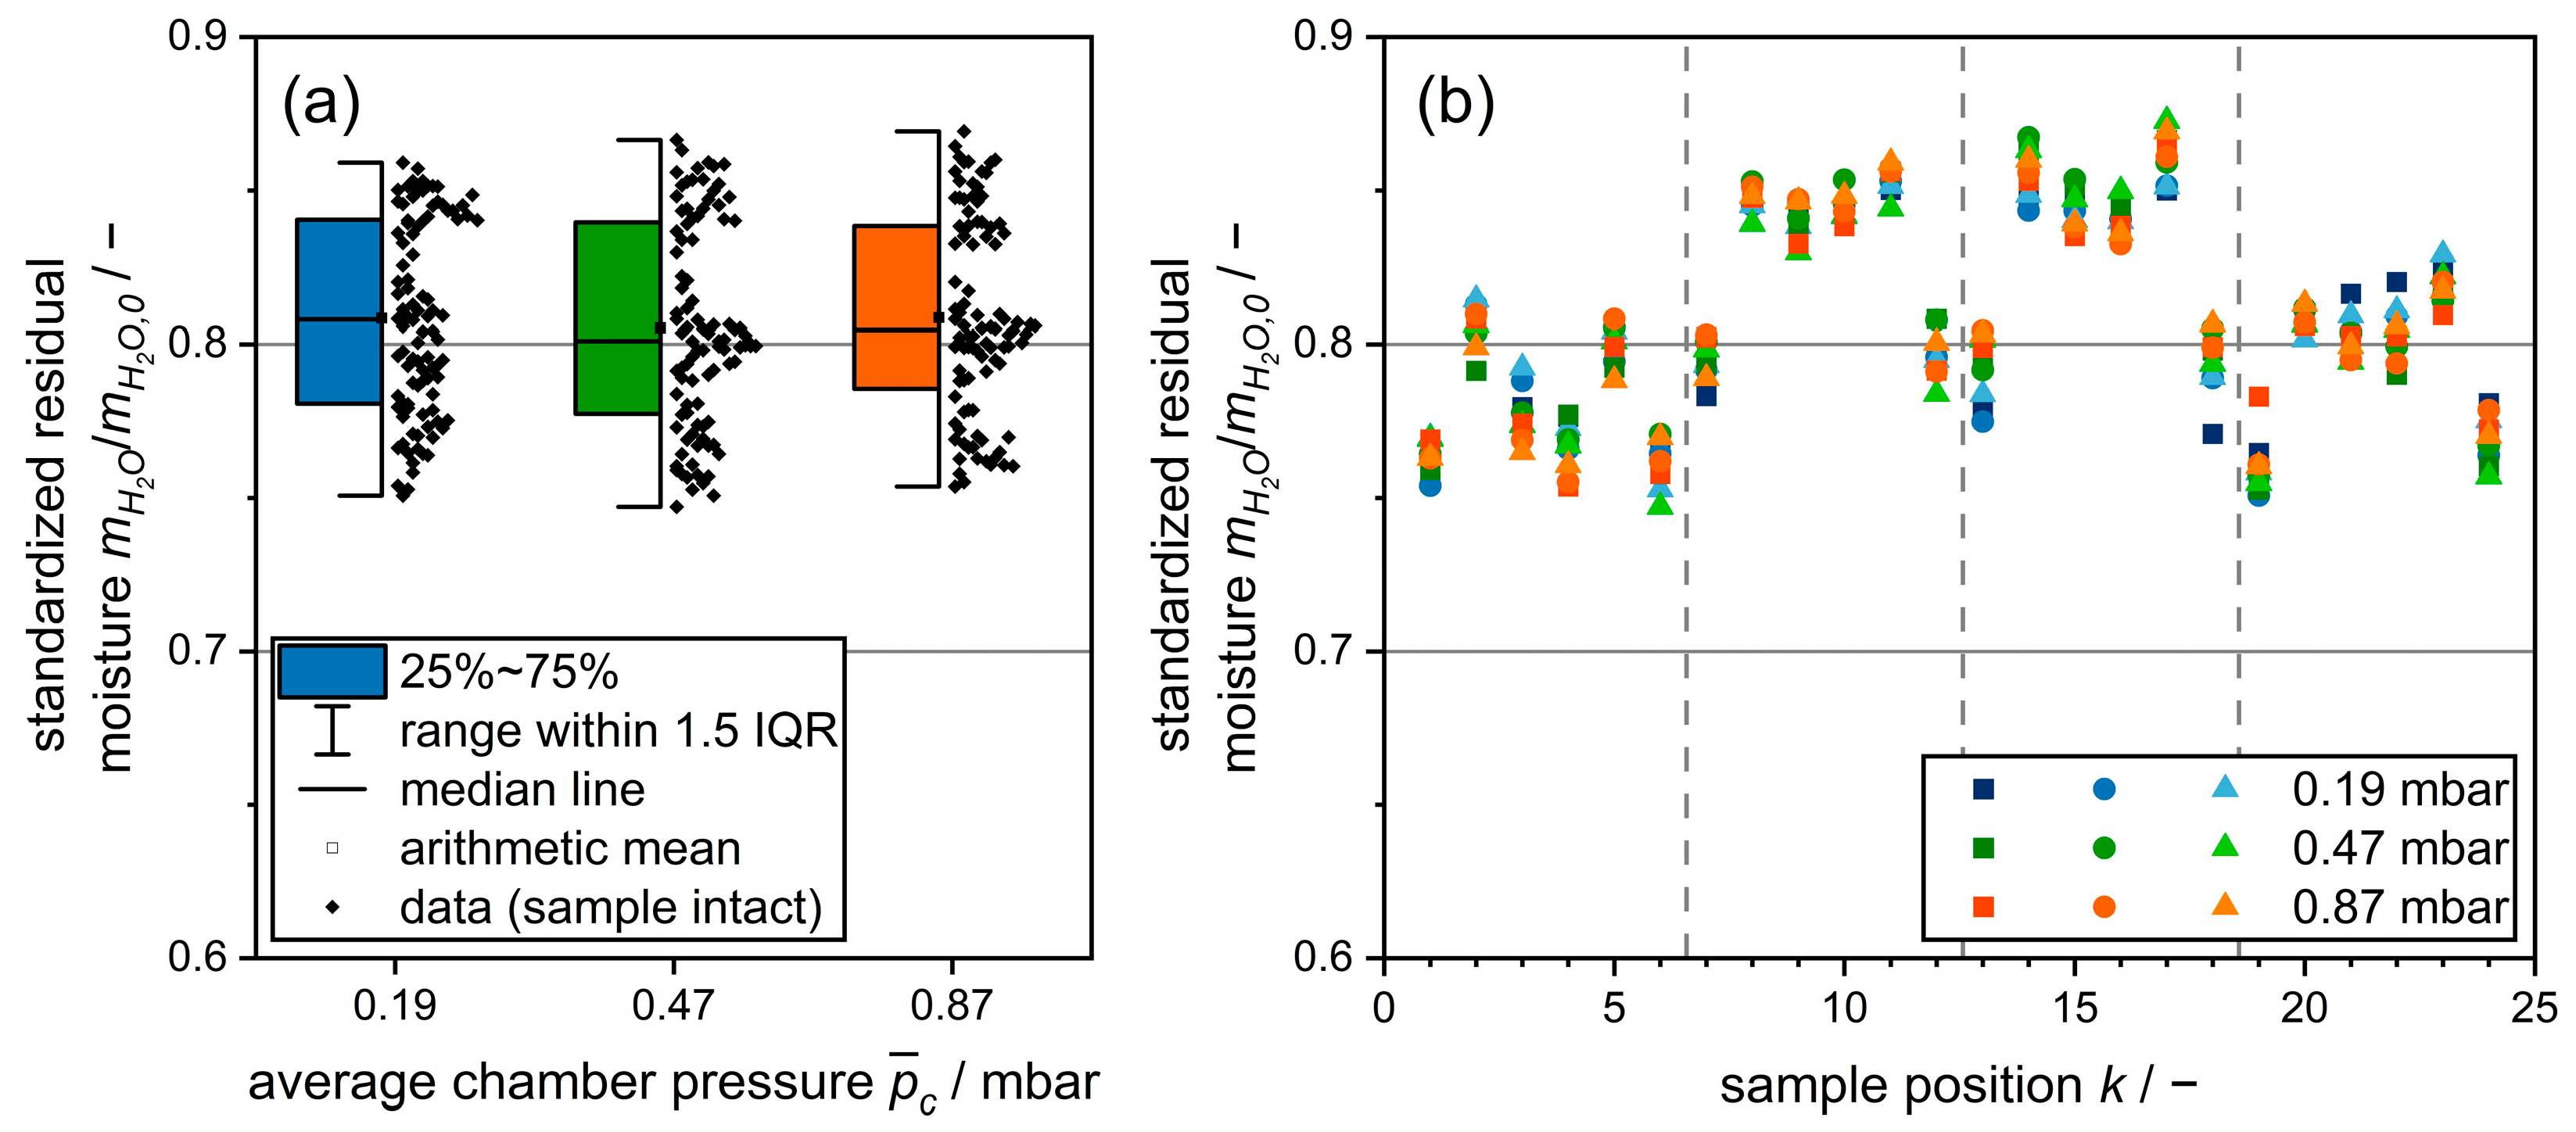
To investigate the effects of chamber pressure on drying homogeneity, the residual moisture of each sample versus chamber pressure is shown in Figure 5a. The residual moistures are in a similar range for all chamber pressures with no outliers, the respective minimum and maximum values being 0.747 and 0.869. Optical observation showed no impairment of the macroscopic structure in any sample. Thus, chamber pressure in the range of 0.19 mbar to 0.87 mbar does not appear to have a significant effect on either drying homogeneity or the product structure in partial MFD of tylose gel with the set microwave properties. For each chamber pressure, the data points accumulate around three residual moistures at 0.76, 0.80, and 0.85. This may be explained by the dependency of the residual moisture on the position of the samples, as depicted in Figure 5b. The drying state of the samples differs since the power dissipation in MFD is inhomogeneous [9]. In addition to the energy input by microwaves, thermal radiation could also occur from the uncooled walls of the process chamber. Samples at the edges and corners of the arrangement are likely to be more exposed to thermal radiation due to the larger exposed surface. Accordingly, samples in the center of the arrangement generally exhibit the highest residual moisture, followed by samples at the edges and the corners of the arrangement. This is consistent with the observed faster drying of edge vials in CFD, associated with additional energy input due to thermal radiation [35]. Deviations from the expected residual moistures are presumably caused by a difference in dissipated microwave power between samples, as reflected by samples 3 and 4, which have relatively low residual moistures. Nonetheless, the effects of thermal radiation seem to be predominant over the effects of the pattern of the electromagnetic field during the examined part of MFD.
3.2.2. Microwave Power
In the present study, the average forward power was varied by the activation ratio. However, the activation ratio affected the power level of the generator, as will be outlined in Section 3.3. To account for this phenomenon, the effect of microwave power is evaluated via the average specific dissipated power, as the product of energy efficiency and average specific forward power. Note that the value of the average specific dissipated power does not correlate linearly with the activation ratio, i.e., the individual activation ratios do not occur sequentially with increasing average specific dissipated power. The exact values of the activation ratio and the specific forward power are given in Table S3 in the Supplementary Materials.
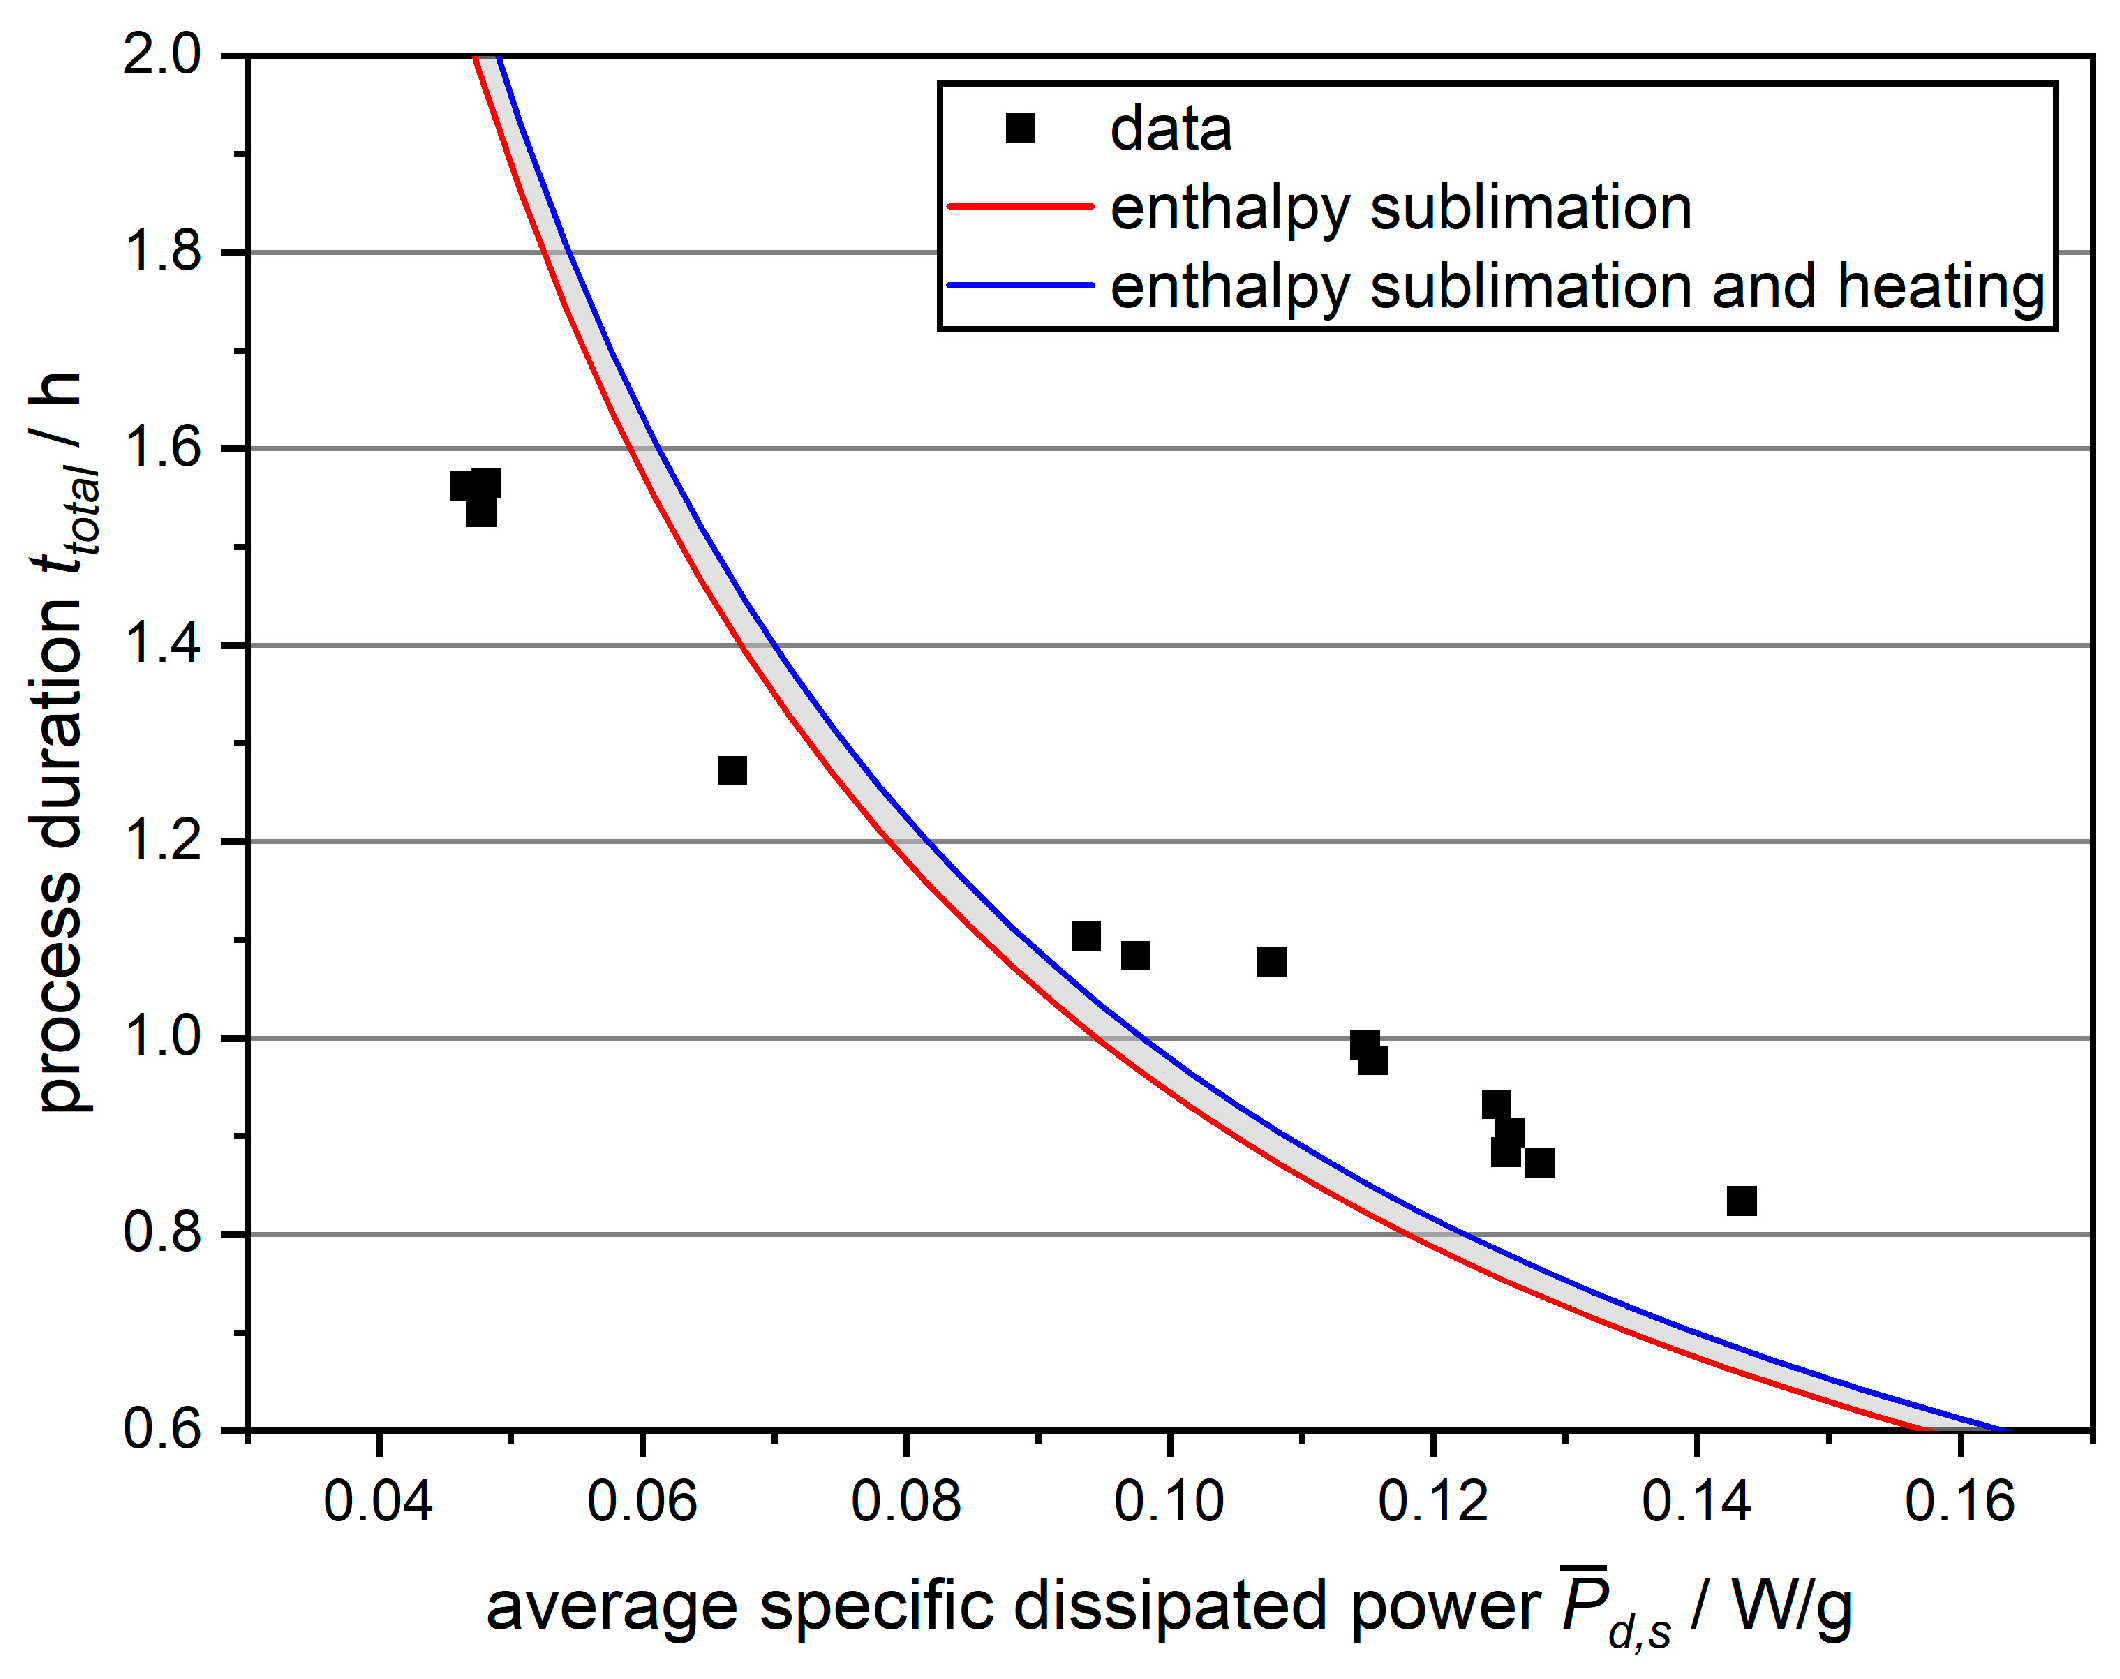
The influence of the average specific dissipated microwave power on process duration is obvious from Figure 6. The average specific dissipated power here correlates approximately linearly with the average forward power since the average energy efficiency was relatively constant at 77.7% to 80.3%. In Figure 6, the higher average specific dissipated power correlates with a shorter process duration. For instance, the process duration dropped by 46.7% when the average specific dissipated microwave power increased from 0.048 W/g to 0.143 W/g. The observed correlation between the higher microwave power and shorter process duration in partial MFD is in agreement with the literature on complete MFD [2,4,5,8,21,23,24,25]. Therefore, partial MFD seems to be suitable for qualitatively studying the effect of microwave power. The resulting drying kinetics at the investigated power levels are shown in detail in Figure S2 in the Supplementary Materials.
In Figure 6, isenthalpic lines are plotted next to the experimental data. The red line corresponds to the enthalpy of sublimation, while the blue line additionally accounts for the enthalpies for heating the dry product matrix and water vapor to ambient temperature. All data points should be located in the area colored gray between the isenthalpic lines when assuming that energy was supplied by microwaves only and all energy was utilized to supply the enthalpy of sublimation or to heat the product. These assumptions are not satisfied, since no data point is located within the gray area. At low power levels, less electromagnetic energy was dissipated in the process chamber than required for sublimation. At medium to high power, more energy was dissipated in the process chamber than required to heat the water vapor and dry product matrix in addition to providing the sublimation enthalpy. These observations suggest at least two mechanisms of energy transfer. The presence of some points below the curve of sublimation enthalpy indicates that there is another source of energy apart from microwaves contributing to the enthalpy of sublimation. One possible mechanism is thermal radiation from the uncooled walls of the process chamber. With low dissipated power, lower temperatures on the product surface might have contributed to an increased energy transfer by thermal radiation. At medium and high dissipated power, more energy dissipated in the process chamber than theoretically required for sublimation as well as for heating the samples and water vapor. This suggests that electromagnetic energy did not dissipate in the samples but elsewhere, e.g., in the product support or gaskets. In addition, it is known that microwave power losses may occur in resonators due to induced currents in the walls of the process chamber [36]. Furthermore, it might be necessary to supply additional latent enthalpy to remove water from the samples, e.g., for the desorption of unfrozen water, which is known to be present in tylose gel [37].
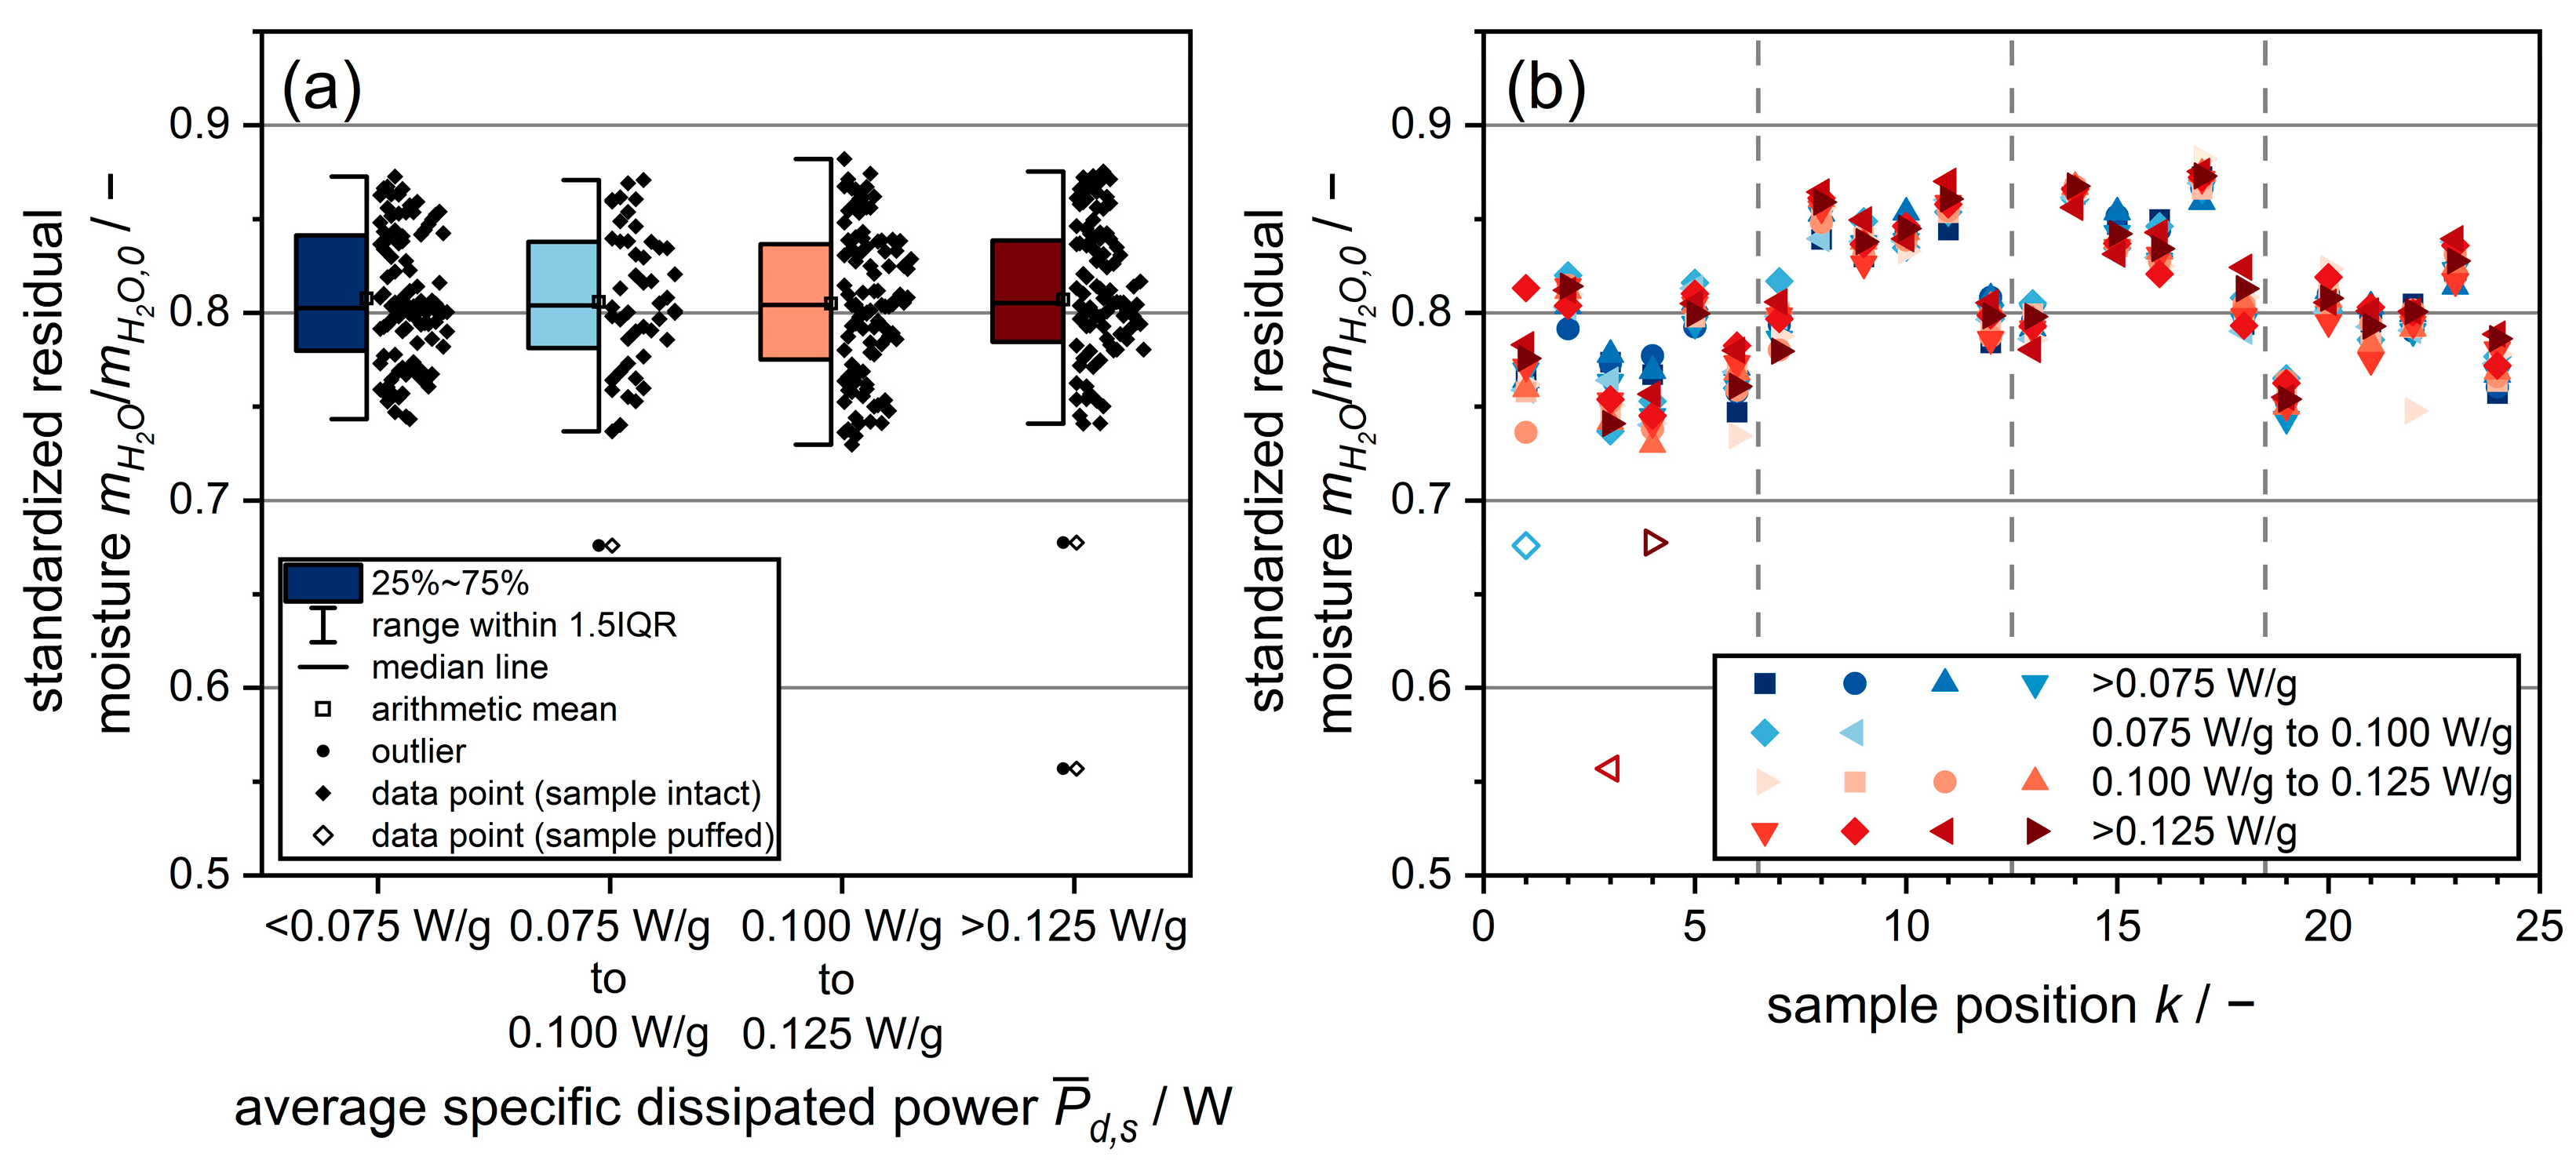
To evaluate drying homogeneity, the standardized residual moistures of the dried samples are depicted as a function of the average specific dissipated power in Figure 7a and as a function of sample position in Figure 7b. The range of the residual moisture is approximately constant with average specific dissipated powers, ranging from 0.743 to 0.872 at <0.075 W to 0.741 to 0.875 at >0.125 W/g. These similar ranges can be explained by the same patterns of the electromagnetic field, which are not affected by microwave power. In contrast to frequency, microwave power only affects the amplitudes of the electromagnetic field. As with the parameter study on chamber pressure, the samples in the center of the arrangement in Figure 7b have the highest residual moisture contents. Presumably, this is also due to the effect of thermal radiation. However, there are outliers in residual moisture at positions 1, 3, and 4 at a specific dissipated power > 0.075 W/g. At >0.125 W/g, these outliers appear to be more frequent, although this statement is not conclusive due to the small number of outliers. Optical observations showed that these outliers were structurally impaired samples, as depicted in Figure S4 in the Supplementary Materials. The formation of relatively large pores inside the samples was presumably caused by the melting of the samples. Liquid water absorbs more microwave power than ice. The increased uptake of energy following melting probably led to the buildup of vapor pressure inside the samples. This impaired the macroscopic structure when the product matrix could no longer withstand the pressure gradient. This mechanism of product impairment is referred to as puffing. Puffing correlated with a relatively low residual moisture. This was probably caused by the relatively high amount of dissipated energy due to melting and the formation of large pores inside the samples.
3.2.3. Microwave Frequency
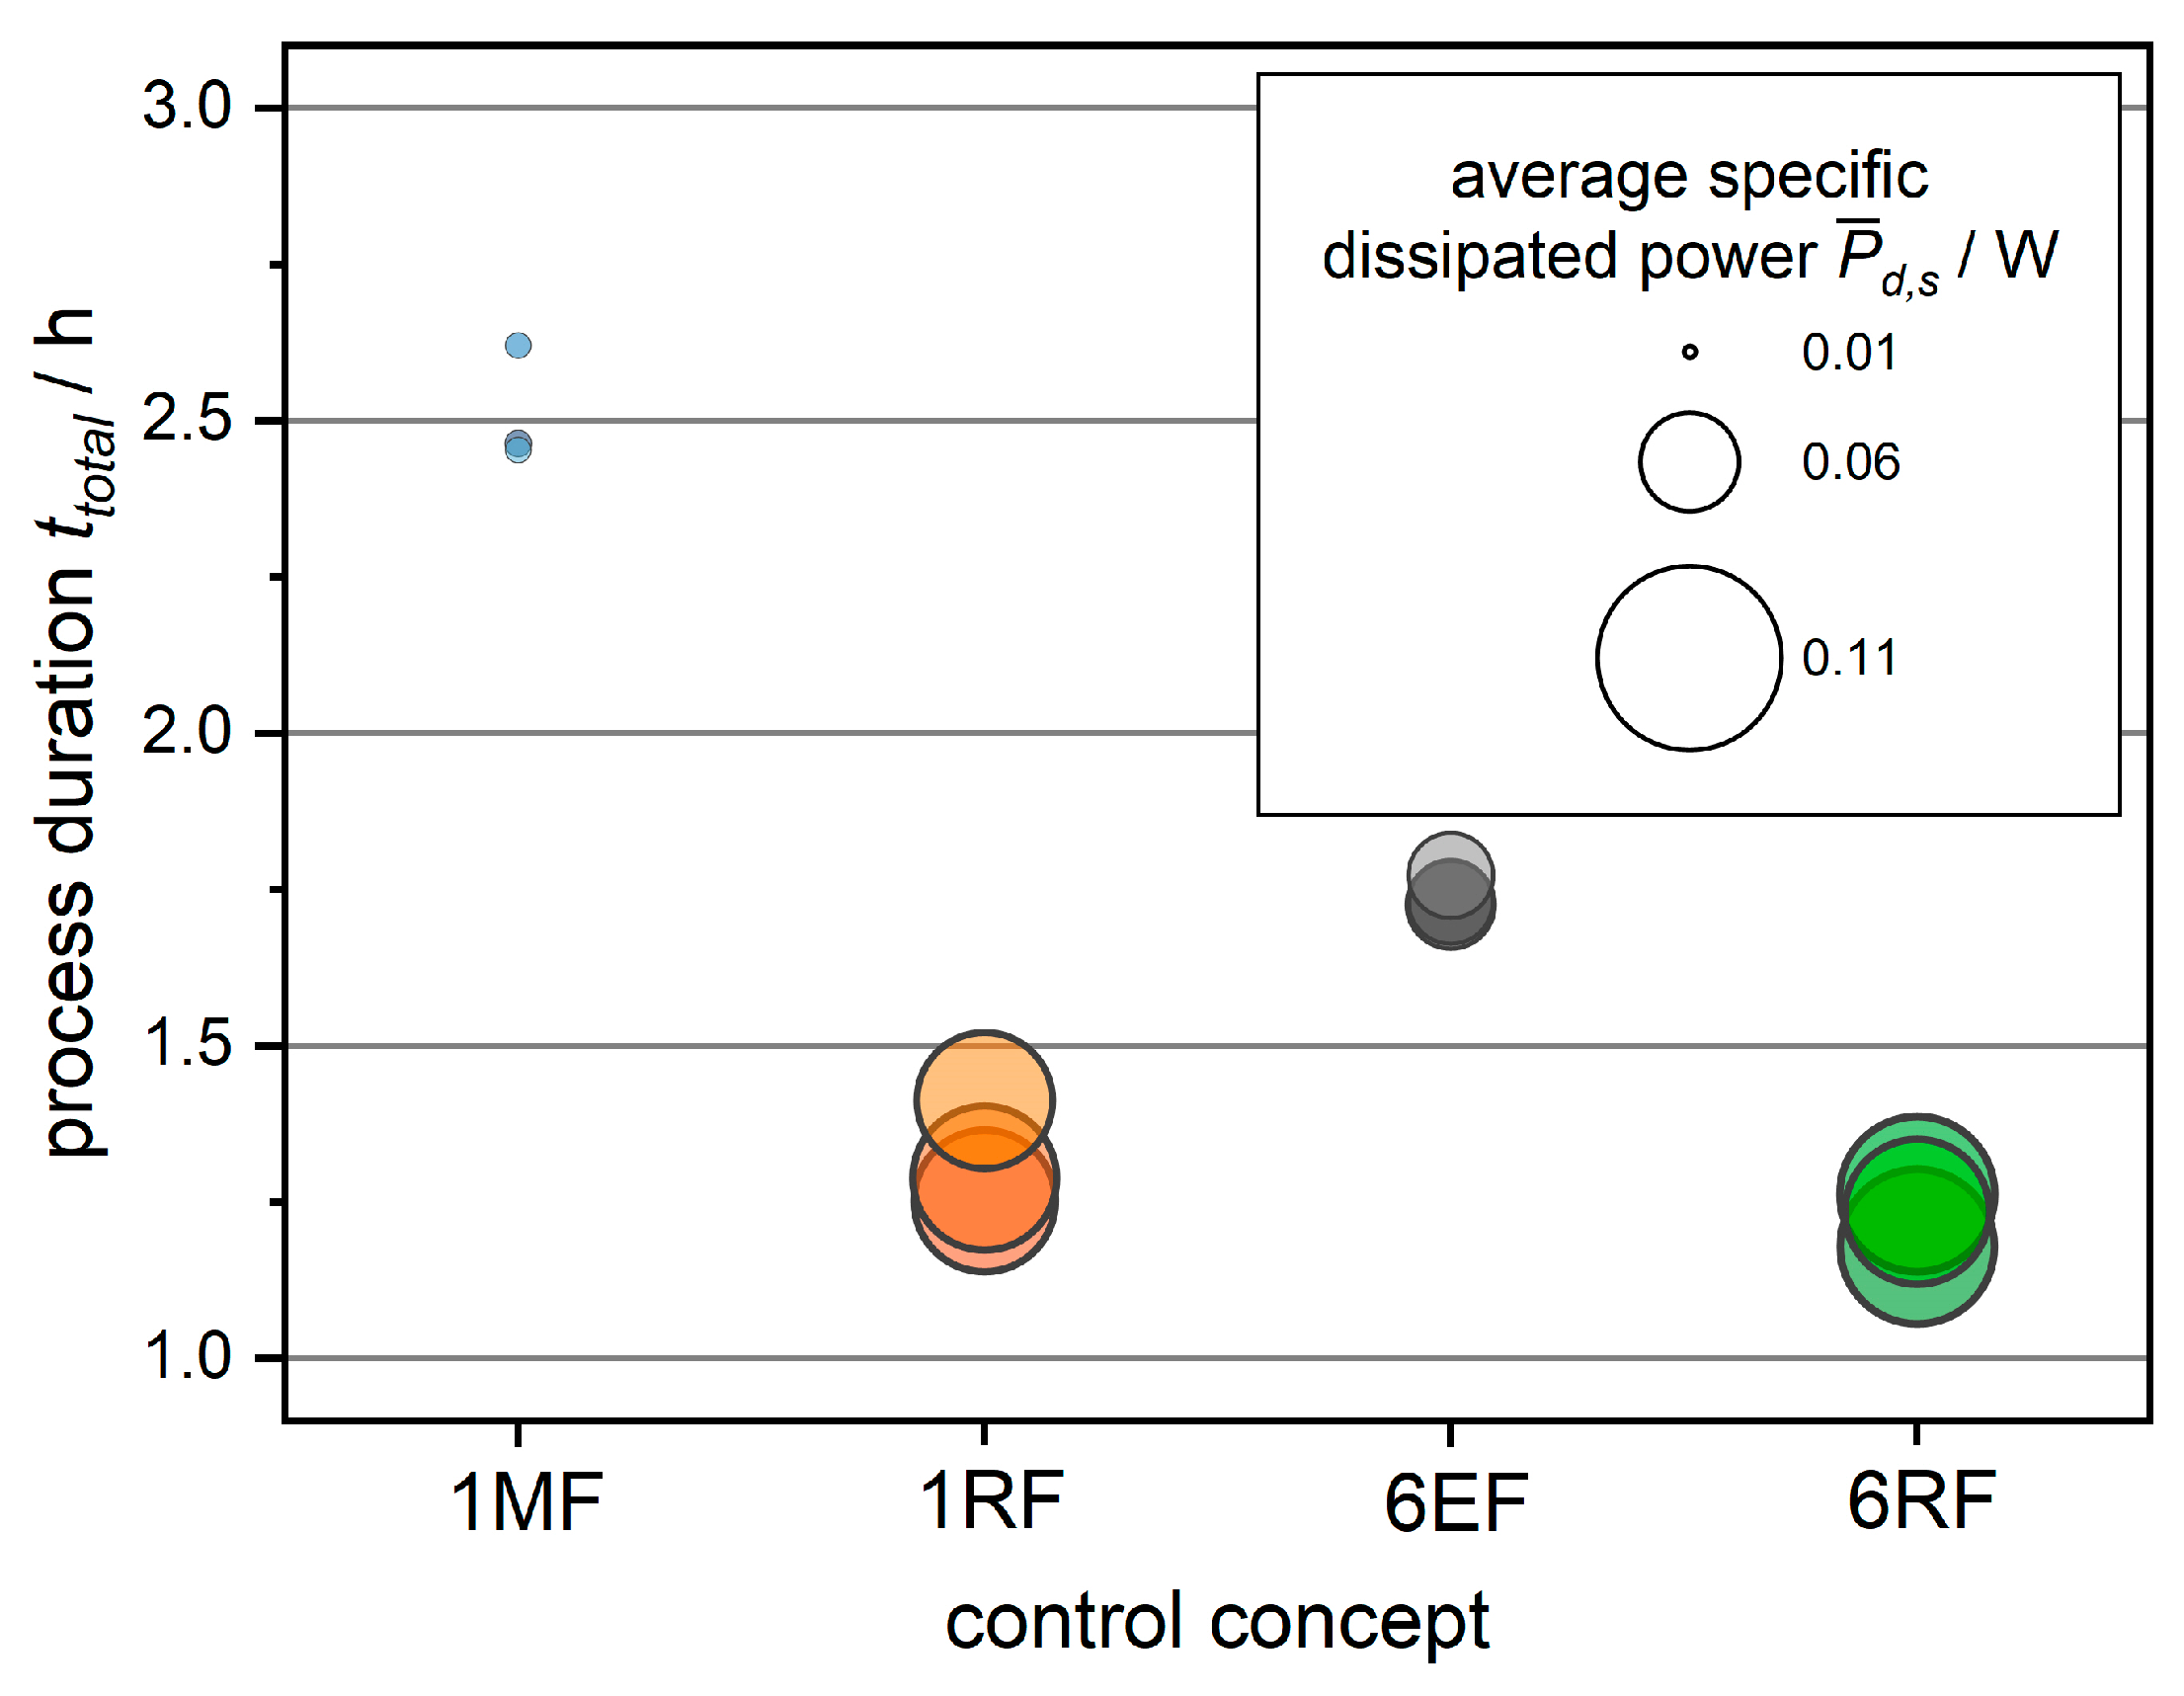
The results below complement already published data [9] to enable a comparison with the other parameters studied. To evaluate the effects of frequency on MFD, Figure 8 shows the process durations for the applied frequency-based control concepts with the bubble size reflecting the average specific dissipated power. In addition, Figure S5 in the Supplementary Materials displays the drying kinetics in detail. The control concepts 1RF and 6RF have the shortest process durations in a comparable range, followed by 6EF and 1MF.
The results from a one-way ANOVA in Table 3 confirm significant differences in average drying duration between the control concepts 1MF, 6EF, and 6RF, while the difference between 6RF and 1RF is not significant. Compared to the most time-consuming control concept 1MF, the application of 6RF shortened the average process duration by 51.2%. In contrast to the parameter study on chamber pressure, both the total water mass removed and the water mass removed before microwave application remained relatively constant in all experiments. The average chamber pressure was also constant, as expected. The average drying rates during power application differed visibly from 15.03 g/h for 1MF to 39.97 g/h for 6RF, although no statistical significance could be calculated since not all prerequisites for an ANOVA were fulfilled. Nevertheless, these results underline the tremendous influence of the applied frequencies on the drying rate.
The forward power of the SSG in the present study was dependent on frequency, leading to average specific forward powers of 0.063 W/g for 1MF up to 0.111 W/g for 6RF. These differences could not be fully resolved within the scope of this work. For instance, different forward powers may have been the cause of the slightly shorter process duration of 6RF compared to 1RF, despite the higher average energy efficiency of 1RF. Further details on the limitations of the experimental setup can be found in Section 3.3. Nevertheless, the statements made on the influence of frequency remain valid when the processes are evaluated in terms of energy efficiency or specific dissipated power. The differences in average energy efficiency are in the range of 24.6% for 1MF to 92.4% for 1RF. This large range of energy efficiency can be explained by the frequency dependence of modes, which are associated with specific patterns of the electromagnetic field inside the process chamber. The different modes present with each control concept influence the interaction of the samples in the process chamber with the electromagnetic field, presumably causing differences in energy efficiency. The excitation of RFs in 1RF and 6RF was associated with a particularly high energy efficiency from 83.6% to 92.4%. The possibility of increasing energy efficiency with targeted frequency control has also been demonstrated in microwave-assisted heating [29,31,32,33]. The energy efficiency, in turn, determines the specific dissipated power, which correlates with the drying rate. The same correlation of a higher drying rate with increasing dissipated power was observed in the parameter study on microwave power.
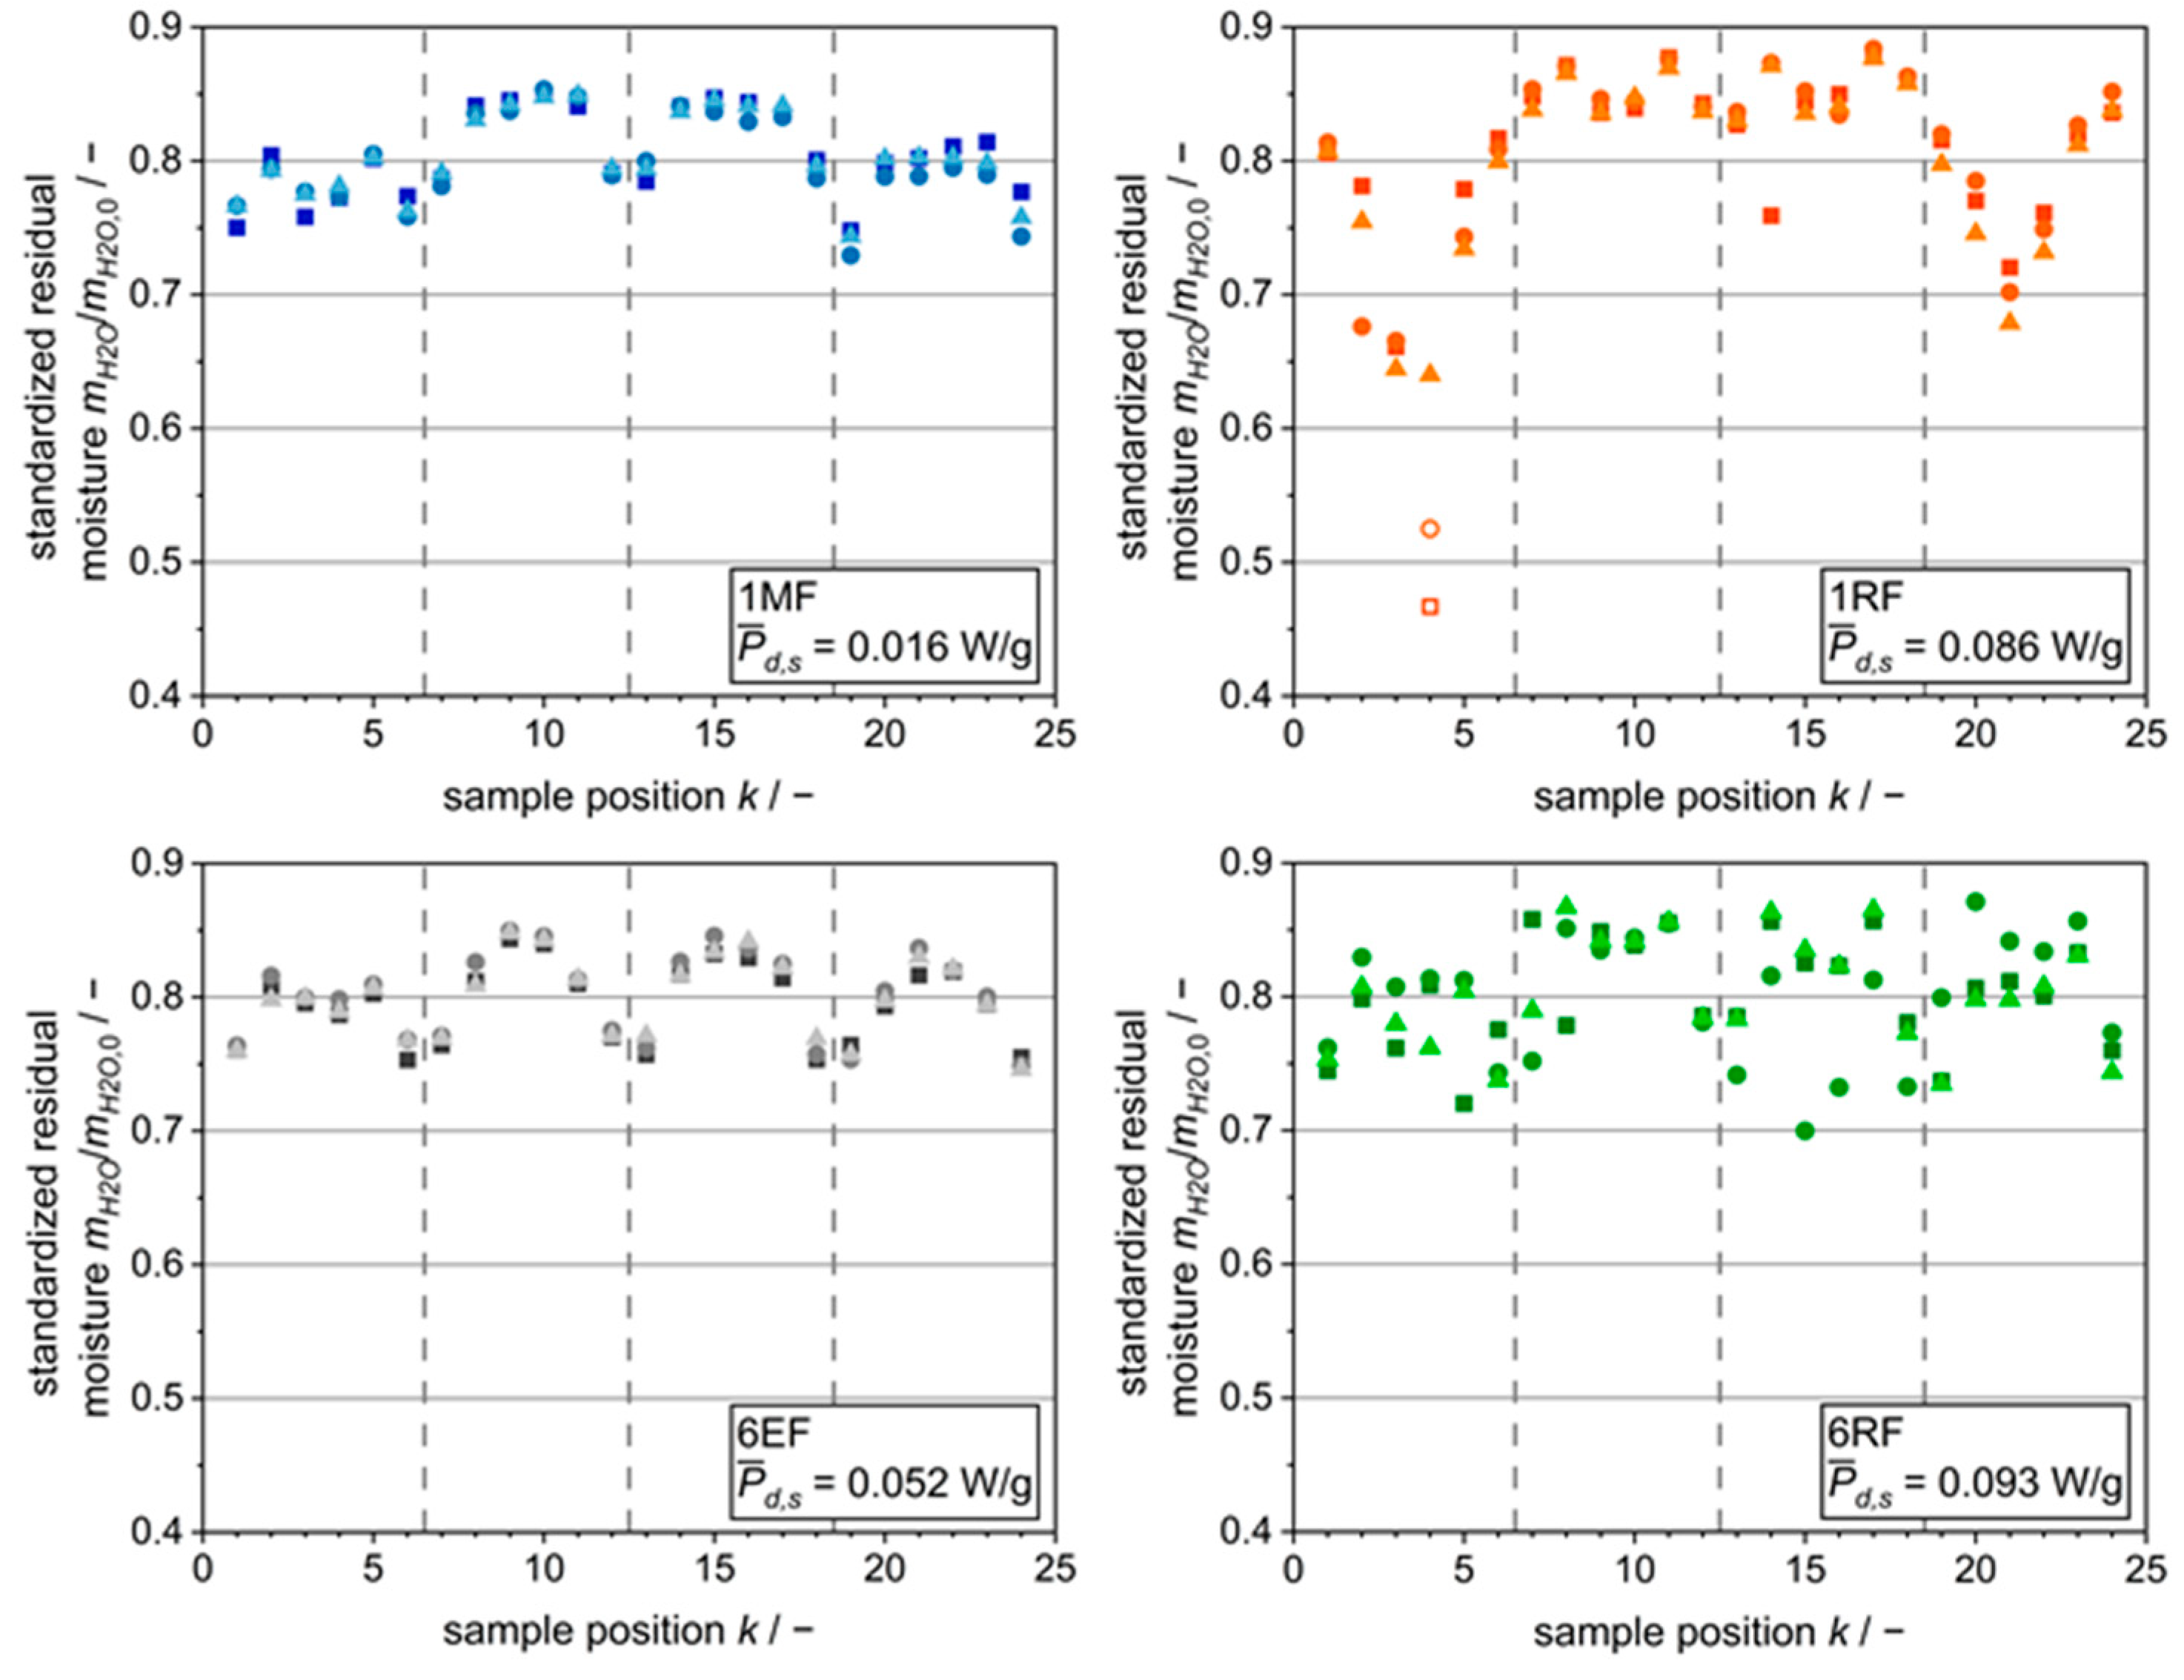
The application of frequency-based control concepts has significant effects on drying homogeneity in MFD. This is shown by previously published data [9], where a partial MFD was conducted using the experimental setup and control concepts of the present study. To complement the data already published, the residual moisture is plotted versus the sample position and the frequency-based control concept in Figure 9. Even though the typical patterns of residual moisture associated with thermal radiation are recognizable for all control concepts, differences can be found between the control concepts. The application of multiple frequencies instead of one frequency resulted in increased drying homogeneity at similar dissipated power, namely 1MF compared to 6EF and 1RF compared to 6RF. Puffing occurred in the experiments at 1RF exclusively, although the dissipated microwave power was lower than for 6RF. This indicates a more uniform average power dissipation over time when multiple frequencies are used. These results are consistent with the literature on microwave-assisted heating, which shows higher heating homogeneity for targeted excitation of multiple frequencies [31,32,33]. Frequency, hence, is the only parameter investigated that results in a substantially increased drying homogeneity.
3.3. Limitations and Future Work
The proposed approach of utilizing partial MFD in parameter studies enables tremendous time savings for the evaluation of process parameters like chamber pressure, microwave power, and microwave frequency regarding their influence on drying kinetics and drying homogeneity. While results from the parameter study on frequency and power are consistent with the expectations based on the literature, the results of the parameter studies on chamber pressure contradicted the expected results. Limitations of heat transfer due to low applied power or the relatively thin dried layer that is not representative of a complete MFD are possible causes of the discrepancies, as discussed in Section 3.2.1.
Complete MFD would allow for the evaluation of the final product quality. This is inherently impossible for partial MFD since the samples are still partly moist. During MFD, however, the dielectric properties of the product change significantly, causing shifts in the frequency-dependent energy efficiency and the frequency of resonant modes [9]. In the present study, modulation of frequencies during drying was omitted, since the shift of RFs during the initial part of primary drying was assumed to be negligible. During complete MFD, the applied frequencies would have to be adjusted throughout drying to ensure the excitation of desired frequencies over the whole course of drying.
Future work on partial MFD should focus on adjusting the termination criterion to investigate whether the expected results can be obtained for the influence of chamber pressure. Extending the process duration by applying a lower residual moisture content as a termination criterion, e.g., 60 wt% or 70 wt%, could be a solution. To test the universal suitability of partial MFD for parameter studies, its application to other products and parameter spaces should be investigated. In a broader context, partial drying could also be evaluated for other microwave-assisted drying processes. Additionally, complete MFD experiments with modulation of microwave frequency should be conducted to enable the evaluation of product quality. Various frequency-based control concepts should be compared since this study has shown that frequency is an influential parameter affecting drying kinetics, energy efficiency, and drying homogeneity. MFD should also be compared to CFD to ensure its competitiveness with the established process in terms of product quality and process duration.
In the present work, the forward microwave power varied considerably among experiments, as can be seen in Tables S1–S4 in the Supplementary Materials. A prominent example from the parameter study on microwave power is the decreasing forward power when the activation ratio increased. Presumably, this can be attributed to a temperature rise in the SSG with low pause times. This could not be prevented due to a lack of control based on the measurement of reflected power and forward power. Recalibrations of the SSG between parameter studies are another possible cause of deviations. These inconsistencies in forward power may conceal the influence of chamber pressure and frequency in the respective parameter studies. To prevent these inconsistencies, the effects of fluctuations in average specific dissipated microwave power, which is directly linked to specific forward power, were taken into account in all experiments. For future studies, it would be desirable to achieve more equal forward power between experiments, e.g., through frequency-dependent calibration or adaptive power control. Lastly, future work should focus on using the developed framework for high-throughput experiments in MFD to optimize the process by varying multiple variables.
4. Conclusions
Partial MFD is suggested as an approach to a time-efficient process design by increasing the throughput of experiments in parameter studies. Experiments were terminated when 20 wt% of the initial water content was removed from the samples. This would lead to a 92.0% reduction in the process duration compared to complete MFD. As expected, partial MFD exhibited drying kinetics similar to the initial phase of complete MFD. Moreover, the early termination enabled an investigation of drying homogeneity, which could not be determined when drying the product completely. While the influence of process parameters on drying kinetics and drying homogeneity can be evaluated with the proposed approach, product quality cannot, since the samples are partly moist.
To verify the applicability of the proposed approach, parameter studies on chamber pressure, microwave power, and microwave frequency were carried out and compared to results from the literature. A reduction in process duration of 18.8% was observed with a decrease in average chamber pressure from 0.87 mbar to 0.19 mbar. The difference in process duration can be attributed to the removal of a higher mass of water before microwave application and higher drying rates during microwave application at a lower chamber pressure. The latter results are not in line with the literature, where a decrease in drying time with chamber pressure due to a lower product temperature or no significant correlation was found. Moreover, higher microwave power up to the average specific dissipated power of 0.143 W/g led to a 46.7% shorter process duration in comparison to 0.048 W/g. A targeted adjustment of microwave frequency through control concepts had a significant influence on the process duration, reducing it by up to 51.2% in comparison to the longest process. One cause is the frequency-dependent energy efficiency, which influenced the specific dissipated power. The application of RFs exhibited the highest energy efficiencies ranging from 83.6% to 92.4%. These results for power and frequency are qualitatively consistent with the literature.
Generally, drying homogeneity was not influenced substantially by chamber pressure or microwave power, although outliers in residual moistures were observed in the parameter study on power for a specific dissipated power >0.075 W/g. The respective samples showed structural impairments presumably caused by the melting of the samples during MFD. However, drying homogeneity was increased when applying multiple frequencies at similar levels of specific dissipated power, as shown in a previous study [9].
Partial MFD produced the expected results regarding the influence of microwave properties. This underlines the general suitability of the approach proposed for investigating the influence of process parameters in a time-efficient manner. The expected influence of chamber pressure could not be observed, presumably due to low input power and limitations through mass transfer occurring during later stages of drying. Partial drying is not limited to MFD but may be applied to a wide range of drying processes. The achieved time savings could play an important role when investigating the simultaneous adaptation of multiple process parameters by using solid-state technology. Targeted adaptation of microwave frequency had the most pronounced effect on energy efficiency and could be utilized to increase drying homogeneity. For future work, selective adjustment of frequency during drying based on measurement of forward and reflected power seems to be a particularly promising approach.
Supplementary Materials
The following supporting information can be downloaded at: https://www.mdpi.com/2227-9717/11/10/2886/s1, Table S1: Average forward power and average chamber pressure in the experiments comparing termination criteria; Table S2: Average forward power and average chamber pressure in the experiments of the parameter study on chamber pressure; Table S3: Average forward power and average chamber pressure in the experiments of the parameter study on microwave power; Table S4: Average forward power and average chamber pressure in the experiments of the parameter study on microwave frequency; Table S5: Applied frequencies during the parameter studies on chamber pressure and microwave power; Table S6: Applied frequencies during the parameter study on microwave frequency; Figure S1: Schematic top view of the arrangement of the 24 samples of tylose gel on the product support; Figure S2: Drying kinetics for experiments of the parameter study on chamber pressure; Figure S3: Drying kinetics for experiments of the parameter study on microwave power; Figure S4: Exemplary pictures of tylose gel samples in gray-scale; Figure S5: Drying kinetics for the frequency-based control concepts in the parameter study on microwave frequency.
Author Contributions
Conceptualization, T.S. and V.G.; methodology, T.S., R.B. and J.C.; software, T.S.; validation, T.S.; formal analysis, T.S.; investigation, T.S.; resources, V.G.; data curation, T.S.; writing—original draft preparation, T.S.; writing—review and editing, R.B., J.C. and V.G.; visualization, T.S., R.B. and J.C.; supervision, V.G.; project administration, T.S. and V.G.; and funding acquisition, T.S. and V.G. All authors have read and agreed to the published version of the manuscript.
Funding
This research was funded as an IGF project of the FEI via AiF within the program for promoting the Industrial Collective Research (IGF) of the German Federal Ministry for Economic Affairs and Climate Action, based on a resolution of the German Parliament. Project 22205 N.
Data Availability Statement
The data and methods used in the research are presented in sufficient detail in the document for other researchers to replicate the work.
Acknowledgments
The authors express their gratitude to Xiaoqi Zhou for her assistance in conducting the experiments on microwave-assisted freeze drying. We acknowledge support by the KIT Publication Fund of the Karlsruhe Institute of Technology.
Conflicts of Interest
The authors declare no conflict of interest.
References
- Ratti, C. Hot air and freeze-drying of high-value foods: A review. J. Food Eng. 2001, 49, 311–319. [Google Scholar] [CrossRef]
- Duan, X.; Zhang, M.; Mujumdar, A.S.; Wang, S. Microwave freeze drying of sea cucumber (Stichopus japonicus). J. Food Eng. 2010, 96, 491–497. [Google Scholar] [CrossRef]
- Huang, L.; Zhang, M.; Mujumdar, A.S.; Lim, R.-X. Comparison of four drying methods for re-structured mixed potato with apple chips. J. Food Eng. 2011, 103, 279–284. [Google Scholar] [CrossRef]
- Ambros, S.; Mayer, R.; Schumann, B.; Kulozik, U. Microwave-freeze drying of lactic acid bacteria: Influence of process parameters on drying behavior and viability. Innov. Food Sci. Emerg. Technol. 2018, 48, 90–98. [Google Scholar] [CrossRef]
- Cao, X.; Zhang, M.; Mujumdar, A.S.; Zhong, Q.; Wang, Z. Effect of microwave freeze drying on quality and energy supply in drying of barley grass. J. Sci. Food Agric. 2018, 98, 1599–1605. [Google Scholar] [CrossRef]
- Gitter, J.H.; Geidobler, R.; Presser, I.; Winter, G. Significant Drying Time Reduction Using Microwave-Assisted Freeze-Drying for a Monoclonal Antibody. J. Pharm. Sci. 2018, 107, 2538–2543. [Google Scholar] [CrossRef]
- Gitter, J.H.; Geidobler, R.; Presser, I.; Winter, G. Microwave-Assisted Freeze-Drying of Monoclonal Antibodies: Product Quality Aspects and Storage Stability. Pharmaceutics 2019, 11, 674. [Google Scholar] [CrossRef]
- Ozcelik, M.; Heigl, A.; Kulozik, U.; Ambros, S. Effect of hydrocolloid addition and microwave-assisted freeze drying on the characteristics of foamed raspberry puree. Innov. Food Sci. Emerg. Technol. 2019, 56, 102183. [Google Scholar] [CrossRef]
- Sickert, T.; Kalinke, I.; Christoph, J.; Gaukel, V. Microwave-Assisted Freeze-Drying with Frequency-Based Control Concepts via Solid-State Generators: A Simulative and Experimental Study. Processes 2023, 11, 327. [Google Scholar] [CrossRef]
- Wang, Z.; Duan, X.; Li, L.; Ren, G.; Wu, T.; Chen, J.; Ang, Y.; Guo, J.; Zhao, M. Effects of freeze-drying and microwave vacuum freeze-drying on the activity of IgY: From the perspective of protein structure. Dry. Technol. 2023, 41, 222–232. [Google Scholar] [CrossRef]
- Franks, F. Freeze-drying of bioproducts: Putting principles into practice. Eur. J. Pharm. Biopharm. 1998, 45, 221–229. [Google Scholar] [CrossRef]
- Thostenson, E.T.; Chou, T.-W. Microwave processing: Fundamentals and applications. Compos. Part A Appl. Sci. Manuf. 1999, 30, 1055–1071. [Google Scholar] [CrossRef]
- Gaukel, V.; Siebert, T.; Erle, U. Microwave-assisted drying. In The Microwave Processing of Foods; Elsevier: Amsterdam, The Netherlands, 2017; pp. 152–178. ISBN 9780081005286. [Google Scholar]
- Feng, H.; Tang, J.; Cavalieri, R.P.; Plumb, O.A. Heat and mass transport in microwave drying of porous materials in a spouted bed. AIChE J. 2001, 47, 1499–1512. [Google Scholar] [CrossRef]
- Clark, D.E.; Sutton, W.H. Microwave Processing of Materials. Annu. Rev. Mater. Sci. 1996, 26, 299–331. [Google Scholar] [CrossRef]
- Atuonwu, J.C.; Tassou, S.A. Quality assurance in microwave food processing and the enabling potentials of solid-state power generators: A review. J. Food Eng. 2018, 234, 1–15. [Google Scholar] [CrossRef]
- Yang, F.; Wang, W.; Yan, B.; Hong, T.; Yang, Y.; Zhu, H.; Wu, L.; Huang, K. Sweep Frequency Heating based on Injection Locked Magnetron. Processes 2019, 7, 341. [Google Scholar] [CrossRef]
- Zhou, X.; Tang, Z.; Pedrow, P.D.; Sablani, S.S.; Tang, J. Microwave heating based on solid-state generators: New insights into heating pattern, uniformity, and energy absorption in foods. J. Food Eng. 2023, 357, 111650. [Google Scholar] [CrossRef]
- Assegehegn, G.; La Brito-de Fuente, E.; Franco, J.M.; Gallegos, C. Freeze-drying: A relevant unit operation in the manufacture of foods, nutritional products, and pharmaceuticals. Adv. Food Nutr. Res. 2020, 93, 1–58. [Google Scholar] [CrossRef] [PubMed]
- Tang, X.; Pikal, M.J. Design of freeze-drying processes for pharmaceuticals: Practical advice. Pharm. Res. 2004, 21, 191–200. [Google Scholar] [CrossRef] [PubMed]
- Wang, Z.H.; Shi, M.H. Microwave Freeze Drying Characteristics of Beef. Dry. Technol. 1999, 17, 434–447. [Google Scholar] [CrossRef]
- Krokida, M.K.; Karathanos, V.T.; Maroulis, Z.B. Effect of freeze-drying conditions on shrinkage and porosity of dehydrated agricultural products. J. Food Eng. 1998, 35, 369–380. [Google Scholar] [CrossRef]
- Wang, R.; Zhang, M.; Mujumdar, A.S.; Sun, J.-C. Microwave Freeze–Drying Characteristics and Sensory Quality of Instant Vegetable Soup. Dry. Technol. 2009, 27, 962–968. [Google Scholar] [CrossRef]
- Jiang, H.; Zhang, M.; Mujumdar, A.S. Microwave Freeze-Drying Characteristics of Banana Crisps. Dry. Technol. 2010, 28, 1377–1384. [Google Scholar] [CrossRef]
- Jiang, H.; Zhang, M.; Liu, Y.; Mujumdar, A.S.; Liu, H. The energy consumption and color analysis of freeze/microwave freeze banana chips. Food Bioprod. Process. 2013, 91, 464–472. [Google Scholar] [CrossRef]
- Li, L.; Zhang, M.; Yang, P. Suitability of LF-NMR to analysis water state and predict dielectric properties of Chinese yam during microwave vacuum drying. LWT 2019, 105, 257–264. [Google Scholar] [CrossRef]
- Nakagawa, K.; Kono, S. Monitoring of primary drying in the freeze-drying process using an open-ended coaxial microwave resonator. J. Food Eng. 2021, 289, 110163. [Google Scholar] [CrossRef]
- Pozar, D.M. Microwave Engineering, 4th ed.; John Wiley & Sons Inc.: Hoboken, NJ, USA, 2012; ISBN 0470631554. [Google Scholar]
- Tang, Z.; Hong, T.; Liao, Y.; Chen, F.; Ye, J.; Zhu, H.; Huang, K. Frequency-selected method to improve microwave heating performance. Appl. Therm. Eng. 2018, 131, 642–648. [Google Scholar] [CrossRef]
- Yakovlev, V.V. Effect of frequency alteration regimes on the heating patterns in a solid-state-fed microwave cavity. J. Microw. Power Electromagn. Energy 2018, 52, 31–44. [Google Scholar] [CrossRef]
- Taghian Dinani, S.; Feldmann, E.; Kulozik, U. Effect of heating by solid-state microwave technology at fixed frequencies or by frequency sweep loops on heating profiles in model food samples. Food Bioprod. Process. 2021, 127, 328–337. [Google Scholar] [CrossRef]
- Yang, R.; Fathy, A.E.; Morgan, M.T.; Chen, J. Development of online closed-loop frequency shifting strategies to improve heating performance of foods in a solid-state microwave system. Food Res. Int. 2022, 154, 110985. [Google Scholar] [CrossRef]
- Yang, R.; Fathy, A.E.; Morgan, M.T.; Chen, J. Development of a complementary-frequency strategy to improve microwave heating of gellan gel in a solid-state system. J. Food Eng. 2022, 314, 110763. [Google Scholar] [CrossRef]
- Wexler, A. Vapor pressure formulation for ice. J. Res. Nat. Bur. Stand. Sect. A Phys. Chem. 1977, 81A, 5–20. [Google Scholar] [CrossRef]
- Rambhatla, S.; Pikal, M.J. Heat and mass transfer scale-up issues during freeze-drying, I: Atypical radiation and the edge vial effect. AAPS PharmSciTech 2003, 4, E14. [Google Scholar] [CrossRef]
- Morgan, S.P. Effect of Surface Roughness on Eddy Current Losses at Microwave Frequencies. J. Appl. Phys. 1949, 20, 352–362. [Google Scholar] [CrossRef]
- Chamchong, M.; Datta, A.K. Thawing of foods in a microwave oven: I. Effect of power levels and power cycling. J. Microw. Power Electromagn. Energy 1999, 34, 9–21. [Google Scholar] [CrossRef] [PubMed]
Figure 1.
Exemplary sequence for a frequency loop of an arbitrary control concept with six frequencies and = 0.5. Frequencies 1 to 6 are sorted in the order of ascending frequency.
Figure 1.
Exemplary sequence for a frequency loop of an arbitrary control concept with six frequencies and = 0.5. Frequencies 1 to 6 are sorted in the order of ascending frequency.

Figure 2.
Drying kinetics of partial MFD in comparison to complete MFD. The inset plot provides an enlarged view of the initial two hours of MFD. The dashed lines mark the time and mass at which complete MFD reaches the termination criteria = 0.80 and < 0.25 g/h.
Figure 2.
Drying kinetics of partial MFD in comparison to complete MFD. The inset plot provides an enlarged view of the initial two hours of MFD. The dashed lines mark the time and mass at which complete MFD reaches the termination criteria = 0.80 and < 0.25 g/h.

Figure 3.
Comparison of standardized residual moistures for partial and complete MFD.

Figure 4.
Process durations of MFD as a function of average chamber pressure. Bubble size indicates the average specific dissipated power of each experiment.
Figure 4.
Process durations of MFD as a function of average chamber pressure. Bubble size indicates the average specific dissipated power of each experiment.

Figure 5.
(a) Standardized residual moisture as a function of the average chamber pressure. Data sets consist of experiments in triplicate with 24 samples each. (b) Standardized residual moisture plotted over sample position for investigated average chamber pressures. The sample position describes the placement of the samples, as depicted in Figure S1 in the Supplementary Materials. Different shapes mark individual experiments and dashed lines mark the transition between rows of samples.

Figure 6.
Process duration of MFD as a function of the average specific dissipated power. The red line indicates the time at which the average required enthalpy of sublimation is supplied by microwaves. The blue line additionally accounts for the average energy required for heating the dried product matrix and water vapor to room temperature, which is supplied by microwaves only.

Figure 7.
(a) Standardized residual moisture as a function of the average specific dissipated power for experiments in the parameter study on microwave power. (b) Standardized residual moisture plotted as a function of the position of the samples, grouped by the levels of average specific dissipated power. The sample position indicates the placement of the sample in analogy to Figure 5. Dashed lines mark the transition between rows of samples, while different shapes indicate individual experiments. Blank symbols mark samples with an impaired structure by puffing.

Figure 8.
Process durations of MFD versus the applied frequency-based control concept. Bubble size reflects the average specific dissipated power of each experiment.
Figure 8.
Process durations of MFD versus the applied frequency-based control concept. Bubble size reflects the average specific dissipated power of each experiment.

Figure 9.
Standardized residual moisture plotted against the position of the samples for the control concepts 1MF, 1RF, 6EF, and 6RF. The specified power is the average specific dissipated power. Blank symbols mark samples with an impaired macroscopic structure by puffing. The sample position describes the placement of the sample in analogy to Figure 5. Dashed lines mark the transition between rows of samples, while different shapes indicate individual experiments.


Table 1.
Specifications of set chamber pressure, set forward power, activation ratio, and frequency-based control concepts in the experiments to compare termination points and parameter studies.
Table 1.
Specifications of set chamber pressure, set forward power, activation ratio, and frequency-based control concepts in the experiments to compare termination points and parameter studies.
| Comparison Termination | Parameter Study | |||
|---|---|---|---|---|
| Pressure | Power | Frequency | ||
| Set chamber pressure /mbar | 0.5 | 0.2; 0.5; 1.0 | 0.5 | 0.5 |
| Set forward power /W | 50 | 50 | 50 | 50 |
| Activation ratio /− | 0.25 | 0.25 | 0.25; 0.50; 0.75; 1.00 | 0.25 |
| Frequency-based control concept | 6EF | 6RF | 6RF | 1MF; 1RF; 6EF; 6RF |
Table 2.
Process parameters for the MFD experiments in the parameter study on chamber pressure. The values indicate the arithmetic mean and the standard deviation of the experiments performed in triplicate. Different letters indicate significant differences between the arithmetic means.
Table 2.
Process parameters for the MFD experiments in the parameter study on chamber pressure. The values indicate the arithmetic mean and the standard deviation of the experiments performed in triplicate. Different letters indicate significant differences between the arithmetic means.
| Set Chamber Pressure /mbar | 0.2 | 0.5 | 1.0 |
|---|---|---|---|
| Process duration /s | 5029 ± 246 C | 5595 ± 60 B | 6196 ± 195 A |
| Average chamber pressure /mbar | 0.19 ± 0.00 C | 0.47 ± 0.00 B | 0.87 ± 0.00 A |
| Removed water total /g | 45.1 ± 0.3 | 45.1 ± 0.1 | 45.1 ± 0.0 |
| Removed water before power application /g | 13.4 ± 1.3 A | 9.0 ± 0.2 B | 8.9 ± 0.7 B |
| Average drying rate during power application /g/h | 22.71 ± 0.82 A | 23.24 ± 0.09 A | 21.03 ± 0.71 B |
| Average specific forward power /W/g | 0.051 ± 0.006 A | 0.060 ± 0.001 A | 0.051 ± 0.003 A |
| Average energy efficiency /% | 75.3 ± 0.5 B | 78.6 ± 0.8 A | 76.7 ± 0.3 B |
| Average specific dissipated power /W/g | 0.038 ± 0.004 B | 0.047 ± 0.001 A | 0.039 ± 0.003 B |
Table 3.
Process parameters for the MFD experiments in the parameter study on frequency. The values indicate the arithmetic mean and the standard deviation of the experiments performed in triplicate. Different letters indicate significant differences between the arithmetic means.
Table 3.
Process parameters for the MFD experiments in the parameter study on frequency. The values indicate the arithmetic mean and the standard deviation of the experiments performed in triplicate. Different letters indicate significant differences between the arithmetic means.
| Control Concept | 1MF | 1RF | 6EF | 6RF |
|---|---|---|---|---|
| Process duration /s | 9044 ± 337 A | 4744 ± 303 C | 6275 ± 93 B | 4413 ± 155 C |
| Average chamber pressure /mbar | 0.47 ± 0.00 | 0.46 ± 0.01 | 0.47 ± 0.00 | 0.47 ± 0.00 |
| Removed water total /g | 45.6 ± 0.6 | 45.5 ± 0.3 | 46.3 ± 1.0 | 45.4 ± 0.2 |
| Removed water before power application /g | 7.9 ± 0.3 A | 8.1 ± 1.0 A | 8.2 ± 1.8 A | 7.4 ± 0.8 A |
| Average drying rate during power application /g/h | 15.03 ± 0.18 | 28.44 ± 1.46 | 21.88 ± 0.41 | 30.97 ± 0.65 |
| Average specific forward power /W/g | 0.063 ± 0.002 C | 0.093 ± 0.002 B | 0.098 ± 0.002 B | 0.111 ± 0.004 A |
| Average energy efficiency /% | 24.6 ± 0.3 D | 92.4 ± 0.3 A | 52.1 ± 0.4 C | 83.6 ± 0.4 B |
| Average specific dissipated power /W/g | 0.016 ± 0.000 | 0.086 ± 0.002 | 0.052 ± 0.001 | 0.093 ± 0.004 |
Disclaimer/Publisher’s Note: The statements, opinions and data contained in all publications are solely those of the individual author(s) and contributor(s) and not of MDPI and/or the editor(s). MDPI and/or the editor(s) disclaim responsibility for any injury to people or property resulting from any ideas, methods, instructions or products referred to in the content. |
© 2023 by the authors. Licensee MDPI, Basel, Switzerland. This article is an open access article distributed under the terms and conditions of the Creative Commons Attribution (CC BY) license (https://creativecommons.org/licenses/by/4.0/).
Share and Cite
MDPI and ACS Style
Sickert, T.; Bergmann, R.; Christoph, J.; Gaukel, V. A Time-Saving Approach to Parameter Studies in Microwave-Assisted Freeze Drying. Processes 2023, 11, 2886. https://doi.org/10.3390/pr11102886
AMA Style
Sickert T, Bergmann R, Christoph J, Gaukel V. A Time-Saving Approach to Parameter Studies in Microwave-Assisted Freeze Drying. Processes. 2023; 11(10):2886. https://doi.org/10.3390/pr11102886
Chicago/Turabian StyleSickert, Till, Richy Bergmann, Jana Christoph, and Volker Gaukel. 2023. "A Time-Saving Approach to Parameter Studies in Microwave-Assisted Freeze Drying" Processes 11, no. 10: 2886. https://doi.org/10.3390/pr11102886
Note that from the first issue of 2016, this journal uses article numbers instead of page numbers. See further details here.