
The Pursuit of Energy Reduction in Generation of Stable Nanobubbles

Department of Biotechnology and Bioprocess Engineering, Faculty of Chemical and Process Engineering, Warsaw University of Technology, Waryńskiego 1, 00-645 Warsaw, Poland
*
Authors to whom correspondence should be addressed.
Processes 2023, 11(9), 2739; https://doi.org/10.3390/pr11092739
Submission received: 22 August 2023
/
Revised: 7 September 2023
/
Accepted: 12 September 2023
/
Published: 14 September 2023
(This article belongs to the Special Issue Technological Processes for Chemical and Related Industries)
Abstract
:The repeatable and cost-efficient generation of nanobubbles is still a challenge. In most cases, the hydrodynamic generation of nanobubbles is used at larger scales. Therefore, every cost reduction possible in nanobubble generation is needed. In this work, we decided to check how the generation of nanobubbles changes when the surrounding liquid properties change. The generation of nanobubbles was carried out in a novel setup, designed by us. We investigated the minimum liquid velocity needed for nanobubble generation and propose correlations describing this based on the physicochemical properties of the liquid and gas phases. As carbon dioxide nanobubbles are commonly used for the treatment of ischemia and chronic wounds, the investigation of their stability enhancement is crucial for the wider public. We investigated the minimum rotation rate of the impeller needed for CO2 nanobubble generation and the influence of a biomedical surfactant (Pluronic P-123) addition and concentration change on the size of nanobubbles and their stability over time. Nanobubbles were stable in the presence of surfactant additions and showed the impact of both changes in generation time and shear stress on their size. We hope that this study will be a step in the direction of the cost-efficient generation of stable carbon dioxide nanobubble dispersions.
1. Introduction
Nanobubbles have been the object of interest of multiple research groups worldwide for the last three decades [1,2,3,4,5,6,7,8,9,10,11,12,13,14,15,16,17,18,19]. However, the ability to reliably measure their size using techniques such as Dynamic Light Scattering (DLS), Nanoparticle Tracking Analysis (NTA), or Static Light Scattering (SLS) has caused a rapid increase in publications concerning their nature and interactions in the last ten years (see e.g., [11,20,21,22,23,24,25,26,27,28,29,30,31,32,33,34,35,36,37,38,39,40,41,42,43]). Most of the mentioned articles study the molecular or nanoscale interactions of nanobubbles, whereas the macroscopic properties tend to be less studied. The stability of nanobubble dispersions in various media is one of the branches that requires better understanding. Based on the hypotheses of phenomena causing nanobubble stability, the ion strength of the liquid phase should have a clear effect on the generated bubbles [1,12,21,23,44,45]. Parameters of the generation setup also have a huge impact on both the size and stability of nanobubble dispersions in hydrodynamic, acoustic, or electrochemical mechanisms of bubble formation [5,13,19,46,47,48,49,50,51,52,53].
Interactions of nanobubbles with surfactants have been previously studied, and results clearly show that surfactant presence affects both the average nanobubble size in nanodispersions directly after generation and its stability over time [5,7,9]. Cho et al. [15] showed the probable mechanism of the stabilization of nanobubbles (median diameter between 200 and 700 nm) by surfactants with an alkyl chain and polar head and how the presence of surfactants from the CXTAB group (where subscript denotes the length of the alkyl chain) affects the size of ultrasonically generated nanobubbles in liquid. The longer the alkyl chain, the larger the bubbles formed in solution. According to Fan et al. [5], “the presence of a small amount of surfactant such as frother reduces the surface tension, stabilizes the gas nuclei present in the liquid under the effect of surface tension forces, significantly reduces the cavitation threshold, and reduces the violence of nanobubbles collapse”. In the same work, Fan et al. [5] showed that a change in F507 surfactant concentration significantly affects the size distribution of nanobubbles, but their modal diameter stays approximately the same. The higher the concentration of surfactant, the more narrow the distribution of nanobubble sizes. The authors also showed that for both CO2 and O2 gases in nanobubbles, the size of nanobubbles is smaller for lower concentrations of gas dissolved in liquid. Ma et al. [54] performed a comprehensive analysis of interactions of nanobubble generation by ultrasonication and the presence of three surfactants: cationic one (C16TAB), anionic one (SDS), and nonionic one (Tween 20). It is interesting that for a wide range of surfactant concentrations, the number size distribution of nanobubbles remains similar.
Further investigation of biocompatible polymer solutions in the case of oxygen or carbon dioxide bubbles can possibly enhance multiple therapeutic processes such as ischemic foot ulcer treatment [55,56,57] or other problems that involve respiratory or blood circulation symptoms. Investigations of biocompatible surfactant solutions for the generation of nanobubbles have not yet fully surfaced in the literature. Like multiple surfactants from this group, Pluronic P-123, which was chosen as the surfactant to be used in this study, is commonly used in the pharmaceutic industry. Pluronic surfactants serve as solubilizing agents, tablet binders, emulsifying agents, and drug carriers, as reported on the manufacturer site and in the literature [58,59,60]. We suspect that soon, nanobubbles will be even more commonly used in medical and pharmaceutical applications [55,61,62,63,64,65], especially in cases in which the patient has to be able to administer treatment given or prescribed by the medical staff to oneself in liquid. On the other hand, the generation of nanobubbles with biomedical polymers as stabilizers may allow for pharmaceutical usage in situations in which the preparation of dispersions by the patient is not applicable.
This study has two main scientific aims. The first is to check whether some of the existing similarity criteria can be used to predict the generation of nanobubbles in different media, such as pure ethanol or water. The second is to show the effects of the addition of non-toxic biomedical polymers based on the PEG-PPG-PEG structure to water on the subsequent generation of nanobubble dispersions and to find out whether there is a connection between the concentration of surfactant or its average molecular mass and the size or stability of generated bubbles. The novelty of this work is in the investigation of the duration of nanobubble generation regarding the size of the obtained bubbles. We suspect, as previously mentioned by Fan et al. [5], that with an increasing time of generation, when the degree of saturation of liquid with gas increases, so too will the nanobubble diameter. These results in connection with an analysis of the influence of shear stress and surfactant concentration would be a next step in understanding surfactant–nanobubble interactions.
2. Materials and Methods
2.1. Generation Setup
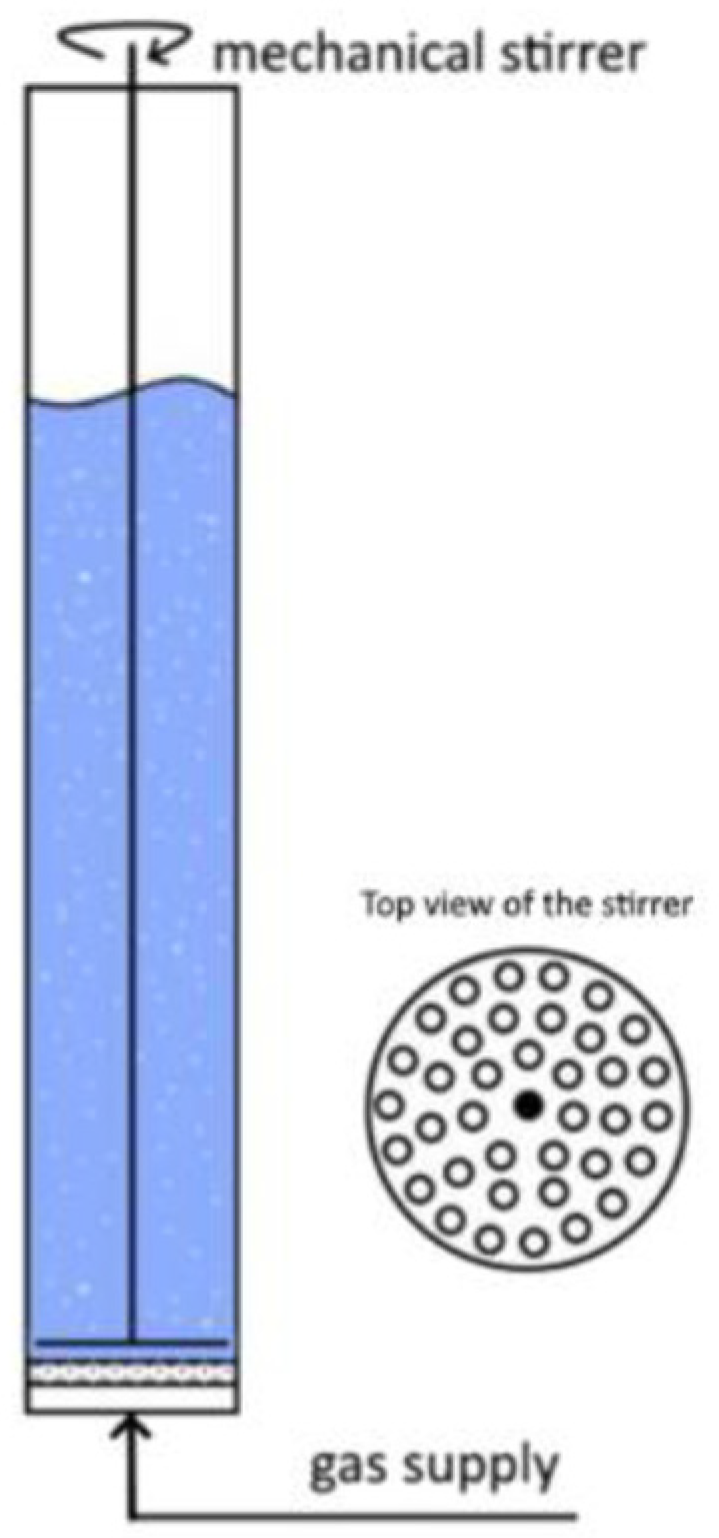
The nanobubble membrane-impeller generation setup (designed by us) consisted of a high-shear mechanical impeller (diameter 20 mm) embedded in a polycarbonate cylinder (internal diameter 24 mm, capacity 50 mL) and placed directly above a flat silicon carbide ceramic membrane (pore size 0.2 µm) enclosed securely in the setup (see Figure 1). Here, the shear stress is induced by the rotation of the impeller. Gas is pressurized through the membrane and is cut off from the membrane in the form of nanobubbles. The rotation rate and gas flow rate are controlled and set at a constant value (10 mL/min) by the internal driver of the impeller motor and mass flow controllers (Brooks 5850S, Brooks Instruments, Hatfield, PA, USA). To assess whether the system is generating any contaminations that would influence the bubble size distribution measurements, we induced the flow of the gases (carbon dioxide and nitrogen) through the membrane for 30 min and measured the samples using the DLS technique. Based on the densities of size distributions, we have calculated the Sauter diameter () describing each distribution.
2.2. Media Preparation
All pure liquids (water, ethanol) were filtered before usage using a nanofiltration membrane (pore diameter approx. 4 nm) and syringe pump to get rid of possible suspended particles. Media were stored in closed glass vials (volume 50 mL). Before usage, the quality of the pure liquid without nanobubbles was assessed using Dynamic Light Scattering (DLS). An additional test in which the gas was allowed to flow freely through the system filled with liquid, with the impeller submerged in it but turned off, was carried out to be sure that the setup itself did not introduce any nanoparticles to the liquid, which may be visible to the DLS and interfere with the results.
2.3. Experiment 1: Usability Study of Common Hydrodynamic Criteria for the Generation of Bubbles in Various Liquids
Still, the most popular methods for obtaining nanobubbles involve hydrodynamic effects, especially the shear stress for cutting off bubbles from the membrane surface. The obvious fact is that there must be some minimal value of such stress, which allows for the formation of a stable nanodispersion of bubbles. For this reason, this experiment aims to find the minimum value of the rotation rate of the impeller for nanobubble formation. Additionally, we wish to check whether the gas and liquid used can influence this value. For this, we decided to use two liquids that have different densities and surface tensions, namely, water and ethanol, and two gases that have extremely different solubilities in these liquids: carbon dioxide and nitrogen. Additionally, we set the rotation rate of the impeller at values from 50 to 1200 rpm (with varying rpm intervals) and generated bubbles for 30 min. The resulting bubble dispersions were analyzed with the DLS technique using a Zetasizer NanoZS (Malvern Panalytical, Malvern, UK). Our goal was to find the lowest value of the rotation rate for which stable nanobubbles are generated repeatably.
Based on the DLS results, we obtained only the density of the size distribution, not the distribution itself, and therefore, we also made the additional generations with oxygen nanobubbles to prove that nanoobjects of gas in liquid are formed using our method. We used a value of rotation rate equal to 600 rpm, which we have proven as viable in previous research. As oxygen has larger solubility than nitrogen and much lower solubility than carbon dioxide, we suspect that nanobubbles formed for this gas should be formed for lower rotation rates than carbon dioxide, but for higher rates than in the case of nitrogen. As such, we performed the measurements of oxygen concentration in each liquid using an optical probe (ProSolo, YSI), which was described in detail in our previous work [62]. The measured oxygen concentration is above the solubility of oxygen in liquid, and therefore, assuming that the surplus is originating from the presence of nanobubbles, and taking the volume-averaged size obtained by DLS, we can calculate that the concentration of oxygen nanobubbles is about , which corresponds with concentrations obtained in the literature using different methods [66]. We can assume that the concentration of oxygen derived from these calculations would be in between the concentration of nitrogen and carbon dioxide. Obviously, we can use the pH meter to calculate the concentration of carbonic acid, and therefore the amount of carbon dioxide in the bulk of the liquid. However, we decided to omit this step, as the dimensions of the setup were too small for reliable pH measurement on site, since the pH electrode would impact the hydrodynamics of the system.
As stated above, we assume that the minimum rotation rate (), and consequently the minimum shear stress, needed for nanobubble generation will differ based on the properties of the liquid and the solubility of the gas in it. To be able to use our results and conclusions in the broader spectrum of hydrodynamic generators, we need to generalize the definitions of our results. As most of the setups do not use the impeller, in place of the minimum rotation rate, we calculate the surface-averaged velocity corresponding to the minimum rotation rate ():
The surface-averaged velocity of the impeller was chosen to be the approximation of the whole shear stress, not only the tangential index of it, due to the shape of the impeller itself. As the impeller is a flat disc with holes, it induces only minimal normal shear stress, whereas the tangential shear stress is obviously significant.
Similarly, the average size of the bubbles (Sauter diameter, ) can be affected by the size of the pores of the membrane, so we divide the initial (i.e., measured directly after generation) Sauter diameter of the bubbles () by the membrane pore diameter (), obtaining a dimensionless ratio (denoted as ) that can be easily compared with results from other researchers:
The third result is the Eötvös number (), which describes the ratio between the force of gravity and surface tension forces:
The Eötvös number is used to characterize the dispersion of phases in a two-phase system. Therefore, for a better understanding of the hydrodynamics of the process, we correlate the results with either criterial numbers (for and ) or the physicochemical properties of gas and liquid (for ). We decided to use dimensional correlation for , as the solubility of gas is not part of any criterial number known to us that will have any connotation with the investigated subject.
For and , three criterial numbers were considered, namely: the Reynolds number (Re), capillary number (Ca), and Morton number (Mo), which were defined as below:
Connecting the analysis of the Eötvös number with the Morton and Reynolds number is common and allows, for example, for deducing the shape of the bubble or droplet during free rising or free fall through liquid, as described by Grace et al. (1976) [67], among others.
On the other hand, was correlated with four physicochemical properties of liquid and gas: liquid density (), liquid viscosity (), the surface tension between gas and liquid (), and the solubility of a given gas in a given liquid (). This analysis aims to predict the minimal liquid velocity needed for nanobubble generation and the Sauter diameter of nanobubbles obtained for the given physicochemical properties of phases.
The density and viscosity of chosen solutions were taken from the literature, and the surface tension was measured using the pendant droplet method with a DSA 100 drop shape analyzer (KRÜSS, Hamburg, Germany). The physicochemical properties of phases are shown in Table 1.
2.4. Experiment 2: Nanobubble Stability Assessment in Non-Ionic Surfactant Solutions
For this experiment, we chose Pluronic P-123 (paste, molecular weight 5750 Da, CMC = 0.0256 g/L) as an example of a nonionic surfactant that is compatible with biological applications. Solutions of this polymer in water were prepared with concentrations corresponding to 0.2, 0.5, and 0.8 of the critical micellar concentration of P-123.
In this experiment, CO2 was chosen for investigation, as this gas is rarely studied in the case of nanobubble formation, and its interactions with biocompatible polymers are extremely important for medical applications. We devised two research questions: (1) Does the duration of the generation of CO2 bubbles in our generation setup affect the stability of nanobubbles in the presence of different concentrations of P-123 surfactant for the constant rotation rate of the impeller? (2) How does the change in the rotation rate of the impeller affect the stability of CO2 nanobubbles for a constant generation time for this surfactant? All these studies were carried out for carbon dioxide as the process gas with a flow rate of 10.0 mL/min.
To find the answer to the first question, we generated bubbles in our setup for a rotation rate of 900 rpm and a duration of generation of 15, 30, 45, 60, 90, and 120 min for each of the concentrations of surfactant. Additionally, we carried out the generation of bubbles in distilled water to serve as a reference for samples with a surfactant addition, as stability in water has been previously proven [23,68].
For the answer to the second question, we carried out the generation of nanobubbles for Pluronic P-123 in all three concentrations with the rotation rate of the impeller set to 600, 900, or 1200 rpm. Each generation lasted for 30 min. As such, we carried out the generation of nanobubbles for 9 distinct samples for the surfactant, which can be mapped on a 9-cell square grid, where two perpendicular sides denote the change in the surfactant concentration and the rotation rate of the impeller. Therefore, assuming a monotonous change in the Sauter diameter between investigated points, we can visualize the data using 2D heat maps, where the color of the point denotes the value of the Sauter diameter for a given pair of values of the rotation rate and surfactant concentration.
After each generation, the liquid was transferred to the freshly cleaned glass vial with a glass cap to ensure minimalization of the mass transfer within the environment. Samples from the liquid were analyzed using the DLS technique directly after generation and then after 7, 14, and 21 days after generation to check the stability of the average size and density of number distribution.
3. Results and Discussion
3.1. Experiment 1
For typical barbotage cases, the detachment of the bubble from the orifice is connected to the overcoming of gravitational and surface tension forces by the sum of cohesion and buoyancy forces. In most cases, the bubble formed in water without any shear is at least a few times larger than the diameter of the orifice [69,70]. For orifices (or pores) placed extremely close to one another, which is the case when we are dealing with membranes with submicron pores, the coalescence of bubbles may occur directly on the membrane surface, causing the formation of bubbles that are even a few magnitudes larger than the diameter of the pore. For this reason, it is necessary to include some shear to cause the faster detachment of bubbles and, in our case, form nanobubbles. The most popular way to induce shear stress on the membrane surface is to use either a flat or cylindrical membrane and to force the liquid to flow along the membrane surface with appropriate velocity [23,49,71,72]. However, this approach causes differences in the shear stress along the membrane length due to the pressure drop in both gas and liquid on opposite sides of the membrane. Additionally, in most cases, flow-through setups require large volumes of liquid, which restricts their usage in fundamental studies. For this reason, we constructed the generation setup for volumes of liquid below 50 mL with a mechanical impeller and a small surface area of the membrane to minimize the differences between bubbles formed on different parts of the membrane. As mentioned earlier, for our discussion, we take the surface-averaged velocity of the impeller to approximate the shear. An additional benefit of using our system is that it is not a flow system with respect to liquid; only gas is continuously supplied to the generation vessel. This causes the bubbles to be generated in the same liquid volume for the whole duration of the process.
Looking for a minimal rotation rate for the impeller has implications that are important for both fundamental science and commercial or industrial applications. First and foremost, finding the boundary for which there is a change between the formation of stable nanobubbles and larger, easily floatable bubbles is crucial for understanding the properties of these kinds of objects and their generation mechanisms. Additionally, in the case of the applicative approach, finding the value guaranteeing the minimalization of the energy consumption of the nanobubble generation process is extremely important from the economic point of view.
In this study, we performed experiments for two gases and two liquids, obtaining four distinct gas-liquid pairs. We found the minimum shear stress needed for the repeatable generation of nanobubbles based on the densities of number size distributions of nanobubbles obtained using the DLS method. For a lower shear stress, nanobubbles were not formed (no significant signal in the DLS measurement in a range from 0.4 nm to 5000 nm), or the generated nanoobjects were not similar (the standard deviation between measurements was over 50% of average value) between repetitions of the same experiment for the same process parameters. Exemplary data of the Sauter diameter of nanobubbles with standard deviations obtained for nitrogen nanobubbles in water are presented in Figure S3 in the Supplementary Materials. We also excluded the possibility that the nanoobjects originated from either the contaminants from the liquid and gas phase used or the materials of the generation system itself. Both the pure liquids and the system with the impeller submerged but not turned on did not show any nanoobjects using the DLS method. Table 2 summarizes the values of , , , , and for each of the four investigated cases.
Our suspicion, which is the reason we have chosen these gases, is that the solubility of a given gas in a liquid will affect the minimum rotation rate of the impeller and therefore the minimal surface-averaged linear velocity of the impeller. One can see the obvious pattern that for carbon dioxide, higher shear stress is needed to form stable nanobubbles than in the case of nitrogen, and the bubbles tend to be larger. As carbon dioxide is much more soluble in both water and ethanol than nitrogen, there needs to be more gas supplied to the vessel for it to saturate the liquid. Locally, the non-saturated liquid causes the escape of gas from the non-stabilized nanobubble on the membrane surface and therefore slows the growth of the nanobubble. This claim is also backed by literature, as Cerrón-Calle et al. [73] have shown that the volumetric mass transfer coefficient for carbon dioxide is much higher for nanobubble dispersion than for the dispersion of macrobubbles from conventional barbotage [73] or gas-liquid microreactors [74].
The bubbles formed in ethanol demand lower shear stress for stable nanobubble formation than water. By considering the basic principles of gas bubble formation on orifices, for liquid with lower surface tension, the detachment of the bubble should be easier, as there is less energy needed to change the interfacial area. On the other hand, ethanol is also less dense, which would hinder detachment. However, the ratio of surface tensions for ethanol and water is ~0.31, and the ratio of their densities is 0.79. This shows that bubbles formed in ethanol should be smaller than their counterparts generated in water. This effect is visible for both nitrogen and carbon dioxide, and therefore, our results have a ground in the theory. Even assuming that on a nanoscale, the surface tension may have different values than on a macroscale, as shown in the literature [75], there is no indication that the liquid with lower surface tension on the macroscale would have a higher one on the nanoscale.
In the next step, based on the values presented in Table 1 and the values of the physicochemical properties of phases, we found correlations that describe the chosen values (i.e., , and ) in the form of power functions. We have used the least squares method to find the exponents of each power. For each correlation, we present the values of , the residual sum of squares error (RSSE), the underestimation error (), and the overestimation error () for a confidence level of 95%.
First, we correlated the values of as a function of the density and viscosity of liquid, the surface tension between liquid and gas, and the solubility of a given gas in liquid (Table 3, Equation (7)). Using this correlation, one can approximate the minimum linear velocity of the liquid needed for nanobubble generation using only the basic physicochemical properties of gas and liquid. Approximating the minimum velocity has obvious economical value due to cost reduction, but on the other hand, the approximation of generated in the system for a given is also crucial. For this reason, we obtained the dimensionless correlations for and as a function of (Table 3, Equations (8) and (9), respectively) and , , and (Table 3, Equations (10) and (11), respectively). The number depends solely on liquid properties, whereas the and numbers also depend on the hydrodynamics of the system. Using these correlations, as both and are functions of the Sauter diameter, one can calculate the values of and therefore approximate the size of the bubbles for given .
Table 3 also shows the statistical coefficients of all correlations. As can be easily seen, correlations (7), (10), and (11) are well fit to the experimental data. On the other hand, the poor quality of correlations (8) and (9) is, in our opinion, the effect of not considering the hydrodynamic properties. In order to determine the economically viable conditions of nanobubble generation and the diameter of bubbles obtained by this method, we propose using correlation (8) for the first purpose and correlations (10) or (11) for the second one. It is worth noting that we recommend using these three correlations only in the range of variables specified in Table 1 and Table 2.
3.2. Experiment 2
3.2.1. Does the Duration of the Generation of Bubbles in Our Generation Setup Affect the Stability of Nanobubbles in the Presence of Different Concentrations of P-123 Surfactant for the Constant Rotation Rate of the Impeller?
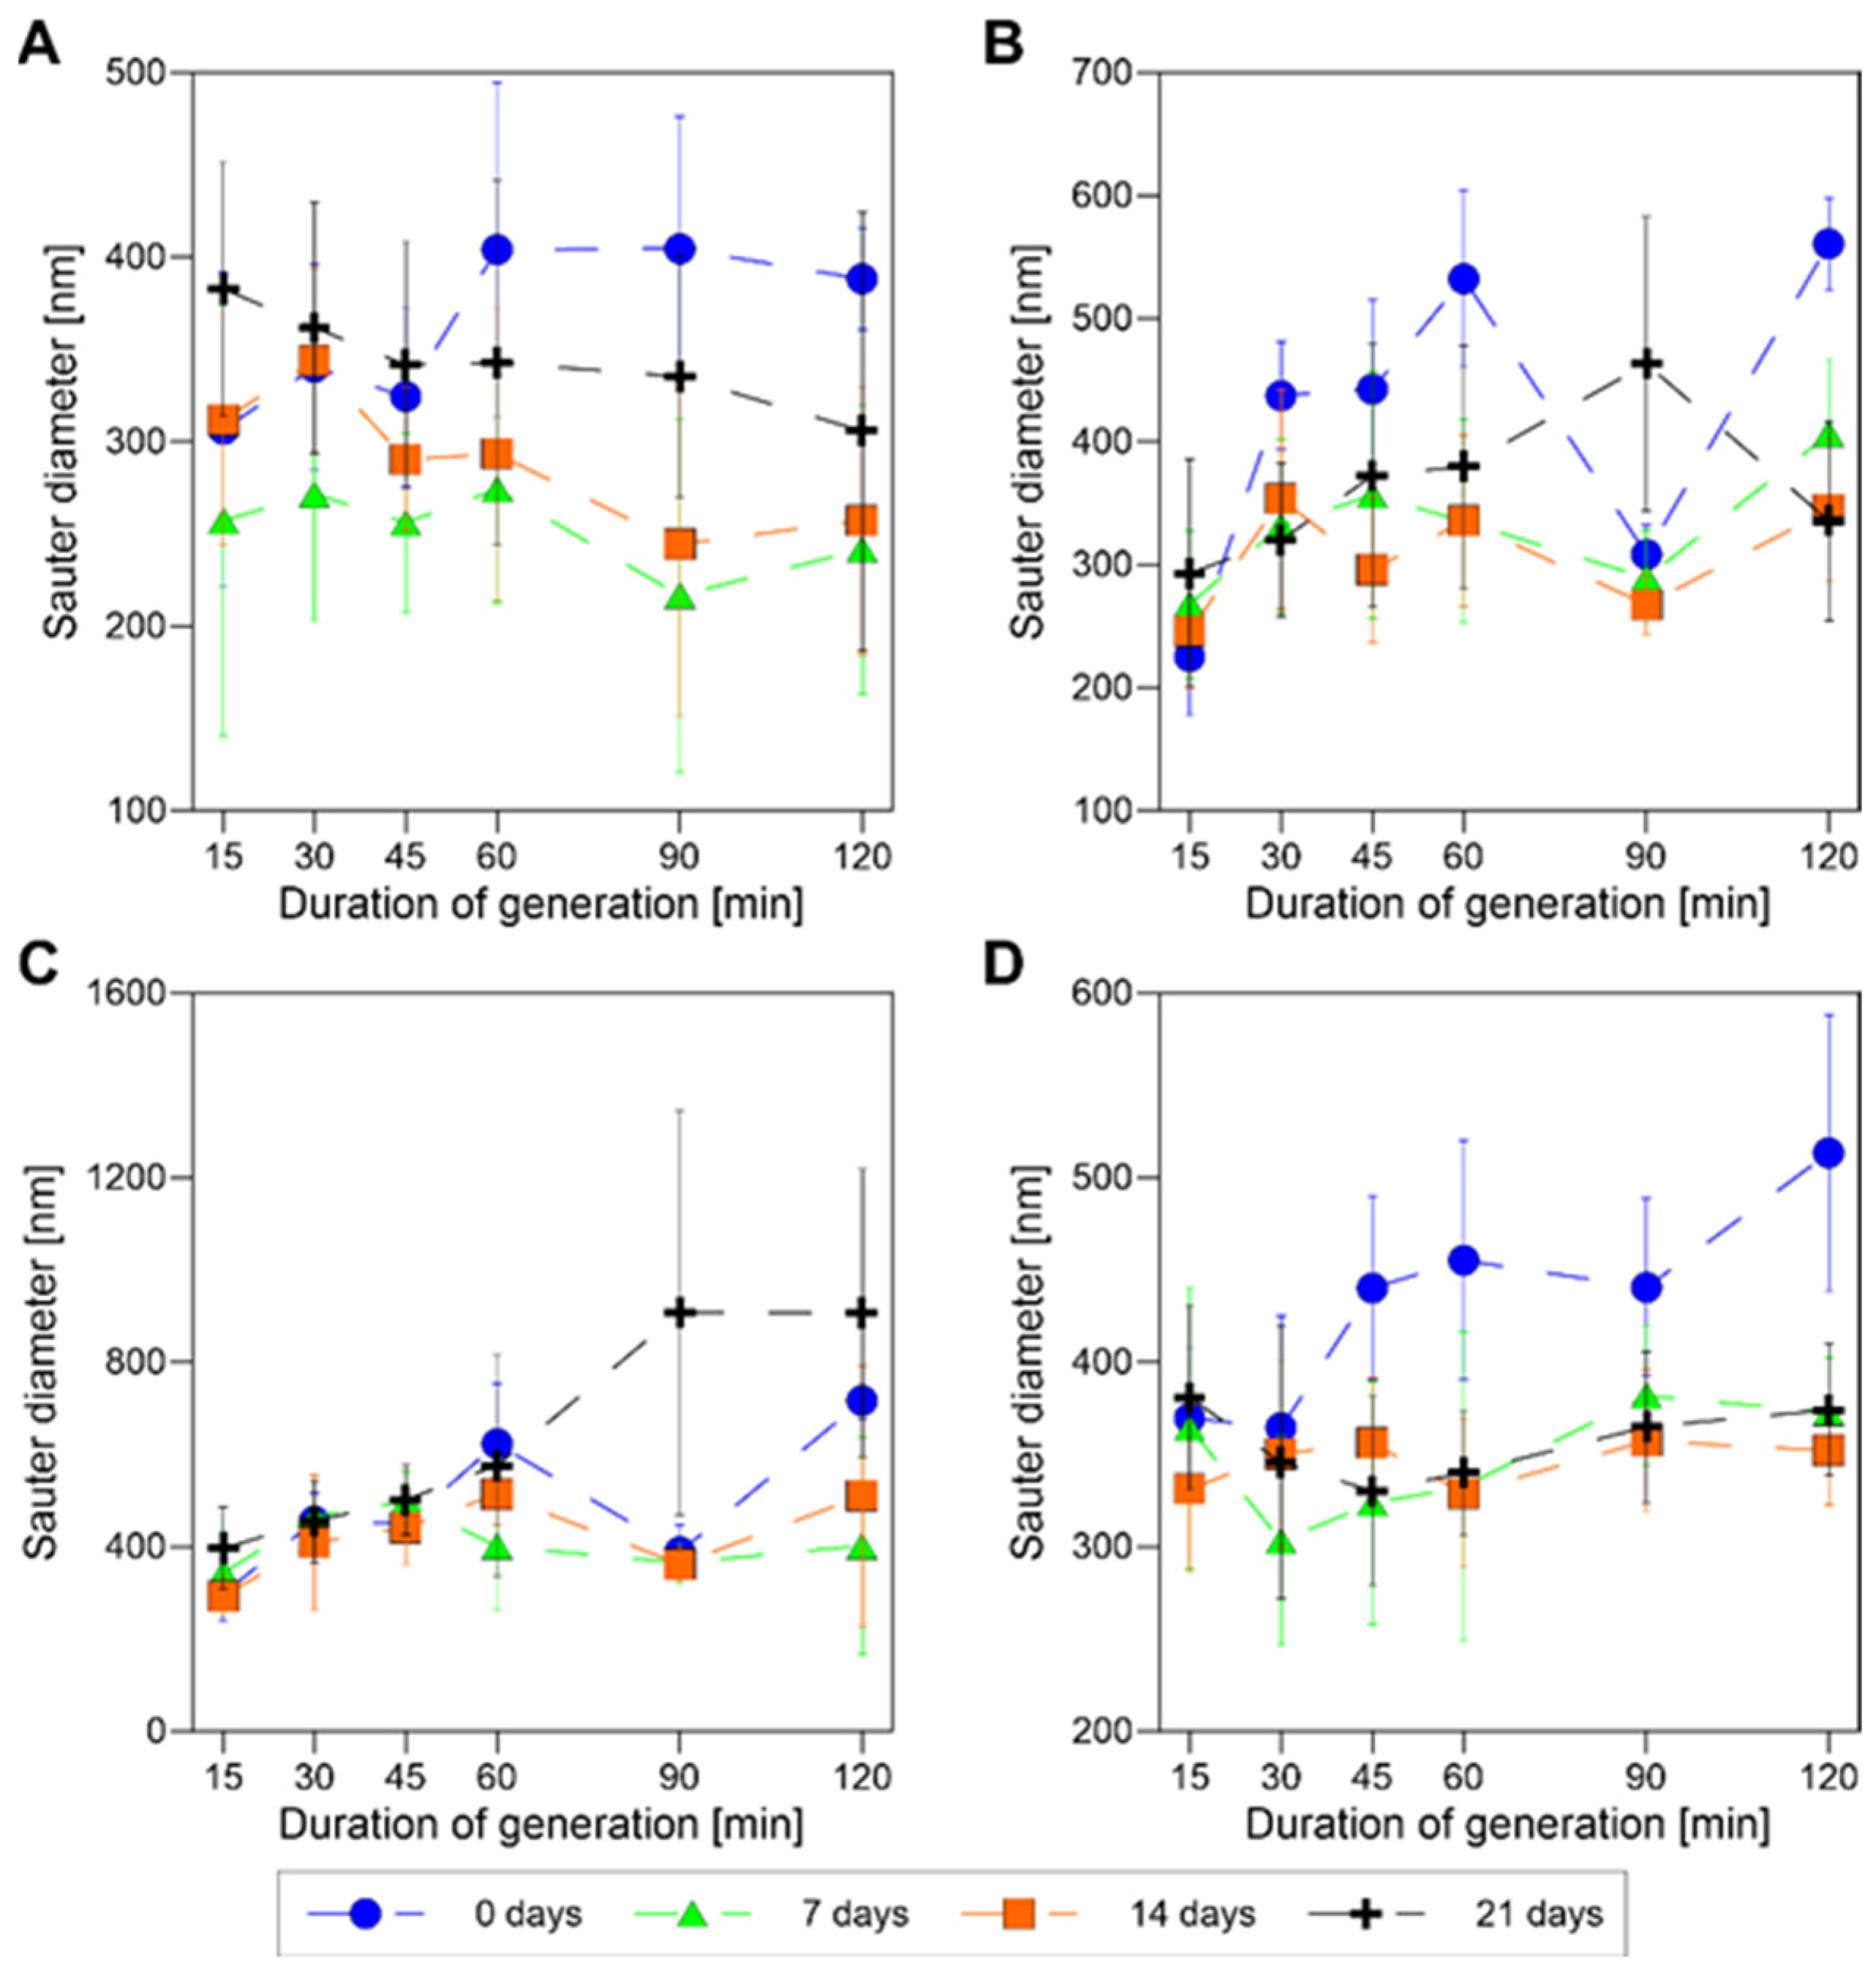
As our goal is to find the most cost-efficient conditions for stable nanobubble generation, we need to determine the time needed for this purpose. Six hundred rotations per minute was proven in Experiment 1 to be the minimal rotation rate for nanobubble generation in a carbon dioxide-water system. However, this time, we have added a surfactant to the water, which will affect the generation process, and our goal is to determine the effect of the process time on nanobubble size. As such, we should not carry out experiments for the minimal value of . We wish to be sure that some bubbles will be generated in every subsequent experiment—the rotation rate of the impeller needs to be larger than minimum. This claim is backed up by the correlations derived as the result of Experiment 1, especially Equation (7), where we have shown that the minimal surface-averaged velocity of the impeller is affected by the viscosity of the liquid (). When a surfactant is introduced, the local viscosity of the solution changes, which increases the value of the rotation rate necessary for nanobubble generation. We are not able to approximate the specific change in local viscosity; therefore, we used a safe margin and increased the minimal rotation rate by 50%. For this reason, the rotation rate of the impeller was set at 900 rpm. Figure 2 presents the Sauter diameter of generated nanobubbles for different fractions of CMC of Pluronic P-123 as a function of generation duration (X-axis) and storage time (different markers). One can see in Figure 2A that in distilled water without the addition of a surfactant, the average diameter of nanobubbles mostly stabilized after 7 days of storage; however, in the case of longer generation times, the diameter was slightly higher directly after generation. In our opinion, this effect is linked to the saturation of the liquid with both dissolved gas and with nanobubbles. As gas cannot be enclosed in new nanobubbles without coalescence as well as it can be dissolved in the liquid, it must form larger bubbles. After 7 days of storage, such large bubbles rise to the surface and form a gas pocket under the cap, which is visible to the naked eye. Such gas pockets are negligible for shorter generation durations. This suspicion is also confirmed by the visual observation of dispersion through the transparent sides of the generation vessel: for longer generation times, the solution started to cloud with the white mist of microbubbles. The first observations of such mist were visible between the 45th and 60th minute of generation. One can also see that even though the difference bears no statistical significance, after 21 days of storage, bubbles also tend to coalesce, which may be the effect of prolonged time and numerous opportunities for spontaneous coalescence during stochastic impacts between nanobubbles. However, looking at the final size of nanobubbles after 21 days, there is no statistically significant difference between the diameters of the carbon dioxide bubbles generated in distilled water for different generation durations.
Figure 2B shows the results obtained for the concentration of surfactant equal to 0.2 of CMC. In this case, we observe drastic differences between different generation times. Focusing on the diameter of bubbles directly after generation, one can see that for the shortest generation duration (15 min), the bubbles are smallest (212 nm), and their diameter increases with an elapsed time of generation up to the 60th minute, reaching over 500 nm. Somewhere between the 60th and 90th minute, the diameter drops to a much lower value and rebounds after the subsequent 30 min. A similar effect, though slightly less significant, is visible for 0.5 CMC (Figure 2C), whereas it is nearly non-existent for 0.8 CMC (Figure 2D). Due to the highly hydrophobic nature of Pluronic P-123 in temperatures above 15 °C, the presence of gas objects in liquid may cause surfactant adhesion to the bubbles in the liquid. According to Yasui et al. [40], the presence of hydrophobic material on the surface of the nanobubble may cause its stabilization. In the case of a rising concentration of surfactant in liquid, more bubbles are enabled to be stabilized by the surfactant, which causes the generation of much more stable nanobubbles with the increase in the surfactant concentration. The nanobubbles generated for 0.8 CMC exhibit an extreme stability of nanobubble size with much lower standard deviations than in the case of 0.2 CMC and 0.5 CMC. In our opinion, the increase in size between the 15th and 60th minute of generation is the effect of surfactant covering the surface of the bubbles. As the amount of surfactant in the liquid is constant for a given concentration, but we continuously supply the gas, the surfactant covers the smaller portions of the total surface of bubbles, and the more gas we have supplied to the liquid. When the concentration (and, consequently, the amount) of surfactant in the liquid increases, a larger number of bubbles can be stabilized by the surfactant. After the surfactant is no longer able to adhere to newly generated bubbles, the new bubbles are not covered, and their size once again drops to a size similar to the stable size in water, i.e., about 300 nm, which is visible in the 90th minute of generation for 0.2 CMC. After that, the bubbles start to increase in size, as they do not have a stabilization agent in the form of a surfactant. When bubbles without surfactant reach the size of bubbles covered in surfactant, dynamic equilibrium is achieved between them, which is once again confirmed by the corresponding sizes of bubbles in the 60th and 120th minute of generation for both 0.2 CMC and 0.5 CMC.
It is interesting that for distilled water, 0.5 CMC, and 0.8 CMC, the initial size of bubbles generated for the shortest generation duration (15 min) is similar (no statistically significant difference), but in the case of dispersions with surfactant, the stability of such bubbles during storage is much higher.
The same data can also be visualized in different axes, i.e., as the Sauter diameter as a function of the critical micellar concentration of Pluronic P-123 for different durations of generation for a given time of storage (Figure S1) or the Sauter diameter as a function of the critical micellar concentration of Pluronic P-123 for different times of storage for a given duration of generation (Figure S2). As plots in these Figures present the same data as those in Figure 2, we decided to submit them in the Supplementary Materials. However, we would like to point out that for Figure S1A, it is visible that with an increasing time of generation, the dispersion exhibits a cyclic change in the size of bubbles, which we have discussed above.
In conclusion from this part of Experiment 2, we have chosen a time of generation of 30 min for surfactant solutions, as after this time, we suspect that bubbles are still covered with surfactant, and this time is also short and cost-efficient. For longer generation times, the bubbles start to grow and shrink periodically. The first shrinkage was visible for 45 min of generation; therefore, we have chosen the shorter time to ensure stability of the nanobubble size.
3.2.2. How Does the Change in the Rotation Rate of the Impeller Affect the Stability of Nanobubbles for Constant Generation Time for Pluronic P-123?
For this experiment, we carried out the generation of nanobubbles for three concentrations of Pluronic P-123 surfactant and distilled water with the rotation speed of the impeller set at one of three distinct values, i.e., 600 rpm, 900 rpm, or 1200 rpm. Each generation lasted for 30 min, in accordance with the results of Experiment 2.1.
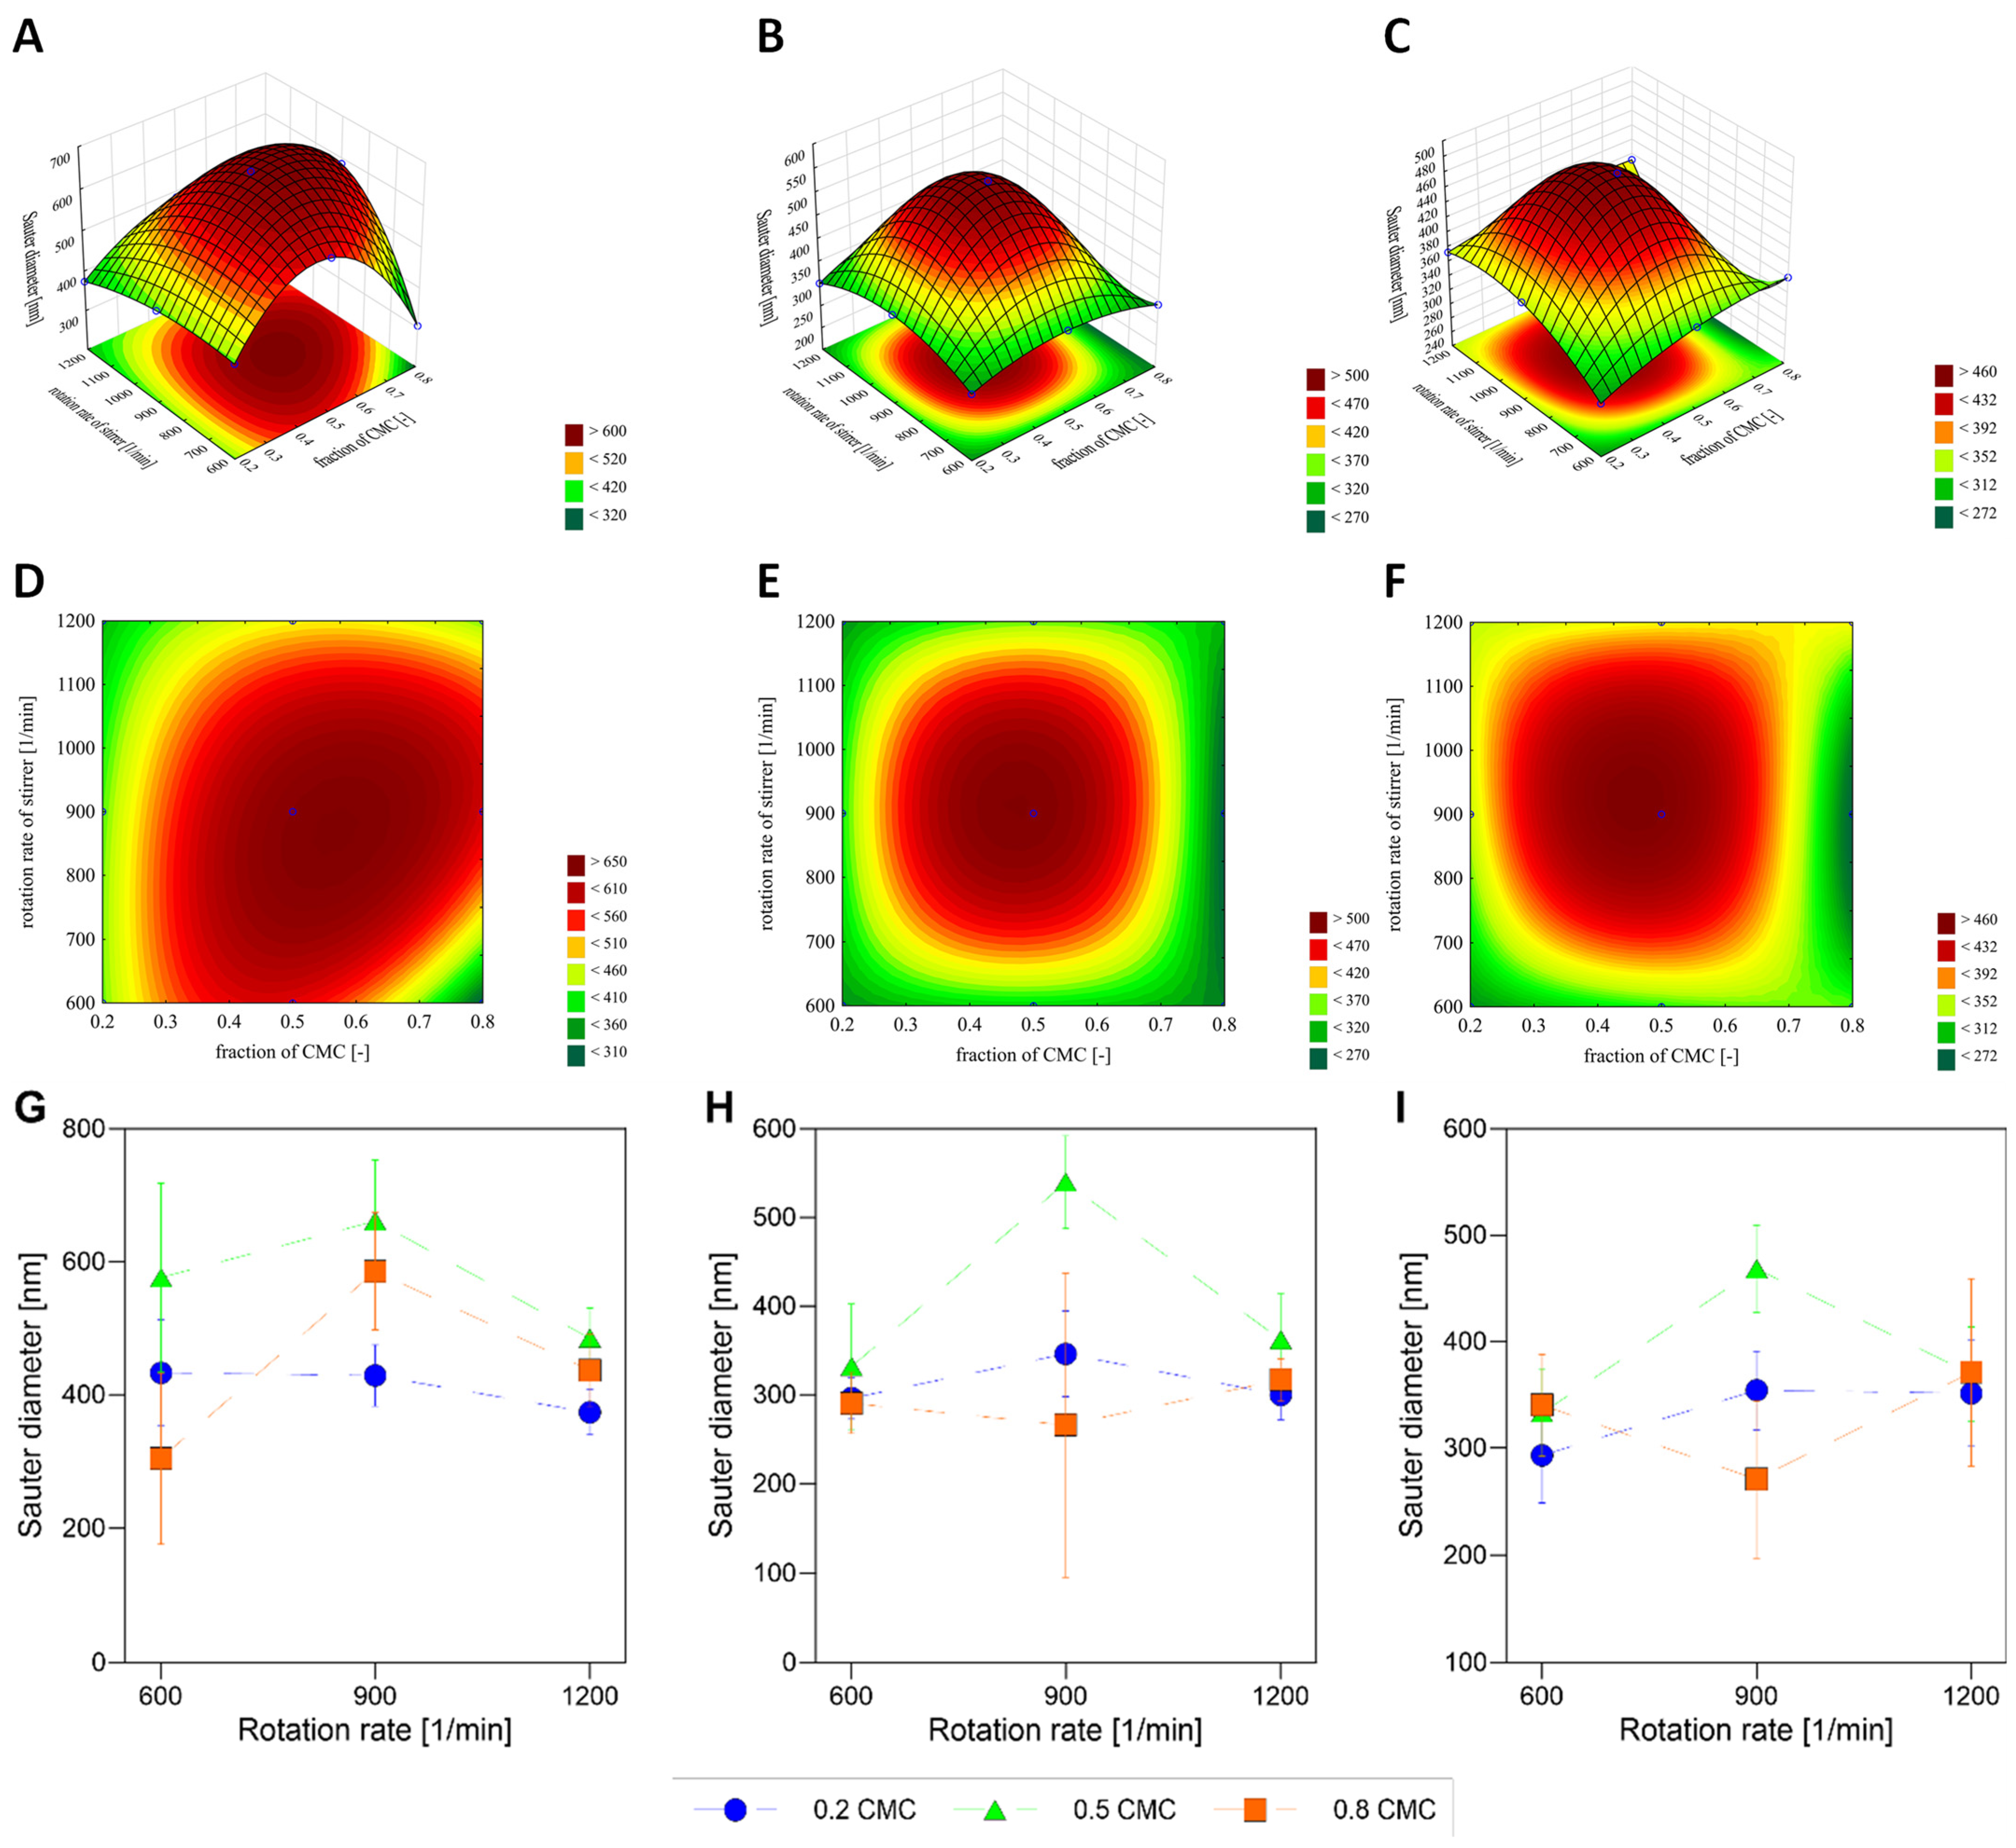
We present the data in three forms: surface plots (plots A, B, C in Figure 3) and heat maps (plots D, E, F in Figure 3) in which two axes denote the change in surfactant concentration and rotation rate of the impeller, and the color of a given point shows the Sauter diameter of bubbles for its coordinates, as well as simple scatter plots (plots G, H, I in Figure 3) in which three data series denote the behavior for different concentrations of surfactant.
Pluronic P-123 shows a similar response (Figure 3) to the change in CMC fraction as observed for this surfactant in Experiment 2.1., i.e., we observe the maximum Sauter diameter for 0.5 CMC. However, looking at the change in rotation rate of the impeller for a constant fraction of CMC, for a higher rotation rate, we observe an interesting phenomenon. We see that for 0.5 CMC and 0.8 CMC, the response to an increase in the shear stress is not monotonous as a function of both time and the rotation rate of the impeller. We do not see the same effect for 0.2 CMC, where the change is indeed monotonous. The effect obtained for 0.2 CMC is similar to the effect obtained for water in our previous studies [49]. However, when the amount of P-123 surfactant is increased, we see that there is a visible maximum of the Sauter diameter for 900 rpm, which is the most prevalent for 0.8 CMC. With elapsed time, the diameters of bubbles in both 0.2 CMC samples and 0.8 CMC samples reach approximate stable values of about 300–350 nm, and for 0.5 CMC, the maximum is still visible. It is worth noting that samples for 0.5 CMC were also affected the most by the generation time in Experiment 2.1., hinting that for these average values of surfactant concentration, the whole system is extremely dynamic and vulnerable to any change in generation parameters.
To answer the question of which concentration of surfactant and which rotation rate of the impeller we should choose for the cost-efficient generation of nanobubbles, we need to see whether the size of the bubbles remains constant over time and whether the change in rotation rate allows us to produce other sizes of nanobubbles. We can see that the most stable nanobubbles are present for a concentration of surfactant equal to 0.2 CMC, as when the size of nanobubbles changes from the initial diameter around 400 nm to 300 nm after the first week, it does not change further. Additionally, the size of generated bubbles does not tend to change with an increase in the rotation rate of the impeller in the investigated range. Therefore, we recommend using a concentration of Pluronic equal to 0.2 CMC () and a rotation rate of 600 rpm.
4. Conclusions
During this study, two experiments were performed to gain knowledge about the minimum shear stress needed for nanobubble formation in a membrane-impeller system and the stabilization of nanobubble dispersion using biocompatible surfactant from the Pluronic group (namely Pluronic P-123) and two gases: carbon dioxide and nitrogen.
In the first experiment, we showed the differences between the minimum average velocity of the impeller for different pairs of liquid and gas, namely, that for ethanol, the shear stress needed for nanobubble generation is lower than in the case of water; and that higher shear stress is needed to detach bubbles of carbon dioxide than those of nitrogen. We proposed correlations for predicting the minimum average velocity of the impeller (), the Eötvös number (), and the ratio between the Sauter diameter of bubbles and the membrane pore diameter (), which allows for either calculation of the minimum shear stress needed for nanobubble generation or the Sauter diameter of bubbles generated for such conditions. We hope that these correlations will be a step in the direction of the repeatable and controllable generation of nanobubbles in various liquids.
As carbon dioxide has high medical usability, we decided to focus on its interactions with surfactants. Looking for the optimal time of generation of CO2 nanobubbles in water with Pluronic P-123 for constant shear stress, we saw results corresponding with those obtained by Fan et al. [5], which claim that for an increasing degree of saturation of liquid with gas, the size of nanobubbles would increase. However, we have also shown that after the initial period during which nanobubbles increase in size, there is a rapid decrease in the Sauter diameter of nanobubbles, which is then followed by a more rapid increase in size. We suspect that in the given generation setup, the time of generation over 60 min causes a high coalescence of bubbles, which is detrimental to the dispersion quality. This phenomenon should be present in every type of hydrodynamic generation setup, but the specific time of generation when it occurs will differ depending on the volume and efficiency of gas transfer to the liquid. Identifying the optimal time of generation of nanobubbles will have huge impact on the efficiency of processes taking into account both cost and energy consumption, and therefore on their viability and sustainability.
As for shorter durations of generation resulting in the nanodispersion of gas being stable, we decided to carry out further experiments for a generation time of 30 min. Next, we investigated Pluronic P-123 further for the chosen time of generation, this time changing both the concentration of surfactant and the shear stress induced by the impeller. It was obvious that the bubble diameter stabilized after 7 days of storage.
To sum up, this study has shown that it is possible to find the minimum velocity of liquid needed for nanobubble generation for different liquid and gas phases. We have also investigated the minimal time of generation. Both the impeller rotation rate and time of the process directly contribute to the costs of the process, and for that reason, the search for minimalization of these values is important. Additionally, it was shown that Pluronic P-123 can be used as a stabilizer of nanobubble dispersion of carbon dioxide, and therefore, its bubble dispersions can potentially be used as the medium for home applications for treatment. However, Cox et al. (2021) [76] have shown that Pluronic surfactants may cause an allergic response in prolonged exposure, so our approach of combining nanobubbles with Pluronic stabilizers may only be used in cases of short treatments, or a new stabilizer for nanobubble dispersions needs to be found. This, however, requires further studies, especially in cooperation with medical institutions.
Supplementary Materials
The following supporting information can be downloaded at: https://www.mdpi.com/article/10.3390/pr11092739/s1, Figure S1: The Sauter diameter of carbon dioxide nanobubbles generated (900 rpm) in dispersions with different concentrations of Pluronic P-123 surfactant during storage. The time of storage differs between plots (A) directly after generation (0 days after generation), (B) 7 days after generation, (C) 14 days after generation, (D) 21 days after generation; Figure S2: The Sauter diameter of carbon dioxide nanobubbles generated (900 rpm) in dispersions with different concentrations of Pluronic P-123 surfactant during storage. The time of generation differs between plots. (A) t = 15 min, (B) t = 30 min, (C) t = 45 min, (D) t = 60 min, (E) t = 90 min, (F) t = 120 min; Figure S3: The Sauter diameter of nitrogen nanobubbles generated in pure water for different rotation rates of the stirrer and 30 min of generation.
Author Contributions
Conceptualization, K.U. and P.S.; methodology, K.U.; software, K.U. and A.C.; validation, K.U. and P.S.; formal analysis, K.U. and P.S.; investigation, A.C.; resources, P.S.; data curation, K.U.; writing—original draft preparation, K.U.; writing—review and editing, P.S. and K.U.; visualization, K.U. and A.C.; supervision, P.S.; project administration, P.S.; funding acquisition, P.S. All authors have read and agreed to the published version of the manuscript.
Funding
This work was supported by National Science Centre, Poland, grant number 2018/29/B/ST8/00365.
Data Availability Statement
The raw data gathered can be obtained from authors by request.
Conflicts of Interest
The authors declare no conflict of interest.
Abbreviations
| Ca | Capillary number, (-) |
| CMC | Critical micellar concentration, (g/dm3) |
| CXTAB | Alkyl trimethylammonium bromide |
| d | Diameter of a impeller, (m) |
| d32 | Sauter diameter of nanobubbles, (nm) |
| dpore | Diameter of the membrane pore, (m) |
| DLS | Dynamic Light Scattering |
| Eo | Eötvös number, (-) |
| g | Gravitational acceleration, (m/s2) |
| n | Rotation rate of an impeller, (1/s) |
| nmin | Minimal rotation rate of the impeller needed for needed for nanobubble generation, (1/s) |
| Mo | Morton number, (-) |
| NTA | Nanoparticle Tracking Analysis |
| P-123 | Pluronic P-123 |
| PEG | Poly(ethylene glycol) |
| PPG | Poly(propylene glycol) |
| R2 | Regression coefficient, [-] |
| Re | Reynolds number, [-] |
| RSSE | Residual sum of squares error, unit varies |
| s | Solubility of gas in liquid, (ggas/100 gsolvent) |
| SDS | Sodium dodecyl sulphate |
| SLS | Static Light Scattering |
| Surface-averaged velocity of the impeller, (m/s) | |
| Greek letters: | |
| Δ+ | Overestimation error, (-) |
| Δ− | Underestimation error, (-) |
| μ | Dynamic viscosity of a liquid, (Pa∙s) |
| ρ | Density of a liquid, (kg/m3) |
| σ | Surface tension between liquid and air, (N/m) |
| Ratio of Sauter diameter and membrane pore diameter, (m/m) | |
| Subscripts: | |
| G | Corresponding to gas phase |
| L | Corresponding to liquid phase |
References
- Bunkin, N.F.; Kochergin, A.V.; Lobeyev, A.V.; Ninham, B.W.; Vinogradova, O.I. Existence of charged submicrobubble clusters in polar liquids as revealed by correlation between optical cavitation and electrical conductivity. Colloids Surf. A Physicochem. Eng. Asp. 1996, 110, 207–212. [Google Scholar] [CrossRef]
- Ljunggren, S.; Eriksson, J.C. The lifetime of a colloid-sized gas bubble in water and the cause of the hydrophobic attraction. Colloids Surf. A Physicochem. Eng. Asp. 1997, 129–130, 151–155. [Google Scholar] [CrossRef]
- Brenner, M.P.; Lohse, D. Dynamic equilibrium mechanism for surface nanobubble stabilization. Phys. Rev. Lett. 2008, 101, 214505. [Google Scholar] [CrossRef] [PubMed]
- Bunkin, N.F.; Suyazov, N.V.; Shkirin, V.; Ignat’ev, P.S.; Indukaev, K.V. Determination of the microstructure of gas bubbles in highly purified water by measuring the elements of the laser radiation scattering matrix. Quantum Electron. 2009, 39, 367–381. [Google Scholar] [CrossRef]
- Fan, M.; Tao, D.; Honaker, R.; Luo, Z. Nanobubble generation and its application in froth flotation (part I): Nanobubble generation and its effects on properties of microbubble and millimeter scale bubble solutions. Min. Sci. Technol. 2010, 20, 1–19. [Google Scholar] [CrossRef]
- Yamamoto, T.; Ohnishi, S. Molecular dynamics study on helium nanobubbles in water. Phys. Chem. Chem. Phys. 2011, 13, 16142. [Google Scholar] [CrossRef] [PubMed]
- Wu, C.; Nesset, K.; Masliyah, J.; Xu, Z. Generation and characterization of submicron size bubbles. Adv. Colloid Interface Sci. 2012, 179–182, 123–132. [Google Scholar] [CrossRef]
- Nakatake, Y.; Kisu, S.; Shigyo, K.; Eguchi, T.; Watanabe, T. Effect of nano air-bubbles mixed into gas oil on common-rail diesel engine. Energy 2013, 59, 233–239. [Google Scholar] [CrossRef]
- Calgaroto, S.; Wilberg, K.Q.; Rubio, J. On the nanobubbles interfacial properties and future applications in flotation. Miner. Eng. 2014, 60, 33–40. [Google Scholar] [CrossRef]
- Zhao, W.; Hu, X.; Duan, J.; Liu, T.; Liu, M.; Dong, Y. Oxygen release from nanobubbles adsorbed on hydrophobic particles. Chem. Phys. Lett. 2014, 608, 224–228. [Google Scholar] [CrossRef]
- Wang, X.; Yuan, T.; Lei, Z.; Kobayashi, M.; Adachi, Y.; Shimizu, K.; Lee, D.J.; Zhang, Z. Supplementation of O2-containing gas nanobubble water to enhance methane production from anaerobic digestion of cellulose. Chem. Eng. J. 2020, 398, 125652. [Google Scholar] [CrossRef]
- Kim, J.Y.; Song, M.G.; Kim, J.D. Zeta potential of nanobubbles generated by ultrasonication in aqueous alkyl polyglycoside solutions. J. Colloid Interface Sci. 2000, 223, 285–291. [Google Scholar] [CrossRef] [PubMed]
- Kikuchi, K.; Takeda, H.; Rabolt, B.; Okaya, T.; Ogumi, Z.; Saihara, Y.; Noguchi, H. Hydrogen particles and supersaturation in alkaline water from an Alkali-Ion-Water electrolyzer. J. Electroanal. Chem. 2001, 506, 22–27. [Google Scholar] [CrossRef]
- Rodrigues, R.T.; Rubio, J. New basis for measuring the size distribution of bubbles. Miner. Eng. 2003, 16, 757–765. [Google Scholar] [CrossRef]
- Cho, S.H.; Kim, J.Y.; Chun, J.H.; Kim, J.D. Ultrasonic formation of nanobubbles and their zeta-potentials in aqueous electrolyte and surfactant solutions. Colloids Surf. A Physicochem. Eng. Asp. 2005, 269, 28–34. [Google Scholar] [CrossRef]
- Kikuchi, K.; Tanaka, Y.; Saihara, Y.; Maeda, M.; Kawamura, M.; Ogumi, Z. Concentration of hydrogen nanobubbles in electrolyzed water. J. Colloid Interface Sci. 2006, 298, 914–919. [Google Scholar] [CrossRef]
- Alheshibri, M.; Qian, J.; Jehannin, M.; Craig, V.S.J. A History of Nanobubbles. Langmuir 2016, 32, 11086–11100. [Google Scholar] [CrossRef] [PubMed]
- Tsai, J.C.; Kumar, M.; Chen, S.Y.; Lin, J.G. Nano-bubble flotation technology with coagulation process for the cost-effective treatment of chemical mechanical polishing wastewater. Sep. Purif. Technol. 2007, 58, 61–67. [Google Scholar] [CrossRef]
- Kikuchi, K.; Ioka, A.; Oku, T.; Tanaka, Y.; Saihara, Y.; Ogumi, Z. Concentration determination of oxygen nanobubbles in electrolyzed water. J. Colloid Interface Sci. 2009, 329, 306–309. [Google Scholar] [CrossRef]
- Ebina, K.; Shi, K.; Hirao, M.; Hashimoto, J.; Kawato, Y.; Kaneshiro, S.; Morimoto, T.; Koizumi, K.; Yoshikawa, H. Oxygen and Air Nanobubble Water Solution Promote the Growth of Plants, Fishes, and Mice. PLoS ONE 2013, 8, e65339. [Google Scholar] [CrossRef]
- Hamamoto, S.; Takemura, T.; Suzuki, K.; Nishimura, T. Effects of pH on nano-bubble stability and transport in saturated porous media. J. Contam. Hydrol. 2017, 208, 61–67. [Google Scholar] [CrossRef] [PubMed]
- Temesgen, T.; Bui, T.T.; Han, M.; Kim, T.I.; Park, H. Micro and nanobubble technologies as a new horizon for water-treatment techniques: A review. Adv. Colloid Interface Sci. 2017, 246, 40–51. [Google Scholar] [CrossRef]
- Ulatowski, K.; Sobieszuk, P.; Mróz, A.; Ciach, T. Stability of nanobubbles generated in water using porous membrane system. Chem. Eng. Process. Process Intensif. 2019, 136, 62–71. [Google Scholar] [CrossRef]
- Alheshibri, M.; Craig, V.S.J. Armoured nanobubbles; ultrasound contrast agents under pressure. J. Colloid Interface Sci. 2019, 537, 123–131. [Google Scholar] [CrossRef] [PubMed]
- Nirmalkar, N.; Pacek, A.W.; Barigou, M. On the existence and stability of bulk nanobubbles. Langmuir 2018, 34, 10964–10973. [Google Scholar] [CrossRef] [PubMed]
- Mo, C.R.; Wang, J.; Fang, Z.; Zhou, L.M.; Zhang, L.J.; Hu, J. Formation and stability of ultrasonic generated bulk nanobubbles. Chin. Phys. B 2018, 27, 118104. [Google Scholar] [CrossRef]
- Ulatowski, K.; Fiuk, J.; Sobieszuk, P. Sterilisation of nanobubble dispersions. Chem. Process Eng. 2020, 41, 69–76. [Google Scholar] [CrossRef]
- Michailidi, E.D.; Bomis, G.; Varoutoglou, A.; Kyzas, G.Z.; Mitrikas, G.; Mitropoulos, A.C.; Efthimiadou, E.K.; Favvas, E.P. Bulk nanobubbles: Production and investigation of their formation/stability mechanism. J. Colloid Interface Sci. 2020, 564, 371–380. [Google Scholar] [CrossRef]
- Phan, K.K.T.; Truong, T.; Wang, Y.; Bhandari, B. Nanobubbles: Fundamental characteristics and applications in food processing. Trends Food Sci. Technol. 2020, 95, 118–130. [Google Scholar] [CrossRef]
- Xiao, W.; Xu, G. Mass transfer of nanobubble aeration and its effect on biofilm growth: Microbial activity and structural properties. Sci. Total Environ. 2020, 703, 134976. [Google Scholar] [CrossRef]
- Sayed Ahmed, A.S. Cavitation Nanobubble Enhanced Flotation Process for More Efficient Coal Recovery. 2013. Theses and Dissertations--Mining Engineering. 8. Available online: https://uknowledge.uky.edu/mng_etds/8 (accessed on 20 August 2023).
- Sobieszuk, P.; Strzyżewska, A.; Ulatowski, K. Investigation of the possibility of culturing aerobic yeast with oxygen nanobubble addition and evaluation of the results of batch and semi-batch cultures of Saccharomyces cerevisiae. Chem. Eng. Process. Process Intensif. 2021, 159, 108247. [Google Scholar] [CrossRef]
- Ulatowski, K.; Sobieszuk, P. Gas nanobubble dispersions as the important agent in environmental processes—Generation methods review. Water Environ. J. 2020, 34, 772–790. [Google Scholar] [CrossRef]
- Jin, J.; Wang, R.; Tang, J.; Yang, L.; Feng, Z.; Xu, C.; Yang, F.; Gu, N. Dynamic tracking of bulk nanobubbles from microbubbles shrinkage to collapse. Colloids Surf. A Physicochem. Eng. Asp. 2020, 589, 124430. [Google Scholar] [CrossRef]
- Tan, B.H.; An, H.; Ohl, C.D. Stability of surface and bulk nanobubbles. Curr. Opin. Colloid Interface Sci. 2021, 53, 101428. [Google Scholar] [CrossRef]
- Yadav, G.; Fabiano, L.A.; Soh, L.; Zimmerman, J.; Sen, R.; Seider, W.D. CO2 process intensification of algae oil extraction to biodiesel. AIChE J. 2021, 67, e16992. [Google Scholar] [CrossRef]
- Kim, H.; Han, M. A Study on the Development of Sub-Micron Bubble Generator and Characterization of Sub-Micron Bubble. Ph.D. Thesis, Seoul National University, Seoul, Republic of Korea, 2014. [Google Scholar]
- Li, H.; Hu, L.; Song, D.; Lin, F. Characteristics of Micro-Nano Bubbles and Potential Application in Groundwater Bioremediation. Water Environ. Res. 2014, 86, 844–851. [Google Scholar] [CrossRef]
- An, H.; Liu, G.; Craig, V.S.J. Wetting of nanophases: Nanobubbles, nanodroplets and micropancakes on hydrophobic surfaces. Adv. Colloid Interface Sci. 2015, 222, 9–17. [Google Scholar] [CrossRef]
- Yasui, K.; Tuziuti, T.; Kanematsu, W.; Kato, K. Dynamic Equilibrium Model for a Bulk Nanobubble and a Microbubble Partly Covered with Hydrophobic Material. Langmuir 2016, 32, 11101–11110. [Google Scholar] [CrossRef]
- Park, J.B.; Shin, D.; Kang, S.; Cho, S.P.; Hong, B.H. Distortion in Two-Dimensional Shapes of Merging Nanobubbles: Evidence for Anisotropic Gas Flow Mechanism. Langmuir 2016, 32, 11303–11308. [Google Scholar] [CrossRef]
- Leroy, V.; Norisuye, T. Investigating the Existence of Bulk Nanobubbles with Ultrasound. ChemPhysChem 2016, 17, 2787–2790. [Google Scholar] [CrossRef]
- Hu, L.; Xia, Z. Application of ozone micro-nano-bubbles to groundwater remediation. J. Hazard. Mater. 2018, 342, 446–453. [Google Scholar] [CrossRef] [PubMed]
- Ushikubo, F.Y.; Furukawa, T.; Nakagawa, R.; Enari, M.; Makino, Y.; Kawagoe, Y.; Shiina, T.; Oshita, S. Evidence of the existence and the stability of nano-bubbles in water. Colloids Surf. A Physicochem. Eng. Asp. 2010, 361, 31–37. [Google Scholar] [CrossRef]
- Uchida, T.; Liu, S.; Enari, M.; Oshita, S.; Yamazaki, K.; Gohara, K. Effect of NaCl on the lifetime of micro- and nanobubbles. Nanomaterials 2016, 6, 31. [Google Scholar] [CrossRef] [PubMed]
- Zinjenab, Z.T.; Azimi, E.; Shadman, M.; Hosseini, M.R.; Abbaszadeh, M.; Namgar, S.M. Nano-microbubbles and feed size interaction in lead and zinc sulfide minerals flotation. Chem. Eng. Process. Process Intensif. 2023, 189, 109401. [Google Scholar] [CrossRef]
- Ohgaki, K.; Khanh, N.Q.; Joden, Y.; Tsuji, A.; Nakagawa, T. Physicochemical approach to nanobubble solutions. Chem. Eng. Sci. 2010, 65, 1296–1300. [Google Scholar] [CrossRef]
- Terasaka, K.; Hirabayashi, A.; Nishino, T.; Fujioka, S.; Kobayashi, D. Development of microbubble aerator for waste water treatment using aerobic activated sludge. Chem. Eng. Sci. 2011, 66, 3172–3179. [Google Scholar] [CrossRef]
- Ulatowski, K.; Sobieszuk, P. Influence of liquid flowrate on size of nanobubbles generated by porous-membrane modules. Chem. Process Eng. 2018, 39, 335–345. [Google Scholar] [CrossRef]
- Khan, M.S.; Hwang, J.; Lee, K.; Choi, Y.; Kim, K.; Koo, H.J.; Hong, J.W.; Choi, J. Oxygen-carrying micro/nanobubbles: Composition, synthesis techniques and potential prospects in photo-triggered theranostics. Molecules 2018, 23, 2210. [Google Scholar] [CrossRef]
- Wang, Q.; Zhao, H.; Qi, N.; Qin, Y.; Zhang, X.; Li, Y. Generation and Stability of Size-Adjustable Bulk Nanobubbles Based on Periodic Pressure Change. Sci. Rep. 2019, 9, 1118. [Google Scholar] [CrossRef]
- Ashokkumar, M. The characterization of acoustic cavitation bubbles—An overview. Ultrason. Sonochem. 2011, 18, 864–872. [Google Scholar] [CrossRef]
- German, S.R.; Edwards, M.A.; Chen, Q.; Liu, Y.; Luo, L.; White, H.S. Electrochemistry of single nanobubbles. Estimating the critical size of bubble-forming nuclei for gas-evolving electrode reactions. Faraday Discuss. 2016, 193, 223–240. [Google Scholar] [CrossRef] [PubMed]
- Ma, X.; Li, M.; Xu, X.; Sun, C. On the role of surface charge and surface tension tuned by surfactant in stabilizing bulk nanobubbles. Appl. Surf. Sci. 2023, 608, 155232. [Google Scholar] [CrossRef]
- Hayashi, H.; Yamada, S.; Kumada, Y.; Matsuo, H.; Toriyama, T.; Kawahara, H. Immersing Feet in Carbon Dioxide-enriched Water Prevents Expansion and Formation of Ischemic Ulcers after Surgical Revascularization in Diabetic Patients with Critical Limb Ischemia. Ann. Vasc. Dis. 2008, 1, 111–117. [Google Scholar] [CrossRef] [PubMed]
- Shalan, N.; Al-Bazzaz, A.; Al-Ani, I.; Najem, F.; Al-Masri, M. Effect of Carbon Dioxide Therapy on Diabetic Foot Ulcer. J. Diabetes Mellit. 2015, 5, 284–289. [Google Scholar] [CrossRef]
- Abdulhamza, G.R.; Al-Omary, H.L. Physiological Effects of Carbon Dioxide Treatment on Diabetic Foot Ulcer Patients. IOSR J. Pharm. Biol. Sci. (IOSR-JPBS) 2018, 13, 1–7. [Google Scholar] [CrossRef]
- Guan, Y.; Huang, J.; Zuo, L.; Xu, J.; Si, L.; Qiu, J.; Li, G. Effect of pluronic P123 and F127 block copolymer on P-glycoprotein transport and CYP3A metabolism. Arch. Pharm. Res. 2011, 34, 1719–1728. [Google Scholar] [CrossRef]
- Yang, T.F.; Chen, C.N.; Chen, M.C.; Lai, C.H.; Liang, H.F.; Sung, H.W. Shell-crosslinked Pluronic L121 micelles as a drug delivery vehicle. Biomaterials 2007, 28, 725–734. [Google Scholar] [CrossRef]
- Dluska, E.; Markowska-Radomska, A.; Metera, A.; Rudniak, L.; Kosicki, K. Mass transfer of anti-cancer drug delivery to brain tumors by a multiple emulsion-based implant. AIChE J. 2022, 68, e17501. [Google Scholar] [CrossRef]
- Odziomek, M.; Ulatowski, K.; Dobrowolska, K.; Górniak, I.; Sobieszuk, P.; Sosnowski, T.R. Aqueous dispersions of oxygen nanobubbles for potential application in inhalation therapy. Sci. Rep. 2022, 12, 12455. [Google Scholar] [CrossRef]
- Ulatowski, K.; Wierzchowski, K.; Fiuk, J.; Sobieszuk, P. Effect of Nanobubble Presence on Murine Fibroblasts and Human Leukemia Cell Cultures. Langmuir 2022, 38, 8575–8584. [Google Scholar] [CrossRef]
- Bhandari, P.N.; Cui, Y.; Elzey, B.D.; Goergen, C.J.; Long, C.M.; Irudayaraj, J. Oxygen nanobubbles revert hypoxia by methylation programming. Sci. Rep. 2017, 7, 9268. [Google Scholar] [CrossRef] [PubMed]
- Gao, Y.; Hernandez, C.; Yuan, H.X.; Lilly, J.; Kota, P.; Zhou, H.; Wu, H.; Exner, A.A. Ultrasound molecular imaging of ovarian cancer with CA-125 targeted nanobubble contrast agents, Nanomedicine Nanotechnology. Biol. Med. 2017, 13, 2159–2168. [Google Scholar] [CrossRef]
- Canavese, G.; Ancona, A.; Racca, L.; Canta, M.; Dumontel, B.; Barbaresco, F.; Limongi, T.; Cauda, V. Nanoparticle-assisted ultrasound: A special focus on sonodynamic therapy against cancer. Chem. Eng. J. 2018, 340, 155–172. [Google Scholar] [CrossRef] [PubMed]
- Etchepare, R.; Oliveira, H.; Nicknig, M.; Azevedo, A.; Rubio, J. Nanobubbles: Generation using a multiphase pump, properties and features in flotation. Miner. Eng. 2017, 112, 19–26. [Google Scholar] [CrossRef]
- Grace, J.R.; Wairegi, T.; Nguyen, T.H. Shapes and velocities of single drops and bubbles moving freely through immiscible liquids. Trans. Inst. Chem. Eng. 1976, 54, 167–173. [Google Scholar]
- Azevedo, A.; Oliveira, H.; Rubio, J. Historical perspective Bulk nanobubbles in the mineral and environmental areas: Updating research and applications. Adv. Colloid Interface Sci. 2019, 271, 101992. [Google Scholar] [CrossRef]
- Zimmerman, W.B.; Tesař, V.; Bandulasena, H.C.H. Towards energy efficient nanobubble generation with fluidic oscillation. Curr. Opin. Colloid Interface Sci. 2011, 16, 350–356. [Google Scholar] [CrossRef]
- Tang, J.; Yu, S.; Sun, L.; Xie, G.; Li, X. Continuous formation of microbubbles during partial coalescence of bubbles from a submerged capillary nozzle. AIChE J. 2020, 66, e16233. [Google Scholar] [CrossRef]
- Ahmed, A.K.A.; Sun, C.; Hua, L.; Zhang, Z.; Zhang, Y.; Zhang, W.; Marhaba, T. Generation of nanobubbles by ceramic membrane filters: The dependence of bubble size and zeta potential on surface coating, pore size and injected gas pressure. Chemosphere 2018, 203, 327–335. [Google Scholar] [CrossRef]
- Khirani, S.; Kunwapanitchakul, P.; Augier, F.; Guigui, C.; Guiraud, P.; Hébrard, G. Microbubble generation through porous membrane under aqueous or organic liquid shear flow. Ind. Eng. Chem. Res. 2012, 51, 1997–2009. [Google Scholar] [CrossRef]
- Cerrón-Calle, G.A.; Magdaleno, A.L.; Graf, J.C.; Apul, O.G.; Garcia-Segura, S. Elucidating CO2 nanobubble interfacial reactivity and impacts on water chemistry. J. Colloid Interface Sci. 2022, 607, 720–728. [Google Scholar] [CrossRef] [PubMed]
- Sobieszuk, P.; Cygański, P.; Pohorecki, R. Volumetric liquid side mass transfer coefficient in a gas-liquid microreactor. Chem. Process Eng. 2008, 29, 651–661. [Google Scholar]
- Long, J.; Ding, Y.; Wang, G. Contact Problems at Micro/Nano Scale with Surface Tension. Procedia IUTAM 2017, 21, 40–47. [Google Scholar] [CrossRef]
- Cox, F.; Khalib, K.; Conlon, N. PEG That Reaction: A Case Series of Allergy to Polyethylene Glycol. J. Clin. Pharmacol. 2021, 61, 832–835. [Google Scholar] [CrossRef] [PubMed]
Figure 1.
Membrane-impeller nanobubble generation setup.

Figure 2.
The Sauter diameter of CO2 nanobubbles generated (900 rpm) in dispersions with different concentrations of Pluronic P-123 surfactant during storage. The concentration of surfactant differs between plots: (A) 0.0 CMC of surfactant (pure water), (B) 0.2 CMC, (C) 0.5 CMC, (D) 0.8 CMC.
Figure 2.
The Sauter diameter of CO2 nanobubbles generated (900 rpm) in dispersions with different concentrations of Pluronic P-123 surfactant during storage. The concentration of surfactant differs between plots: (A) 0.0 CMC of surfactant (pure water), (B) 0.2 CMC, (C) 0.5 CMC, (D) 0.8 CMC.

Figure 3.
The Sauter diameter of CO2 nanobubbles generated in dispersions with different concentrations of Pluronic P-123 surfactant during storage for different rotation rates of the impeller: (A,D,G) directly after generation (0 days after generation), (B,E,H) 7 days after generation, (C,F,I) 14 days after generation.


Table 1.
The physicochemical properties of phases used in experiments.
| Liquid | Gas | ||||
|---|---|---|---|---|---|
| ethanol | nitrogen | 789 | 0.02239 | 0.001040 | 0.035 |
| ethanol | carbon dioxide | 789 | 0.02239 | 0.001040 | 0.177 |
| water | nitrogen | 997 | 0.07199 | 0.001002 | 0.019 |
| water | carbon dioxide | 997 | 0.07199 | 0.001002 | 1.450 |
Table 2.
Values of minimum rotation rate , Sauter diameter of nanobubbles , surface-averaged linear velocity of the impeller , Eötvös number , and the ratio of Sauter diameter and membrane pore diameter for each of the four investigated cases.
Table 2.
Values of minimum rotation rate , Sauter diameter of nanobubbles , surface-averaged linear velocity of the impeller , Eötvös number , and the ratio of Sauter diameter and membrane pore diameter for each of the four investigated cases.
| Liquid | Gas | |||||
|---|---|---|---|---|---|---|
| ethanol | nitrogen | 350 | 108 ± 54 | 0.0412 | 4.03 × 10⁻⁹ | 0.54 |
| ethanol | carbon dioxide | 450 | 250 ± 89 | 0.0530 | 21.6 × 10⁻⁹ | 1.25 |
| water | nitrogen | 400 | 118 ± 42 | 0.0471 | 1.89 × 10⁻⁹ | 0.59 |
| water | carbon dioxide | 600 | 389 ± 40 | 0.0707 | 20.5 × 10⁻⁹ | 1.95 |
Table 3.
Correlations and their statistical coefficients. is the regression coefficient, is the residual sum of squares error, is the underestimation error for a confidence level of 95%, and is the overestimation error for a confidence level of 95%.
Table 3.
Correlations and their statistical coefficients. is the regression coefficient, is the residual sum of squares error, is the underestimation error for a confidence level of 95%, and is the overestimation error for a confidence level of 95%.
| Correlation (Equation No.) | R2 | RSSE | Δ− | Δ+ | |
|---|---|---|---|---|---|
| (7) | 0.999 | 1.58 × 10⁻³ [m/s] | 5.4% | 5.3% | |
| (8) | 0.590 | 9.78 × 10⁻⁹ [-] | 127% | 28.1% | |
| (9) | 0.804 | 5.41 × 10⁻¹ [-] | 92.4% | 53.4% | |
| (10) | 0.999 | 2.27 × 10⁻¹⁰ [-] | 2.8% | 2.7% | |
| (11) | 0.999 | 2.24 × 10⁻² [-] | 3.4% | 3.3% | |
Disclaimer/Publisher’s Note: The statements, opinions and data contained in all publications are solely those of the individual author(s) and contributor(s) and not of MDPI and/or the editor(s). MDPI and/or the editor(s) disclaim responsibility for any injury to people or property resulting from any ideas, methods, instructions or products referred to in the content. |
© 2023 by the authors. Licensee MDPI, Basel, Switzerland. This article is an open access article distributed under the terms and conditions of the Creative Commons Attribution (CC BY) license (https://creativecommons.org/licenses/by/4.0/).
Share and Cite
MDPI and ACS Style
Ulatowski, K.; Cecuga, A.; Sobieszuk, P. The Pursuit of Energy Reduction in Generation of Stable Nanobubbles. Processes 2023, 11, 2739. https://doi.org/10.3390/pr11092739
AMA Style
Ulatowski K, Cecuga A, Sobieszuk P. The Pursuit of Energy Reduction in Generation of Stable Nanobubbles. Processes. 2023; 11(9):2739. https://doi.org/10.3390/pr11092739
Chicago/Turabian StyleUlatowski, Karol, Andrzej Cecuga, and Paweł Sobieszuk. 2023. "The Pursuit of Energy Reduction in Generation of Stable Nanobubbles" Processes 11, no. 9: 2739. https://doi.org/10.3390/pr11092739
Note that from the first issue of 2016, this journal uses article numbers instead of page numbers. See further details here.