
Visual Impact of Renewable Energy Infrastructure: Implications for Deployment and Public Perception


Faculty of Mining, Ecology, Process Control and Geotechnologies, Institute of Earth Sources, Technical University of Košice, Letná 9, 042 00 Košice, Slovakia
*
Author to whom correspondence should be addressed.
Processes 2023, 11(8), 2252; https://doi.org/10.3390/pr11082252
Submission received: 24 May 2023
/
Revised: 12 July 2023
/
Accepted: 21 July 2023
/
Published: 26 July 2023
(This article belongs to the Section Energy Systems)
Abstract
:This study focuses on the specific topic of assessing the negative visual impacts associated with renewable energy infrastructure that may prevent their wider deployment in energy mix. The main objective of the paper is to quantify the perception of the visual impact of renewable energy infrastructure and to estimate potential changes in the visitation of a location after the construction of power plants. The research was conducted using a questionnaire survey in which 449 respondents evaluated edited photographic materials of seven locations with a fictitious power plant. The collected data served as input for the statistical testing of eight defined hypotheses using the U-Mann–Whitney test. The results confirmed trends regarding the influence of age, educational level, and power plant proximity on the overall acceptance of renewable energy infrastructure. Landscape-forming factors affecting the acceptance rate of power plants were also defined at the local level.
1. Introduction
In recent years, the state of various components of the environment and society can be characterized by the word crisis. While we have moved on from the term global warming to climate change, the current environmental problems extend beyond climate change and its negative impacts. Therefore, a more appropriate term for the current state is environmental poly-crisis. Although the negative impacts on the environment, such as pollution [1], deforestation and biodiversity loss [2], ocean acidification [3], or ozone layer depletion [4], are significant, the most significant threat is climate change. According to the latest report from The Intergovernmental Panel on Climate Change [5], the consequences of climate change on society are alarming, and there is only a small chance of fully reversing them. The trajectories of greenhouse gas emissions and the resulting increase in global temperature indicate scenarios of future development that are rather negative [6]. One way to mitigate climate changes and global temperature rise is to reduce the use of fossil fuels, which are associated with the emission of a large volume of greenhouse gases [7]. In some areas, reducing the use of fossil fuels is limited by current technology, such as cement production, maritime and air transport, but some areas can operate with significant restrictions on the consumption of fossil fuels, such as electricity production using nuclear energy or renewable energy sources (hereafter referred to as RES), personal transport using electromobility or biofuels [8,9,10], and others. Some areas could be cut off from fossil fuels due to an increased energy efficiency (e.g., residential housing) or due to the electrification of processes in case low-emission sources are used for electricity production (e.g., steel production [11]).
The prognoses of growth in the use of RES indicate a massive increase in installed capacity in almost all types of utilized technologies. A smaller increase is expected in the use of energy from sea waves and hydropower plants, where most of the potential for a large hydropower plant has been exhausted, and the increase is expected mainly due to the use of small hydropower plants. According to the latest report from The International Energy Agency (IEA) [12], a global increase in installed RES capacity in the electricity production sector of 1800 GW is expected by 2026, representing 95% of the total increase in all energy sources. Overall, a capacity of 4800 GW of RES is expected at the end of this period. In terms of individual RES technologies, the largest increase is expected for photovoltaics, up to 1100 GW by 2026. In onshore wind energy, an annual increase of 75 GW is expected in the assessed period, and the total capacity of offshore wind farms is expected to reach 120 GW. In the case of hydropower energy, an increase of 153 GW is expected (especially due to new projects in China, India, and Turkey). Smaller increases are forecasted for the production of electricity using geothermal power plants, with 5 GW of new installations, and concentrated solar power, at only 3 GW. Overall, a global annual increase of 305 GW is possible in a neutral scenario of development, or 380 GW in an optimistic scenario. At the end of the analyzed period, i.e., in 2026, RES should cover 37% of the total generated volume of electricity. However, even in the most optimistic scenario, based on previous experiences with the implementation of RES into the energy mix, the IEA Net Zero Scenario 2050 is unattainable, and to achieve it, goals expressing the annual increase in installed capacity would have to be increased by 80%.
The presented article deals with the research on the impacts of RES infrastructure development on tourism in the conditions of the Slovak Republic. As a member of the European Union, the Slovak Republic is committed to achieving environmental goals related to reducing greenhouse gas emissions and increasing the share of RES in its energy mix, which must be based on the current Fit for 55 agenda [13]. The goals of the Slovak Republic in the field of RES are defined in the National Climate and Energy Plan [14], which is currently being extensively updated. According to outdated but currently legislatively valid indicators, RES should cover 19.2% of primary energy consumption by 2030. Even with the achievement of this goal, the construction of hundreds of new wind turbines with a total capacity of 500 MW and photovoltaic power plants with a capacity of 600 MW is expected. The new updated target should correspond to the coverage of 24 to 30% of primary energy consumption, so even greater efforts can be expected to build new power plants using RES, and the number of wind and photovoltaic parks built throughout the country will inevitably be higher.
As with any human activity, the use of RES brings not only obvious ecological and economic benefits, but also a range of negative impacts on the environment and society. This topic is currently extensively addressed by a wide range of scientific teams, which not only identify new impacts of RES power plants, but also refine the quantification of the already identified negative impacts. Based on the results of studies published by Sebestén [15], Sayed et al. [16], Rahman et al. [17], Holma et al. [18], Nazir et al. [19], Wassie and Adaramola [20], Atilgan and Azapagic [21] or McCombie and Jefferson [22], and many others, it is possible to summarize the impacts of individual types of RES. A taxonomic and quantified listing of all identified impacts would exceed the scope of this paper, so the most significant impacts are mentioned. These are divided into two groups, where, in the first group, the objective environmental impacts are listed, and in the second group, we discuss subjective, i.e., visual, impacts.
In the case of wind energy, the most significant environmental impacts include the effects on avifauna, aerodynamic and mechanical noise, and land use with the construction and establishment of surrounding infrastructure. In the case of hydropower, the emphasis can be placed primarily on the creation of a physical barrier in rivers, which affects the hydro-fauna as well as the movement of sediments in the longitudinal profile, resulting in an increased erosive activity, changes in evaporation regimes around the reservoir, or increased noise. The use of geothermal energy can be associated with negative impacts in the form of noise, possible effects on groundwater regimes, or their contamination, an increased risk of seismic manifestations, and geological faults on the surface. The use of solar energy, especially in the form of photovoltaic installations, may bring impacts in the form of the reduction in agriculturally valuable land, an increased thermal load in the surrounding area and changes in the microclimate and albedo, the fragmentation of the area, and associated threats to biodiversity. The use of biomass causes impacts to a greater or lesser extent in the form of increasing nitrogen oxide emissions, increasing fertilizer use and pressure on water supplies due to necessary irrigation, and endangering biodiversity after planting monocultures of fast-growing plants. However, the most significant impact can be attributed to overall deforestation, which increases erosive activity, reduces water retention in the soil, and endangers the natural habitat of organisms throughout the vertical structure.
When studying the literature that deals with the overall impact of RES on the environment and society, visual impacts or changes in landscape aesthetics are prominent considerations in almost all types of assessed usage possibilities. The significant visual impact is mainly caused by the considerable dimensions of RES power plants, as the energy they harness has a predominantly low energy density [23]. The dimensional aspect of visual impact is problematic, especially in the use of wind energy through large wind turbines and in the use of solar energy through large photovoltaic parks occupying tens of hectares of land. To a lesser extent, it is problematic in the use of large hydroelectric power plants, which are more widely accepted due to historical experience and their semi-natural character. The negative perception of the visual aspects of RES power plants by the public significantly complicates their wider implementation and, in some respects, represents a problematic element in achieving climate goals. The affected public may enter a permitting process (i.e., EIA), which can ultimately result in a negative final assessment of the project, or the public’s rejecting attitude may lead to a reduction in investor interest in RES power plant projects in specific areas.
2. Literature Review
The following analysis of relevant literary sources points to a wide range of approaches, methods, and statistical research used in assessing the visual impacts of RES infrastructure.
Alphan [24] in his work addressed the visual impact assessment of RES infrastructure, focusing on wind turbines. Besides describing the basic elements of visual impact, the author proposed a potential visibility model for analyzing the visibility of wind turbines from different observers’ viewpoints in various landscape scenarios. The results demonstrated that the potential visual impact of wind turbines varies significantly, and the author also identified areas with low visual impact. Ferrario and Castiglioni [25] emphasized the crucial role of visibility or invisibility in the socio-spatial acceptability of new scenarios dominated by energy infrastructure. The authors focused on the use of hydropower, its visual impact on the environment, and the social acceptance of hydroelectric power plants. Ioannidis and Koutsoyiannis [26] introduced a typology of landscape impacts for solar, wind, and hydropower plants, using three metrics: land use, visibility, and public perception, which were used to rank the sources according to their impact on the landscape. Hydroelectric power plants had the least impact, and wind farms had the greatest impact. In another work, Ioannidis et al. [27] examined how to improve and accelerate the process of mitigating the impacts on the landscape through the redevelopment of an RES project visibility analysis. The authors theoretically and practically investigated the calculation of reverse visibility zones (R-ZTV) in the Greek region of Thessaly for significant landscape elements to project the visual impacts of planned wind energy projects on them. Spielhofer et al. [28] demonstrated an approach that combines assessed landscape visual quality with measured visual properties. The authors created visual stimuli with systematically controlled scenarios of the visual impact of an RES power plant in various landscape types. Möller [29] presents a deterministic approach to determine the probable visual impact on the landscape and population, considering that there is no clear threshold for the perceived adverse visual impact. The author also used a geographic information system to create a regional landscape model for the North Jutland district.
The evaluation of the visual impact of an RES power plant is mainly carried out in the case of wind and photovoltaic power plants, with authors focusing comprehensively on the whole public sector [30,31,32,33,34,35] or only on parts of the public characterized by geographical location or a distinctive feature. Given the nature of the presented contribution, a further analysis of publication sources will focus on the field of tourism. Negative visual impacts of wind turbine installations near tourist sites have been studied in scientific papers in recent years. Machado and Andrés [36] conducted a systematic survey of the available literature on the topic, highlighting the considerable lack of research on this topic in scientific publications. Based on available sources from 2015 to 2019, they concluded that negative impacts of wind parks appear mainly because of a lack of communication between local parties involved in tourism and investors or designers of the wind parks, proving that these negative impacts can be suppressed or mitigated. Tverijonaite et al. [37] evaluated a specific area, focusing on tourist-attractive areas in Iceland. The authors assessed the perception of tourism service providers toward new and existing RES power plants. Results obtained through semi-structured interviews and work with mapping software allowed them to define the affected areas where RES infrastructure could have a negative impact on tourism. The authors emphasized the importance of including all stakeholders in the initial phases of power plant design as well as the fact that older RES power plants are perceived as less problematic than proposed ones, which may reveal the psychological factor of rejecting new ideas.
Smythe et al. [38] assessed the impact of the first offshore wind farm in the United States. The authors focused on tourism service providers, whom they divided into segmented survey groups and interviewed. Most participants described the visual impact as neutral or rather positive, emphasizing the fact that the wind farm also serves as a tourist attraction, which, according to the focus group’s opinions, may change in the future. As in previous scientific publications, the authors drew attention to the importance of involving the tourism service provider segment in the initial phase of wind farm design. Carr-Harris and Lang [39] also studied the same wind farm, in this case assessing the visitation and occupancy rates of accommodations in tourist centers affected by the visual impact of the wind farm. The authors’ results indicate an increase in occupancy, particularly in the summer months of July and August, without a change in occupancy outside of this period. The authors attribute this phenomenon to possible interest from the tourism public in the wind farm, which serves as a tourist attraction.
Ólafsdóttir and Sæþórsdóttir [40] evaluated the perception of a pilot wind farm project in Iceland among residents and providers of tourism services. The results of a questionnaire survey indicate a complex and sensitive relationship between residents and the unique untouched wilderness where the planned wind farm should be located, which conflicts with the existence of hydropower plants in the wider vicinity of the area under consideration. Based on this observation, the authors argue that the social acceptance of wind farms is more complicated than for more traditional forms of RES power plants.
The scientific teams use established data collection procedures and methods of statistical analysis when assessing the impact of RES power plants on various socioeconomic groups of the population. Mroczek and Kurpas [41] used a street survey method with 1169 respondents, including 680 (58.2%) from urban and 489 (41.8%) from rural areas; 354 (17.2%) respondents lived at a distance of more than 3 km from wind farms. Participants were asked about their understanding of sustainable development, their viewpoints on wind energy and other RES, as well as sociodemographic data essential for characterizing the analyzed population. Participants answered most of the key questions using a five-point Likert scale. The results of the study were based on statistical processing using the t-Student test, non-parametric U-Mann–Whitney test, and Kruskal–Wallis test, which evaluated data from multiple segments of the group of respondents. Coleby et al. [42] conducted a study of public opinion related to the construction of wind farms using a five-point Likert scale survey, and the results of non-parametric Kruskal–Wallis and U-Mann–Whitney tests allowed the assessment of the rejection or non-rejection of defined research questions or hypotheses. A similar methodology was used by Hamza et al. [43], who assessed hypotheses related to the installation of wind turbines on respondents’ own land as well as opinions on the installation of turbines in residential areas. The results were processed by statistical analysis using the U-Mann–Whitney test for comparing two groups and the Kruskal–Wallis test for comparing multiple segments of respondents. Ferreira et al. [44] assessed the relationship of local communities with wind farms using a survey with 436 responses, and research questions were statistically processed based on the U-Mann–Whitney test. The extensive study by Cronin et al. [45] deals with the public and their perception of wind farm development in coastal areas of Ireland. Several basic hypotheses were defined within the study, and their evaluation among different groups was conducted based on the results of the U-Mann–Whitney test.
3. Methodology
The presented paper fits into the current necessary segment of scientific studies describing the complicated relationship between the public and the expansion of RES infrastructure, as shown by the literary overview above. The study is focused on describing the attitudes of the tourists toward the possible expansion of wind and solar power plants in areas that exhibit a higher landscape value or are subjected to an increased tourism visit. A detailed description of this attitude is based on research questions and later hypotheses suitable for statistical data analysis.
Each research question, respectively, examined, through the hypotheses, the forming factors influencing the perception of the visual impact of the RES infrastructure. The purpose of the research questions was also to characterize the public groups in relation to the attitude toward RES infrastructure as well as to quantify the influence of the power plant surroundings on the overall perception of the visual impact. The present research was concerned with the influence of the ages of the respondents, their information source about RES, affiliation to a tourist organization, or personal previous experience with the location. The influence of the presence of a historical or significant landscape feature on the acceptance of the RES infrastructure was also quantified. Začiatok formulára.
Hypothesis 1
was formulated based on the expectation that respondents aged over 55 naturally have a negative predisposition toward perceiving new concepts, including RES, which could reflect in their evaluation of locations with built RES infrastructure. In many sociological studies, the age of 55 is considered the dividing line, the so-called older generation from younger ones. This age was chosen so that the presented results could be compared with other studies. The null hypothesis (H0) was formulated as follows: there is no difference in the evaluation of locations between the category of respondents aged over 55 and those aged 55 and below. This corresponds to the alternative hypothesis, which states that there is a difference in evaluation.
Hypothesis 2
was formulated based on the expectation that respondents who are organized in tourist organizations (such as hiking clubs) have a stronger connection to nature and are more sensitive to its changes, which could reflect in their evaluation of the perceived locations where RES infrastructure was implemented. The null hypothesis (H0) was formulated as follows: there is no difference in the evaluation of locations between the category of respondents who are organized in a tourist organization and those who are not organized in a tourist organization. This corresponds to the alternative hypothesis, which states that there is a difference in evaluation.
Hypothesis 3
was formulated based on the expectation that respondents who have previously visited the evaluated location would be more sensitive to changes in the landscape caused by the installation of RES infrastructure, which could reflect in their evaluation of the perceived locations. The null hypothesis (H0) was formulated as follows: there is no difference in the evaluation of locations between the category of respondents who have previously visited the location and those who have not visited the location. This corresponds to the alternative hypothesis, which states that there is a difference in evaluation.
Hypothesis 4
was formulated based on the expectation that respondents who have information about RES from an educational environment would better reflect their positive contributions compared to respondents who have information about RES obtained from mass media or other sources. The null hypothesis (H0) stated that there is no difference in the evaluation of locations between respondents who have information about RES from school and those who have information from other sources. This corresponds to the alternative hypothesis, which states that there is a difference in evaluation.
Hypothesis 5
was formulated based on the expectation that respondents would evaluate locations with RES infrastructure located near a historical element more negatively compared to locations without a historical element. The null hypothesis (H0) stated that there is no difference in the evaluation of locations with a historical element in the landscape and locations without a historical element. This corresponds to the alternative hypothesis, which states that there is a difference in evaluation.
Hypothesis 6
was formulated based on the expectation that locations where fictitious RES power plants are situated in a landscape with other infrastructure (settlements, industrial complexes, agricultural production) would be evaluated more positively than locations where the fictitious RES power plants are situated in a landscape without other visually prominent infrastructure. The null hypothesis (H0) stated that there is no difference in the evaluation of locations with other built infrastructure and locations without other built infrastructure. This corresponds to the alternative hypothesis, which states that there is a difference in evaluation.
Hypothesis 7
was formulated based on the expectation that respondents would rate locations where RES power plants significantly impact the view of the High Tatras mountain range more negatively than locations where RES power plants do not affect the view of the High Tatras. The High Tatras are perceived as a highly valuable environmental area with high landscape value in the context of Slovakia. The null hypothesis (H0) stated that there is no difference in the ratings of locations where RES power plants affect the view of the High Tatras compared to locations where RES power plants do not affect the view. The alternative hypothesis (H1) stated that there is a difference in the ratings of these locations.
The study deals with the perception of the visual impact of RES infrastructure by tourists (more precisely hikers). The focus of the research on this segment of the public is based on the specifics of the Slovak Republic, which is generally perceived as a tourist attractive country, with a unique density of marked hiking trails with a total length of 15,500 km, with the largest number of kilometers located in the mountains within the central part of the country. The high density and good marking of the network of hiking trails are closely related to the large number of hiking clubs, which are represented by the Slovak Hiking Club, with approximately 22,000 members in more than 300 hiking clubs. However, the number of the population that occasionally engages in hiking is even higher. The community is therefore numerous, and the network of trails allows for movement in various parts of Slovakia, which in the future may be interesting from the perspective of building new RES.
The choice of the tourists (hikers) as survey respondents is based on two main factors. The first factor is the high degree of organization in hiking clubs, which may bring a risk factor in organizing protest or interventions within the EIA process. The second factor arises from the assumption of the need to consider the economic losses of operators of tourist facilities in the event of a decrease in tourist interest in locations with newly built RES. On the other hand, it cannot be overlooked that the organization in clubs can contribute to mass visits to possible future wind or PV power plants to increase their acceptance through on-the-ground education, which could have a positive effect beyond the tourist community.
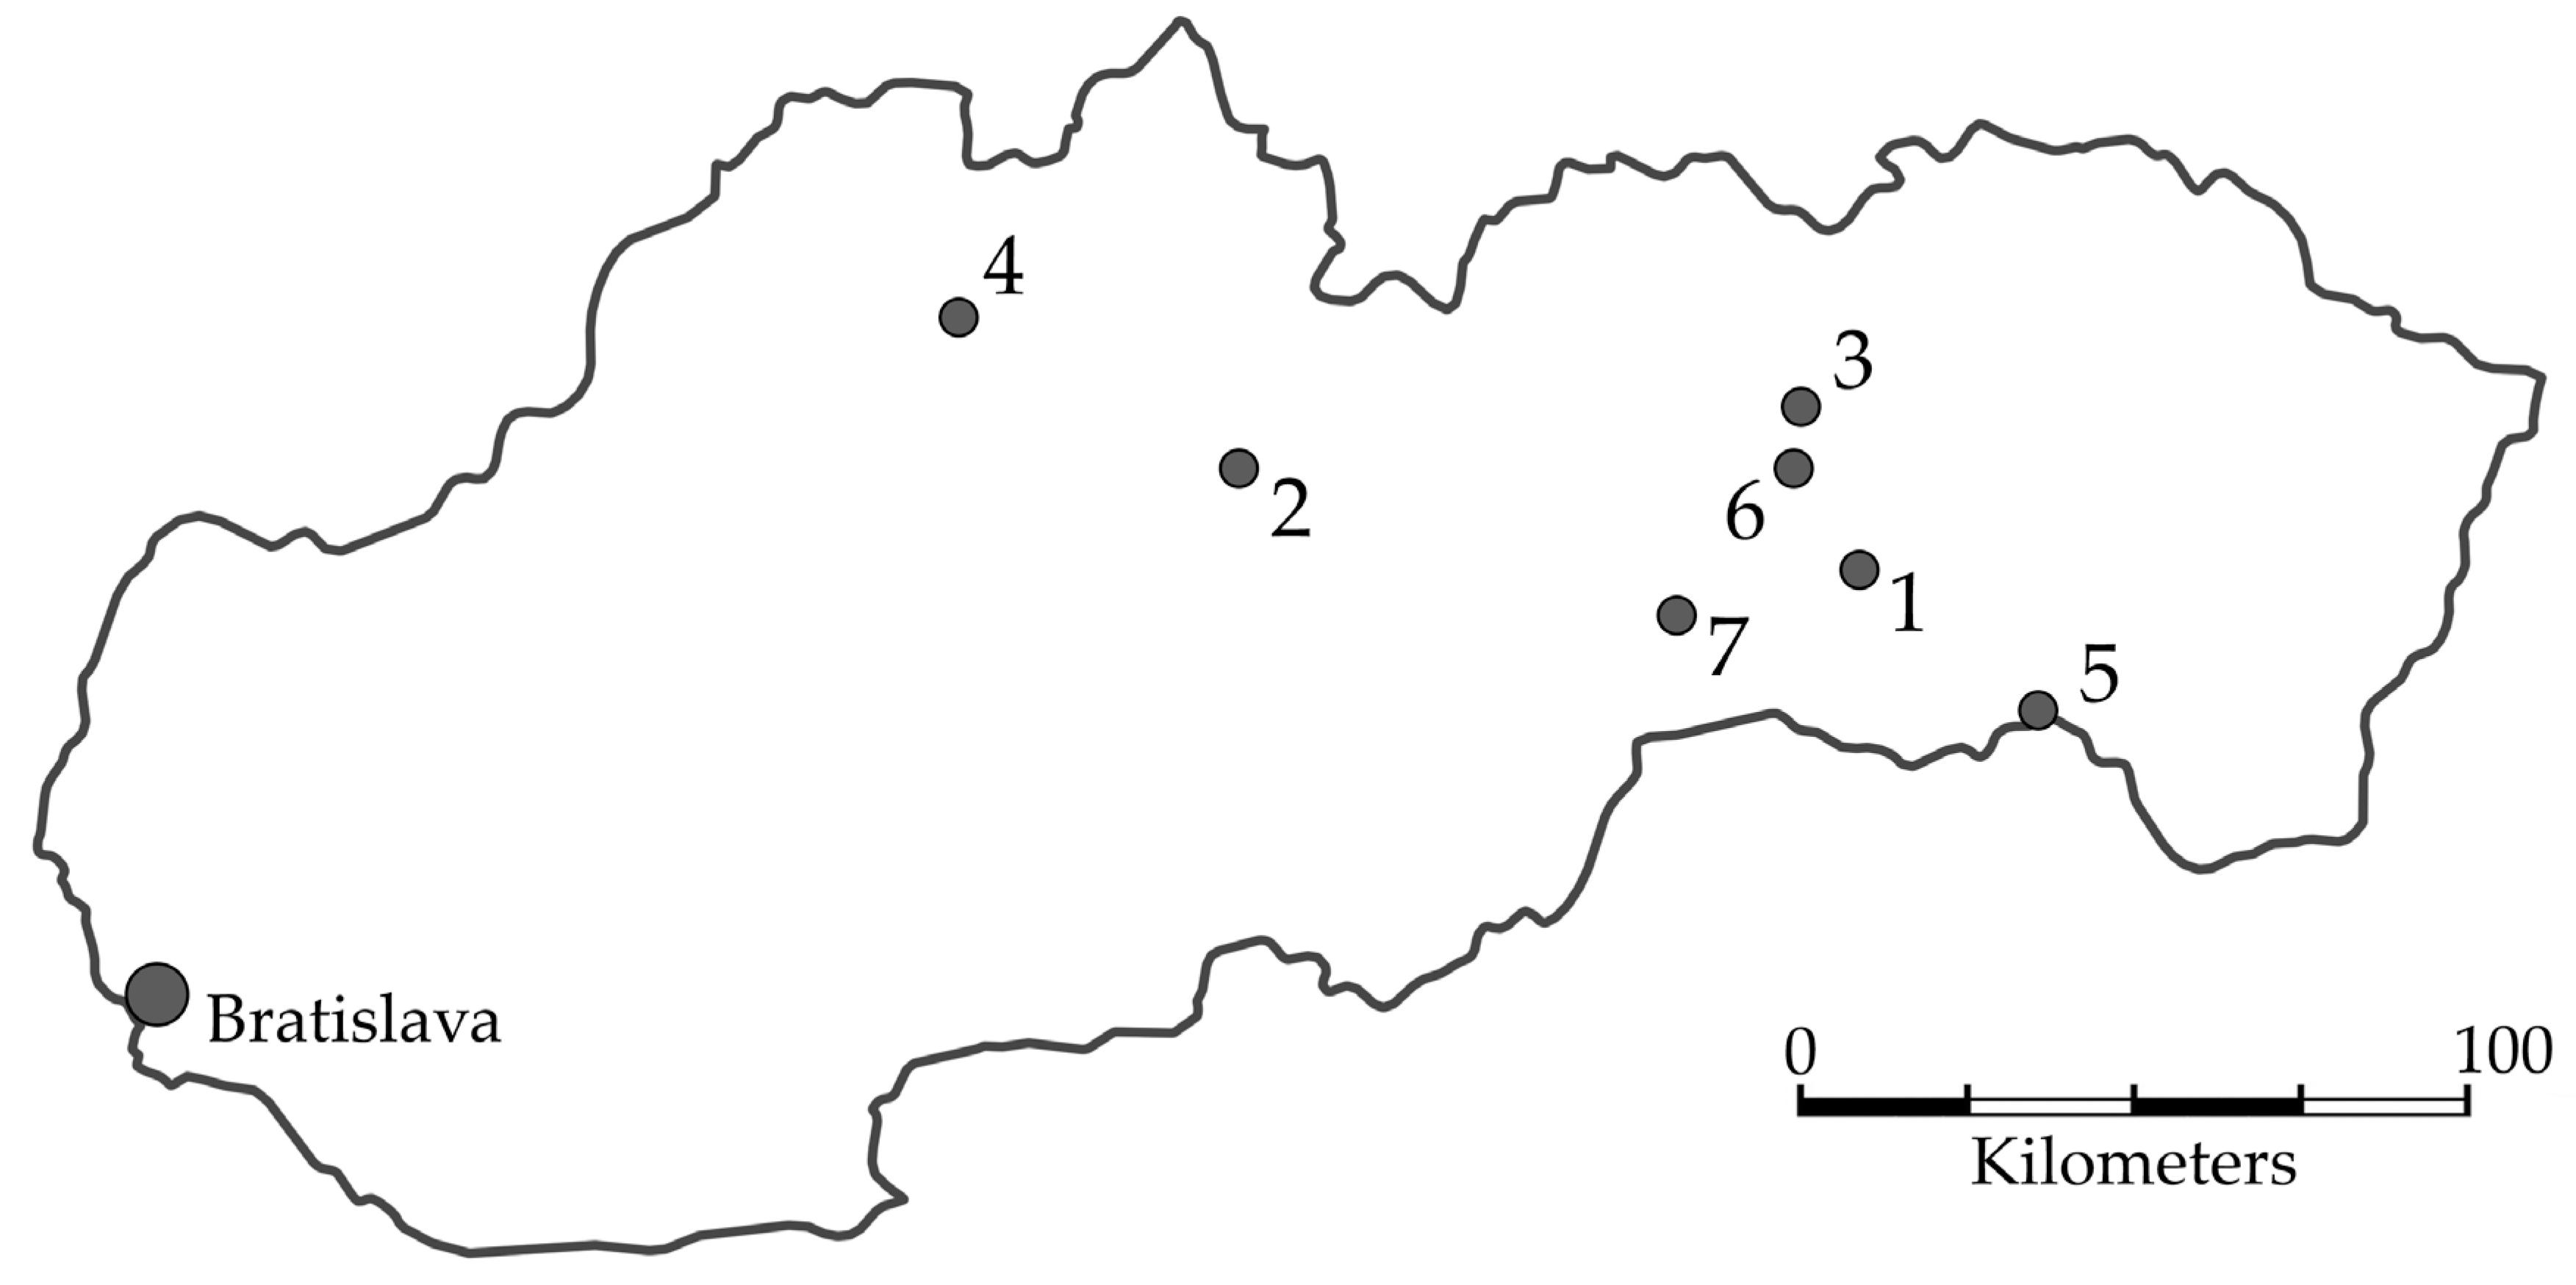
The visual impact of RES infrastructure was assessed in seven locations located in the eastern and northern parts of Slovakia. Specifically, these locations are Folkmarská skala (no. 1), Ďumbier (no. 2), Smrekovica (no. 3), Suchý (no. 4), Skároš (no. 5), Sľubica (no. 6), and Skalisko (no. 7). The geographical locations are shown on the map in Figure 1. Spodná časť formulára.
The selection was based on an assessment of the tourist attractiveness of the location as well as the suitability of the location for a particular type of RES power plant, without considering the currently applicable legislative restrictions. This rather bold argument stems from the belief that the increasing pressure for a larger share of RES in the energy mix of Slovakia will gradually lead to the relaxation of restrictions on their construction, as indicated by discussions on legislative changes at the level of the European Commission and Slovak Republic.
The selection of locations represents a wide range of landscape elements. This range was chosen to represent basic attractive elements, which, in this case, was represented by the mountain range of the High Tatras—a cultural monument—as well as less significant elements such as a village, a hydro reservoir, a densely populated suburban landscape, etc. Graphic inputs were chosen so that the fictional RES power plants could be dominant in one case, but less pronounced in others, to capture different cases of mutual interaction. For each location, a selected type of RES power plant was pre-planned.
All photographic materials were created with a camera equipped with a lens with a focal length range of 8.8–36.8 mm and a 20 MPx CMOS sensor with a size of 13.2 mm × 8.8 mm. When calculating the focal length of the lens using the 35 mm equivalent of sensor size (the so-called film size sensor, which is commonly used in describing and comparing photographic techniques), the camera has a lens with a focal length of 24–100 mm. It was very important to prevent various distorting influences that could affect the final evaluation when creating the used graphic materials. The correct use of the focal length of the final photograph has the most significant impact. The use of a focal length of 50 to 75 mm (for the 35 mm equivalent) is closest to human perception [46], providing the closest viewing angle to the human eye, respectively; it is close to the parameters of peripheral vision of the average person. Due to the absence of a 35 mm film sensor format in the used camera, the 50 mm (for the 35 mm equivalent) focal length was converted to a value of 18.14 mm, which, in combination with a 13.2 × 8.8 mm sensor, represents identical optical properties of the resulting image.
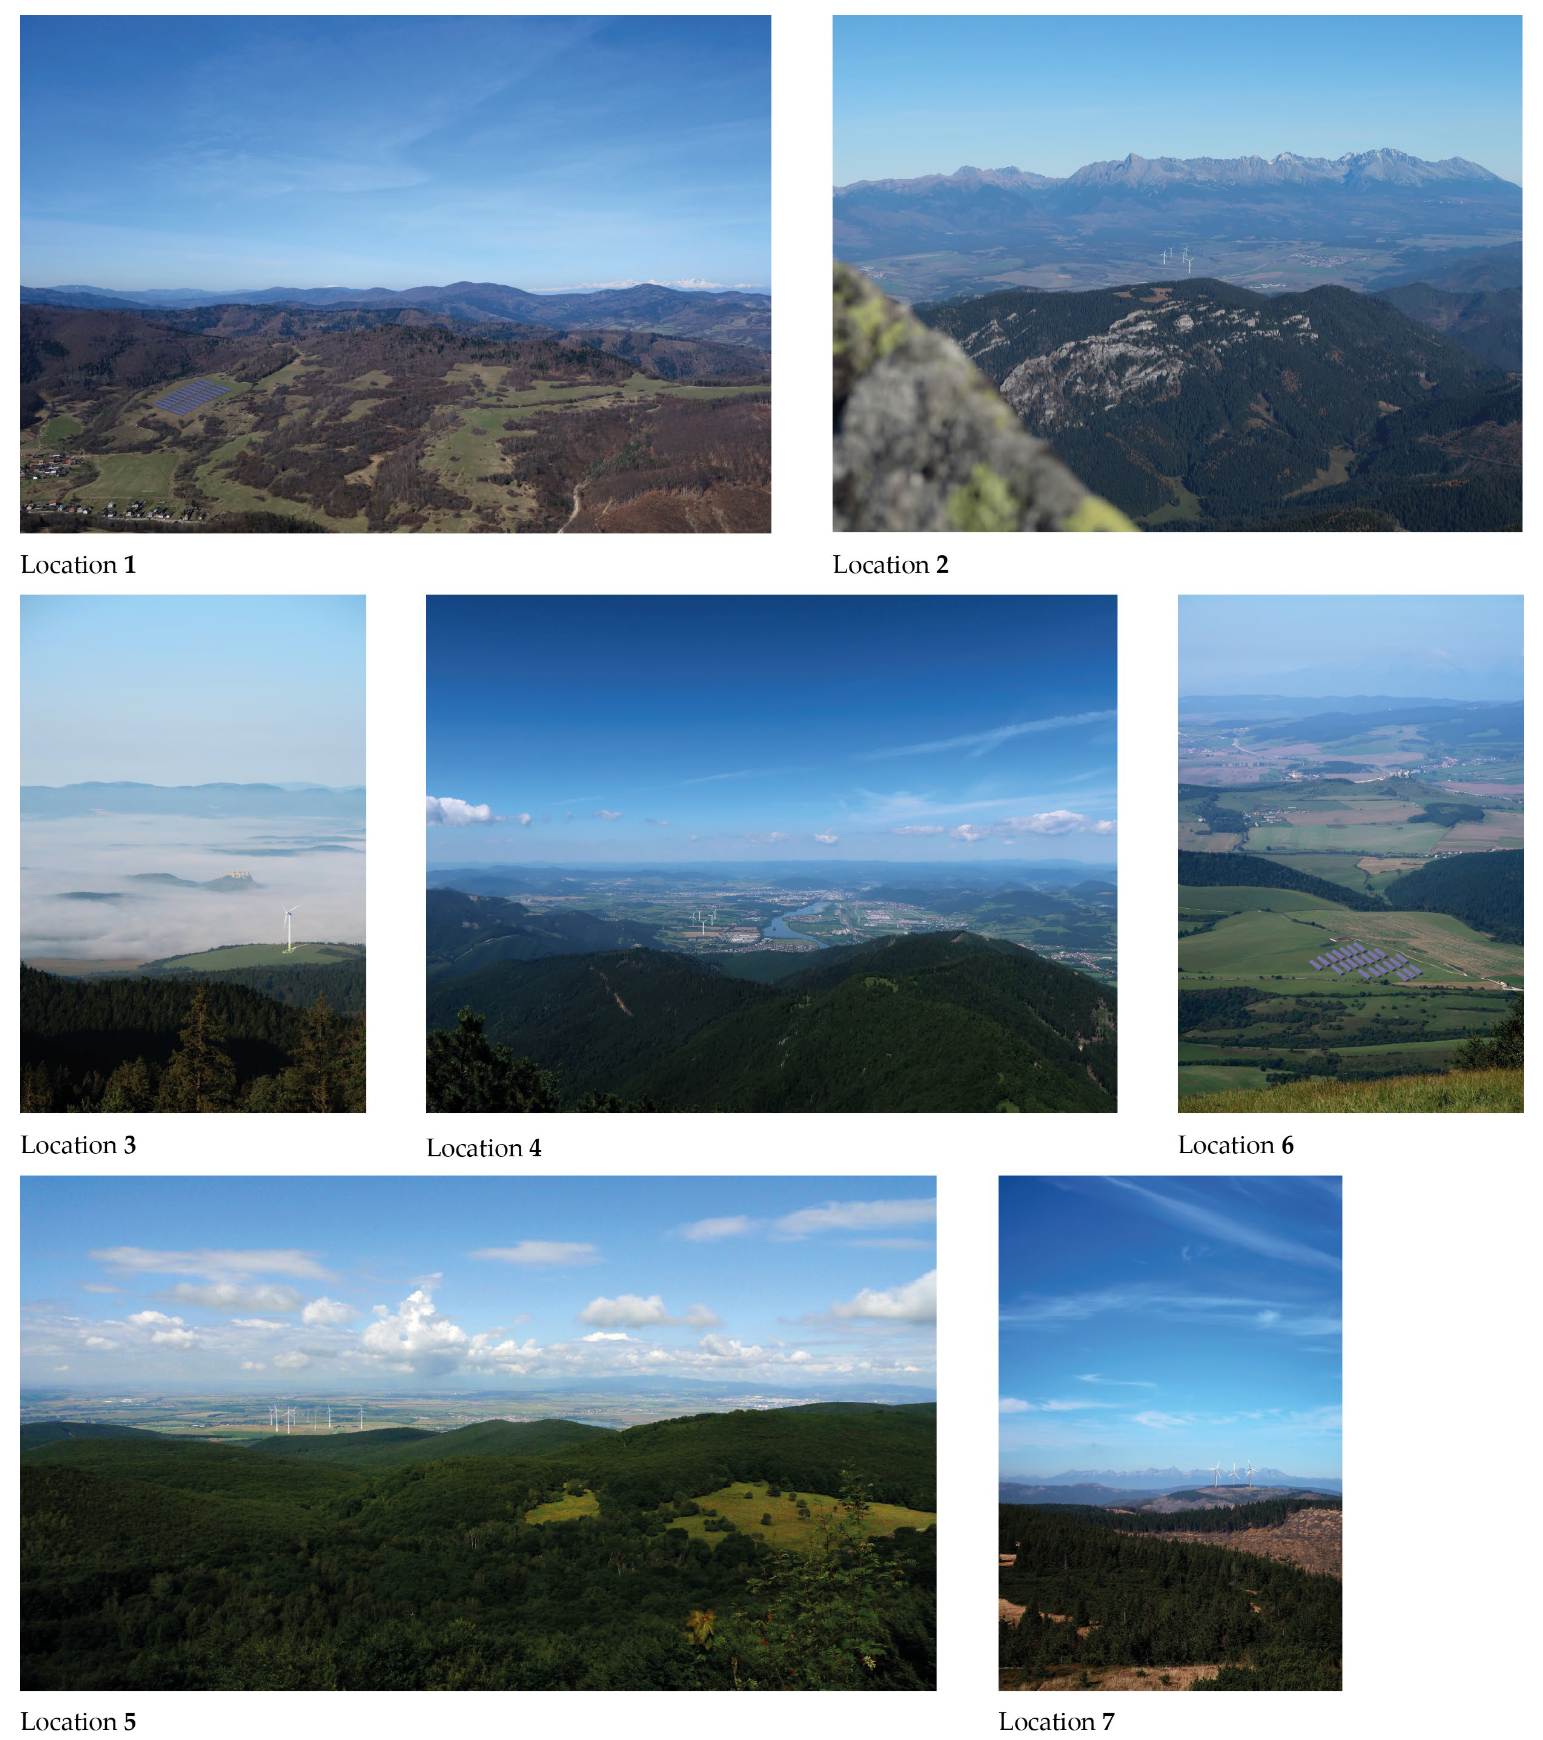
Selected types of RES power plants were added to the photography materials using graphic editing software. Two types of power plants were chosen for evaluating their visual impact—photovoltaic power plants and wind turbines (or wind farms). For simulating a photovoltaic park, photographs of polycrystalline photovoltaic panels with a power output of 550 Wp and dimensions of 2 × 1.3 m were selected and subsequently arranged into the desired shape and size of the power plant. For simulating views with wind turbines, photographs of Enercon and Gamesa wind turbines with a power output of 5 MW, tower height of 120 m, and rotor diameter of 128 m were used.
A key part of the preparation of the edited images was to determine the size of the fictional wind or photovoltaic power plant. For a correct determination, it was necessary to know the distance of the location of the fictional power plant from the observer (i.e., the place from which the photographs were taken). This information was obtained from a commonly available interactive map that allows the measurement of distances between two points with different elevations.
The next steps aimed to determine the exact dimensions, i.e., the height of the wind turbine and the width (and length) of the photovoltaic power plant. In this process, a photograph of an object with a known height was first taken from a precisely determined distance, with a precisely determined focal length. The size of the known object in pixels was subsequently determined through image analysis in the ImageJ 1.0 software. Based on this, it was possible to calculate the relationship between the real size of the object, the distance from the observer, and the size of the fictional object in pixels. A photovoltaic park with dimensions of 70 × 200 m was added to location 1; a wind park with five wind turbines was added to location 2; a solitary wind turbine was added to location 3; a wind park with five wind turbines was added to location 4; a wind park with eight wind turbines was added to location 5; a photovoltaic park with dimensions of 300 × 300 m was added to location 6; and a wind park with three wind turbines was added to location 7. The resulting graphical materials with fictional RES power plants are shown in Figure 2.
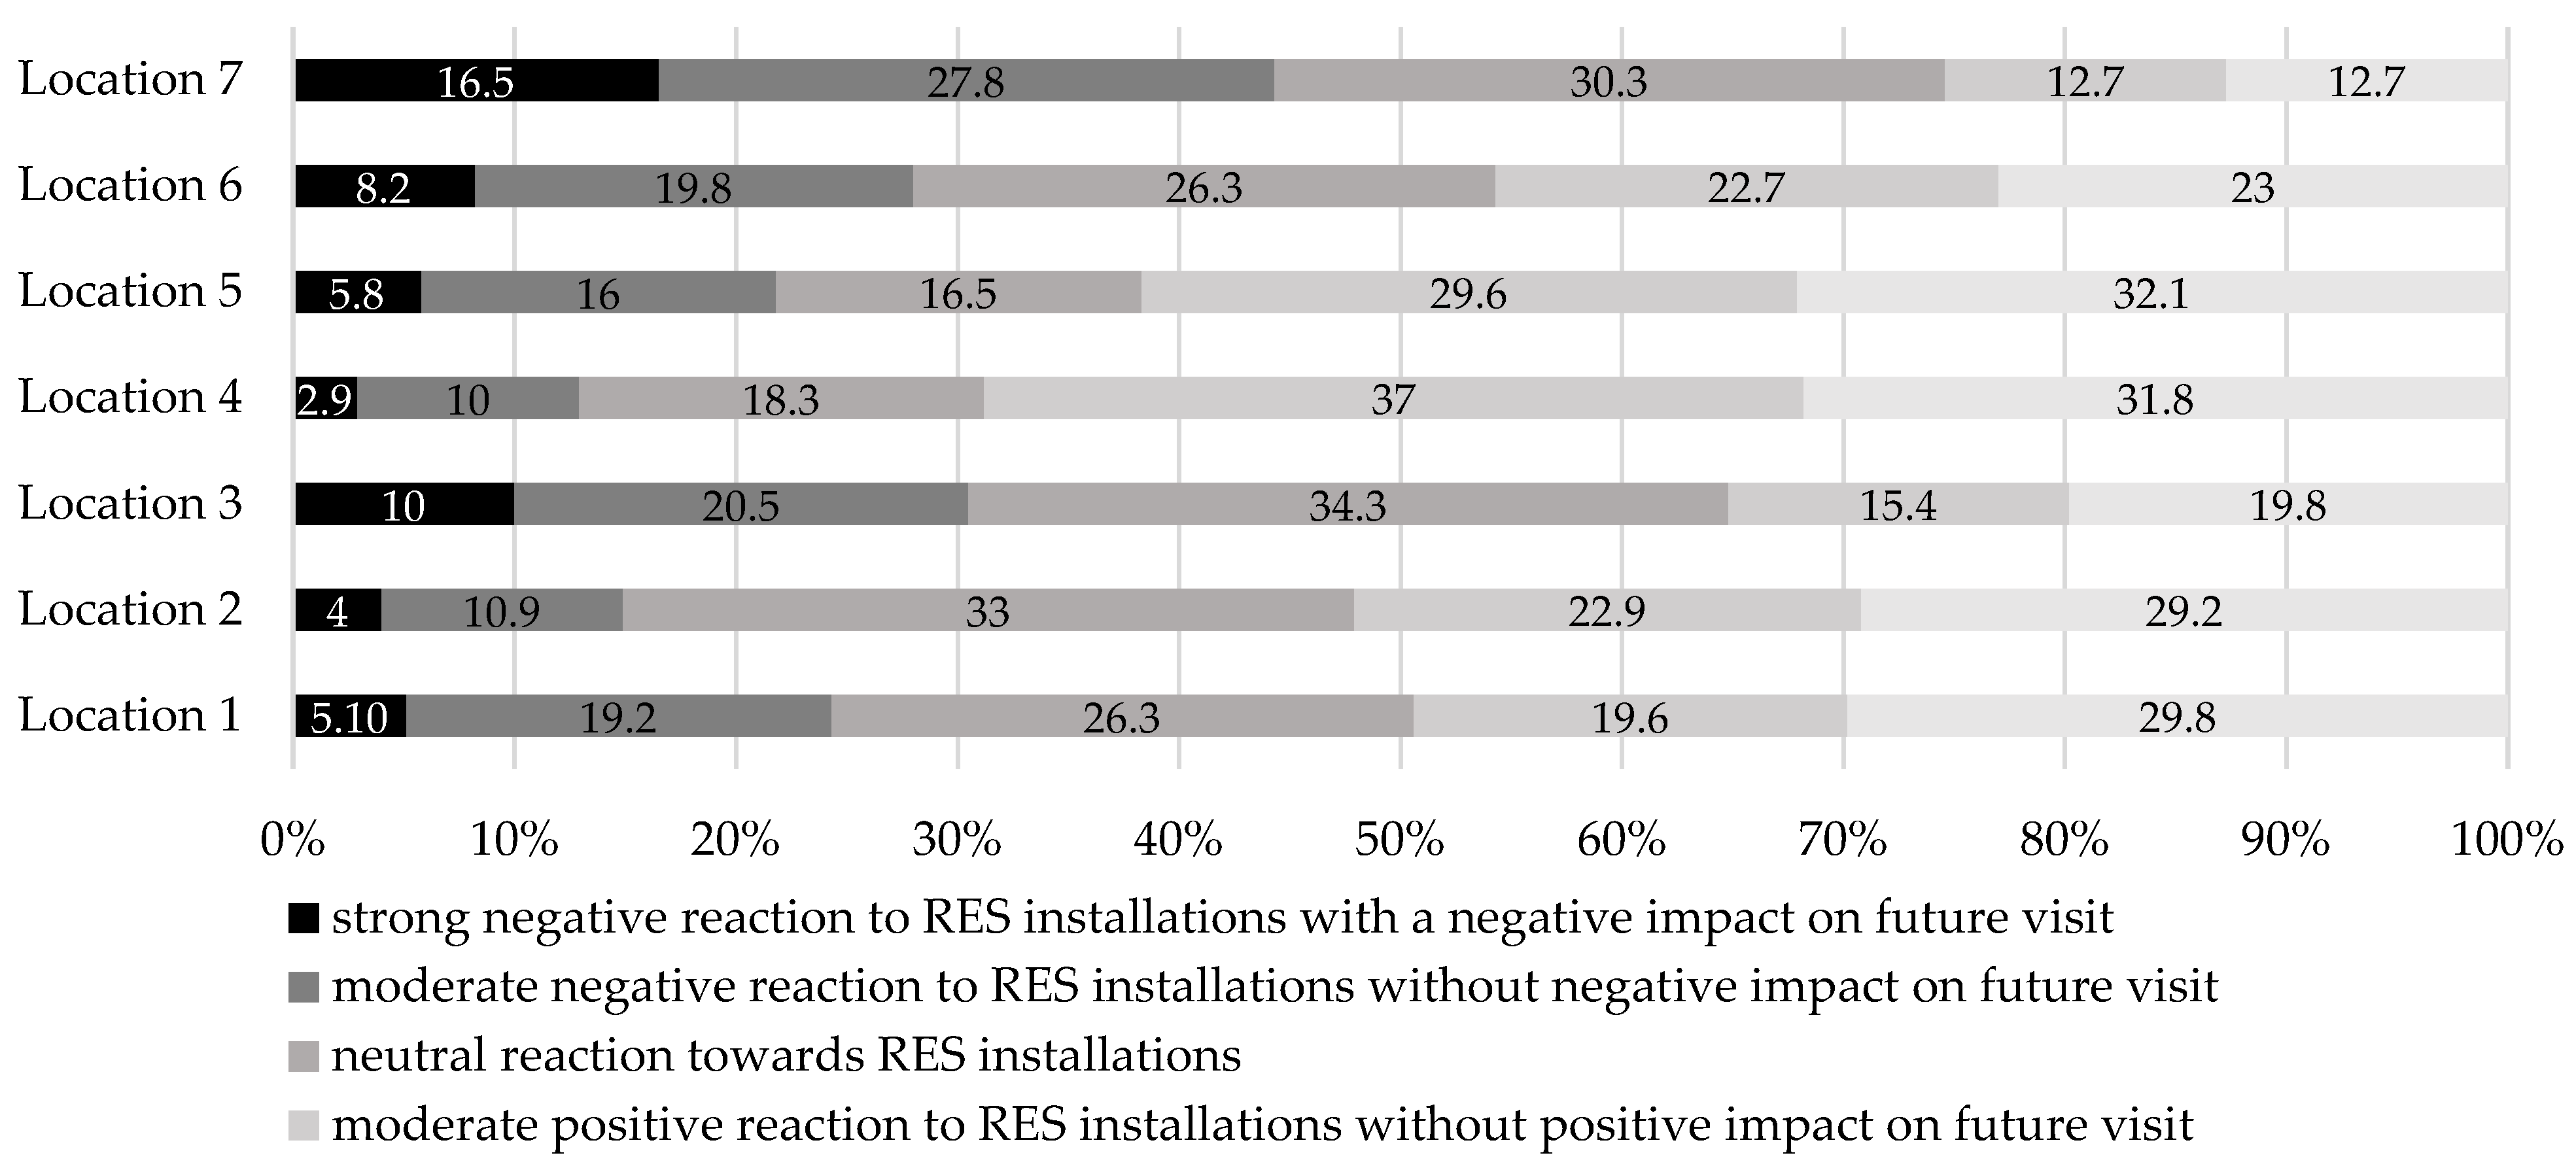
The presented visual materials formed a key part of the questionnaire, which aimed to answer a series of questions regarding the perception of RES infrastructure within the hiking community. The structure of the questionnaire was designed into three parts. The first part characterized the group of respondents in terms of basic characteristics such as gender, age, education, location, relationship to tourism, environment, ecology, and energy in general. The second part was focused on evaluating the visual materials and assessing the visual impact of fictional RES power plants on the perception of the location, where the respondent rated the presented examples using the following five-point Likert scale: (1) a strong negative reaction to RES installations with a negative impact on future visit; (2) a moderate negative reaction to RES installations without a negative impact on future visit; (3) a neutral reaction toward RES installations; (4) a moderate positive reaction to RES installations without a positive impact on future visit; and (5) a strong positive reaction to RES installations with a positive impact on future visit. The third part of the questionnaire was focused on expressing the respondents’ opinions on various ways of increasing acceptance of RES through information infrastructure such as information panels, education trails, etc. The whole questionnaire included a total of 34 questions, with closed answers, or the respondent could choose several answers at once. Before the actual dissemination of the questionnaire, it was tested on a selected group of ten respondents, which included people of different genders, ages, educational levels, and occupational backgrounds. The questionnaire was also tested on different devices (smartphone, tablet, laptop, desktop) as well as different browsers. After positive references on the clarity of the questions, answers, and the visual design of the edited photographs, the questionnaire was distributed to the chosen segment of the public.
Respondents were approached through social networks as well as direct email communication through the Slovak Hiking Club. In total, 462 responses were obtained, and after a selection of the so-called “liners” (i.e., respondents that selected the same points on the Likert scale for each question), 449 responses were used as a data source for the statistical verification of the defined hypotheses. In the field of statistical analysis, data from the Likert scale can be considered interval or ordinal, as the intervals may not have the same value for each respondent (i.e., the difference between “strong negative” and “moderate negative” may not be subjectively the same as the difference between “moderate negative” and “neutral”). Each of these approaches has its advantages and disadvantages, and there is a lively debate in the professional community about the overall suitability of each approach [47]. The choice of the approach to the data in terms of their interval or ordinal definition adjusts the usability and suitability of selected statistical methods in the further testing of statistical hypotheses.
The acceptance or rejection of the defined null hypotheses was based on the results of the U-Mann–Whitney test at a significance level of α = 0.05. This test is a nonparametric counterpart to the t-Student test for statistical data samples of independent character. The dataset should contain an independent variable with at least two distinct codes that unambiguously identify the group membership of each case in the dataset. The U-Mann–Whitney test assumes that the dependent variable under study was measured on an ordinal scale. The U-Mann–Whitney test compares the sums of ranks of the considered samples and is the most sensitive nonparametric alternative to the t-Student test for independent samples, and in some cases offers a better result for rejecting the null hypothesis (both samples are from the same population) than the t-Student test. The null hypothesis of the test is that there is a 50% probability that the value of a randomly selected member of the first sample will be greater than a member of the second sample. Another possible formulation of the null hypothesis is that these two samples come from the same population (i.e., they have the same median).
The unrestricted use of the U-Mann–Whitney test requires the fulfilment of several conditions regarding the parameters of the statistical datasets for their use. The most important condition is the homogeneity of variance in the two compared datasets. The result of this parameter further conditions the evaluation and interpretation of the results. This parameter can be analyzed visually using a histogram of the variables, or Levene’s test can be used. The null hypothesis of this test states the equality of variances, meaning that the compared datasets are homoscedastic. The alternative hypothesis states the inequality of variances, meaning that the datasets are heteroscedastic. If the data from the selections do not achieve homogeneity according to Levene’s test, the U-Mann–Whitney test can only be used in a limited form, when it is only possible to reject or not reject the tested hypothesis, but it is not possible to assign a marking of the selections based on the median value.
4. Results and Discussion
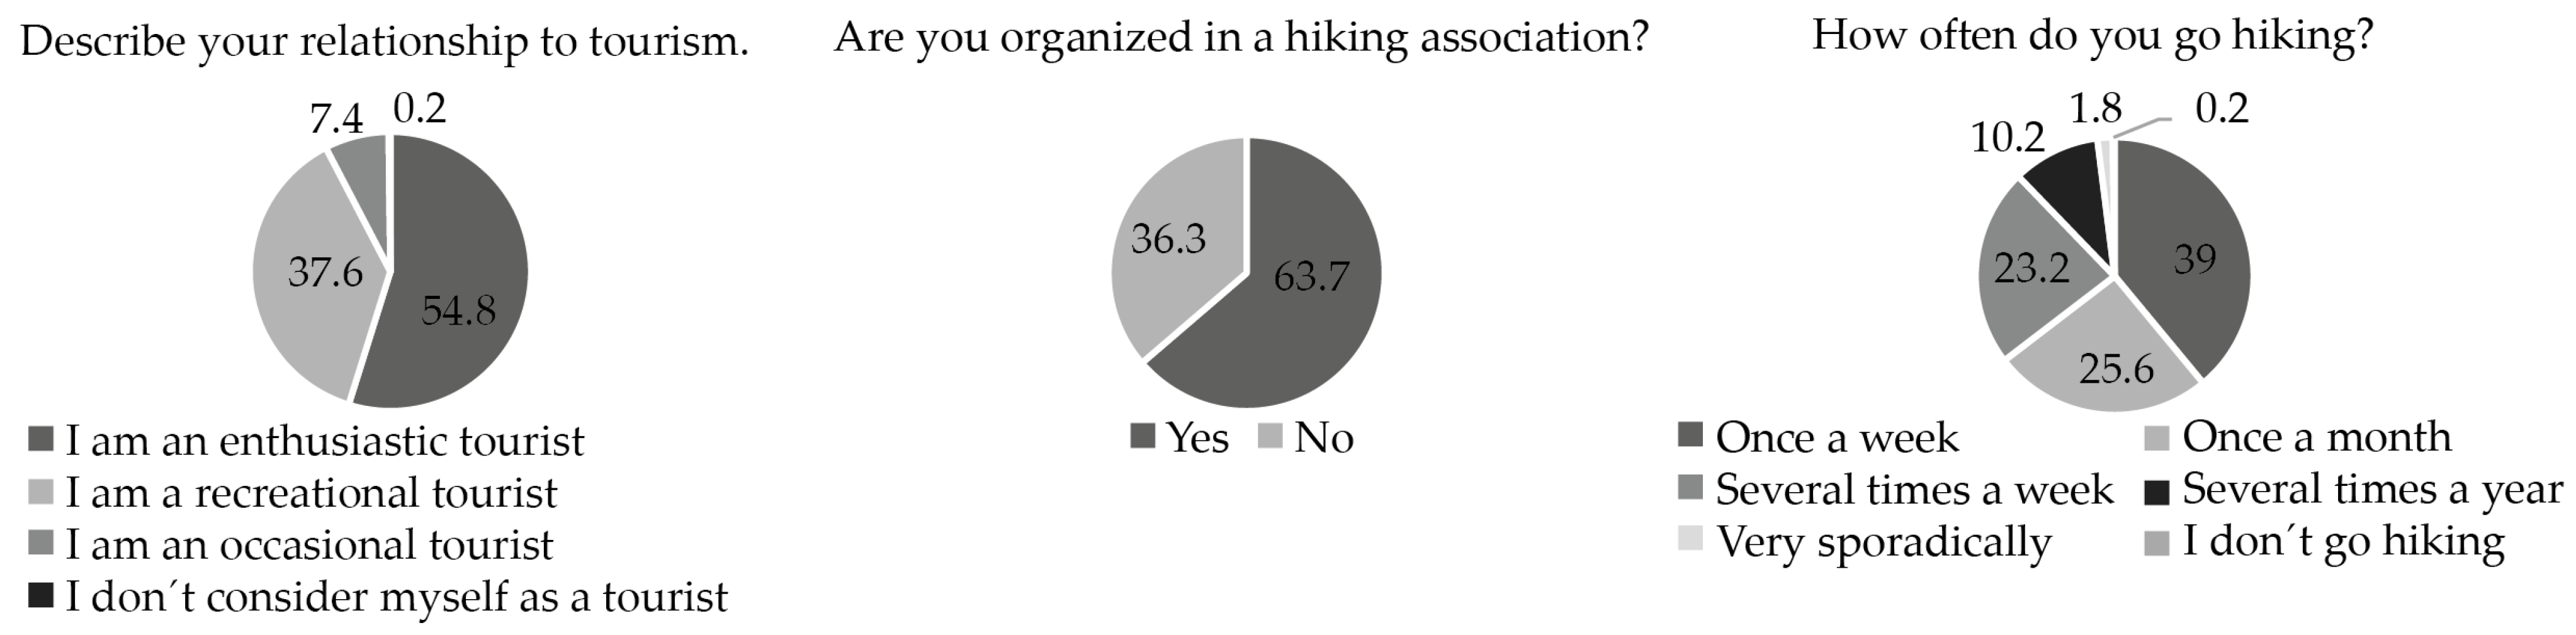
The initial data analysis was carried out during the data collection period. This approach was chosen to test the success of the questionnaire dissemination among the target groups. The success of targeting the questionnaire was assessed by responses to questions regarding the subjective relationship of respondents to hiking, membership in an organized hiking club, or the frequency of engaging in this sport activity. Ongoing checks as well as final data confirmed the correctness of the chosen approach. The presented data shows that a significant majority of the participants identified themselves as a hiking enthusiast, or recreational hikers, and 63.7% of respondents were organized in a hiking club. From the perspective of the questionnaire’s focus, it is also possible to positively perceive the responses to the question regarding the frequency of visiting nature for the purpose of hiking, with the most frequent answer being at least once a week with 39%, followed by at least once a month with 25.6%. A detailed summary of the categorization of respondents within the given set of questions is displayed in Figure 3. Based on the analysis of these data, it can be stated that the survey was attended by people who have a positive relationship to nature, which corresponds to the high frequency of its visit and are therefore relevant from the perspective of the presented research.
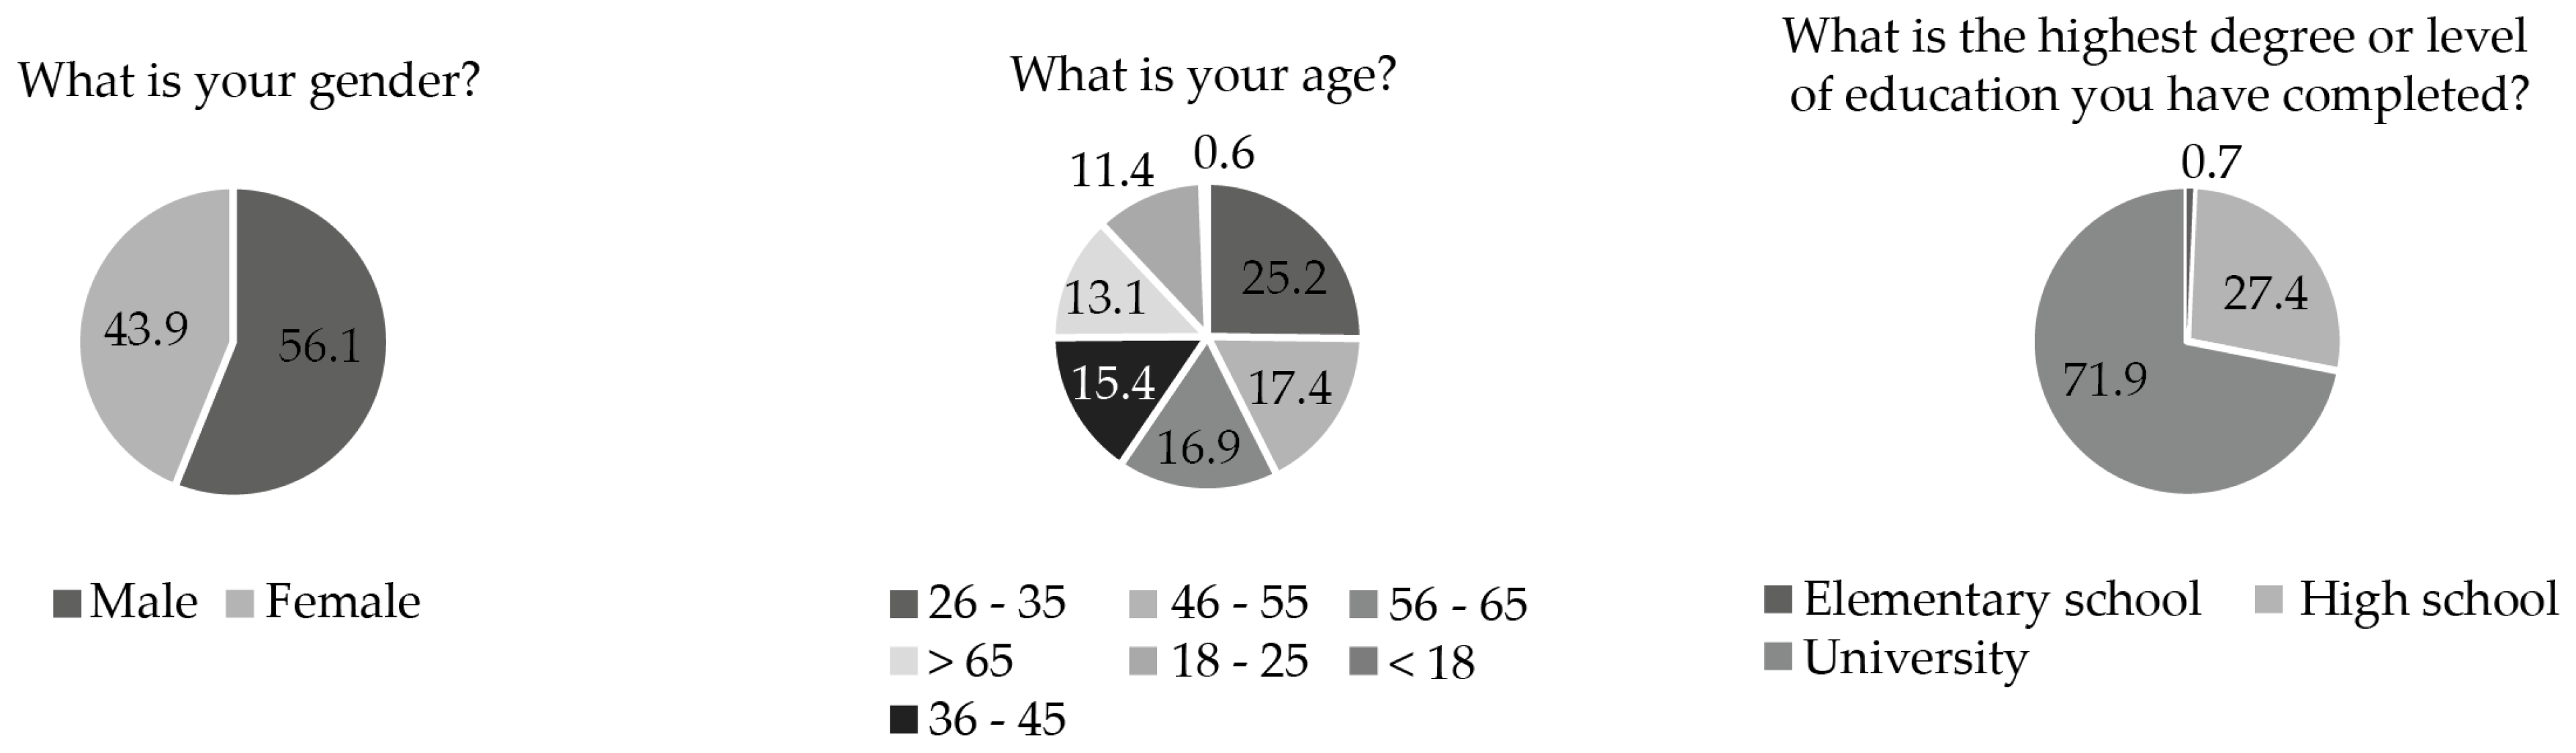
The general division of respondents according to basic characteristics such as gender, age, education, etc., enabled their subsequent selection into selected groups defined by research questions or hypotheses. A detailed summary of this division is shown in Figure 4, which shows a relatively significant representation of the older generation as well as respondents with higher education, but this corresponds to the average membership base of these organizations.
The key part of results obtained from the survey dealt with the perception of a fictional RES power plant by respondents who evaluated their visual impact and their possible influence on the future visits of such locations. This section analyzed responses to two questions assigned to each location, the first of which focused on the respondent’s relationship with the location, i.e., whether the respondent had visited it in the past, or whether or not the respondent planned to visit it in the future. The second question concerned the expression of the respondent’s attitude toward the fictional RES power plant depicted in an edited image.
The evaluation of all locations summarizes the graphical representation of the Likert scale in Figure 5, where the darkest color represents the most negative attitude, and the lightest color represents the most positive attitude. Of all the evaluated cases, location no. 7 has the lowest level of acceptance, where a fictional wind power plant with three wind turbines was added. The fictitious wind power plant significantly affects the panorama view of the High Tatras (a highly popular mountain range in terms of its landscape and aesthetic value), which, according to the questionnaire results, would have a significantly negative impact on the future visit of the site. The paradox with this location is the fact that massive deforestation has taken place within the surroundings, after which most of the displayed areas remained strongly devastated. Despite the relatively devastated landscape, this view from the location after the addition of the power plant is unacceptable for 44.3% of respondents.
Another problematic area identified based on the questionnaire results is the proximity of a historical element, in the presented cases, it was Spiš Castle (the largest castle in Central Europe). Both location 3 and location 6 recorded approximately 30% of respondents who expressed a rather negative attitude toward the fictitious photovoltaic and wind power plant. On the opposite end of the spectrum are locations 2, 4, and 5. Each of these sites is characterized by a view of agricultural or industrial landscape, which resulted in a more positive assessment of the impact of RES infrastructure. This is because in these cases, RES power plants would not have a dominant impact on the landscape view.
In the interpretation of the results evaluating the potential change in location visits after the construction of RES power plants, it can be observed that the future visits in individual locations would be negatively affected by a range of 2.9% to 16.5% among all respondents. This interval or number of visitors cannot be ignored, as it could have a significant impact on the selected economic parameters related to the tourism industry. However, it is necessary to note that based on examples from abroad [48], RES infrastructure can also attract a new type of visitor seeking elements of industrial tourism, potentially replacing the number of visitors who may stop visiting a particular location due to the existence of wind or solar farms in the future. From the point of view of tourism linked to the RES infrastructure, it is possible to discuss the different types of tourist infrastructures—simple information panels, educational hiking trails, or large-scale educational visitor centers that allow the learning of RES in an attractive form. According to the findings of the study [48], these visitor centers may have annual visits in the tens of thousands. From foreign experience and examples, it is possible to confirm that these centers are built mainly at wind, geothermal, and hydropower plants.
Nevertheless, this fact needs to be thoroughly examined and analyzed within future research tasks and studies in the conditions of the Slovak Republic.
The most important findings, in terms of a more effective public engagement in the design and approval process of RES infrastructure, come from the statistical analysis of data within the testing of defined research questions or hypotheses. The analysis of hypotheses not only identifies the potential negative impacts of the public on the approval process or boycotts of areas with future power plants, but also focuses on specific population groups that can be considered the most affected segments of the public. Their characterization in terms of distinctive characteristics (age, gender, education level, etc.) is the first step toward possible adjustments in the construction preparation processes to reflect these realities. Furthermore, it enables tailoring specific processes to target population groups, thereby reducing the overall project risk.
Results of Statistical Hypothesis Testing
In the process of statistical analysis, within each hypothesis, all obtained responses were divided into two groups. The first group consisted of responses from the selected segment of respondents, while the second group included responses from all other respondents.
Hypothesis 8.
Based on the p-value of the Levene’s test (0.558), it can be concluded that the dataset has an homogenous variance, which means it can be used in the U-Mann–Whitney test without limitations. The results of the U-Mann–Whitney test revealed that there is a statistically significant difference between the evaluations of locations by respondents aged over 55 (Md = 2, n = 945) compared to those aged 55 and below (Md = 3, n = 2198). Therefore, based on the significance value (p = <0.001), the null hypothesis can be rejected at the given level of statistical significance. When comparing the medians, it can be stated that the older generation evaluates the locations with built RES infrastructure more negatively (rating 2—moderate negative reaction to RES installations without negative impact on future visit) than the younger generation (rating 3—neutral reaction toward RES installations).
Hypothesis 9.
Based on the p-value of the Levene’s test (0.927), it can be concluded that the dataset has an homogenous variance, which means it can be used in the U-Mann–Whitney test without limitations. The results of the U-Mann–Whitney test revealed that there is a statistically significant difference between the evaluations of locations by respondents who are organized in tourist clubs (Md = 2, n = 2002) compared to those who are not organized in tourist clubs (Md = 3, n = 1141). Therefore, based on the significance value (p = <0.001), the null hypothesis can be rejected at the given level of statistical significance. When comparing the medians, it can be stated that respondents who are organized in tourist clubs evaluate the locations with built RES infrastructure more negatively (rating 2—moderate negative reaction to RES installations without negative impact on future visit), compared to respondents who are not organized in tourist clubs (rating 3—neutral reaction toward RES installations).
Hypothesis 10.
Based on the p-value of the Levene’s test (<0.001), it can be concluded that the dataset has an heterogeneous variance, which means it can be used in the U-Mann–Whitney test with the limitation of comparing medians. In this case, we can assess the difference between the statistical sets, but we cannot precisely quantify the evaluation of groups based on the median rating, only based on the sum of ranks. The results of the U-Mann–Whitney test revealed that there is no statistically significant difference between the evaluation of locations with built RES infrastructure by respondents who have previously visited the location and those who have not visited the location. Therefore, based on the significance value (p = 0.202), we cannot reject the null hypothesis at the given level of statistical significance.
Hypothesis 11.
The Levene’s test resulted in a p-value of 0.476, indicating that the dataset has an homogeneous variance and can be used in the U-Mann–Whitney test without limitations. The results of the U-Mann–Whitney test revealed a statistically significant difference in the evaluation of locations between respondents who have information about RES from the educational environment (Md = 3, n = 728) and those who obtained information from sources outside of school (Md = 2, n = 2401). Therefore, based on a significance level of p < 0.001, we can reject the null hypothesis. When comparing the medians, it can be concluded that respondents who obtained information about RES from sources outside of the school evaluated the locations with built RES infrastructure more negatively (rating 2—moderate negative reaction to RES installations without negative impact on future visit) compared to respondents who acquired information within the educational process (rating 3—neutral reaction toward RES installations).
Hypothesis 12.
The Levene’s test resulted in a p-value of 0.065, indicating that the dataset has an homogeneous variance and can be used in the U-Mann–Whitney test without limitations. The results of the U-Mann–Whitney test revealed a statistically significant difference between the evaluation of locations with a historical element (Md = 2, n = 898) and locations without a historical element (Md = 3, n = 2245). Therefore, based on a significance level of p < 0.001, we can reject the null hypothesis. When comparing the medians, it can be concluded that locations with a historical element are evaluated more negatively (rating 2—moderate negative reaction to RES installations without negative impact on future visit) compared to locations without a historical element (rating 3—neutral reaction toward RES installations).
Hypothesis 13.
The Levene’s test resulted in a p-value of <0.001, indicating that the dataset has an heterogeneous variance. This means that it can be used in the U-Mann–Whitney test with the limitation of comparing medians. In this case, we can assess the difference between the statistical datasets, but we cannot precisely quantify the group evaluation according to the median rating, only based on the results of the sum of the rank order of the statistical datasets. The results of the U-Mann–Whitney test revealed a statistically significant difference between the evaluation of locations where RES infrastructure was located near other built infrastructure (n = 898) and locations where RES infrastructure was in a landscape without other built infrastructure (n = 2245). Therefore, based on a significance level of p < 0.001, we can reject the null hypothesis at the given level of statistical significance.
Hypothesis 14.
Based on a p-value of 0.085 from the Levene’s test, it can be concluded that the dataset has an homogeneous variance, allowing the use of the U-Mann–Whitney test without restrictions. The results of the U-Mann–Whitney test revealed a statistically significant difference in the ratings of locations where RES power plants affect the view of the High Tatras (Md = 2, n = 898) compared to locations where RES power plants do not affect the view (Md = 3, n = 2245). Therefore, based on the significance level (p = <0.001), the null hypothesis can be rejected. In terms of medians, it can be concluded that locations where RES power plants affect the view are rated more negatively (rating 2—moderate negative reaction to RES installations without negative impact on future visit,) compared to locations where RES power plants do not affect the view (rating 3—neutral reaction toward RES installations).
Hypothesis 15.
Based on a p-value of 0.328 from the Levene’s test, it can be concluded that the dataset has an homogeneous variance, allowing the use of the U-Mann–Whitney test without restrictions. The results of the U-Mann–Whitney test revealed that there is no statistically significant difference in the ratings of locations between respondents who viewed the questionnaire on larger devices and those who viewed it on smaller devices. Therefore, based on the significance level (p = 0.069), we cannot reject the null hypothesis at the given level of statistical significance.
When referring the overall results of hypothesis testing, we can positively evaluate the way they were formulated, considering that out of a total of eight tested hypotheses, two were rejected, and we were able to demonstrate statistically significant differences in six hypotheses between the evaluated statistical samples at the given level of significance.
For a better clarity of the results, the outcomes of the statistical analysis for the defined hypotheses are summarized in Table 1.
When comparing the presented results within Slovakia, we cannot rely on a study or scientific work that would assess the same issue, namely the visual impact of RES infrastructure, as there is no such study available in the conditions of the Slovak Republic to the best knowledge of the authors. However, the obtained results can be partially confronted with studies focused on the public perception of RES in general. The results of a study conducted by the Slovak Climate Initiative titled “Support for RES in Slovakia” [49] in June 2021 indicate that 68% of respondents support the greater utilization of RES, with 24% strongly in favor and 45% leaning toward support. Conversely, 8% are strongly against the further utilization of RES, and approximately 23% are leaning toward opposition. These findings roughly correlate with the presented data, as the most negative rating is represented by an average of 7.2% of respondents, and the group with a somewhat negative perception of RES consists of 22% of respondents. According to the Slovak Climate Initiative study, respondents over 55 years of age have the most negative attitude, which was again confirmed by the presented survey. Similar results are found in comparison with foreign studies. The Southwest Research Company conducted a survey in Cornwall (UK) [50], in which authors evaluated the impact of wind and photovoltaic power plants on visitors to locations with established RES power plants. Out of the total number of respondents (1007), 80% were in favor of RES infrastructure, 14% had an ambivalent attitude, and only 6% had a negative attitude toward RES infrastructure. These results also correlate to some extent with the presented findings.
The commentary on the results of the study for the Slovak Climate Initiative also suggests the need for better education regarding RES, which could help overcome barriers to their further development. With the expected significant growth of RES power plants in the future, as indicated by the information and data presented in the introductory chapters of this work, significant efforts must be made to improve the media image of RES, as most of the public acquires knowledge through mass media. The current unfavorable media image of RES is caused by several factors, including the political controversy surrounding past subsidy schemes that negatively impact current high electricity prices, poor communication skills of investors in crisis communication, and the insufficient use of knowledgeable RES experts in commenting on current controversial projects in the mass media, where they are replaced by environmental activists or, at best, scientists from other fields. When comparing the impact of the surrounding environment on RES infrastructure acceptance, the study by Michell et al. [51] can be utilized. In this study, the authors examined the acceptance of RES installations in various landscape or urban elements within the environment of Switzerland. The respondents in that study rated RES installations on the roofs of historic city centers, near historic buildings, and in undeveloped natural landscapes as the most negative. On the other hand, installations in industrial areas and in connection with modern architecture were seen as the least problematic as was demonstrated in presented study.
5. Conclusions
The presented research deals with the specific issue of the visual impact of power plants that utilize RES such as wind and solar energy. These types of power plants are particularly negatively evaluated in terms of their visual impact on the landscape and the degradation of the scenic value of an area. The research was focused on the tourist-active part of the public and was conducted through a questionnaire survey. Respondents used a five-point Likert scale to evaluate photographs of selected tourist-attractive locations, to which wind or solar power plants were added using graphic editing software. Hypotheses formulated within the research were based on an attempt to quantify the state of the topic and identify possible negative phenomena that could influence the future expansion of RES infrastructure. The statistical analysis of the hypotheses, which allowed for either the rejection or non-rejection of the given hypotheses, was performed using the U-Mann–Whitney test. The results of the questionnaire survey and statistical data analysis confirmed the expected findings, namely that respondents over the age of 55 and respondents affiliated with a tourist organization would evaluate new RES infrastructure more negatively. The hypothesis regarding the importance of information sources was also confirmed, as respondents who obtained information about RES from educational environments rather than mass media evaluated new RES infrastructure more positively. These findings, expressing the acceptance of RES infrastructure, mirror the results of studies conducted in other countries as well as the results of domestic studies dealing with support for RES in general. Another significant contribution of the presented research is the analysis of the impact of the surroundings of an RES power plant, where respondents negatively evaluated the proximity of a historical element in the landscape and evaluated installations in extensively used landscapes more positively, as expected. The analysis of the visual impact of power plants on the High Tatras mountain range, which is perceived as a significant landscape feature and a center of tourism in the conditions of the Slovak Republic, yielded relatively specific results. In this case, all power plants were evaluated negatively, regardless of the wider surroundings. Lastly, the research also assessed the potential change in visitation to a location after the construction of wind or photovoltaic power plants, with 2.9% to 16.5% of respondents expressing that they would never visit the location again for the considered locations. However, it is necessary to reflect on experiences from abroad where RES power plants can to some extent be a part of industrial tourism and attract a new segment of visitors to a location. Nevertheless, this fact needs to be further examined under the conditions of the Slovak Republic. According to the authors, the presented results can bring about necessary changes in the communication with the affected public in the process of designing and constructing RES power plants, thereby achieving their faster development and representation in the country’s energy mix.
Author Contributions
Conceptualization, M.B. and R.R.; methodology, M.B. and R.R.; formal analysis, M.B. and R.R.; resources, M.B.; data curation, M.B.; writing—original draft preparation, M.B., Ľ.G. and R.R.; writing—review and editing, M.B.; visualization, M.B.; funding acquisition, M.B. and R.R. All authors have read and agreed to the published version of the manuscript.
Funding
This research was funded by Grant Agency of the Ministry of Education, Science, Research and Sport of the Slovak Republic, VEGA 1/0290/2 “Study of the behavior of heterogeneous structures based on PCM and metal foams as heat accumulators with application potential in technologies for obtaining and processing of the earth resources”. This paper was created in connection with the project KEGA—048TUKE-4/2021: Universal educational competitive platform.
Data Availability Statement
The data that support the findings of this study are available on request from the corresponding author.
Conflicts of Interest
The authors declare no conflict of interest.
References
- Artiola, J.; Baumgartner, D.J.; Bohn, H.; Chorover, J.; Comrie, A.; Crimmins, M.; Fitzsimmons, K.; Glenn, E.; Maier, R.; Matthias, A.; et al. Environmental and Pollution Science, 2nd ed.; Academic Press: Cambridge, MA, USA, 2006; pp. 3–8. [Google Scholar]
- Whitmore, T.C.; Sayer, J.A. Tropical Deforestation and Species Extinction, 1st ed.; Springer: Dordrecht, The Netherlands, 1992; pp. 108–111. [Google Scholar]
- Liu, G. Ocean Acidification and Marine Wildlife, Physiological and Behavioral Impacts, 1st ed.; Academic Press: Cambridge, MA, USA, 2021; pp. 25–32. [Google Scholar]
- Abbasi, S.A.; Abbasi, T. Ozone Hole Book Subtitle Past, Present, Future, 1st ed.; Springer: New York, NY, USA, 2017; pp. 18–27. [Google Scholar]
- Intergovernmental Panel on Climate Change—Climate Change 2022: Impacts, Adaptation and Vulnerability. Available online: https://www.ipcc.ch/report/ar6/wg2/ (accessed on 24 March 2023).
- Intergovernmental Panel on Climate Change—Global Climate Projections. Available online: https://www.ipcc.ch/report/ar4/wg1/global-climate-projections/ (accessed on 24 March 2023).
- Erickson, P.; Lazarus, M.; Piggot, G. Limiting fossil fuel production as the next big step in climate policy. Nat. Clim. Chang. 2018, 8, 1037–1043. [Google Scholar] [CrossRef]
- Puškár, M.; Živčák, J.; Král, Š.; Kopas, M.; Lavčák, M. Analysis of Biodiesel Influence on Unregulated Gaseous Emissions of Diesel Motor Vehicles. Appl. Sci. 2021, 11, 4646. [Google Scholar] [CrossRef]
- Puškár, M.; Tarbajovský, P.; Lavčák, M.; Šoltésová, M. Marine Ancillary Diesel Engine Emissions Reduction Using Advanced Fuels. J. Mar. Sci. Eng. 2022, 10, 1895. [Google Scholar] [CrossRef]
- Puškár, M.; Živčák, J.; Košišová, M.; Šoltésová, M.; Kopas, M. Impact of bio-renewable energy sources on reduction of emission footprint from vehicles. Biofuels Bioprod. Biorefining 2021, 15, 1385–1394. [Google Scholar] [CrossRef]
- Kildahl, H.; Li Wang, L.; Tong, L.; Ding, Y. Cost effective decarbonisation of blast furnace—Basic oxygen furnace steel production through thermochemical sector coupling. J. Clean. Prod. 2023, 389, 135963. [Google Scholar] [CrossRef]
- International Energy Agency—Renewables 2021, Analysis and Forecast to 2026. Available online: https://iea.blob.core.windows.net/assets/5ae32253-7409-4f9a-a91d-1493ffb9777a/Renewables2021-Analysisandforecastto2026.pdf (accessed on 24 March 2023).
- Council of the EU and the European Council—European Green Deal and Fit for 55. Available online: https://www.consilium.europa.eu/sk/policies/green-deal/fit-for-55-the-eu-plan-for-a-green-transition/ (accessed on 24 March 2023).
- Slovak Ministry of Economy—Integrated National Energy and Climate Plan (2021–2030). Available online: https://energy.ec.europa.eu/system/files/2022-08/sk_final_necp_main_sk.pdf (accessed on 24 March 2023).
- Sebestyén, V. Renewable and Sustainable Energy Reviews: Environmental impact networks of renewable energy power plants. Renew. Sustain. Energy Rev. 2021, 151, 111626. [Google Scholar] [CrossRef]
- Sayed, E.T.; Wilberforce, T.; Elsaid, K.; Rabaia, M.K.H.; Abdelkareem, M.A.; Chae, K.; Olabi, A.G. A critical review on environmental impacts of renewable energy systems and mitigation strategies: Wind, hydro, biomass and geothermal. Sci. Total Environ. 2021, 766, 144505. [Google Scholar] [CrossRef]
- Rahman, A.; Farrok, O.; Haque, M.M. Environmental impact of renewable energy source based electrical power plants: Solar, wind, hydroelectric, biomass, geothermal, tidal, ocean, and osmotic. Renew. Sustain. Energy Rev. 2022, 161, 112279. [Google Scholar] [CrossRef]
- Holma, A.; Leskinen, P.; Myllyviita, T.; Manninen, K.; Sokka, L.; Sinkko, T.; Pasanen, K. Environmental impacts and risks of the national renewable energy targets—A review and a qualitative case study from Finland. Renew. Sustain. Energy Rev. 2018, 82, 1433–1441. [Google Scholar] [CrossRef]
- Nazir, M.S.; Mahdi, A.J.; Bilal, M.; Sohail, H.M.; Ali, N.; Iqbal, H. Environmental impact and pollution-related challenges of renewable wind energy paradigm—A review. Sci. Total Environ. 2019, 683, 436–444. [Google Scholar] [CrossRef]
- Wassie, Y.T.; Adaramola, M.S. Potential environmental impacts of small-scale renewable energy technologies in East Africa: A systematic review of the evidence. Renew. Sustain. Energy Rev. 2019, 111, 377–391. [Google Scholar] [CrossRef]
- Atilgan, B.; Azapagic, A. Renewable electricity in Turkey: Life cycle environmental impacts. Renew. Energy 2016, 89, 649–657. [Google Scholar] [CrossRef] [Green Version]
- McCombie, C.; Jefferson, M. Renewable and nuclear electricity: Comparison of environmental impacts. Energy Policy 2016, 96, 758–769. [Google Scholar] [CrossRef]
- Smil, V. Power Density: A Key to Understanding Energy Sources and Uses, 1st ed.; The MIT Press: Cambridge, MA, USA, 2016; pp. 23–28. [Google Scholar]
- Alphan, H. Modelling potential visibility of wind turbines: A geospatial approach for planning and impact mitigation. Renew. Sustain. Energy Rev. 2021, 152, 111675. [Google Scholar] [CrossRef]
- Ferrario, V.; Castiglioni, B. Visibility/invisibility in the ‘making’ of energy landscape. Strategies and policies in the hydropower development of the Piave river (Italian Eastern Alps). Energy Policy 2017, 108, 829–835. [Google Scholar] [CrossRef]
- Ioannidis, R.; Koutsoyiannis, D. A review of land use, visibility and public perception of renewable energy in the context of landscape impact. Appl. Energy 2020, 276, 115367. [Google Scholar] [CrossRef]
- Ioannidis, R.; Mamassis, N.; Efstratiadis, A.; Koutsoyiannis, D. Reversing visibility analysis: Towards an accelerated a priori assessment of landscape impacts of renewable energy projects. Renew. Sustain. Energy Rev. 2022, 209, 112389. [Google Scholar] [CrossRef]
- Spielhofer, R.; Hunziker, M.; Kienast, F.; Wissen Hayek, U.; Grêt-Regamey, A. Does rated visual landscape quality match visual features? An analysis for renewable energy landscapes. Landsc. Urban Plan. 2021, 209, 104000. [Google Scholar] [CrossRef]
- Möller, B. Changing wind-power landscapes: Regional assessment of visual impact on land use and population in Northern Jutland, Denmark. Appl. Energy 2006, 83, 477–494. [Google Scholar] [CrossRef]
- Iwata, K.; Kyoi, S.; Ushifusa, Y. Public attitudes of offshore wind energy in Japan: An empirical study using choice experiments. Clean. Energy Syst. 2023, 4, 100052. [Google Scholar] [CrossRef]
- Brennan, N.; van Rensburg, T.M. Does intermittency management improve public acceptance of wind energy? A discrete choice experiment in Ireland. Energy Res. Soc. Sci. 2023, 95, 102917. [Google Scholar] [CrossRef]
- Duarte, R.; García-Riazuelo, Á.; Sáez, L.A.; Sarasa, C. Analysing citizens’ perceptions of renewable energies in rural areas: A case study on wind farms in Spain. Energy Rep. 2022, 8, 12822–12831. [Google Scholar] [CrossRef]
- Buchmayr, A.; Verhofstadt, E.; Van Ootegem, L.; Thomassen, G.; Taelman, S.E.; Dewulf, J. Exploring the global and local social sustainability of wind energy technologies: An application of a social impact assessment framework. Appl. Energy 2022, 312, 118808. [Google Scholar] [CrossRef]
- Windemer, R. Acceptance should not be assumed. How the dynamics of social acceptance changes over time, impacting onshore wind repowering. Energy Policy 2023, 173, 113363. [Google Scholar] [CrossRef]
- Knauf, J. Can’t buy me acceptance? Financial benefits for wind energy projects in Germany. Energy Policy 2022, 165, 112924. [Google Scholar] [CrossRef]
- Machado, J.; de Andrés, M. Implications of offshore wind energy developments in coastal and maritime tourism and recreation areas: An analytical overview. Environ. Impact Assess. Rev. 2023, 99, 106999. [Google Scholar] [CrossRef]
- Tverijonaite, E.; Sæþórsdóttir, A.D.; Ólafsdóttir, R.; Hall, C.M. How close is too close? Mapping the impact area of renewable energy infrastructure on tourism. Energy Res. Soc. Sci. 2022, 90, 102574. [Google Scholar] [CrossRef]
- Smythe, T.; Bidwell, D.; Moore, A.; Smith, H.; McCann, J. Beyond the beach: Tradeoffs in tourism and recreation at the first offshore wind farm in the United States. Energy Res. Soc. Sci. 2020, 70, 101726. [Google Scholar] [CrossRef]
- Carr-Harris, A.; Lang, C. Sustainability and tourism: The effect of the United States’ first offshore wind farm on the vacation rental market. Resour. Energy Econ. 2019, 57, 51–67. [Google Scholar] [CrossRef]
- Ólafsdóttir, R.; Sæþórsdóttir, A.D. Wind farms in the Icelandic highlands: Attitudes of local residents and tourism service providers. Land Use Policy 2019, 88, 104173. [Google Scholar] [CrossRef]
- Mroczek, B.; Kurpas, D. Social Attitudes towards Wind Farms and other Renewable Energy Sources in Poland. Med. Sr. Environ. Med. 2014, 17, 19–28. [Google Scholar]
- Coleby, A.M.; Miller, D.R.; Aspinall, P.A. Public attitudes and participation in wind turbine development. J. Environ. Assess. Policy Manag. 2009, 11, 69–95. [Google Scholar] [CrossRef]
- Hamza, N.; Borg, R.P.; Camilleri, L.; Baniotopoulos, C. Experts versus the Public: Perceptions of Siting Wind Turbines and Performance Concerns. Energies 2022, 15, 7743. [Google Scholar] [CrossRef]
- Ferreira, P.; Lima, F.; Ribeiro, F.; Vieira, F. A mixed-method approach for the assessment of local community perception towards wind farms. Sustain. Energy Technol. Assess. 2019, 33, 44–52. [Google Scholar] [CrossRef]
- Cronin, Y.; Wolsztynski, E.; Cummins, V. Public Perception of Offshore Wind Farms Report Part 2; EirWind Project Deliverable D4.7, Report; MaREI Centre: Cork, Ireland; ERI: Cork, Ireland; University College Cork: Cork, Ireland, 2020. [Google Scholar]
- Takacs, B.; Goulden, M.C. Accuracy of wind farm visualizations: The effect of focal length on perceived accuracy. Environ. Impact Assess. Rev. 2019, 76, 1–9. [Google Scholar] [CrossRef]
- de Winter, J.C.F.; Dodou, D. Five-Point Likert Items: T test versus Mann-Whitney-Wilcoxon, Practical Assessment. Res. Eval. 2010, 15, 1–12. [Google Scholar]
- Beer, M.; Rybár, R.; Kaľavský, M. Renewable energy sources as an attractive element of industrial tourism. Curr. Issues Tour. 2018, 21, 2147–2159. [Google Scholar] [CrossRef]
- Climatic Alliance of Slovakia. Survey—Support for RES. Available online: https://klimatickainiciativa.sk/prieskum-verejnej-mienky-podporujeme-obnovitelne-zdroje-a-uspory-energie-ale-sme-skepticki-k-tomu-ci-to-nase-domacnosti-ochrani-pred-zvysenim-nakladov-za-energie/ (accessed on 1 February 2023).
- The South West Research Company. The Impact of Renewable Energy Farms on Visitors to Cornwall. Available online: http://www.deg.wales/wp-content/uploads/2015/09/TheimpactofrenewableenergyfarmsonvisitorstoCornwall-FINALREPORT-November13.pdf> (accessed on 1 February 2023).
- Michel, A.H.; Buchecker, M.; Backhaus, N. Renewable Energy, Authenticity and Tourism: Social Acceptance of Photovoltaic Installations in a Swiss Alpine Region. Mt. Res. Dev. 2015, 35, 161–170. [Google Scholar] [CrossRef]
Figure 1.
The geographical locations of the evaluated cases.

Figure 2.
Summary view of selected locations with added fictional photovoltaic and wind power plants.
Figure 2.
Summary view of selected locations with added fictional photovoltaic and wind power plants.

Figure 3.
Summary of results characterizing the respondents’ attitude toward tourism (hiking).

Figure 4.
Basic characteristic of respondents.

Figure 5.
Summary of ratings of evaluated locations.


Table 1.
Summary of the results of statistical hypothesis testing.
| Research Question | Group and Median Rating | p-Value Levene’s Test | p-Value U-Mann–Whitney Test | Conclusion | |
|---|---|---|---|---|---|
| 1 | Are respondents over 55 years of age more negative in their evaluation of RES infrastructure compared to younger respondents (up to 55 years old)? | under 55y (Md = 3, n = 2 198); over 55y (Md = 2, n = 945) | 0.558 | <0.001 | There is a difference: respondents over 55 years of age rate RES more negatively. |
| 2 | Do respondents who are members of tourist clubs evaluate RES infrastructure more negatively? | club members (Md = 2, n = 2 002); non-club members (Md = 3, n = 1 141) | 0.927 | <0.001 | There is a difference: club members evaluate RES infrastructure more negatively. |
| 3 | Do respondents who have visited the location in the past rate RES infrastructure more negatively? | visited (N/A); not visited (N/A) | <0.001 | 0.202 | There is no difference in RES infrastructure ratings between respondents who visited and those who did not visit the location. |
| 4 | Do respondents who have information about RES from educational sources rate RES infrastructure more positively? | information from school (Md = 3, n = 728); other sources (Md = 2, n = 2401) | 0.476 | <0.001 | There is a difference: respondents who have information from educational sources rate RES infrastructure more positively. |
| 5 | Are locations where RES infrastructure is near a historical element rated more negatively? | RES infrastructure near historical element (Md = 2, n = 898); RES infrastructure distant from historical element (Md = 3, n = 2245) | 0.065 | <0.001 | There is a difference: locations where RES infrastructure is near a historical element are rated more negatively than locations without a historical element. |
| 6 | Are locations where RES infrastructure is situated in areas with other built infrastructure rated more positively than in natural areas? | RES infrastructure near other infrastructure (Md = N/A, Rank = 1819.52); RES infrastructure in natural landscape (Md = N/A, Rank = 1472.99) | <0.001 | <0.001 | There is a difference: locations where RES infrastructure is situated in areas with developed infrastructure are rated more positively than locations without developed infrastructure (specific ratings cannot be determined based on the statistical analysis results). |
| 7 | Are locations where RES infrastructure affects the view of the High Tatras mountains perceived more negatively? | RES infrastructure affects views (Md = 2, n = 898); RES infrastructure does not affect views (Md = 3, n = 2245) | 0.085 | <0.001 | There is a difference: locations where RES infrastructure affects the view of the significant mountain range are perceived more negatively. |
| 8 | Is it true that there is a difference in the rating of locations, depending on the device used to display the online questionnaire? | ratings from small devices (N/A); ratings from large devices (N/A) | 0.328 | 0.069 | There is no difference depending on the device on which the questionnaire was displayed. |
Disclaimer/Publisher’s Note: The statements, opinions and data contained in all publications are solely those of the individual author(s) and contributor(s) and not of MDPI and/or the editor(s). MDPI and/or the editor(s) disclaim responsibility for any injury to people or property resulting from any ideas, methods, instructions or products referred to in the content. |
© 2023 by the authors. Licensee MDPI, Basel, Switzerland. This article is an open access article distributed under the terms and conditions of the Creative Commons Attribution (CC BY) license (https://creativecommons.org/licenses/by/4.0/).
Share and Cite
MDPI and ACS Style
Beer, M.; Rybár, R.; Gabániová, Ľ. Visual Impact of Renewable Energy Infrastructure: Implications for Deployment and Public Perception. Processes 2023, 11, 2252. https://doi.org/10.3390/pr11082252
AMA Style
Beer M, Rybár R, Gabániová Ľ. Visual Impact of Renewable Energy Infrastructure: Implications for Deployment and Public Perception. Processes. 2023; 11(8):2252. https://doi.org/10.3390/pr11082252
Chicago/Turabian StyleBeer, Martin, Radim Rybár, and Ľubomíra Gabániová. 2023. "Visual Impact of Renewable Energy Infrastructure: Implications for Deployment and Public Perception" Processes 11, no. 8: 2252. https://doi.org/10.3390/pr11082252
Note that from the first issue of 2016, this journal uses article numbers instead of page numbers. See further details here.