
Bulk Resistivity of Materials in the Si/FeSi Furnace


1
Department of Materials Science and Engineering, Norwegian University of Science and Technology, 7034 Trondheim, Norway
2
NORCE, 4630 Kristiansand, Norway
3
Department of Engineering, Reykjavik University, 102 Reykjavik, Iceland
*
Author to whom correspondence should be addressed.
Processes 2023, 11(7), 2115; https://doi.org/10.3390/pr11072115
Submission received: 12 June 2023
/
Revised: 2 July 2023
/
Accepted: 11 July 2023
/
Published: 15 July 2023
Abstract
:The formation of silicon carbide (SiC) and the energy distribution in the furnace are two important parameters in evaluating furnace operations. The energy distribution is determined by the resistivity of the materials in the furnace. This work aims to investigate the bulk resistivity of materials in the silicon (Si) furnace using both partially transformed carbon materials and raw charge mixes. In this study, the impact of temperature, SiC and Si content, and the addition of insulating charge materials are investigated up to 1600 °C using carbon materials as a base. The materials were treated under similar conditions to the industrial furnace. The resistivity of the carbon materials was between 7 and 17 mΩm at 1600 °C, where the char and coal were generally more conductive than the charcoal. The resistivity of partially transformed materials increased with conversion to SiC, and coal with a higher SiC content than 60% had an average resistivity at 1600 °C of around 30 mΩm. The resistivity then began to decrease as elemental Si formed in the pores. Up to 36%, the amount of Si did not affect the measured resistivity, but its presence likely causes a slight decrease. Computed tomography (CT) scans show that the SiC material is not visibly changing or transforming in the crucible during measurement. Comparing the SiC materials to carbon materials and SiC crust from the literature shows that partially transformed SiC will be as conductive or less conductive than carbon at high temperatures. At 1400 °C, the resistivity of the charge mixes that included char, quartz, woodchips, and silica–iron ore showed that the resistivity is directly proportional to the amount of the main conductive material, in this case, char. Temperature, transformation to SiC, and volume of conductive materials appear to influence the resistivity most heavily in this work. At higher temperatures, the effect of SiC content and heat treatment temperature is lessened as the range becomes smaller for these materials.
1. Introduction
Production of silicon and ferrosilicon (Si/FeSi) requires high amounts of electrical energy and carbon materials which are becoming scarcer and more expensive. Understanding the energy distribution in the furnace is key to increasing process efficiency. Previous literature indicates that much of the electrical current delivered to the system via the electrode will pass through an electric arc, whereas the remaining current may pass through the silicon carbide (SiC) crust or the partially transformed raw materials depending on their conductivities [1]. The electrical resistivity in the arc and the SiC crusts have previously been investigated [1,2,3,4], while there is scarce literature on the partly transformed charge material. Furthermore, most previous literature has studied the resistivity of pure materials or high temperatures.
Silicon is produced by carbothermic reduction of quartz (SiO2) in a submerged arc furnace (SAF). The overall ideal reaction is shown in Equation (1). However, this equation shows a simplified mass balance and in the furnace, silicon dioxide is not reduced by solid carbon directly.
The process takes place in an SAF with three consumable carbon electrodes which supply electrical energy to the system. The furnace is further divided into two zones, the low-temperature zone and the high-temperature zone. The high-temperature zone is where most of the silicon is produced. Molten SiO2 from the charge material reacts with intermediate solid silicon carbide to form liquid silicon (Si), silicon oxide gas (SiO), and carbon monoxide gas (CO).
While the liquid pool is tapped at the bottom of the furnace, the gas moves upwards through the raw material charge in the furnace. As the gases reach areas of lower temperature, they eventually react to condensed materials in the low-temperature zone. SiO gas plays an important role as it forms the SiC intermediate (Equation (3)) necessary for the silicon-producing reaction (Equation (4)). Additionally, it can also reform SiO2 and Si as it condenses (reverse of Equation (2)) [5].
The paths of the applied electrical current will determine the energy distribution of the furnace [3,6]. For a stable operation, the electrical current paths should be focused in the lower part of the furnace and minimized elsewhere. Based on the structure of the furnace the current may follow from the electrode through the arc (which can strike the liquid silicon pool or the crust made up of SiC [7]) or through the partially transformed charge material [5]. The transformed charge in the furnace consists of quartz, partially transformed carbon to SiC, and woodchips transformed to charcoal. Generally, SiO2 is an insulator, carbon is conductive, and woodchips will become conductive once they have sufficiently been transformed to charcoal at a high-enough temperature. The amount of current that will pass through the charge will depend on its conductivity. It is desirable to achieve high electrical resistance in the charge to generate more power for the electric arc and its surroundings [8]. Thermal energy must be generated at the electrode tips with a minimum amount of energy generated in the top layer of the charge material to achieve optimal conditions for the reduction of SiO2 [9]. Therefore, the resistivity of the charge materials as they are transformed and mixed will be important to overall furnace operations, whereas most previous literature focuses on pure materials.
In studying the resistivity of mixed materials, it is important to further differentiate between material resistivity, contact resistance, and bulk resistivity [10]. Bulk resistivity refers to a bed of particles, and it is the combination of both material and contact resistivity. Material resistivity refers to the intrinsic resistivity value of a given material in its granular state based on its structure. Contact resistance refers to the natural resistance that arises from current passing through points of contact between particles. Contact resistance is believed to largely contribute to bulk resistivity as the area of contact connecting the conducting particles will greatly affect its ability to conduct charge [10].
Many studies have been published on the resistivity of carbon materials [9,10,11,12,13,14,15,16,17,18]. In general, it is accepted that resistivity decreases with increasing temperature for the materials in the Si/FeSi furnace. It can however be mentioned that for metals the resistivity increases with temperature. The effect of particle size remains unclear as some studies show increasing resistivity with increasing size, while others found the opposite. Current in the charge conducts through an array of conducting particles in the bulk and contact resistance decreases with increasing temperature and contact pressure. Eidem [10] found that contact resistance is a major component of the total resistance, but its contribution decreases with increasing temperature because the increased temperature compensates for the added energy band gap.
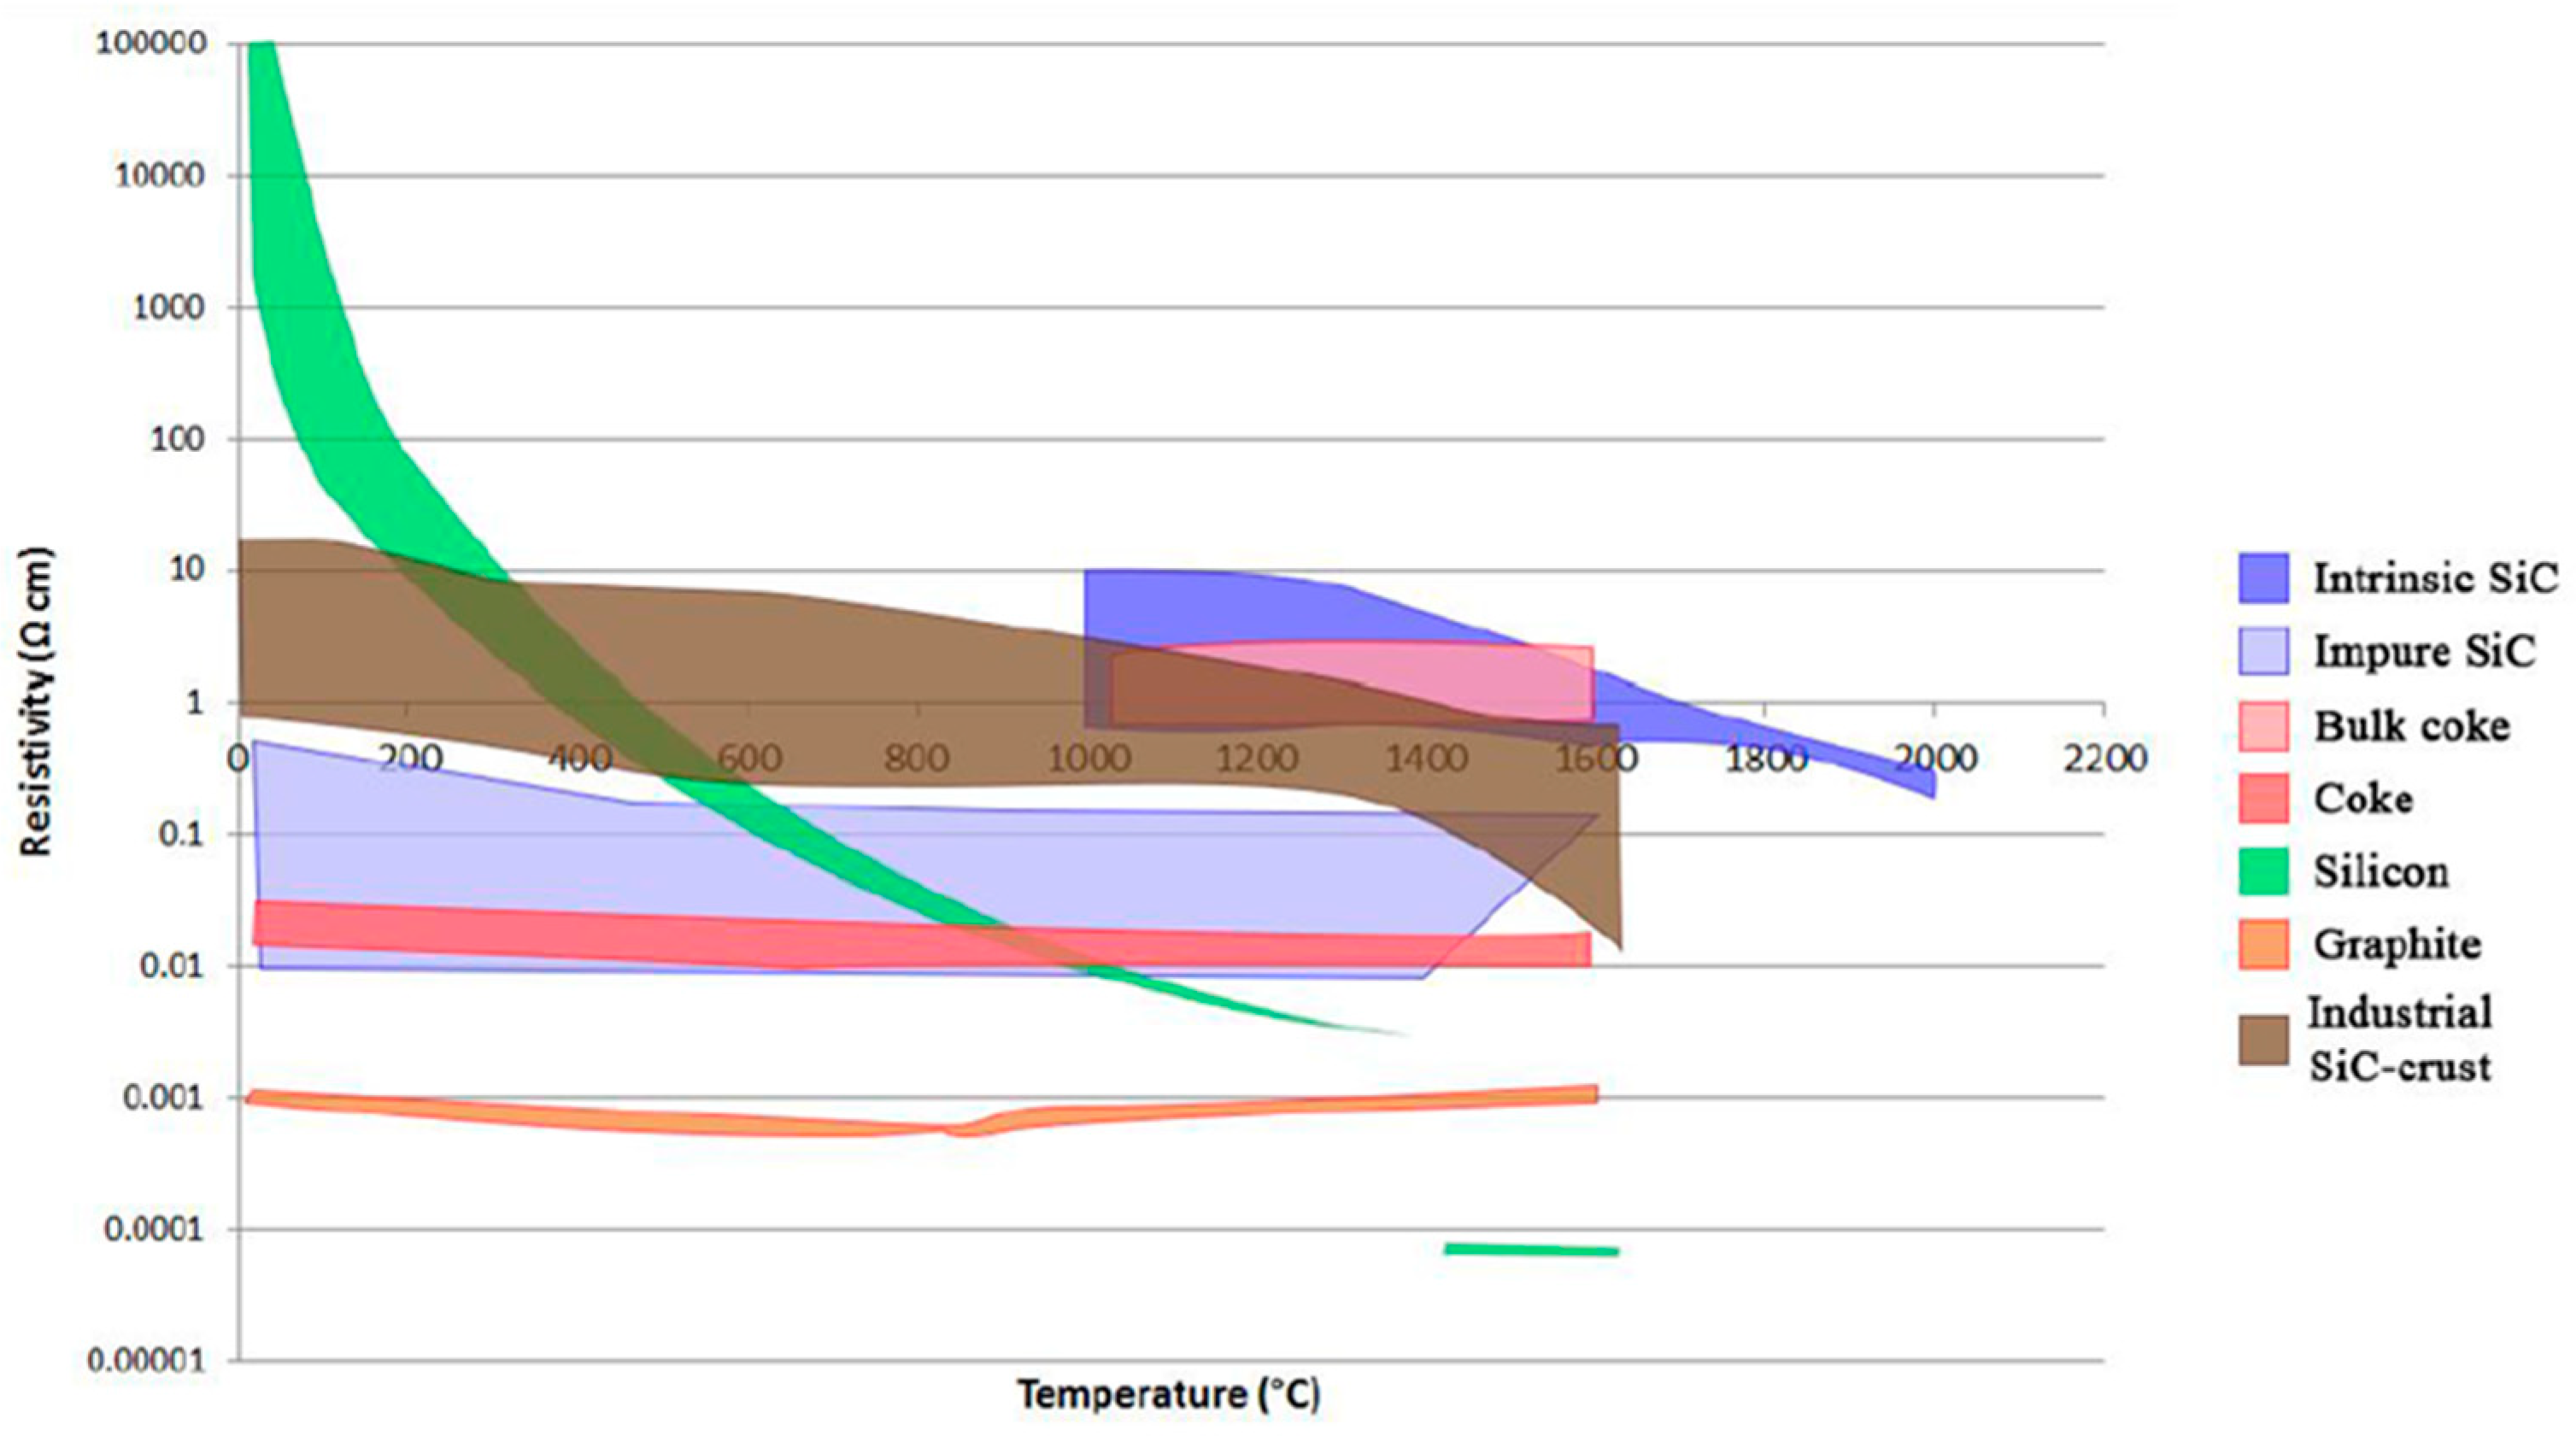
Krokstad [2] measured the material resistivity of industrial α-SiC crust samples and compared it to commercial samples found in the literature up to 1600 °C. The review of materials is summarized in Figure 1. He found that industrial α-SiC crust had a resistivity in the range of 1–10 mΩm at 1600 °C. The SiC crust had a higher resistivity than both liquid Si (0.001 mΩm) and the most conductive grades of commercial SiC (0.1–1000 mΩm) and had a lower resistivity than a cokebed (10–50 mΩm). Krokstad also found that even though there were large variations in composition in the SiC samples, the differences in resistivity were not significantly affected at high temperatures. He believed that increased silicon content and the state of the silicon (liquid) had the potential effect of lowering the resistivity, but believed additional investigations were needed to confirm the trend. Though not investigated directly in his work, he also speculated that the effect of porosity was significant, particularly at lower temperatures, and could account for the large ranges in resistivity of the material.
Table 1 shows a summary of the various values found in the literature for the bulk resistivity of carbon materials. Some units have been converted for clarity.
A bed of particles is usually not homogeneous and there is a constant balance between the material resistivity, contact resistance, and geometry. For example, the current traveling through a bed of particles will follow many possible paths throughout, so long as it travels through a series of conducting particles. However, since the bed is likely inhomogeneous, this can lead to localized breakthroughs of the voltage [5]. Although most setups are unique, there are general parameters used in previous studies that outline good practices for measuring bulk resistivity. Some factors which must be considered according to Singh [19] and as explained by Schei et al. [5] include sample preparation, temperature control, input current, and sufficient electrical contacts.
The four-point method is commonly used to measure resistivity. The four-point method introduces a separate measurement circuit in addition to the current supply. Following Bakken and Rash’s advice, the use of a voltmeter with a large internal resistance (usually several MΩ) for the measurement circuit, makes its current negligible. This essentially eliminates contact resistance between the sample and the electrical contacts. The resistance (R) is measured through the voltage drop (V), and from Equation (6) the bulk resistivity ( can be calculated [10] where the area is (A) the height of the bed is (h) and the current is (I). As current is applied the voltage drop is measured over the distance between the conductors, also known as the height of the bulk. From there the specific resistance can be calculated via Ohm’s law (Equation (5)).
This work aims to investigate the bulk resistivity of materials in the Si furnace using both partially transformed carbon materials and raw charge mixes. In this study, the impact of temperature, SiC and Si content, and the addition of insulating charge materials are investigated using carbon materials as a base. The materials were treated under similar conditions to the industrial furnace. The objectives were specifically to confirm the previous literature regarding the bulk resistivity of carbon materials and investigate the effect of present temperature and heat treatment temperature. The carbon materials were then partially transformed to SiC with SiO gas, and the bulk resistivity was investigated. Finally, mixtures of carbon with quartz and silica–iron ore were investigated to study the impact on the bulk resistivity of mixing conductive charge and non-conductive charge at high temperatures.
2. Materials and Methods
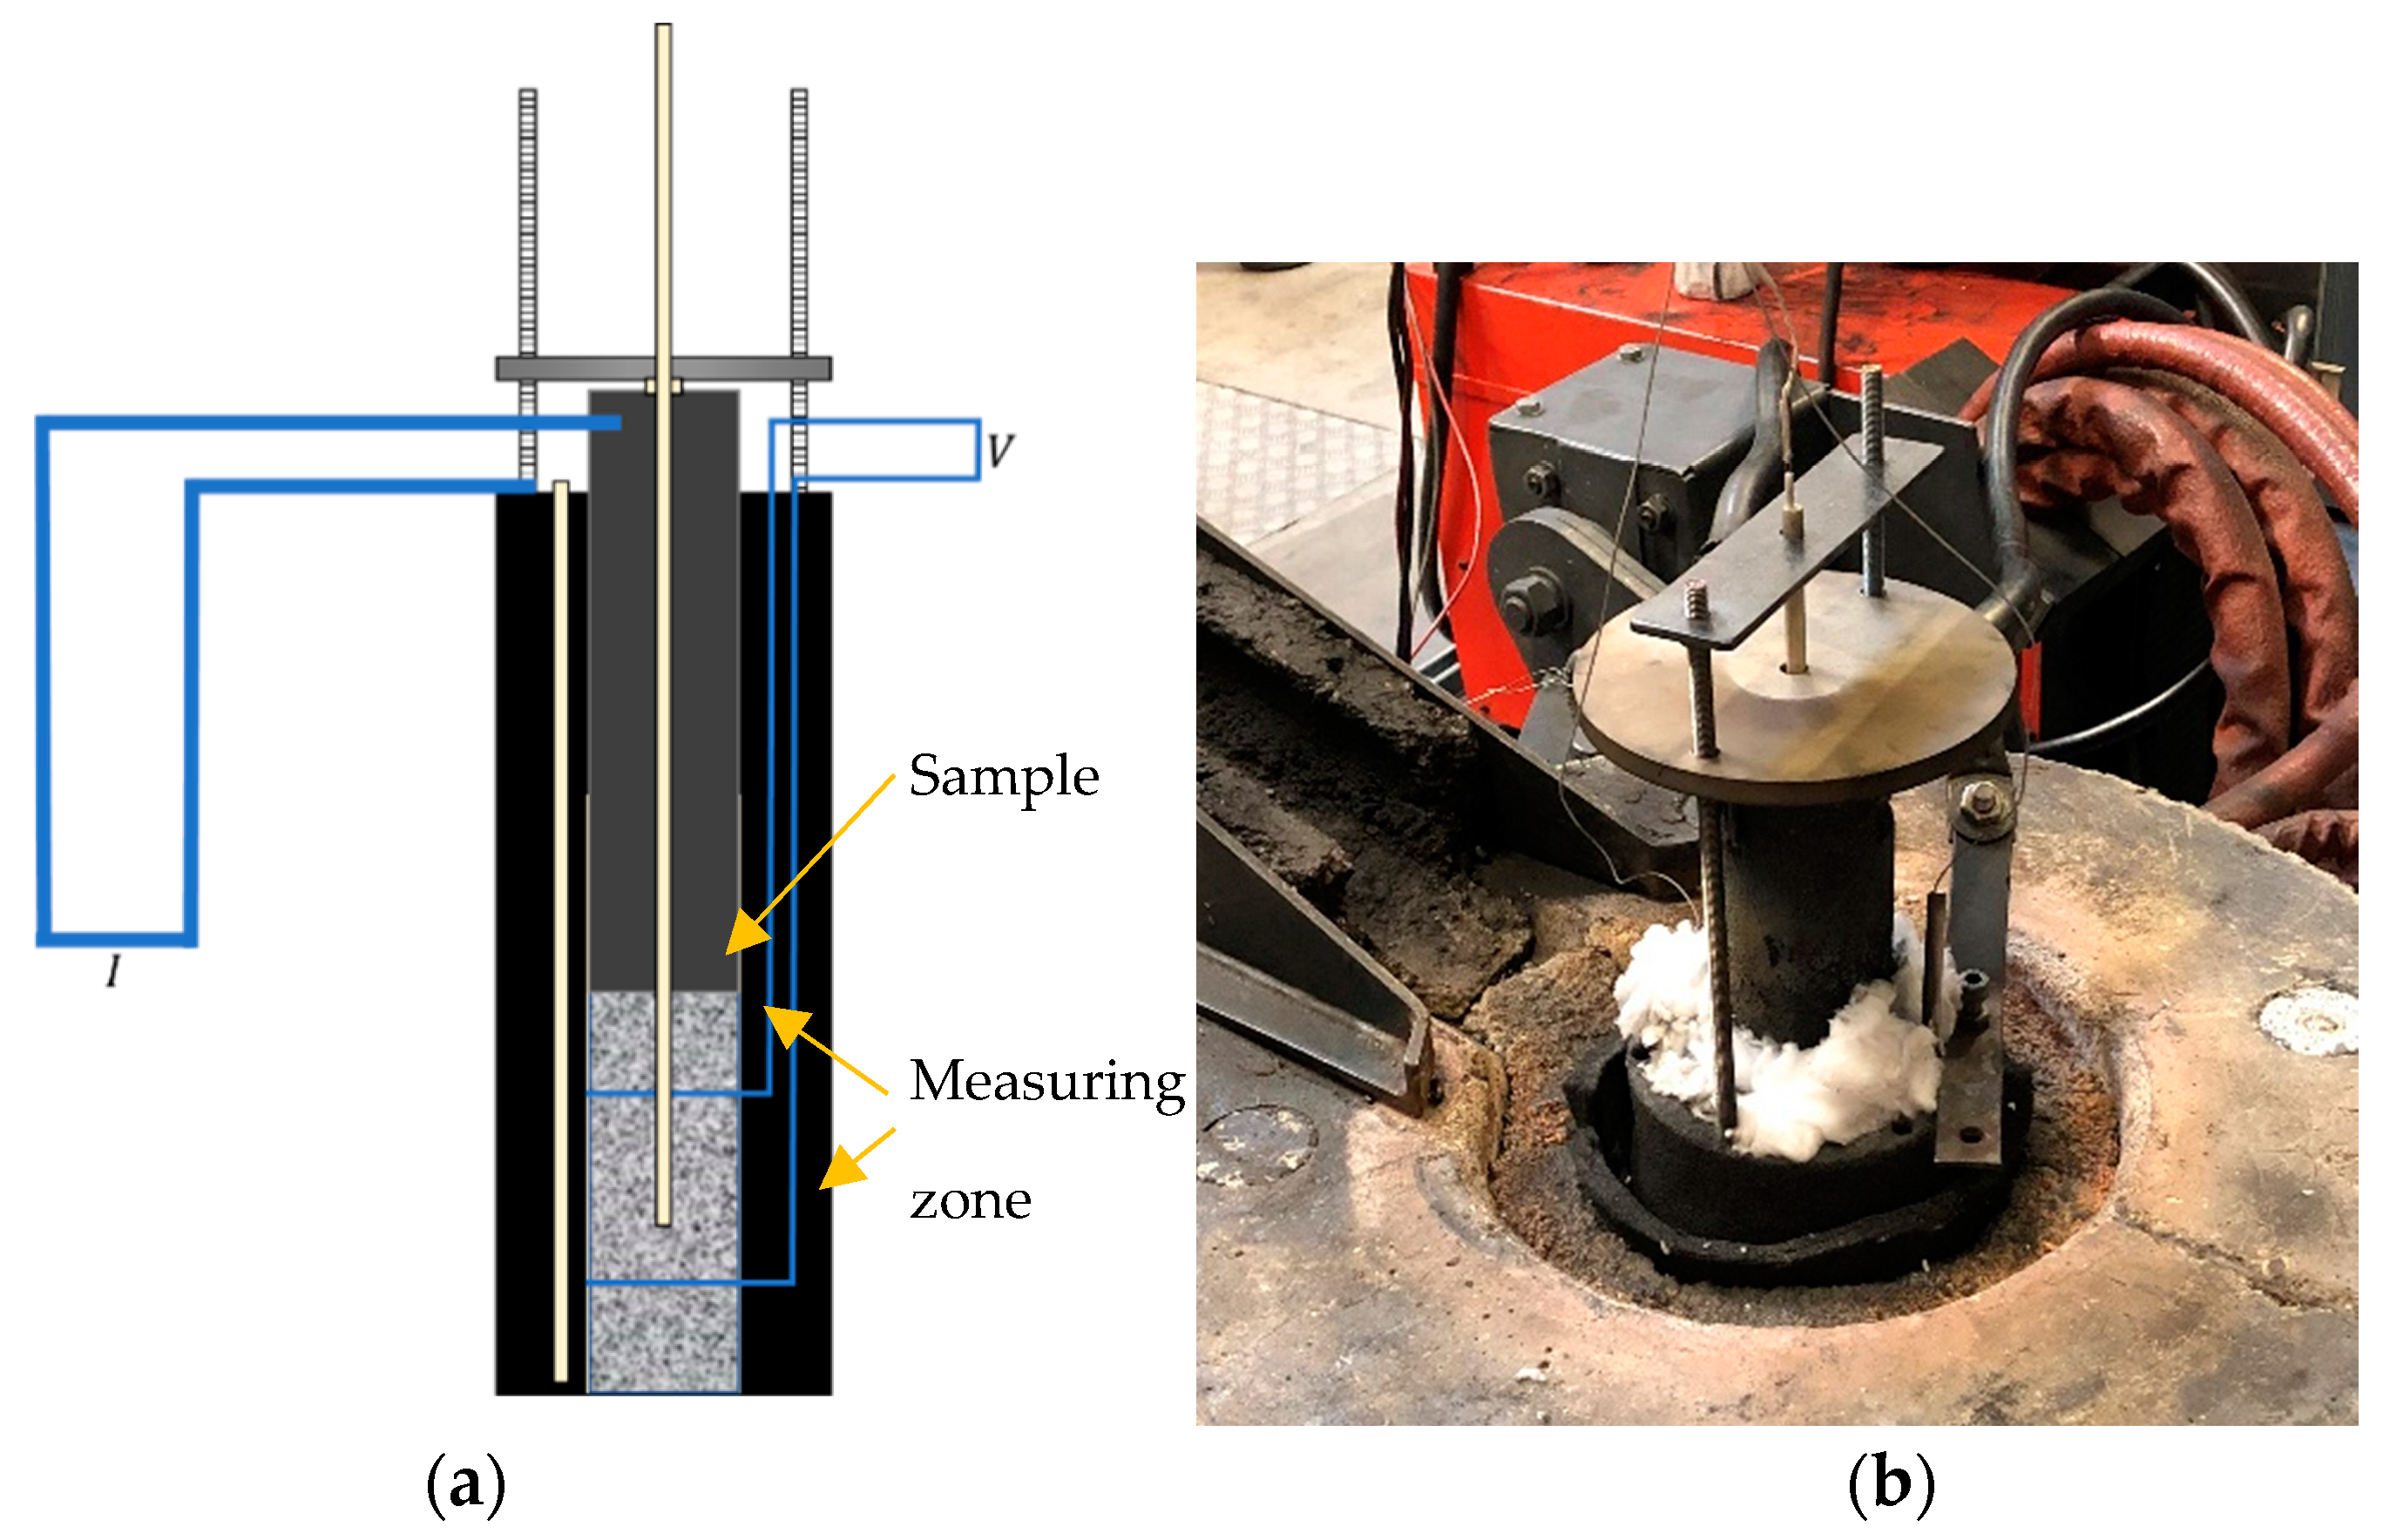
The experimental setup for bulk resistivity measurements is shown in Figure 2. This method is based on the work of Pedersen [14]. The entire setup is placed in an induction furnace. Contained within the graphite crucible is an alumina crucible which acts to insulate the charge from the graphite crucible walls. A four-point measurement system is used to eliminate contact resistance between the samples and the electrical contact points by measuring voltage and current in two different places [10]. Molybdenum (Mo) wires are placed across the length of the alumina crucible (8 cm wide) 10 cm apart from each other and the sample is loaded to cover both wires to measure the resistivity of the bulk. For some of the experiments, the setup is altered to 8 cm instead of 10 cm due to the lack of partially transformed materials, and no significant difference was found between the two distances. The main thermocouple is placed through the top electrode and embedded in the center of the sample. An additional thermocouple is placed between the alumina crucible and the inside of the graphite crucible. This thermocouple controls the heating rate of the furnace to ensure the stability of the equipment. A stainless-steel weight sits atop the graphite block to provide even total pressure. The graphite block acts as the top electrode, with the bottom of the graphite crucible acting as the bottom electrode.
To reduce the variations in the measurements, the sample is manually compacted by dropping the setup onto Styrofoam from a height of 10 cm for 40 drops. The experimental procedure applies current in pulses every 25 °C so the voltage drop between the two wires can be measured. The resistance is calculated from the average voltage and current.
The total list of materials tested in this work is shown in Table 2, split into 3 sections for clarity beginning with the carbon materials, followed by the carbon that has been partially transformed to SiC, and finally the charge mixtures. For the charge mixes, the relative weight ratios of the materials are listed. The proportions were calculated based on available data from the literature to produce 1 ton of silicon and FeSi65. The amount of woodchip was reduced due to the large volume change that was expected to reduce the volume of the sample below the measuring zone. The notation “HT” means the material was heat-treated beforehand. The chemical analysis of the quartz and silica–iron ore used in the charge mixture experiments are shown in Table 3 and Table 4. Particle size for all experiments was 4–8 mm, except for the charge mixtures with quartz, which were 4–10 mm.
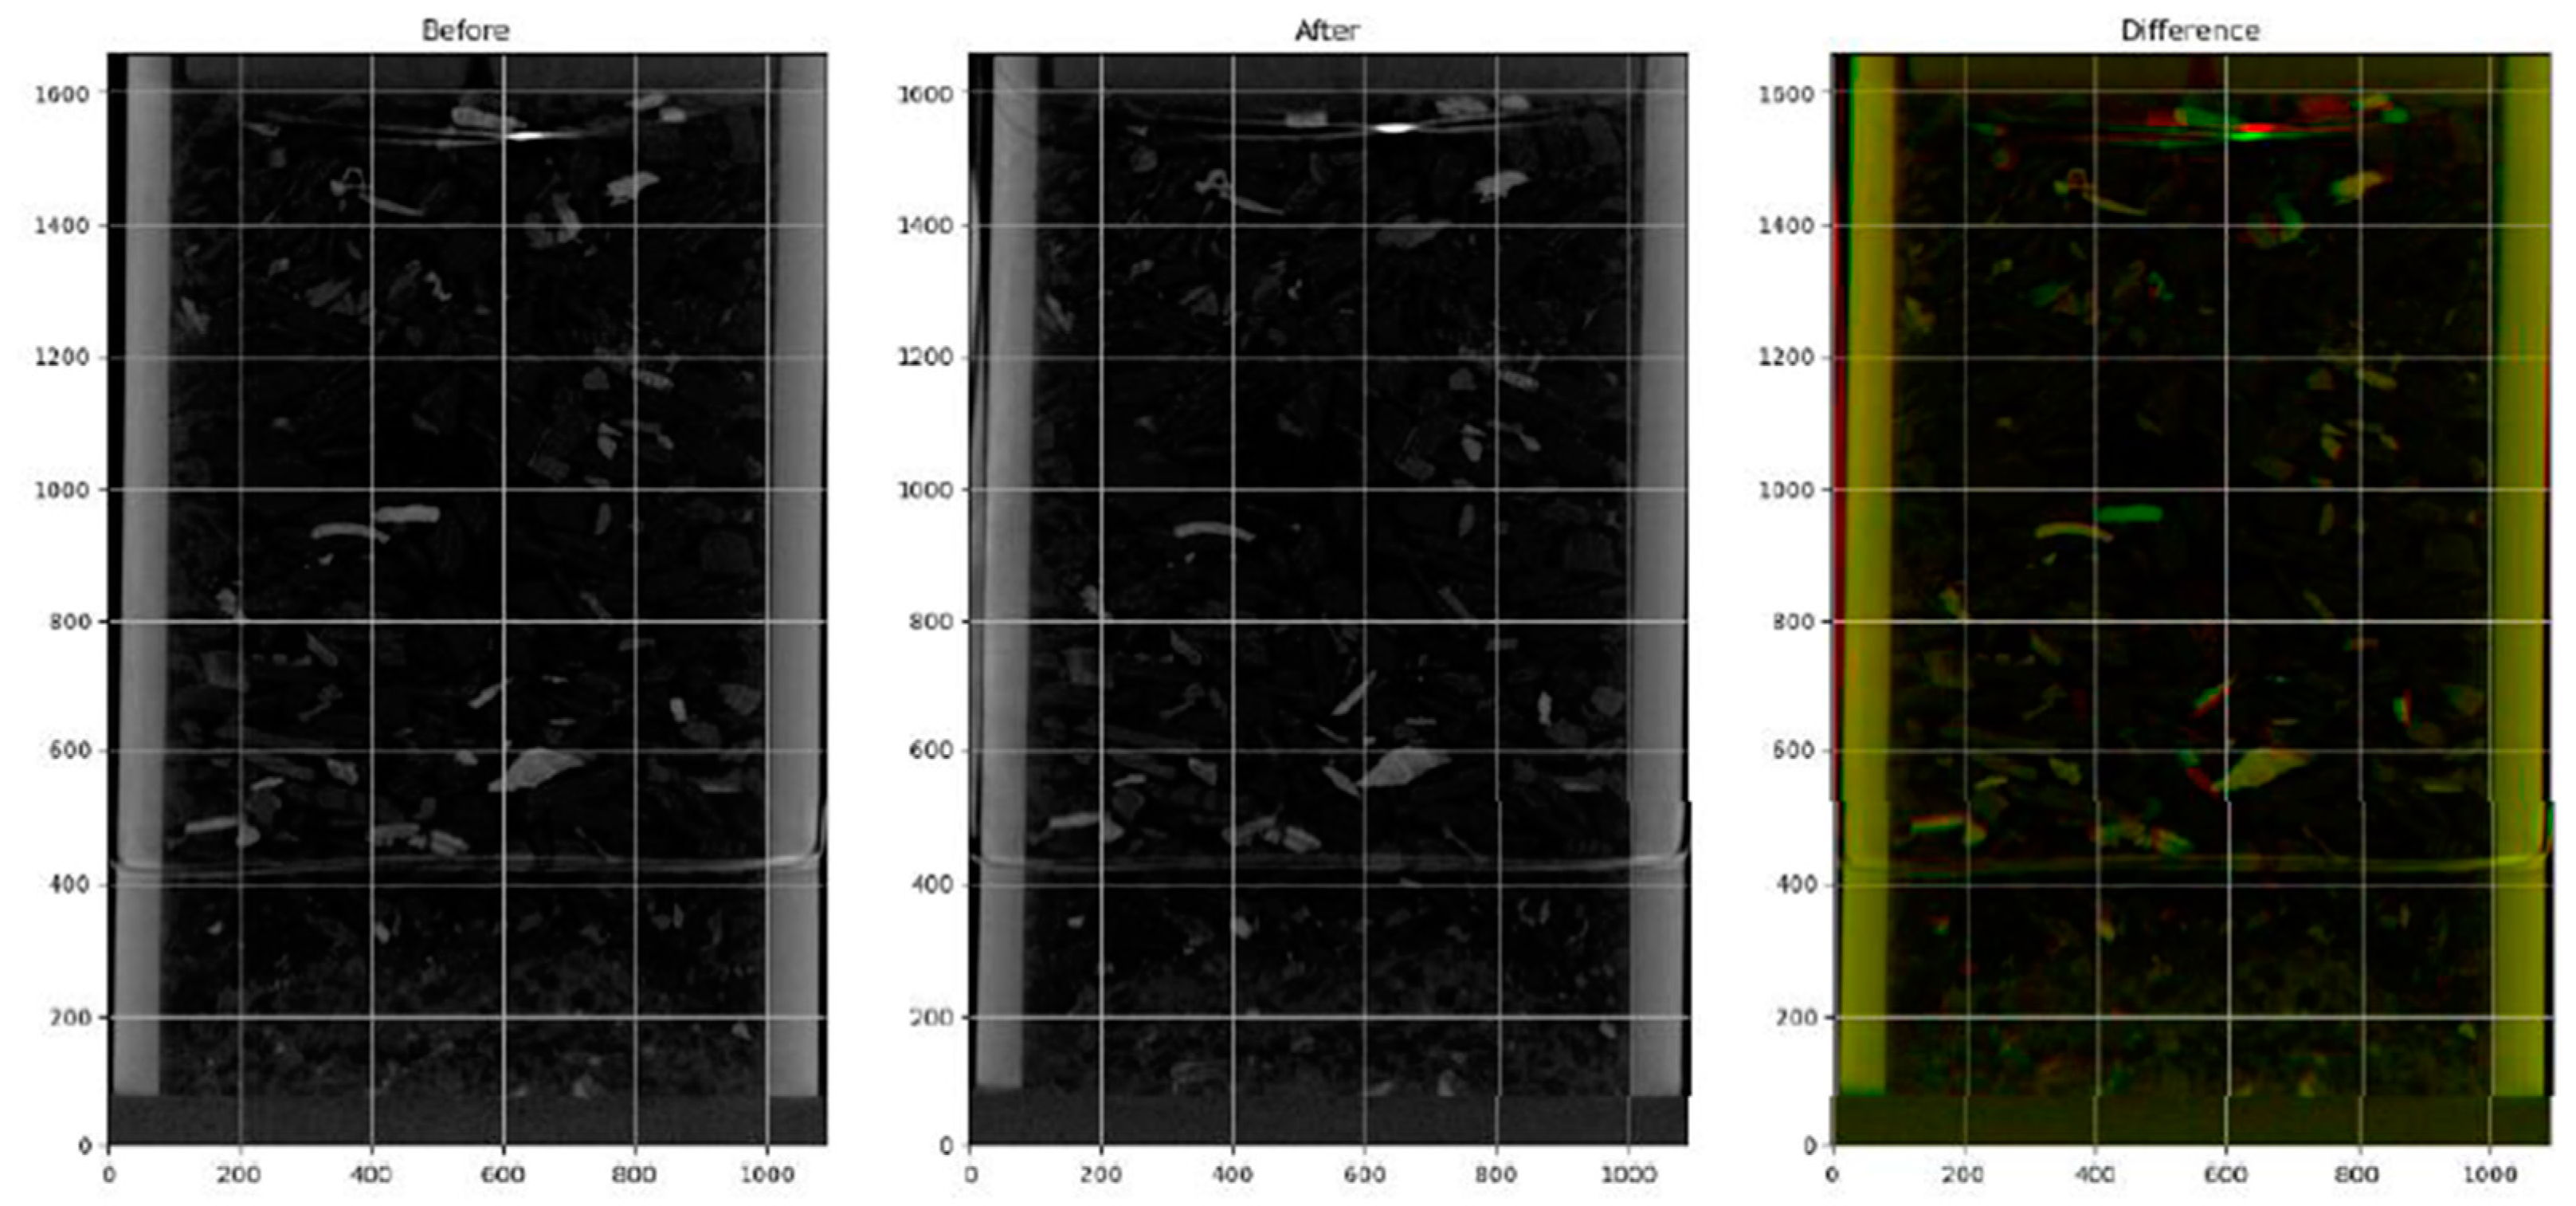
Computed tomography (CT) [20] was used to take images of the resistivity setup before and after the measurements. CT is a non-invasive imaging method where the instrument rotates an object between an X-ray generator and a detector. A series of 2D images is then reconstructed using Nikon CT Pro 3Dsoftware to give a 3D model. The scans were taken to evaluate the potential changes occurring during resistivity measurement that may affect the results. This includes changes in the wiring, placement of the thermocouples, shifting of material or the alumina tube, and notable particles or signs of a chemical reaction.
To quantitatively determine the difference between the bed before and after, a method was developed that included the following steps:
- Aligning the images using landmarks such as the alumina cylinder and the molybdenum wires.
- Converting the dataset to binary using a given threshold to determine if a voxel contained a particle and assigning it a “1” value if yes and a “0” value if not.
- Subtracting the after from the before scan, where if there is no change, black is coded, a particle “appears” in the after is green, and a “disappearing particle” is red.
Chemical analysis and electron probe micro-analyzer wavelength dispersive spectroscopy (EPMA WDS) were used to characterize the SiC, C, and Si content of the materials and the slag composition in the charge mixes, respectively. Chemical analysis was carried out by Degerfors Lab (D-Lab). From D-Lab, the values of free carbon, total carbon, and total Si were given and the amount of SiC, C, and Si were calculated based on Equations (7)–(9), which were also used by [21]. The free Si is measured using X-ray fluorescence (XRF). The total carbon is measured using LECO CS-444 and the free carbon using LECO RC-612. An electron probe micro-analyzer (EPMA) was used to identify different phases and specific compositions for mixed samples. Sample particles were cast in iodoform epoxy to give better contrast. EPMA works similarly to scanning electron microscopy (SEM) but is more precise in its quantitative analysis using wavelength dispersive spectroscopy (WDS) [22]. The following equations are used:
3. Results and Discussions
The resistivity curves for each grouping of materials are shown from 1000 to 1600 °C. The high-temperature area was chosen due to its increased relevance for the Si process. At lower temperatures, the resistivity will be higher and have higher variation.
3.1. Resistivity of Carbon Materials
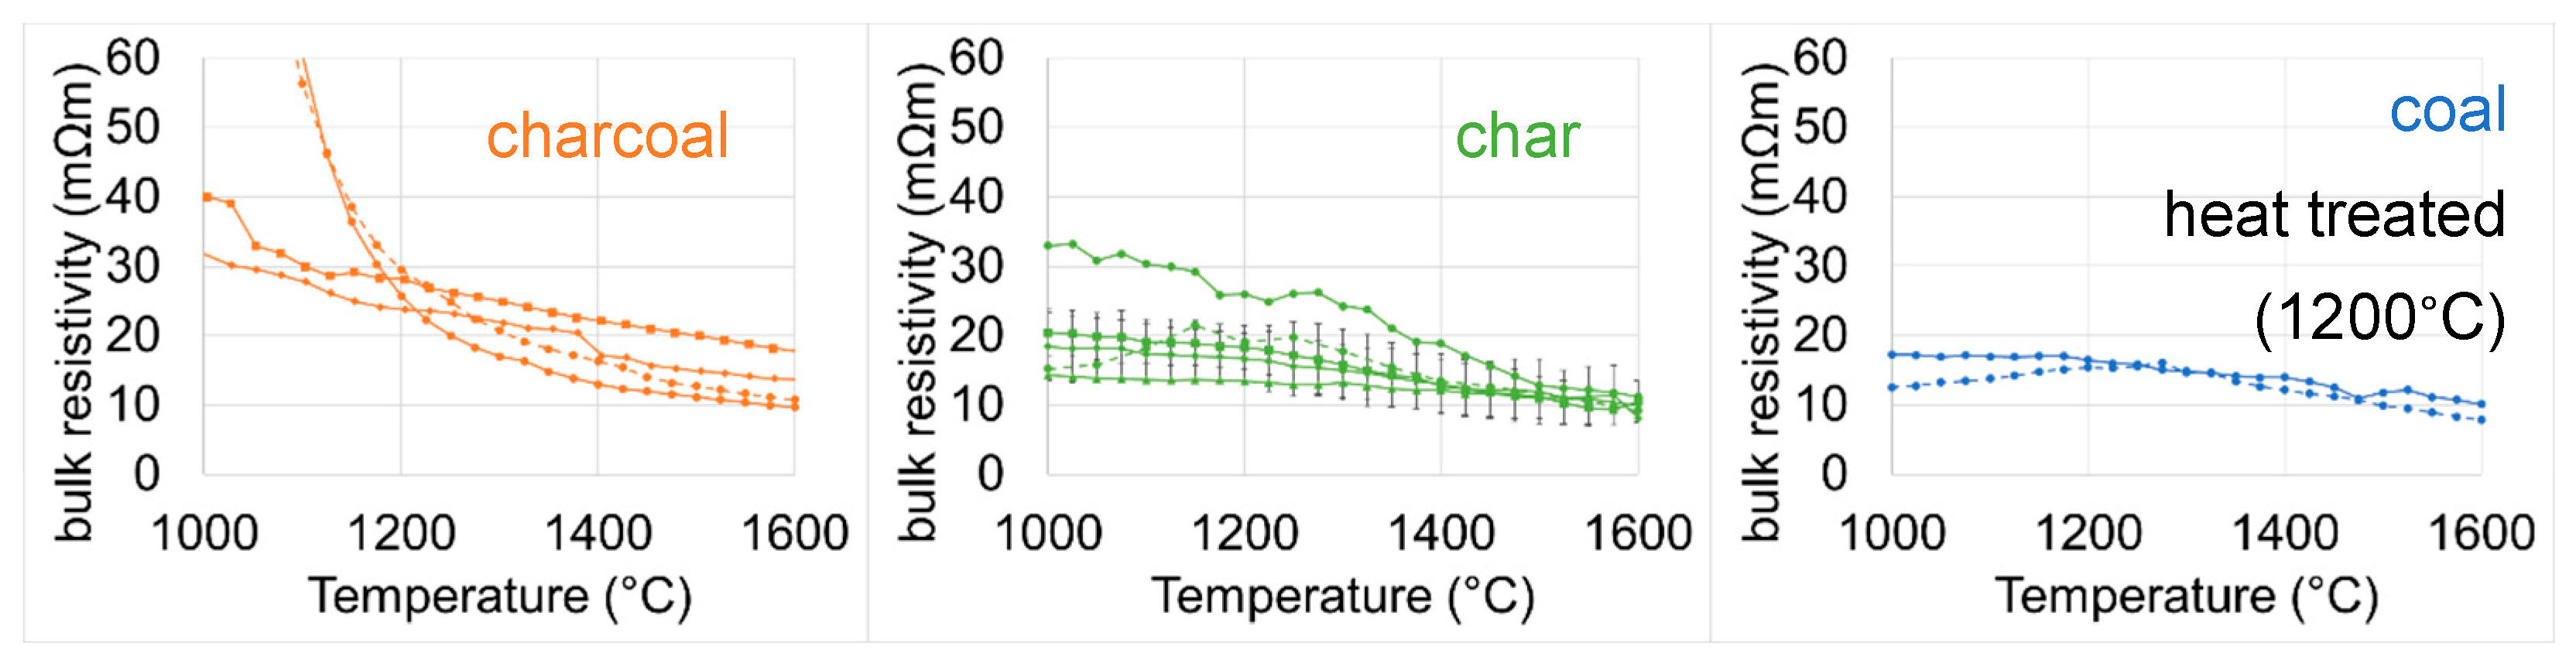
Figure 3 shows the resistivity range of all the carbon materials (heat-treated coal, char, and charcoal) versus temperature. Char is shaded in green and includes both heat-treated and untreated char from three sources, charcoal is orange and includes two industrial charcoals and one that was made in the lab, and coal is blue and includes only heat-treated coal from one source. The dotted lines indicate the results are from Pedersen’s measurements of the same materials [13]. The results show reasonable grouping among the various carbon materials, regardless of if the material was char A or char B for example. There is a difference if the material was heat-treated, as the presence of volatiles will increase the resistivity. The heat-treated chars and the coal had similar resistivity throughout the temperature range. Charcoal, on the other hand, was non-conductive until around 1000 °C, where the resistivity then decreases rapidly with increasing temperature. At 1600 °C, there is an area where all three materials overlap that ranges between 10 and 15 mΩm, except for the homemade charcoal. These results agree with [9,10,13] at similar temperatures and particle sizes. Overall, the charcoals have the highest resistivity over the temperature range, and the heat-treated chars and coal seem to be within the same range of each other. This could be because only one type of coal was tested.
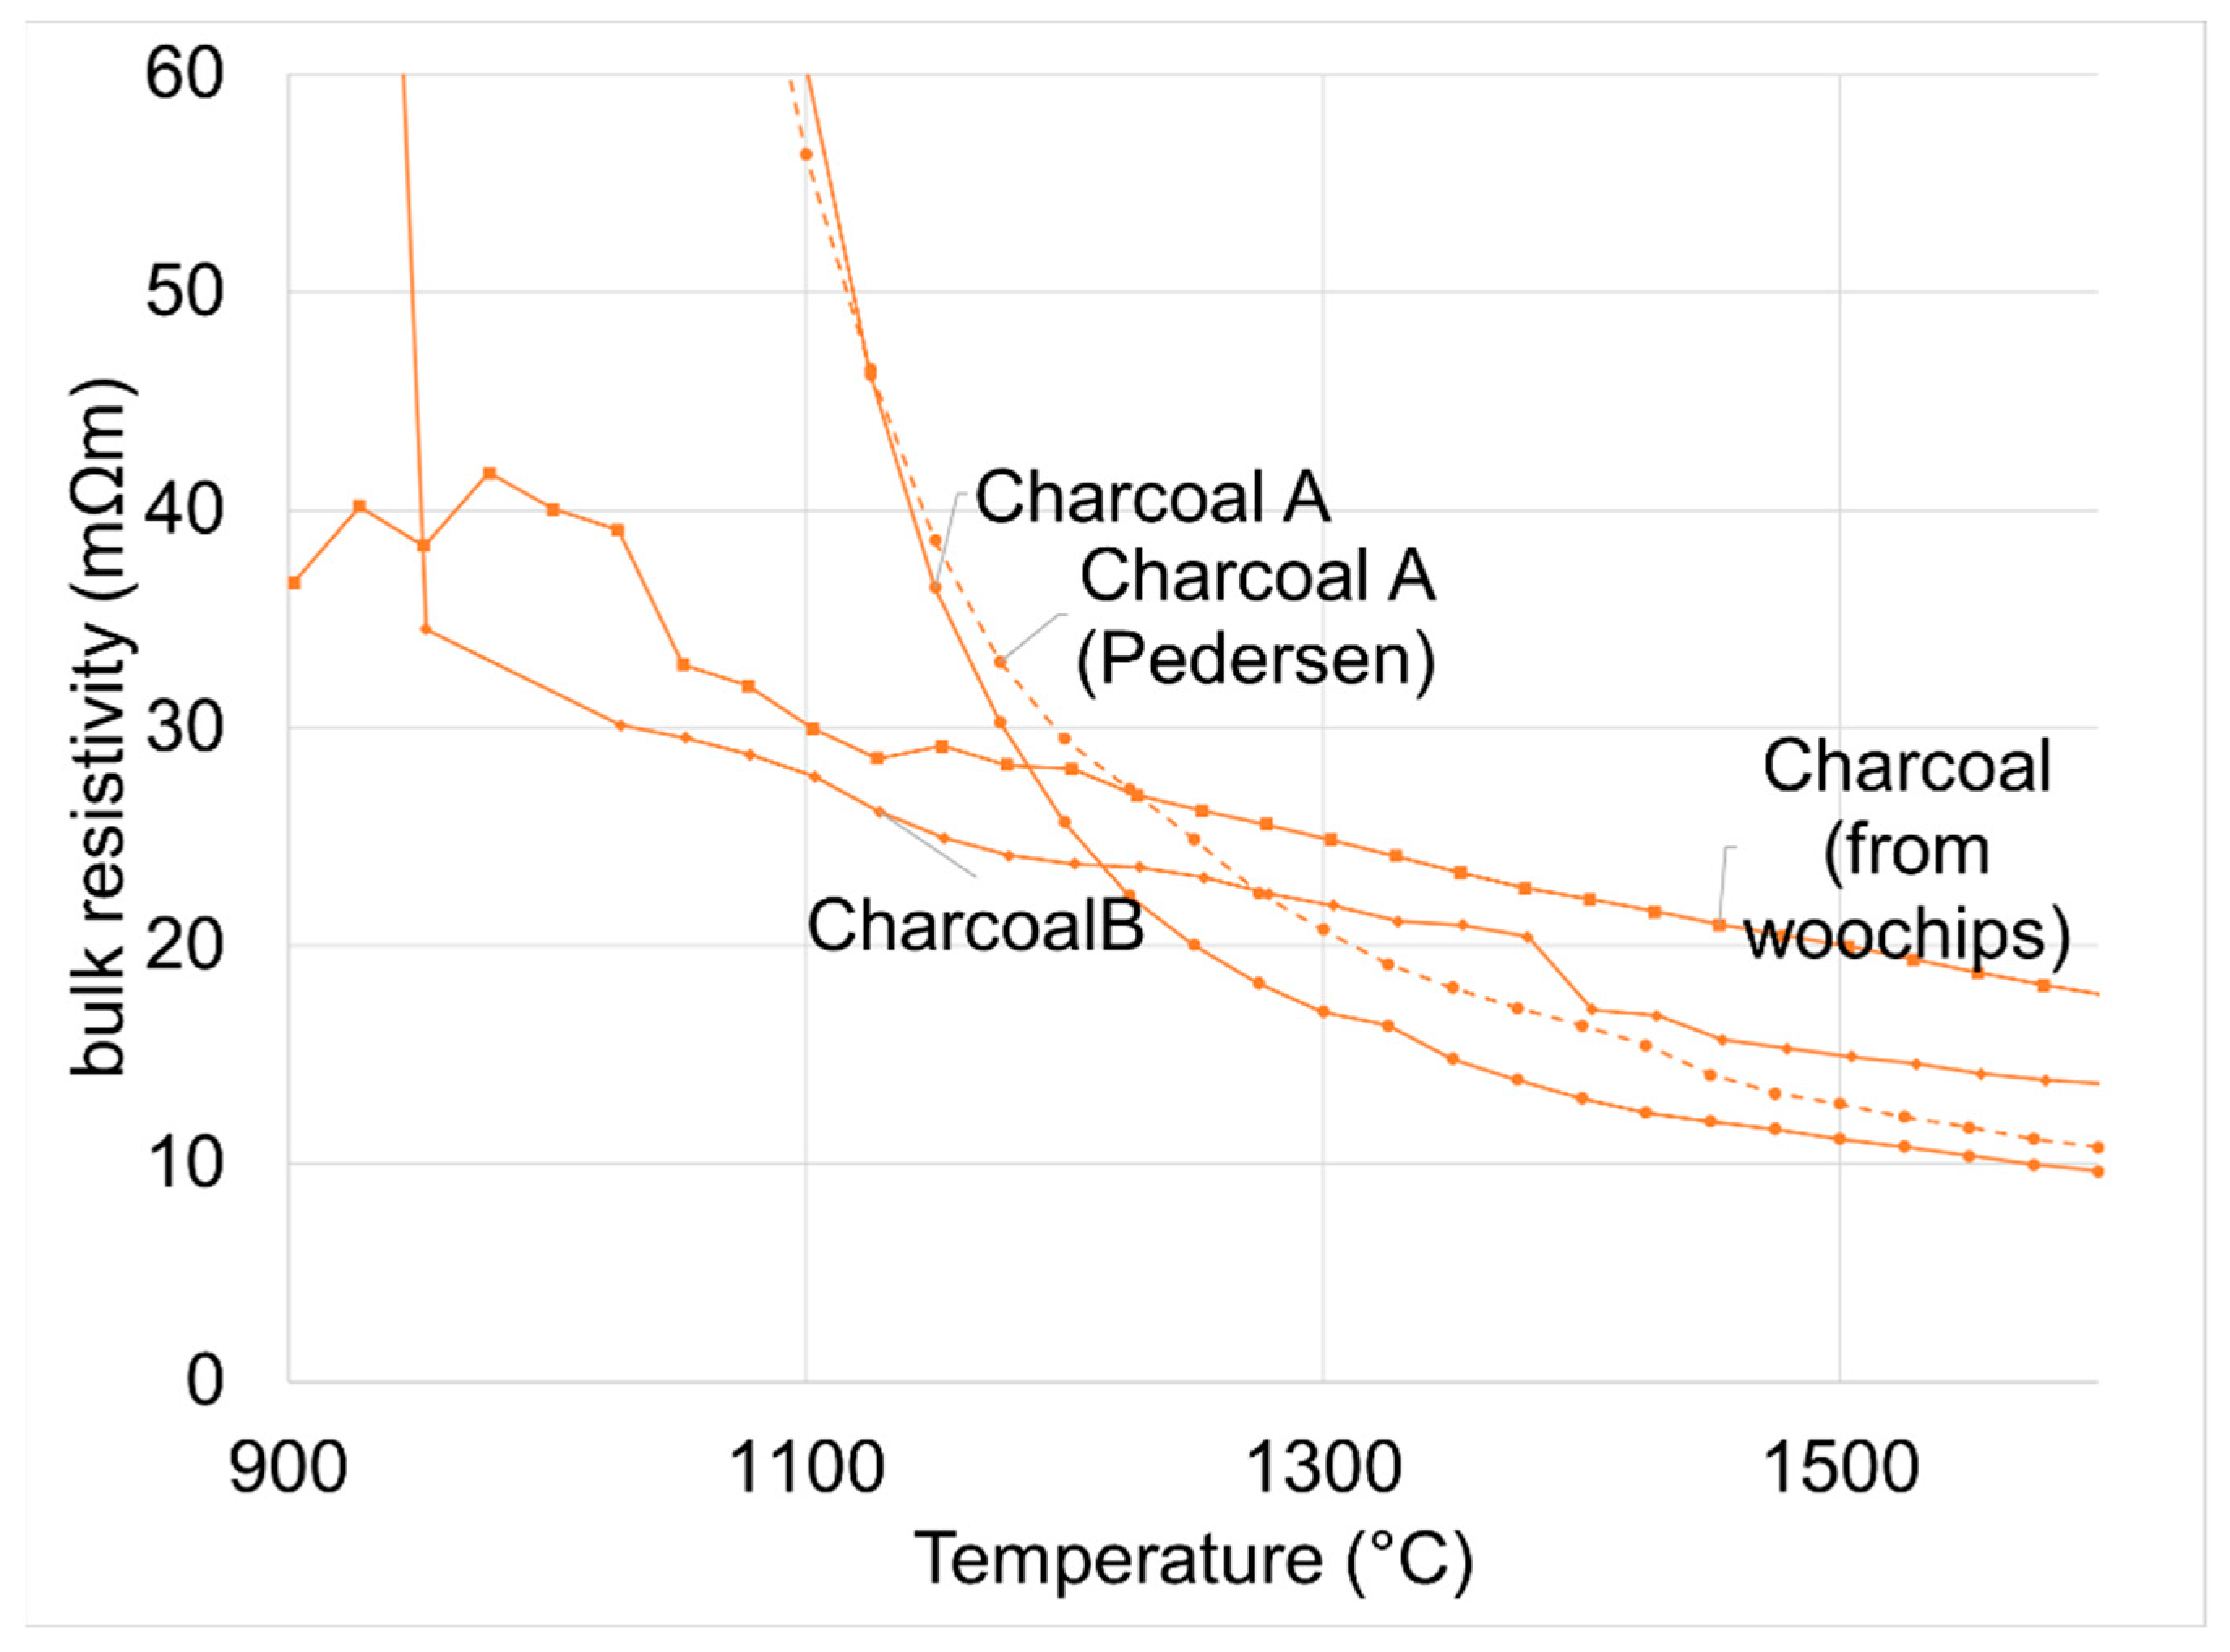
Figure 4 shows the charcoals with a larger temperature range. The “homemade” charcoal from recovered woodchips had a higher resistivity than the industrial charcoals after around 1200 °C, but it was conductive over the entire temperature range. This is likely because the “homemade” charcoal has been essentially heat-treated at 1600 °C, compared to charcoal’s typical manufacturing process. This resulted in a higher fixed carbon and lower volatiles, as can be seen in Table 3, shown with just the charcoals below. CharcoalA shows similar results to the same material measured by Pedersen. CharcoalB shows a similar trend to other charcoals, where a steep decrease is seen as the material becomes conductive as 1000 °C is approached. However, in the CharcoalB sample, this sudden drop in resistivity happens at a lower temperature, closer to 900 °C.
Figure 5 shows the resistivity of three types of char. The graph on the left shows untreated material and the graph on the right shows chars that were heat-treated at 1200 °C for approximately 10 min in batches before the experiments. The untreated samples include CharA and CharC. CharA has a higher resistivity than CharC, whereas CharC, despite being untreated, has a similar resistivity to the heat-treated chars. According to Table 3, shown below with the chars, CharC has a lower volatile content than CharA, and therefore the resistivity could be less sensitive to temperature, similar to what is seen in the heat-treated materials, which presumably had most of their volatiles released during the previous heat treatment and not during the resistivity measurement. CharC also has the highest ash content, but this does not show any effect. At 1600 °C, all chars fall into the range of 7–11 mΩm.
3.2. Resistivity of SiC Materials
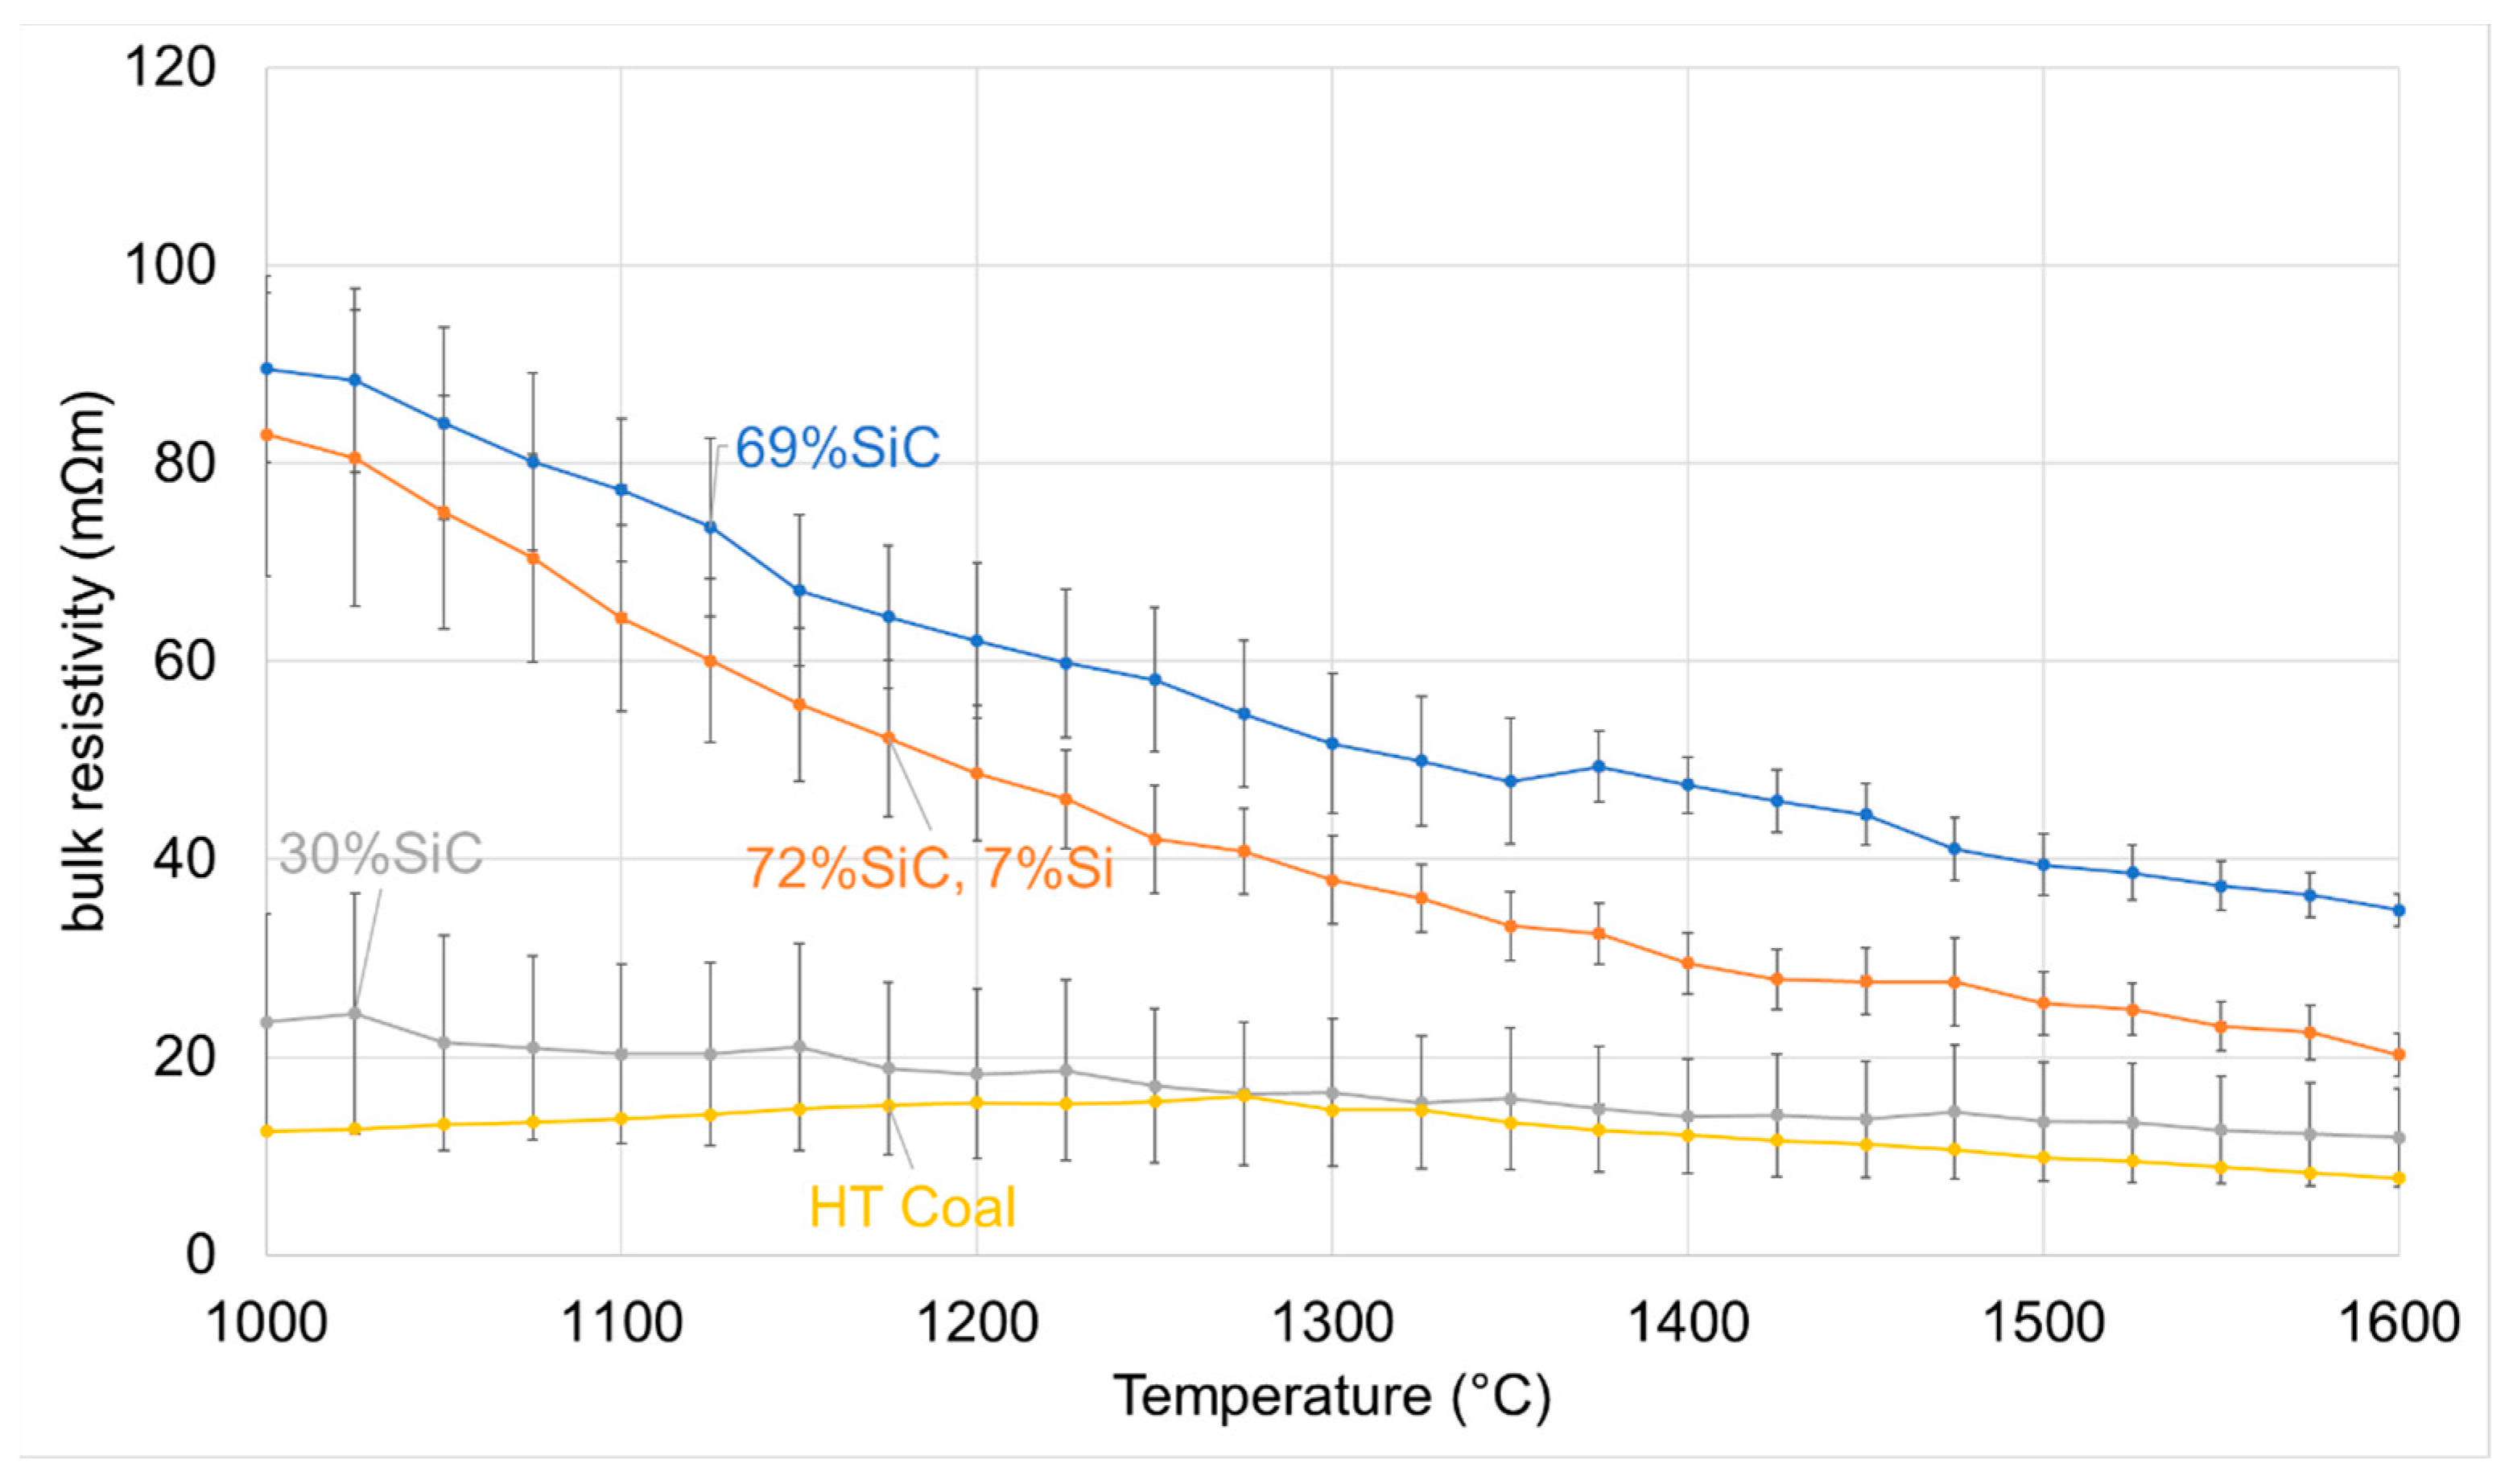
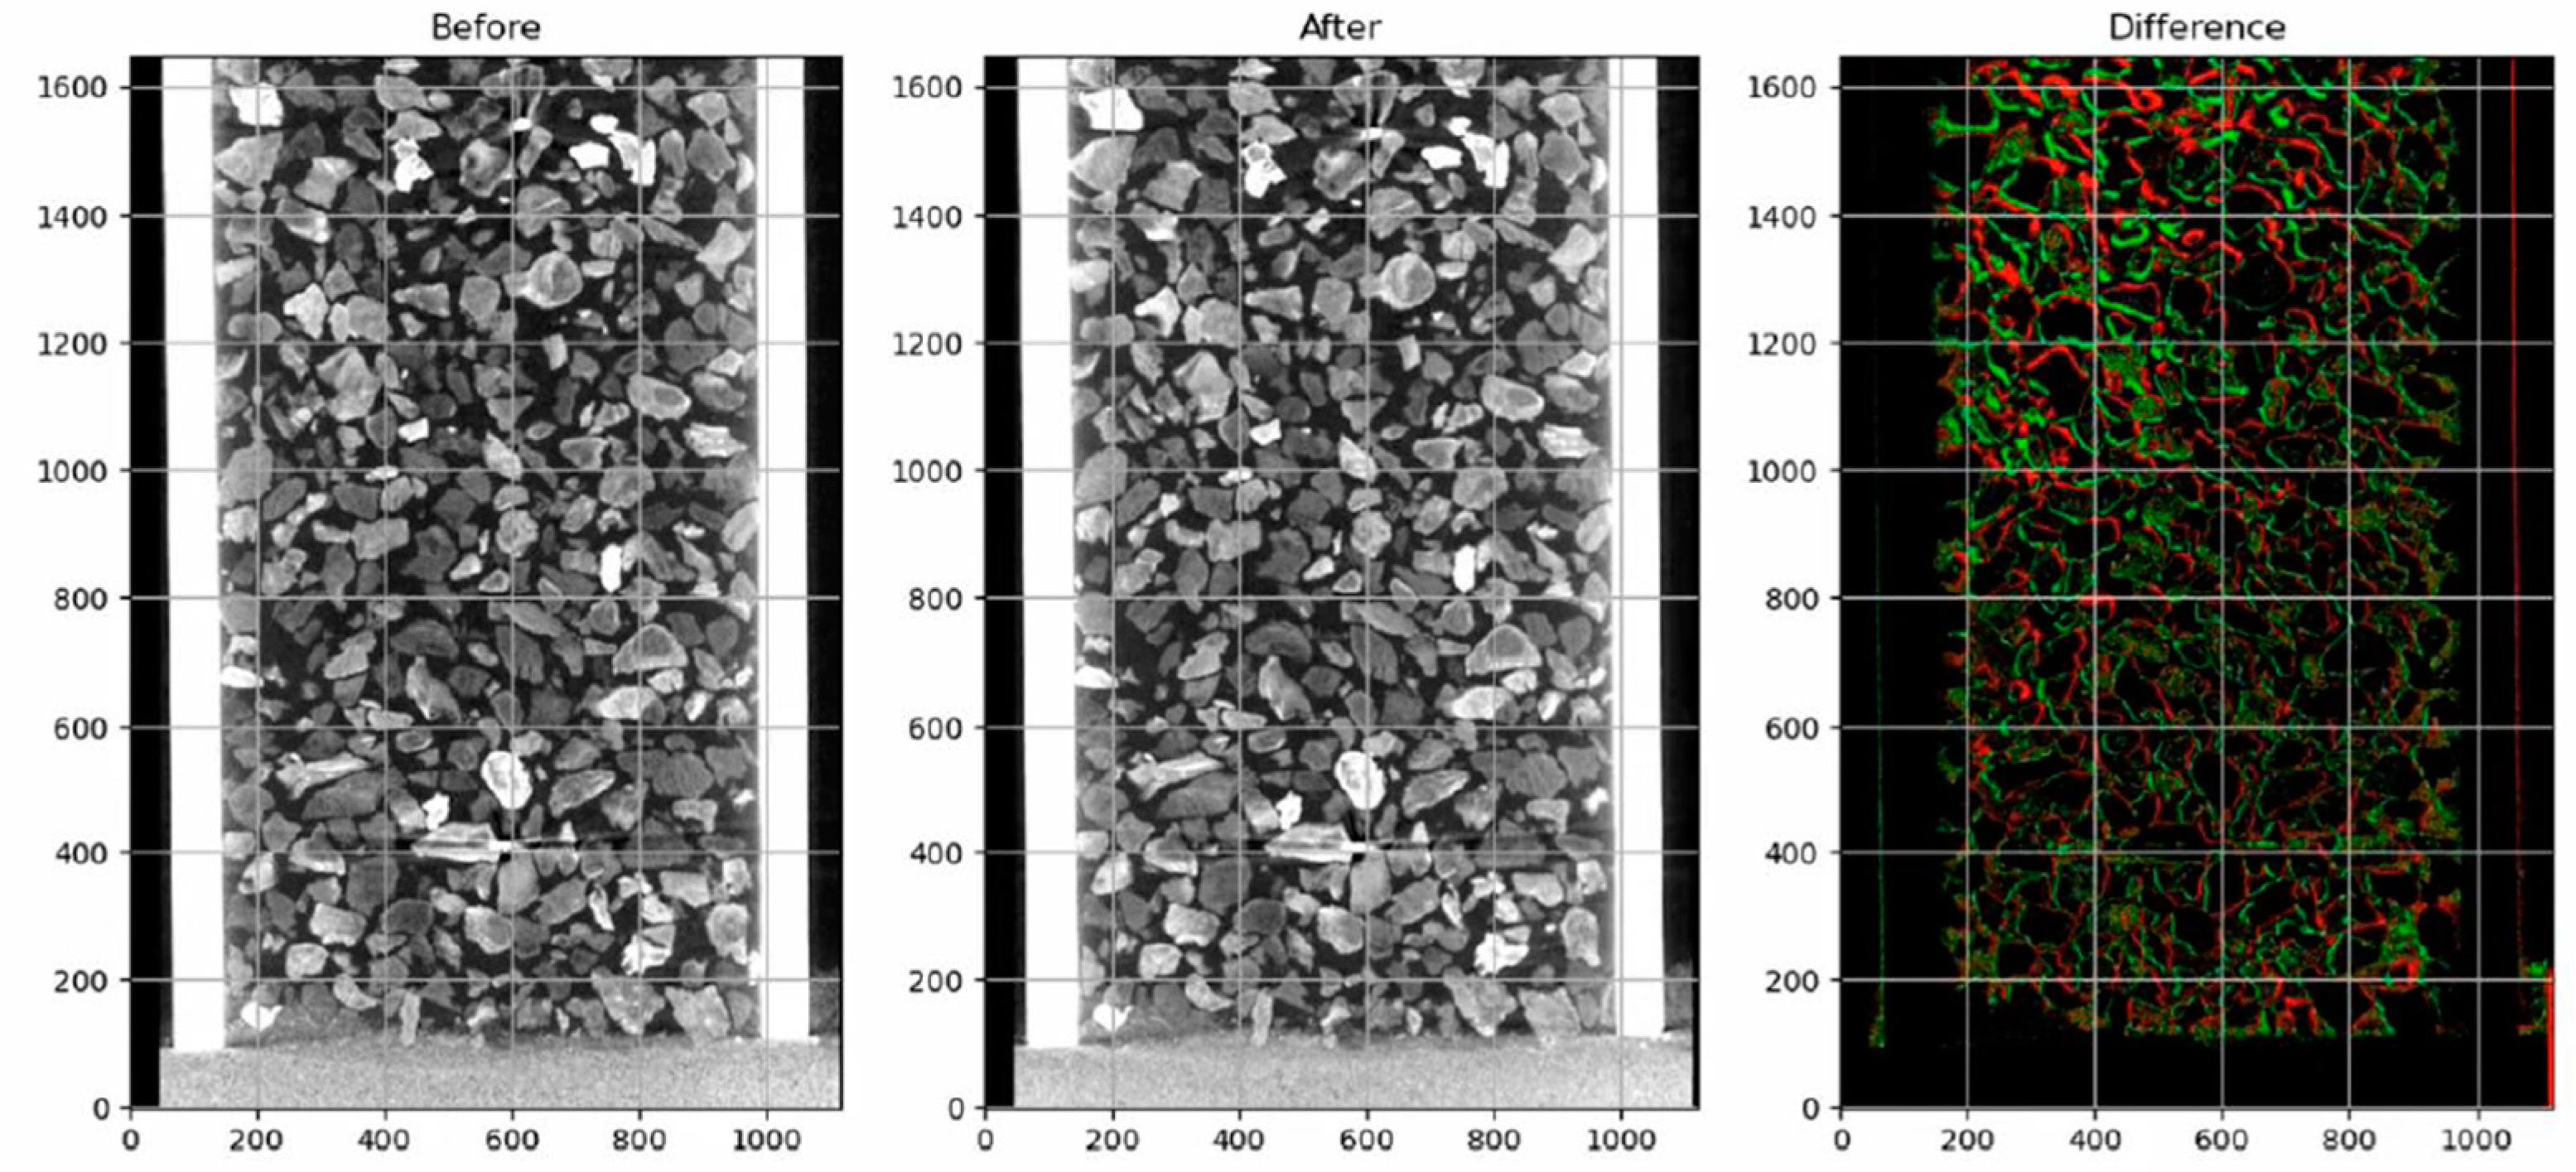
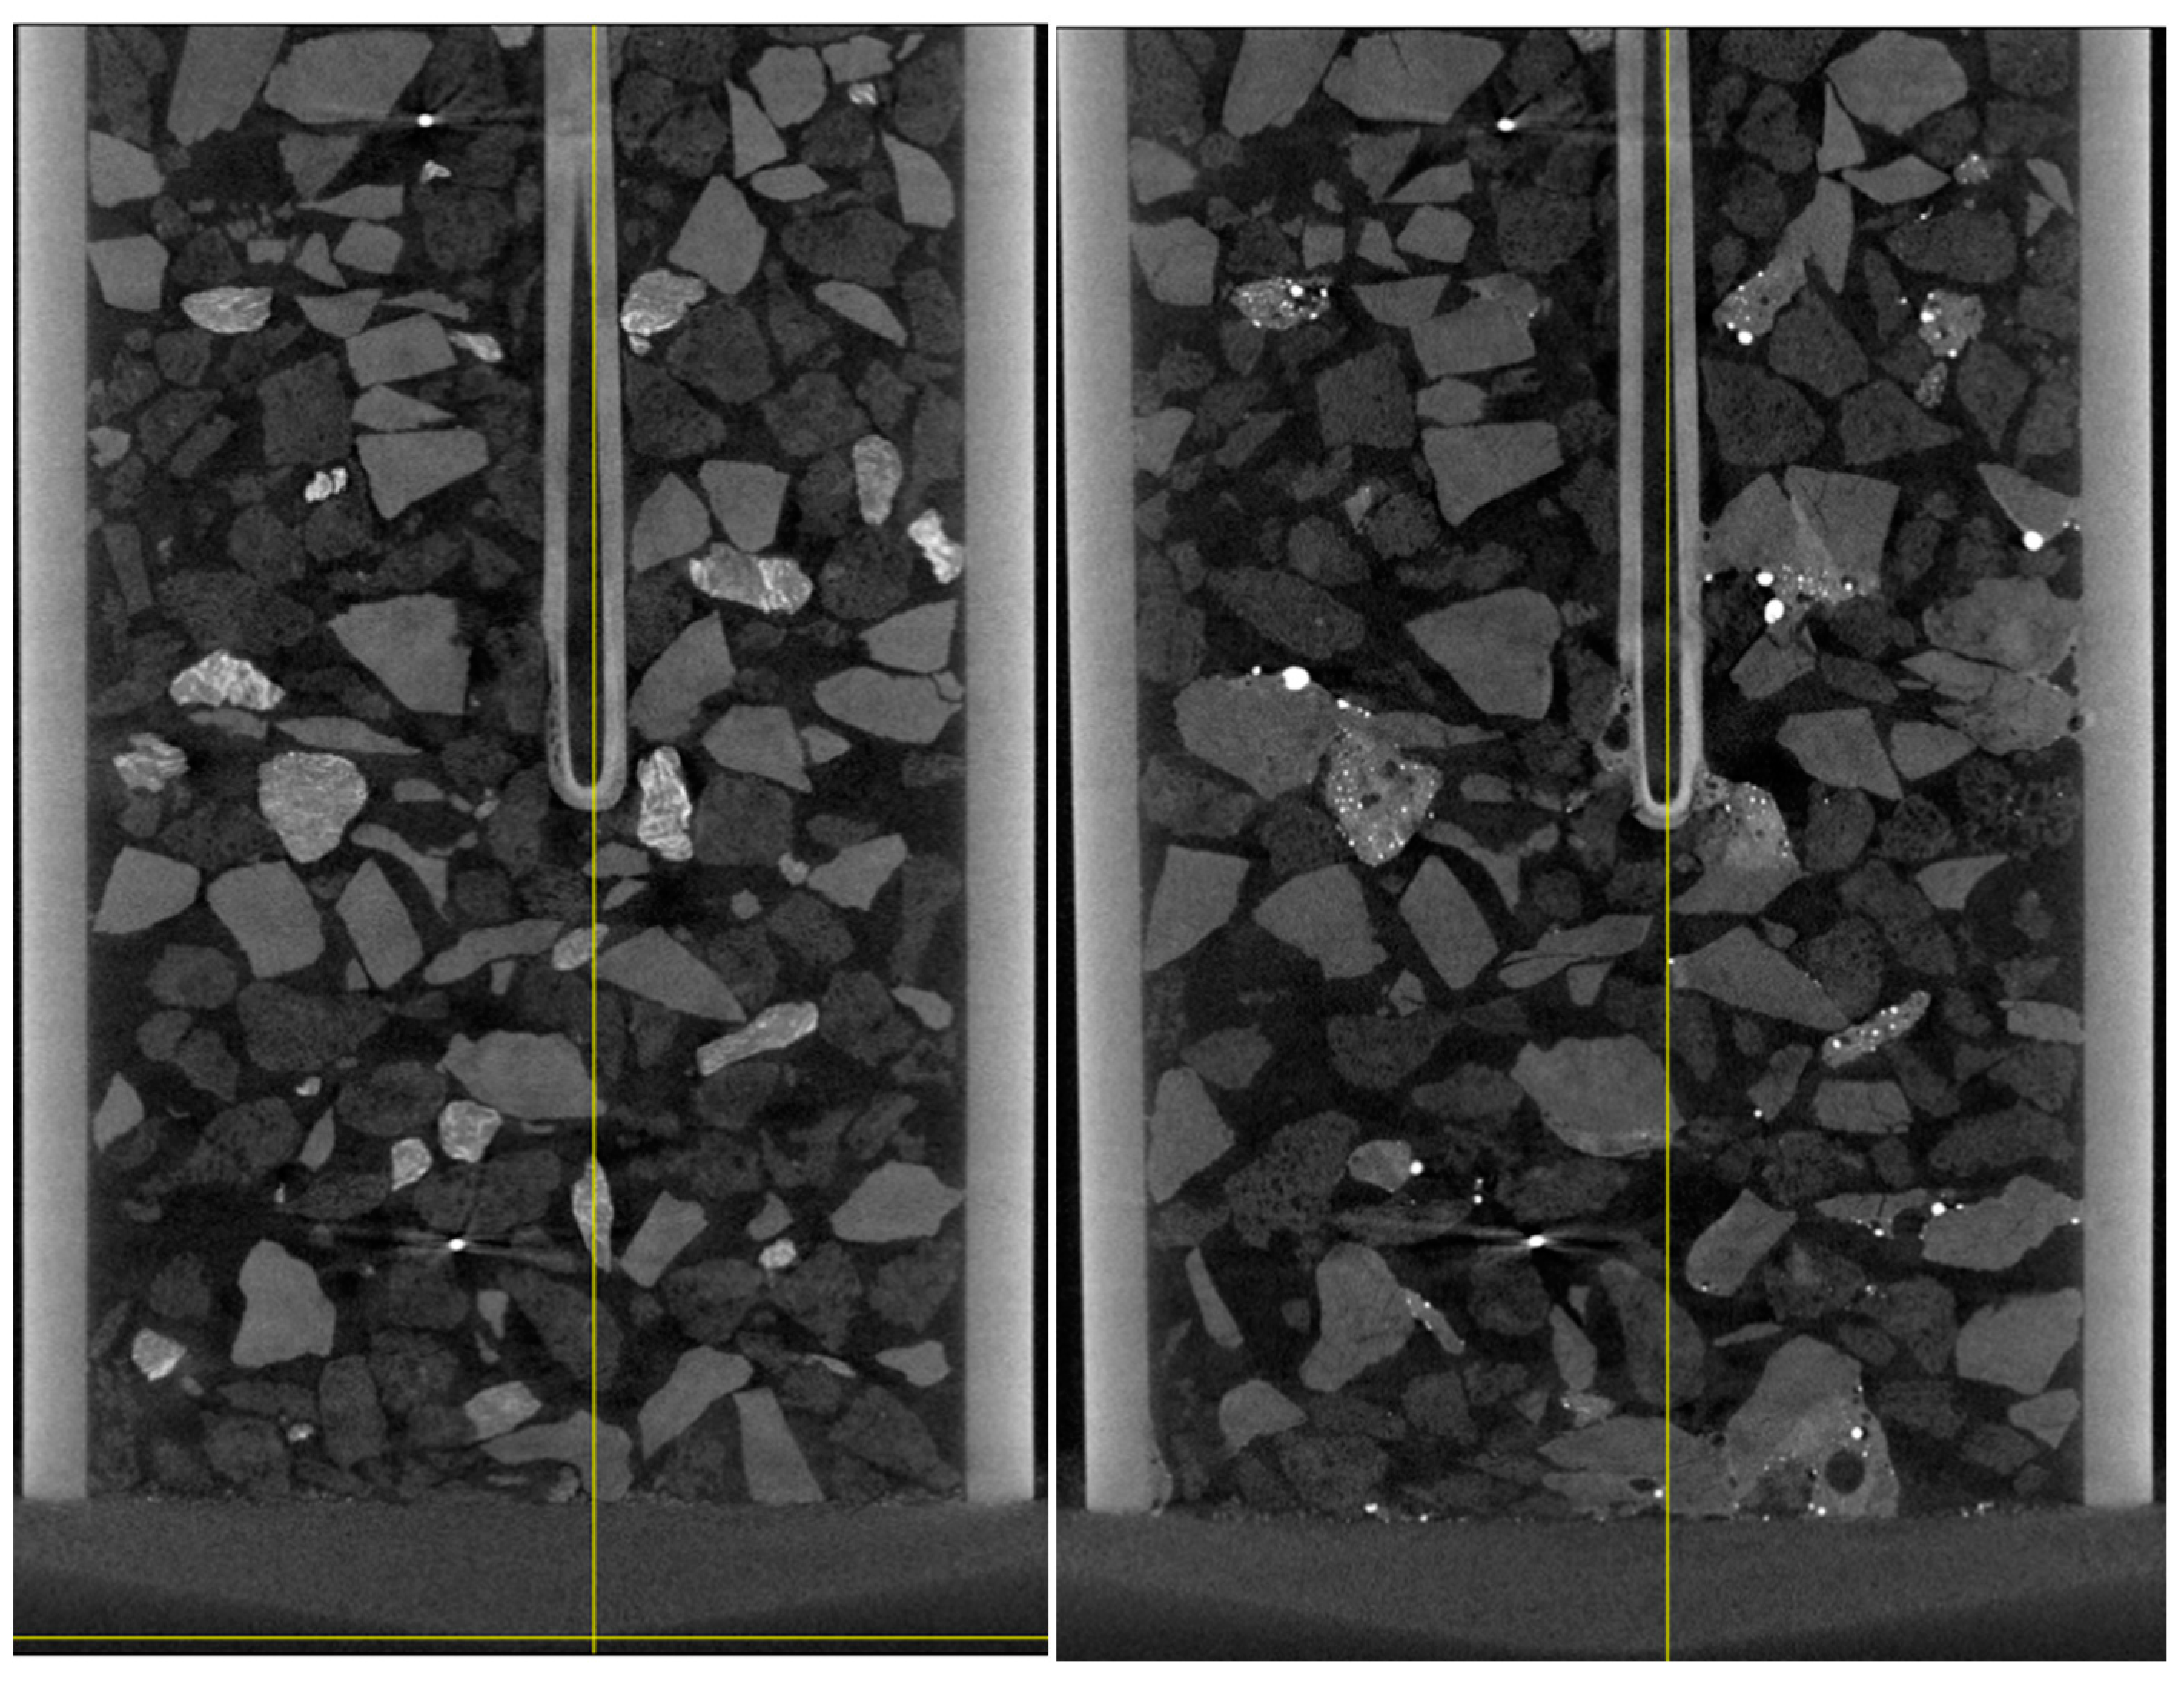
Figure 6 shows the results of the resistivity of SiC materials from coal. The SiC content ranges from 30 to 72% and silicon is present in the 72% samples. The original heat-treated coal is also shown. The results show that the carbon material’s conversion to SiC raises the resistivity, and upon the formation of elemental silicon, the resistivity begins to decrease. The two samples with high SiC content are 69% and 72%, which are close in value. Therefore, the silicon that is present in the 72% sample is likely responsible for the lower resistivity. The different trials of the same samples show good agreement, even when the experimental packing is changed. The 30% SiC samples show slightly different results, with one experiment having a higher resistivity than the coal, and another having a slightly lower resistivity. This could be because of differences in packing or bulk density, or there simply is not enough SiC in the sample to discern if it fits the trend seen in the other two samples. The overall differences in resistivity between the coal and the SiC material decrease as the temperature increases. The CT scan of the crucible before and after (Figure 7) shows no discernable changes in the bed, aside from a slight shifting in the top of the bed, which could have happened during transport. This implies that any variations are due to the measurement method and not due to shifting or additional transformation of the material.
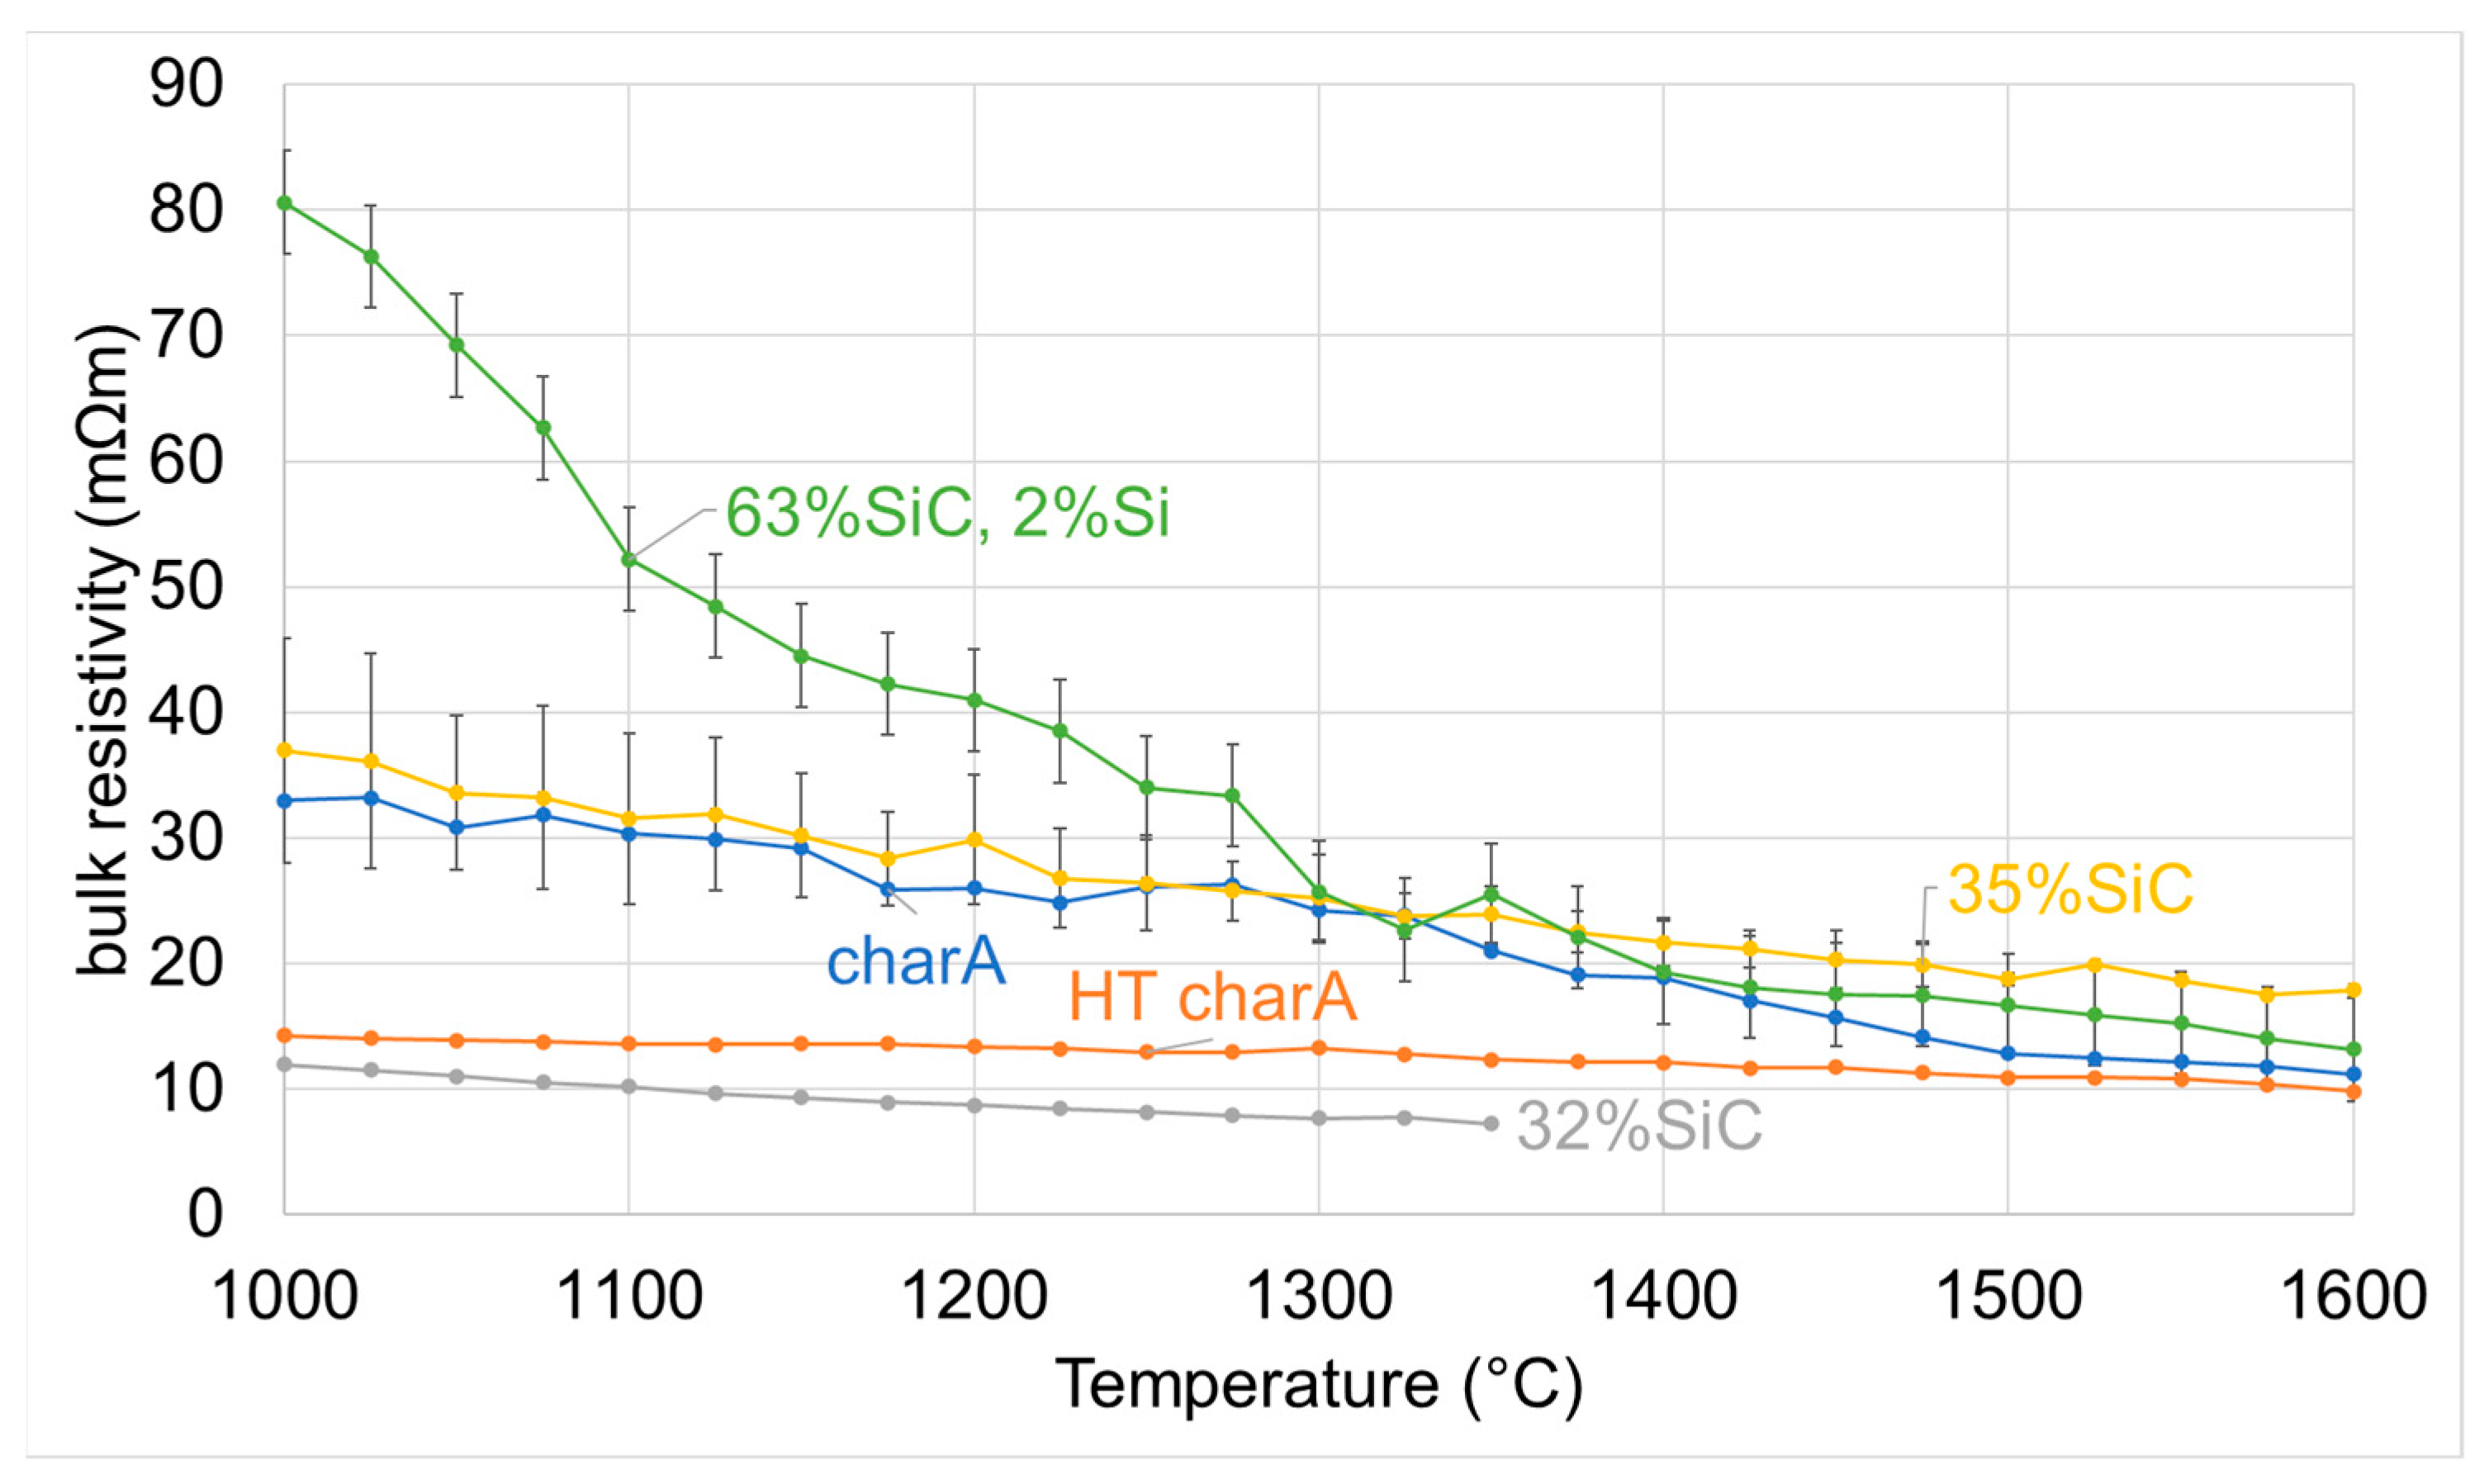
Figure 8 shows the resistivity of the SiC materials made from CharA. Char and heat-treated char are also shown. At high temperatures, the 63% SiC, which contains Si is slightly lower in resistivity than the 35% SiC, but at higher temperatures the reverse is true. This is similar to the trend seen in the coal samples, but at low temperatures, the resistivity of the 69% SiC and 72% SiC have the same range of resistivity. The 35% SiC samples appear to have a similar resistivity to that of untreated char, whereas the 32% SiC sample is close to that of the heat-treated char. However, the 32% SiC sample is only measured to 1350 °C due to thermocouple failure during the experiment. A reason for the differences between the 32% SiC and 35% SiC could be in their production methods. The 35% SiC sample all came from a more homogeneous sample, whereas the 32% SiC was a combination of more or less transformed layers that were mixed. This means that while the overall SiC content may be similar, one sample could contain a more heterogeneous mix of char particles and SiC particles, and the other could be a more homogeneous mixture of only slightly converted SiC and carbon particles. This could change the current paths in the setup as the results from the coal have led to the possibility that the SiC has a higher resistivity than the carbon. Therefore, the 32% SiC with more unreacted carbon particles could result in its lower resistivity.
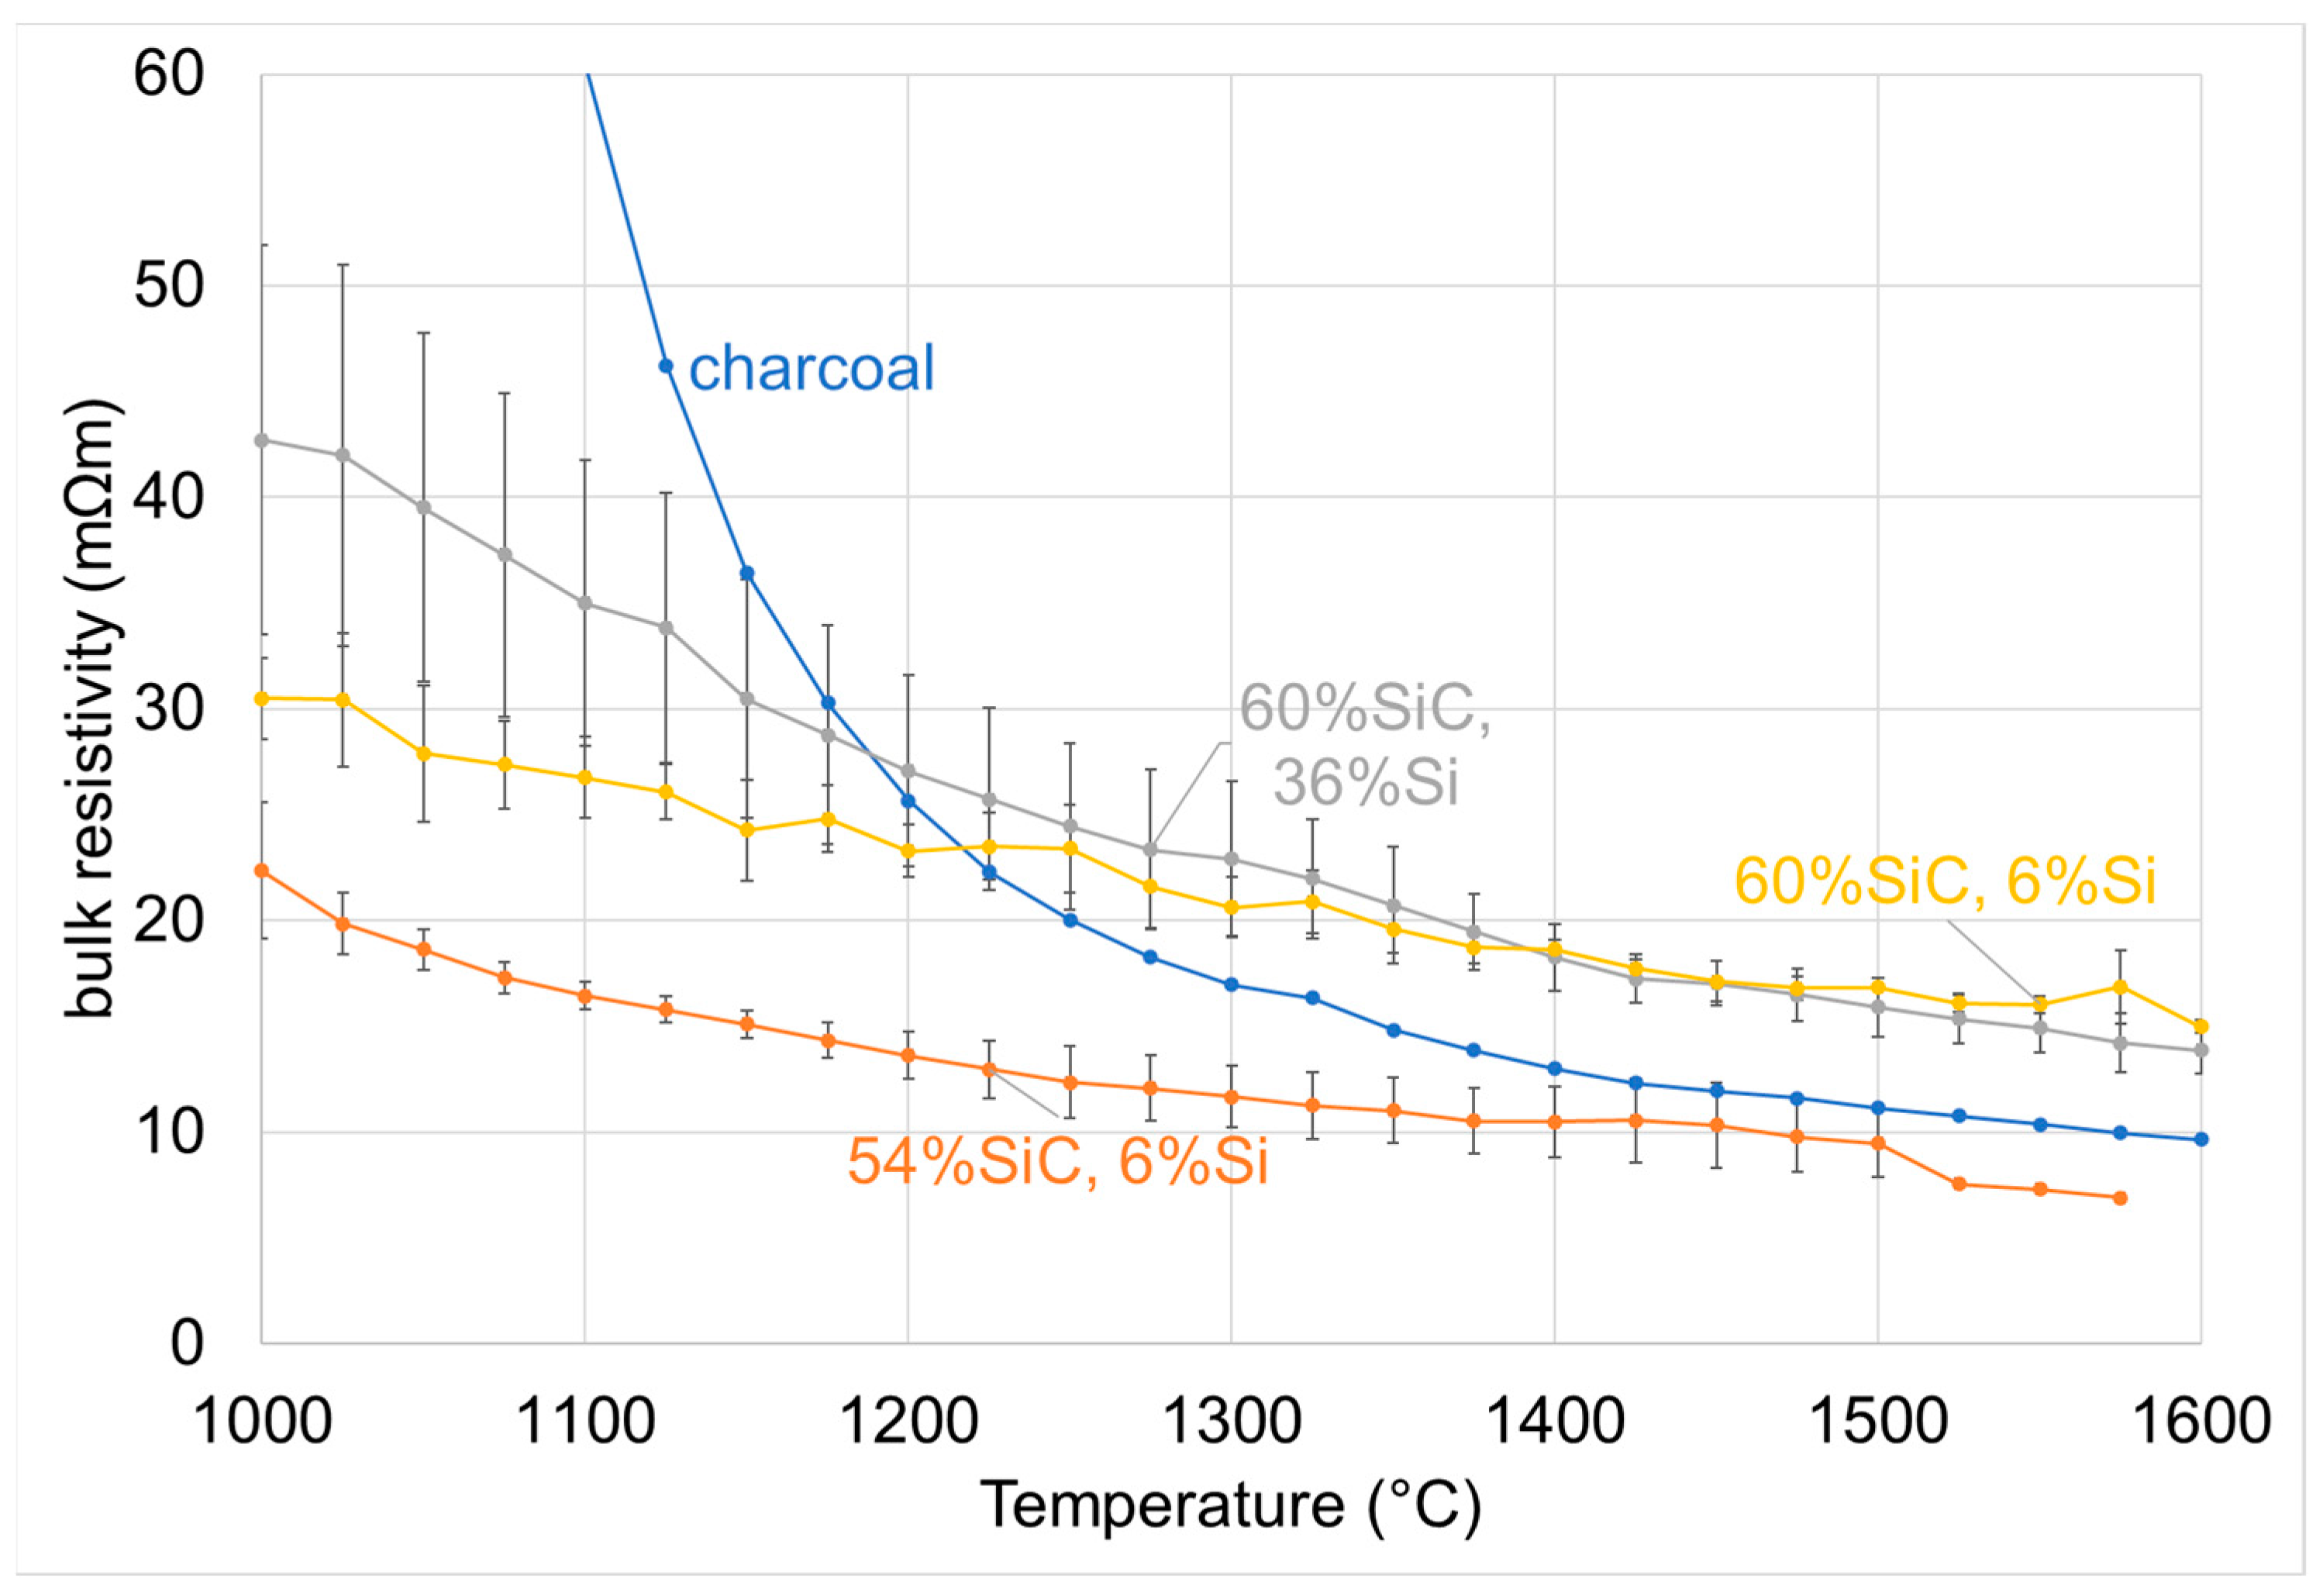
Figure 9 shows the resistivity of the SiC materials made from charcoal. In addition, charcoal is shown in blue. Two of the SiC materials have the same SiC content, but one has 6% Si and the other has 36% Si. However, the amount of Si seems to have no effect at these temperatures because the materials have similar resistivities. Additionally, the 54% SiC sample has 6% Si and has a lower resistivity than the 60% SiC with the same Si content. If they are examined by their unreacted carbon contents, the three samples contain 4%, 34%, and 36% C. This higher carbon content could explain the differences at lower temperatures, where the sample with the lowest carbon content has the highest resistivity. However, this effect is lessened at high temperatures, as all materials, charcoal included, fall within 10–15 mΩm at 1600 °C. If the maximum temperature is lowered to 1575 °C to include the 54% SiC, the range becomes 6–15 mΩm. The CT scan of the crucible before and after (Figure 10) shows no discernable changes in the bed, which is the same as the SiC from the coal results.
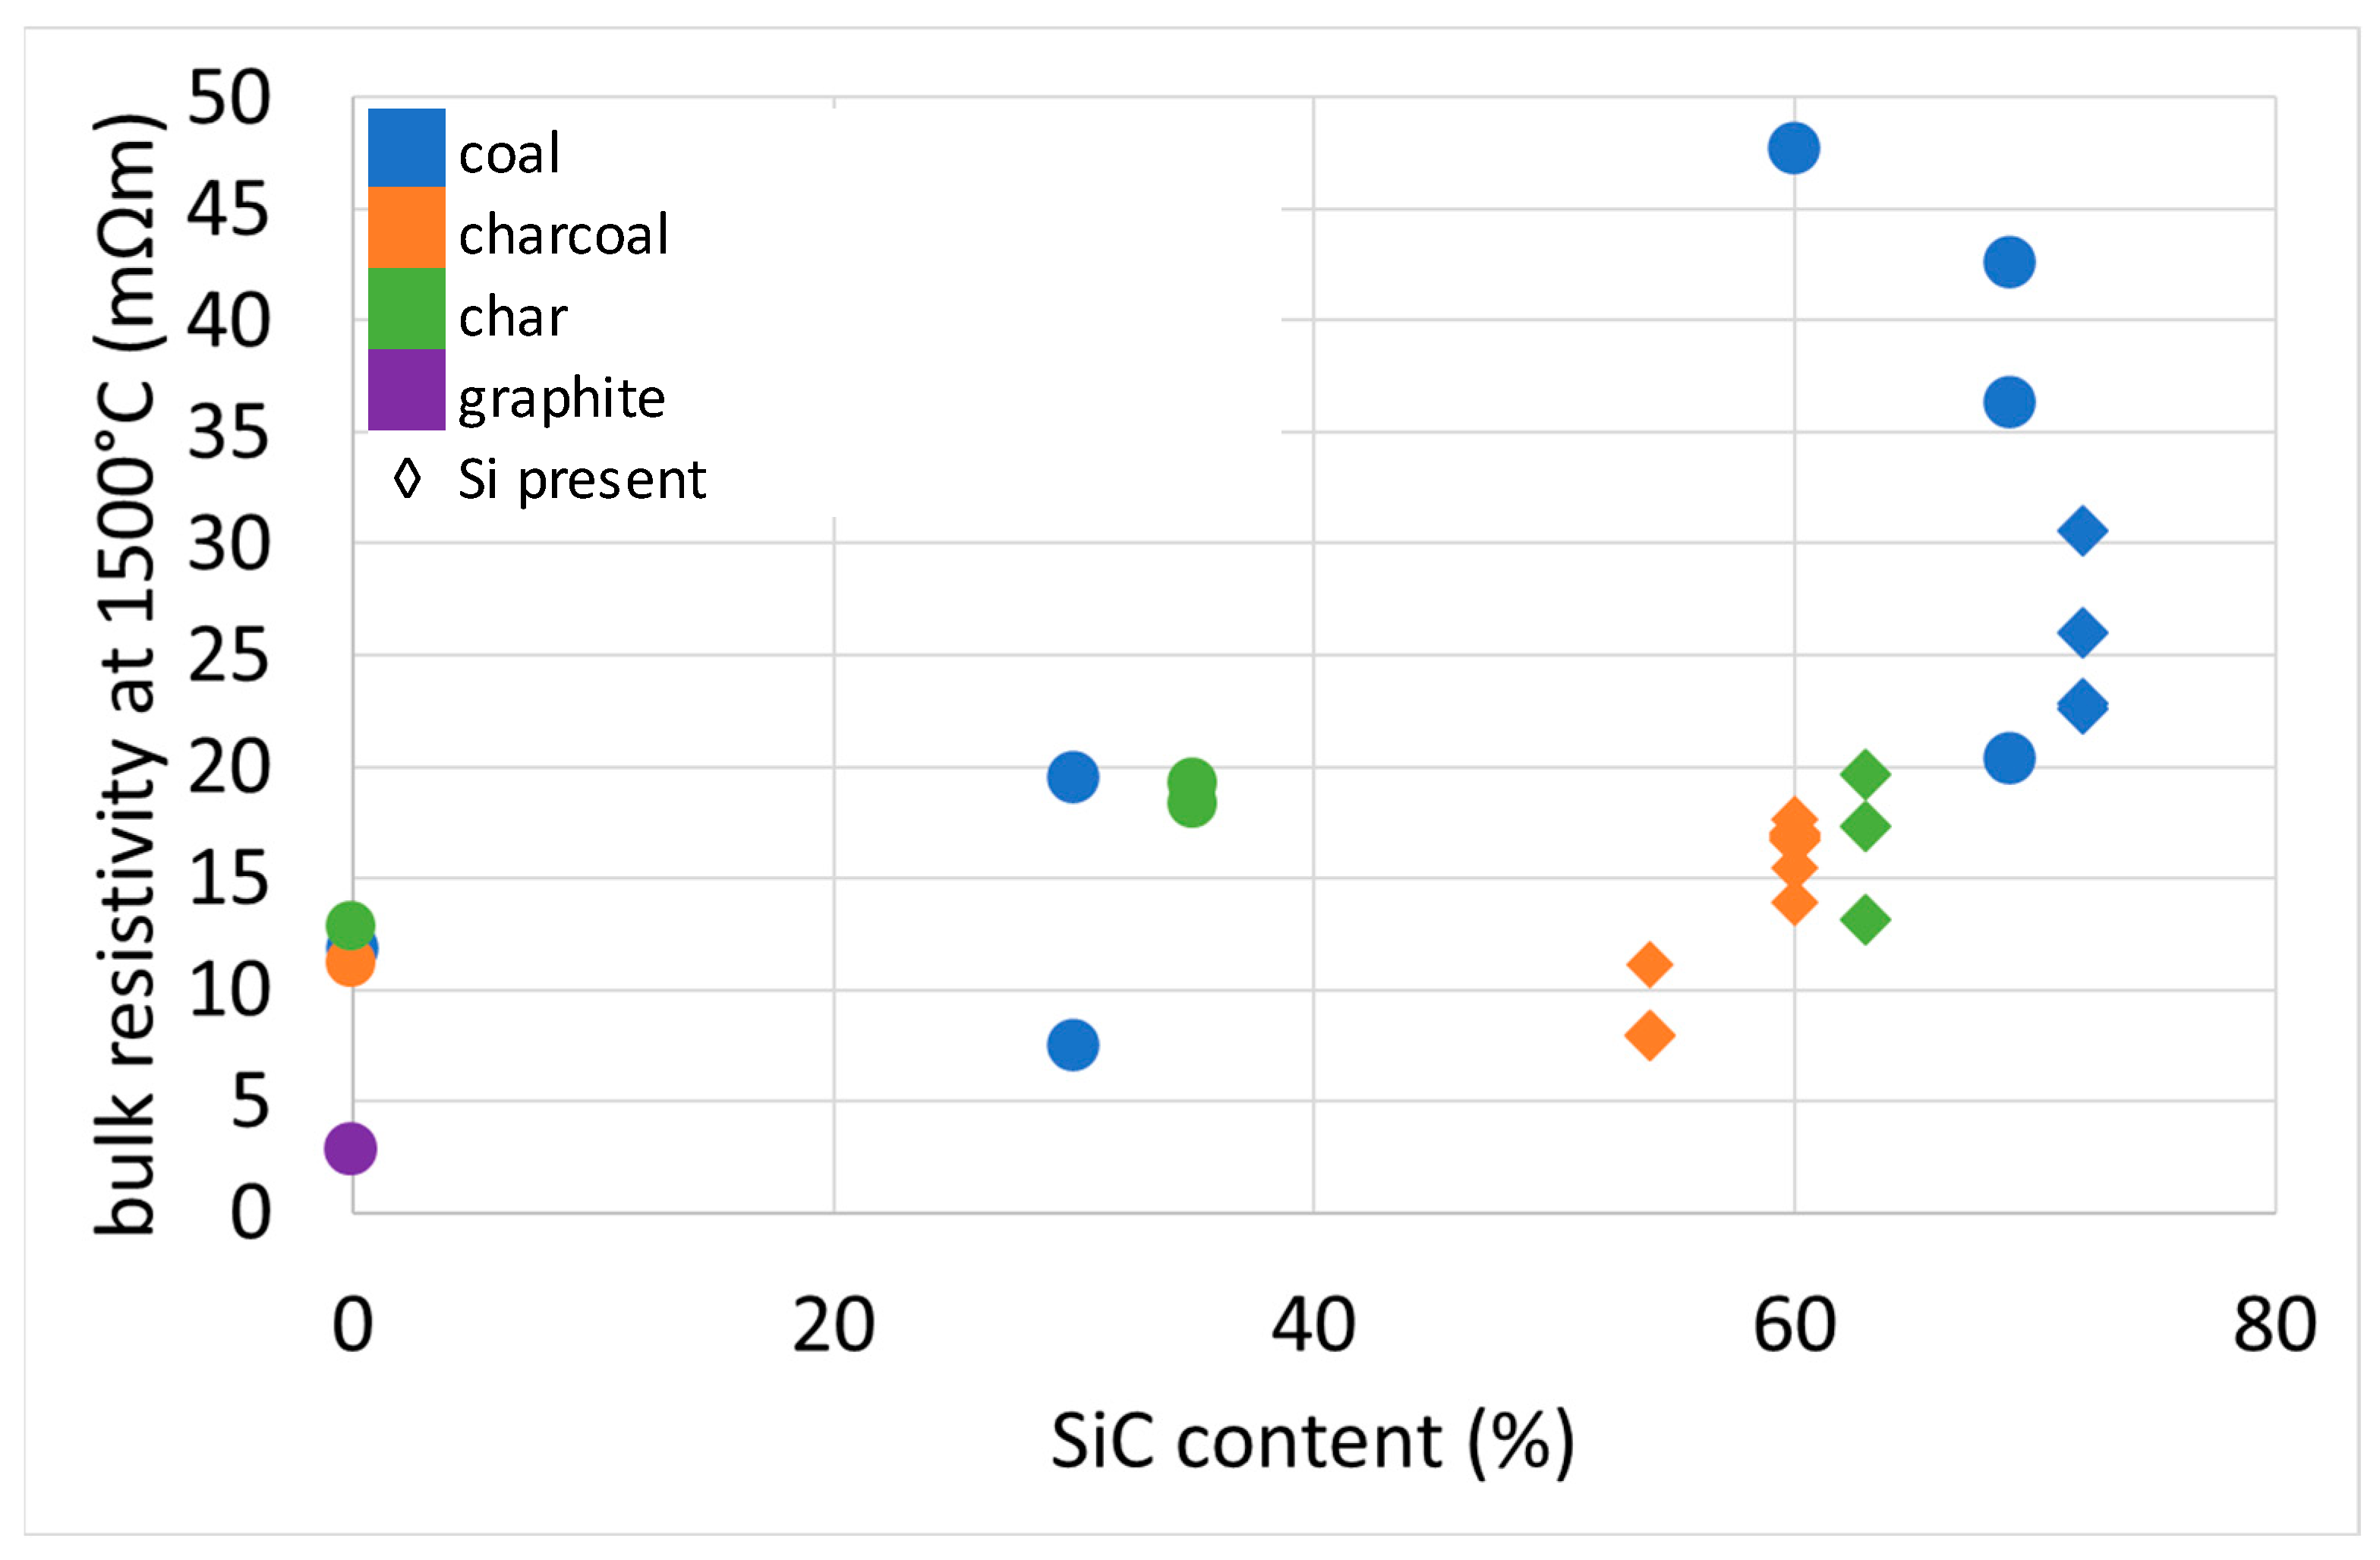
Figure 11 shows the resistivity at 1500 °C for all the partially transformed SiC materials and the carbon materials as a function of the SiC content. The samples from coal are shown in blue, charcoal in orange, and char in green. Graphite, as referenced, is shown in purple. Samples containing elemental Si are shown with diamond markers. Among all the materials it appears that as the SiC content is increasing, the resistivity is also increasing. Additionally, for the char and coal materials, the presence of Si seems to slightly lower the resistivity. This trend cannot be seen in the charcoal samples as all of them contain some Si. For the charcoal samples, the Si content ranges from 6 to 36%, yet their resistivities are very close in range. This implies that the amount of Si present (up to 36%) does not affect the resistivity, but perhaps its presence and the corresponding lower porosity is what can have an effect.
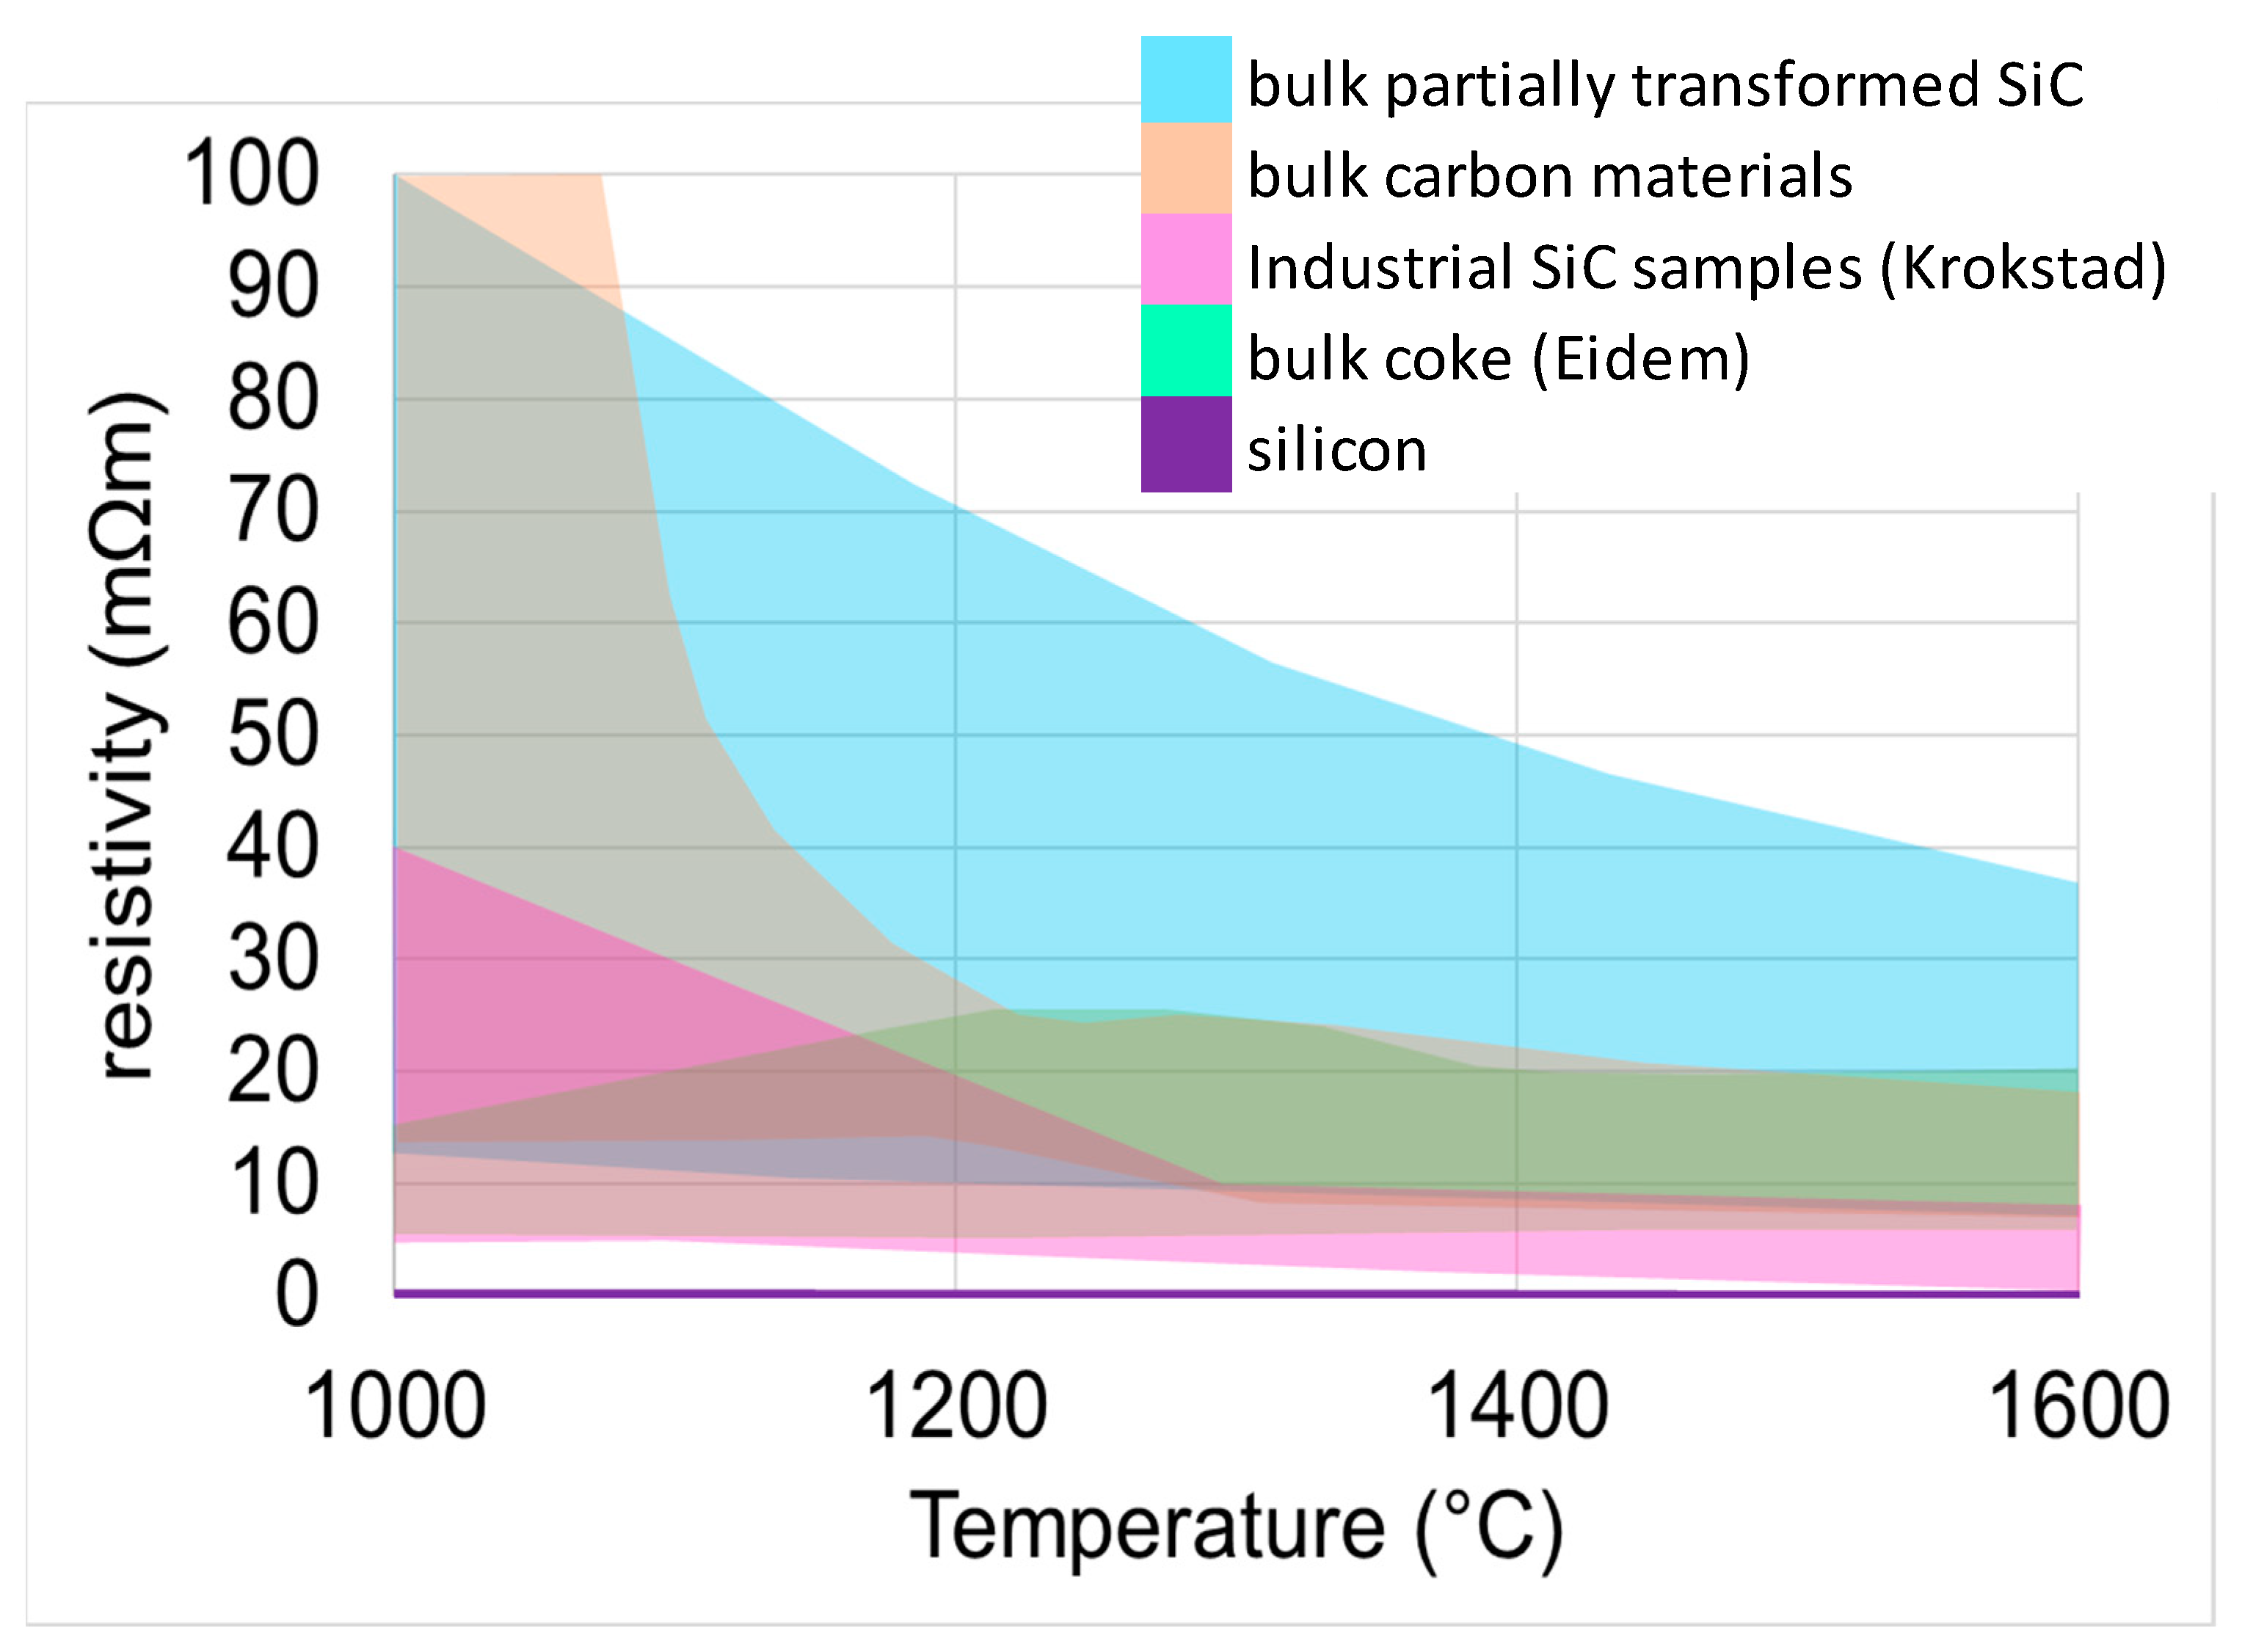
If the partially transformed SiC materials are compared to previous literature values of carbon materials and SiC crust, they are likely to be as conductive or slightly less conductive. This is shown in Figure 12, where the ranges of the various materials are shown from 1000 to 1600 °C. The partially transformed SiC has a larger range, from around 8–40 mΩm at 1600 °C. The SiC crust samples from Krokstad have the lowest resistivity apart from pure silicon at 1600 °C, likely due to both the more conductive α-SiC being present, and the fact that it is a measure of the material resistivity, not the bulk. Silicon will have a much lower resistivity at these temperature ranges but is shown.
3.3. Resistivity of Charge Materials
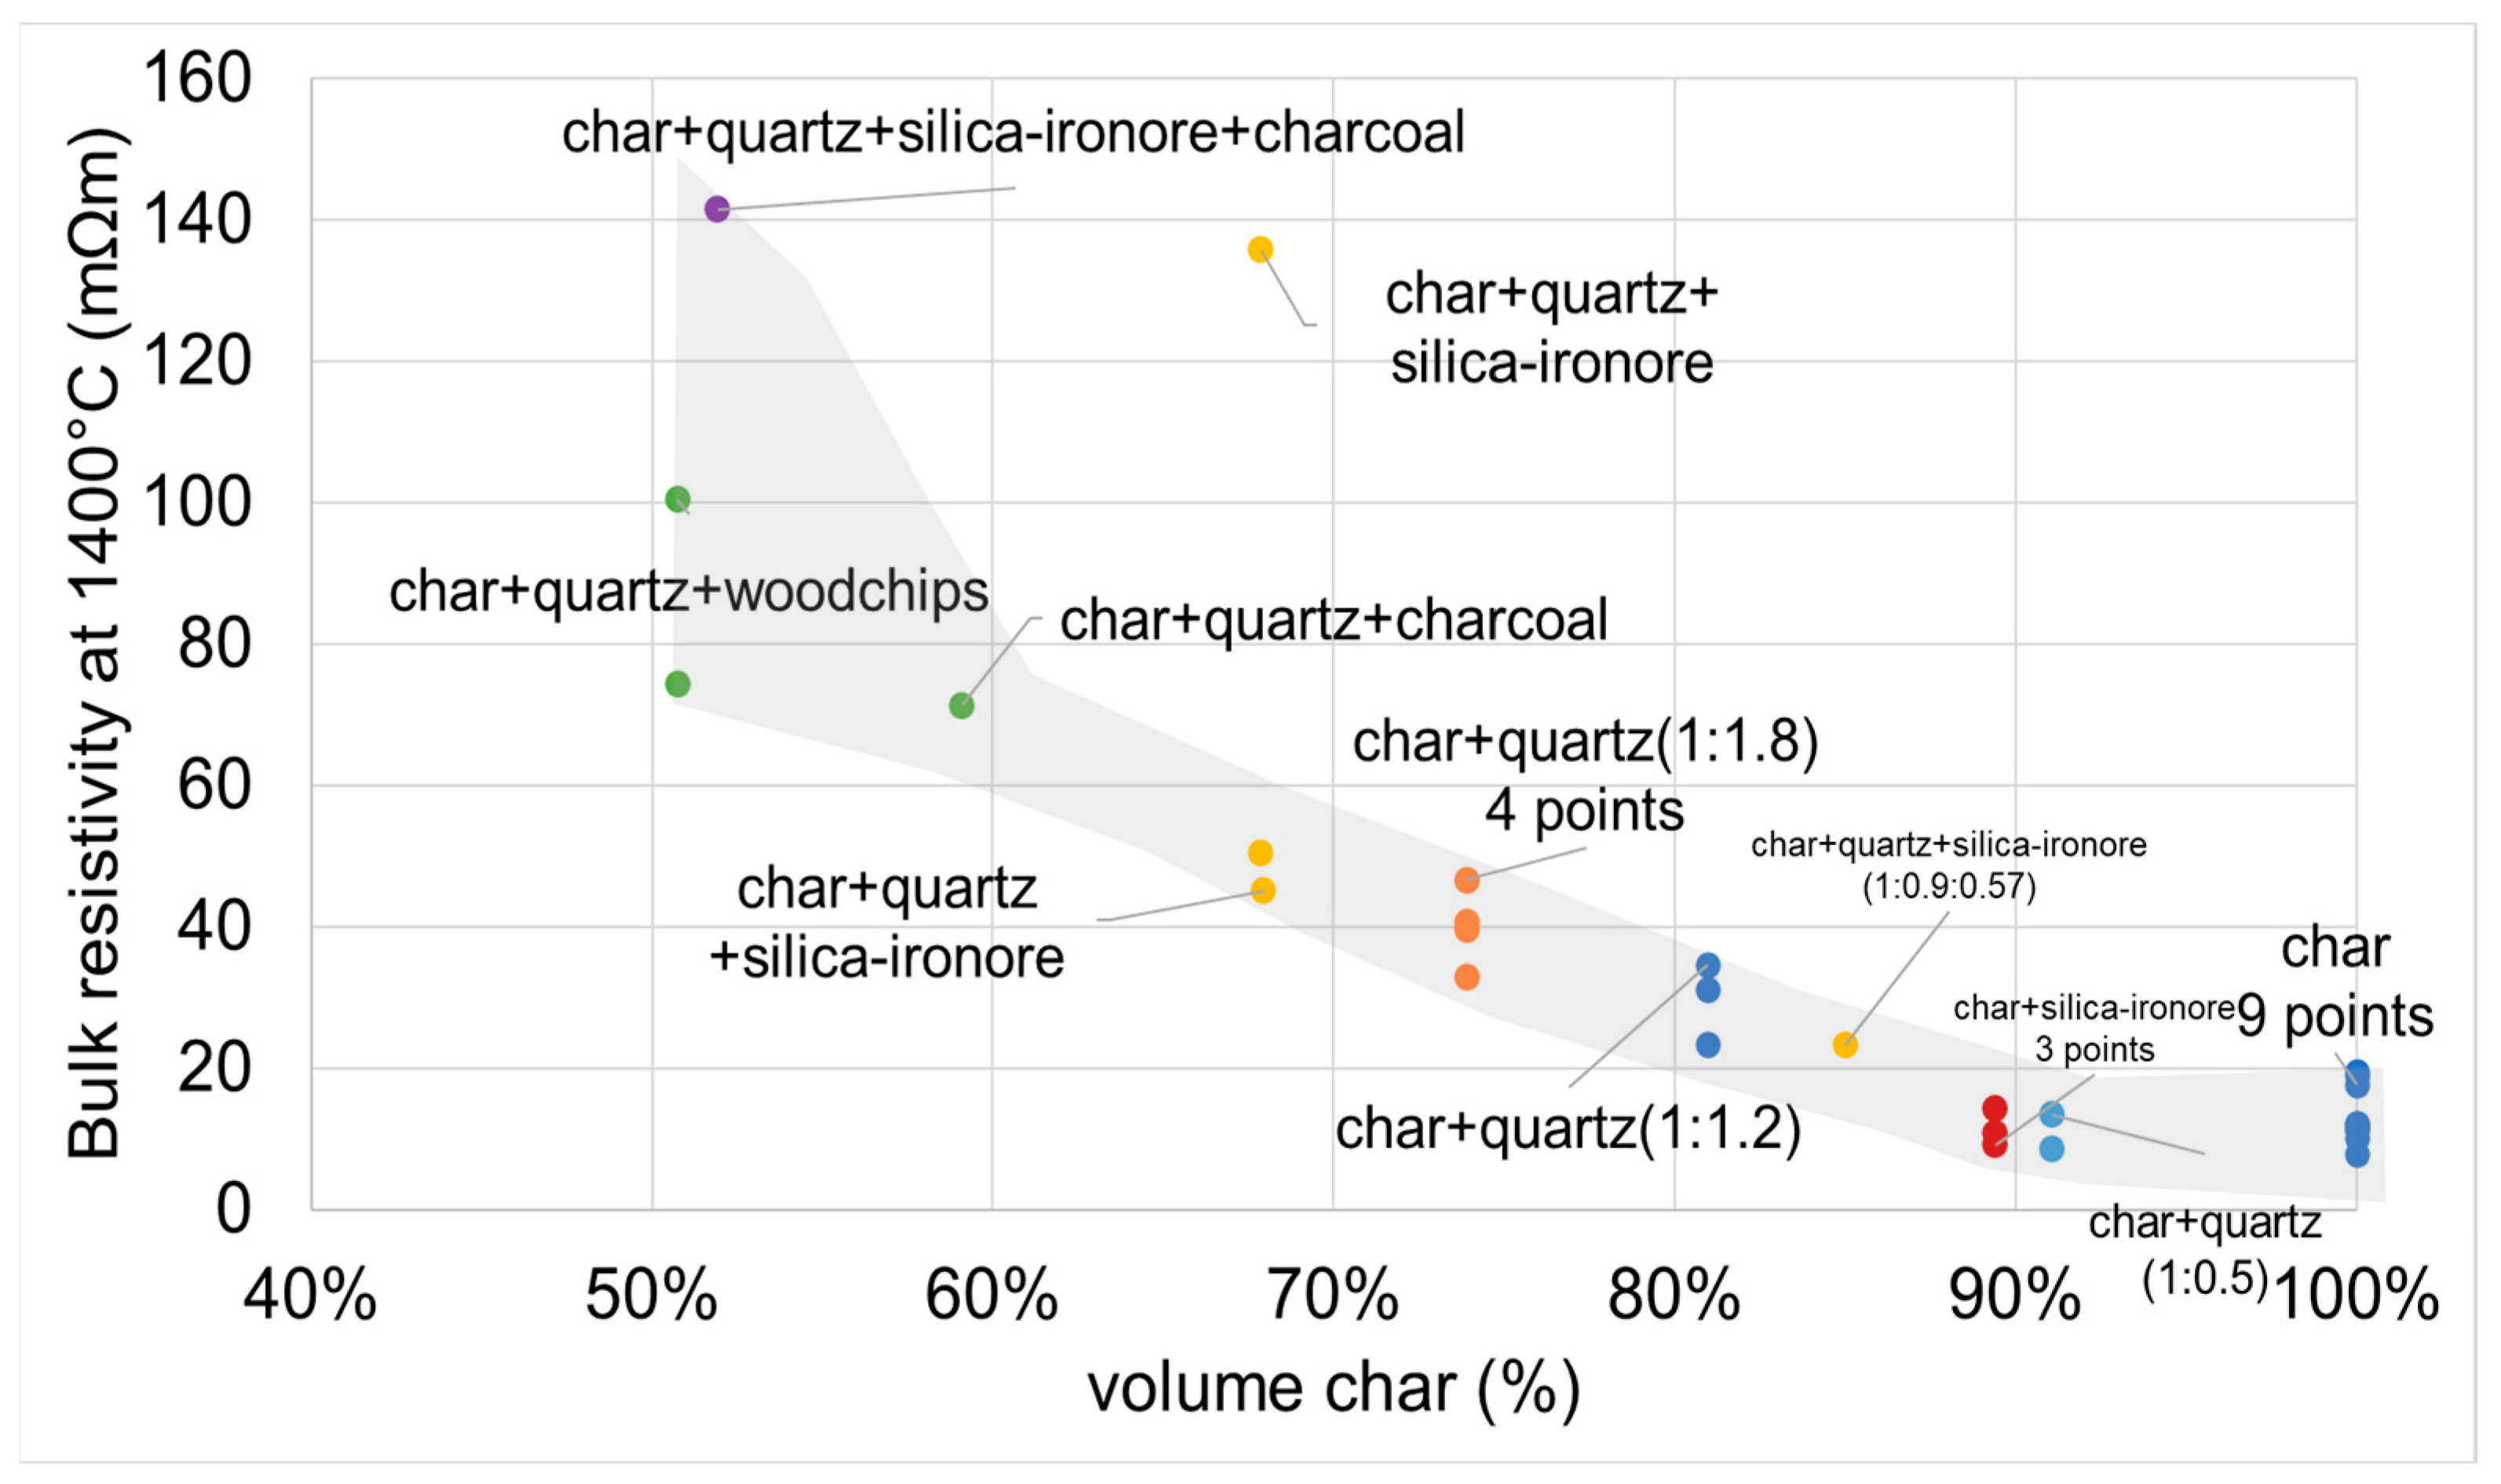
Figure 13 shows the resistivity at 1400 °C for all charge mixes as a function of the volume of char (%). All results from char alone are also shown. Even with high variations among some of the mixes (char+quartz+silica–iron for example), there is a clear trend that increasing the volume of char in the bed decreases the resistivity at 1400 °C. The lowest resistivity at this temperature is in the char+quartz mixture with a 1:0.5 ratio, and the highest is the mixture containing all raw materials.
The samples that contained silica–iron ore formed a slag in the crucible upon heating, which is visible in the CT scans shown in Figure 14. Samples of the slag were taken and a WDS analysis showed the compositions, which are shown in Table 5. The slag had a high SiO2 content of around 70%, 10% Al2O3, and 5–10% FeO. Slag has various conductivity based on temperature and composition. If the slag were pure SiO2, according to the Slag Atlas [23], the resistivity at 1400 °C would be around 1 × 10⁵–1 × 10⁷ mΩm. The addition of 10–12% Al2O3 lowers the resistivity to around 5880 mΩm at 1400 °C, and the FeO should decrease it even more. Therefore, the slag in this work appears to be non-conductive. For some of the experiments, such as the char+silica–iron ore, it is possible that the slag is not in the measuring zone, or it is just not present in sufficient quantities to overcome the conductivity of the char. This is plausible since the ore only accounts for around 10% of the volume in the char+silica–iron ore experiments.
The transformed woodchip (charcoal) appears to have an insulating effect on the resistivity since the experiments with charcoal seem to line up based on the char volume trend. This charcoal would mimic what was seen in the homemade charcoal measurements in Figure 5, where the resistivity is higher than for traditionally made charcoal and char and could therefore contribute to its more insulating effect. Overall, it appears that despite all these competing factors and the individual conductivities of the materials in the mixtures, the amount of the main conductor, in this case, char, is proportional to the bulk resistivity at high temperatures. This matches Surup’s conclusion that at least 40% of the bed must contain conductive material for the bed to be conductive [16].
4. Conclusions
The transformation of various carbon materials to SiC was examined and the resulting material was characterized by SiC, C, and Si content. The resistivity of these materials was then reported between 1000 and 1600 °C. The resistivity of mixtures of the charge materials used in Si/FeSi was also investigated. The resistivity of the carbon materials was between 7 and 17 mΩm at 1600 °C, where the char and coal were generally more conductive than the charcoal. Comparisons between the heat-treated and untreated chars showed that the lower volatile content lowers the resistivity and makes it less sensitive to temperature. A comparison between industrial charcoal and homemade charcoal from recovered woodchips showed that the homemade charcoal was also less sensitive to temperature, and conductive at lower temperatures, but had an overall higher resistivity than industrial charcoal at high temperatures. The resistivity of partially transformed materials increased with conversion to SiC, and coal with a higher SiC content than 60% had an average resistivity at 1600 °C of around 30 mΩm. The resistivity then began to decrease as elemental Si formed in the pores. Up to 36%, the amount of Si showed no effect on the resistivity, but its presence likely causes a slight decrease. CT scans show that the SiC material is not visibly changing or transforming in the crucible during measurement. Comparing the SiC materials to carbon materials and SiC crust from the literature shows that partially transformed SiC will be as conductive or less conductive than carbon at high temperatures. At 1400 °C, the resistivity of the charge mixes that included char, quartz, woodchips, and silica–iron ore showed that the resistivity is directly proportional to the amount of the main conductive material, in this case, char. CT scans before and after measurement showed no change for the partially transformed SiC material. With the charge mixes, changes such as slag formation were observed. Temperature, transformation to SiC, and volume of conductive materials appear to influence the resistivity most heavily in this work. At higher temperatures, the effect of SiC content and heat treatment temperature is lessened as the range becomes smaller for these materials.
Author Contributions
Conceptualization, H.H., M.T. and G.S.; methodology, H.H. and M.F.; software, M.F.; formal analysis, H.H.; writing—original draft preparation, H.H.; writing—review and editing, H.H., M.F., G.S. and M.T. All authors have read and agreed to the published version of the manuscript.
Funding
This publication has been partly funded by the SFI Metal Production, (Centre for Research-based Innovation, 237738). The authors gratefully acknowledge the financial support from the Research Council of Norway and the partners of SFI Metal Production. This paper is also published as part of the project “Electrical Conditions in Submerged Arc Furnaces—Identification and Improvement” (SAFECI), with financial support from the Research Council of Norway (project number 326802) and the companies Elkem, Eramet Norway, Finnfjord, and Wacker Chemicals Norway.
Data Availability Statement
The data presented in this study are available on request from the corresponding author.
Acknowledgments
The authors additionally acknowledge the contributions of the following people: EPMA instrument was operated by Morten Peder Raanes at NTNU. Resistivity experiments with charge mixes were run by Meggi Glowacki with results calculated by the author. Three measurements of the 60% SiC, 6% Si sample from charcoal were run by Khadija Choudry, with the results calculated by the author.
Conflicts of Interest
The authors declare no conflict of interest. The funders had no role in the design of the study; in the collection, analyses, or interpretation of data; in the writing of the manuscript; or in the decision to publish the results.
References
- Sævarsdottir, G.; Bakken, J. Current distribution in submerged arc furnaces for silicon metal/ferrosilicon production. In Proceedings of the Ferrosilicon Smelting, Helsinki, Finland, 6–9 June 2010; pp. 717–728. [Google Scholar]
- Krokstad, M.A. Electric Resistivity in Industrial SiC-Slag; NTNU: Trondheim, Norway, 2014. [Google Scholar]
- Tesfahungegn, Y.; Magnusson, T.; Tangstad, M.; Sævarsdottir, G.A. Effect of Carbide Configuration on the Current Distribution in Submerged Arc Furnaces for SIlicon Production—A Modelling Approach. In CFD Modeling and SImulation in Materials Processing; Springer: Cham, Switzerland, 2018; pp. 175–185. [Google Scholar]
- Tefsahunegn, Y.; Magnusson, T.; Tangstad, M.; Sævarsdottir, G. The Effect of Side Srcs on Current Distributions in a Submerged Arc Furance for Silicon Production. In Materials Processing Fundamentals 2020, TMS Springer; Springer: Cham, Switzerland, 2020; pp. 177–188. [Google Scholar]
- Schei, A.; Tuset, J.K.; Tveit, H. Production of High Silicon Alloys; Tapir Forlag: Trondheim, Norway, 1998. [Google Scholar]
- Magnussen, T. Basic paramters in the operation and design on submerged arc furnaces, with particular reference to production of high-silicon alloys. J. South. Afr. Inst. Min. Metall. 2018, 118, 631–636. [Google Scholar] [CrossRef] [Green Version]
- Tranell, G.; Andersson, M.; Ringdalen, E.; Ostrovski, O.; Steinmo, J. Reaction zones in a FeSi75 furnace—Results from an industrial excavation. In Proceedings of the Twelfth International Ferroalloys Congress, Helsinki, Finland, 6–9 June 2010. [Google Scholar]
- Westly, J. Resistance and Heat Distribution in a Submerged-arc Furnace. In Proceedings of the INFACON I, Johannesburg, South Africa, 22–26 April 1974; pp. 121–127. [Google Scholar]
- Nurmukhanbetov, Z.; Privalov, O.; Prokopyev, L. Reducibility and electric resistance of carbonaceous materials within ferroalloy smelting processes. In Proceedings of the Thirteenth International Ferroalloys Congress: Efficient Technologies In Ferroalloy Industry, Kazakhstan, Almaty, 9–12 June 2013. [Google Scholar]
- Eidem, P.A. Electrical Resisitivity of Coke Beds; NTNU: Trondheim, Norway, 2008. [Google Scholar]
- Cromarty, R.; Nhiwatiwa, J. Evaluation of coke resistivity for the manganese alloy market. In Proceedings of the INFACON XVI, Trondheim, Norway, 27–29 September 2021. [Google Scholar]
- Krogerus, H.; Lintumma, T.; Jokinen, P. Laboratory Investigations of the Electrical Resistivity of Cokes and Smelting Charge for Optimizing Operation in Large Ferrochrome Furnaces. In Proceedings of the Southern African Pyrometallurgy 2006 International Conference, Johannesburg, South Africa, 5–8 March 2006; pp. 309–328. [Google Scholar]
- Pedersen, T. Electrical Resistivity in Carbon Materials Converting to SiC; NTNU: Trondheim, Norway, 2020. [Google Scholar]
- Pedersen, T. Method for measuring bulk resisitivity in particulate carbon materials. In Proceedings of the Internal NTNU Conference Paper, Trondheim, Norway, 4–6 December 2019. [Google Scholar]
- Surup, G.R.; Pedersen, T.A.; Chaldien, A.; Beukes, J.P.; Tangstad, M. Electrical resistivity of carbonaceous bed material at high temperature. Processes 2020, 8, 933. [Google Scholar] [CrossRef]
- Surup, G.; Smith-Hanssen, N.; Tangstad, M. The properties of carbon blends in submerged arc furnaces. In Proceedings of the INFACON XVI, Trondheim, Norway, 27–29 September 2021. [Google Scholar]
- Hasannezhad, H.; Meysami, A. Effects of Porosity and Electrical Resistance of Metallurgical Coke and Semicoke on Silicon Recovery in a Electric Arc Furnace. JOM 2019, 71, 336–341. [Google Scholar] [CrossRef]
- Bharat, S. Influence of High Temperature Thermal Cycles on the Electrical Resistivity of Charcoal; Faculty of Engineering, University of Pretoria: Pretoria, South Africa, 2022. [Google Scholar]
- Singh, Y. Electrical resistivity measurements: A review. Int. J. Mod. Phys. 2013, 22, 745–756. [Google Scholar] [CrossRef]
- Ketcham, R. X-ray Computed Tomography (CT); SERC, University of Texas: Austin, TX, USA, 2017. [Google Scholar]
- Jayakumari, S. Formation and Characterization of B- and a-Silicon Carbide Produced During Silicon/Ferrosilicon Process; NTNU: Trondheim, Norway, 2020. [Google Scholar]
- Goodge, J. Electron Probe Micro-Analyzer (EPMA); SERC, University of Minnesota Duluth: Duluth, MN, USA, 2019. [Google Scholar]
- Allibert, M.; Gaye, H.; Geiseler, J.; Janke, D.; Keene, B.; Kirner, D.; Kowalski, M.; Lehmann, L.; Mills, K.; Neuschutz, D.; et al. (Eds.) Slag Atlas (Book); ECSC Research: Dusseldorf, Germany, 1995. [Google Scholar]
Figure 1.
The material resistivity of materials used in the silicon furnace from Krokstad’s MSc Thesis work [2], used with permission.
Figure 1.
The material resistivity of materials used in the silicon furnace from Krokstad’s MSc Thesis work [2], used with permission.

Figure 2.
(a) Schematic of the setup used for bulk resistivity measurements. (b) A picture of the resistivity setup from the laboratory.
Figure 2.
(a) Schematic of the setup used for bulk resistivity measurements. (b) A picture of the resistivity setup from the laboratory.

Figure 3.
Graph of the resistivity of carbon materials with increasing temperature. Chars are green, charcoals in orange, and coal in blue.
Figure 3.
Graph of the resistivity of carbon materials with increasing temperature. Chars are green, charcoals in orange, and coal in blue.

Figure 4.
Graph of resistivity versus temperature for two industrial charcoal samples and one sample made in the lab from woodchips.
Figure 4.
Graph of resistivity versus temperature for two industrial charcoal samples and one sample made in the lab from woodchips.

Figure 5.
Graph of resistivity versus temperature for untreated (left) and heat-treated (right) char samples.
Figure 5.
Graph of resistivity versus temperature for untreated (left) and heat-treated (right) char samples.

Figure 6.
Resistivity with increasing temperature for the partially transformed SiC from coal, including coal.
Figure 6.
Resistivity with increasing temperature for the partially transformed SiC from coal, including coal.

Figure 7.
CT scans in the YZ axis before (left) and after (middle) measuring the resistivity of 69% SiC from coal, and the calculated difference between the two (right). Green is before and red is after.
Figure 7.
CT scans in the YZ axis before (left) and after (middle) measuring the resistivity of 69% SiC from coal, and the calculated difference between the two (right). Green is before and red is after.

Figure 8.
Resistivity with increasing temperature for the partially transformed SiC from CharA, including CharA.
Figure 8.
Resistivity with increasing temperature for the partially transformed SiC from CharA, including CharA.

Figure 9.
Resistivity with increasing temperature for the partially transformed SiC from charcoal, including charcoal in blue.
Figure 9.
Resistivity with increasing temperature for the partially transformed SiC from charcoal, including charcoal in blue.

Figure 10.
CT scans in the YZ axis before (left) and after (middle) measuring the resistivity of 60% SiC 6% Si from charcoal, and the calculated difference between the two (right). Green is before, red is after, and yellow is overlapping.
Figure 10.
CT scans in the YZ axis before (left) and after (middle) measuring the resistivity of 60% SiC 6% Si from charcoal, and the calculated difference between the two (right). Green is before, red is after, and yellow is overlapping.

Figure 11.
Resistivity at 1500 °C for all the SiC and carbon materials as a function of the SiC content. The coal is shown in blue, charcoal in orange, and char in green. Graphite is shown in purple. Samples with Si are shown with diamond markers.
Figure 11.
Resistivity at 1500 °C for all the SiC and carbon materials as a function of the SiC content. The coal is shown in blue, charcoal in orange, and char in green. Graphite is shown in purple. Samples with Si are shown with diamond markers.

Figure 12.
Comparison of resistivity versus temperature for partially transformed SiC, carbon materials, SiC crust, and silicon.
Figure 12.
Comparison of resistivity versus temperature for partially transformed SiC, carbon materials, SiC crust, and silicon.

Figure 13.
Resistivity at 1400 °C for all charge mixes as a function of the volume%char.

Figure 14.
CT scans in the YZ axis before (left) and after (right) measuring the resistivity of char+quartz+silica–iron ore.
Figure 14.
CT scans in the YZ axis before (left) and after (right) measuring the resistivity of char+quartz+silica–iron ore.


Table 1.
Bulk resistivity values of various relevant materials from literature.
| Material | Temperature | Resistivity | Particle Size |
|---|---|---|---|
| various cokes [10] | 1500 °C | 4–14 mΩm | 10–30 mm |
| petcoke [10] | 1450 °C | 8–20 mΩm | 10–30 mm |
| charcoal [10] | 1600 °C | 7–16 mΩm | 10–30 mm |
| anthracites [10] | 1400 °C | 9 and 41 mΩm | 10–30 mm |
| coke [9] | 1600 °C | 20–36 mΩm | 3–6 mm |
| char [9] | 1600 °C | 16.6 mΩm | 3–6 mm |
| coke [12] | 1600 °C | 70.9 mΩ * | 5–25 mm |
| char and gas coke [12] | 1600 °C | 164 mΩ * | 5–25 mm |
| coke [17] | 600 °C | 110 mΩm | |
| semicoke [17] | 600 °C | 1250 mΩm | |
| charcoal [13] | 1600 °C | 10.8 mΩm | 4.5–9.5 mm |
| char (treated) [13] | 1600 °C | 9.1 mΩm | 4.5–9.5 mm |
| coal (treated) [13] | 1600 °C | 7.8 mΩm | 4.5–9.5 mm |
| charcoal/SiC/condensate [13] | 1600 °C | 200 mΩm | 4.5–9.5 mm |
* published as conductivity and converted to resistivity.
Table 2.
List of experiments split by carbon materials, partially transformed SiC materials, and charge mixes.
Table 2.
List of experiments split by carbon materials, partially transformed SiC materials, and charge mixes.
| (A) List of the number of experiments done on each of the carbon materials. “HT” denotes heat treatment. Different samples of the same carbon material are differentiated using A, B, or C. | ||||
| Number of Experiments | Carbon Materials | Fixed C (%) | Ash (%) | Volatiles (%) |
| 1 | CharA | 88.5 | 5.87 | 5.4 |
| 1 | CharA_HT | |||
| 1–4 | CharB HT | 96.2 | 1.2 | 2.6 |
| 1–4 | CharC | 86.9 | 11.8 | 1.2 |
| 1 | CharcoalA | 85.9 | 3.97 | 15.9 |
| 1 | Charcoal from woodchips | 91.4 | 4.9 | 3.7 |
| 1 | CharcoalB | 81.8 | 0.03 | 16.2 |
| 1 | Coal_HT | 95.3 | 2.28 | 0.4 |
| (B) List of materials used in the bulk resistivity measurements. | ||||
| SiC Materials from Charcoal A | SiC Materials from CharA | SiC Materials from Coal | ||
| 60% SiC, 6% Si | 32% SiC | 69% SiC | ||
| 60% SiC, 36% Si | 35% SiC | 72% SiC, 7% Si | ||
| 54% SiC, 6% Si | 63% SiC, 2% Si | 30% SiC | ||
| (C) List of the number of experiments done on each of the charge mixtures. Weight ratios are listed in the same order as the materials. | ||||
| Number of Experiments | Charge Mixes | |||
| 1–7 | 1:1.8 char + quartz | |||
| 1–4 | 1:1.2 char + quartz | |||
| 1–2 | 1:0.5 char + quartz | |||
| 1–3 | 1:1.8:0.5 char + quartz + woodchips (charcoal) | |||
| 1–7 | 1:1.8:0.57 char + quartz + silica/iron ore (+charcoal) | |||
| 1–3 | 1:0.57 char + silica/iron ore | |||
Table 3.
Chemical analysis of Quartz A for the charge mixes (wt.%).
| Wt. (%) | |
|---|---|
| SiO2 | 99.8 |
| MgO | 0.02 |
| Al2O3 | 0.04 |
| Fe2O3 | 0.14 |
| Cr2O3 | 0.04 |
Table 4.
Chemical analysis of silica–iron ore A and B for the charge mixes (wt.%).
| Silica–Iron Ore A wt.(%) | Silica–Iron Ore B wt.(%) | |
|---|---|---|
| SiO2 | 46.3% | 61.8% |
| CaO | 22.5% | 4.96% |
| Al2O3 | 11.4% | 6.91% |
| Fe2O3 | 7.42% | 19.5% |
| MgO | 6.72% | 3.57% |
Table 5.
Point analysis for the slag samples (average of 6 points).
| Sample | SiO2 | FeO | Al2O3 | MgO | K2O | CaO | Na2O | SO3 | |
|---|---|---|---|---|---|---|---|---|---|
| 1 | Average of 6 points (%) | 69.90 ± 1.63 | 5.79 ± 1.17 | 11.21 ± 0.96 | 4.09 ± 0.36 | 2.09 ± 0.22 | 6.43 ± 0.46 | 0.8 ± 0.04 | 0.03 ± 0.01 |
| 2 | Average of 6 points (%) | 69.94 ± 3.29 | 11.16 ± 2.28 | 10.49 ± 2.18 | 3.23 ± 0.74 | 3.13 ± 0.34 | 1.66 ± 0.42 | 0.84 ± 0.12 | 0.18 ± 0.11 |
Disclaimer/Publisher’s Note: The statements, opinions and data contained in all publications are solely those of the individual author(s) and contributor(s) and not of MDPI and/or the editor(s). MDPI and/or the editor(s) disclaim responsibility for any injury to people or property resulting from any ideas, methods, instructions or products referred to in the content. |
© 2023 by the authors. Licensee MDPI, Basel, Switzerland. This article is an open access article distributed under the terms and conditions of the Creative Commons Attribution (CC BY) license (https://creativecommons.org/licenses/by/4.0/).
Share and Cite
MDPI and ACS Style
Hoover, H.; Fromreide, M.; Sævarsdottir, G.; Tangstad, M. Bulk Resistivity of Materials in the Si/FeSi Furnace. Processes 2023, 11, 2115. https://doi.org/10.3390/pr11072115
AMA Style
Hoover H, Fromreide M, Sævarsdottir G, Tangstad M. Bulk Resistivity of Materials in the Si/FeSi Furnace. Processes. 2023; 11(7):2115. https://doi.org/10.3390/pr11072115
Chicago/Turabian StyleHoover, Haley, Mads Fromreide, Gudrun Sævarsdottir, and Merete Tangstad. 2023. "Bulk Resistivity of Materials in the Si/FeSi Furnace" Processes 11, no. 7: 2115. https://doi.org/10.3390/pr11072115
Note that from the first issue of 2016, this journal uses article numbers instead of page numbers. See further details here.