

Gas–Water Characteristics of Tight Sandstone in Xihu Sag, East China Sea Basin under Different Charging Models
1
State Key Laboratory of Petroleum Resources and Prospecting, China University of Petroleum, Beijing 102249, China
2
College of Geosciences, China University of Petroleum, Beijing 102249, China
3
Hangzhou Institute of Geology, China National Petroleum Corporation, Hangzhou 310023, China
4
Kunlun Digital Technology Co., Ltd., Beijing 100007, China
*
Author to whom correspondence should be addressed.
Processes 2023, 11(5), 1310; https://doi.org/10.3390/pr11051310
Submission received: 17 March 2023
/
Revised: 14 April 2023
/
Accepted: 21 April 2023
/
Published: 24 April 2023
(This article belongs to the Special Issue The Exploration and Development of Unconventional (Mainly Shale) Hydrocarbon Resources)
Abstract
:The Xihu sag has two main oil−gas fields: Huagang Gas Field and Pinghu Oil Field. The Huagang formation is the reservoir of the Huagang Gas Field in the Central Tectonic Zone, while the Pinghu formation is the reservoir of the Pinghu Oil Field in the Western Slope Zone. In this paper, which mainly focusses on the Huagang formation, we conducted gas-driven water displacement–magnetic resonance imaging (GWD-MRI) experiments to simulate the charging characteristics of the sandstone migration layer, centrifugal magnetic resonance (Cen-NMR) experiments to simulate the short-term rapid trap charging process, and semi-permeable baffle (SPB) charging experiments to simulate the slow trap accumulation process. The results indicate that a start-up pressure exists for migration layer charging, where the start-up pressure for a core with a permeability of 0.3 mD is about 0.6 MPa. Our experimental simulations confirm that a planar front of changing water saturation exists, which has a width of about 1–1.5 cm. Migration layer charging is mainly influenced by two actions: the drive effect and the carrying effect. The drive effect can reduce the water saturation to 70–80%, while the carrying effect can further reduce the water saturation by 5–10%. The water saturation in the rapid charging scenario is mainly affected by the petrophysical characteristics of the rock: if the porosity is high, the water saturation is low. The water saturation decreases significantly with the increase in centrifugal force when the centrifugal force is small; however, when the centrifugal force is greater than 0.8 MPa, the water saturation decreases slowly. In the slowly charging trap experiment, the water saturation was basically stable at 40–50%, which matched the measured water saturation of the airtight cores well (ranging from 40–55%), and the petrophysical characteristics of the rock did not have a significant effect on the final water saturation.
1. Introduction
When carrying out physical modeling to study the characteristics of gas and water, gas–water driving (GWD) models are generally used, with semi-permeable baffle (SPB) models being used less frequently to study the hydraulic properties of rock. Furthermore, nuclear magnetic resonance (NMR) and magnetic resonance imaging (MRI) techniques have recently been used to study both free and combined water in this context.
Many articles in the literature have studied gas–water driving characteristics using physical models [1,2,3,4,5,6,7], considering factors such as the design of the driving fluid and displacement conditions, measurement of the driving pressure, the volume of discharge water, and the calculation of residual water. These articles have generally focused on tight sandstone or heavy oil. If necessary, numerical simulations may also be carried out according to the experimental conditions.
Some scholars have also conducted studies involving the visualization of driving experiments [1,8]. Lysova [8] analyzed the influence of the exothermic reaction by determining the residual water distribution using magnetic resonance imaging (MRI), while Masri [1] placed CT imaging devices on the core displacement chamber to analyze the spatial changes in water saturation after displacement. These works allowed the residual water to be easily observed in a single picture, but they lacked an analysis of the change in residual water over different periods of the experiment.
There have been many articles focused on determining the distribution of core residual water according to the results of Centrifugal NMR experiments [9,10,11,12,13,14,15], through which the fluidity of the reservoir fluid can be analyzed.
Semi-permeable baffle experiments are mostly used in the field of material research [16,17]. The wettability of porous materials has been previously studied [18], which has reference significance regarding the wettability of rock samples, as semi-permeable experiments considering porous materials are similar to those using geological samples.
Few previous studies have focused on visualization of the dynamic displacement process. Therefore, in this paper, we attempt to visualize such a process through a gas-driven water displacement–magnetic resonance imaging (GWD-MRI) experiment. Furthermore, considering the lack of gas–water characteristic analysis in different physical models, we analyzed the residual water results obtained with different models.
The three types of natural gas charging simulation experiments considered in this paper have varying characteristics, as described below.
The centrifugal nuclear magnetic resonance (Cen-NMR) experiment uses different speeds to centrifuge the core, such that the water in the pores is driven out of the core under the action of the centrifugal force. Generally, the speed ranges from 1000 rpm to 10,000 rpm, such that the centrifugal force produced is in the range of 0.1–5 MPa and the time required for centrifugation is short. After centrifugation, the samples are tested by NMR spectroscopy and weighed at the same time, allowing for an analysis of the water content and water-bearing pore distribution characteristics under different centrifugal force conditions [10,12].
The semi-permeable baffle (SPB) experiment involves the use of a ceramic baffle, which only allows the liquid phase to pass through at the end of the core; this can be used to measure the capillary data. The core chamber is filled with natural gas at a certain pressure, which will drive out the water in the core under the action of pressure. The driven liquid phase enters the measuring cup through the semi-permeable ceramic plate, while the gas phase remains in the core chamber [19]. Regarding the experimental conditions, the gas chamber pressure is generally 0–1 MPa and the experiment equilibrium time is very long (generally >6 h). Therefore, this type of experiment mainly simulates low-pressure trap charging.
The Gas-driven water displacement–magnetic resonance imaging (GWD-MRI) experiment uses a displacement device combined with a magnetic resonance imaging (MRI) device. According to the design, the core driving experiment can simulate different driving pressures, different driving times, and different types of fluid. Under the gas-driven water model, the driving pressure depends on the core petrophysical properties to select the appropriate displacement pressure (in the range of 0–5 MPa), and a driving time between 1–48 h must be appropriately selected. The displacement is very close to migration layer charging. In order to effectively visualize the drive process, this paper uses a technical method involving the combination of a drive device and a magnetic resonance imaging (MRI) device.
According to the above, the Cen-NMR experiment takes a short time, has a large driving pressure range, and can analyze the residual water distribution, making it suitable for analyzing the characteristics of short-term high-intensity charging. In contrast, the semi-permeable baffle experiment takes a long time and has a low driving pressure, which makes it better suited for simulation of the charging process in the underground trap, with the final water saturation generally well-matching the current water saturation of a typical gas field. Finally, GWD–MRI can be used to observe the spatial distribution characteristics of the residual water. Gas generally drives water under low-pressure conditions. In the driving process, the end of the core will discharge water and gas, such that the core driving experiment can better reflect the charging of the migration layer.
According to the experimental time and whether the core is damaged, we conducted GWD-MRI, Cen-NMR, and SPB experiments in sequence. Combining these three types of experiments allowed us to analyze the gas–water characteristics under migration layer charging, short-term high-intensity trap charging, and slow trap charging, respectively.
2. Samples and Experiment
2.1. Geological Background
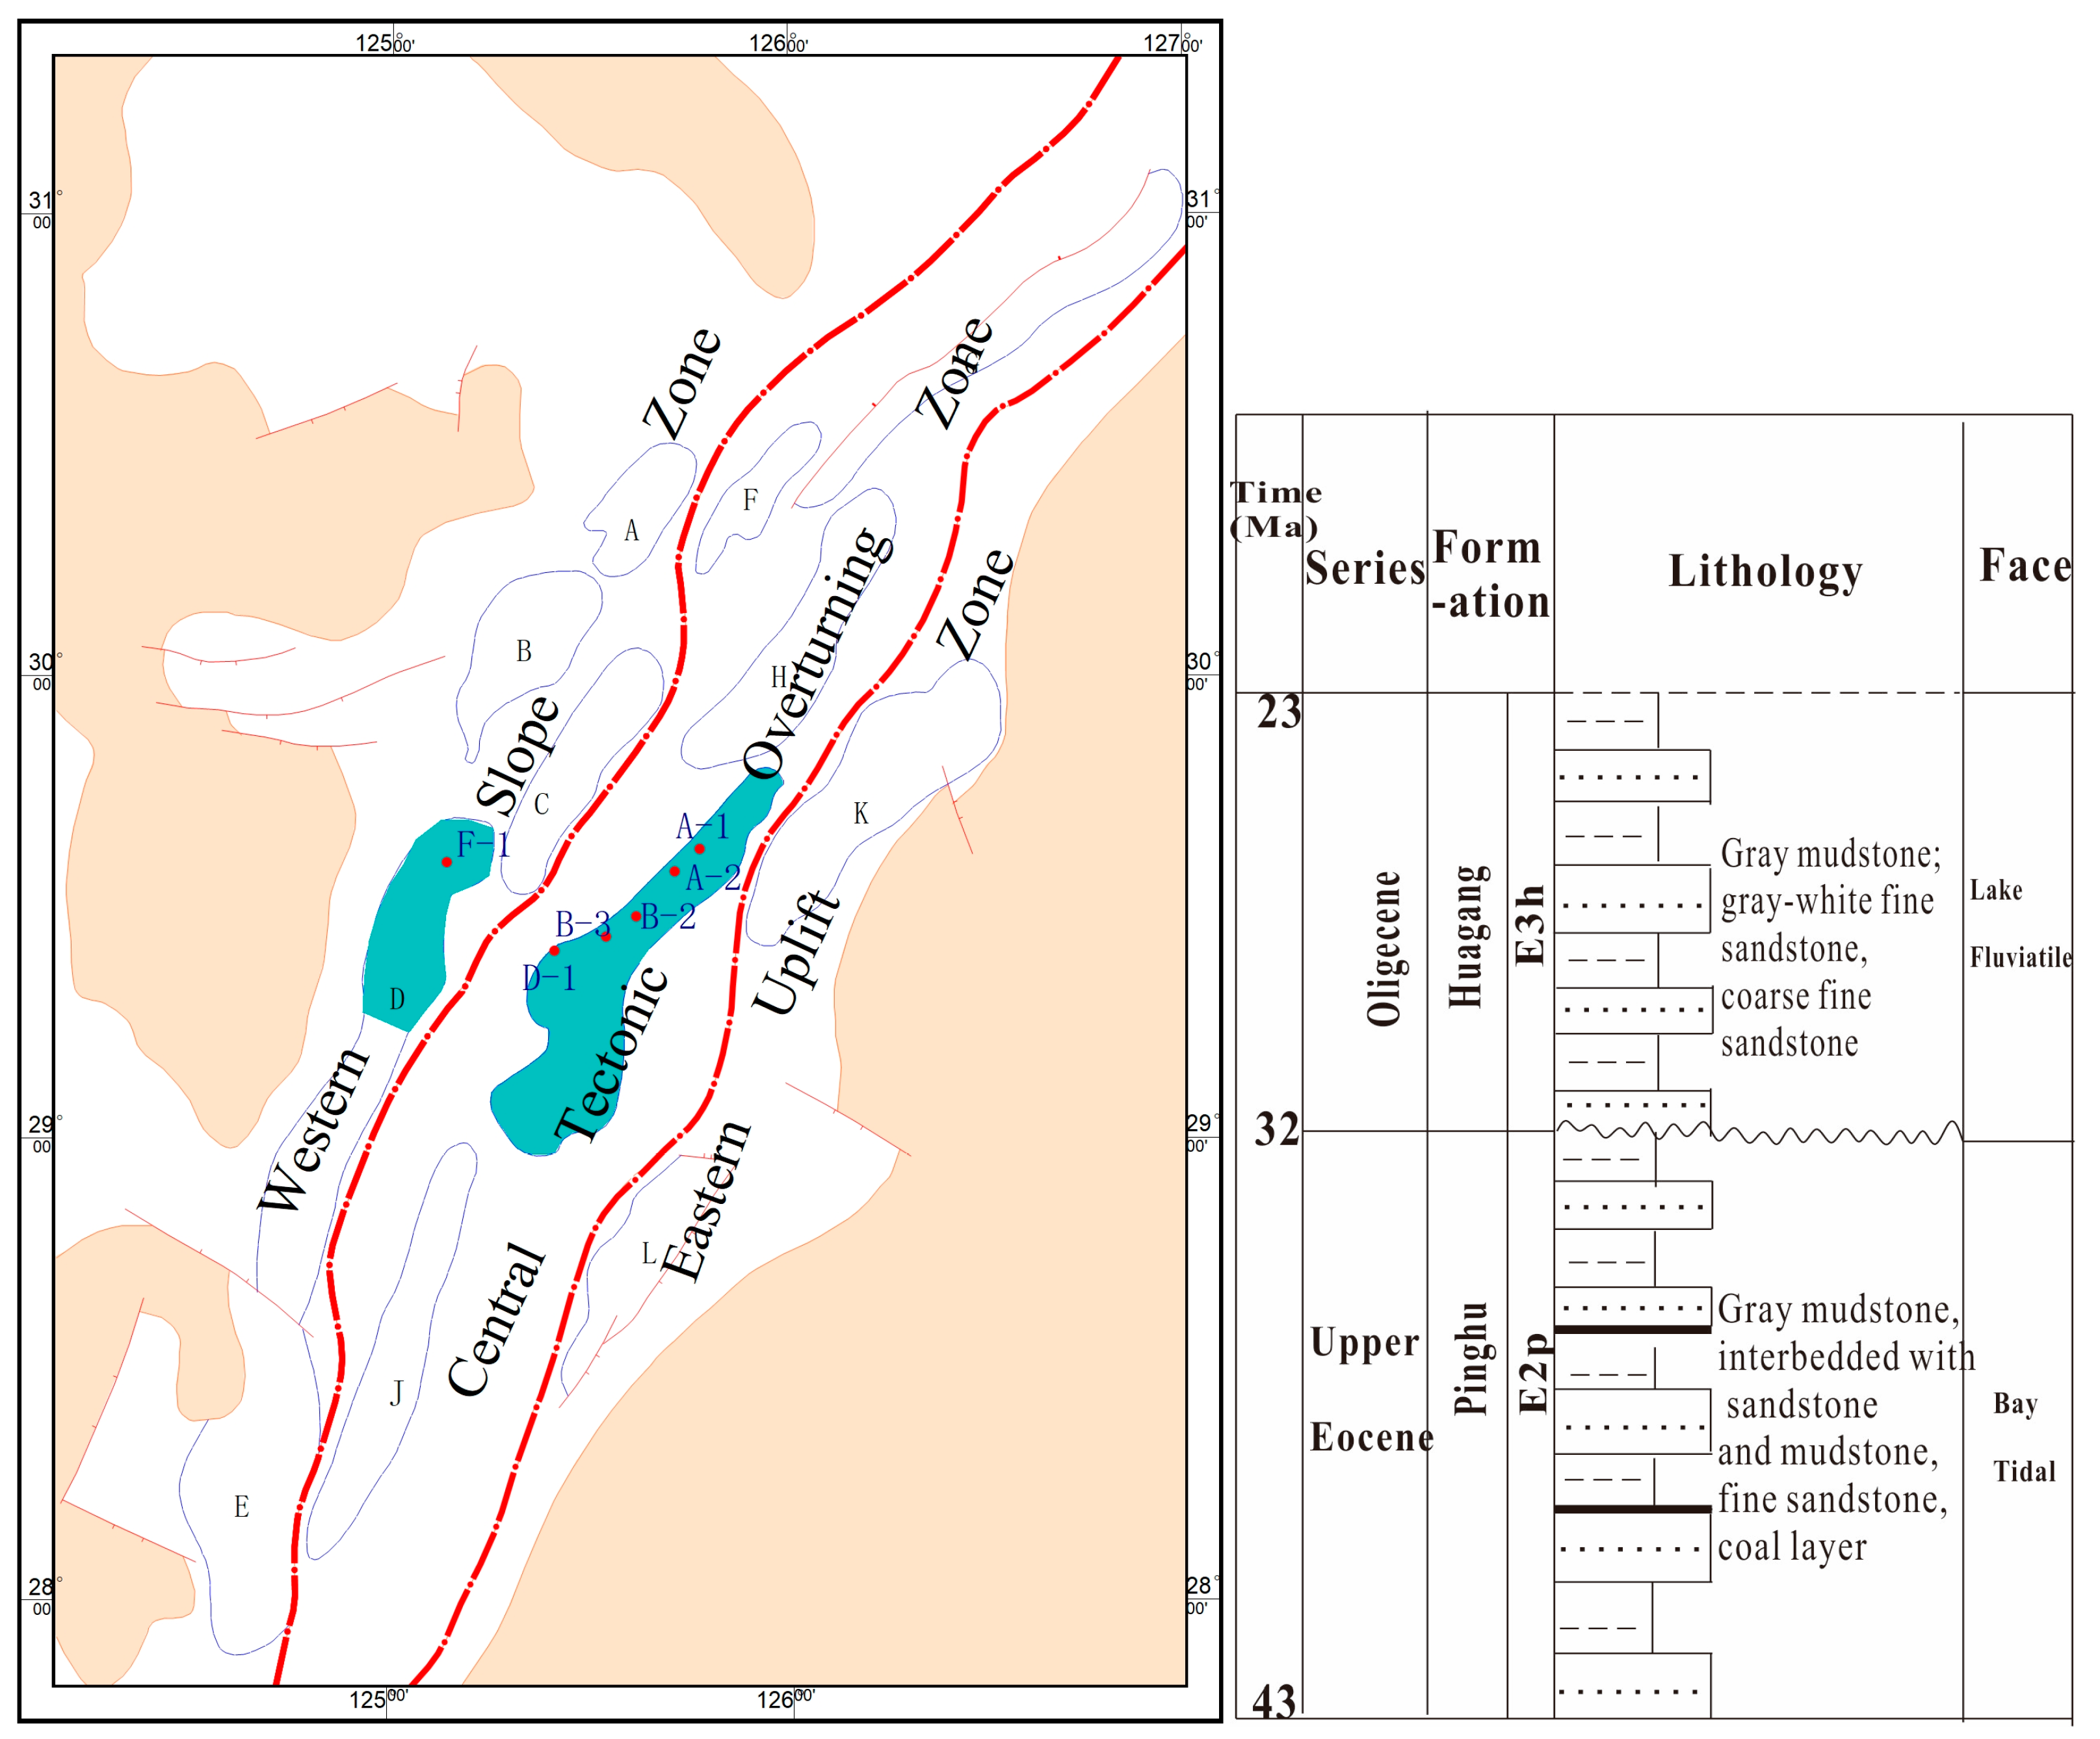
The study area is located in the Xihu Sag of the East China Sea Basin. The East China Sea Basin is a large offshore basin located off Shanghai and north of Taiwan Island, China. The Xihu sag is located in the central part of the East China Sea Basin. It spans about 350 km north–south and 150 km east–west, and the depression area is about 50,000 square kilometers. From west to east, the Xihu sag consists of the Western Slope Zone, the Central Tectonic Overturning Zone, and the Eastern Uplift Zone. At present, the main exploration areas are the central and southern parts of the central structural zone, as well as the central part of the western slope zone. The core samples selected for this paper were obtained from a total of five wells, with four located in the central tectonic overturning zone and one located in the western slope zone (Figure 1).
The main reservoir in the western slope zone is the Pinghu Formation (E2P), which is a Bay Tidal platform deposit. The main lithology is dark mudstone, coal rock, and fine sandstone. The main reservoir in the central tectonic overturning zone is the Huagang Formation (E3h), which is a river lacustrine deposit, with the main lithology being thick fine sandstone and mudstone.
2.2. Sample Information
We selected 10 samples from the Xihu sag, including nine cores from the Huagang Formation in the central tectonic zone and one core from the Pinghu Formation in the western slope zone (Table 1). The complete plunger samples had a diameter of 2.5 cm and a length of 4–5 cm. The core porosity and permeability were measured first. We selected three cores for vacuum pressurization saturation (vacuum for 4–6 h, water pressure 30 MPa, and saturation time of about 24 h). The water-saturated core was analyzed using the GWD-MRI combined detection instrument, with the driving pressure set to 0.3 MPa, 0.5 MPa, 0.8 MPa, or 1 MPa and the driving time varying from 1 min to 10 min. When displacement was completed, the T2 relaxation time was measured and MRI was performed. The MRI procedure took about 40 min. After the GWD-MRI measurement had been completed, the sample was dried and re-saturated with water. Then, seven cores were selected for vacuum pressurization saturation, following which the saturated cores were subjected to Cen-NMR experiments in order to detect water saturation changes under different centrifugal force conditions. The centrifugal speed ranged from 1500 to 7000 rpm, and the corresponding centrifugal force was 0.1–2.2 MPa. Finally, six samples were selected for the semi-permeable baffle (SPB) experiment. The natural gas driving pressure was set to 0–1.4 MPa and, for each pressure, the discharge of water had to stabilize before it could be recorded.
2.3. Experiment
2.3.1. Gas-Driven Water Displacement–Magnetic Resonance Imaging (GWD-MRI)
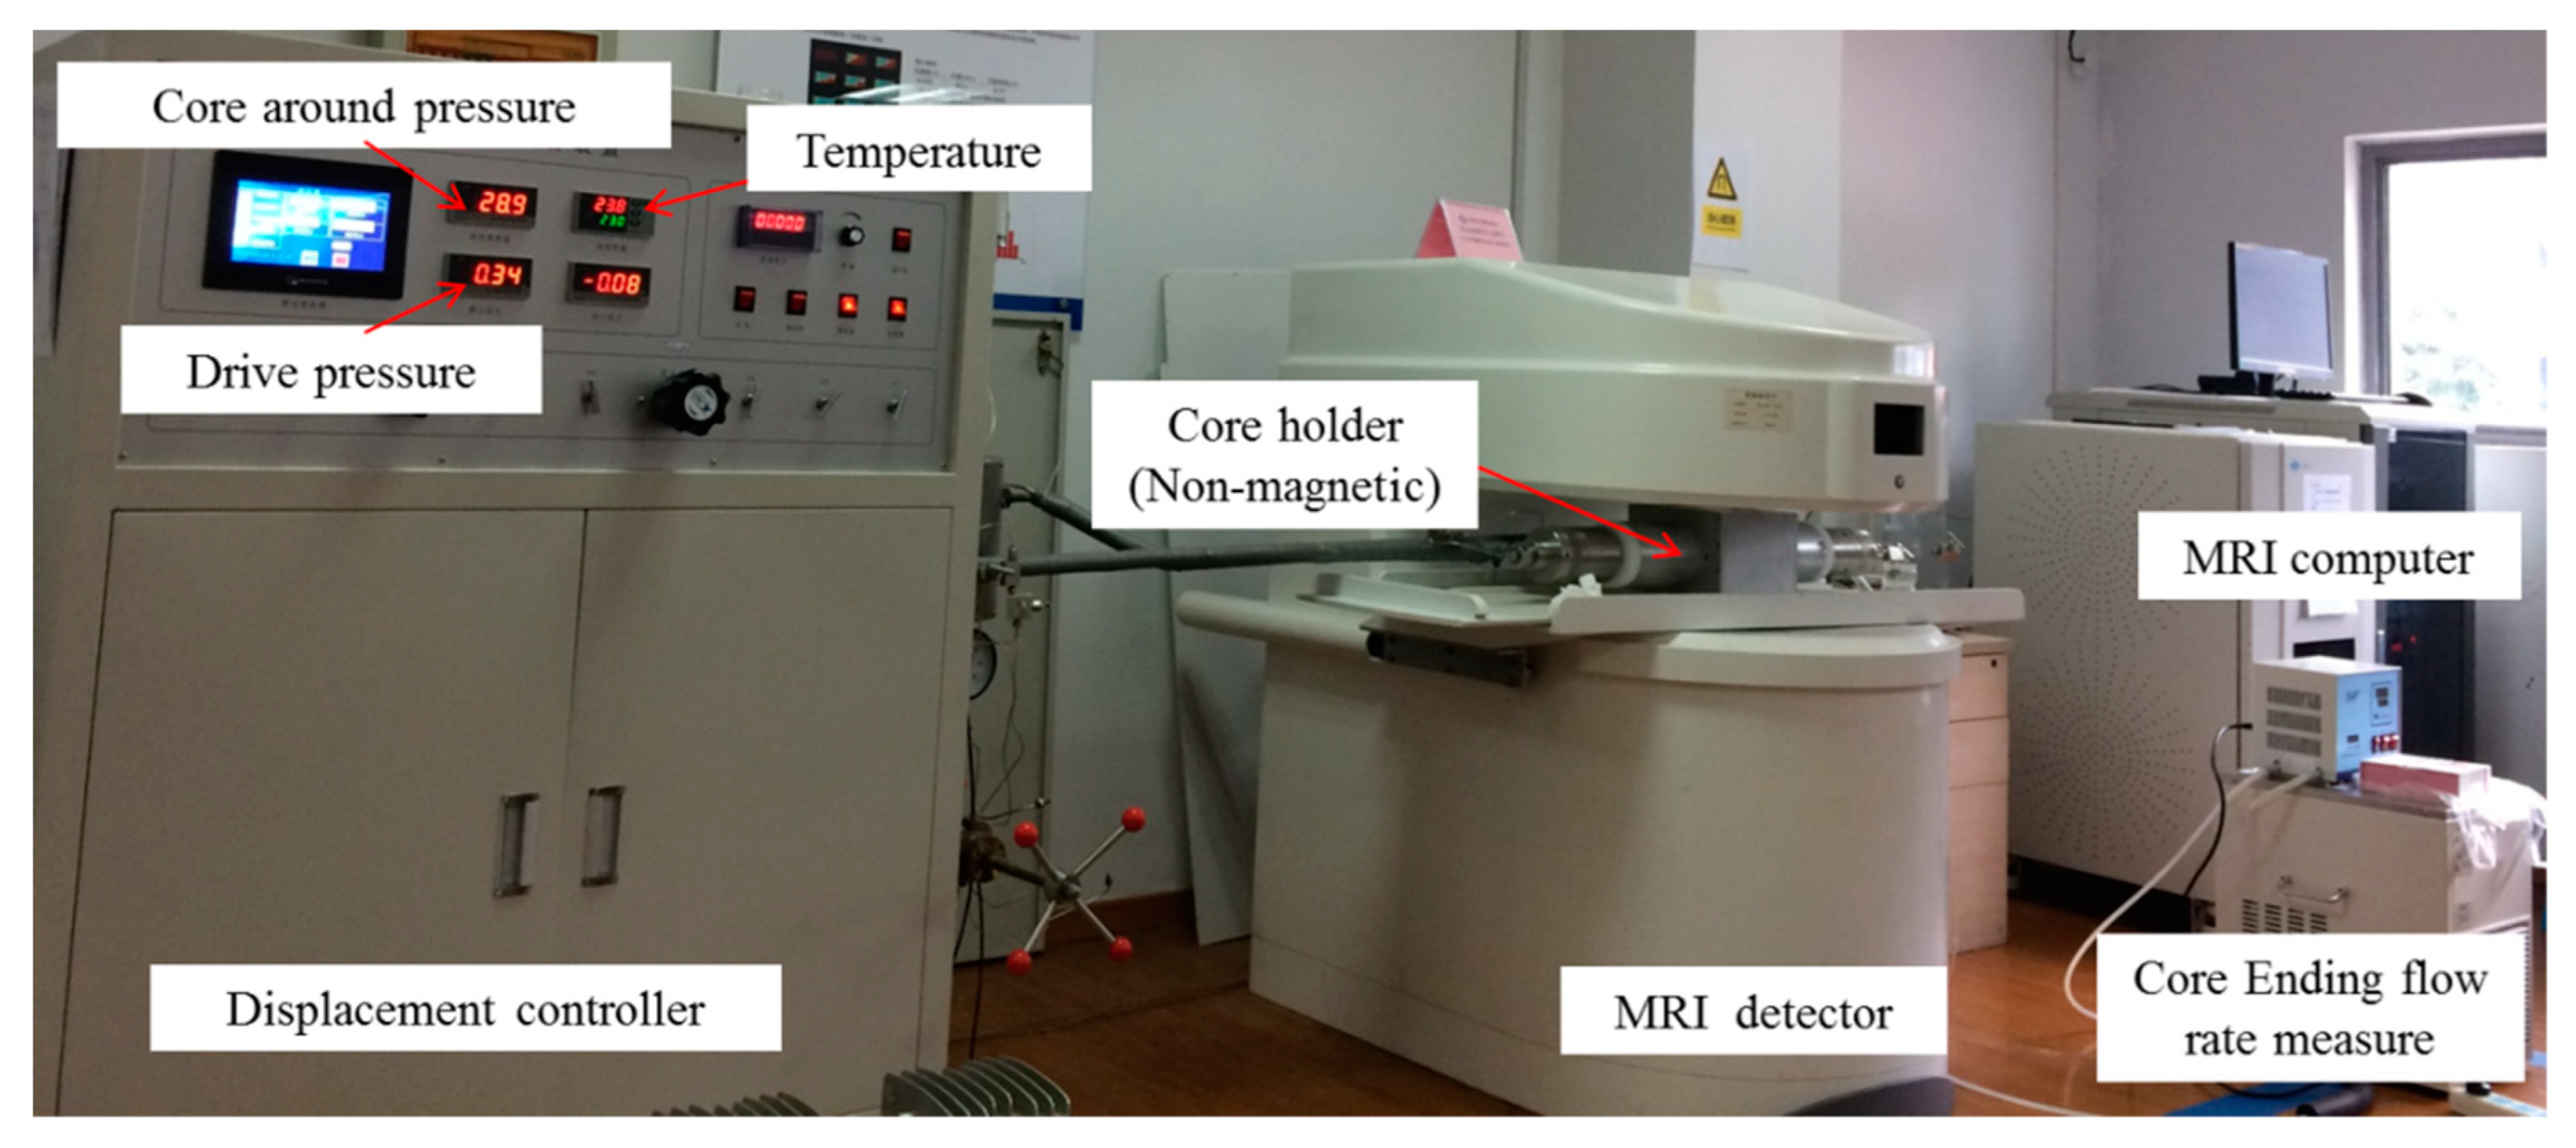
Displacement–magnetic resonance imaging combined equipment can be used to visualize the distribution of formation water during the displacement process. The displacement instrument was an MR-HTHP-type high-temperature, high-pressure displacement device. The confining pressure of the holder was 0–30 MPa and the driving pressure was 0–5 MPa. Magnetic imaging was conducted using a MacroMR12-150H nuclear magnetic resonance instrument, with a coil diameter of 150 mm (allowing it to form a stable magnetic field at a range of 100 mm), frequency of 12.80 MHz, and magnet strength of 0.3 T. The imaging time was about 40 min per image, and the displacement had to be stopped during the imaging process. The nuclear magnetic resonance imaging (MRI) instrument could also perform NMR T2 spectrum detection at the same time, for which the echo interval was set to 0.15 ms and the measurement time was 8000 ms. The CPMG sequence [20,21,22] can be used for quantitative evaluation of the water content (Figure 2).
The main experimental steps were as follows:
① Three selected samples were dried in an oven at 105 °C for 4 h, then cooled to room temperature in a drying chamber. The weight, length, diameter, porosity, and permeability were then measured.
② The formation water, with salinity of 10,000 mg/L, was formed by combining 1 L of water with 1020 mg of NaHCO3, 1500 mg of Na2SO4, 150 mg of CaCl2, and 7330 mg of NaCl.
③ The samples were put into the sample chamber of the High-Pressure Saturation Device and vacuumed for 6 h. Then, the prepared formation water was injected, with water continuously added to a pressure of up to 30 MPa, with a saturation time of 12 h. After saturation, the sample was taken out and immersed in prepared formation water.
④ On the magnetic resonance imaging computer, the echo interval was set to 0.15 ms and the detection time to 8000 ms. The standard samples were put into the core holder of the displacement device, and the relationship between the water content and detection signal strength was calibrated.
⑤ The sample was taken out of the formation water, the surface water was wiped off using a wet tissue, and the sample was put into the core holder of the displacement device. With the surrounding pressure brought up to 30 MPa, the NMR T2 spectrum and MRI image were obtained.
⑥ The driving pressure was set and displacement was conducted for a certain period of time. Then, the driving was stopped and the NMR T2 spectrum and MRI image were obtained again.
⑦ The previous step was repeated until the natural gas had completely displaced the core, and little change was observed in the NMR T2 spectra and MRI images.
⑧ The driving pressure was released to atmospheric pressure slowly, following which the core was removed from the device.
⑨ The core was replaced with the next sample, and the experiment was repeated. After all three samples had been submitted to this experiment, they were dried.
2.3.2. Semi-Permeable Baffle (SPB) Charging Experiment
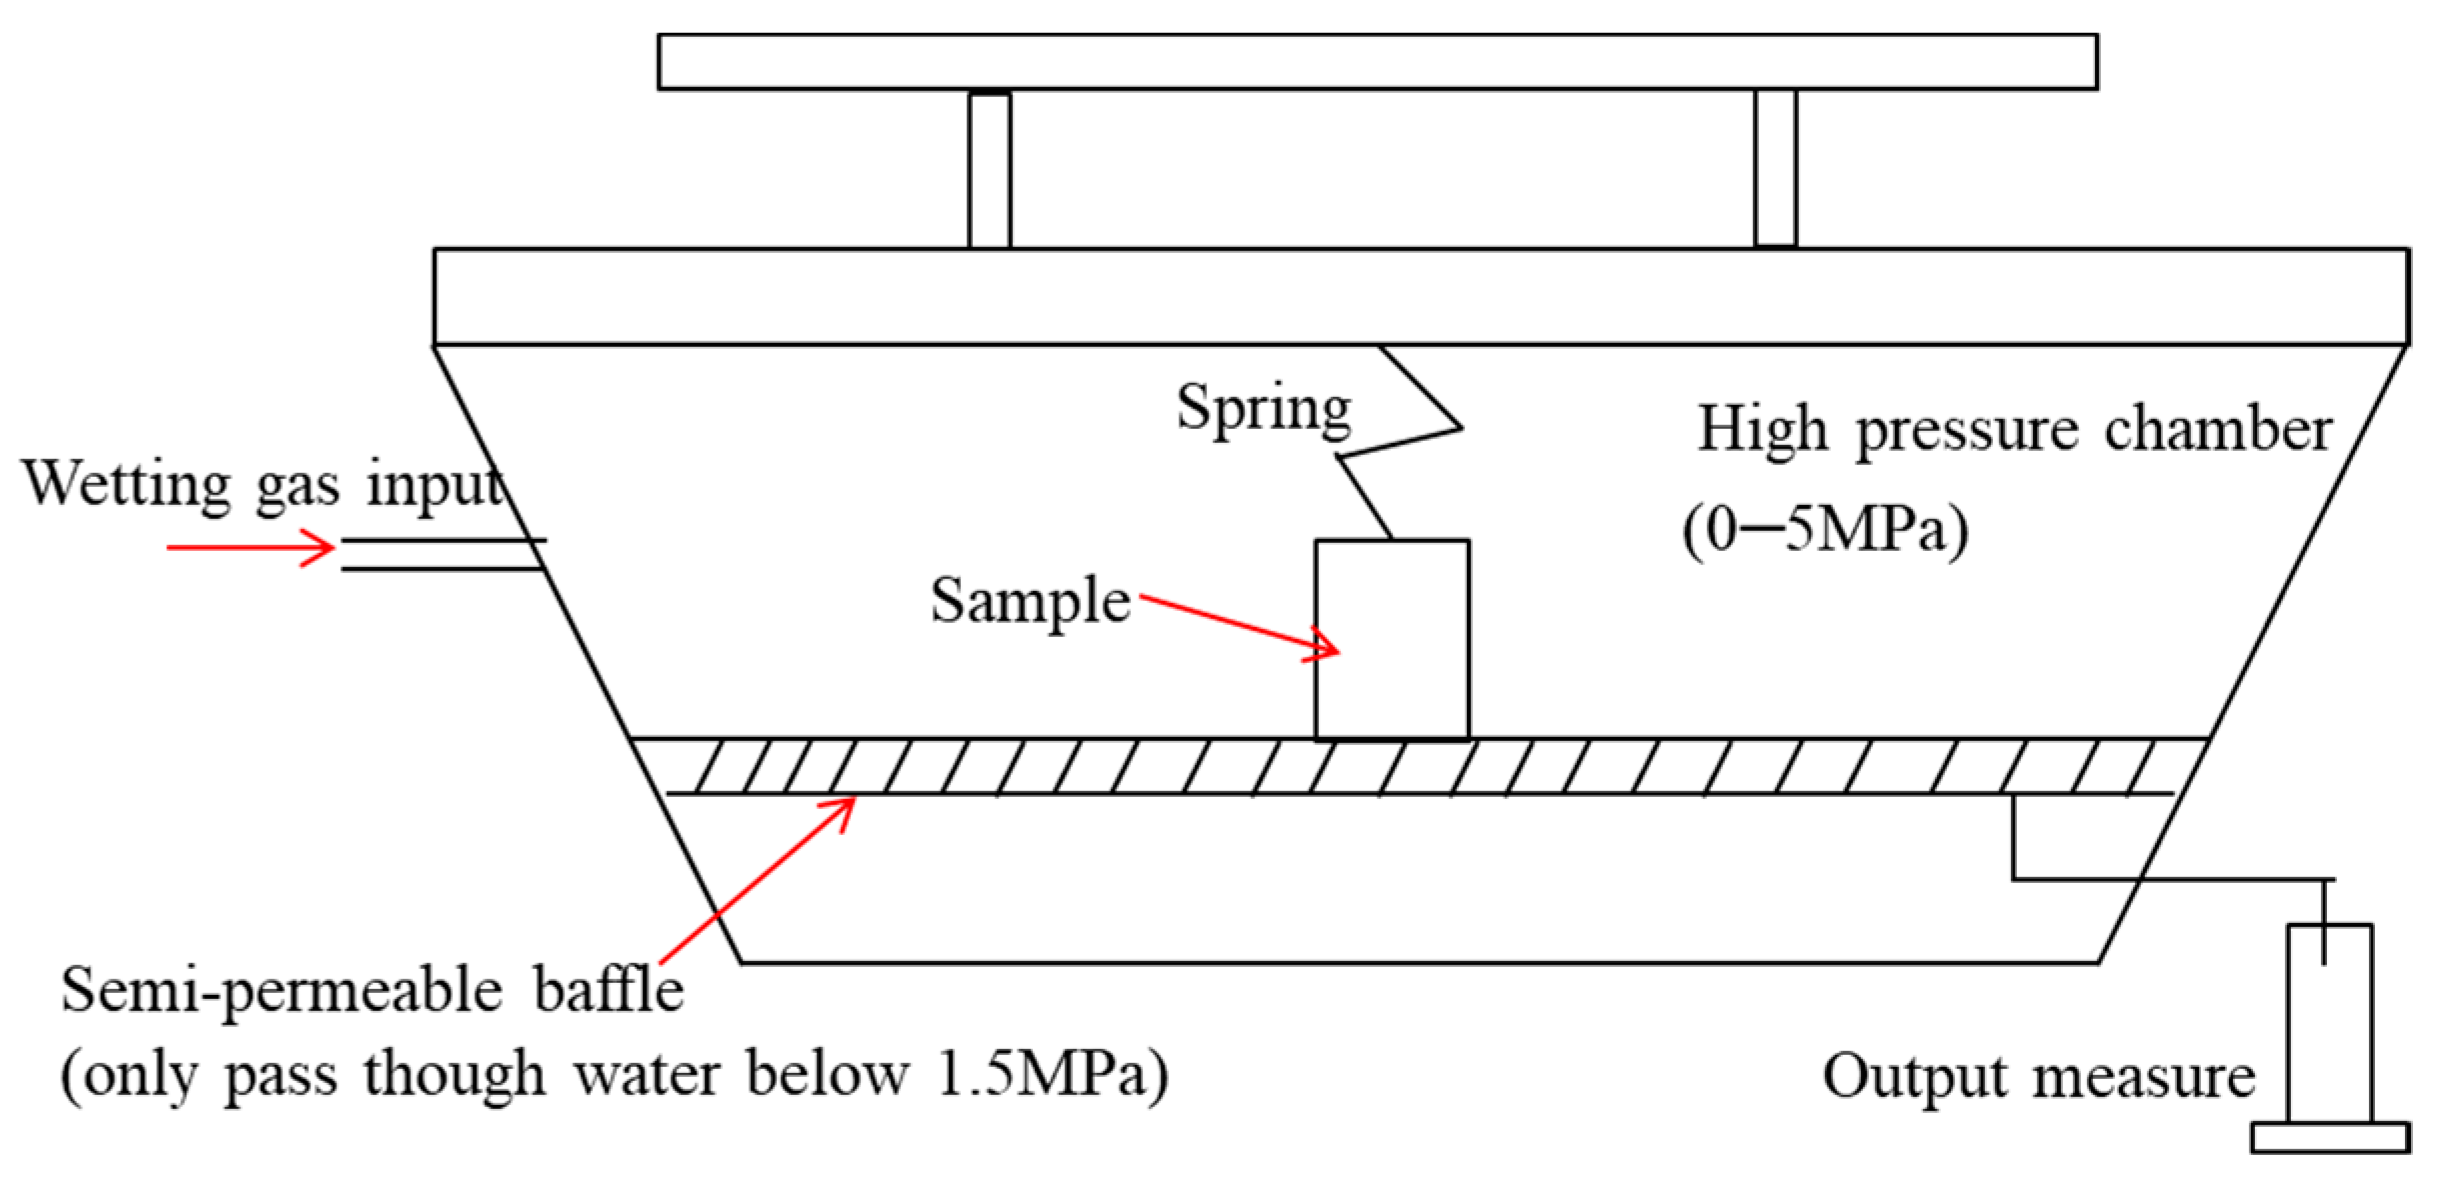
This experiment involved the use of a baffle—which allows water to pass through but does not allow natural gas to pass through—as the compartment of the displacement chamber. When natural gas exists in the high-pressure chamber, the natural gas enters the core under the action of gas pressure, thus discharging part of the water. Water seeps out into the measuring cup through the semi-permeable baffle, while the natural gas cannot escape from the high-pressure chamber, thus simulating the accumulation characteristics of the reservoir. We used a GMD-III-type high-temperature, high-pressure capillary pressure resistivity continuous measuring instrument (Figure 3), with a driving pressure of 0–1.4 MPa, pressure stability accuracy of 0.01 MPa, and formation water volume measurement accuracy of 0.005 mL.
The main experimental steps were as follows:
① The sample was dried and cooled to room temperature. Then, formation water (prepared as described above) was used to saturate the sample with a high-pressure saturation device (similar to steps ①–③ in the GWD-MRI experiment).
② The saturated core was taken out of the formation water and placed into the sample chamber. Then, gas was added to the chamber, the pressure was allowed to stabilize for 8 h, and the volume of liquid discharged was recorded.
③ The pressure was increased multiple times, again stabilizing for 8 h, recording the resulting volume, and stopping the experiment when the pressure reached around 1.4 MPa.
④ The pressure of the sample chamber was released, the sample was taken out, and the device was cleaned.
2.3.3. Centrifugal Nuclear Magnetic Resonance (Cen-NMR) Experiment
NMR was conducted using a MacroMR12-150H (the same MRI device as shown in Figure 2), with a frequency of 12.80 MHz, magnet strength of 0.3 T, coil diameter of 150 mm, echo interval set to 0.15 ms, and measurement time of 8000 ms. The CPMG sequence [20,21,22] was used. For water saturation, we carried out vacuum pressurization saturation with a vacuum for 4–6 h, water pressure of 30 MPa, and saturation time of 24 h. The centrifugal speed was set as 1500 rpm, 3000 rpm, 4000 rpm, or 7000 rpm (the maximum centrifugal speed).
The main experimental steps were as follows:
① The sample was dried and cooled to room temperature. Then, formation water was used to saturate the samples in a high-pressure saturation device (similar to steps ①–③ in the GWD-MRI experiment).
② The sample was taken out of the formation water, the surface water was wiped off using a wet tissue, and it was put into the sample tray of the MR12-150H device. The T2 spectrum was measured, following which the sample was retrieved and wrapped in a wet tissue to reduce the impact of evaporation.
③ Three cores with weight similar to the first sample were further selected. Their T2 spectra were recorded, and the cores were retrieved and wrapped in wet tissue.
④ After completing the T2 measurements, the samples were loaded into a centrifuge, and placed symmetrically in pairs. The centrifuge was set to 1500 rpm and, after centrifugation for 0.5 h, the rock cores were taken out. They were then wrapped in wet tissue and the T2 spectra were measured sequentially.
⑤ After completing the above procedure at 1500 rpm, 3000 rpm, 4000 rpm, 5000 rpm, 6000 rpm, 6500 rpm, and 7000 rpm, the experiment for this group of four samples was completed.
⑥ The above experimental steps were repeated until all of the samples had been tested.
3. Result and Discussion
The displacement-MRI experiment was mainly conducted to analyze the gas infiltration characteristics in the migration layer, the semi-permeable baffle experiment was mainly conducted to analyze the trap charging characteristics, and centrifugal-NMR was mainly conducted to analyze the short-term charging characteristics.
3.1. Migration Layer Charging Results and Discussion
We analyzed the nuclear magnetic resonance imaging (MRI) results while carrying out gas-driven water displacement (GWD), which was completed for three samples.
3.1.1. Sample A10 Experimental Results and Discussion of Start-Up Pressure
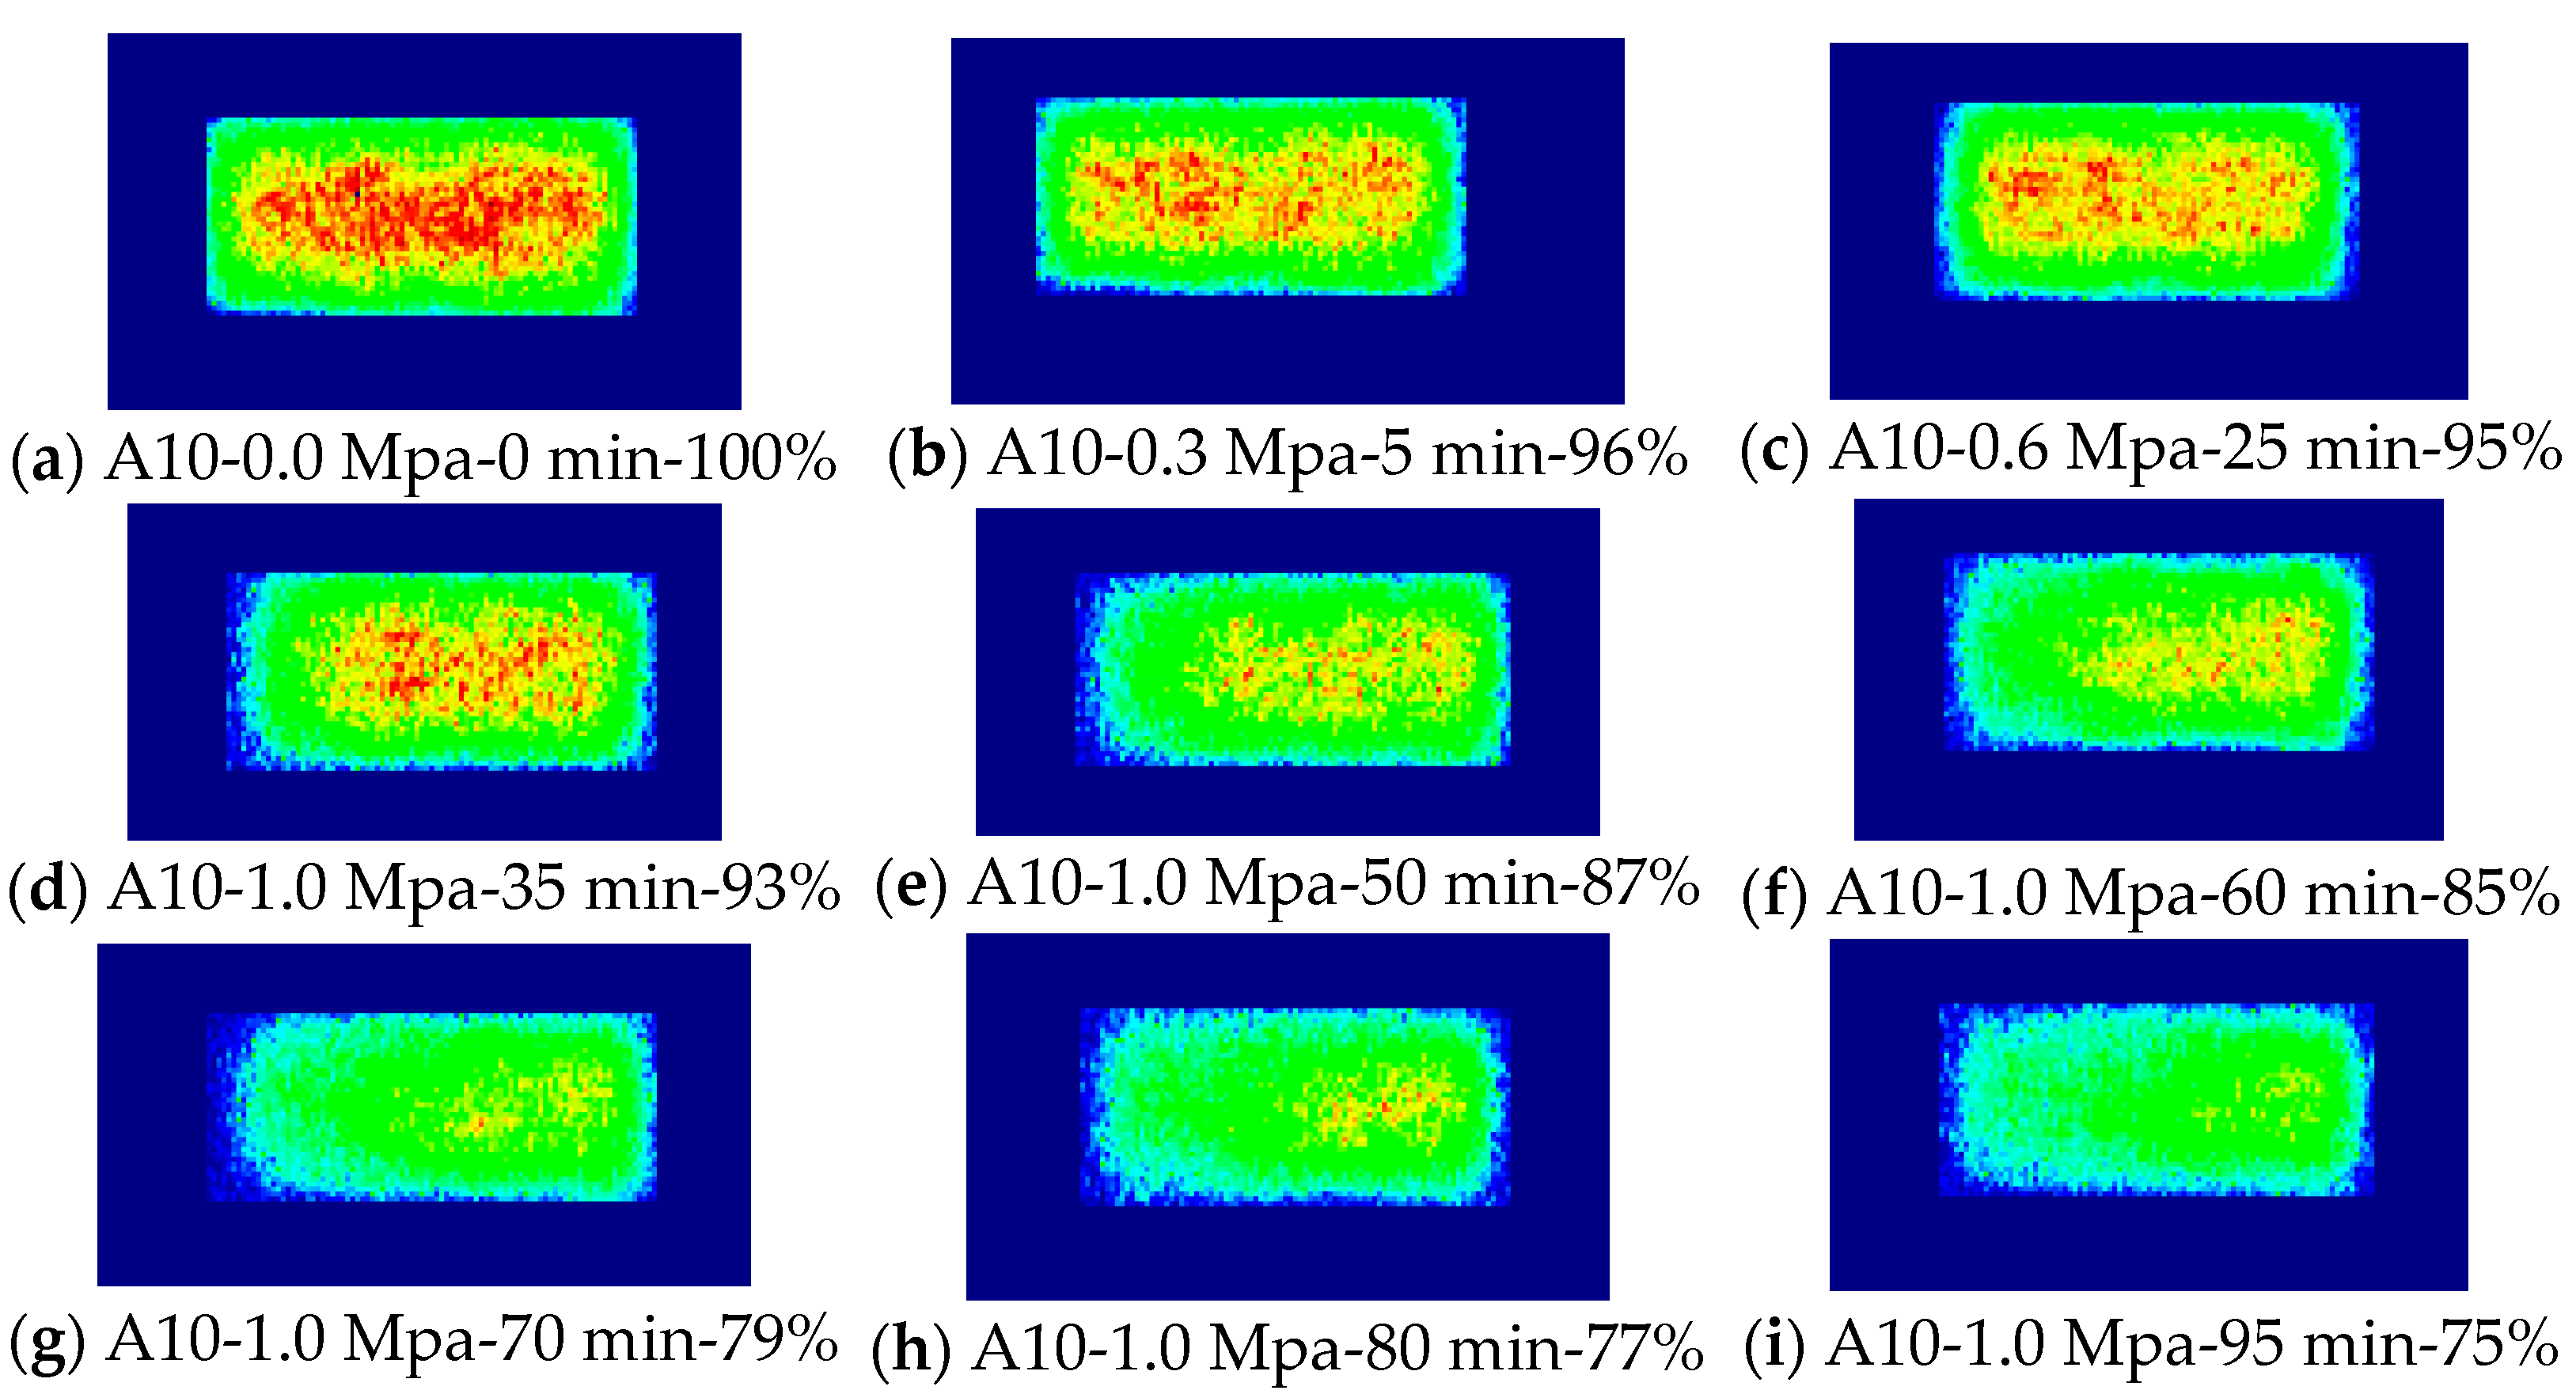
Sample A10 (4320.9 m from Well A-2) had a permeability of 0.34 mD and a porosity of 8%. After a drive pressure of 0.3 MPa for 5 min and a drive pressure of 0.6 MPa for 20 min (for a cumulative driving time of 25 min), the nuclear magnetic imaging (MRI) results showed that the residual water was evenly distributed, indicating that natural gas cannot charge low-permeability cores under the condition of 0.6 MPa. After 0.3 MPa and 0.6 MPa driving, the water saturation of the samples decreased, which is considered to be the result of water evaporation caused by heating the core throughout the 40 min required for imaging.
Then, the drive pressure was increased to 1 MPa for 10 min (for a cumulative driving time of 35 min). The water content in the front of the core decreased, while that at the center and the end of the core did not change, and the water saturation was 93%, indicating that 1 MPa pressure allowed for charging into the core. When we continued to use 1 MPa driving pressure for 15 min (for a cumulative driving time of 50 min), the water content in the front of the core continued to decrease, and the water content in the center and end of the core began to decrease, with a water saturation of 87%. With a cumulative driving time of 60, 70, and 80 min, the water content decreased at all different core positions. Finally, when the cumulative driving time was 95 min, the water content at the front of the core was very low and the water content at the end of the core had also decreased significantly, with a water saturation of 75%.
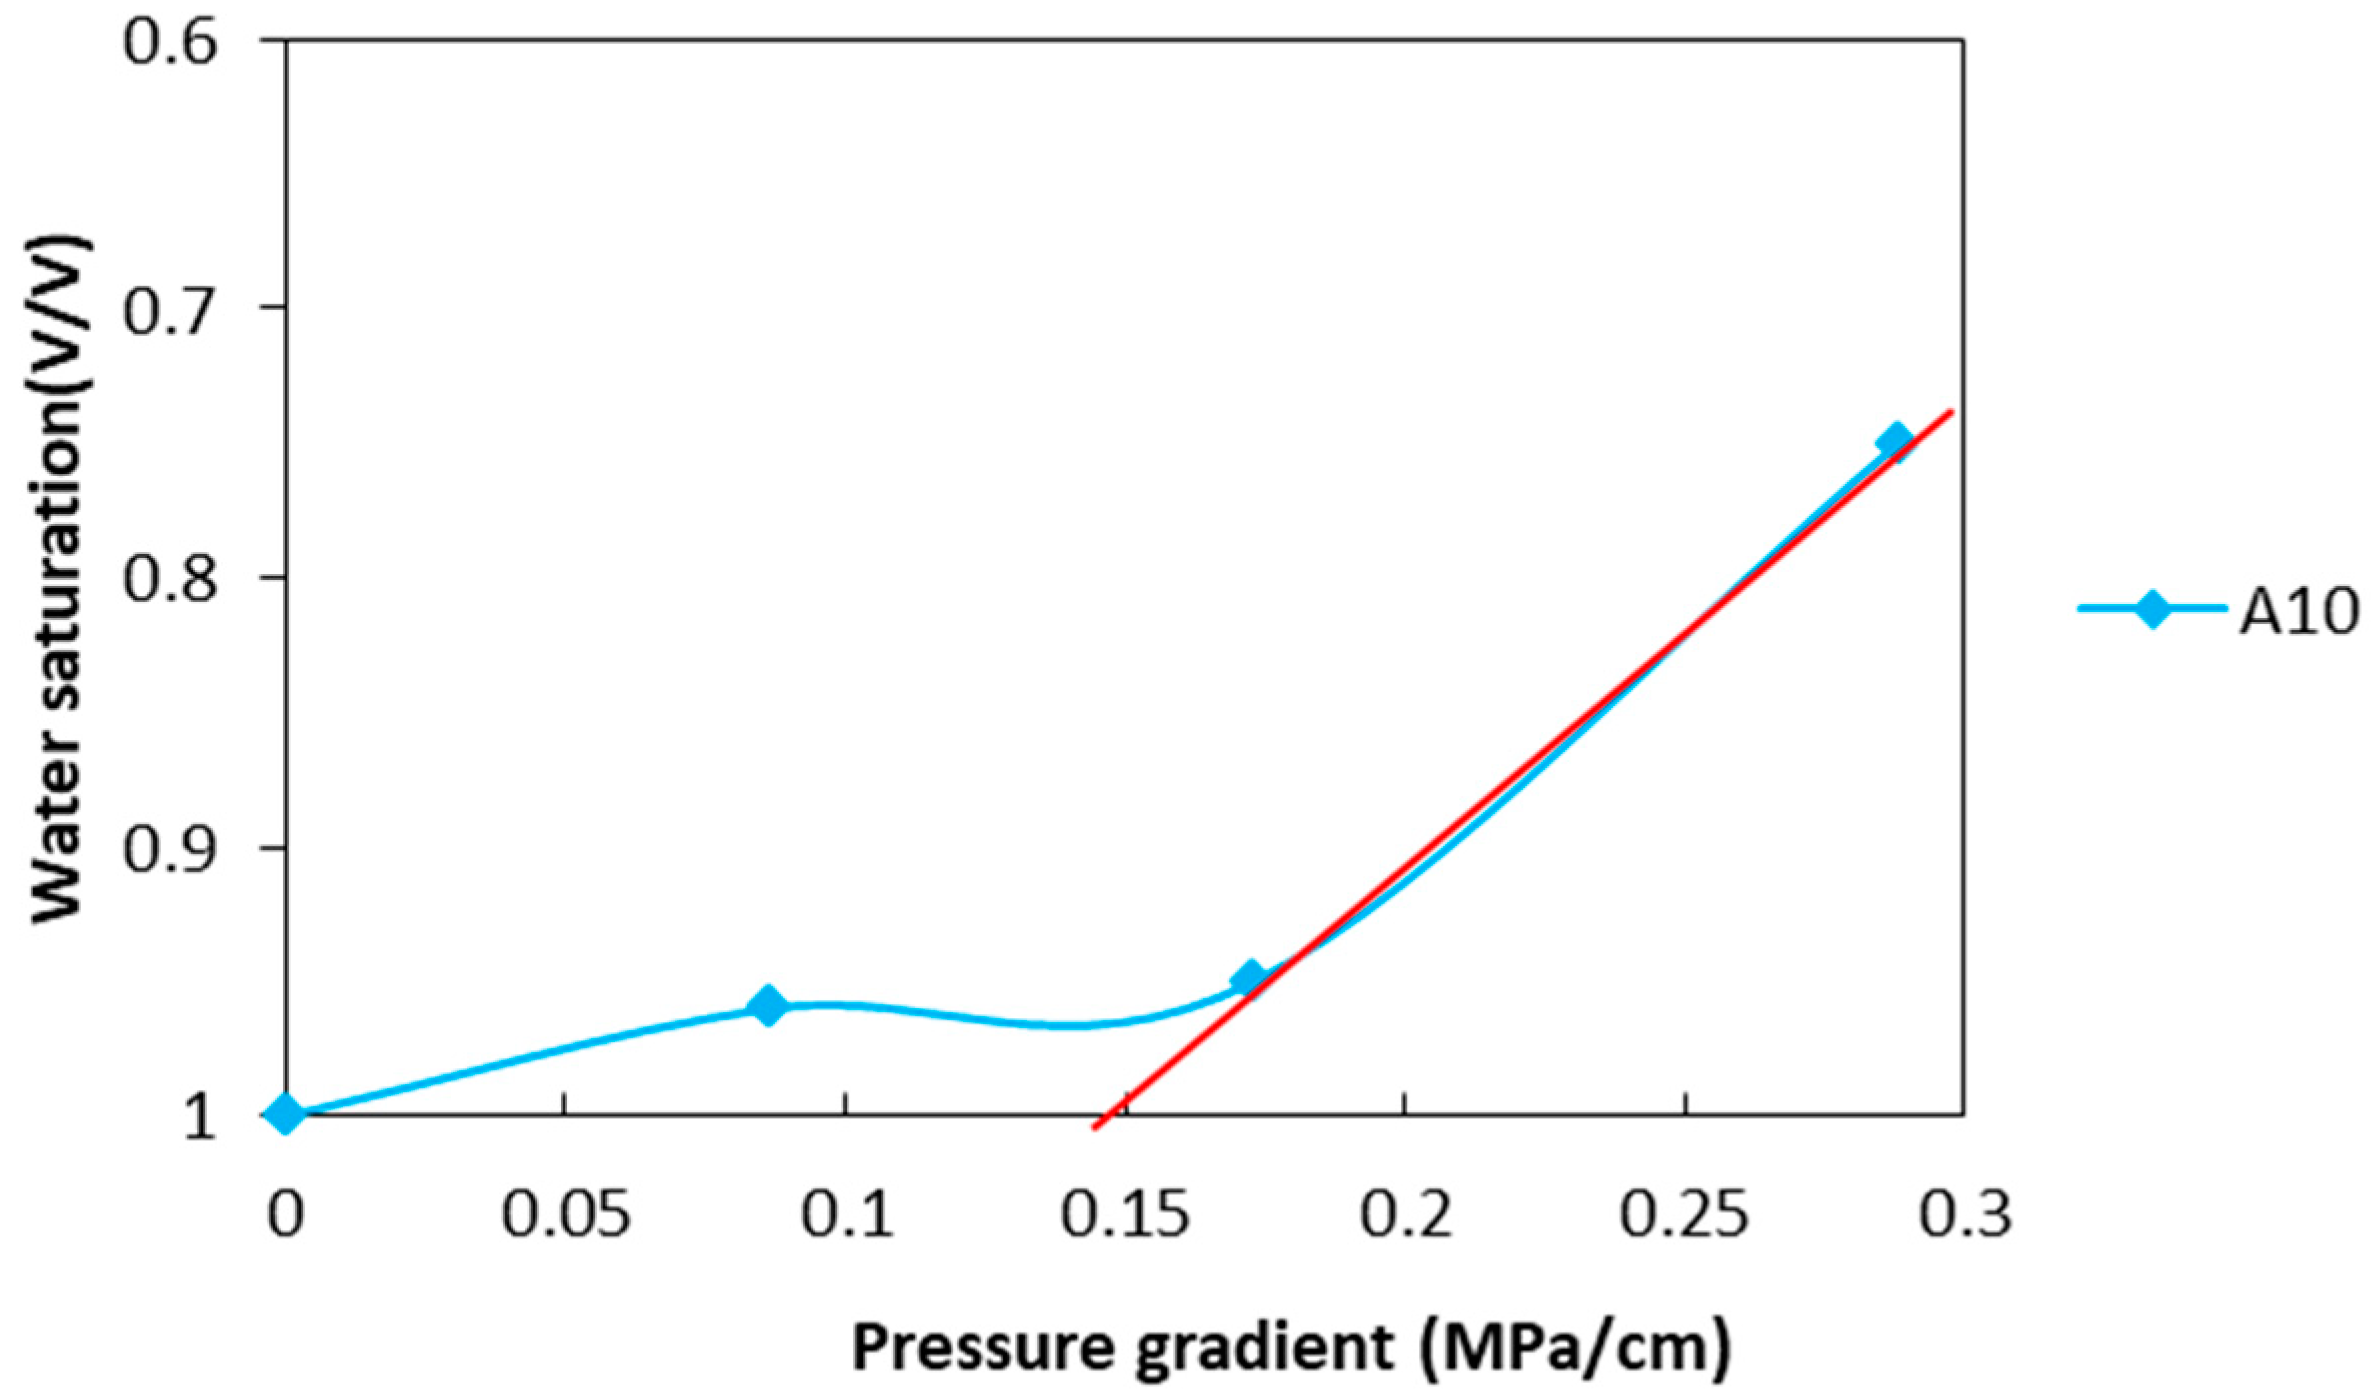
An important feature of the migration layer charging infiltration is that there is a start-up pressure gradient. When the driving pressure gradient is lower than the starting pressure gradient, the natural gas cannot drive the formation water; only when the driving pressure gradient is greater than the start-up pressure gradient can the natural gas drive the formation water. The water saturation of sample A10 was basically unchanged at driving pressures of 0.3 MPa and 0.6 MPa. However, when the driving pressure was 1 MPa, the water saturation began to decrease. After the experiment had completed, the final water saturation under 1 MPa was 75% (Figure 4i). Samples A25 and A45 had a higher permeability, and no start-up pressure gradient was observed during the physical modeling experiments. For a migration layer of about 0.3 mD, the starting pressure was approximately 0.6 MPa (Figure 4c), the core length was 3.47 cm, and the starting pressure gradient was 0.15 MPa/cm (Figure 5). Some scholars have also observed a start-up pressure gradient in oil-driven water displacement experiments [4], where the start-up pressure gradient for oil-driven water is relatively high: generally, for a 0.1 mD core, the start-up pressure was about 0.6–1 MPa/cm [4], which was affected by the oil viscosity. From this physical modeling experiment, it can be considered that, when the permeability was greater than 1 mD, the start-up pressure gradient could not be observed.
3.1.2. Sample A25 Experimental Results and Discussion of Driving Frontier
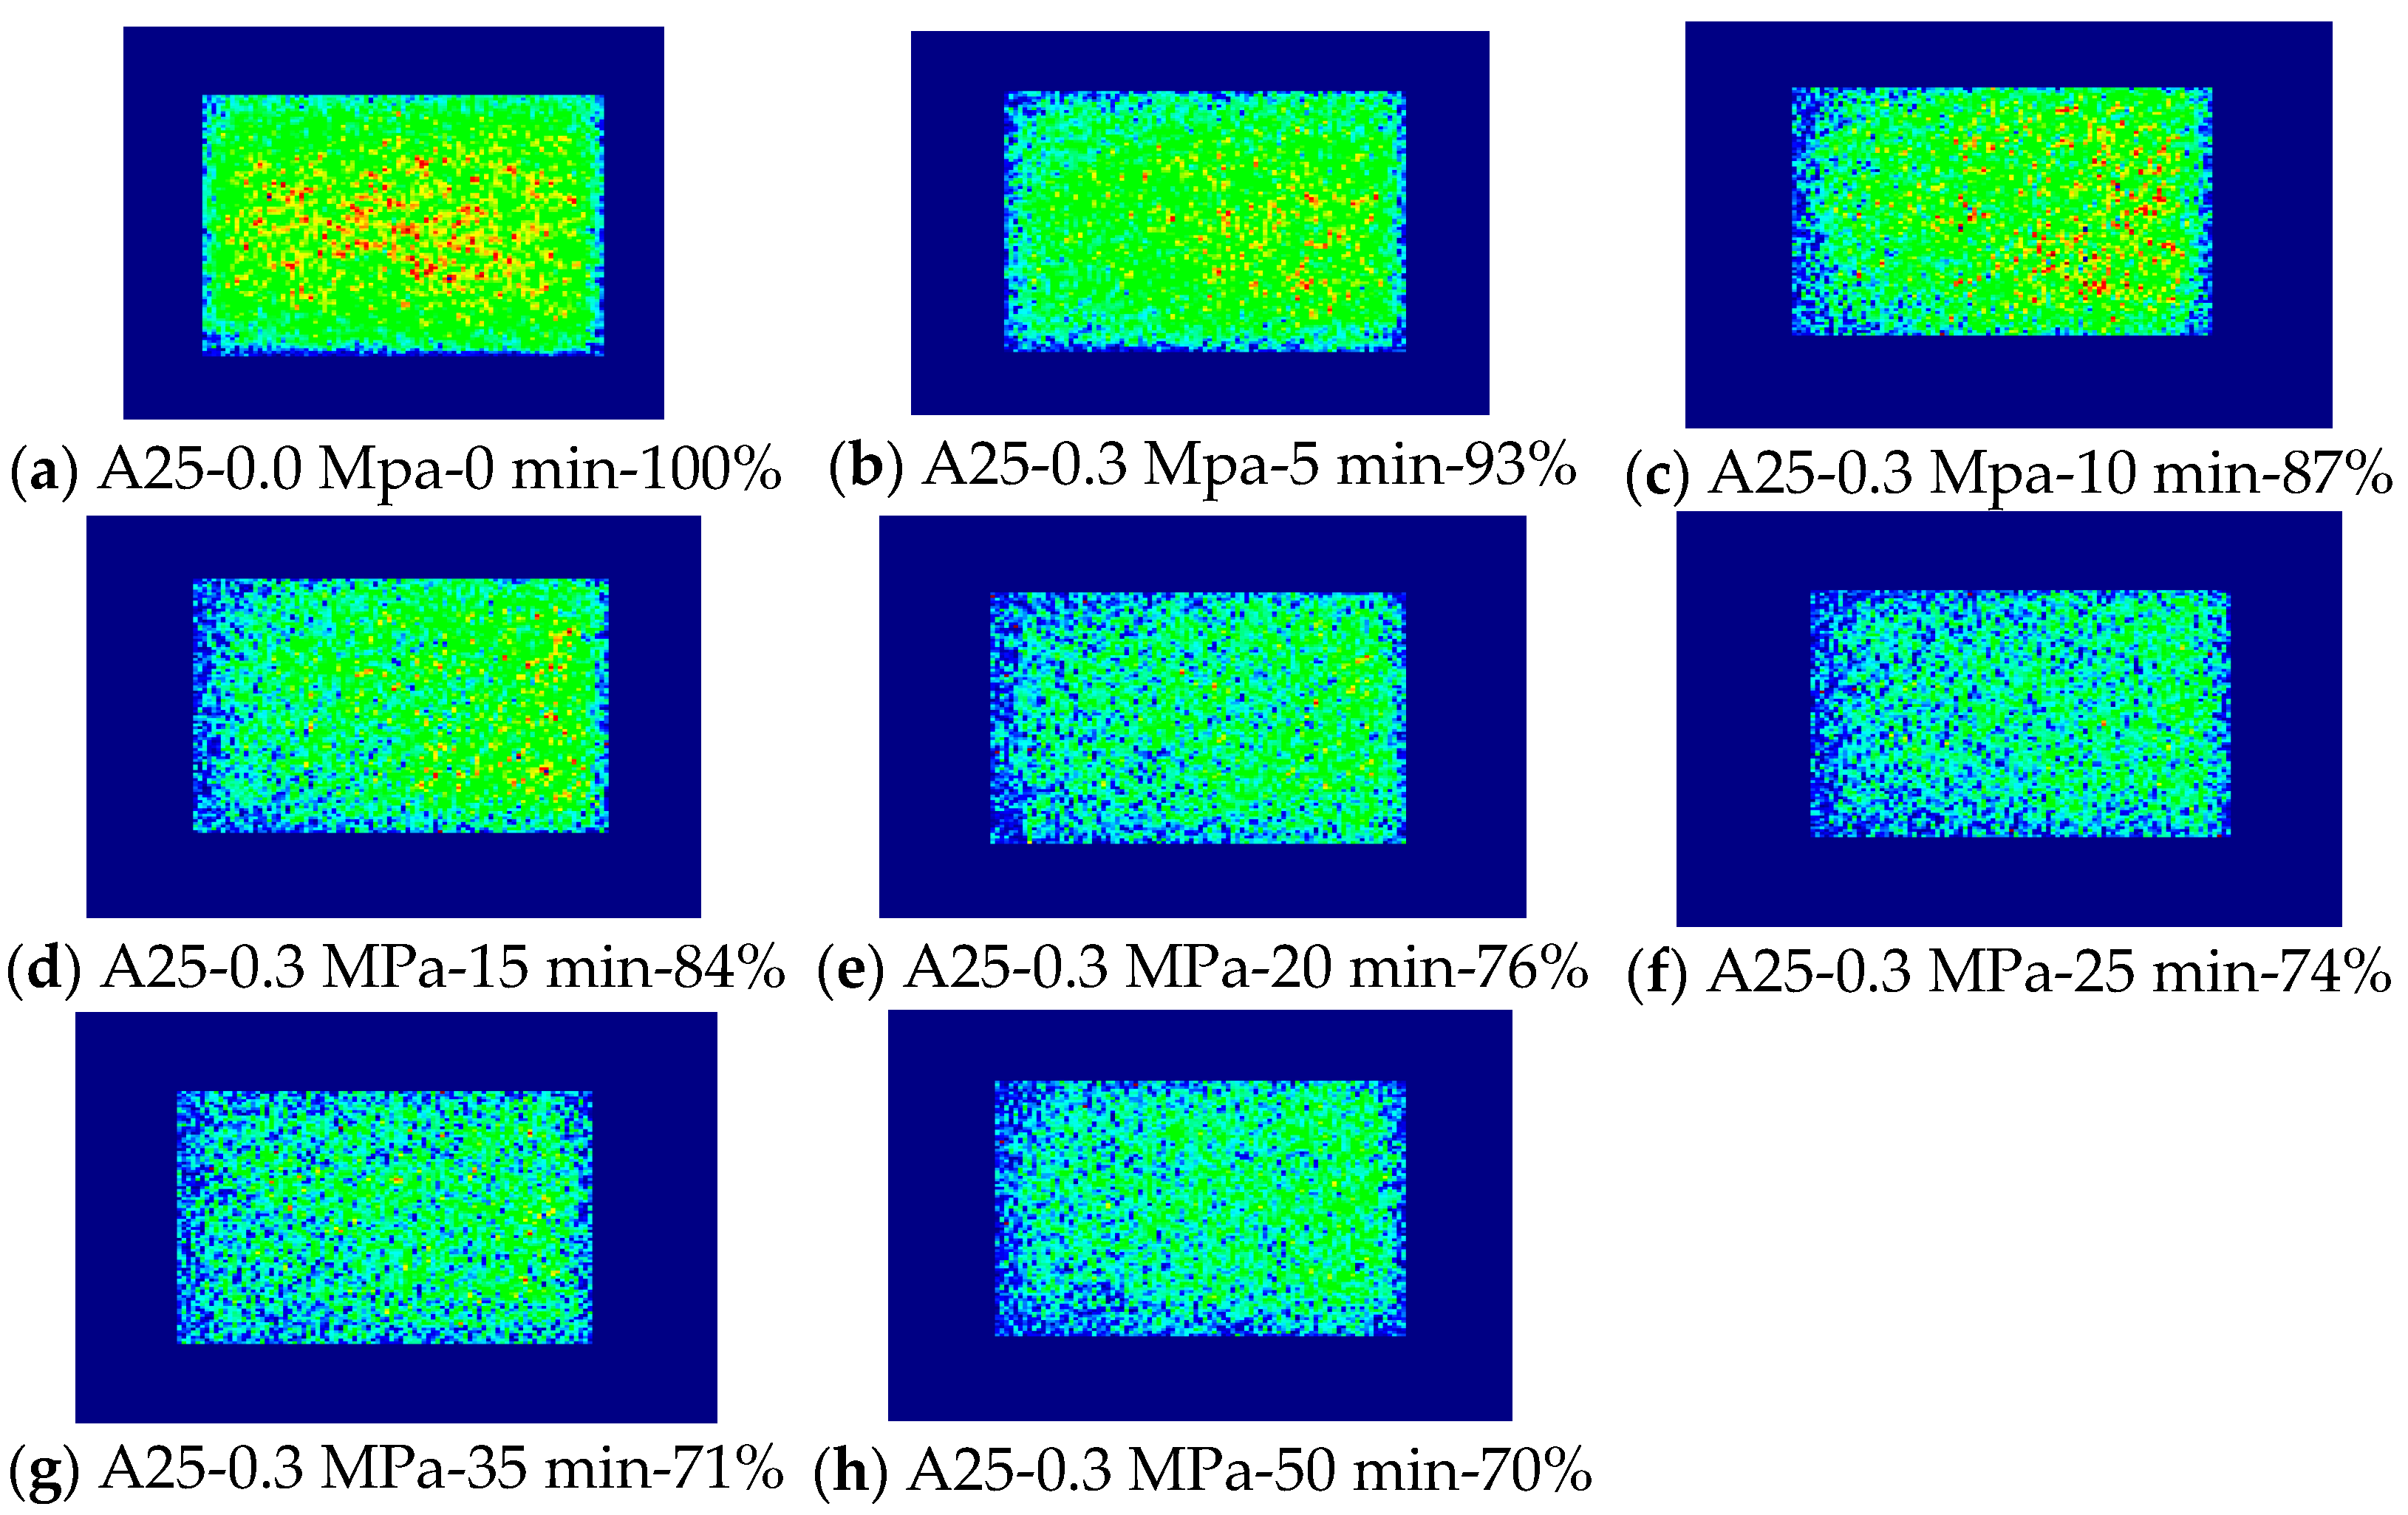
Sample A25 (4324.9 m from Well D-1), with a permeability of 1.39 mD and porosity of 8.2%, was tested at only one driving pressure: 0.3 MPa. After 5 min of driving, the water content in the front of the core decreased significantly, and the water content in the center and the end of the core also began to decrease, with a water saturation of 93%. This result indicates that 0.3 MPa was sufficient for charging into a medium-permeability core. After driving for a further 5 min (for a cumulative driving time of 10 min), the water content in the center and the end of the core decreased slowly, while the water content of the front end of the core decreased significantly, with a water saturation of 87%. The water content at the end of the core was similar to that in the original sample, but the water content in the center and the front of the core decreased significantly, reflecting that the natural gas had driven the water at the front of the core to the end of the core. With a cumulative driving time of 25 min, the water content throughout the core was equal, indicating that the natural gas had completely infiltrated the core, displacing most of the movable fluid; the water saturation was 74% at this time. Continuing to use 0.3 MPa for driving, the water content throughout the whole core decreased, indicating that natural gas could still carry fluid away from the core. After a cumulative driving time of 50 min, the water saturation was 71%.
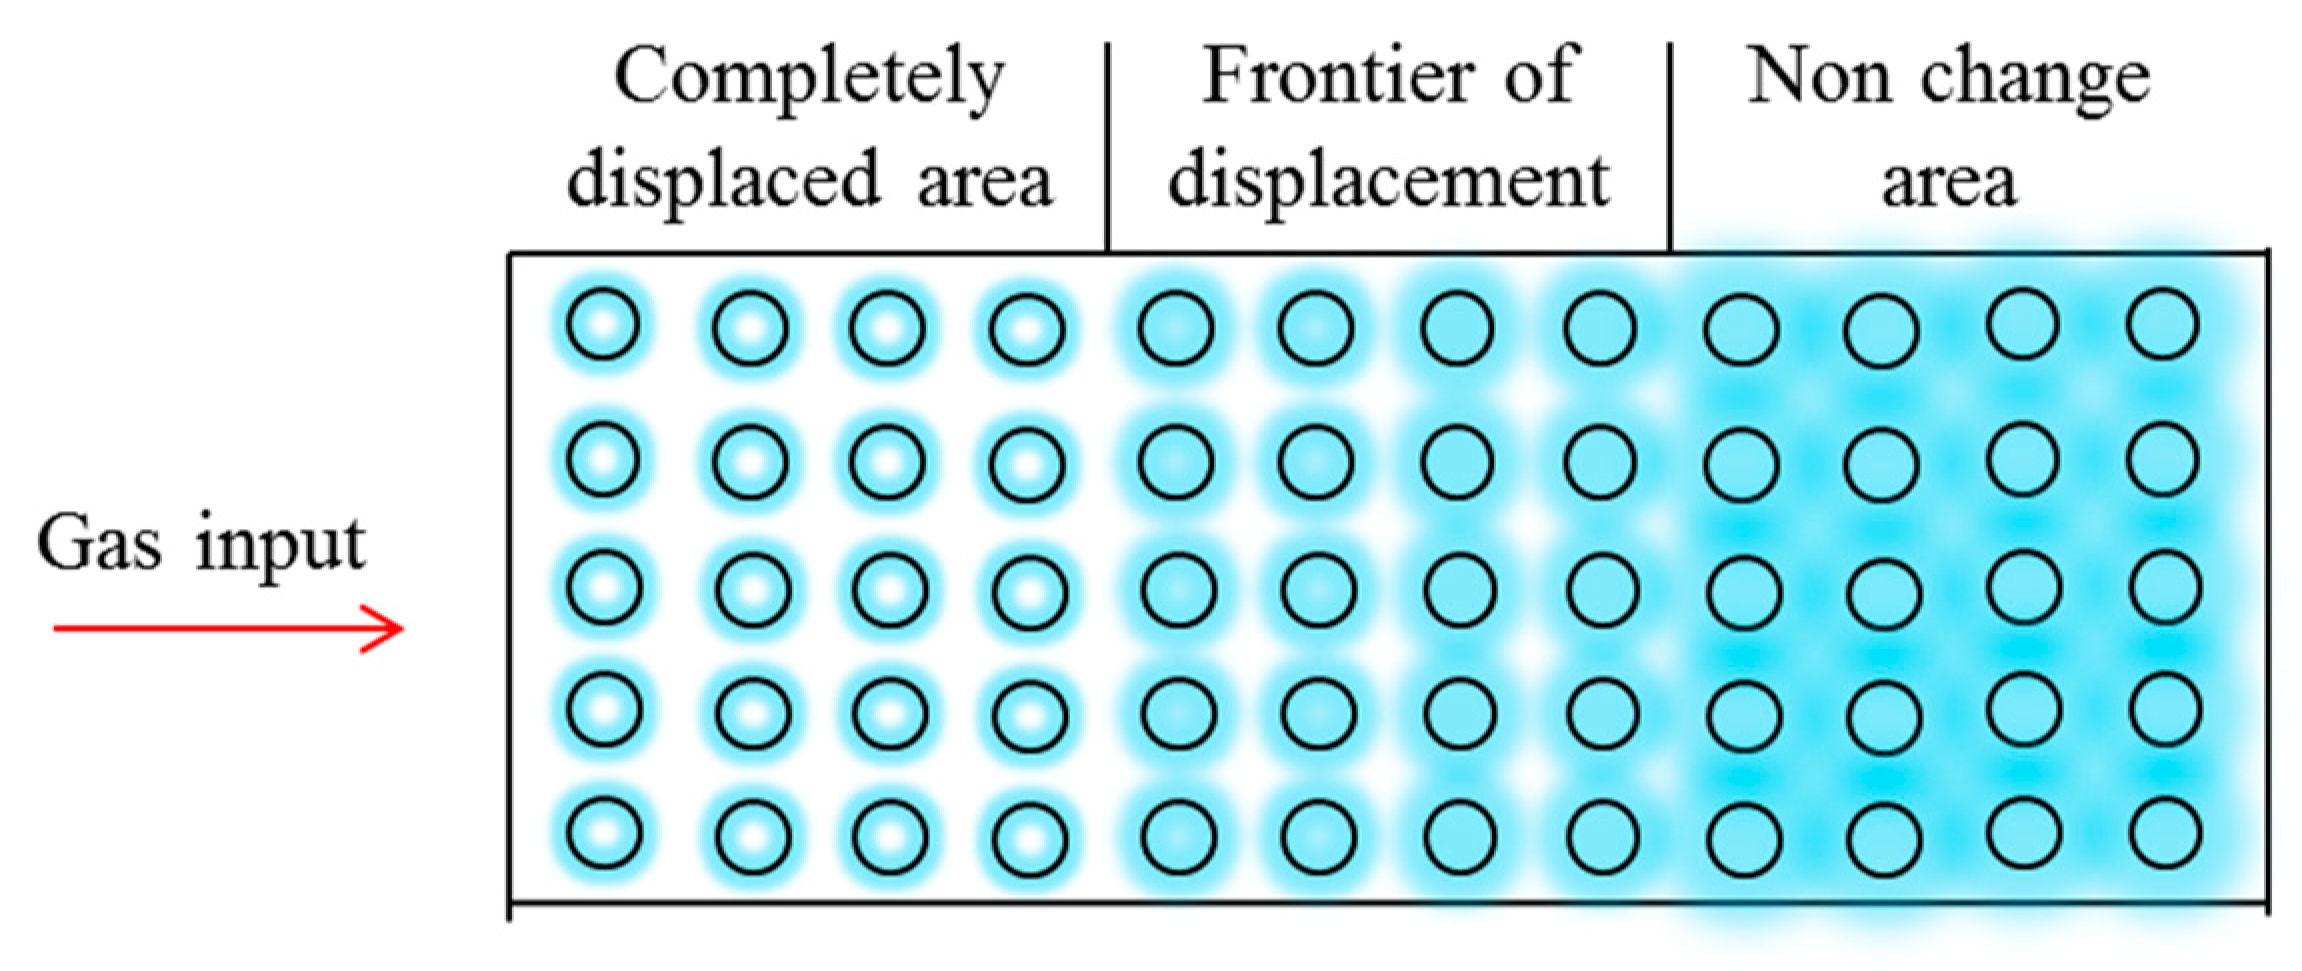
The simulation experiments demonstrated that the charging front of the migration layer was basically flat (i.e., planer; see Figure 4d–f and Figure 6b–d). Some scholars believe that charging occurs in a branch-like manner [23,24,25]; however, the core displacement imaging experiment cannot prove whether the charging occurs in a branch-like way or not. The results support the idea that the driving front is flat, with gradual changes in water saturation. When sample A10 was driven for 60 min at a driving pressure of 1 MPa, the core was still divided into three sections: a complete displacement section (the left third of Figure 4f), the driving front (the middle third of Figure 4f), and an unchanged section (the right third of Figure 4f). Here, the core length was 3.36 cm and the driving front was about 1–1.5 cm. Similarly, when sample A25 was driven for 5 min under a pressure of 0.3 MPa, according to the MRI results, the core could also be divided into three sections: A complete displacement section (Figure 6b, left third), the driving front (Figure 6b, middle third), and an unchanged section (Figure 6 b, right third). Here, the core length was 3.47 cm and the driving front was, again, about 1–1.5 cm. The physical modeling experiments demonstrated that the core driving front was about 1–1.5 cm in both cases. It can be considered that the gas-driven water displacement is approximately planar (Figure 7). The completely displaced area is mainly dominated by the residual water of the water film, the driving front is dominated by a gradual decrease in movable water, and the unchanged section is basically full of water. In the physical simulation, due to the use in small core sections, no obvious rock heterogeneity affected the charging of the migration layer.
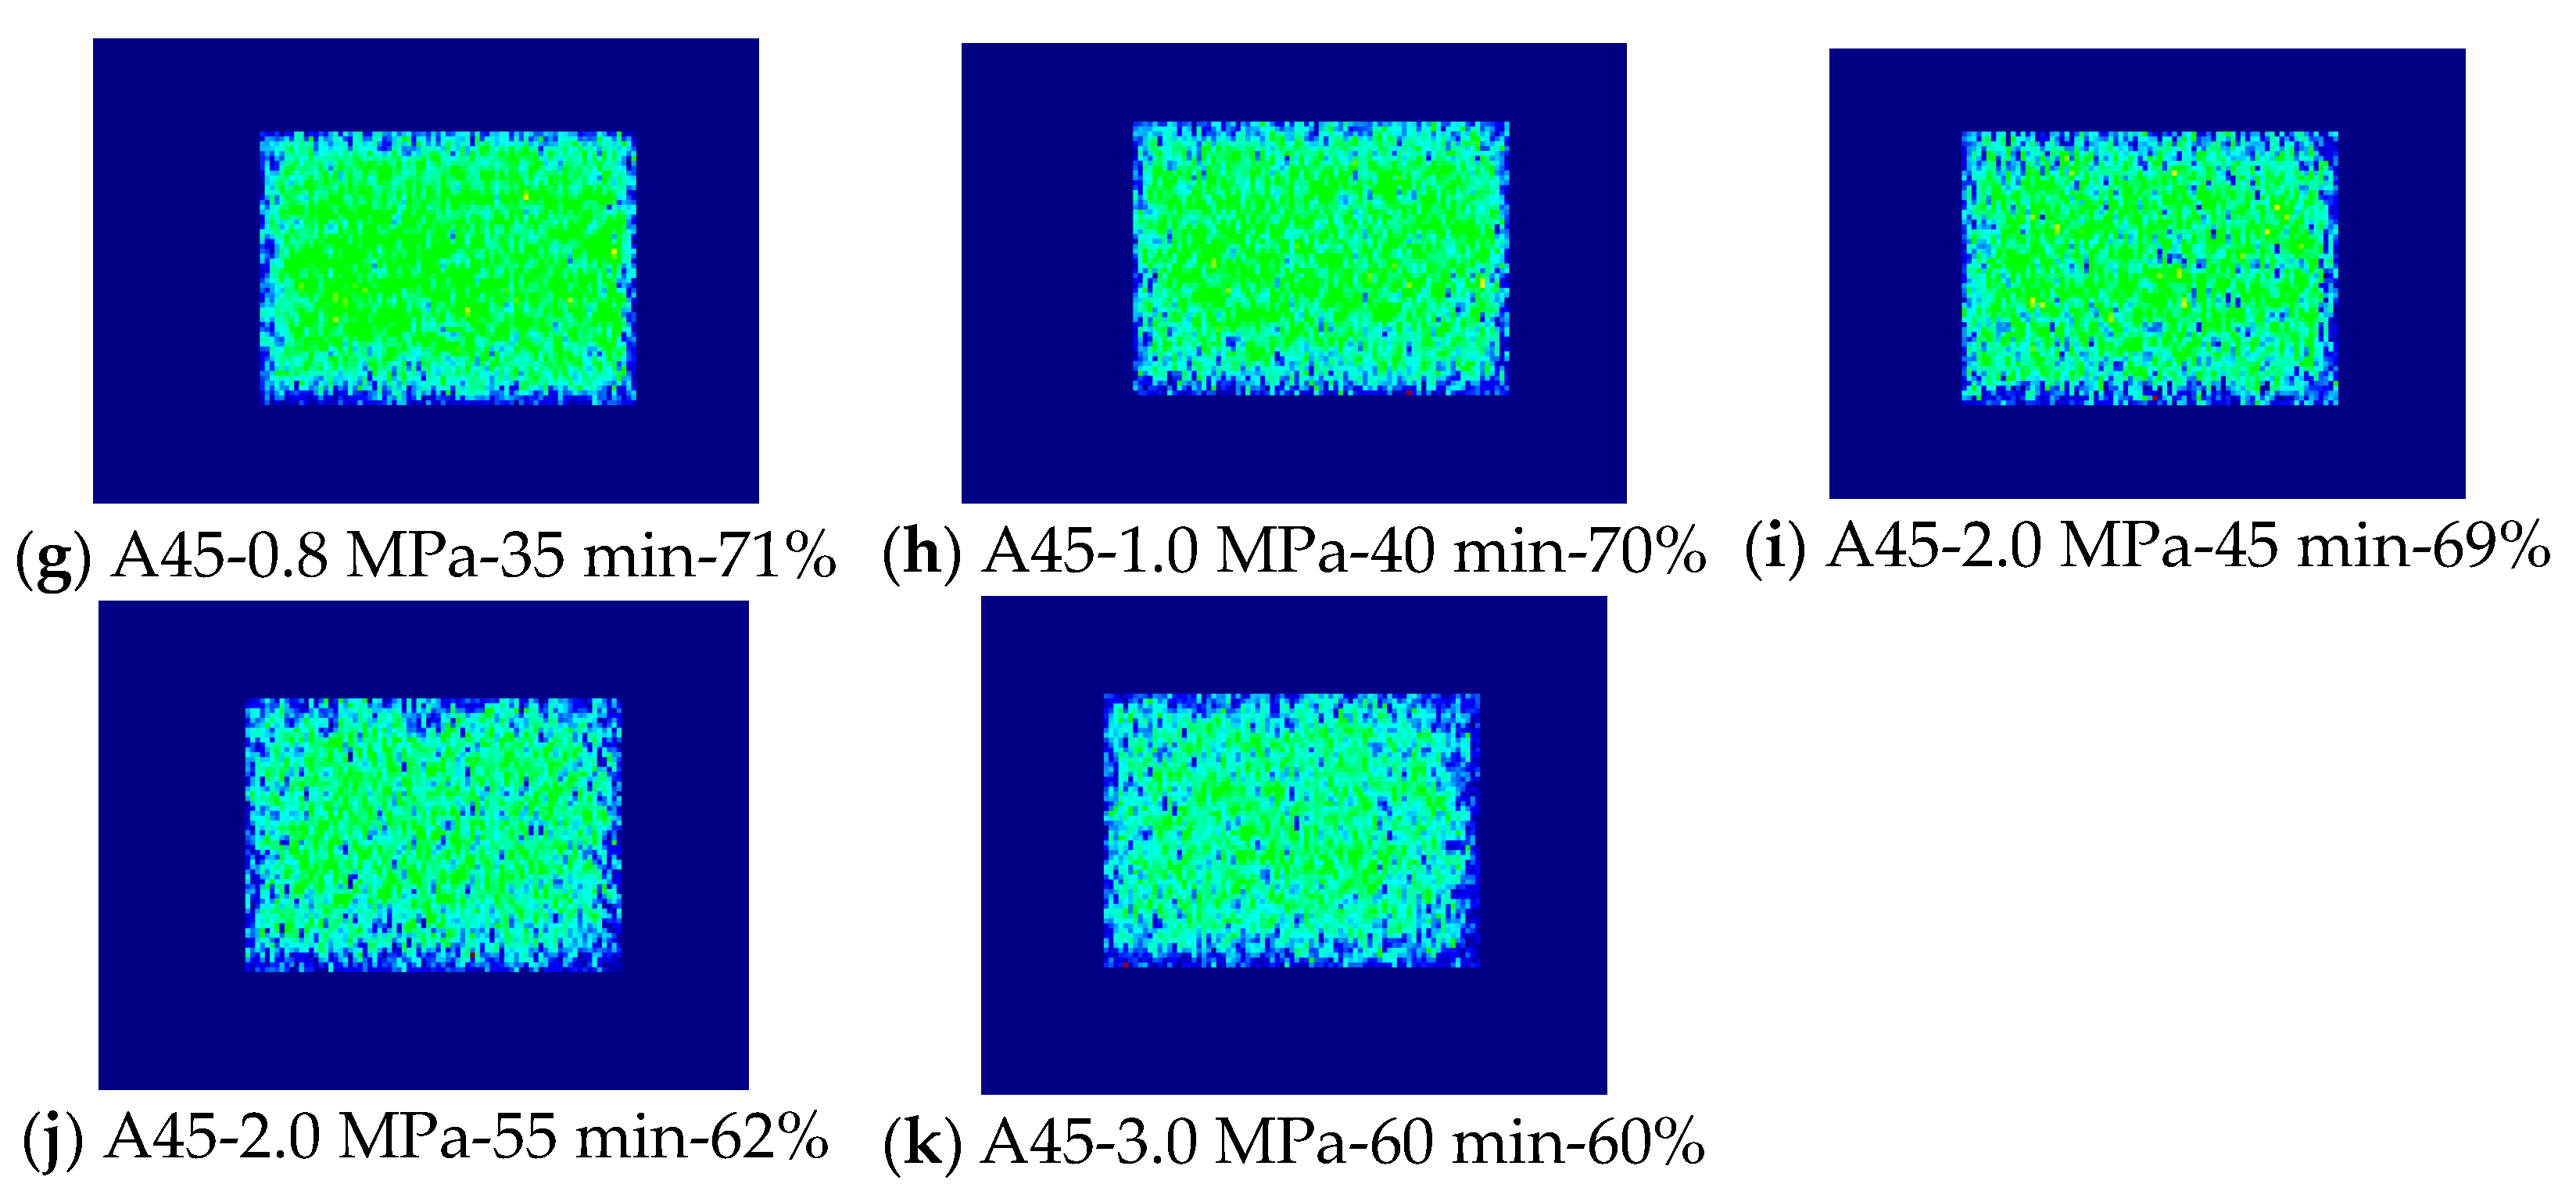
3.1.3. Sample A45 Experimental Results and Discussion of Carrying Effect
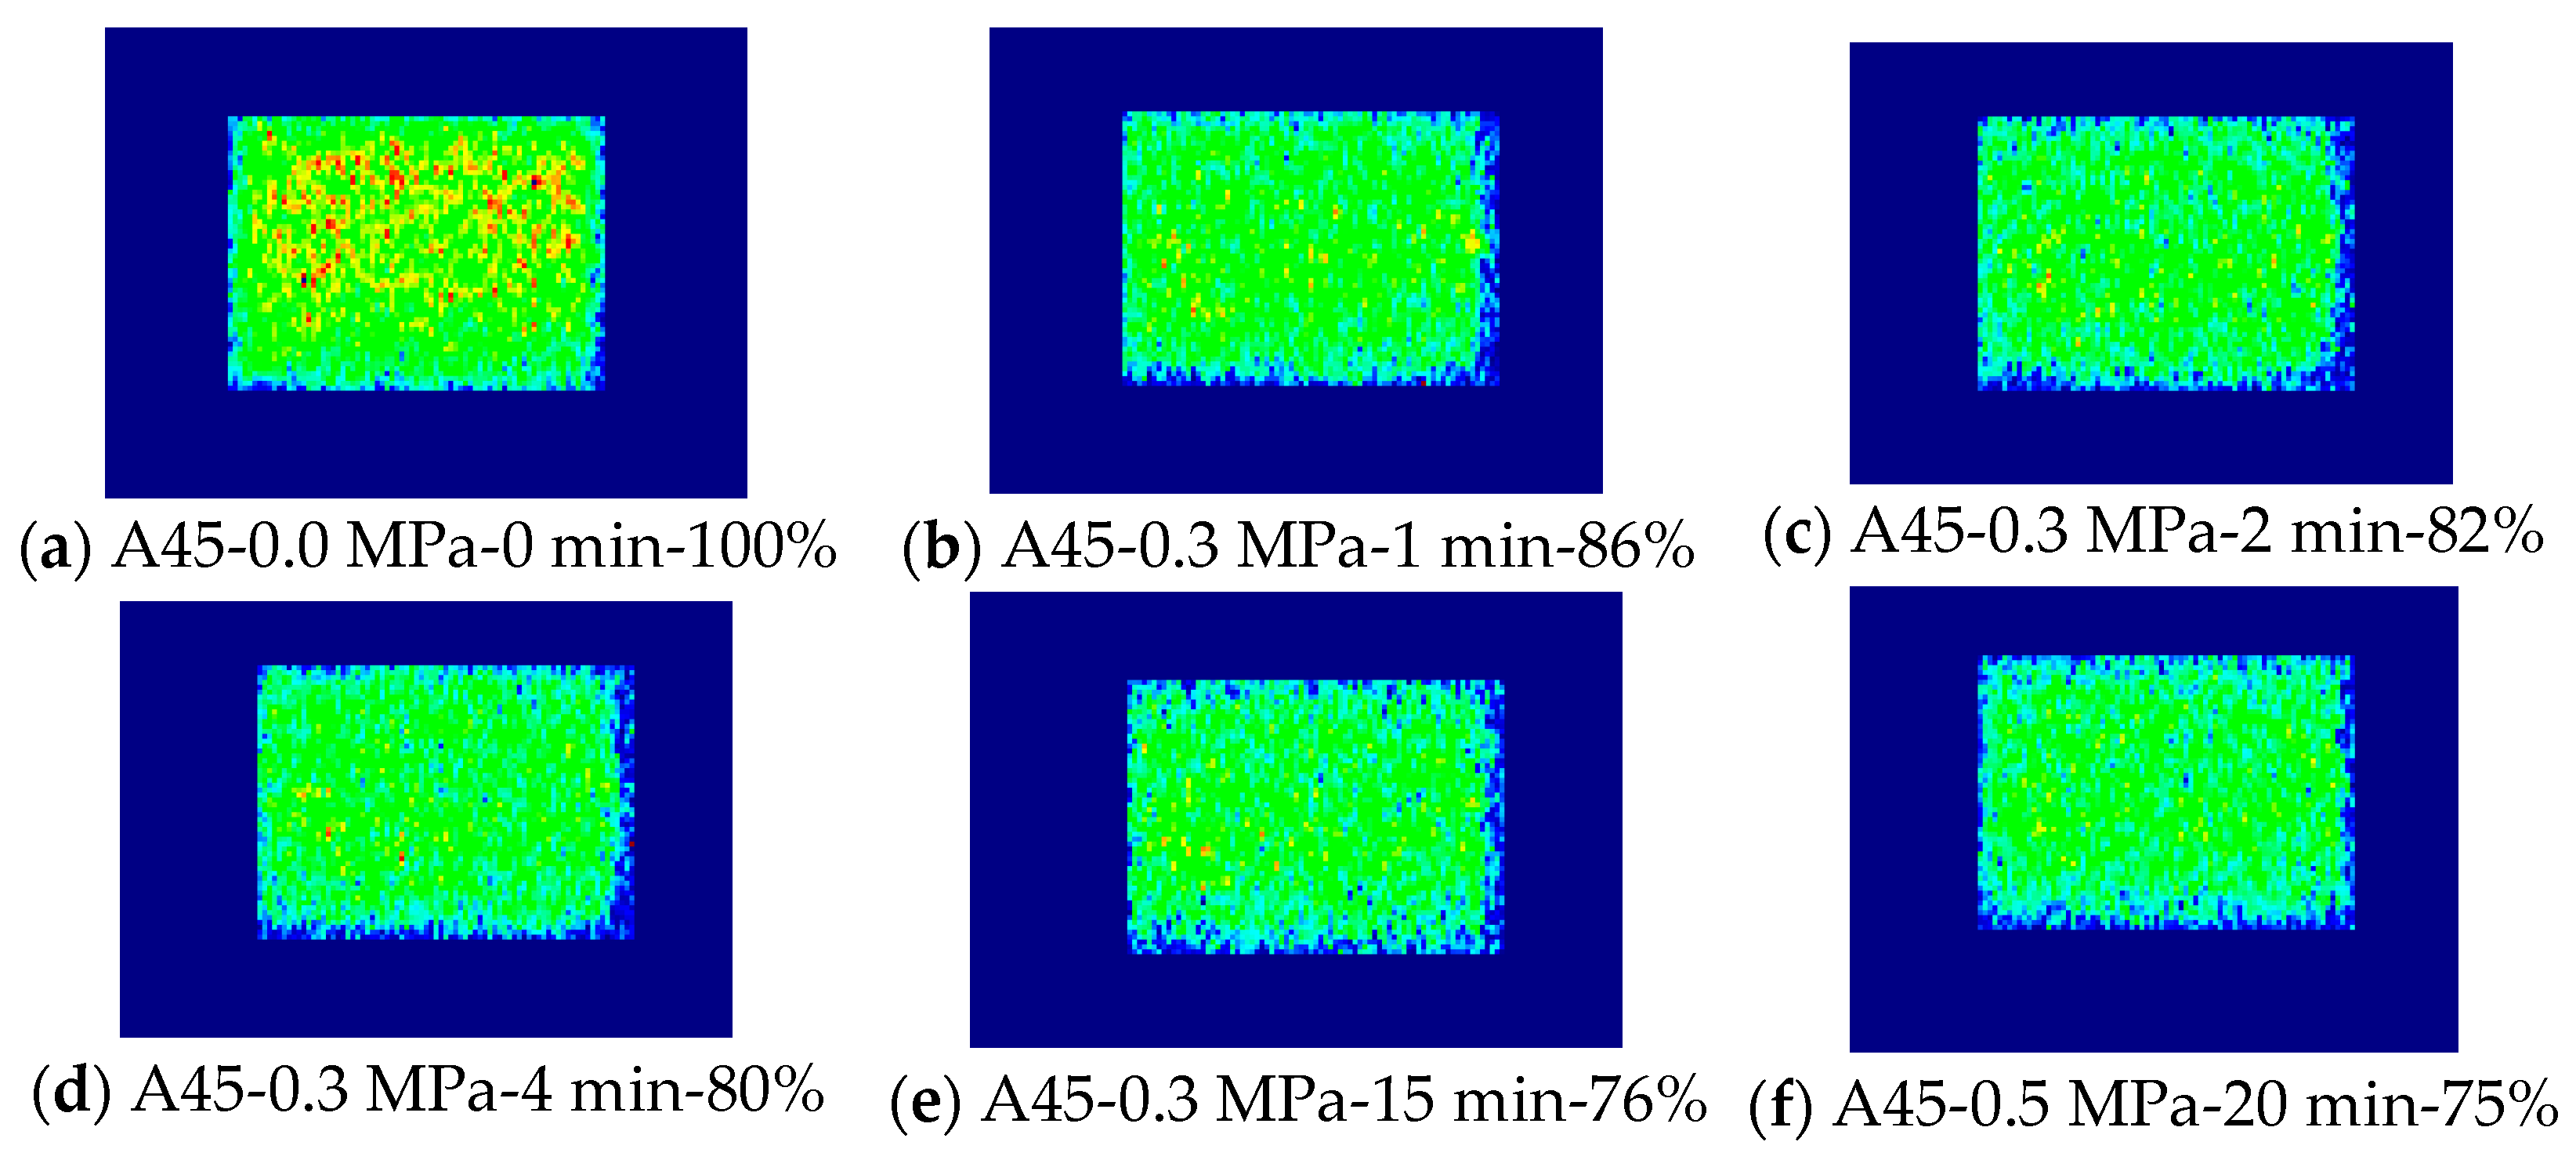
Sample A45 (4106.86 m from Well F-1) was displaced with a driving pressure of up to 3 MPa. After using 0.3 MPa driving for 1 min, the residual water content of the core was evenly distributed and the water saturation decreased to 86%, reflecting that natural gas quickly infiltrated the core, thus displacing the movable water. Continuing to use 0.3 MPa pressure for another 1, 2, and 11 min (for a cumulative driving time of 15 min), the core water saturation was 76% and the water saturation was equal and decreased slowly, reflecting the carrying effect as the main displacement method. Subsequently, the driving pressure was gradually increased to 3 MPa. For simplicity of calculation, 0.3 MPa driving was carried out for 10 min, 0.5 MPa driving for 5 min, 0.8 MPa driving for 10 min, 1 MPa driving for 5 min, 2 MPa driving for 10 min, and 3 MPa driving for 5 min. The water saturation decreased by 4%, 1%, 4%, 2%, 7%, and 2% in these stages, respectively, indicating that the decrease in water saturation caused by the carrying effect was related to the gas flow rate. At the same time, high driving pressures can displace water from smaller pores, but the driving effect was not directly observable.
After the natural gas completely infiltrated the entire core, while the displacement pressure remained unchanged, the water saturation continued to decrease (Figure 6e–g and Figure 8b–d). The experimental results prove that the gas charging of the migration layer was influenced by the carrying effect by the flooding gas, leading to the water content decreasing throughout the entire core. Representative images are those for Sample A25 in Figure 6e–g. Here, with a core driving pressure of 0.3 MPa, the water saturation of the core dropped from 76% to 70%. The MRI results show that the water content dropped uniformly in the core. Similarly, the images for Sample A45 in Figure 8b–d were obtained with a driving pressure of 0.3 MPa, showing a water saturation drop from 86% to 76%; again, the MRI results indicate that the water content in the core decreased uniformly.
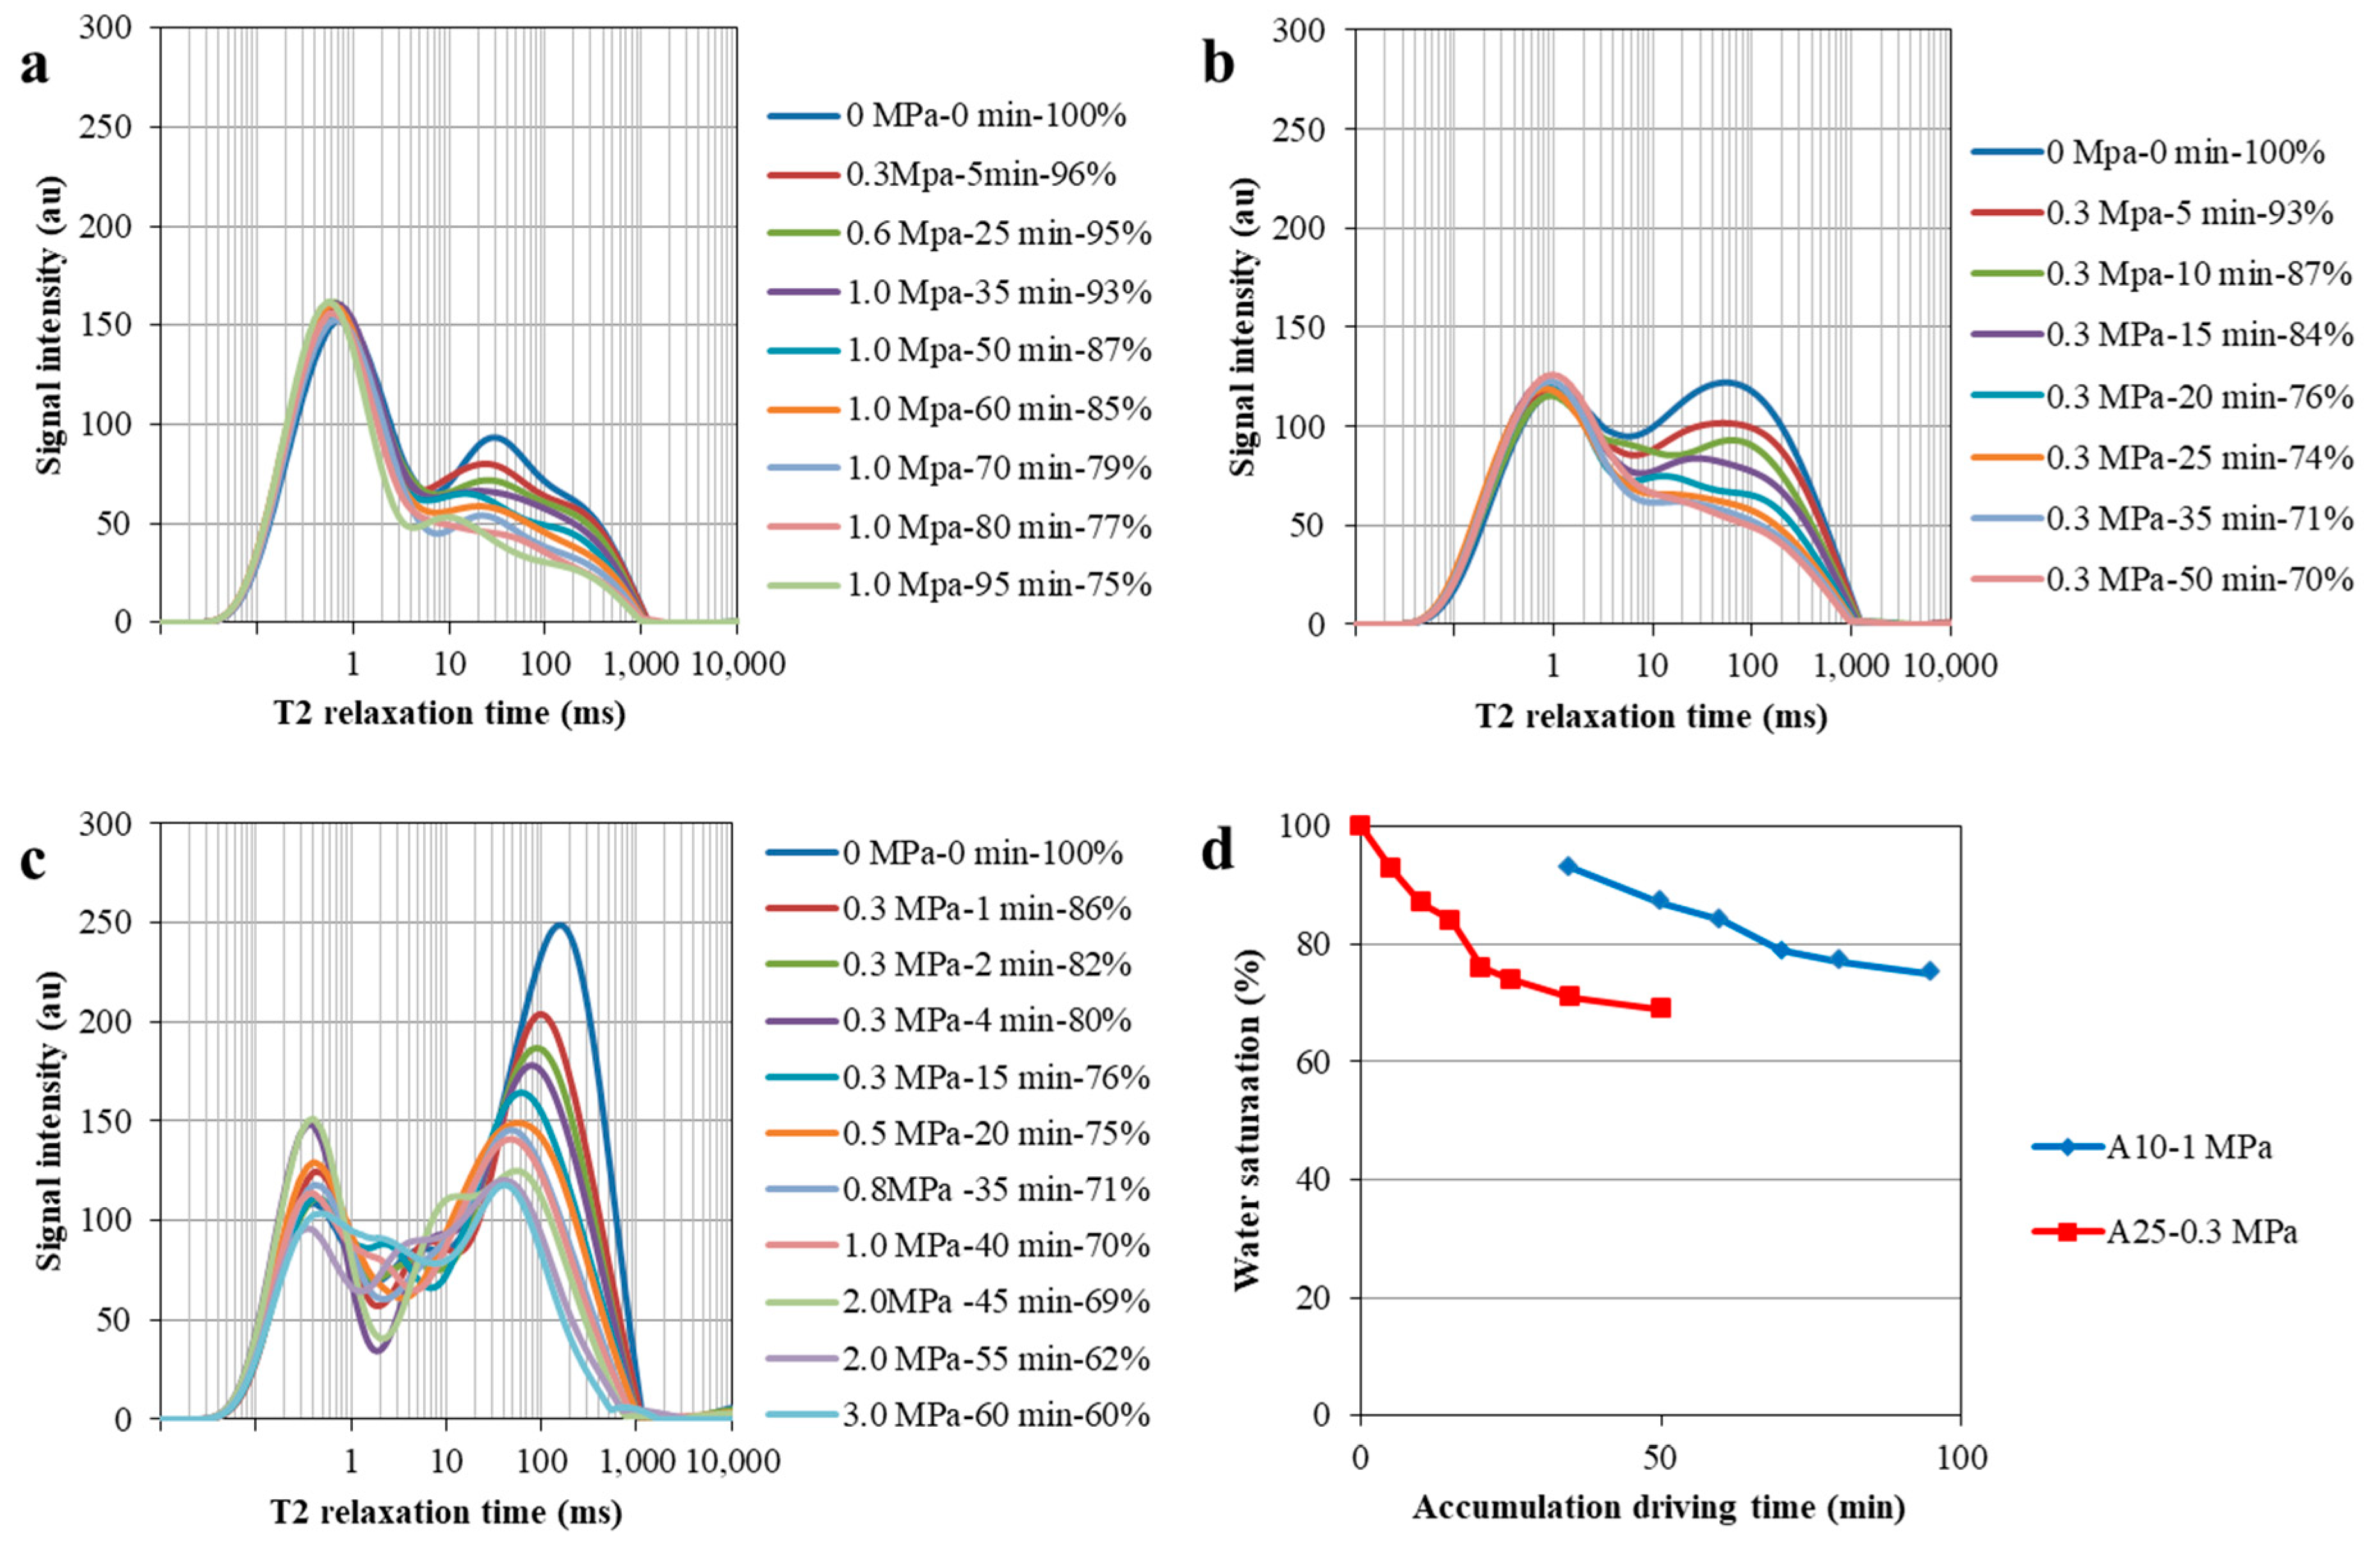
After completing MRI testing of the three samples at different driving times, NMR T2 spectrum tests were also carried out. It can be seen from the T2 spectra that the T2 relaxation time of the movable fluid in the core was mainly 10–500 ms, while that of the bound water was mainly <10 ms. The movable fluid gradually decreased during the driving process, but was not completely displaced. There was no change in bound water. Under low-pressure driving for 60–90 min, the water content of low-permeability cores generally decreased by less than 25%, the water content of medium-permeability cores decreased by about 30%, and the water content of the high-permeability cores decreased by around 40%. The NMR T2 spectra also revealed that a small part of the movable fluid tended to remain in the core. According to the equal distribution of water content observed in the MRI analysis, the remaining movable fluid decreased through the carrying effect of flooding gas.
According to the analysis of the modeling experiments, the carrying effect should not be ignored, which can reduce the water saturation by about 10% (Figure 9d). According to the water saturation change plot in Figure 9d, when the driving time was 20 min for Sample A25, the natural gas had completely infiltrated the core and the water saturation was 76% at this time. As the driving continued to 50 min, the core water saturation slowly dropped to 70%. According to the trend in water saturation, there was still room for it to further decline. Under the condition of the driving pressure of 0.3 MPa, the final water saturation can be expected to be around 60–65%; that is, the carrying effect can reduce the water saturation by about 10–15%.
After the natural gas had infiltrated the entire core, the driving pressure continued to increase and the water saturation decreased (Figure 8f–k). When the core driving pressure increased from 0.5 MPa to 2 MPa, the water saturation dropped from 76% to 60%, with an associated reduction of 16%, and the water content of the core decreased uniformly throughout the whole core. Our analysis suggests that, in the displacement process, as the driving pressure increases, there is one effect through which the water in smaller pores is driven by high-pressure gas, and another effect through which flowing gas carries the water out from core. The carrying effect generally reduced the water saturation by about 10% in the analysis of Sample A25 (Figure 9d) and, so, an increase in the driving pressure could produce a water saturation drop of about 5%. It can be seen that, when the natural gas completely infiltrated the core, the water saturation reduction produced by the carrying effect was about two times greater than that due to the pressure increase.
3.2. Slow-Charging Results and Discussion
3.2.1. SPB Experiment Results
The main feature of trap charging is that the natural gas will not go away and only water can discharge, with the semi-permeable baffle (SPB) model being the best experimental fit for this type of charging. We completed an SPB charging experiment using six core samples, in which the charging pressure was 0–1.4 MPa and the balance time at each pressure was 4–6 h.
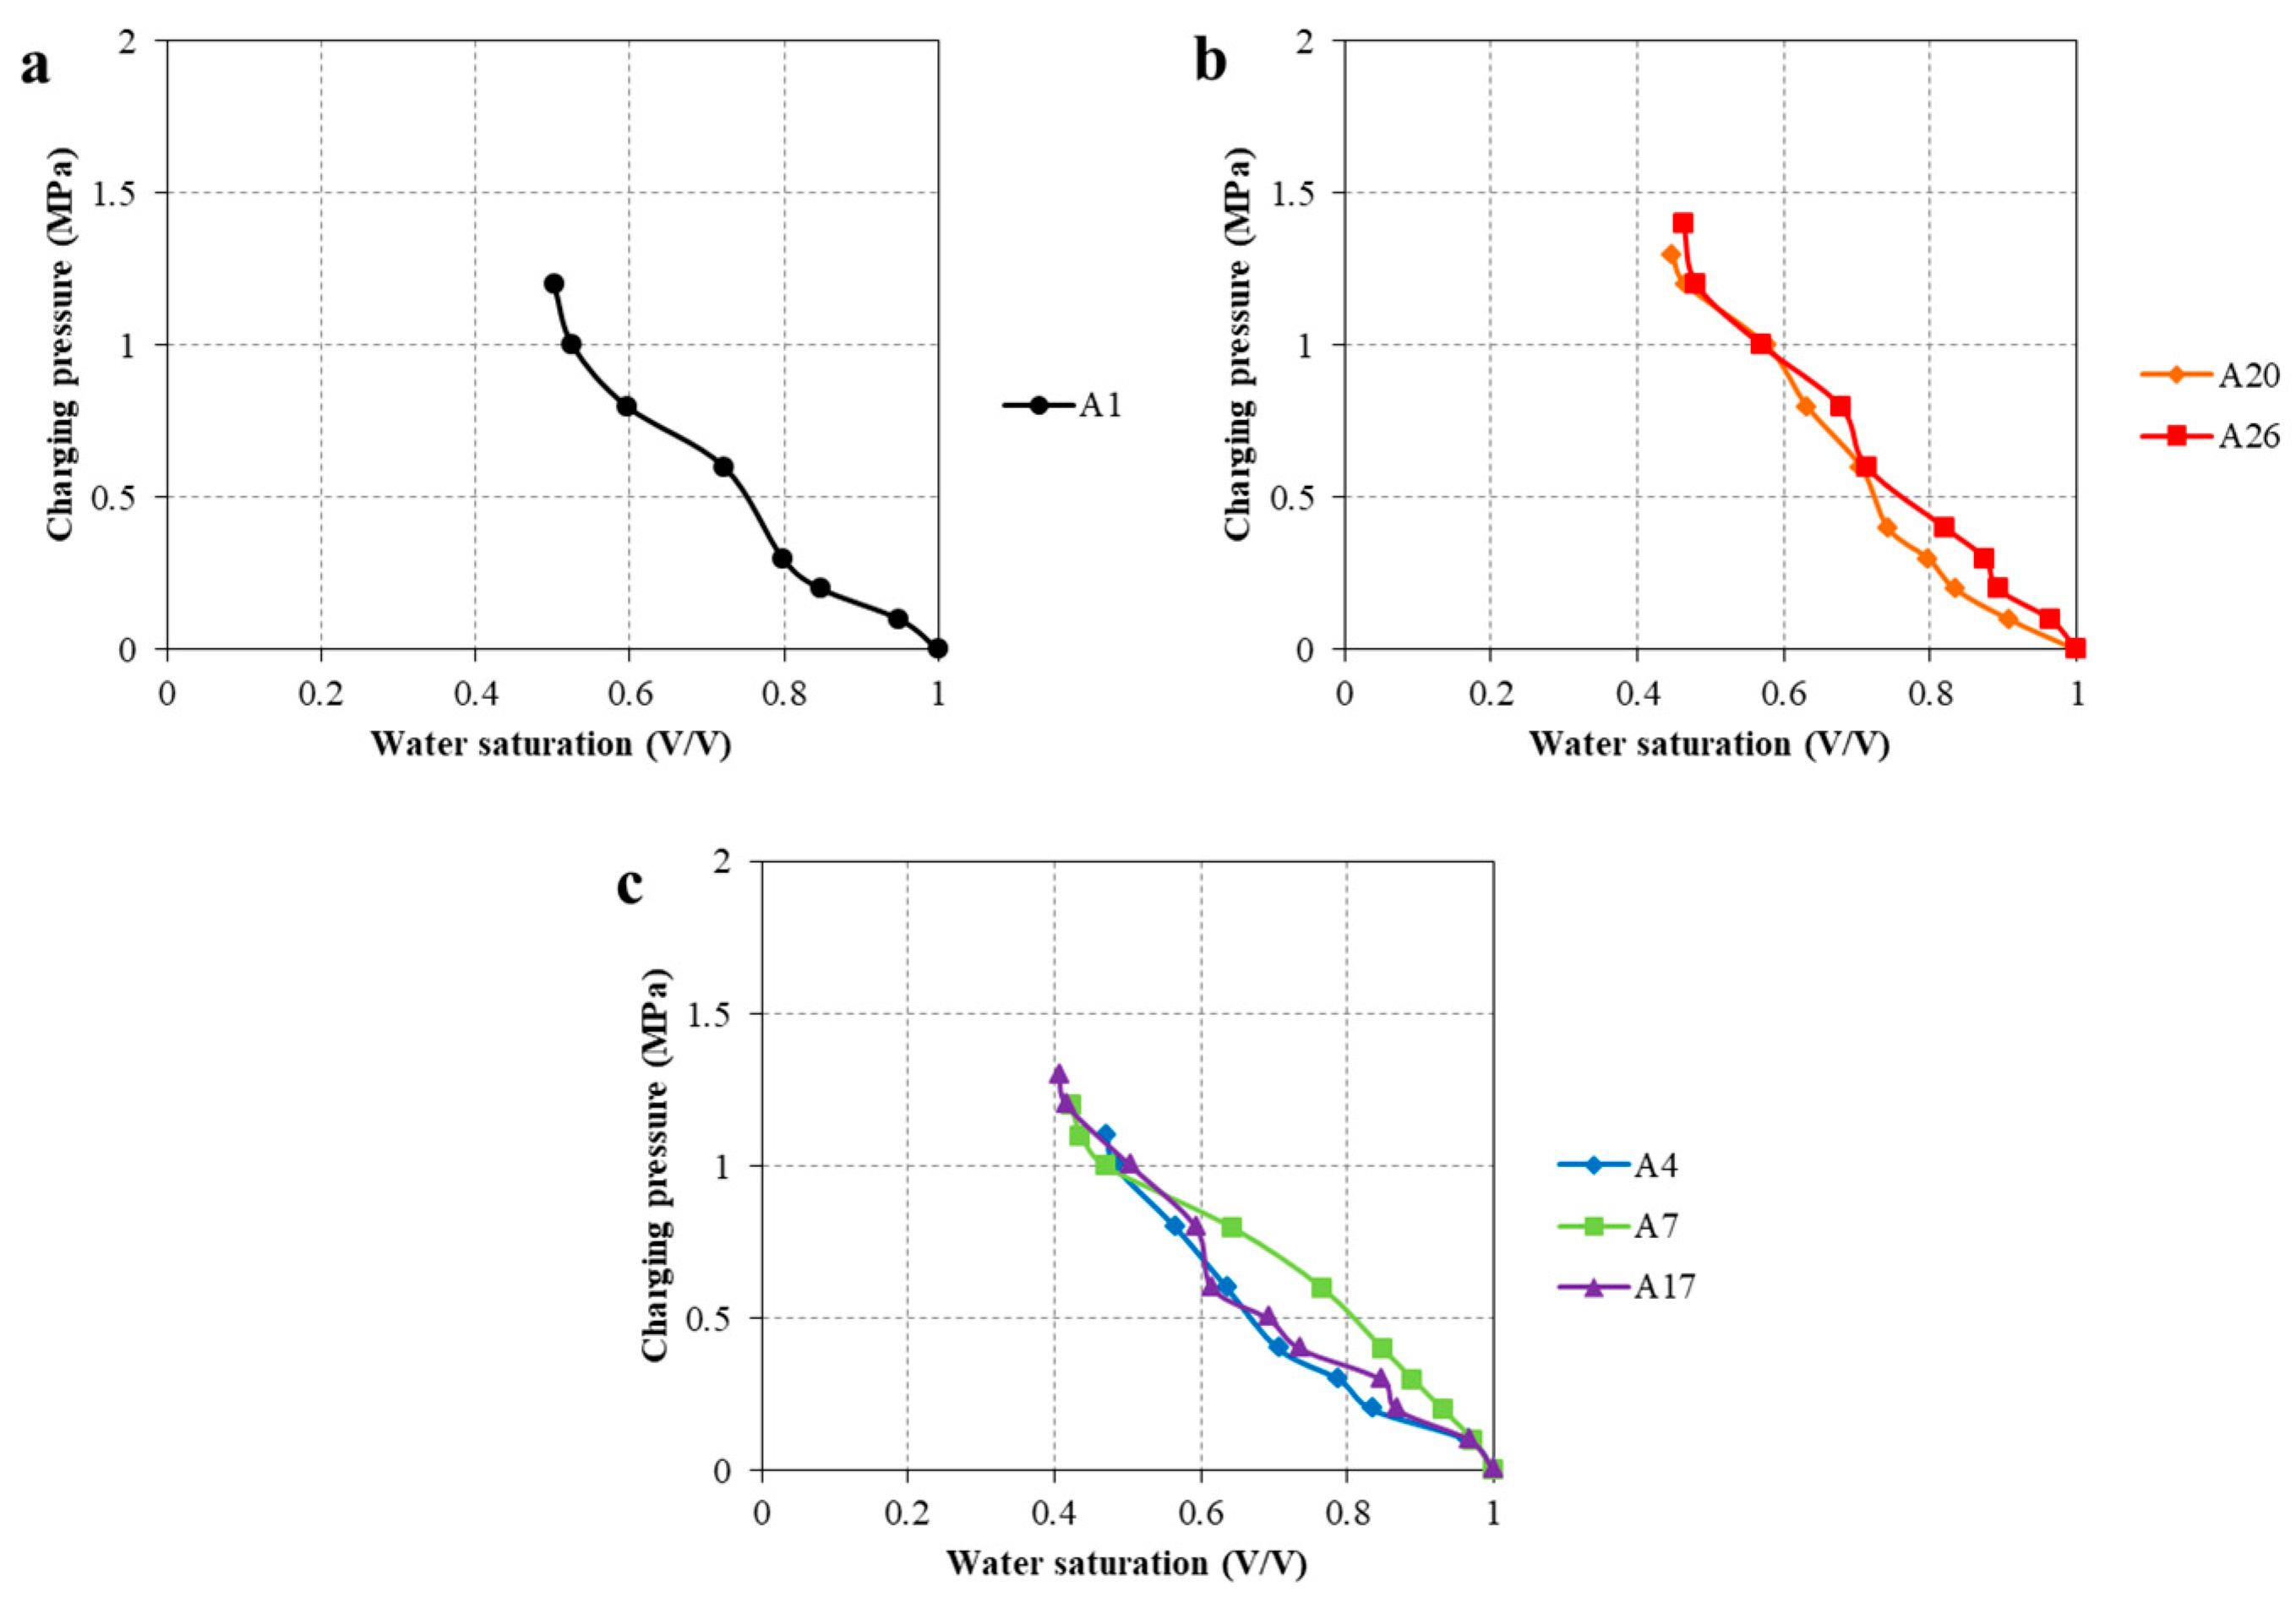
After analyzing the six samples, we found that the water saturation change was almost unaffected by the physical properties of the rock (Figure 10), as the water saturation of different cores decreased in basically the same way with an increase in charging pressure; however, the physical properties of the rock did affect the final water saturation. Sample A1 (3449 m, Well A-1) had a permeability of 0.1 mD, a porosity of 7.6%, and a water saturation of 55% at a charging pressure of 1 MPa. When the charging pressure increased again, the water saturation did not decrease and remained stable at 50%. Samples A20 (4008 m, Well B-2) and A26 (5106.9 m, Well D-1) had permeability of 0.29 mD and 0.37 mD, and porosity of 7.2% and 8.5%, respectively. At a charging pressure higher than 1.2 MPa, the water saturation was basically unchanged and remained at 45%. Samples A4 (3823.1 m, Well A-1), A7 (3614.9 m, Well A-2), and A17 (3752.7 m, Well B-2) had aa permeability of 1.9 mD, 8.1 mD, and 2.6 mD, respectively, and the water saturation at above 1.1 MPa was basically unchanged, being stable at about 40%. Overall, the final water saturation of high porosity and permeability cores tended to remain at 40%, while that for low permeability cores basically remained at around 45–50%.
3.2.2. Time Factor
The permeability of the reservoirs in the study area approximately ranges between 0.1–10 mD, and there is obvious gas−water contact. The charging pressure of a gas trap can be calculated according to the gas–water density difference:
where P is the trap charging power (MPa), is the density of the formation water (g/cm3), is the density of natural gas under formation conditions (g/cm3), g denotes gravitational acceleration (N/m), and Δh is the distance between the gas–water contact and the measuring point (km).
According to the formation conditions of the study area, the natural gas density is generally around 0.2 g/cm3. The typical height of the gas column of the main gas reservoirs is 150–200 m. The maximum charging pressure at the reservoir top is about 1.3–1.6 MPa, while the max SPB charging pressure is 1.4 MPa, which is similar to the maximum charging power of the reservoir in the study area. Even though the equilibrium time for the semi-permeable charging model was very long, there is still a huge gap compared with the historical period of the charging geology.
The gas–water contact drilled in Well A-4 is at about 3550 m and is obvious; furthermore, the water saturation at about 3510 m is 40–55% according to the measurements of the sealed cores (Table 2). Considering the charging pressure cause by the difference in density between gas and water, the charging pressure in a small area above the gas–water contact is very small (only about 0.2 MPa). The water saturation in the SPB experimental model was 80–90%, which is very different to that observed in the sealed core test. This indicates that the time factor is the most important factor to control the water saturation of the reservoir. Conversely, the pressure factor in the modeling experiment had an almost negligible influence on the water saturation.
Considering the time factor, even if the charging pressure is low, the reservoir can still reach a high gas saturation. Therefore, for traps with relatively good physical properties, the water saturation of the reservoir above the gas–water contact can reach a minimal value. The conclusion that the charging pressure affects the water saturation in the experimental model is not suitable when considering the slow charging of traps in the process of geological accumulation. From the experimental results and analysis of sealed cores, slow trap accumulation is only affected by the time factor.
3.2.3. Final Water Saturation
Even though the SPB charging experiment model cannot truly describe the trap accumulation process, the minimum water saturation obtained in the SPB experiment matched the sealed core data well.
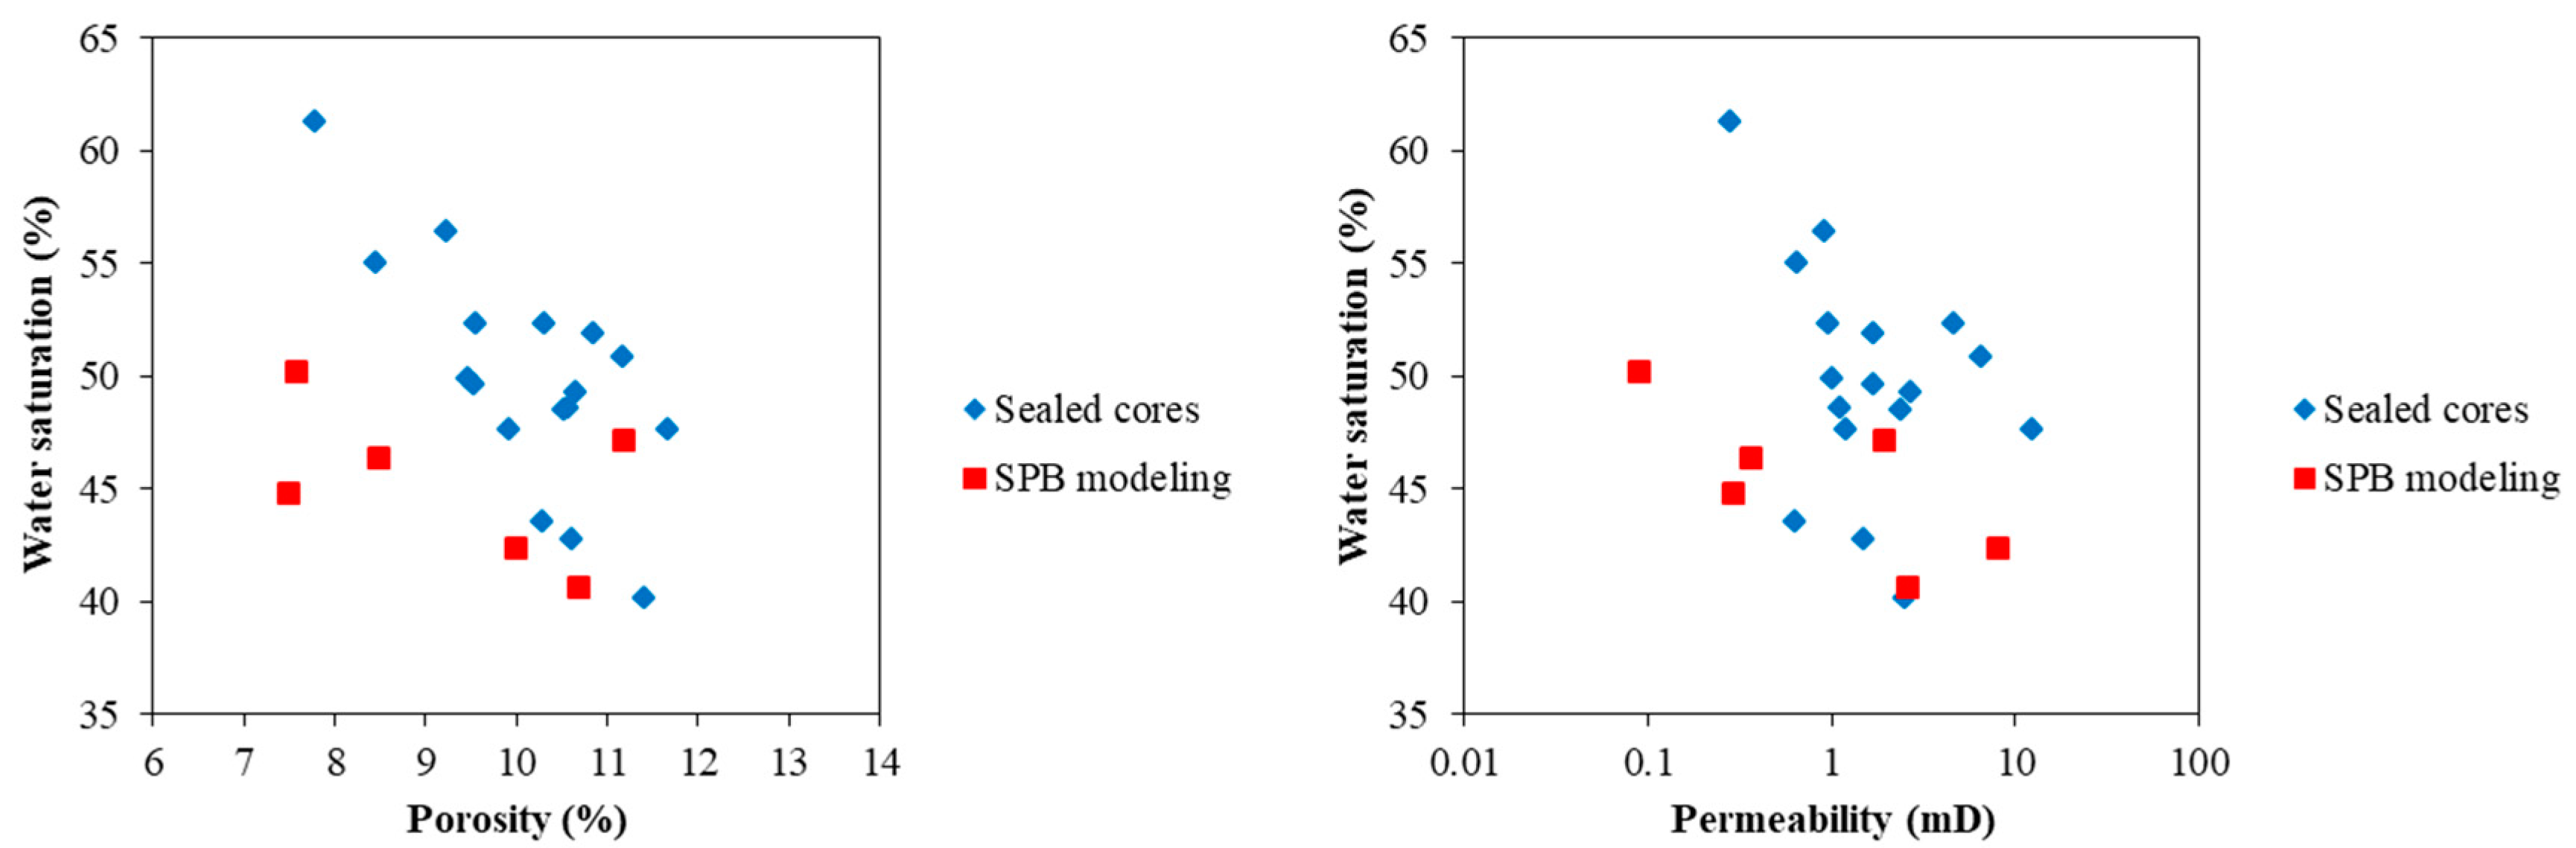
According to the SPB charging experiment, when the charging pressure is about 1.2 MPa, the water saturation of the reservoir is basically stable, an increase in the charging pressure will no longer cause the water saturation to decrease (Figure 8a–c), and the water saturation will basically be maintained at about 40–50%. This indicates that a water saturation of 40–50% is the lowest water saturation that the reservoir can reach; that is, the maximum gas saturation in the study area is 50–60%. The water saturation for the sealed cores from well A-4 was in the range of 40–55% (Table 2), confirming the final water saturation of 40–50% obtained through SPB experimental modeling (Figure 11).
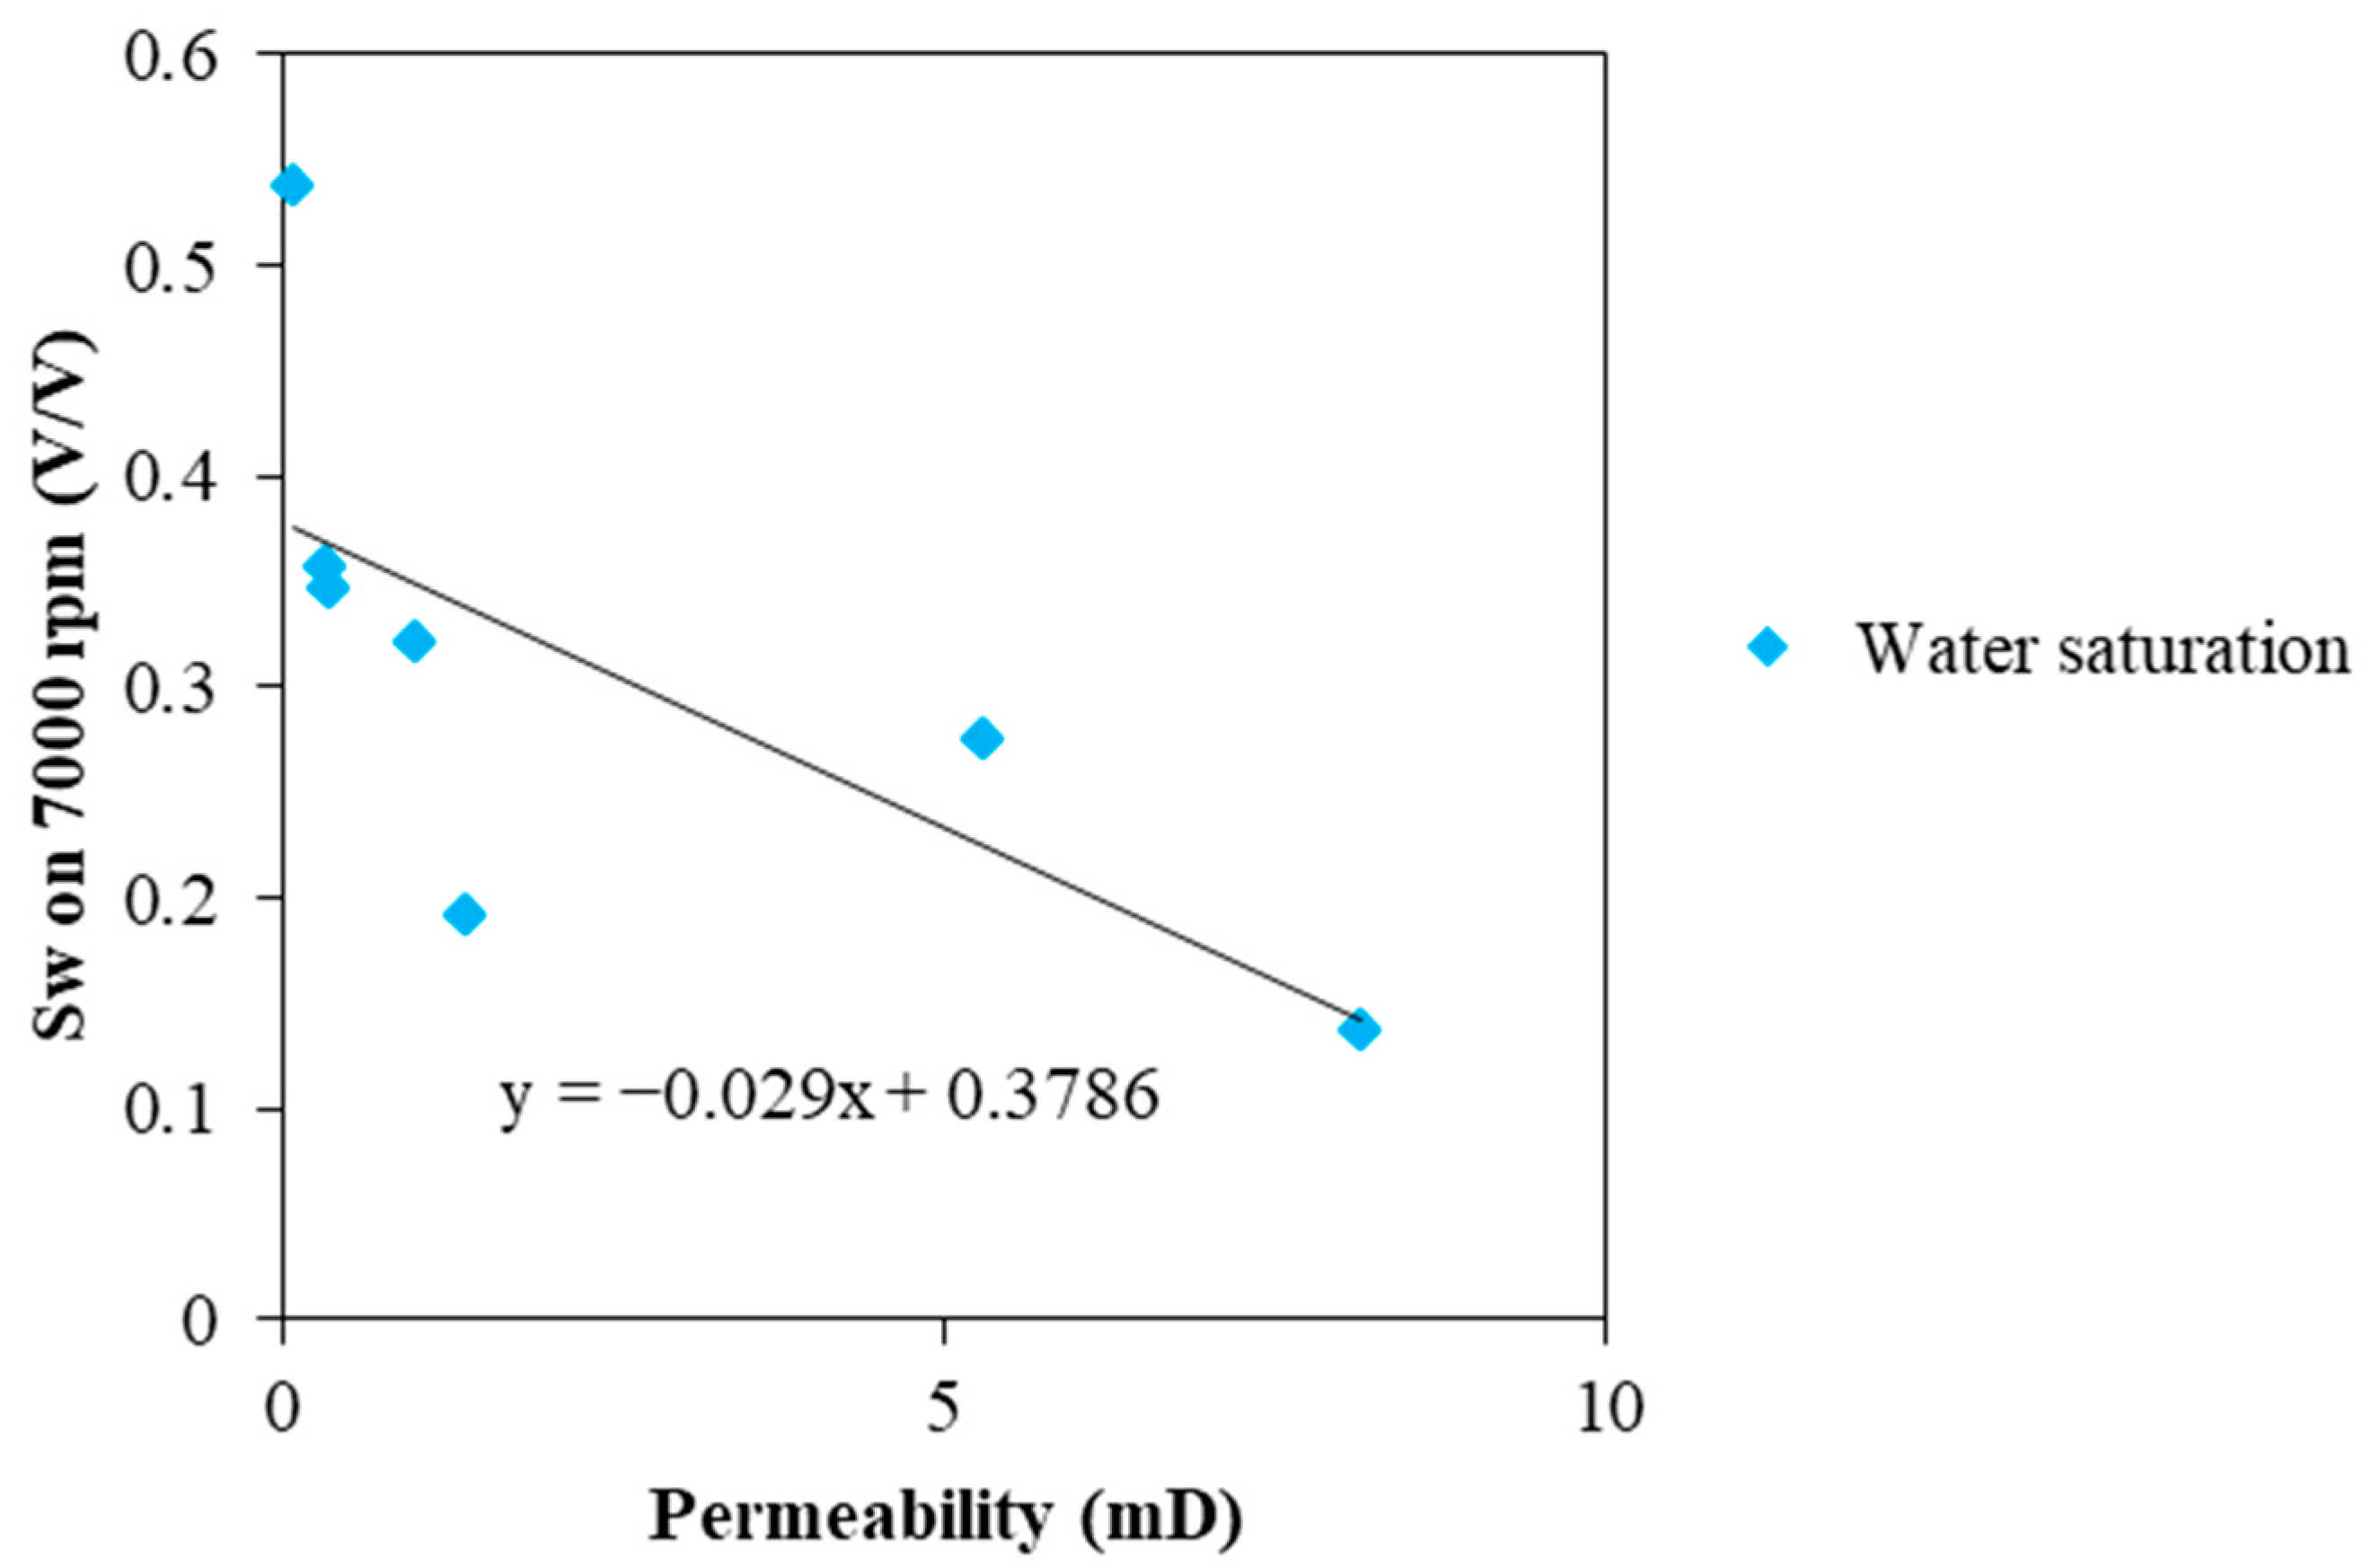
The water saturation data of the sealed cores was negatively correlated with the rock physical properties, but the correlation was poor; this also indicates that the physical properties of the rock have little influence on the water saturation of the reservoir, being more greatly affected by the charging time.
3.3. Rapid-Charging Trap Result and Discussion
3.3.1. Cen-NMR Experiment Result
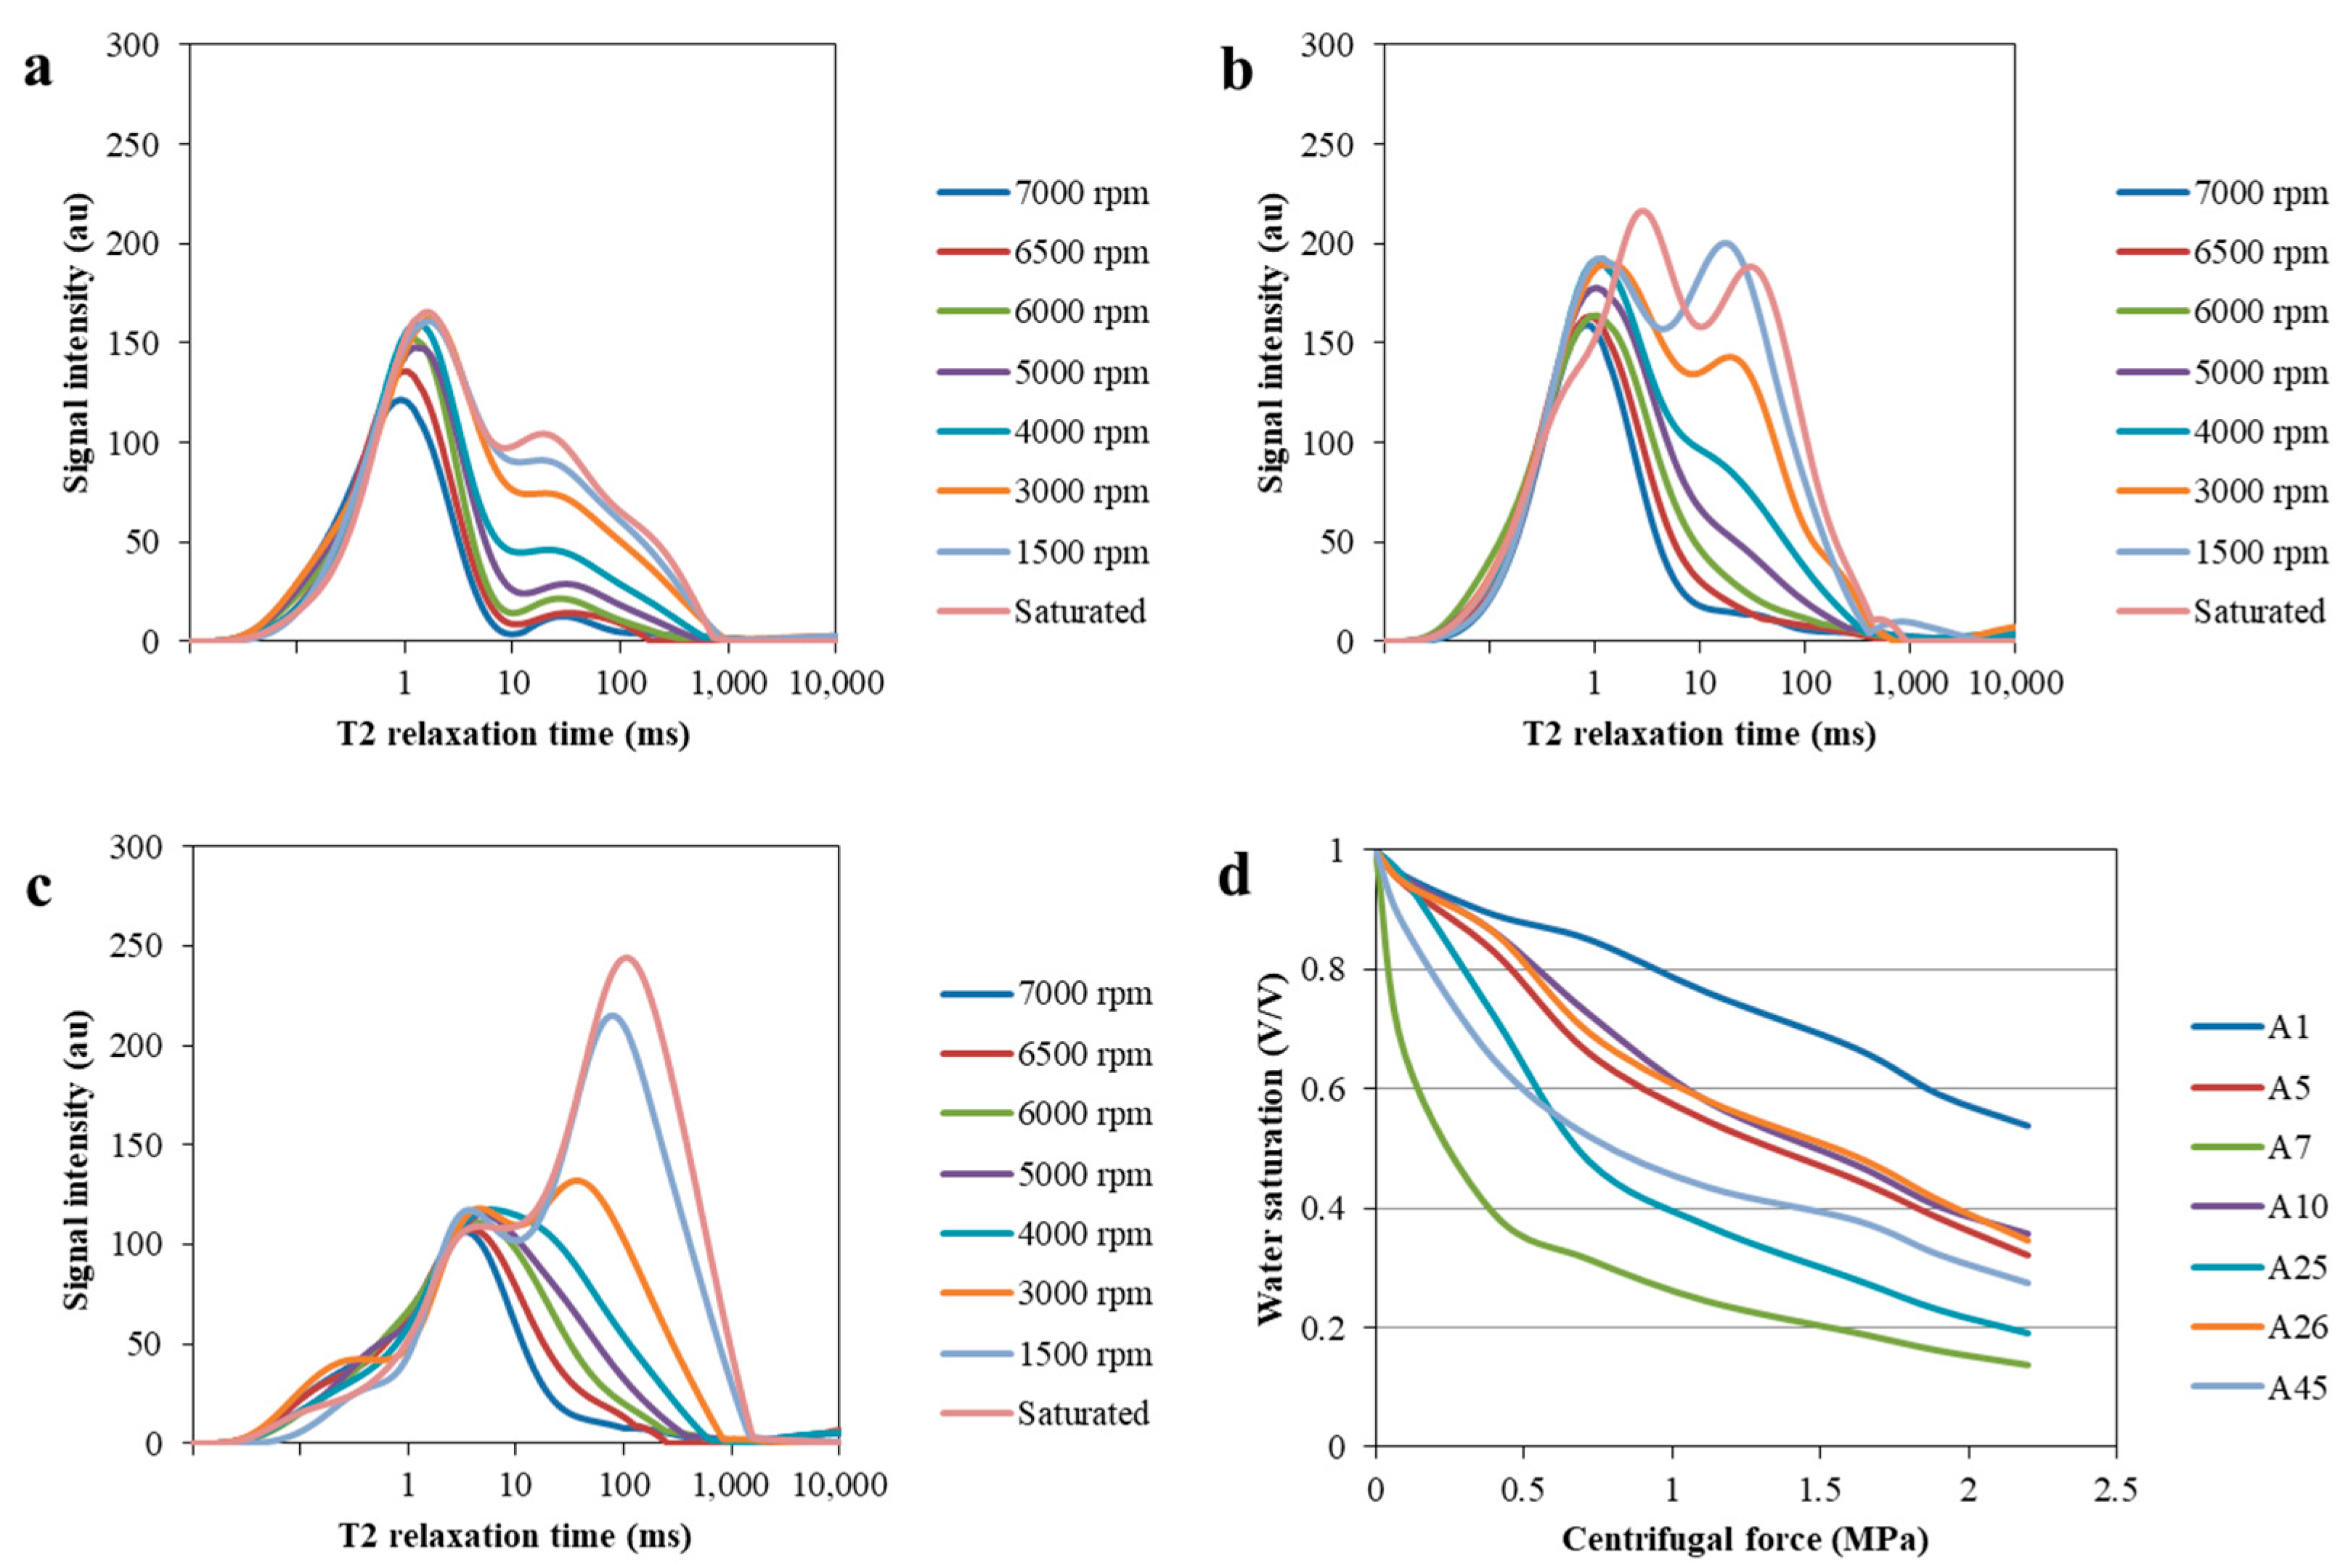
We selected seven samples to carry out centrifugal experiments at 1500, 3000, 4000, 5000, 6000, 6500, and 7000 rpm. After each centrifugation step was completed, the NMR T2 spectrum was recorded (Figure 12a–c).
In order to establish the relationship between centrifugal force and water saturation (Figure 12d), it was necessary to convert the rotational speed into the pressure at the bottom of the cores. According to the speed, the length of the centrifugal arm, and the length of the core, the centrifugal speed can be converted into the pressure at the bottom of the core as follows:
where Pc is the centrifugal charging pressure (MPa), Δρ is the difference in density between the two fluids (g/cm3), L is the core length (cm), Re is the maximum radius of the core (cm), and n is the centrifugal rotation speed (rpm).
Converting the centrifugal speed to the pressure at the bottom of the core, it was found that A7, A25, and A45 have permeabilities greater than 2.5 mD. For these samples, when the centrifugal pressure was less than 0.6 MPa, water saturation rapidly decreased; meanwhile, when the pressure was above 0.6 MPa, the water saturation decreased slowly, and the water saturation was considered to be stable at 15–30%. Samples A5, A10, and A26 had permeabilities in the range of 0.3–1 mD. For these samples, when the pressure was higher than 1 MPa, the water saturation decreased slowly. According to the recorded curve, we considered the water saturation as stable at about 30%. The permeability of Sample A1 was 0.1 mD. Under the experimental conditions, there was no inflection point for the decrease in water saturation, and the residual water saturation at the same pressure was higher than that in the other samples. This reflects the fact that the inflection point of the decrease in water is influenced by the core permeability; namely, when the physical properties are better, the inflection point is lower.
3.3.2. Rapid Trap Charging Characteristics
Centrifugal modeling is most suitable for simulating the short-term gas charging process at the initial stage of episodic charging, while mid–late episodic charging is more suitably simulated using the semi-permeable baffle charging model. The NMR curves obtained after different centrifugal forces (Figure 9) indicate that cores with permeability less than 0.1 mD had almost no large pores, cores with permeability around 0.5 mD had a relatively similar water content in large pores and small pores, and cores with permeability greater than 1 mD had a very high water content in large pores. After centrifugation, the water saturation and permeability presented a good relationship: when the permeability was higher, the water saturation was lower after centrifugation (Figure 13). The results of the Cen-NMR experiments demonstrate that short-term rapid charging is completely affected by the physical properties of the rock (Figure 13).
The water saturation decreased quickly when the centrifugal force was lower than 0.8 MPa, and decreased slowly when it was above 0.8 MPa (Figure 12d). When the centrifugal force was above 2 MPa it became difficult to judge the change trend in water saturation due to experimental limitations; however, according to the curve extension for Samples A7 and A45, it can be seen that the water saturation of samples with a higher permeability will not change as the pressure increases. For samples with lower permeability, the water saturation will still decrease as the centrifugal force increases. This indicates that, when considering the rapid charging of a trap, it can be completely filled at about 2 MPa if the reservoir has good physical properties.
3.4. Final Water Saturation with Different Physical Models
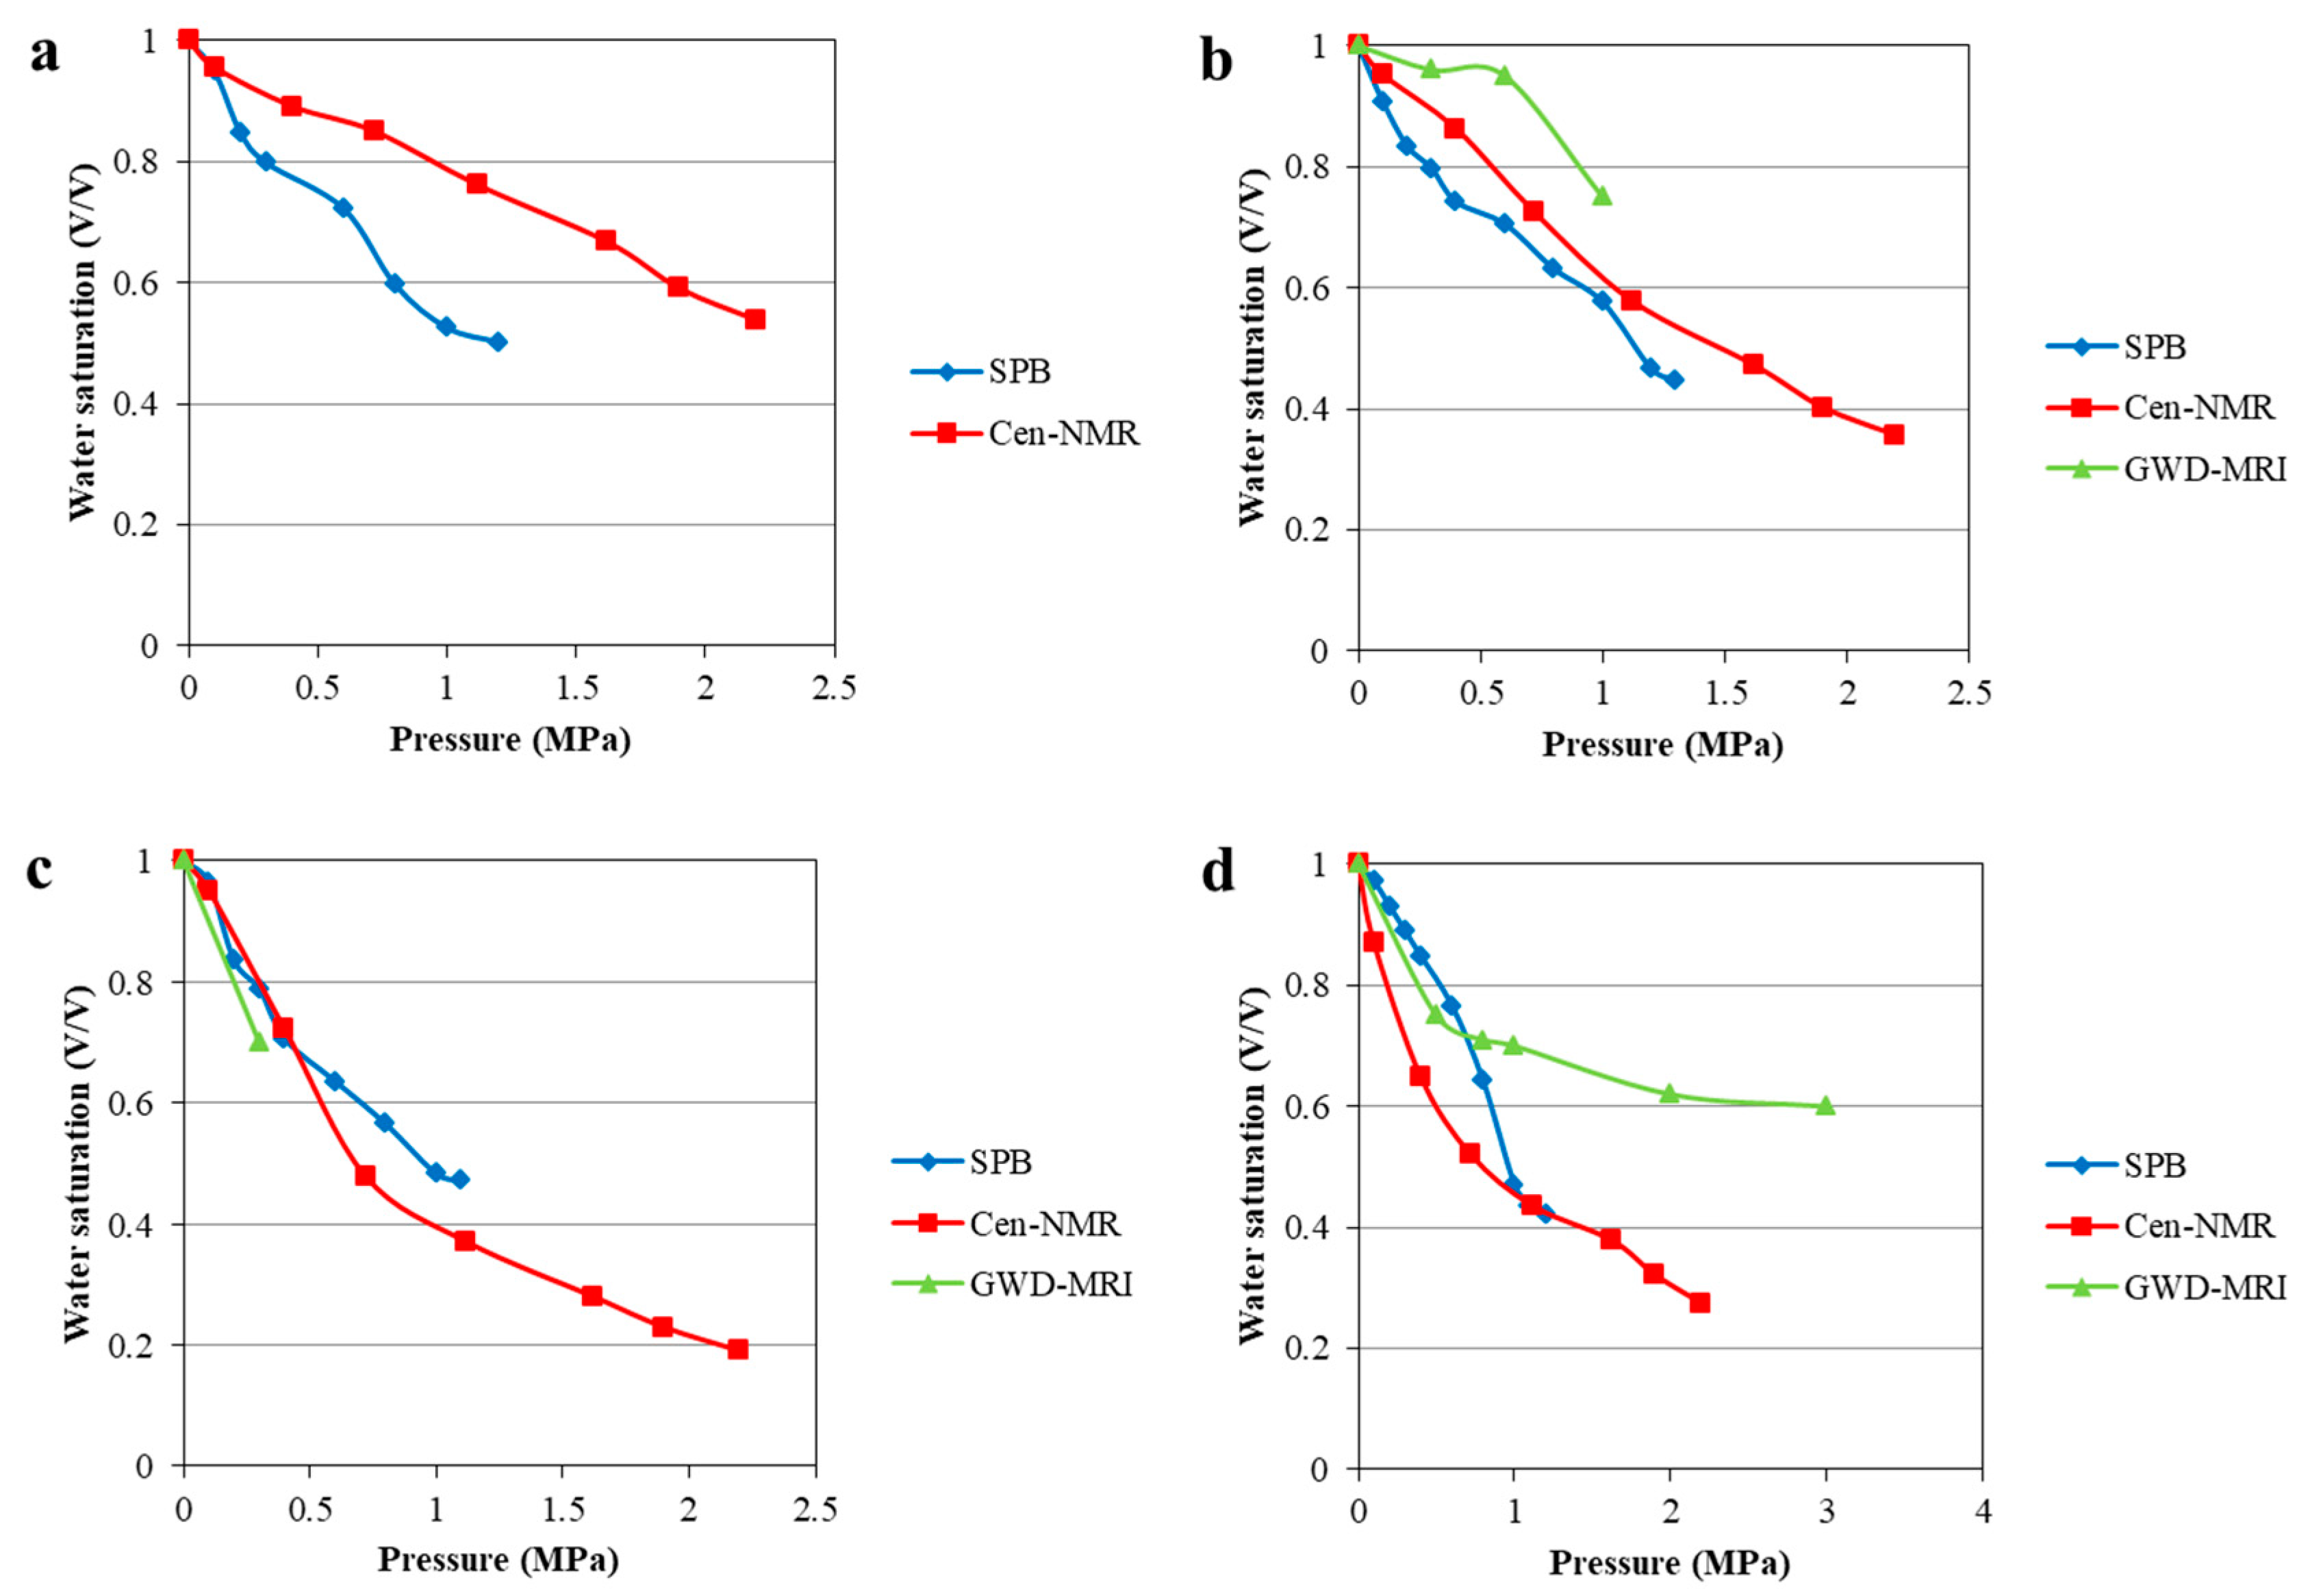
The final water saturation of cores with different physical properties differed with the models used in the experiments. Only Sample A1 had permeability less than 0.1 mD. The semi-permeable baffle (SPB) and the Cen-NMR experiments were completed with this sample, but it was not submitted to MRI analysis. Under the same driving pressure for this ultra-low-permeability sample, the water saturation in SPB modeling was low, while that obtained in the Cen-NMR experiment was higher (Figure 14).
Three sample had a permeability in the range of 0.1–0.5 mD; namely, A10, A20, and A26. Among them, Sample A10 completed the GWD-MRI and Cen-NMR experiments, while Sample A20, with similar properties, completed the SPB experiment. The final water saturation in the SPB experiment for the low-permeability samples was the lowest, while that for Cen-NMR was medium, and GWD-MRI gave the highest values.
The cores with permeability of 0.5–2 mD were represented by Samples A4 and A25. Sample A25 completed GWD-NMR and Cen-NMR experiments, while Sample A4, with similar permeability, completed the SPB experiment. The water saturation values obtained in the SPB, Cen-NMR, and GWD-MRI experiments were relatively similar for these medium-permeability samples.
The samples with permeability greater 2 mD were Samples A7, A17, and A45. Among them, Sample A45 completed the GWD-MRI and Cen-NMR experiment, while Sample A7, with similar permeability, completed the SPB experiment. For these samples, GWD-MRI yielded the highest water saturation, while the final water saturation in the SPB and Cen-NMR results was relatively close.
The water saturation values obtained in the displacement imaging experiments were generally 10% higher than those of the semi-permeable baffle and centrifugal-NMR experiments under the same driving pressure (Figure 10b,d), indicating that the gas charging of the migration layer was weaker than that of the reservoir within the trap. For samples with permeability greater than 0.1 mD, the semi-permeable baffle and centrifugal nuclear magnetic water saturation values were relatively similar (Figure 10b–d), indicating that trap charging leads to similar water saturation when the drive pressure is low (when not taking the charging time into consideration).
4. Conclusions
According to the results obtained using different physical models, we found that charging of the migration layer is greatly influenced by the driving pressure, slow trap charging is almost entirely influenced by time, and rapid trap charging is completely influenced by petrophysical parameters (i.e., the physical properties of the rock).
Our key conclusions are as follows:
- A start-up pressure gradient exists in the sandstone migration layer. The main effects influencing the charging of the migration layer are the driving and carrying effects. The driving front of the migration layer is basically flat. When the permeability is 0.3 mD, the start-up pressure is 0.6 MPa, the start-up pressure gradient is 0.15 MPa/cm, and the length of the driving front observed in the modeling experiment is about 1–1.5 cm. The driving effect can reduce the water saturation to 70–80%, while the carrying effect can further reduce the water saturation by 5–10%. Therefore, the carrying effect should not be ignored.
- The rapid charging of the trap is only affected by the physical properties of the reservoir; namely, the better the porosity and permeability, the lower the final water saturation. With centrifugal force lower than 0.8 MPa, the water saturation decreased rapidly, while when it was above 0.8 MPa, the water saturation decreased slowly.
- The water saturation in slow trap charging stabilized at 40–50%, and was relatively unaffected by the physical properties and/or charging power. The results of the semi-permeable baffle charging experiment matched the measured water saturation data of the sealed cores well.
Author Contributions
Conceptualization, Z.H. and G.Y.; methodology, Z.H.; data curation, J.C.; writing—original draft preparation, J.C.; writing—review and editing, J.C. and H.F. All authors have read and agreed to the published version of the manuscript.
Funding
This paper was funded by the National Science and Technology Major Project (No. 2016ZX05027-002-001).
Data Availability Statement
Raw data is reserved.
Acknowledgments
We would like to thank the State Key Laboratory of Oil and Gas and Resource Exploration, China University of Petroleum (Beijing), and Huang for his guidance in writing the paper, as well as Zhang, Dong, Li, and the project team members who provided assistance in writing the paper.
Conflicts of Interest
The authors declare no conflict of interest.
References
- Masri, W.; Shapiro, A. Experimental determination of relative permeabilities and critical gas saturations under solution-gas drive. J. Pet. Sci. Eng. 2021, 202, 108509. [Google Scholar] [CrossRef]
- Li, Y.B.; Zhang, Y.Q.; Luo, C.; Gao, H.; Li, K.; Xiao, Z.R.; Wang, Z.Q.; Pu, W.F.; Bai, B. The experimental and numerical investigation of in situ re-energization mechanism of urea-assisted steam drive in superficial heavy oil reservoir. Fuel 2019, 249, 188–197. [Google Scholar] [CrossRef]
- Wang, Y.; Hou, J.R.; Tang, Y.; Song, Z.J. Effect of vug filling on oil-displacement efficiency in carbonate fractured-vuggy reservoir by natural bottom-water drive: A conceptual model experiment. J. Pet. Sci. Eng. 2019, 174, 1113–1126. [Google Scholar] [CrossRef]
- Zheng, M.; Li, J.; Wu, X.; Li, P.; Wang, W.; Wang, S.; Xie, H. Physical modeling of oil charging in tight reservoirs: A case study of Permian Lucaogou formation in Jimsar sag, Junggar basin, NW China. Pet. Explor. Dev. 2016, 43, 241–250. [Google Scholar] [CrossRef]
- Guo, X.; Huang, Z.; Zhao, L.; Han, W.; Ding, C.; Sun, X. Pore structure and multi-fractal analysis of tight sandstone using MIP, NMR and NMRC methods: A case study from the kuqa depression, China. J. Pet. Sci. Eng. 2019, 178, 544–558. [Google Scholar] [CrossRef]
- Lu, T.; Li, Z.M.; Li, S.Y.; Wang, P.; Wang, Z.Z.; Liu, S.Q. Enhanced heavy oil recovery after solution gas drive by water flooding. J. Pet. Sci. Eng. 2016, 137, 113–124. [Google Scholar] [CrossRef]
- Wang, J.; Fu, J.; Xie, J.; Wang, J. Quantitative characterisation of gas loss and numerical simulations of underground gas storage based on gas displacement experiments performed with systems of small-core devices connected in series. J. Nat. Gas Sci. Eng. 2020, 81, 103495. [Google Scholar] [CrossRef]
- Lysova, A.A.; Garnier, A.V.; Hardy, E.H.; Reimert, R.; Koptyug, I.V. The influence of an exothermic reaction on the spatial distribution of the liquid phase in a trickle bed reactor: Direct evidence provided by nmr imaging. Chem. Eng. J. 2011, 173, 552–563. [Google Scholar] [CrossRef]
- Arogun, O.; Nwosu, C. Capillary Pressure Curves from Nuclear Magnetic Resonance Log Data in a Deepwater Turbidite Nigeria Field—A Comparison to Saturation Models from Scal Drainage Capillary Pressure Curves; Society of Petroleum Engineers: Richardson, TX, USA, 2011. [Google Scholar] [CrossRef]
- Chen, S.D.; Tang, D.Z.; Tao, S.; Ji, X.Y.; Xu, H. Fractal analysis of the dynamic variation in pore-fracture systems under the action of stress using a low-field NMR relaxation method: An experimental study of coals from western guizhou in china. J. Pet. Sci. Eng. 2019, 173, 617–629. [Google Scholar] [CrossRef]
- Daigle, H.; Johnson, A. Combining mercury intrusion and nuclear magnetic resonance measurements using percolation theory. Transp. Porous Media 2015, 111, 669–679. [Google Scholar] [CrossRef]
- Shao, X.; Pang, X.; Jiang, F.; Li, L.; Huyan, Y.; Zheng, D. Reservoir characterization of tight sandstones using nuclear magnetic resonance and incremental pressure mercury injection experiments: Implication for tight sand gas reservoir quality. Energy Fuels 2017, 31, 10420–10431. [Google Scholar] [CrossRef]
- Xue, D.J.; Liu, Y.T.; Zhou, J.; Sun, X.T. Visualization of helium-water flow in tight coal by the low-field nmr imaging: An experimental observation. J. Pet. Sci. Eng. 2019, 188, 106862. [Google Scholar] [CrossRef]
- Ji, Y.K.; Liu, C.L.; Zhang, Z.; Meng, Q.G.; Zhang, Y.C.; Wu, N.Y. Experimental study on characteristics of pore water conversion during methane hydrates formation in unsaturated sand. China Geol. 2022, 5, 276–284. [Google Scholar] [CrossRef]
- Qin, X.W.; Lu, J.A.; Lu, H.L.; Qiu, H.J.; Liang, J.Q.; Kang, D.J.; Zhan, L.S.; Lu, H.F.; Kuang, Z.G. Coexistence of natural gas hydrate, free gas and water in the gas hydrate system in the shenhu area, south china sea. China Geol. 2020, 3, 210–220. [Google Scholar] [CrossRef]
- Niroomand, S.; Fauchoux, M.T.; Simonson, C.J. Evaluation of the frost properties on a semipermeable membrane. Int. J. Heat Mass Transf. 2019, 133, 435–444. [Google Scholar] [CrossRef]
- Gu, J.; Jeong, Y.J.; Na, J.Y.; Seon, J.K.; Kang, K. Application of semi-permeable membrane for a scaffold in a nature-mimicking vascular system. J. Membr. Sci. 2020, 611, 118384. [Google Scholar] [CrossRef]
- Feng, C.; Guimares, A.S.; Ramos, N.; Sun, L.; Janssen, H. Hygric properties of porous building materials (vi): A round robin campaign. Build. Environ. 2020, 185, 107242. [Google Scholar] [CrossRef]
- SY/T 5346-2005; Determination of Capillary Pressure Curve of Rocks. National Development and Reform Commission: Beijing, China, 2005.
- Glorioso, J.C.; Aguirre, O.; Piotti, G.; Mengual, J.F. Deriving Capillary Pressure and Water Saturation from NMR Transversal Relaxation Times; Society of Petroleum Engineers: Richardson, TX, USA, 2003. [Google Scholar] [CrossRef]
- Wen, Y.; Qu, M.; Hou, J.; Liang, T.; Yuan, N. Experimental study on nitrogen drive and foam assisted nitrogen drive in varying-aperture fractures of carbonate reservoir. J. Pet. Sci. Eng. 2019, 180, 994–1005. [Google Scholar] [CrossRef]
- Zuo, J.Y.; Mullins, O.C.; Achourov, V.; Pfeiffer, T.; Pan, S.; Wang, K.; Kollien, T.; di Primio, R. Fluid distributions during light hydrocarbon charges into oil reservoirs using multicomponent maxwell-stefan diffusivity in gravitational field. Fuel 2017, 209, 211–223. [Google Scholar] [CrossRef]
- Liu, G.; Liu, K.; Zhai, G.; Zhao, J.; Guo, Z. Crystallinity and formation of silica in Palaeozoic shales: A new quantification calculation method based on X-ray diffraction. Mar. Petroelum Geol. 2023, 150, 106124. [Google Scholar] [CrossRef]
- Liu, G.; Zhai, G.; Yang, R.; He, T.; Wei, B. Quartz crystallinity index: New quantitative evidence for biogenic silica of the Late Ordovician to Early Silurian organic-rich shale in the Sichuan Basin and adjacent areas, China. Sci. China Earth Sci. 2021, 64, 773–787. [Google Scholar] [CrossRef]
- Liu, G.; Liu, B.; Liu, K.; Zhai, G.; Guo, Z. Silica crystallinity: Characteristics and controlling factors in marine shale of the upper Yangtze area, China. Mar. Pet. Geol. 2022, 143, 105833. [Google Scholar] [CrossRef]
Figure 1.
Location and strata of the study area in Xihu sag.

Figure 2.
Device used for the gas-driven water displacement–magnetic resonance imaging (GWD-MRI) experiment.
Figure 2.
Device used for the gas-driven water displacement–magnetic resonance imaging (GWD-MRI) experiment.

Figure 3.
Device used in the semi-permeable baffle experiment [19].
Figure 3.
Device used in the semi-permeable baffle experiment [19].

Figure 4.
Low-permeability GWD-MRI experiment results for Sample A10 (4320.9 m in Well A-2). The captions of the sub-figures denote “sample number-driving pressure-cumulative driving time-water saturation”.
Figure 4.
Low-permeability GWD-MRI experiment results for Sample A10 (4320.9 m in Well A-2). The captions of the sub-figures denote “sample number-driving pressure-cumulative driving time-water saturation”.

Figure 5.
Pressure gradient calculated from the experimental data for sample A10.

Figure 6.
Medium-permeability GWD-MRI experiment results for Sample A25 (4324.9 m in Well D-1). The captions of the sub-figures denote “sample number, driving pressure, cumulative driving time, and water saturation”.
Figure 6.
Medium-permeability GWD-MRI experiment results for Sample A25 (4324.9 m in Well D-1). The captions of the sub-figures denote “sample number, driving pressure, cumulative driving time, and water saturation”.

Figure 7.
Water content map of the core during the driving process.

Figure 8.
High-permeability GWD-MRI experimental results for Sample A45 (4106.86 m in Well F-1). The captions of the sub-figures denote “sample number, driving pressure, cumulative driving time, and water saturation”.
Figure 8.
High-permeability GWD-MRI experimental results for Sample A45 (4106.86 m in Well F-1). The captions of the sub-figures denote “sample number, driving pressure, cumulative driving time, and water saturation”.


Figure 9.
T2 spectra and water saturation changes after displacement: (a) T2 spectra of A10 after different drive times, (b) T2 spectra of A25 after different drive times, (c) T2 spectra of A45 after different drive times, and (d) change in Sw with increase in drive time under the same pressure.
Figure 9.
T2 spectra and water saturation changes after displacement: (a) T2 spectra of A10 after different drive times, (b) T2 spectra of A25 after different drive times, (c) T2 spectra of A45 after different drive times, and (d) change in Sw with increase in drive time under the same pressure.

Figure 10.
Relationship between the charging pressure and water saturation in the SPB experiment: (a) Sw change in SPB charging modeling of ultra-low-permeability samples (<0.1 mD), (b) Sw change in SPB charging modeling of low-permeability samples (0.1–0.5 mD), and (c) Sw change in SPB charging modeling of medium- and high-permeability samples (>0.5 mD).

Figure 11.
Comparison of final water saturation between sealed cores and SPB model results.

Figure 12.
Cen-NMR T2 spectra and water saturation relationship: (a) T2 spectra of A26 under different rotating speeds, (b) T2 spectra of A5 under different rotating speeds, (c) T2 spectra of A45 under different rotating speeds, and (d) water saturation change under different centrifugal forces.
Figure 12.
Cen-NMR T2 spectra and water saturation relationship: (a) T2 spectra of A26 under different rotating speeds, (b) T2 spectra of A5 under different rotating speeds, (c) T2 spectra of A45 under different rotating speeds, and (d) water saturation change under different centrifugal forces.

Figure 13.
Relationship between rock permeability and water saturation after centrifugation.

Figure 14.
Comparison of water saturation in different modeling experiments: (a) comparison for ultra-low-permeability sample (<0.1 mD); (b) comparison for low-permeability samples (0.1–0.5 mD); (c) comparison for medium-permeability samples (0.5–2 mD); and (d) comparison for high-permeability samples (>2 mD).


Table 1.
Information of samples.
| NO. | Well | Formation | Depth | Lithology | Length | Diameter | Pore % | Permeabilty mD | SPB | GWD-MRI | Cen-NMR |
|---|---|---|---|---|---|---|---|---|---|---|---|
| A1 | A-1 | H3 | 3449 | Fine sandstone | 3.71 | 2.47 | 7.6 | 0.091 | √ | √ | |
| A4 | A-1 | H4 | 3823.1 | Fine sandstone | 4.07 | 2.47 | 11.2 | 1.946 | √ | ||
| A5 | A-1 | H4 | 3831.6 | Fine sandstone | 3.64 | 2.47 | 10.6 | 1.018 | √ | ||
| A7 | A-2 | H3 | 3614.9 | Fine sandstone | 3.53 | 2.47 | 10 | 8.152 | √ | √ | |
| A10 | A-2 | H6 | 4320.9 | Fine sandstone | 3.36 | 2.48 | 8 | 0.344 | √ | √ | |
| A17 | B-2 | H3b | 3752.7 | Fine sandstone | 4.03 | 2.51 | 10.7 | 2.623 | √ | ||
| A20 | B-2 | H4b | 4008 | Fine sandstone | 4.07 | 2.47 | 7.5 | 0.291 | √ | ||
| A25 | D-1 | H3 | 4324.9 | Fine sandstone | 3.47 | 2.49 | 8.2 | 1.394 | √ | √ | |
| A26 | D-1 | H8 | 5106.9 | Fine sandstone | 3.39 | 2.47 | 8.5 | 0.369 | √ | √ | |
| A45 | F-1 | P10 | 4106.86 | Sandstone | 3.05 | 2.49 | 12.5 | 5.292 | √ | √ |
Table 2.
Water saturation data of airtight cores from Huagang formation, well A-4.
| Well | Depth m | Rock Density g/cm3 | Porosity % | Permeability mD | Sw of Sealed Cores % |
|---|---|---|---|---|---|
| A-4 | 3507.1 | 2.38 | 10.3 | 4.6 | 52.3 |
| A-4 | 3507.4 | 2.35 | 11.2 | 6.5 | 50.8 |
| A-4 | 3507.66 | 2.34 | 11.7 | 12.2 | 47.6 |
| A-4 | 3509.53 | 2.44 | 7.8 | 0.28 | 61.3 |
| A-4 | 3510.01 | 2.36 | 10.6 | 1.5 | 42.8 |
| A-4 | 3510.41 | 2.38 | 9.9 | 1.2 | 47.6 |
| A-4 | 3510.76 | 2.39 | 9.6 | 0.95 | 52.3 |
| A-4 | 3511.13 | 2.40 | 9.2 | 0.92 | 56.4 |
| A-4 | 3511.39 | 2.37 | 10.3 | 0.63 | 43.5 |
| A-4 | 3511.71 | 2.42 | 8.4 | 0.65 | 55.0 |
| A-4 | 3512.11 | 2.39 | 9.5 | 1.0 | 49.9 |
| A-4 | 3512.38 | 2.55 | 4.2 | 0.06 | 37.1 |
| A-4 | 3512.78 | 2.34 | 11.4 | 2.5 | 40.1 |
| A-4 | 3513.1 | 2.39 | 9.5 | 1.7 | 49.7 |
| A-4 | 3513.43 | 2.36 | 10.5 | 2.4 | 48.5 |
| A-4 | 3514.03 | 2.36 | 10.6 | 2.7 | 49.3 |
| A-4 | 3514.45 | 2.37 | 10.6 | 1.1 | 48.6 |
| A-4 | 3514.61 | 2.38 | 10.8 | 1.7 | 51.9 |
Disclaimer/Publisher’s Note: The statements, opinions and data contained in all publications are solely those of the individual author(s) and contributor(s) and not of MDPI and/or the editor(s). MDPI and/or the editor(s) disclaim responsibility for any injury to people or property resulting from any ideas, methods, instructions or products referred to in the content. |
© 2023 by the authors. Licensee MDPI, Basel, Switzerland. This article is an open access article distributed under the terms and conditions of the Creative Commons Attribution (CC BY) license (https://creativecommons.org/licenses/by/4.0/).
Share and Cite
MDPI and ACS Style
Chen, J.; Huang, Z.; Yao, G.; Fan, H. Gas–Water Characteristics of Tight Sandstone in Xihu Sag, East China Sea Basin under Different Charging Models. Processes 2023, 11, 1310. https://doi.org/10.3390/pr11051310
AMA Style
Chen J, Huang Z, Yao G, Fan H. Gas–Water Characteristics of Tight Sandstone in Xihu Sag, East China Sea Basin under Different Charging Models. Processes. 2023; 11(5):1310. https://doi.org/10.3390/pr11051310
Chicago/Turabian StyleChen, Jinlong, Zhilong Huang, Genshun Yao, and Hongche Fan. 2023. "Gas–Water Characteristics of Tight Sandstone in Xihu Sag, East China Sea Basin under Different Charging Models" Processes 11, no. 5: 1310. https://doi.org/10.3390/pr11051310
Note that from the first issue of 2016, this journal uses article numbers instead of page numbers. See further details here.