

Application of Multidimensional Structural Equations in the Emergency Management of Coal Mine Accidents
1
School of Management, Heilongjiang University of Science and Technology, Harbin 150022, China
2
Business School, Cardiff University, Cardiff CF10 3EU, UK
*
Authors to whom correspondence should be addressed.
Processes 2023, 11(3), 882; https://doi.org/10.3390/pr11030882
Submission received: 30 January 2023
/
Revised: 6 March 2023
/
Accepted: 12 March 2023
/
Published: 15 March 2023
(This article belongs to the Special Issue Modeling, Operation and Planning in Engineering System Problems)
Abstract
:The use of coal as a source of energy is crucial for the growth of the national economy, but mining poses numerous risks and a potential for significant disasters. Coal mine safety is the prerequisite and guarantee for coal industry to achieve new industrialization and sustainable development. Therefore, it is crucial to predict a safety accident in the coal mine in advance. In order to facilitate the early warning of coal mine safety accidents, this study seeks to present a prediction model based on emergency management of safety accidents, which is a fusion model of principal component analysis (PCA) and long short-term memory neural network. According to the results, the correlation coefficients of risk identification and monitoring (a11), safety inspection and warning (a12), emergency planning and training (a13), material and technical support (a15), and macroenvironmental management (a21) were 0.718, 0.653, 0.628, 0.444, and 0.553, respectively, after the PCA dimensionality reduction process, demonstrating that the previous principal component analysis had a better effect. The absolute relative errors of each evaluation index of safety accident emergency management did not exceed the limit of 5%, including a15 and a21, whose values were 4.5% and −3.8%, while the relative errors of the remaining indicators were kept at a relatively low level. In conclusion, it is clear that the algorithm model suggested in this research improved the warning capabilities of safety accident emergency risk.
1. Introduction
An important topic [1,2,3] that coal mining enterprises are currently dealing with is how to establish a scientific and practical emergency management capability assessment model. This is a significant challenge for coal mining enterprises. Governments are paying increasing attention to the management of emergency plans for coal mine accidents. Moreover, this issue has attracted great attention from public management science and practice. Good management related to emergency planning can reduce accidents and guarantee timely and efficient rescue work. Additionally, there is growing interest in the significance of emergency management as a hot topic in emergency situations. Due to the use of a single evaluation method, it is challenging to guarantee the accuracy of both domestic and international studies, and subjective authorization affects both the transparency of the evaluation process and the validity of the evaluation model [4,5]. In order to create a suitable emergency response system for the occurrence of disaster hazards in mines, it is crucial to reduce the number of evaluation index dimensions. As a result, this study proposes a multidimensional structural equation model based on PCA-LSTM. The PCA-LSTM algorithm is a machine learning algorithm that uses principal component analysis (PCA) and recurrent neural networks (LSTM) to predict sequential data. PCA is a technique used to reduce the dimensionality of data by analyzing the relationships between features and mapping the data onto a lower dimensional space. The temporal dependencies of data are learned and stored by special recurrent neural networks called LSTM models. By combining PCA methods with LSTM models, PCA-LSTM algorithms can produce better results in a variety of applications, including time series prediction, text analysis, and natural language processing. PCA-LSTM can handle noisy, time-delayed, and multivariate data and accurately learns patterns in data.
Coal mine safety is related to the stable development of the national economy and energy security, and the accident and disaster emergency plan system is a necessary link in the safety production system of coal mines. The establishment of an emergency response system is necessary due to the severity of coal mine safety accidents. The current research can be mainly divided into four modules. Firstly, the research status of coal mine emergency management ability at home and abroad is introduced; secondly, the safety accident emergency management index and principal component analysis of data are determined; thirdly, the safety accident emergency management model is established; finally, the application effect of the multidimensional structural equation in safety accident emergency management is studied and analyzed.
2. Related Work
In order to assess accidents and related risk factors in the work of research laboratories at Lebanese national universities as well as the effects of training and services on security measures, Nasrallah and colleagues conducted a study among laboratory staff at public universities. Based on their analysis of the process of integrating the forces of society to deal with emergencies based on the mechanism of emergencies, they came to the conclusion that regular incidence training is crucial for maintaining the safety and health of scientific laboratories [6]. The hypothesis that circadian rhythm disturbances and sleep deprivation may be the cause of the increased risk of MVA was developed by Fritz J et al. based on data from a large US registry and it was found that spring DST significantly increased the risk of fatal MVA by 6%, with the effect being more pronounced in the morning and further west within the time zone [7]. Yang et al. [8] produced a thorough analysis of the safety and environmental issues in the coal industry, as well as the company’s contribution to those issues. Enough consideration should be given to mine pollution in order to better understand the influences of human behavior and develop an efficient safety control system. Using the method of fault tree (FTA) to build a model for identifying the key risk factors and the inspection in the sales force automation, Wang et al. [9] presented the main issue of marine traffic safety, pointing out the fires of the marine environment are a kind of instantaneous and continuous development process; a small mistake can cause big loss (SFA). It was found that adequate ventilation and passenger emergency reaction are crucial factors in ensuring aircraft safety. Khajevandi et al. used the method of safety audit to investigate the safety violations of Kashgar Medical College, and found that safety requirements, emergency plans, safety system, and other areas all contained some hidden dangers. Universities must establish a security system in order to better the situation because there are no established roles or organizations for security [10].
According to Sun K et al., the use of hydrogen in vehicles has caused public authorities and private organizations such as fire departments and insurance firms to express safety concerns. Their research examined how hydrogen fuel cell vehicles typically progress during accidents on the road. The findings indicate that the danger brought on by a hydrogen release typically lasts no longer than 1.5 min. If no hissing is heard, a buffer zone with a perimeter of 100 m around the accident scene is advised for the public’s safety, indicating that insurance premiums for death and injury should be higher than those for property damage [11]. Skalozubov et al. recommended using the reliability and availability grade division of the emergency water supply system to improve the emergency treatment efficiency of the power plant with long-term complete power failure. This would allow the unit to completely lose the power supply for a long time in the early stage before entering the stable state of work. Alternative technologies are designated for efficient emergency handling [12]. To address the uncertain aspects of crises, Lin et al. developed an engineering emergency management model based on interval value intuitionistic fuzzy information [13]. According to Ying Liu and colleagues, by assessing the emergency management capabilities of coal mine companies, any issues or flaws can be identified, and the emergency management standard is raised. The safety and emergency of coal mine enterprises are calculated and assessed using the neural network technique. Neurons can be used to build neural networks of any form, which results in calculations that are precise and well-fitting [14]. In order to monitor coal mines and ensure worker safety, Sameer M. et al. explored an Internet of Things (IoT)-based emergency alert system. The researchers proposed an IoT-based safety alert system that can track the location of coal mine workers and send out prompt alerts in an emergency. To achieve this, their research work used a LoRa-based network to implement real-time safety alerting capabilities. The outcomes of their experiment demonstrate that the system is capable of quickly sending out safety alerts and accurately tracking the location of coal miners and issue safety alerts in a timely manner. Thus, an IoT-based coal mine tracking and worker safety emergency alert system can improve the safety of coal miners [15].
A deep learning algorithm called the graph long short-term memory (GLSTM) neural network was highlighted by Bacanin Nebojsa et al. for predicting the characteristics of air quality. Secondly, the predicted nodes are located using the Dragonfly optimizer. The algorithm based on deep evolution will increase the cost of air pollutant prediction and node location sensor [16]. A computerized method for deep learning of skin disease classification based on MobileNet V2 and long short-term memory has been proposed by Srinivasu Parvathaneni Naga et al. (LSTM). Studies have shown that the proposed system can assist general practitioners in effectively diagnosing skin diseases. Thus, complications and morbidity can be reduced [17]. To create the best deep learning model and improve the stock market’s capacity for daytime prediction, Krishna Kumar et al. merged RNN-LSTM with the flower pollination algorithm RNN-LSTM and particle swarm optimization technique. Recurrent neural network (RNN) is a type of neural network that is used to process sequential data. RNNs contain a loop that enables them to take their previous output into account when computing their current output. This enables them to learn patterns in data that are dependent on the order of the data. RNNs have been used for tasks, such as natural language processing, time series analysis, speech recognition, and image captioning [18].
A coal mine safety accident emergency management model is proposed in this study in order to establish a safety management system and achieve the goal of preventing safety accidents. Based on the findings of domestic and foreign scholars’ research, more efforts should be made to explore the incidence of safety accidents and related risk factors, injury prevention, and management strategy in China and abroad.
3. Establishing an Emergency Management Approach to Security Incidents
3.1. Analysis of Safety Incident Emergency Management Indicators
To ensure the accuracy and efficacy of coal mine safety production, it is necessary to establish a scientific and reasonable evaluation index system of mine emergency management capability. The selection of indicators for evaluating the performance of coal mine safety production and operation must fully and impartially reflect the basic characteristics of coal mine production and operation. Based on the previous literature, this paper discusses the capabilities of prevention, environmental management, and command and rescue, and conducts a thorough and methodical evaluation of the four levels of post-accident handling capabilities [19], as shown in Table 1.
As shown in Table 1, this study collated a few index systems for evaluating the emergency management capability of coal mines. Numerous risk factors, such as safety risks and natural fires in mines, pose a significant threat because of the more complicated operating environment of mines and the frequent changes in working conditions and workplaces. Businesses should create emergency response plans to handle emergencies, enhance their capacity to respond to emergencies and disasters, and implement effective prevention and disposal to reduce harm to life, property, and the environment caused by disasters. Coal mines should create emergency plans that are appropriate for the unit’s risk factors and potential hazards, and they should organize the three components of comprehensive emergency plans, special emergency plans, and on-site disposal plans so that they can be easily referenced when forming enterprise emergency plans.
Since there are various types of safety accidents in mines and the degree of hazard is uncertain, each plan is composed of emergency plans according to different types of risk and degree of hazard in a horizontal parallel and vertical hierarchical way. The horizontal parallel relationship of each plan is divided by class, and the vertical relationship is divided by genus, and the individual plans in each emergency plan system have class relationship. There are two kinds of relationships between individual programs: one is caused by the spread of production emergencies, which requires simultaneous use of multiple individual programs; the other is caused by the intensification of production emergencies, which requires the simultaneous use of multiple individual programs. Based on both domestic and international experience, the general factors for the construction of China’s emergency planning system include the country’s current political and administrative structure, its laws and regulations, the history and current state of major emergencies, its reserve emergency plan, and the various parties’ revisions to the emergency plan. These aspects should be taken into account as a crucial starting point for creating an emergency preparation system. It has a significant guiding role for the basic work of establishing an emergency response plan system. The following three essential principles must also be the foundation for the creation and growth of our emergency response system. The first is the rule, which serves as a standard for conduct and a safety net for the continuity of the system and the group. The second is the steady development of the national emergency management system, an organizational structure that functions as both a command and response platform for emergencies and for daily emergency preparedness, especially for directing, supervising, checking, evaluating, and revising the daily revision of emergency plans. Finally, an emergency management operation mechanism is based on three mutually supportive emergency management operation mechanisms: the emergency preparedness guidance document (outline or guide), the national emergency handling system, and the emergency plan. The legal system, the system, and the operational process of emergency management are all part of the emergency management system and must therefore be fully considered when building the emergency planning system [20]. The emergency planning system and the emergency management operational mechanism are essential components of the total emergency management system and must be taken into account when building the system, as was previously demonstrated. In order to prepare the groundwork for later importation of the organized data into the model and improving the model’s accuracy, this study screens out several indicators with strong correlation from a large set of indicators used to evaluate the emergency management capacity of coal mines.
Principal component analysis (PCA) is a method to recombine the original variables into a new set of linearly independent indicators and select the smallest composite index to reflect the data of the original variables according to the actual needs [21]. PCA can be used in applications for coal mine safety disaster early warning management to reduce redundant data in coal mines, reduce data dimensionality, and enhance the effectiveness and visibility of coal mine data management. Firstly, a thorough analysis of the feature variables in coal mine data can be performed using PCA to pinpoint the most important and highly emotive features. These key features can be used to build a model of the mine data to better understand and grasp the mine data. Secondly, by using PCA coal mine data can be made less dimensional and more concise while also having fewer repeated feature variables. This increases the effectiveness of coal mine data management. Finally, PCA can be used to check for potential anomalies in the mine dataset to effectively manage the mine data and better understand its patterns. When this approach is used to assess a real-world issue, it can successfully reduce the computational workload and enhance analysis efficiency by removing correlation between the original variables and index selection workload. Principal component analysis can be applied in various aspects, including biomedical engineering, control engineering, data analysis, robotics, intelligent agriculture, etc. In order to preserve as much of the original data’s validity as possible, PCA projects the original data points to the direction of maximum variance in the new space after projection, and then project the direction of maximum variance to the direction of the next largest variance, and so on. Finally, a set of principal components arranged from the largest to the smallest and uncorrelated is produced, and these principal components can be used to describe the original data. In this study, the principal component analysis method is used to reduce the dimensionality of the coal mine emergency management evaluation indexes to obtain the principal component components, and all the evaluation index data are organized to obtain the sample matrix with the matrix size of dimension, as shown in Equation (1), and its centralized sample matrix is shown in Equation (2).
In Equation (1), is the characteristic parameter of the secondary index of coal mine emergency management evaluation, and the characteristic value of is found and arranged in order of alphabetical size, which is ; the covariance of the characteristic data set is calculated as shown in Equation (3).
On this basis, the coordinate system is assumed to be the eigenvector corresponding to the largest eigenvalue in that coordinate system, and then this projection matrix is output, whose transformed coordinate system is ; is the standard orthogonal basis vector. If the data are downscaled, the projection of the eigenvalue in the low-dimensional coordinate system is . The result of constructing from is shown in Equation (4).
The distance of the reconstituted from the previous is shown in Equation (5).
This study’s dimensionality reduction goal requires that Equation (5) must be minimized and that is used to represent the covariance matrix and determine the smallest eigenweight dimension, as shown in Equation (6).
Equation (6) was used as a constraint function in this study to determine the principal component components following the dimensionality reduction of PCA. In general, a cumulative contribution value between 85% and 95% captures most of the data information and effectively reduces the dimensionality of the raw data.
3.2. Establishment of Emergency Management Model for Safety Accidents
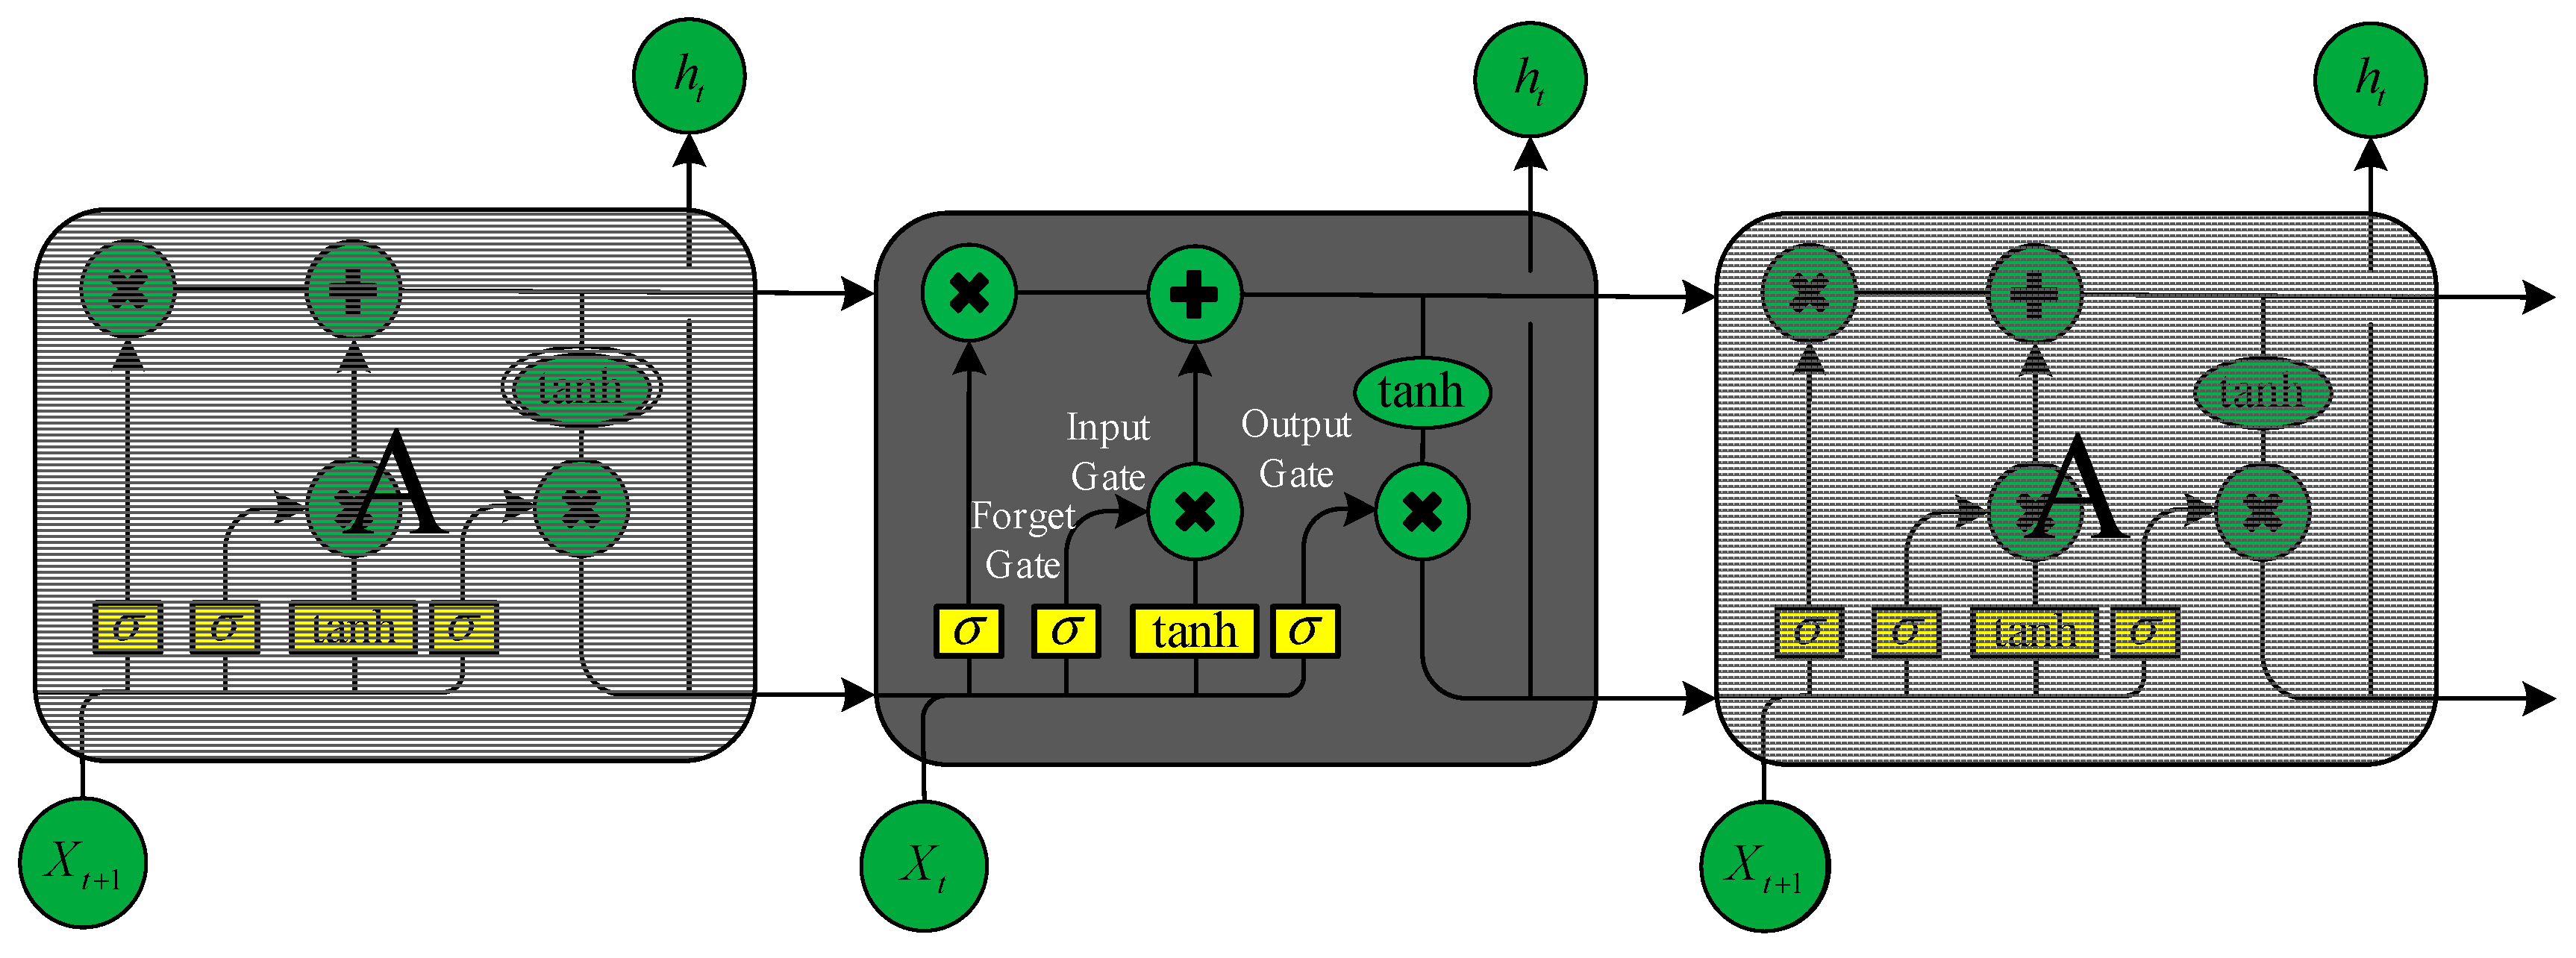
The remaining indicators are used as the input data for the model after the PCA screening and dimensionality reduction procedure of safety accident emergency management indicators. The research employs long short-term memory (LSTM), a recurrent neural network (RNN), in light of the interdependent relationships in the safety accident emergency management indicators data matrix. Input layer, hidden layer, and output layer are the three layers that make up the deep feed-forward neural network known as LSTM. Each layer also serves as a weighted information storage layer. This neural network has seen significant use recently in machine translation, speech recognition, and natural language processing, especially in the prediction of time series. However, in practice, if the sequence is too long, it will generate problems such as gradient burst and gradient disappearance, making it challenging to keep the memory for a long time. Additionally, the LSTM network uses RNN-based thresholding, which can solve this problem very well [22]. There are three gates in this network structure that control the information: the input gate, the forgetting gate, and the output gate, whose specific structure is depicted in Figure 1. In the process, the input gate determines which information should be saved, the forgetting gate determines which information should be forgotten, and the output gate determines the final output information, and the element values of the three gates are between [–1, 1] as shown in Figure 1.
The forgetting matrix is calculated based on Equation (7), the joint matrix consists of the input at the previous time and the input at this time. The output forgetting matrix reflects the selection of the cell condition matrix at the previous time.
In Equation (7), denotes the weighting matrix, denotes the bias, and the input gate is used to determine the information added to the cell state, as shown in Equations (8) and (9) with the same input form as the forgetting gate. The sigmoid layer determines the information needed to update the original cell state , and the tanh layer generates the updated content , multiplied by the two corresponding positions to form the cell state update matrix.
The output signal depends on the state of the cell, and in Equation (10), the sigmoid layer describes how the sigmoid layer selects the information to be output, and the final output is obtained by combining Equation (11) with the desired output cell state .
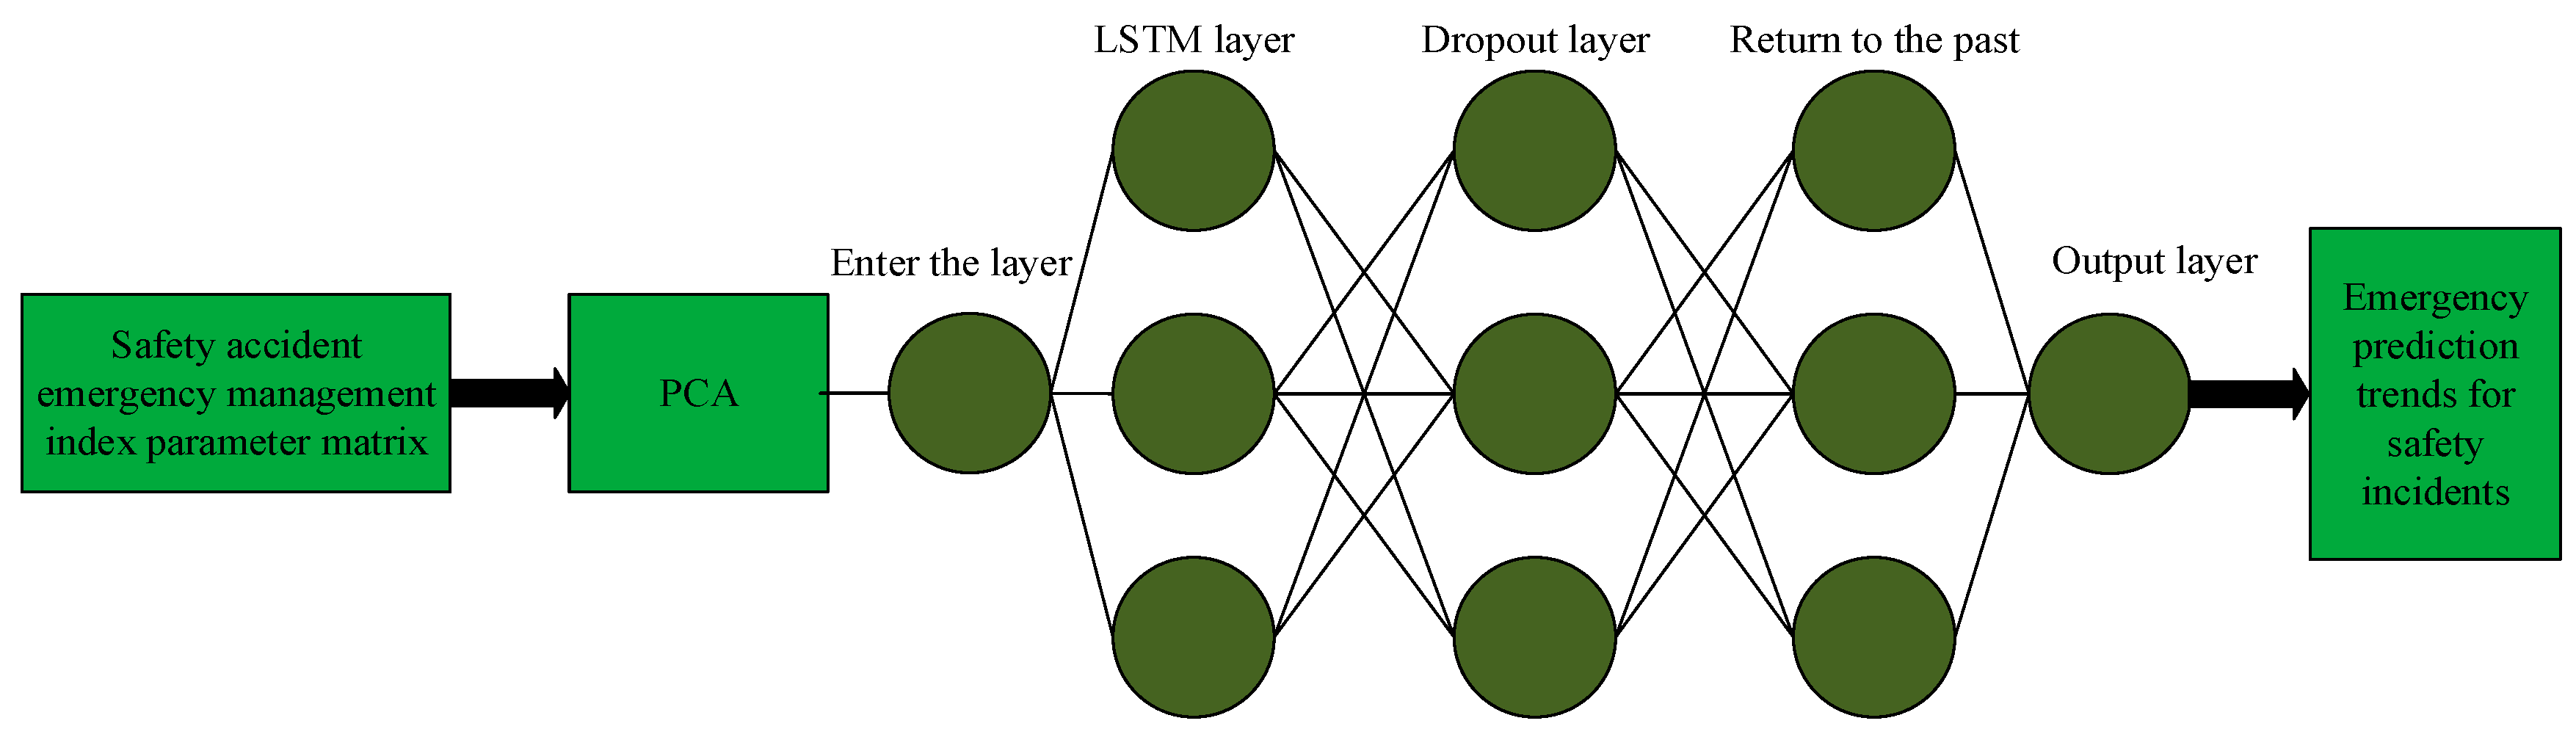
In Equations (10) and (11), represents the output of LSTM units at time , refers to the calculation of the output gate at time point in the LSTM network, represents the hyperbolic tangent activation function. Figure 2 shows the topology of the LSTM network model of this study. The implicit layer in this study is set to three layers, LSTM layer, unregulated deactivation (dropout layer), and regression layer, and finally outputs the anticipated degradation trend. This is conducted after extracting the safety incident emergency management index parameter matrix for the principal component analysis method of dimensionality reduction.
The role of each factor must be taken into account simultaneously in the neural network because various magnitudes and different ranges are generated during the actual data entry procedure. Therefore, the final data are categorized as normalized. The formula for normalization is shown in Equation (12).
In Equation (12), is the sample data series; is the mean of the sampled data and is the standard deviation of the sampled data. These issues can be resolved and the continuity of the time series connection between the data can be preserved by normalizing the data. The data must be denormalized after the prediction is finished, and the denormalization formula is shown in Equation (13).
The LSTM superparameter settings described in this study are shown in Table 2 and must be chosen before the actual modelling can begin.
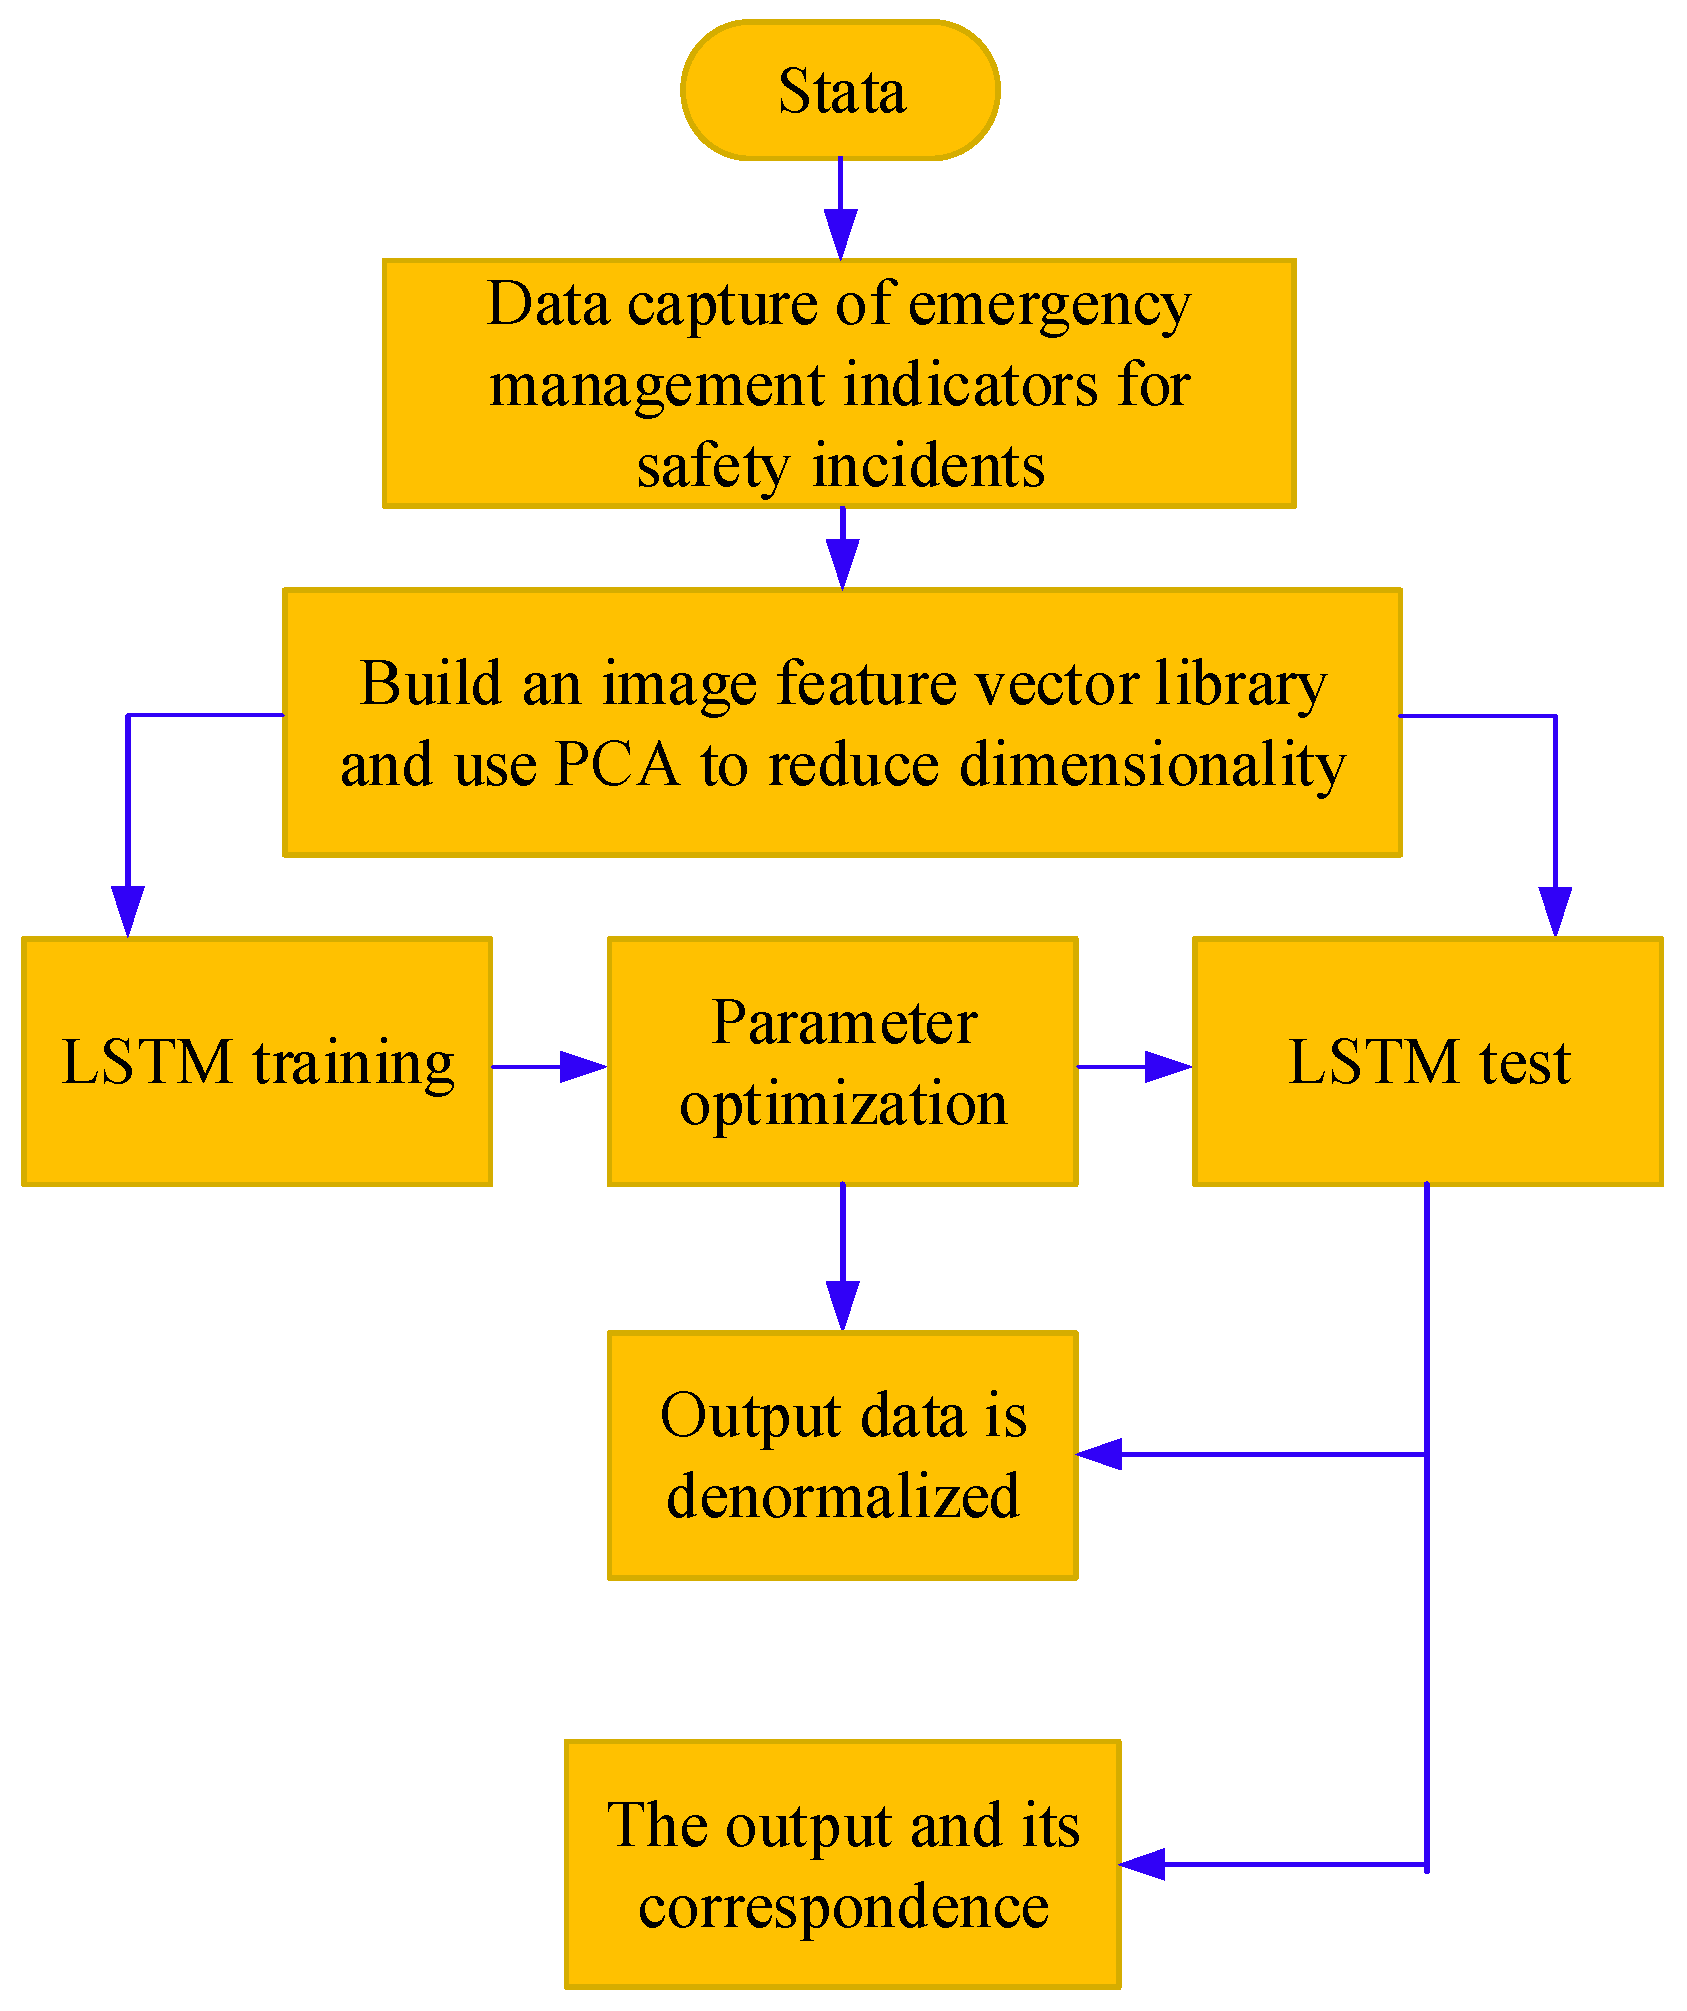
This study adjusts the stochastic deactivation rate to 0.2 and adds a stochastic deactivation layer to the implicit layer of the LSTM, which can successfully prevent its overfitting in the test set. In the solution procedure, the Adam adaptive moment estimation solution procedure is used, and the initial learning rate is set to 0.005, then the learning rate is multiplied by 0.2, and the gradient threshold is set to 1, thus avoiding the gradient burst. The activation function is tanh. Figure 3 depicts the precise flow of the PCA-LSTM model that was proposed in this study.
The specific process is shown in Figure 3, and the process is as follows: First, the network connection information is captured using the Sniffer in the network acquisition module, and the relevant safety accident emergency management index data are collected from the network. Secondly, after converting the character data on the network link into integer data, the data pre-processing unit is used to pre-process the safety accident emergency management index data, and the original input vector is then obtained through data normalization processing. Thirdly, the initial input vector is extracted by using principal element analysis, and the redundant data are eliminated to obtain the reduced dimensional input vector. The reduced-dimensional input vector is learned using the LSTM method under the LSTM model in order to obtain the best set of parameters , which are then saved in the event record database. The reduced-dimensional vectors are found using the LSTM method under the LSTM test approach. The output results are obtained, and they are then saved in the database so that their safety incident emergency management levels can be determined based on the information from the prediction. The mean square error (MSE) and the root mean square error (RMSE), which are two indicators used in this paper to assess the stability and accuracy of the model proposed in the study [23], are shown in Equations (6) to (7).
In Equations (14) to (15), is the total number of samples, is the model predicted value of the ith series, and means the actual value of the ith series.
4. Research and Analysis on the Effectiveness of PCA-LSTM Model in Emergency Management
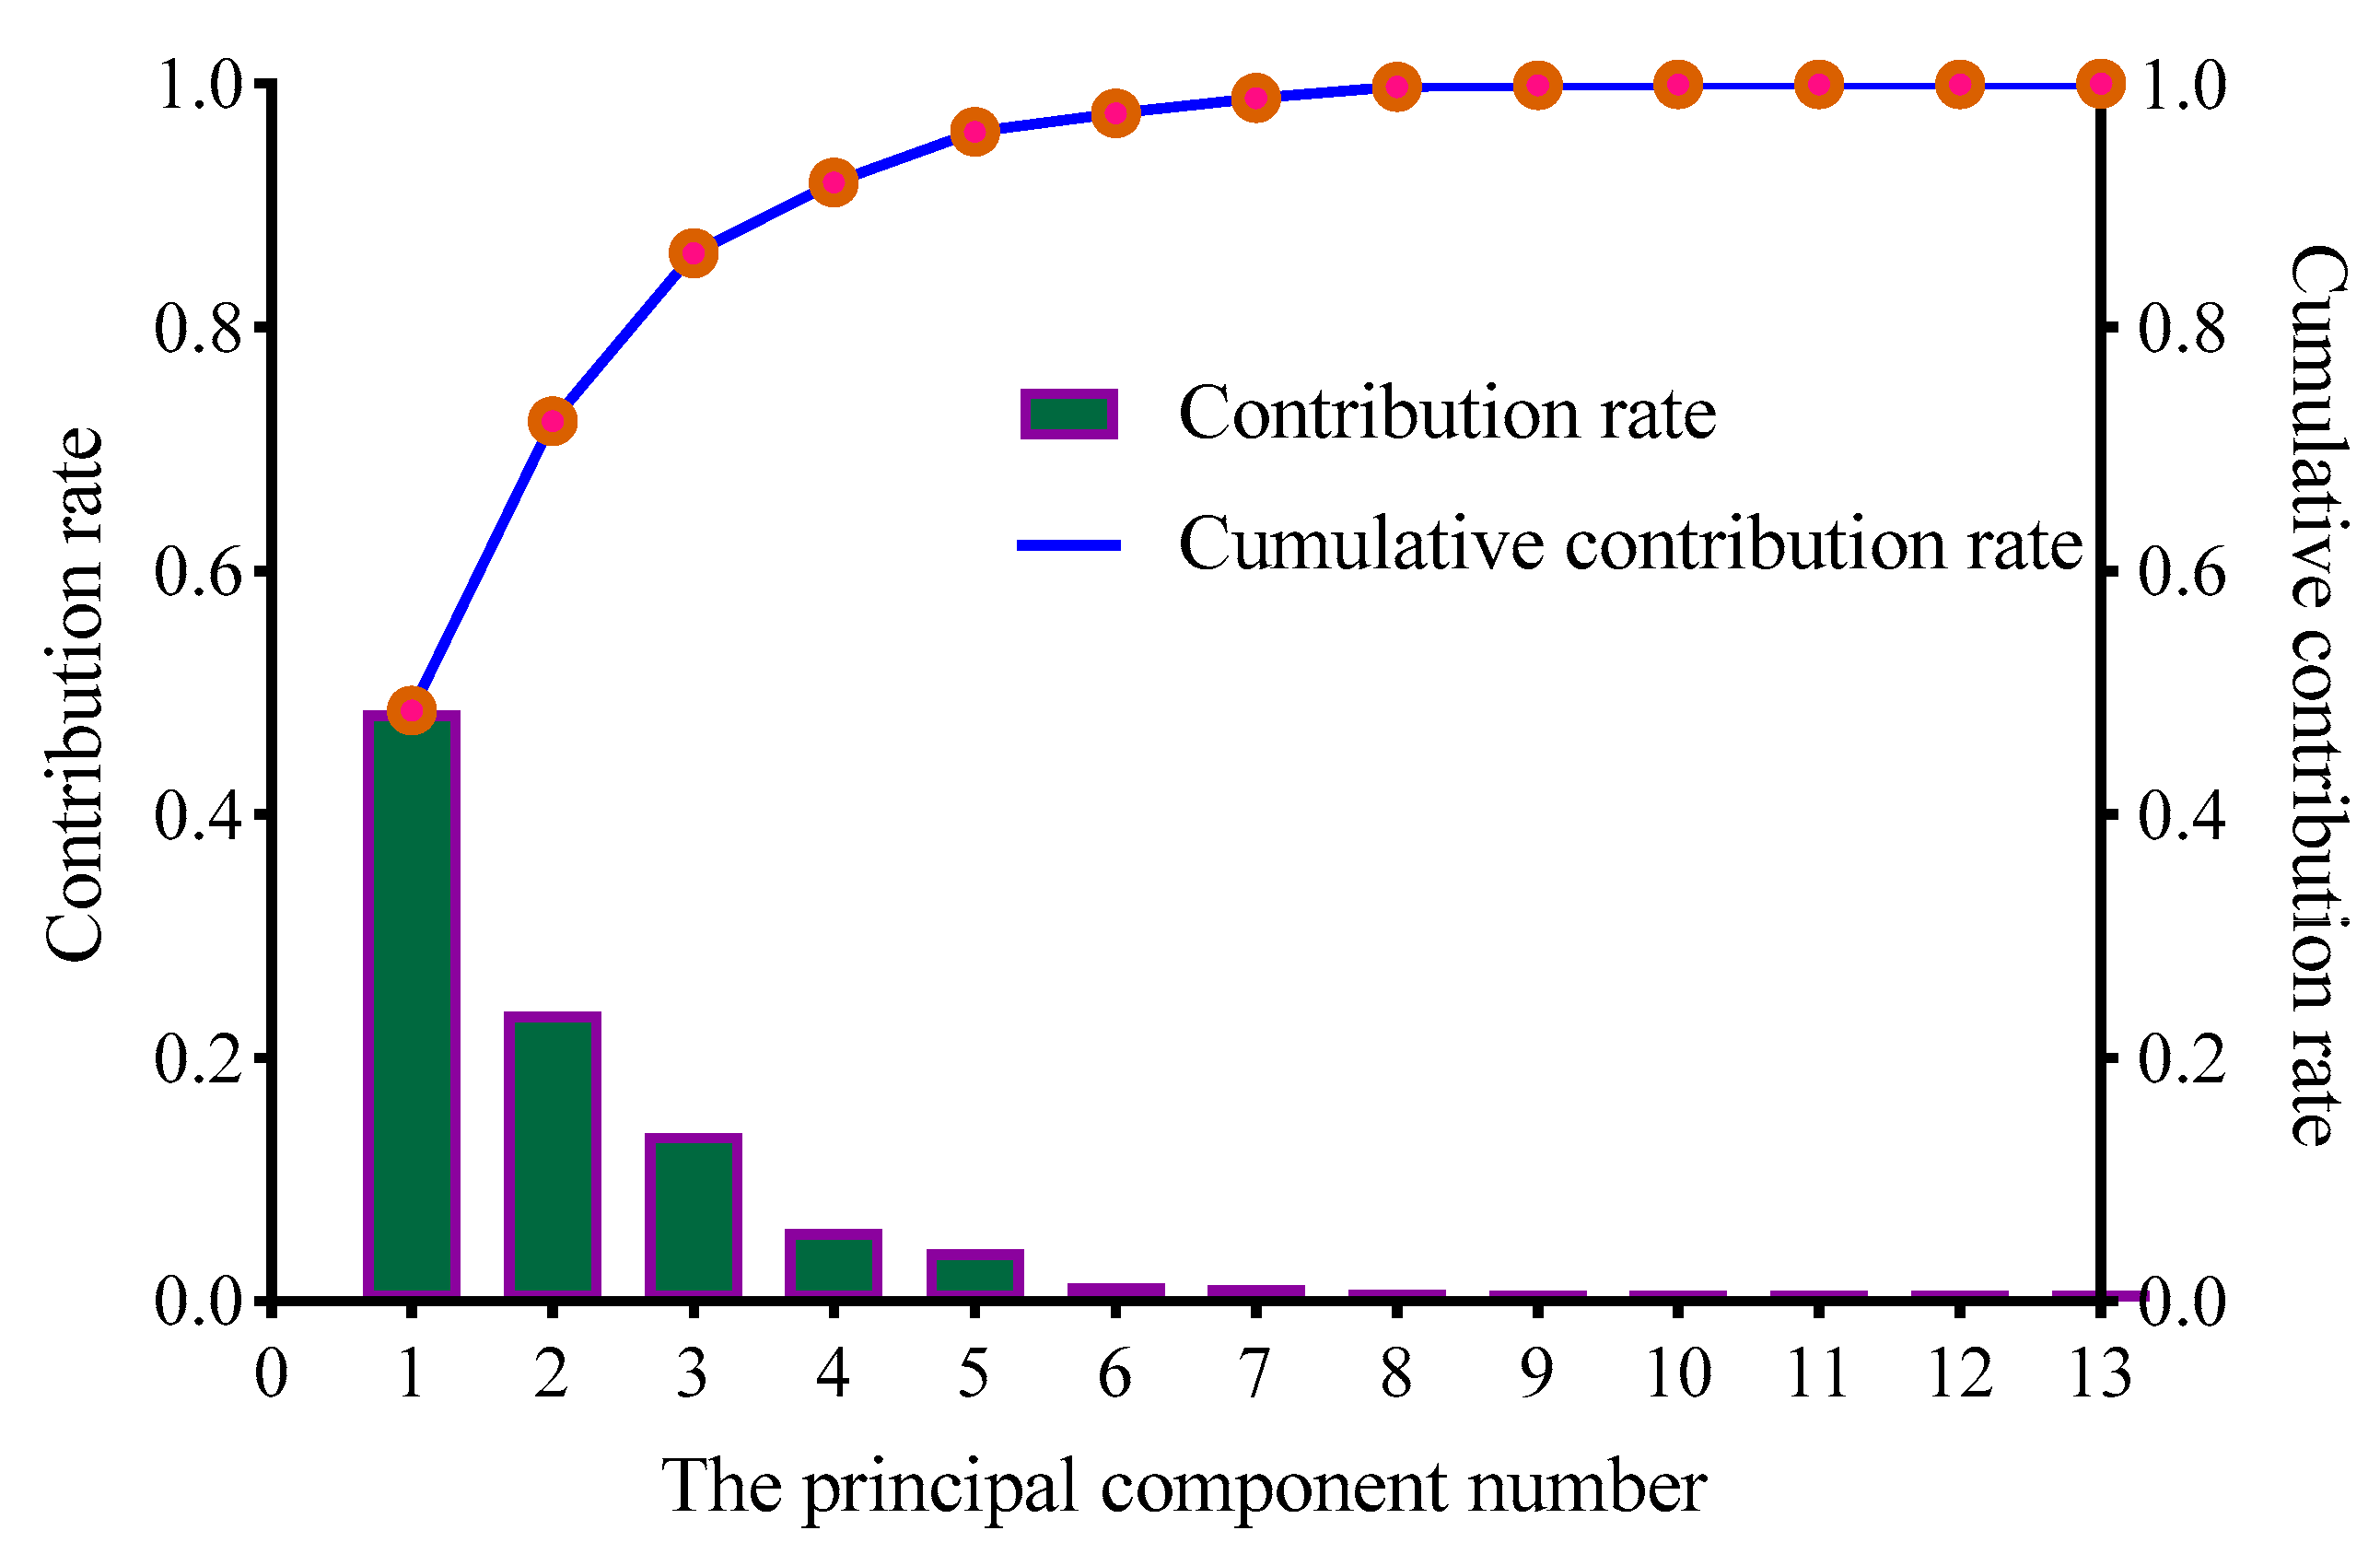
The method for normalizing the characteristic parameters used in this study involves iteratively calculating 15,980 data points from 13 evaluation indicators of safety accident emergency management. It includes hazard identification and monitoring (a11), safety inspection and early warning (a12), emergency planning and training (a13), emergency response institutions and equipment (a14), material and technical support (a15), rescue team and exercise (a16), and other data. In this research work, a questionnaire survey was conducted on the raw coal production mines under the Longmei Group of Heilongjiang. The respondents mainly included coal mine safety management personnel, technical personnel, front-line miners, and logistics personnel. A total of 1000 questionnaires were distributed, 834 were recovered, and 812 questionnaires were valid excluding those with incomplete answers. The questionnaire recovery rate was 83.4%, and the effective questionnaire rate was 97.3%. The main component contribution rate and cumulative contribution rate were obtained, as shown in Figure 4.
As can be seen in Figure 4, the first three principal components accumulated 86.06%, which surpassed 85%, indicating that they have covered the majority of the impact factors. Principal components 1, 2, and 3 each contributed 48.54%, 23.769%, and 13.757% of the total, respectively, so only the first three principal components, or the risk indicators of prevention preparedness (A1), were retained. Specifically, three safety incident emergency management risk assessment evaluations, specifically divided into hazard identification and monitoring (a11), safety inspection and warning (a12), and emergency planning and training (a13), were then added to the pre-built model for additional prediction as well as safety incident emergency management evaluation. To ascertain whether the established model input indicators were connected to safety incident emergency management, additional correlation tests were run on them.
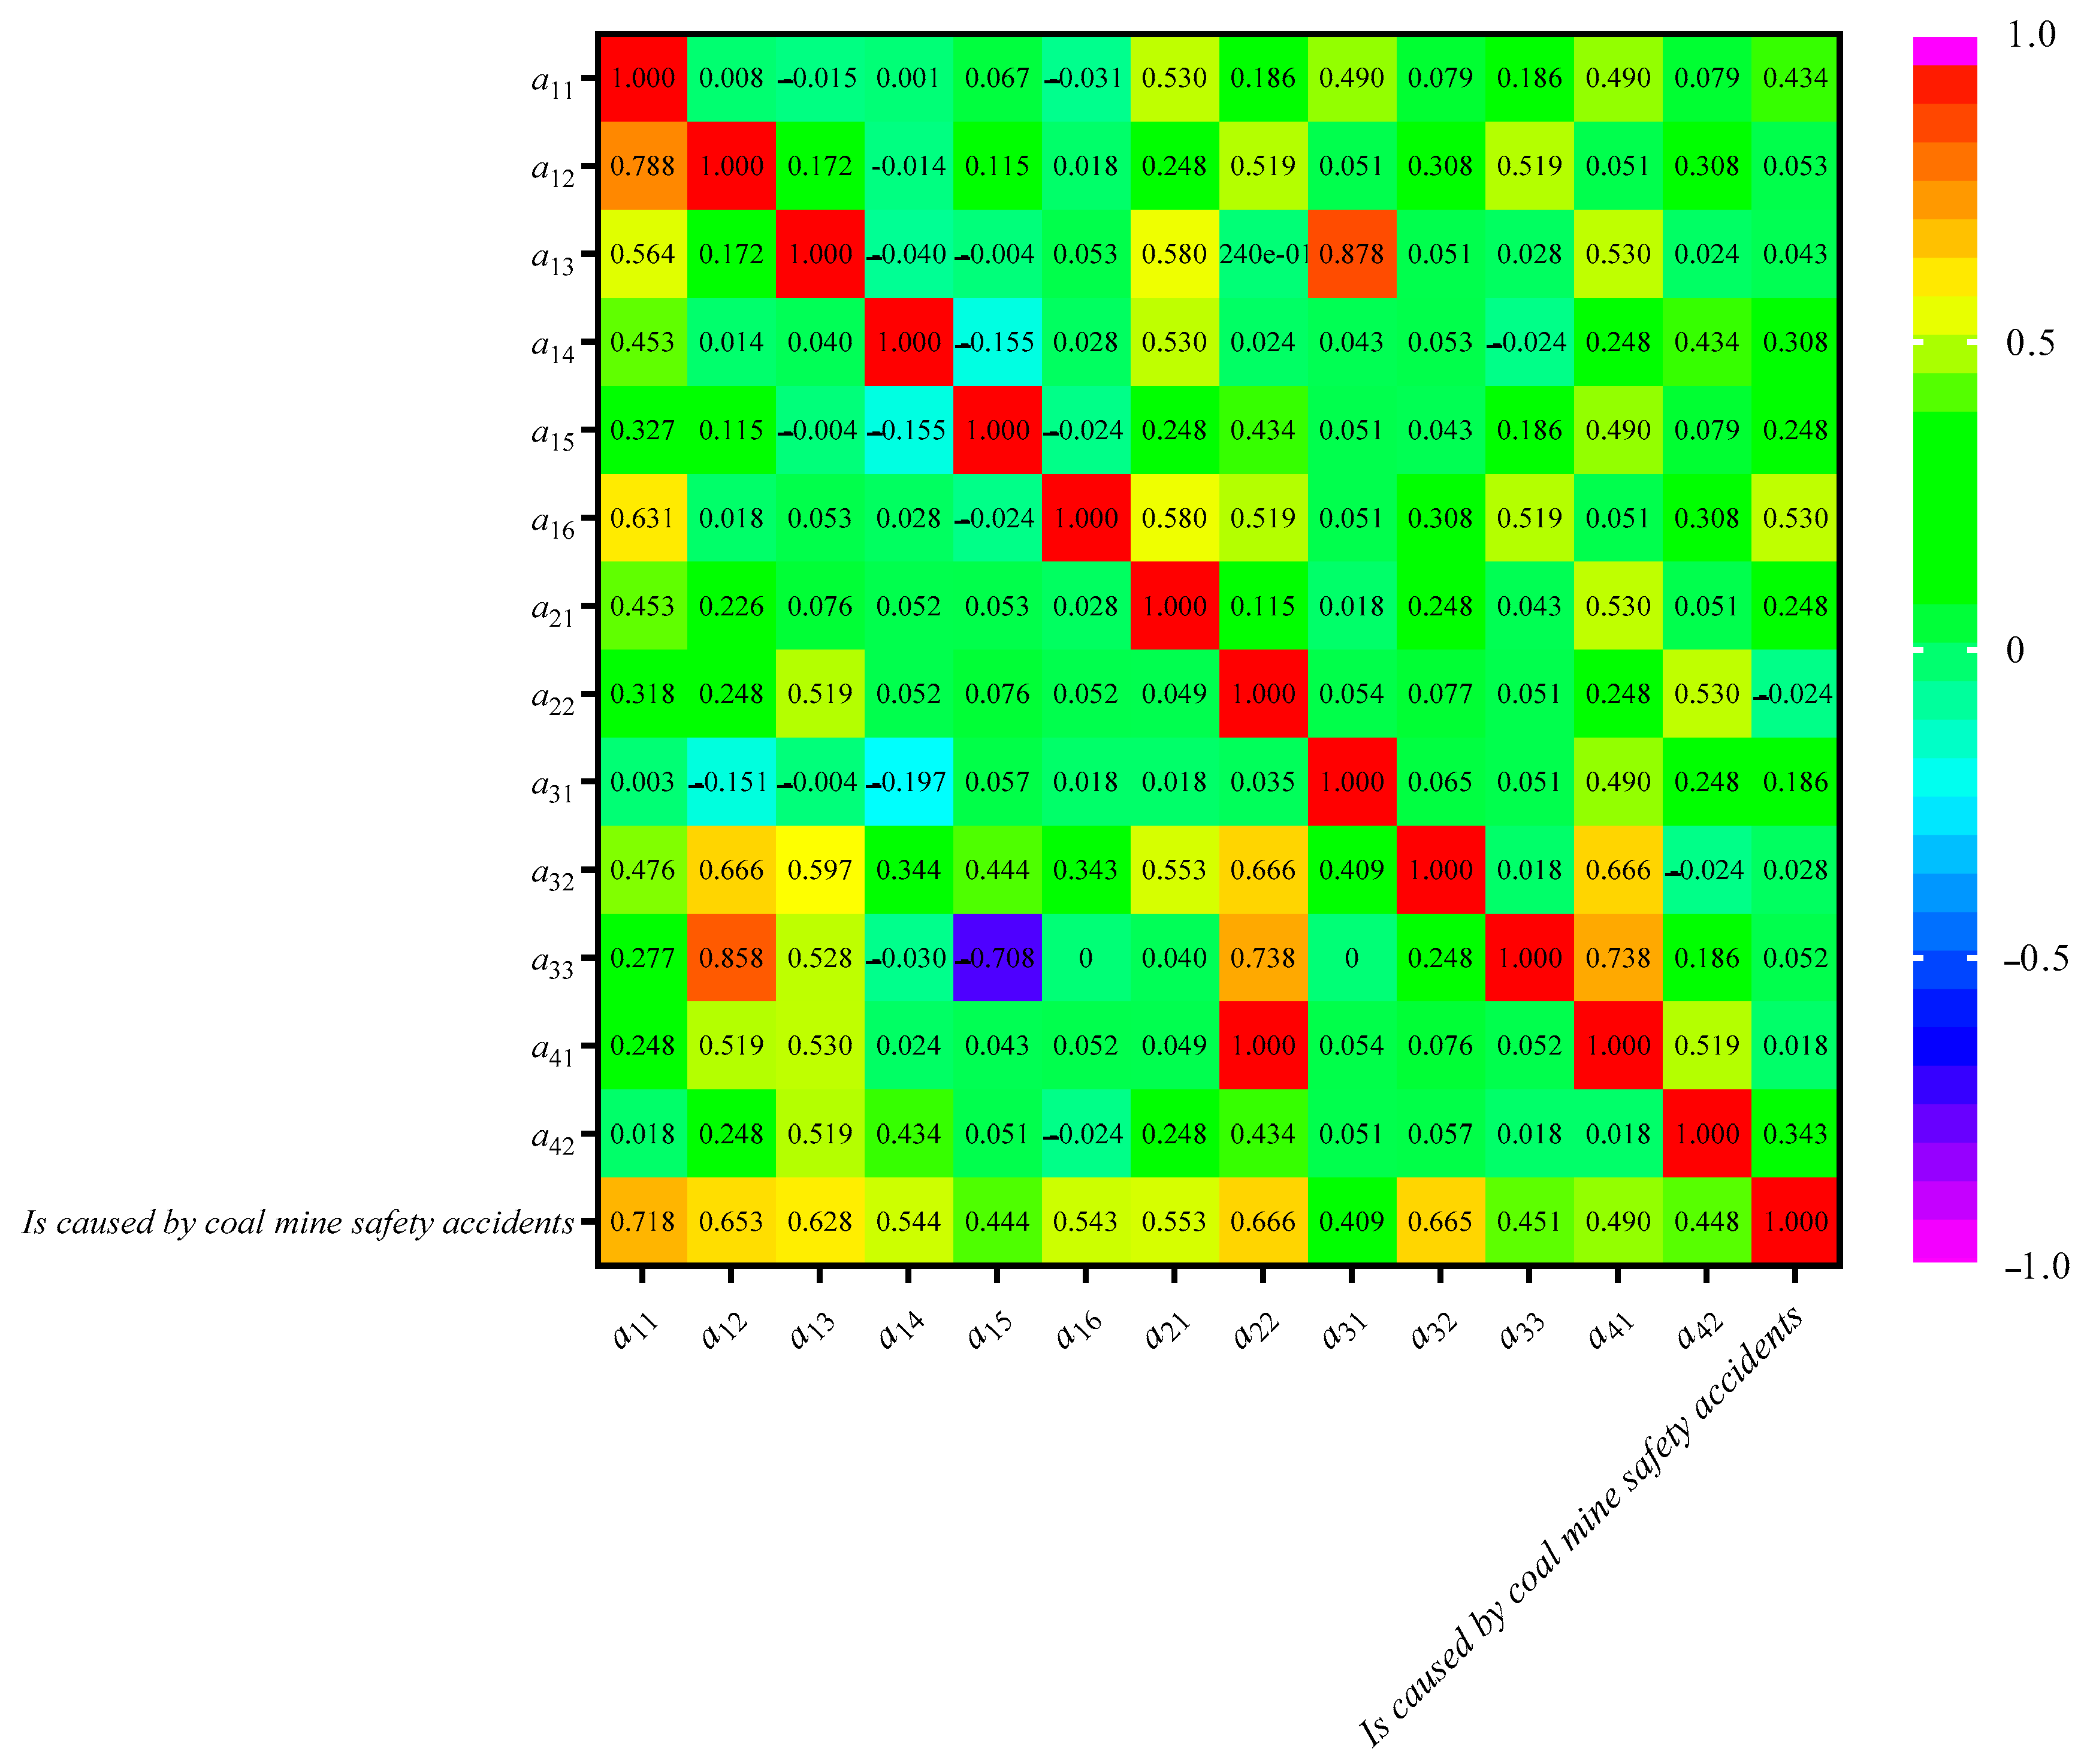
According to the Spearman rank correlation test color temperature plot in Figure 5, for the 13 coal mine safety accident emergency management evaluation indexes, the correlation coefficients with the enterprise’s presence of safety accident crisis factors in that year are generally around 0.5, including hazard identification and monitoring (a11), safety inspection and warning (a12), and emergency planning and training (a13) and the correlation coefficients were 0.718, 0.653, and 0.628, respectively. High correlation values of 0.653 and 0.628 showed that the previous principal component analysis was successful in eliminating factors with low correlations, and the factors with high correlations were used as the input data matrix of the model, laying the groundwork for the next step of incorporating the LSTM network model.
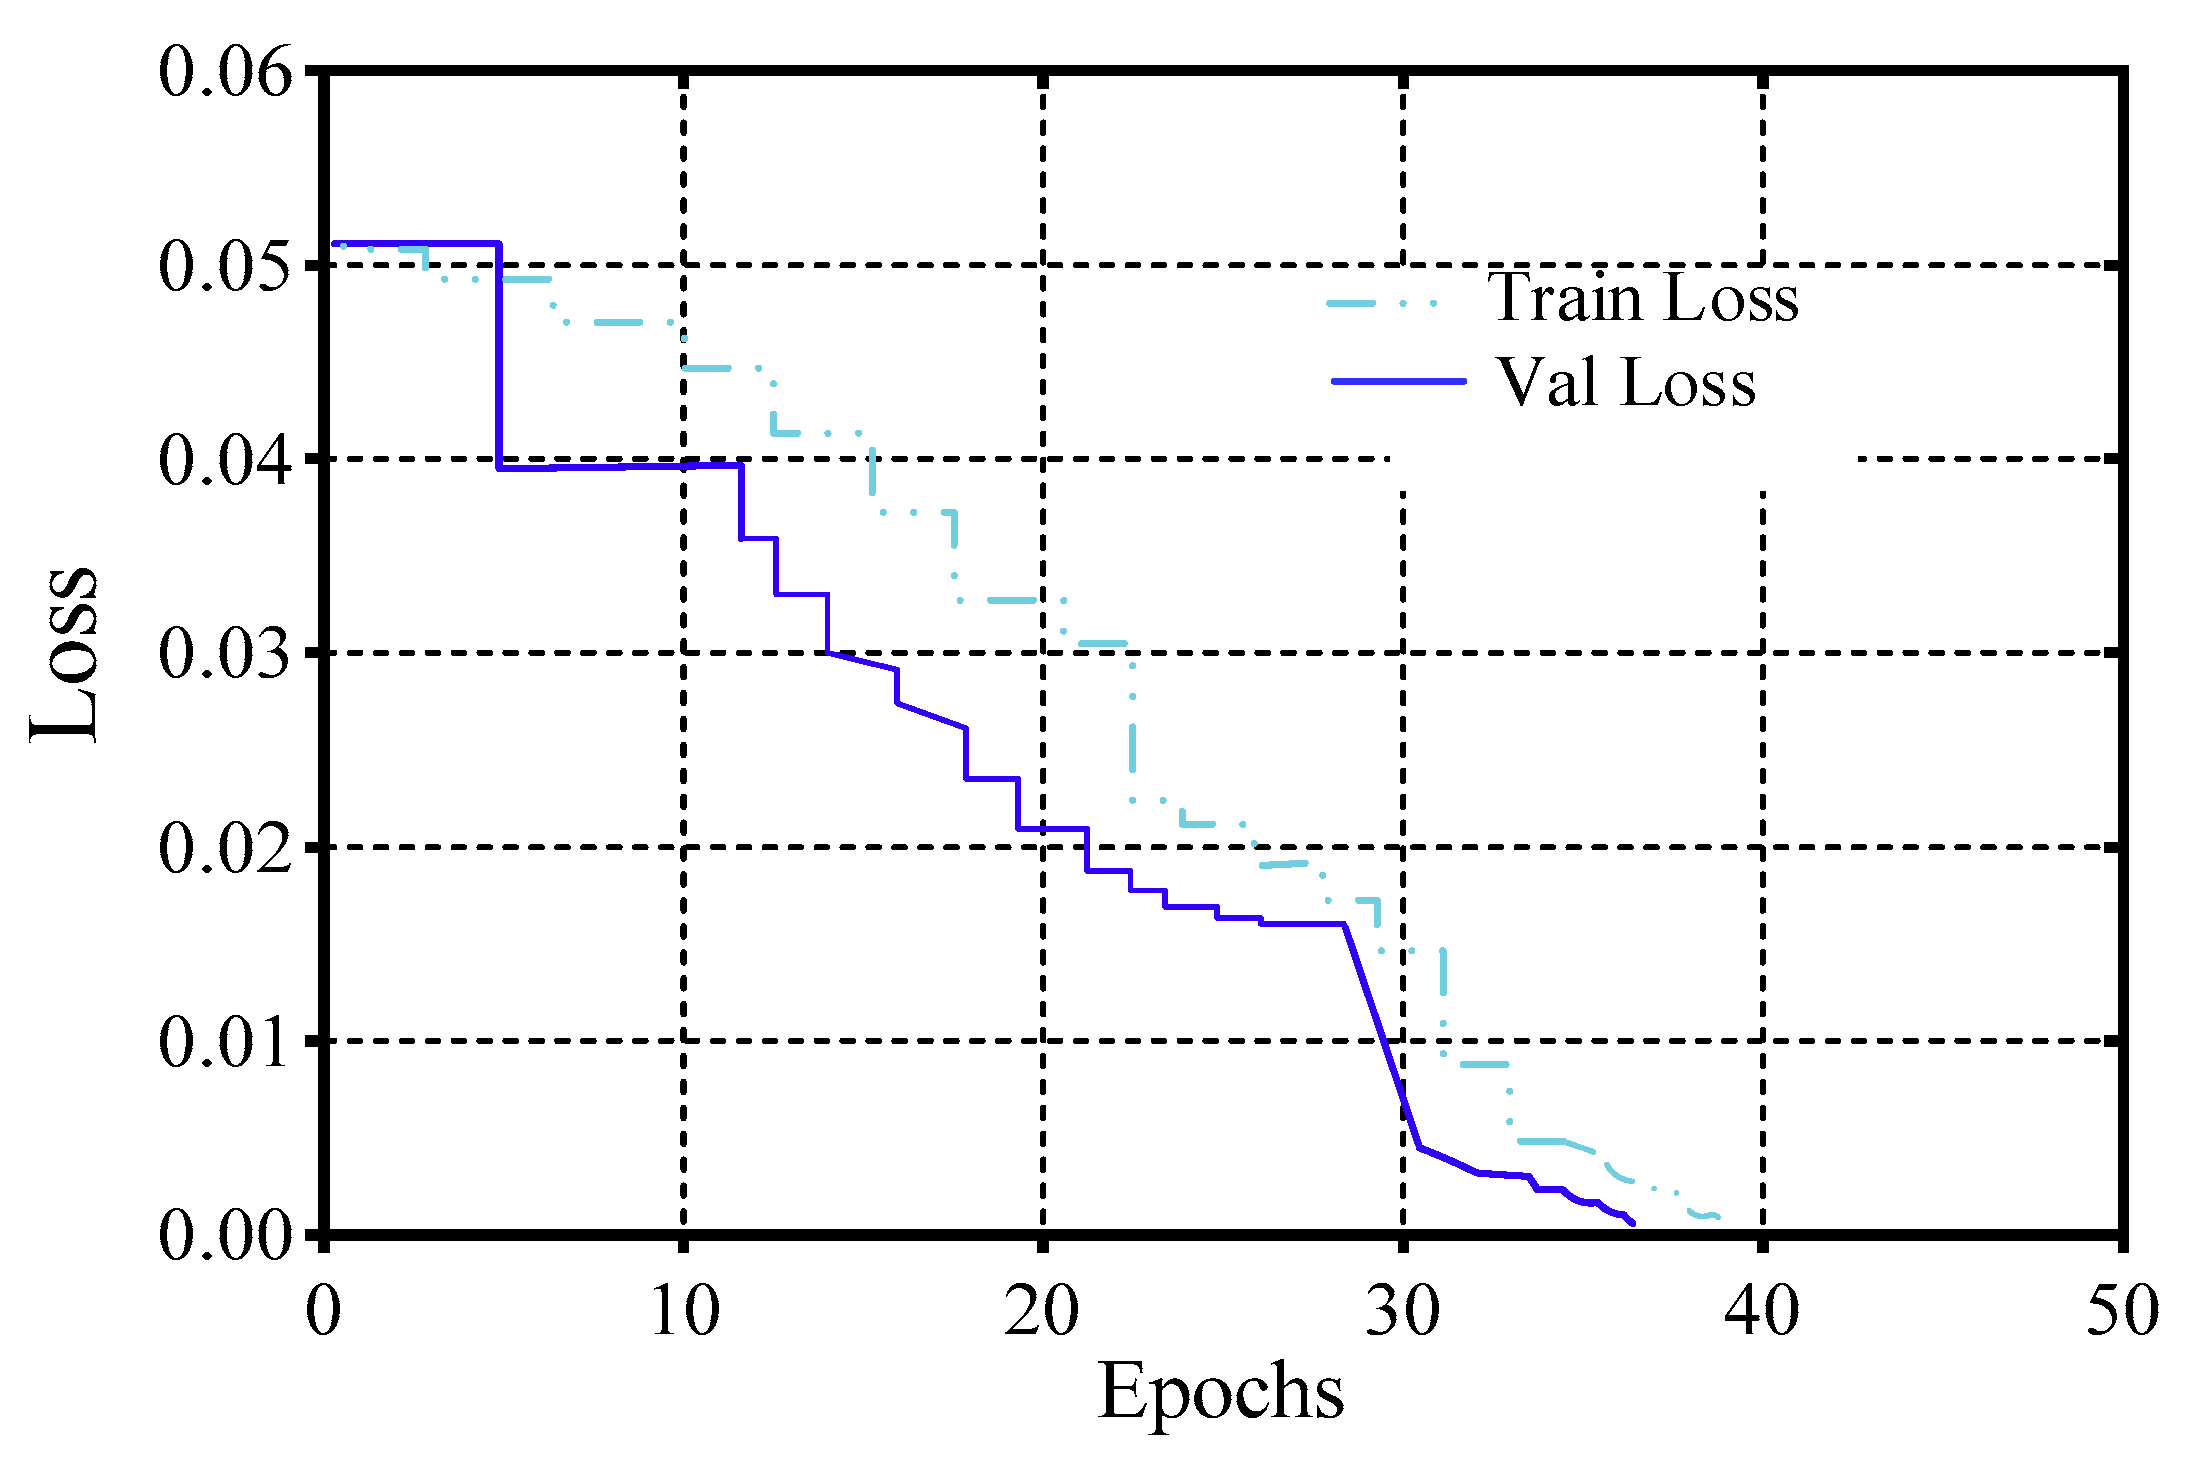
Figure 6 shows the change of the loss function with epoch value in the training and experiment of the LSTM model. The loss value declines with increasing training times on both the training and validation sets, as shown by the loss change curve in the figure, and its training value peaked at a loss value of 0.01 before levelling off. Although the value of loss slightly fluctuated, the network generally stabilized. The model must be determined after 30 iterations for the original determination.
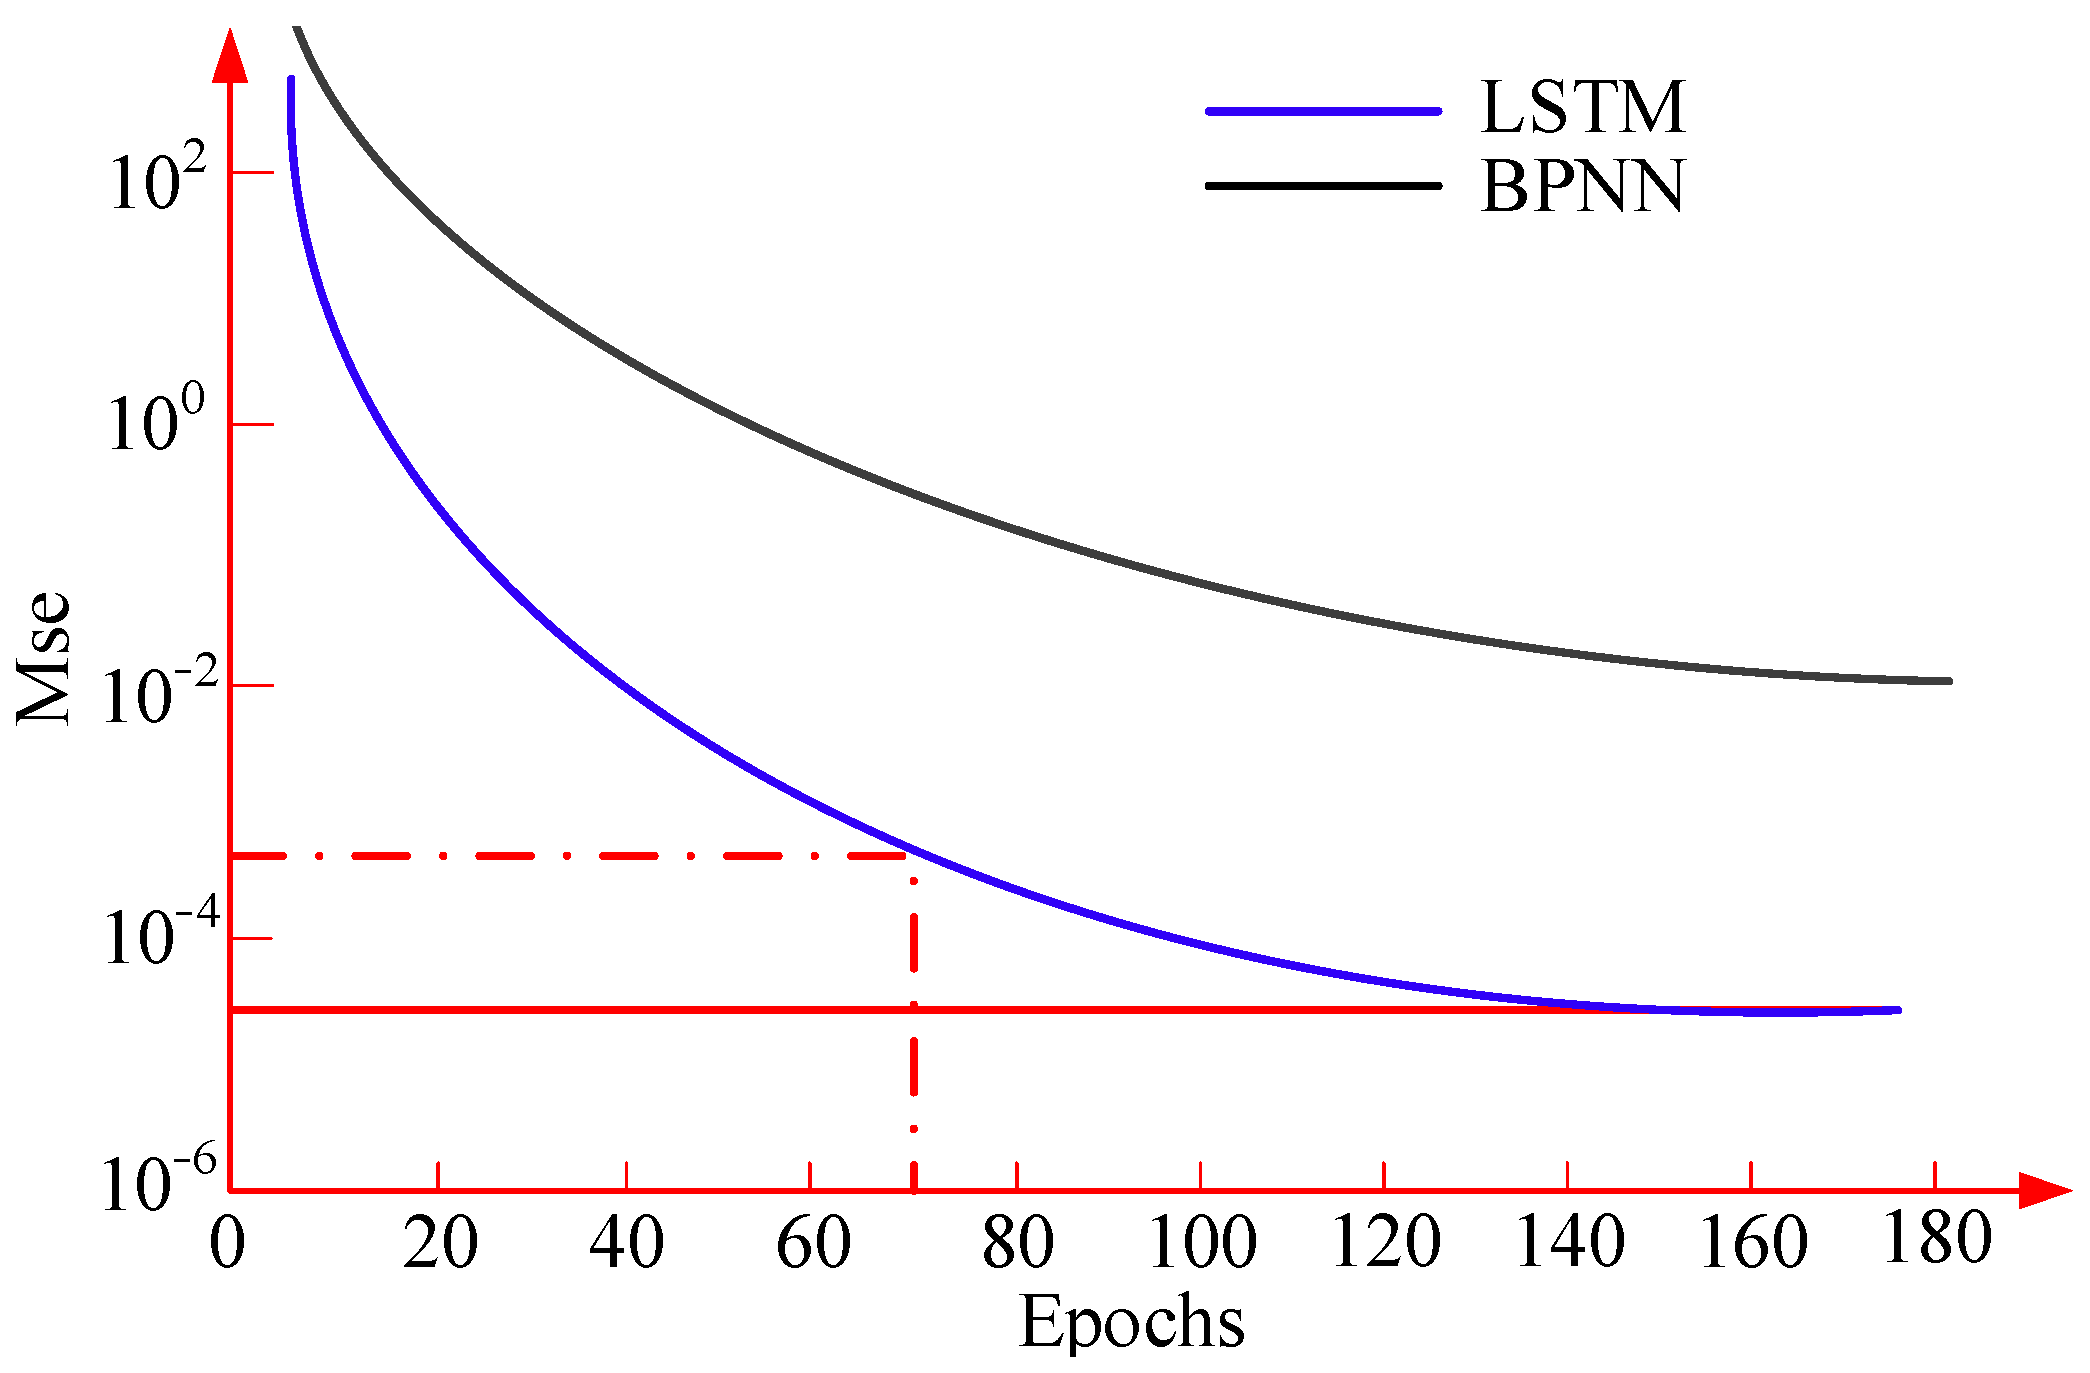
The LSTM network model’s training performance plot is shown in Figure 7. The MSE values for the test group are displayed in the figure. For the LSTM network, it can be seen that the MSE value was high at the start of the training phase and then declined as the number of training steps rose. The MSE value’s decline suggests that the error value was steadily going down. The training of the LSTM network model was stopped when the model achieved the best training performance after 112 training steps, and the MSE error was subsequently maintained at 10−5. After 180 iterations, the BPNN model’s MSE value was still outside this study’s established range, and its feasibility was very low. This indicated that the LSTM network model used in the research was very feasible and that the expected error value had been reached. Table 3 displays the RMSE and R2 of the model’s expected outcomes.
For the hazard identification and monitoring index (a11), Table 3 shows that the improved model PCA-LSTM proposed in this study had RMSE and R2 values of 13.56 and 0.9982, respectively, for the training set. The same was true for the test set, where the RMSE and R2 values were 13.18 and 0.9915, respectively, which showed a significant model effect, indicating that the proposed PCA-LSTM has a good prediction effect.
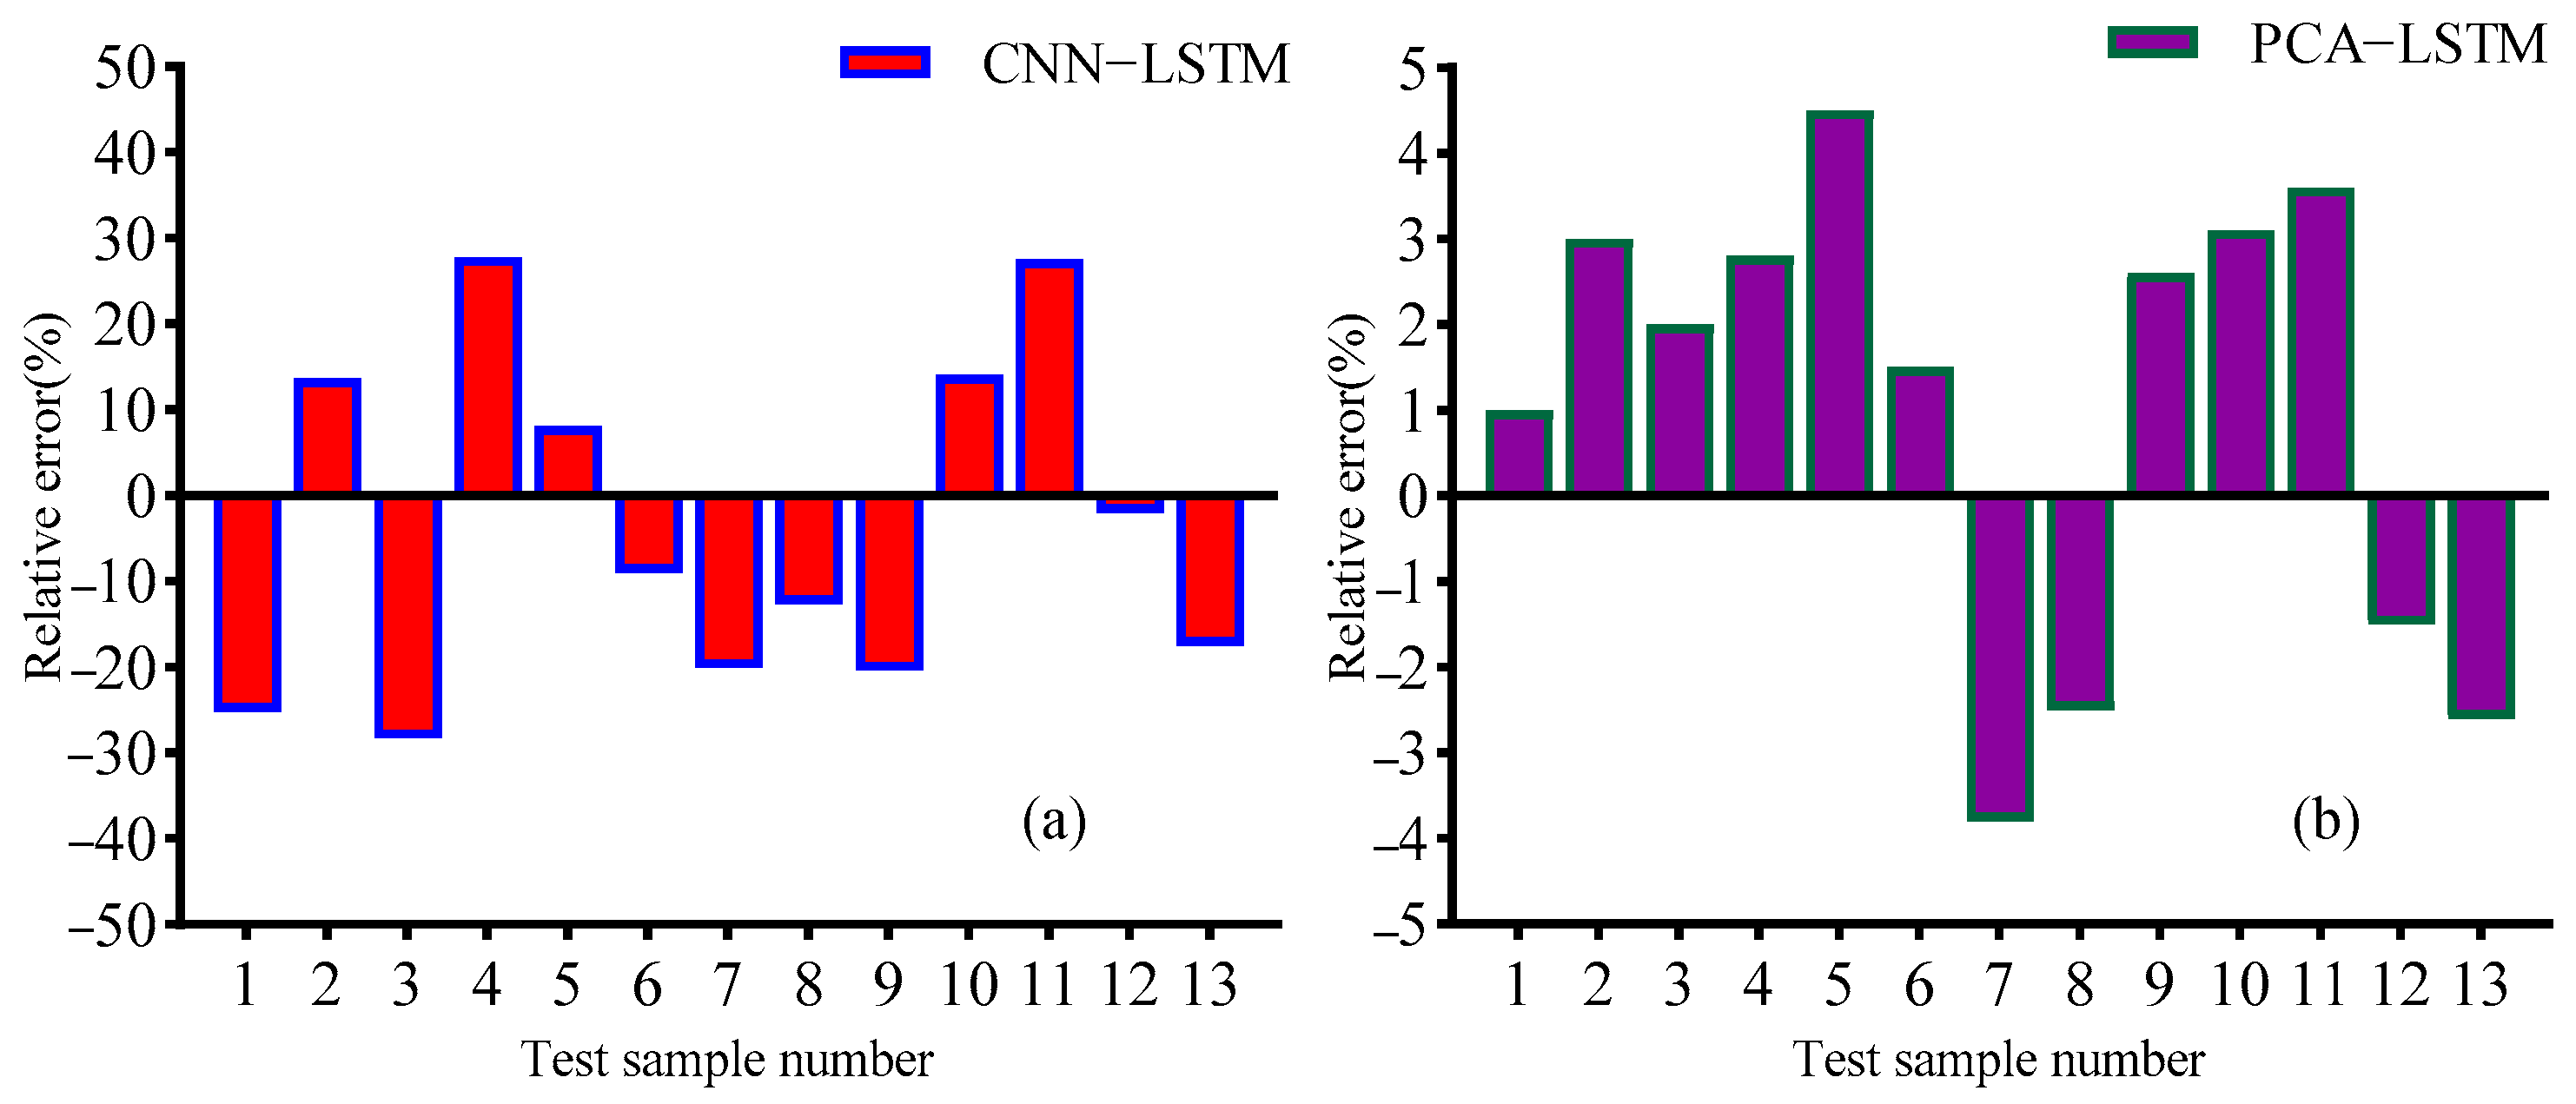
The absolute value of the relative errors of the PCA-LSTM model proposed in this study did not exceed the limit of 5% for each evaluation indicator of safety accident emergency management, as can be seen clearly from the relative error histogram in Figure 8b. Only the relative errors of the individual safety accident emergency management evaluation indexes, such as a15 and a21, had moderately significant issues. Its values were 4.5% and −3.8%, while the relative error of the remaining indicators was kept at a relatively low level, and its error was far smaller than that of the CNN-LSTM model. In summary, we can see that the algorithm model proposed in this study has better early-warning ability of safety accident emergency risk and can be applied to the real scenarios.
5. Conclusions
The emergency response plan for coal mine safety accidents is an essential road map for coal mine safety production, and its execution directly influences the emergency response time and processing effectiveness of the mine. From the viewpoint of coal mine safety accidents, this study examined the key variables influencing the effectiveness of mine safety production emergency plan development and created a corresponding conceptual model. The evaluation indexes of coal mine emergency management capability were first subjected to principal component analysis (PCA) to reduce their dimensionality. Next, correlation tests were run on the results, and finally, the filtered and reduced data were imported into the established long short-term memory (LSTM) model. This study’s findings indicated that after 30 trainings, the model’s loss value was 0.01, and the training value leveled off. When the number of training steps reached 112, the model achieved the best training performance and the LSTM network model was terminated. The MSE error was finally maintained at 10−5, which reached the expected error value, indicating that the feasibility of the set LSTM network model was extremely high. RMSE and R2 values reached 13.56 and 0.9982, and the absolute values of the relative errors of each safety accident emergency management evaluation index did not exceed the 5% threshold, indicating that the prediction effect of the model was satisfactory.
Although the final performance evaluation model in this paper that affects the creation of emergency plans for coal mine safety production accidents has a high goodness of fit, it should be noted that the function of the fit index is to examine the degree of the fit between the theoretical model and the data rather than become the only basis for judging whether the model is valid. The model with high goodness of fit can only be used as a reference, and the rationality of the model should be discussed in light of the issue under the investigation’s context. A model that can be explained by pertinent theories is more significant for research, even if the fitting index is not optimal.
Author Contributions
Conceptualization, J.L. and L.H.; methodology, T.Z.; software, T.Z.; formal analysis, T.Z.; investigation, T.Z.; resources, J.L. and L.H.; data curation, T.Z.; writing—original draft preparation, T.Z.; writing—review and editing, J.L. and L.H. All authors have read and agreed to the published version of the manuscript.
Funding
Heilongjiang Philosophy and Social Science Research Planning Project—Role Definition and Capacity Building of Urban Community Participation in Emergency Management of Major Emergencies in Heilongjiang Province (20GLE385).
Data Availability Statement
The data used to support the findings of this study are available from the corresponding author upon request.
Conflicts of Interest
The authors declare no conflict of interest.
References
- Shrestha, S.R.; Orchiston, C.H.R.; Elwood, K.J.; Johnston, D.M.; Becker, J.S.; Tomassi, I. Understanding the wider social and economic context of post-earthquake cordons: A comparative case study between Christchurch, Aotearoa (New Zealand) and L’Aquila, Italy. Earthq. Spectra 2022, 38, 2731–2753. [Google Scholar] [CrossRef]
- Kim, H.S.; Kim, G.S.; Lee, H.; Choi, J.; Kim, Y.S.; Oh, E.G. Effects of the discharge education program on family caregivers caring for patients on mechanical home ventilation in Korea: A pilot test. Home Health Care Manag. Pract. 2022, 34, 258–268. [Google Scholar] [CrossRef]
- Gewiess, J.; Luedi, M.M.; Schnüriger, B.; Tosounidis, T.H.; Keel, M.J.B.; Bastian, J.D. Effect of C-Clamp application on hemodynamic instability in polytrauma victims with pelvic fracture. Medicina 2022, 58, 1291. [Google Scholar] [CrossRef] [PubMed]
- Hu, Q.; Sadiq, A.; Kapucu, N. Multiplexity in conceptualizing network effectiveness in emergency management. J. Homel. Secur. Emerg. Manag. 2022, 19, 257–279. [Google Scholar] [CrossRef]
- Karimi, T.; Yahyazade, Y. Developing a risk assessment model for banking software development projects based on rough-grey set theory. Grey Syst. Theory Appl. 2022, 12, 574–594. [Google Scholar] [CrossRef]
- Nasrallah, I.M.; El Kak, A.K.; Ismaiil, L.A.; Nasr, R.R.; Bawab, W.T. Prevalence of accident occurrence among scientific laboratory workers of the public university in Lebanon and the impact of safety measures. Saf. Health Work 2022, 13, 155–162. [Google Scholar] [CrossRef] [PubMed]
- Fritz, J.; Vopham, T.; Wright, K.P.; Vetter, C. A Chronobiological Evaluation of the Acute Effects of Daylight Saving Time on Traffic Accident Risk. Curr. Biol. 2020, 30, 729–735. [Google Scholar] [CrossRef]
- Yang, L.; Birhane, G.E.; Zhu, J.Q.; Geng, J.C. Mining employees safety and the application of information technology in coal mining: Review. Front. Public Health 2021, 9, 709987. [Google Scholar] [CrossRef]
- Wang, L.K.; Wang, J.H.; Shi, M.Y.; Fu, S.S.; Zhu, M. Critical risk factors in ship fire accidents. Marit. Policy Manag. 2021, 48, 895–913. [Google Scholar] [CrossRef]
- Khajevandi, A.; Shafiei, Z.; Zamani, B.H.; Hanani, M.; Esmaeili, S. Assessing the safety status of Kashan University of Medical Sciences faculties by audit method in 2018. Int. Arch. Health Sci. 2021, 8, 165–169. [Google Scholar]
- Sun, K.; Li, Z. Quantitative risk analysis of life safety and financial loss for road accident of fuel cell vehicle. Int. J. Hydrog. Energy 2019, 44, 8791–8798. [Google Scholar] [CrossRef]
- Skalozubov, V.I.; Spinov, V.M.; Luzhanskaya, A.V.; Klimchuk, I.A.; Gablaya, T.V. Emergency management with complete loss of long-term power supply on nuclear power plants with steam drive pumps. J. Autom. Inf. Sci. 2021, 52, 51–59. [Google Scholar] [CrossRef]
- Lin, Y.M.; Chen, L. Emergency management for large scale construction projects based on interval valued intuitionistic fuzzy information. Int. J. Perform. Eng. 2020, 16, 1975–1984. [Google Scholar]
- Liu, Y.; Fan, Z.Q.; Qi, H.L. Dynamic statistical evaluation of safety emergency management in coal enterprises based on neural network algorithms. J. Intell. Fuzzy Syst. 2020, 39, 1–14. [Google Scholar] [CrossRef]
- Sameer, M.; Nikhitha, A.; Kalyan Kumar, D.; Sreenivasa Rao, C. IoT Based Coal Mine Tracking and Worker Safety Emergency Alert. Int. J. Res. Appl. Sci. Eng. Technol. 2022, 10, 3888–3893. [Google Scholar] [CrossRef]
- Bacanin, N.; Sarac, M.; Budimirovic, N.; Zivkovic, M.; AlZubi, A.A.; Bashir, A.K. Smart wireless health care system using graph lstm pollution prediction and dragonfly node localization. Sustain. Comput. Inform. Syst. 2022. prepublish. [Google Scholar] [CrossRef]
- Srinivasu, P.N.; SivaSai, J.G.; Ijaz, M.F.; Bhoi, A.K.; Kim, W.; Kang, J.J. Classification of skin disease using deep learning neural networks with MobileNet V2 and LSTM. Sensors 2021, 21, 2852. [Google Scholar] [CrossRef]
- Krishna, K.; Tanwir, M.U.H. Enhanced Prediction of intra-day stock market using metaheuristic optimization on RNN–LSTM network. New Gener. Comput. 2020. Prepublish. [Google Scholar]
- Araki, T. Regional characteristics of local disaster management plans in the northern osaka area, Osaka Prefecture. E-J. GEO 2019, 14, 105–115. [Google Scholar]
- Li, D.S.; Wang, R.J.; Chen, P.; Xie, C.J.; Zhou, Q.; Jia, X.F. Visual feature learning on video object and human action detection: A systematic review. Micromachines 2021, 13, 72. [Google Scholar] [CrossRef]
- Praveen, K.Y.; Suguna, R. Classification of image and text data using deep learning-based LSTM model. Traitement Du Signal 2021, 38, 1809–1817. [Google Scholar]
- Chen, L.; Zheng, M.Y.; Liu, Z.H.; Lv, M.Y.; Zhao, L.; Wang, Z.Y. SDAE+Bi-LSTM-Based situation awareness algorithm for the CAN bus of intelligent connected vehicles. Electronics 2021, 11, 110. [Google Scholar] [CrossRef]
- Kim, S. Automotive vulnerability analysis for deep learning blockchain consensus algorithm. Electronics 2021, 11, 119. [Google Scholar] [CrossRef]
Figure 1.
LSTM network internal structure diagram.

Figure 2.
LSTM network topologies for predicting trends in rolling bearing degradation.

Figure 3.
PCA-LSTM security incident emergency management determination flowchart.

Figure 4.
Principal component contribution rate and cumulative contribution rate.

Figure 5.
The color temperature chart of the analysis of each related factor of coal mine safety accident management crisis.
Figure 5.
The color temperature chart of the analysis of each related factor of coal mine safety accident management crisis.

Figure 6.
The loss function change curve of the LSTM model.

Figure 7.
Training performance curve of LSTM network.

Figure 8.
(a) The mean relative error of CNN-LSTM model; (b) The mean relative error of PCA-LSTM model.
Figure 8.
(a) The mean relative error of CNN-LSTM model; (b) The mean relative error of PCA-LSTM model.


Table 1.
Evaluation index system for coal mine emergency management capacity.
| First-Level Indicators | Secondary Indicators | Metric Meaning |
|---|---|---|
| Preventive preparedness (A1) | Hazard identification and monitoring (a11) | Accurately identify hazards and monitor them in real time |
| Security checks and early warnings (a12) | Regularly check for hidden dangers; The early warning system is sensitive and efficient | |
| Contingency plans and training (a13) | Science of emergency plans; Professional training before the post | |
| Emergency response agencies and equipment (a14) | Emergency sites, facilities and equipment are well prepared | |
| Material and technical support (a15) | Sufficient emergency supplies; Communication technology support | |
| Rescue teams and drills (a16) | Emergency rescue teams regularly conduct simulated exercises | |
| Environmental management capabilities (A2) | Macroenvironmental management (a21) | Formulate and implement enterprise safety rules and regulations |
| Microenvironmental management (a22) | Real-time monitoring of working system status | |
| Command rescue capabilities (A3) | Emergency response and initiation (a31) | Respond quickly and activate emergency plans |
| Information delivery and decision making (a32) | Unimpeded information transmission; Scientific analysis of decision making | |
| Emergency command and control (a33) | Command and dispatch and disaster mitigation control are comprehensive and reasonable | |
| Restore perfect capabilities (A4) | Loss assessment and settlement (a41) | Scientific assessment of losses; Apply for an insurance claim |
| Resumption of production and reconstruction (a42) | Restoration of production order and post-disaster reconstruction |
Table 2.
LSTM network training parameters.
| Network Parameters | LSTM Network | Network Parameters | LSTM Network |
|---|---|---|---|
| Enter the vector dimension | 1 | The number of network layers | 5 |
| The output vector dimension | 1 | Learning rate | 0.005 |
| The number of hidden neuron nodes | 200 | The maximum number of iterations | 200 |
Table 3.
RMSE and R2 for model on datasets.
| Datasets | Algorithm | Training | Testing | ||
|---|---|---|---|---|---|
| RMSE | R2 | RMSE | R2 | ||
| a11 | CNN-LSTM | 17.85 | 0.8545 | 17.11 | 0.8351 |
| PCA-LSTM | 13.56 | 0.9982 | 13.18 | 0.9915 | |
| a12 | CNN-LSTM | 18.49 | 0.8214 | 19.98 | 0.8211 |
| PCA-LSTM | 13.18 | 0.9451 | 13.09 | 0.9569 | |
| a13 | CNN-LSTM | 20.65 | 0.7534 | 18.89 | 0.7896 |
| PCA-LSTM | 13.45 | 0.9932 | 13.09 | 0.9973 | |
Disclaimer/Publisher’s Note: The statements, opinions and data contained in all publications are solely those of the individual author(s) and contributor(s) and not of MDPI and/or the editor(s). MDPI and/or the editor(s) disclaim responsibility for any injury to people or property resulting from any ideas, methods, instructions or products referred to in the content. |
© 2023 by the authors. Licensee MDPI, Basel, Switzerland. This article is an open access article distributed under the terms and conditions of the Creative Commons Attribution (CC BY) license (https://creativecommons.org/licenses/by/4.0/).
Share and Cite
MDPI and ACS Style
Zhang, T.; Liu, J.; Hong, L. Application of Multidimensional Structural Equations in the Emergency Management of Coal Mine Accidents. Processes 2023, 11, 882. https://doi.org/10.3390/pr11030882
AMA Style
Zhang T, Liu J, Hong L. Application of Multidimensional Structural Equations in the Emergency Management of Coal Mine Accidents. Processes. 2023; 11(3):882. https://doi.org/10.3390/pr11030882
Chicago/Turabian StyleZhang, Tianyue, Jiayu Liu, and Liang Hong. 2023. "Application of Multidimensional Structural Equations in the Emergency Management of Coal Mine Accidents" Processes 11, no. 3: 882. https://doi.org/10.3390/pr11030882
Note that from the first issue of 2016, this journal uses article numbers instead of page numbers. See further details here.