
The Influence of Agricultural Production Mechanization on Grain Production Capacity and Efficiency
College of Mechanical and Electrical Engineering, Fujian Agriculture and Forestry University, Fuzhou 350025, China
*
Author to whom correspondence should be addressed.
Processes 2023, 11(2), 487; https://doi.org/10.3390/pr11020487
Submission received: 21 November 2022
/
Revised: 18 January 2023
/
Accepted: 18 January 2023
/
Published: 6 February 2023
(This article belongs to the Special Issue Processes in Urban Farming and Food Security)
Abstract
:As an important production factor of grain production, agricultural machinery can effectively provide a theoretical basis for agricultural modernization development strategies by exploring its impact on grain production capacity and efficiency. This research starts from the two aspects of grain production capacity and grain production efficiency, takes rice, wheat, and corn as the research objects, and uses the C–D production function and Tobit model as the basis, respectively, to establish two impact models of production capacity and production efficiency. At the same time, according to the different emphases of the two models, this research designs different variable systems and finally uses the data from 2017 to 2021 for empirical analysis. The research results show that the influence coefficients of machinery service income and machinery power resource input on the total grain production capacity are 0.0976 and 0.0437, respectively, with a significant positive impact. At the same time, for rice crops, wheat crops, and corn crops, the amount of mechanization cost per mu has a significant positive impact on the yield capacity of crops, with impact coefficients of 0.0311, 0.0827, and 0.0233, respectively. The supply level of agricultural machinery services and the utilization rate of agricultural machinery services per mu have a significant positive impact on grain production efficiency. The impact coefficients of the supply level of agricultural machinery services per mu are 0.0192, 0.0587, and 0.0241, respectively. The impact coefficients of the agricultural machinery service utilization rate are 0.0059, 0.0148, and 0.0607, respectively, with a significant positive impact. It can be seen that agricultural production mechanization can effectively promote the improvement in grain production capacity and efficiency and promote the process of agricultural modernization. At present, most of the research on industrial mechanization services is biased toward the choice of agricultural mechanization services by farmers. However, this research has carried out the impact mechanism analysis from the perspective of time and space and the perspective of crops, rationalizing the impact mechanism of agricultural production capacity and agricultural production efficiency under agricultural mechanization.
1. Introduction
The issue of food has always been an important global issue, especially in the immediate international situation, which has emerged in a more acute form, such as the food issue in the local situation in Ukraine [1]. Due to missing the time window for grain planting and the difficulty in the normal implementation of the grain export agreement, Ukraine is likely to be absent from the position of the world’s food supplier in the near future, which will lead to the reduction in the world’s food supply [2].In this situation, although global dispatching can solve certain problems, countries should also use such methods as agricultural mechanization to deal with the food problem [3]. In China, with the acceleration of theurbanization process, a large number of rural labor forces have been transferred to cities [4]. The problems of rural hollowing and aging of the rural labor force are increasingly serious, and the pressure on the structural transformation process of the agricultural production industry is increasing [5]. In this environment where the demand for agricultural labor is high, but the supply is weakening, the unit labor cost of agricultural production will continue to rise, and the structural shortage contradiction will also bring greater production pressure [6]. The mechanized production mode with high efficiency but a low cost has become an effective way to solve this contradiction. Through effective policy support and market support, agricultural mechanization can solve the contradiction between small-scale operations and large-scale operations [7]. On the other hand, agricultural mechanization is also conducive to breaking the constraints of capital and technology on agricultural operators [8]. As an effective form of labor factor transformation, agricultural production mechanization can solve the structural problems faced by the agricultural production industry from two aspects [9]. The first is to transform the production factors of traditional agricultural production from human production to mechanical production through agricultural production mechanization and solve the problem of hollow agricultural production caused by labor transfer [10]. On the other hand, more new production technologies can be introduced into the agricultural production field through agricultural production mechanization to achieve modern agricultural production increase and improve production efficiency from a technical perspective [11]. By analyzing the impact of agricultural production mechanization on grain production capacity and grain production capacity efficiency in agricultural production, this study explored the form and way of action of agricultural production mechanization in promoting agricultural production development and provided theoretical support for the development strategy of agricultural modernization.
2. Related Works
At present, the research on agricultural mechanization production is gradually deepening. From the perspective of crops, many studies have analyzed the changes in crop yield under the modern agricultural environment and the role of agricultural mechanization in it [12]. Gandasari (2021) analyzed the characteristics of the crop state in the agricultural production process as a research dimension and designed an innovative two-wheeled walking tractor and a new water pump system. The research results show that the innovative agricultural production system designed in the study can effectively reduce production costs while increasing output, effectively reduce the operational difficulty of agricultural production personnel, and improve production efficiency [13].Wu et al. (2021) took the degree of agricultural machinery input and the degree of grain output as the main research elements and established threshold regression and spatial effect analysis models. The results showed that the degree of agricultural production mechanization had a more obvious spatial spillover effect on grain output. Strategically improving the level of agricultural mechanization could effectively improve regional grain output and provide the possibility for the cross-regional cooperative operation of agricultural machinery [14]. Hilal et al. (2020) proposed a genetic algorithm-based identification model for wheat yield and straw-related variables to predict the yield of wheat main products and related agricultural by-products. The research results show that under the prediction of the model, the importance of fertilizer variables in wheat farms is 0.431 for phosphorus fertilizer, 0.327 for seed fertilizer, and 0.273 for nitrogen fertilizer, respectively [15]. It can be seen that the model can help agricultural growers to select more appropriate agricultural planting variables so as to obtain better agricultural production effects, Rahman et al. (2020) conducted in-depth discussions on the development trend of agricultural production mechanization in Bangladesh. The results show that the subsidy policy for agricultural mechanization projects is conducive to the formation of a benign market cycle for agricultural machinery manufacturers and agricultural producers [16]. At the same time, strengthening the popularization of agricultural machinery operation methods and the intelligent connection of agricultural machinery networks can improve the agricultural production effect and promote the development of agricultural modernization.Shaqiri and Vasa (2020) focused on comparing the economic characteristics of EU countries and carried out a systematic analysis of the agricultural mechanization in Kosovo. The research results show that for regions like Kosovo, with high agricultural employment levels and insufficient overall agricultural mechanization levels, agricultural subsidies should be increased to promote the development of agricultural mechanization, actively carry out agricultural mechanization service activities, and set up a mechanization service network [17]. It can be seen from the above studies that most of the studies have linked agricultural mechanization with agricultural production effects [18]. At the level of detail, they have studied the individual design of agricultural machinery and the prediction application of computerization. At the macro level, the development trend of mechanization and the affected factors of regional crop yield were studied. The perspective used in this study is similar to the macro perspective, but the impact is refined for each crop, and the analysis is also carried out from the perspective of time and space.
On the other hand, research on agricultural production capacity is also being enriched. Most of these studies focused on the analysis of the factors affecting the agricultural production capacity of the investigation team [19]. Mwanguhya and Ekere (2021) collected samples from 220 interviewees using random sampling techniques and used the Tobit model to conduct regression analysis on farmers’ planting efficiency and economic characteristics. The research results show that the agricultural efficiency scores of cooperative farmers and non-cooperative farmers are significantly different, and the planting efficiency of farmers can be effectively improved by establishing a sound credit system and financial system [20]. Mile et al. (2021) explored Nigeria’s agricultural expenditure and corresponding agricultural output, mainly using descriptive analysis methods, vector error tests, and variance decomposition methods. The research results show that there is a two-way relationship between Nigeria’s agricultural expenditure and agricultural output during the forecast period. The establishment of a good agricultural credit system can promote the improvement in agricultural production efficiency and reduce farmers’ poverty [21]. Ogundele and Ogundele (2020) studied the relationship between Nigeria’s agricultural output and economic growth to determine the contribution of agricultural output to Nigeria’s economic growth. The study used cointegration and vector error correction models for causal analysis. The research results show that the economic impact of agricultural output on economic growth is long-term and positive. As one of the major industries, it has played a certain supporting role in Nigeria’s economic growth [22]. Mulu and Negessused (2020) the autoregressive distribution method to explore the impact of climate change on agricultural output and divided the impact into long-termand short-term impacts in the analysis process. The research results show that in the long run, the main climate-related variables have a significant impact on agricultural output, while in the short run, the impact of annual average rainfall is relatively significant, while the impact of average temperature is relatively insufficient [23]. It can be seen that the factors affecting agricultural production capacity include the agricultural financial system, climate factors, agricultural expenditure factors, planting efficiency factors, etc. [24]. At the present time of agricultural mechanization popularization, only analyzing a single factor is actually divorced from practical application. Therefore, this study combines different factors with agricultural mechanization and factors in the process of analyzing production capacity and production efficiency to form a comprehensive and practical analysis result.
To sum up, the current research on agricultural production capacity is mainly focused on specific agricultural production conditions in different regions, with more emphasis on the concept of specific regional analysis, while the research on agricultural mechanization focuses more on the new path of agricultural production brought about by technological development and policy support. This study also carries out the concept of the specific analysis of specific regions but divides the impact of agricultural mechanization on agricultural production into macro and micro perspectives for a more comprehensive analysis.
3. Model Design of the Impact of Agricultural Production Mechanization on Grain Production Capacity and Efficiency
3.1. Design of Production Capacity Model
When analyzing the impact of agricultural mechanization on grain production capacity and efficiency, the research mainly establishes models from the two perspectives of grain production capacity and production efficiency. At the same time, the macro panel data analysis and micro crop yield direction are used to analyze the model. On the one hand, this analysis method can more comprehensively analyze the force of agricultural mechanization. On the other hand, it can be analyzed from the perspective of main crop types, with a more comprehensive analysis and more emphasis on the impact path of mechanization. At the same time, the combination of the C–D production function and the Tobit model adopted in this study is more consistent with the research dimension and more feasible and scientific. In the context of agricultural mechanization, it is necessary to assume that agricultural producers are market-rational people and take the pursuit of agricultural production profits as the main goal [25]. This research also adopts this assumption, and the mechanized decision function of farmers is shown in Formula (1).
In Formula (1), is the expected profit increment of farmers, the expected income increment of farmers, the expected cost increase of farmers, the variables that affect farmers’ income, the variables that affect farmers’ costs, and the behavior of farmers choosing mechanized services. The production and management decision-making model of farmers under this assumption is shown in Formula (2).
In Formula (2), ,, and represent the farmers’ income from grain production and operation, other crops’ production and operation income, and total non-agricultural income, respectively, whereas represents the expenditure on purchasing mechanization services, and represents the level of mechanization services in the area where the farmers are located. can be calculated as follows:
In Formula (3), represents the labor force involved in grain production, is the grain planting area, and is the mechanization cost of grain production. can be calculated as follows:
In Formula (4), represents the labor force involved in non-food production, is the non-food planting area, and is the mechanization cost of non-food production. The decision-making model for farmers’ production goals isshown in Formula (5).
In Formula (5), represents the market grain price, and represents the grain output of a single household, which can be calculated as follows:
In Formula (6), can be calculated as follows:
In Formula (7), represents the grain planting area, and represents the labor input per mu. can be calculated as follows:
In Formula (8), represents the input of agricultural machinery per mu. can be calculated as follows:
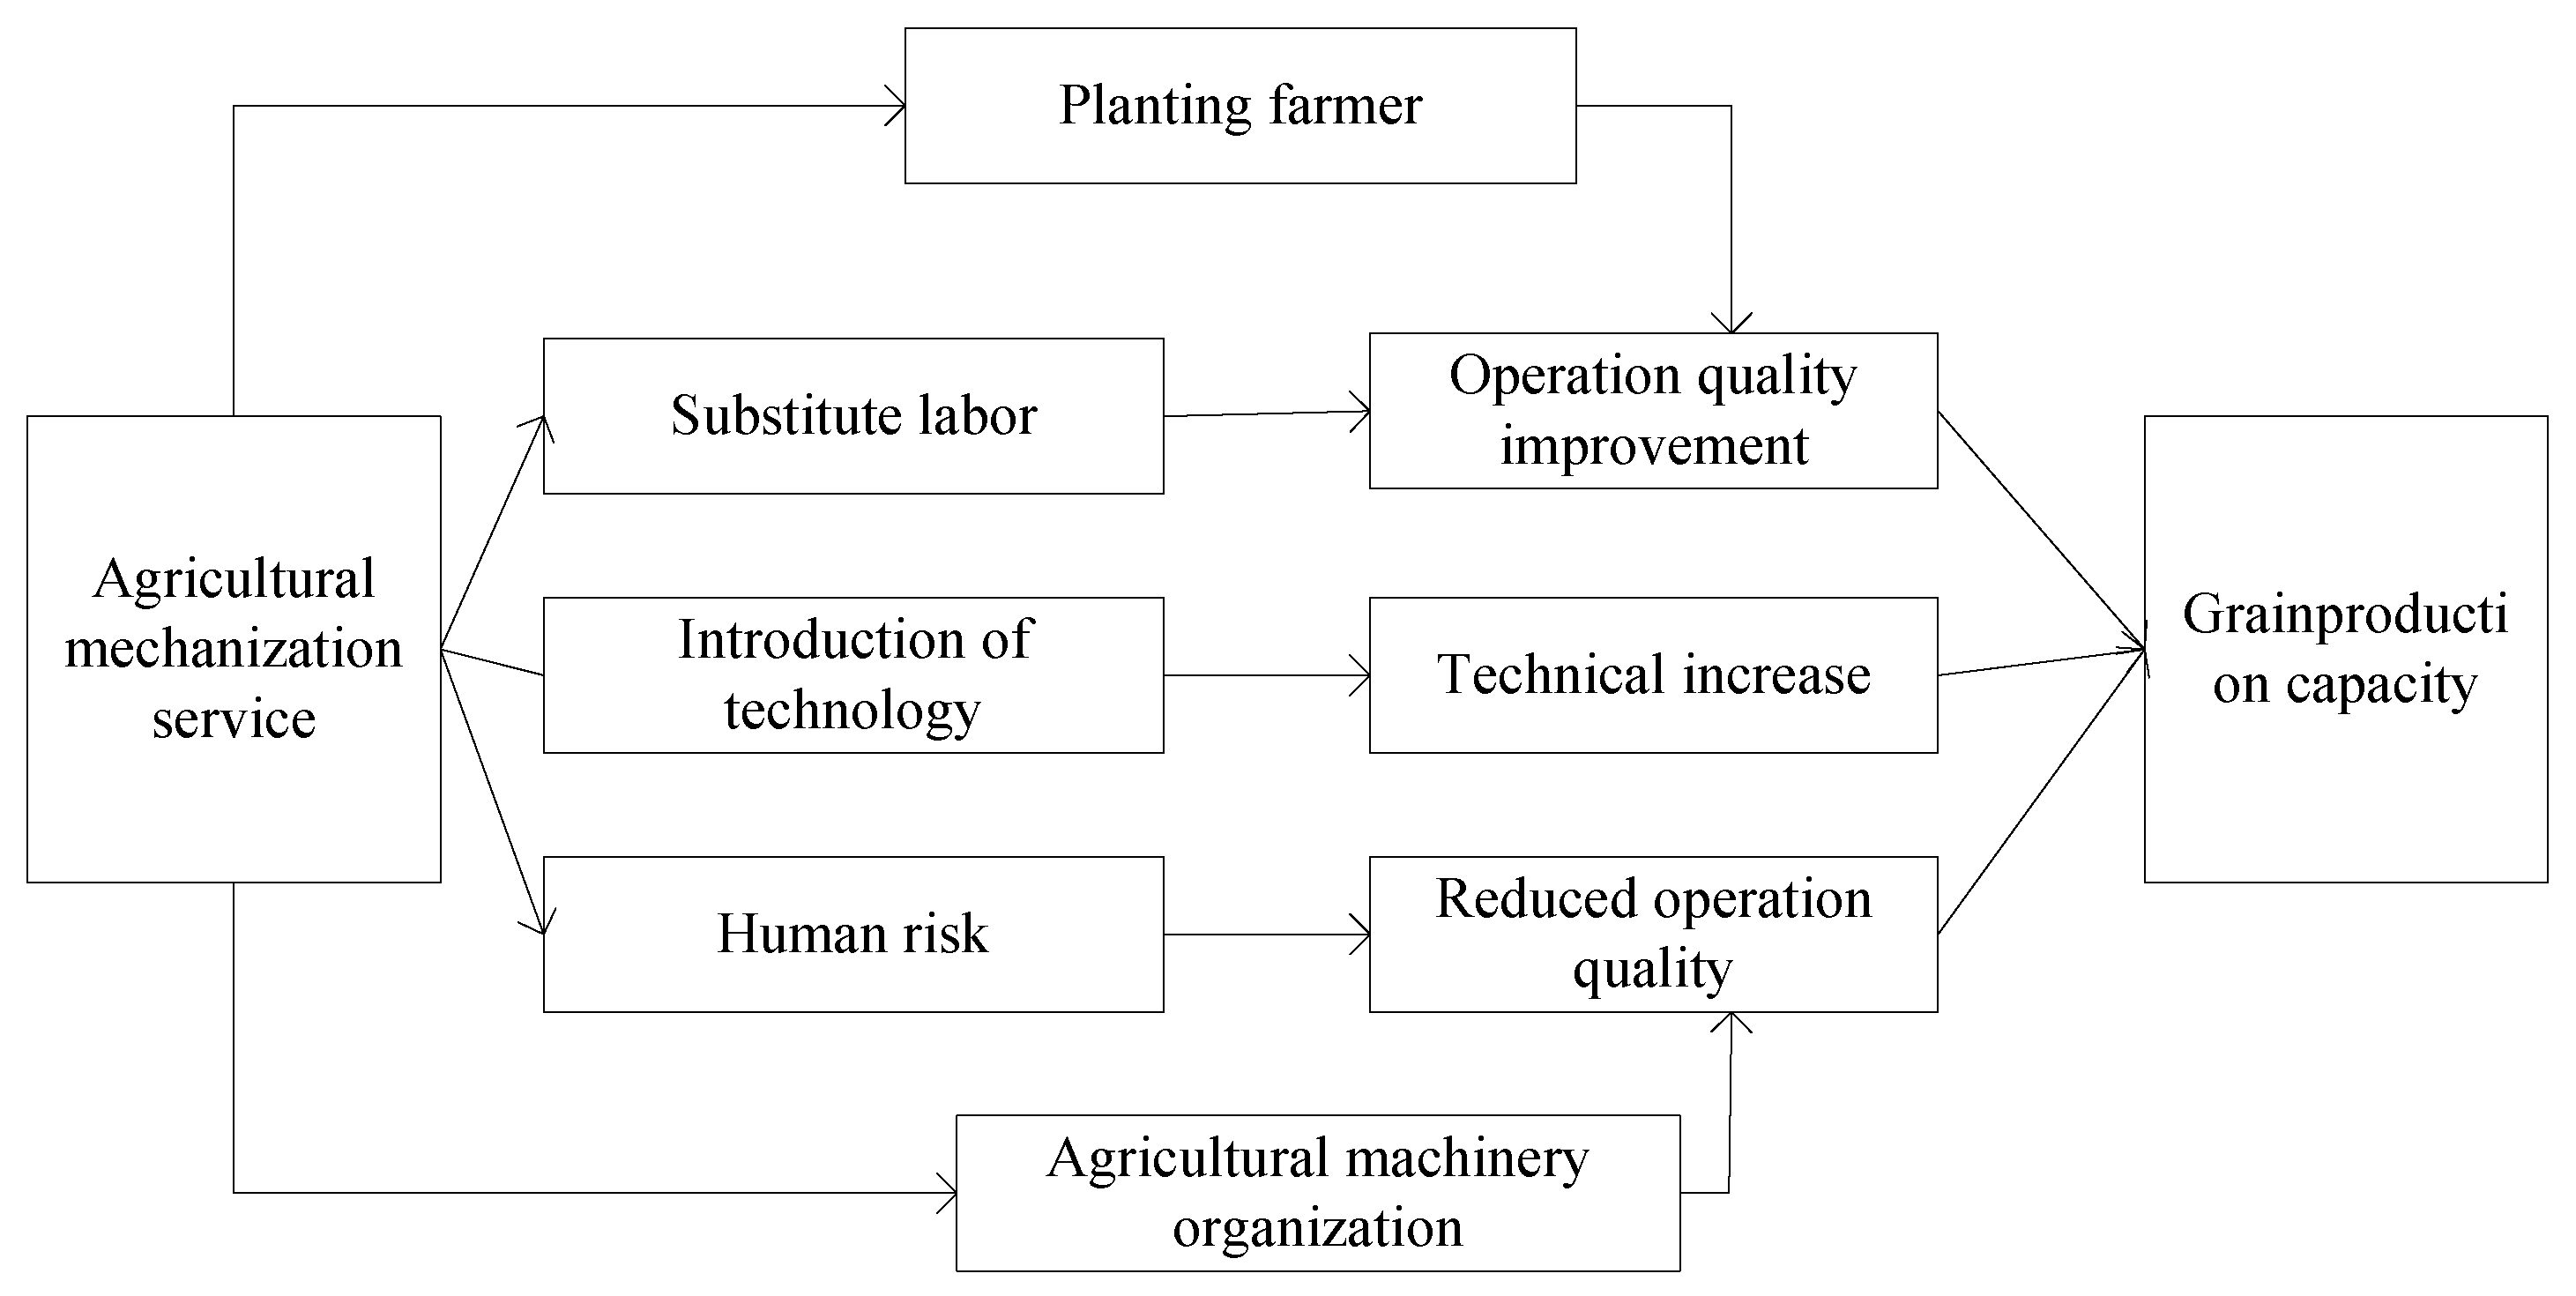
In Formula (9), represents the fertilizer input per mu. Under the combined effect of production decision-making and mechanization decision-making, the impact mechanism of agricultural mechanization services on grain production capacity is shown in Figure 1.
It can be seen from Figure 1 that agricultural mechanization services mainly affect food production capacity from three perspectives: replacing traditional labor, introducing new agricultural technologies, and generating human risks of mechanized technology [26]. In an ideal state, the first two factors will promote the improvement in the quality of agricultural production operations and achieve mechanized yield increases through technological development, while human risk may reduce the quality of operations [27]. When constructing the production capacity model, the research is constructed from the perspectives of the provincial panel and crop yield capacity. The provincial panel model is mainly designed based on the perspective of the C–D production function, as shown in Formula (10).
In Formula (10), , , , and , represent the total grain production capacity, the input of mechanical power resources, the input of labor, the input of land, the input of chemical fertilizer, and the degree of damage to crops, respectively, while the values representthe parameters to be estimated, and represents the interference items. The specific variables are shown in Table 1.
The model based on crop yield capacity is also based on the C–D production function model, as shown in Formula (11).
In Formula (11), , , ,, and represent the output capacity per mu, the amount of mechanization cost, the amount of labor input, the amount of fertilizer input, and other costs, respectively. Here, indicates the area, is the time, and is the interference item. The specific variables are shown in Table 2.
3.2. Design of Production Efficiency Model
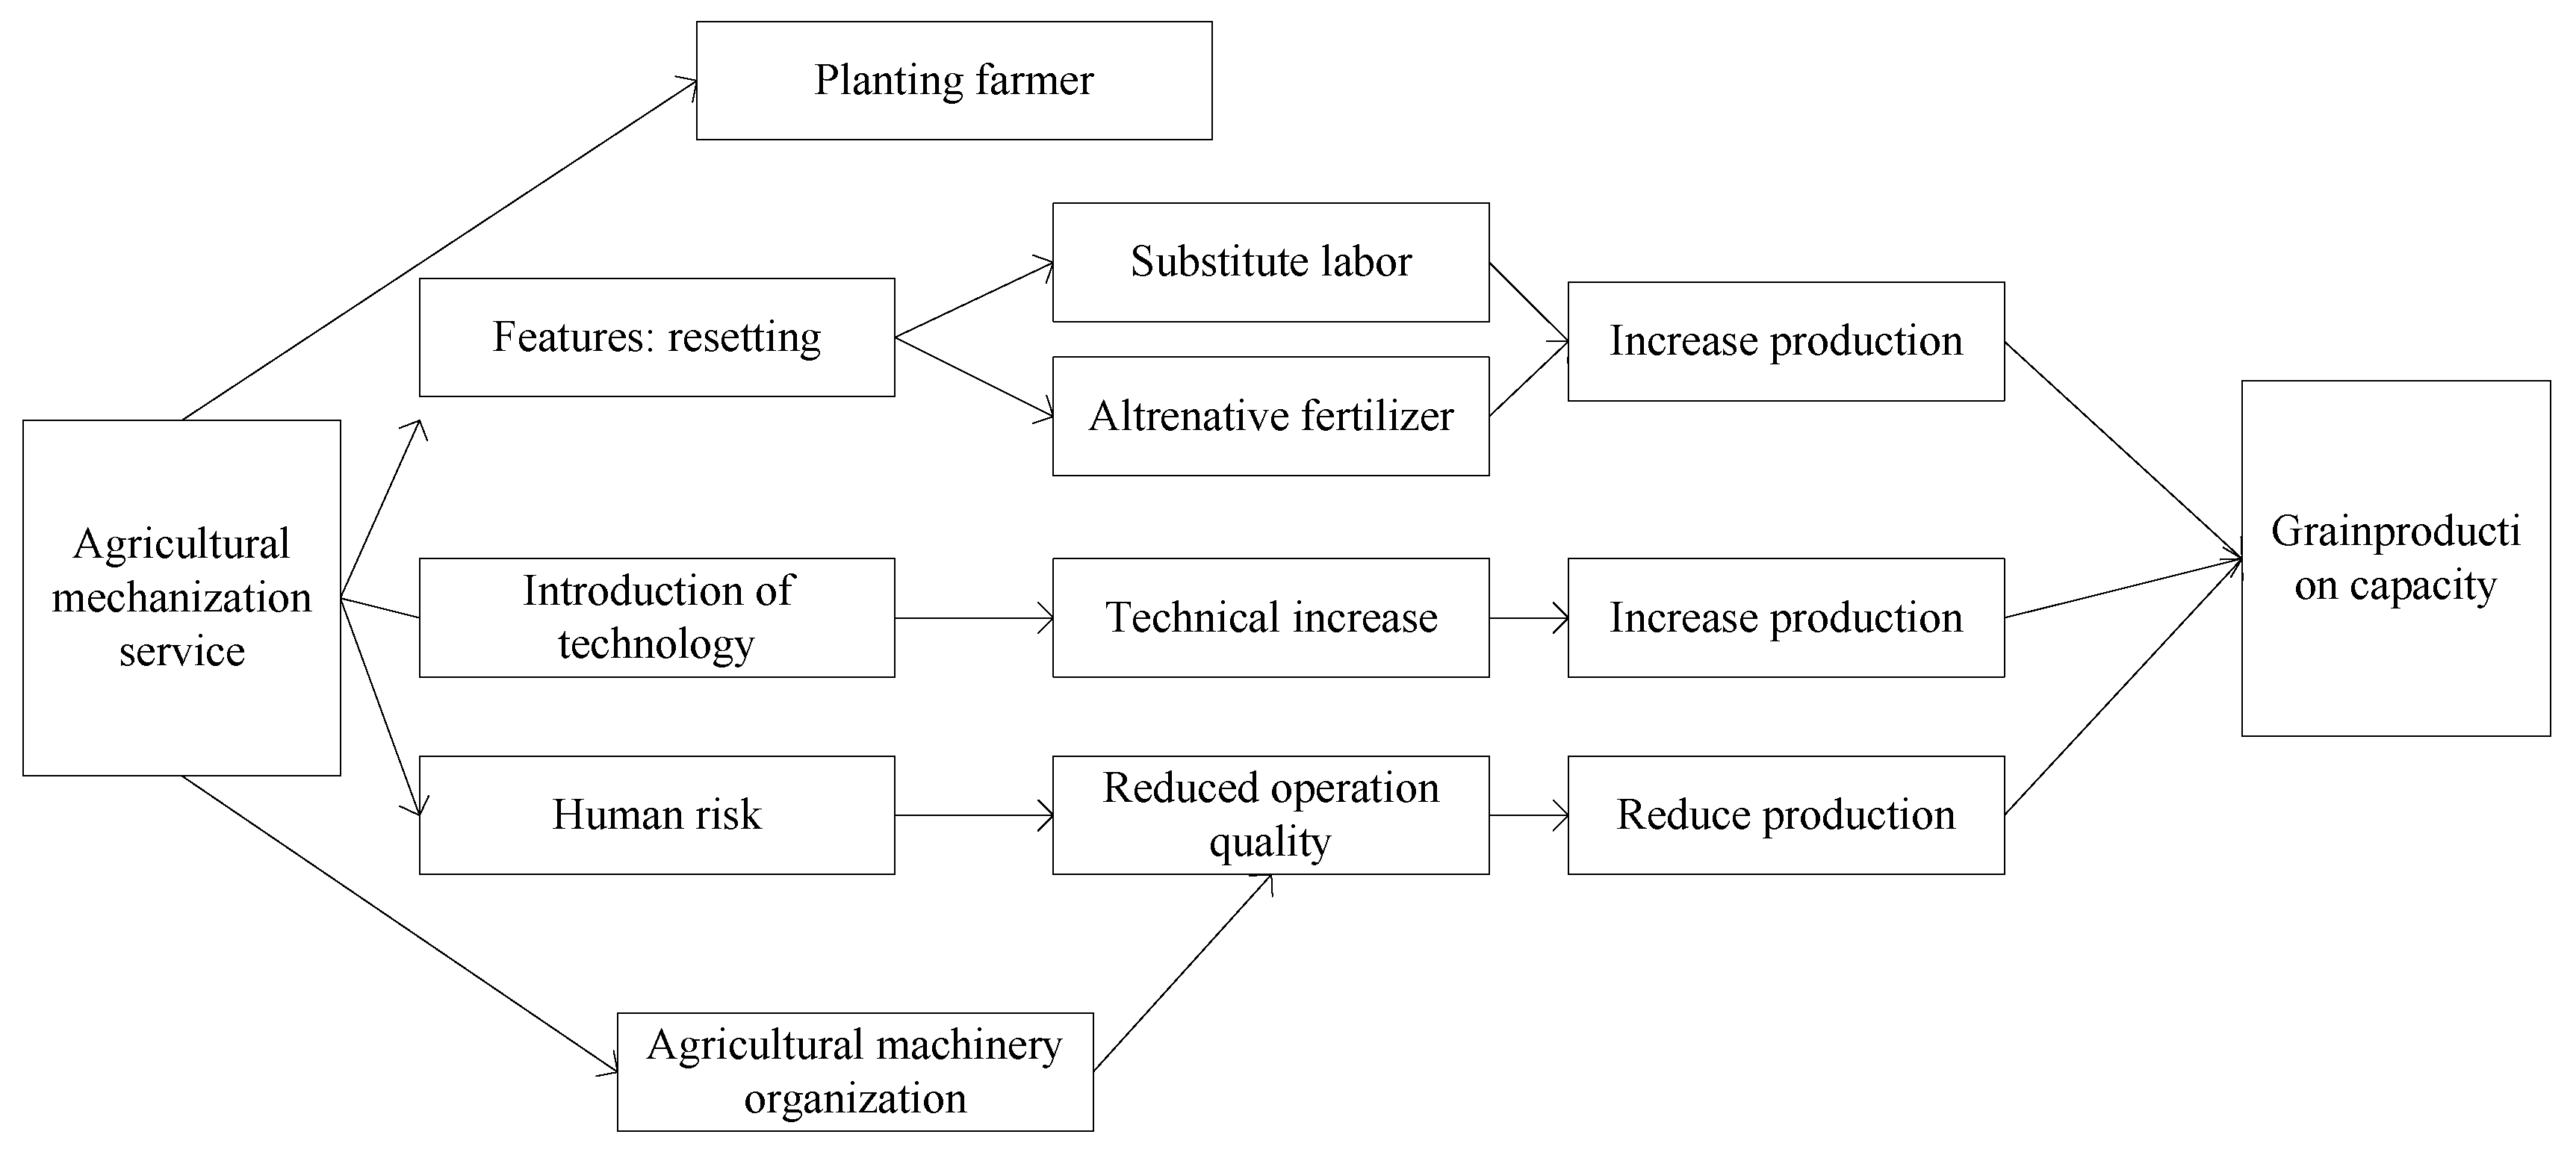
Food production efficiency refers to the degree of matching between the input of food production factors and the resulting food output [28]. The effect of socialized agricultural mechanization services on grain production efficiency is mainly reflected in two aspects, one is the reset of labor factors, and the other is the introduction of modern technology [29], as shown in Figure 2.
The research is mainly based on the Tobit model, and the model is constructed from the perspective of crop yield capacity. The crops are divided into three types: rice, wheat, and corn. For each crop type, separate indicators and models are established. The rice individual model is shown in Formula (12).
In Formula (12), , , , , , and represent rice production efficiency, mechanized water products, farmers’ education level, rice planting scale, rice disaster status, and rice irrigation status, respectively. is calculated as follows:
In Formula (13), represents the sample group aged six years and above, represents the number of groups with primary school education, represents the number of groups with junior high school education, represents the number of groups with high school education, and represents the number of groups withcollege education and above, respectively. The rice stand-alone model isshown in Formula (14).
In Formula (14), represents the wheat planting scale. The separate model for the corn class isshown in Formula (15).
In Formula (15), represents the wheat planting scale. The specific variables are shown in Table 3.
4. Analysis of the Impact of Agricultural Production Mechanization on Grain Production Capacity and Efficiency
4.1. Analysis of the Impact of Agricultural Production Mechanization on Grain Production Capacity
When analyzing the impact of agricultural production mechanization on grain production capacity, the research will analyze from the perspectives of provincial panel data and crop yield capacity. The panel data is analyzed, and the basic data comes from the “China Statistical Yearbook”. The specific results are shown in Table 4.
From Table 4, it can be seen that the fixed effects equation results are better. From the fixed effect equation, the influence coefficient of the input of mechanical power resources on the total grain production capacity is 0.0976, which is significant at the 1% level. The influence coefficient of machinery service income on the total grain production capacity is 0.0437, which is significant at the 5% level. This shows that the input of mechanical power resources has a significant positive impact on the total grain production capacity, and the income from mechanical services has a significant effect on the total grain production capacity. In the part of crop yield data analysis, this study also selected 2017 to 2021 as the research period, and the basic data came from the “National Agricultural Product Cost and Benefit Data Compilation”. The specific results are shown in Table 5.
In Table 5, the Hausman test of the fixed effect is more significant, and the result is better. In terms of rice crops, the influence coefficient of the cost per mu of mechanization on the yield capacity of rice crops is 0.0311, and 1% water is significant; in terms of wheat crops, the influence coefficient of the cost per mu of mechanization on the yield capacity of rice crops is 0.0827, and 1% water quality is significant; for maize crops, the influence coefficient of the mechanization cost per mu on the yield capacity of rice crops is 0.0233, and 5 % water quality is significant. It can be seen that the amount of mechanization cost per mu has a significant positive impact on the yield per unit of the three crops.
4.2. Analysis of the Impact of Agricultural Production Mechanization on Grain Production Capacity
In the analysis of the impact of agricultural production mechanization on grain production capacity, the research is mainly analyzed from the perspective of crop yield capacity. The rice crop results areshown in Table 6.
In Table 6, the influence coefficient of agricultural machinery service supply level per mu on the production efficiency of rice crops is 0.0192, which is significant at the 1% level. The influence coefficient of agricultural machinery service utilization rate on rice crop production efficiency is 0.0059, which is significant at the 1% level. It can be seen that both the supply level of agricultural machinery services per mu and the utilization rate of agricultural machinery services have a significant positive impact on the production efficiency of rice crops. The wheat crop results are shown in Table 7.
In Table 7, the influence coefficient of agricultural machinery service supply level per mu on the production efficiency of wheat crops is 0.0587, which is significant at the 1% level. The influence coefficient of agricultural machinery service utilization rate on the production efficiency of rice and wheat crops is 0.0148, which is significant at the 5% level. It can be seen that the supply level of agricultural machinery services per mu and the utilization rate of agricultural machinery services have a significant positive impact on the production efficiency of wheat crops. The corn crop results are shown in Table 8.
In Table 8, the influence coefficient of agricultural machinery service supply level per mu on the production efficiency of maize crops is 0.0241, which is significant at the 1% level. The influence coefficient of agricultural machinery service utilization rate on the production efficiency of rice and corn crops is 0.0607, which is significant at the 1% level. It can be seen that the supply level of agricultural machinery services per mu and the utilization rate of agricultural machinery services have a significant positive impact on the production efficiency of corn crops. To sum up, for the three crops of rice, wheat, and corn, the level of agricultural machinery service supply per mu and the utilization rate of agricultural machinery services can significantly affect crop production efficiency, forming a positive driving effect. Although the research has carried out a more detailed analysis of the food production capacity and efficiency path of agricultural mechanization, agricultural mechanization is not the only factor affecting the food production capacity and efficiency, and the research lacks a more comprehensive analysis, which is also one of the future research directions.
5. Conclusions
In order to explore the influence of agricultural production mechanization on grain production capacity and efficiency, this research takes the C–D production function as the theoretical basis to establish the influence model of grain production capacity, and based on the Tobit model, establishes the influence model of grain efficiency capacity. This research uses provincial panel data and national agricultural product cost-benefit data from 2017 to 2021 as the data basis for empirical analysis. The research results show that in terms of grain production capacity, the amount of mechanical service income and the input of mechanical power resources have a significant positive impact on the total grain production capacity. The influence coefficients of the cost on the crop yield capacity are 0.0311, 0.0827, and 0.0233, respectively, and the positive effect is significant. In terms of the grain production efficiency for rice crops, wheat crops, and corn crops, the influence coefficients of agricultural machinery service supply level per mu are 0.0192, 0.0587, and 0.0241, respectively; the influence coefficients of agricultural machinery service utilization rate are 0.0059, 0.0148, and 0.0607, respectively, and the positive effect is significant. It can be seen that the mechanization of industrial production can simultaneously improve grain production capacity and efficiency and provide a material basis and technical support for the development of agricultural modernization.
Author Contributions
In this paper, X.L. (Xiangjuan Liu) put forward the research experiment: the research starts from the two aspects of grain production capacity and grain production efficiency, using the C–D production function and the Tobit model as the basis, respectively, to establish two impact models, and uses the data from 2017 to 2021 for empirical analysis. X.L. (Xibing Li) analyzed the data and helped with the constructive discussion. X.L. (Xiangjuan Liu) and X.L. (Xibing Li) made great contributions to manuscript preparation. All authors have read and agreed to the published version of the manuscript.
Funding
The research is supported by: General project of basic scientific research Funds for provincial universities in Heilongjiang Province, Study on Crop Yield Change by Intelligent Analysis of Agricultural Climate Data, (NO., 145109142); Open project of Heilongjiang Agricultural Multidimensional Sensor Information Perception Engineering Technology Research Center, Analysis and research on field microclimate based on multidimensional intelligent sensing information cognition, (NO., DWCGQKF202101); Science and Technology Innovation Fund project of Fujian Agriculture and Forestry University, Study on optimization and strategy of Crop planting structure in Fujian province based on data fusion, (NO., CXZX2020132B).
Institutional Review Board Statement
This article does not contain any studies with human participants performed by any of the authors.
Informed Consent Statement
Not applicable.
Data Availability Statement
The datasets used and/or analyzed during the current study are available from the corresponding author upon reasonable request.
Conflicts of Interest
The authors declare no conflict of interest.
References
- Clapp, J.; Moseley, W.G. This food crisis is different: COVID-19 and the fragility of the neoliberal food security order. J. Peasant Stud. 2020, 47, 1393–1417. [Google Scholar] [CrossRef]
- Panukhnyk, O.; Popadynets, N.; Fedotova, Y. Analysis and modeling of factor determinants of food provision at consumer market of Ukraine. Global J. Environ. Sci. Manag. 2019, 5, 215–226. [Google Scholar]
- Irtyshcheva, I.; Ponomarova, M.; Dolzhykova, I. Conceptual fundamentals of development of the food security system. Balt. J. Econ. Stud. 2019, 5, 57–64. [Google Scholar] [CrossRef]
- Wang, P.; Chen, H.; Kopittke, P.M.; Zhao, F.J. Cadmium contamination in agricultural soils of China and the impact on food safety. Environ. Pollut. 2019, 249, 1038–1048. [Google Scholar] [CrossRef] [PubMed]
- Fedorova, M. Seeds as technology: The Russian agricultural bureau in New York and soviet agricultural modernization, 1921–1926. Russ. Rev. 2021, 80, 209–228. [Google Scholar] [CrossRef]
- Teodorescu, F.R.; Mrcu, L.; Coman, C.; Tudor, V.C. Analysis of the agricultural labor force and its impact on agricultural products obtained in the South-Muntenia region. Rom. Biotechnol. Lett. 2021, 26, 2640–2649. [Google Scholar] [CrossRef]
- Liu, J.C.; Xu, Z.G.; Zheng, Q.F.; Hua, L.L. Is the feminization of labor harmful to agricultural production? The decision-making and production control perspective. J. Int. Agric. 2019, 18, 220–229. [Google Scholar] [CrossRef]
- Weber, T.L.; Romero, C.M.; MacKenzie, M.D. Biochar—Manure changes soil carbon mineralization in a Gray Luvisol used for agricultural production. Can. J. Soil Sci. 2021, 102, 225–229. [Google Scholar] [CrossRef]
- Periyasamy, P. Estimation of economic loss of agricultural production and livestock population in Tamil Nadu due to sago industrial pollution: A case study. Grassroots J. Nat. Resou. 2021, 4, 165–178. [Google Scholar] [CrossRef]
- Alsaour, L. Monetary policy and its impact on agricultural output for the period (1990–2017) republic of Iraq and Egypt as a model. Tanmiyat Al-Rafidain. 2020, 39, 24–48. [Google Scholar] [CrossRef]
- Askerov, M. New materials for the production of replaceable parts of tillage agricultural machinery. Bull. Tech. Univ. KhPI Series N Solut. Mod. Technol. 2021, 2, 3–8. [Google Scholar]
- Jaleta, M.; Baudron, F.; Krivokapic-Skoko, B.; Erenstein, O. Agricultural mechanization and reduced tillage: Antagonism or synergy? Int. J. Agric. Sustain. 2019, 17, 219–230. [Google Scholar] [CrossRef]
- Gandasari, D. Analysis of Innovation attributes in the innovation adoption of agricultural mechanization technology in farmers. J. Komun. Pembang. 2021, 19, 38–51. [Google Scholar] [CrossRef]
- Wu, Z.; Dang, J.; Pang, Y.; Xu, W. Threshold effect or spatial spillover? The impact of agricultural mechanization on grain production. J. Appl. Econ. 2021, 24, 478–503. [Google Scholar] [CrossRef]
- Hilal, Y.Y.; Rajab, R.H.; Seddiq, A. Plural genetic algorithms approach to control agricultural mechanization and wheat production. J. Mech. Eng. Res. Develop. 2020, 43, 373–383. [Google Scholar]
- Rahman, A.; Ali, M.R.; Kabir, M.S.N.; Rahman, M.M.; Hossen, M.A. Agricultural mechanization in Bangladesh: Status and challenges towards achieving the sustainable development goals (SDGs). AmaAgric. Mech. Asia Afr. Lat. Amer. 2020, 51, 106–120. [Google Scholar]
- Shaqiri, F.; Vasa, L. Efficiency and sustainability questions of the agricultural production in Kosovo. Visegr. J. Bioeconomy Sustain. Develop. 2020, 9, 1–8. [Google Scholar] [CrossRef]
- Li, W.; Zhang, P. Relationship and integrated development of low-carbon economy, food safety, and agricultural mechanization. Environ. Sci. Pollut. Res. 2021, 28, 68679–68689. [Google Scholar] [CrossRef] [PubMed]
- Sammauria, R.; Kumawat, S.; Kumawat, P.; Singh, J.; Jatwa, T.K. Microbial inoculants: Potential tool for sustainability of agricultural production systems. Arch. Microbiol. 2020, 202, 677–693. [Google Scholar] [CrossRef]
- Mwanguhya, J.; Ekere, W. A stochastic production frontier approach: Determinants of technical efficiency in small scale tea farmers. J. Appl. Agr. Econ. Policy Anal. 2021, 4, 47–53. [Google Scholar]
- Mile, B.N.; Ijirshar, V.U.; Asom, S.T.; Sokpo, J.T.; Fefa, J. Empirical analysis of government agricultural spending and agricultural output in Nigeria. Asian J. Econ. Bus. Account. 2021, 21, 7–23. [Google Scholar] [CrossRef]
- Ogundele, T.; Ogundele, B. Agricultural output and economics growth in Nigeria Afolabi OgundeleIbukun. J. Agr. Econ. 2020, 3, 184–189. [Google Scholar]
- Mulu, A.; Negesso, K.D. Effect of climate change on agricultural output in Ethiopia. J. Perspekt. PembiayaanDan Pembang. Drh. 2020, 8, 195–208. [Google Scholar]
- Temirbai, J.; Sarsengalii, B. Improving the Economic Efficiency of Agricultural Production by its Diversification in the Republic of Karakalpakstan. Bull. Sci. Pract. 2020, 6, 306–312. [Google Scholar]
- Coti-Zelati, P.E.; Teixeira, M.; Machado, M.M.; Araújo, D.L.A.D.; Pereira, R.M.D. Perception of the sociology of absences in the agricultural machinery industry supply chain. Rev. Econ. Sociol. Rural 2021, 60, 1–19. [Google Scholar] [CrossRef]
- Kudnar, N.S.; Padole, M.S.; Salunke, V.S.; Bhagat, R. Traditional crop diversity and its conservation on-farm for sustainable agricultural production in Bhandara district India. Int. J. Sci. Res. 2021, 8, 35–43. [Google Scholar] [CrossRef]
- Podorozhniak, A.; Balenko, O.; Sobol, V. Model and algorithms for determining the location and position of agricultural machinery during the movement. Innov. Technol. Sci. Solut. Ind. 2021, 2, 32–38. [Google Scholar] [CrossRef]
- Lim, H.; Yun, B.U.; Bang, B.J. Protection design method and reliability test evaluation method for electronic units of outdoor agricultural machinery. Trans. Korean Inst. Elect. Eng. P 2021, 70, 114–120. [Google Scholar] [CrossRef]
- Varchenko, O.M.; Gerasimenko, I.; Dmytryk, A.; Vernyuk, N. Features of formation of distribution marketing channels of agricultural production of personal peasant economy (PF). Ekon. Kata Uprav. L APK 2021, 1, 198–212. [Google Scholar] [CrossRef]
Figure 1.
Impact mechanism of agricultural mechanization service on grain production capacity.

Figure 2.
Impact mechanism of agricultural mechanization service on grain production efficiency.


Table 1.
Provincial panel data variables.
| Variable Number | Variable Name | Variable Explanation | Variable Dimension | Maximum Value | Minimum | Average Value | Sample Size |
|---|---|---|---|---|---|---|---|
| A1 | Total food production capacity | Total food output | Tons | 6325 | 154 | 2077.55 | 315 |
| A2 | Mechanical power resource input | Total power of agricultural machinery * ratio of grain sown area | Ten thousand kilowatts | 9071.74 | 143.31 | 2286.56 | 315 |
| A3 | Mechanical service revenue | Total income from agricultural machinery services * ratio of grain sown area | Billion | 296.31 | 4.87 | 74.17 | 315 |
| A4 | Labor input | Number of agricultural employees * ratio of grain sown area | 10,000 People | 2105.42 | 76.82 | 716.74 | 315 |
| A5 | Land input | Grain sown area | Thousand hectares | 11,764.35 | 376.71 | 4141.23 | 315 |
| A6 | Fertilizer input | Fertilizer usage * ratio of grain sown area | Tons | 6.32 | 2.86 | 4.71 | 315 |
| A7 | Crop damage | Grain affected area/grain sown area | / | 0.97 | 0.03 | 0.26 | 315 |
Note: * Indicates a multiplication sign.
Table 2.
Data variables of crop yield per unit area.
| Crop Type | Variable Number | Variable Name | Variable Explanation | Variable Dimension | Maximum Value | Minimum | Average Value | Sample Size |
|---|---|---|---|---|---|---|---|---|
| Rice crops | B1 | Rice yield per mu | Output of main products per mu of rice crops | Kilogram | 718.21 | 274.41 | 492.45 | 300 |
| B2 | Mechanization cost per mu of rice | Mechanized operation cost per mu of rice crops | Yuan | 20.32 | 0.01 | 84.31 | 300 | |
| B3 | The amount of labor input per mu of rice | Labor usage per mu of rice crops | Day | 26.71 | 3.04 | 9.81 | 300 | |
| B4 | Fertilizer input per mu of rice | Fertilizer usage per mu of rice crops | Kilogram | 39.64 | 13.67 | 22.56 | 300 | |
| B5 | Other expenses per mu of rice | Other services and miscellaneous charges per acre of rice crops | Yuan | 198.71 | 69.77 | 113.46 | 300 | |
| Wheat crops | C1 | Output capacity per mu of wheat | Output of main products per mu of wheat crops | Kilogram | 495.26 | 100.81 | 341.37 | 190 |
| C2 | Mechanization cost per mu of wheat | Mechanized operation cost per mu of wheat crops | Yuan | 131.47 | 4.96 | 71.35 | 190 | |
| C3 | The amount of labor input per mu of wheat | Labor usage per mu of wheat crops | Day | 14.27 | 0.27 | 7.21 | 190 | |
| C4 | Fertilizer input per mu of wheat | Fertilizer usage per mu of wheat crops | Kilogram | 38.13 | 10.14 | 23.51 | 190 | |
| C5 | Other expenses per mu of wheat | Other services and miscellaneous charges per acre for wheat crops | Yuan | 162.75 | 40.81 | 87.42 | 190 | |
| Corn crops | D1 | Yield capacity per mu of corn | Main product output per mu of corn crops | Kilogram | 691.61 | 231.76 | 457.43 | 245 |
| D2 | Mechanization cost per mu of corn | Mechanized operation cost per mu of corn crops | Yuan | 127.81 | 0.01 | 47.51 | 245 | |
| D3 | The amount of labor input per mu of corn | Corn crops labor usage per acre | Day | 23.94 | 2.67 | 8.82 | 245 | |
| D4 | Fertilizer input per mu of corn | Fertilizer usage per mu of corn crops | Kilogram | 33.87 | 13.81 | 23.91 | 245 | |
| D5 | Other expenses per mu of corn | Other services and miscellaneous charges per acre for corn crops | Yuan | 182.42 | 17.94 | 77.23 | 245 |
Table 3.
Production efficiency model data variables.
| Crop Type | Variable Number | Variable Name | Variable Explanation | Variable Dimension | Maximum Value | Minimum | Average Value | Sample Size |
|---|---|---|---|---|---|---|---|---|
| Rice crops | E1 | Rice production efficiency | Agricultural productivity of rice crops | / | 0.9892 | 0.6261 | 0.8663 | 300 |
| E2 | Agricultural machinery service supply level | Number of agricultural machinery employees per hectare of rice crop sown area | People | 0.6453 | 0.0754 | 0.2827 | 300 | |
| E3 | Agricultural machinery service utilization | Agricultural machinery operation cost as a percentage of total service cost | % | 0.4735 | 0.0001 | 0.2486 | 300 | |
| E4 | Average years of education for farmers | Average years of education of rural residents | Year | 8.2163 | 5.6349 | 7.3891 | 300 | |
| E5 | Percentage of farmers in basic education | Rural population with junior high school education or above in the total population | % | 0.6953 | 0.2433 | 0.5346 | 300 | |
| E6 | Rice planting scale | Planting area of rice crops under a unit farmer | mu | 9.2354 | 0.0731 | 2.1135 | 300 | |
| E7 | Disaster status of rice | Proportion of affected area of rice crops in planted area | % | 0.9461 | 0.0257 | 0.2381 | 300 | |
| E8 | Rice irrigation status | Proportion of effective irrigated area of rice crops in planted area | % | 0.6472 | 0.1532 | 0.3642 | 300 | |
| Wheat crops | F1 | Wheat production efficiency | Agricultural productivity of wheat crops | / | 0.9862 | 0.6172 | 0.8172 | 200 |
| F2 | Agricultural machinery service supply level | Number of agricultural machinery employees per hectare of wheat crop sown area | people | 0.6453 | 0.0813 | 0.3121 | 200 | |
| F3 | Agricultural machinery service utilization | Agricultural machinery operation cost as a percentage of total service cost | % | 0.3871 | 0.0516 | 0.2453 | 200 | |
| F4 | Average years of education for farmers | Average years of education of rural residents | year | 8.5271 | 5.6341 | 7.3542 | 200 | |
| F5 | Percentage of farmers in basic education | Rural population with junior high school education or above in the total population | % | 0.6982 | 0.2532 | 0.5301 | 200 | |
| F6 | Wheat planting scale | Wheat crop planting area under unit farmer | mu | 7.0347 | 0.2138 | 2.2794 | 200 | |
| F7 | Wheat disaster situation | Proportion of affected area of wheat crops in planted area | % | 0.6776 | 0.0265 | 0.2543 | 200 | |
| F8 | Irrigation status of wheat | Proportion of effective irrigation area of wheat crops in planting area | % | 0.9247 | 0.2341 | 0.4102 | 200 | |
| corn crops | G1 | corn production efficiency | Agricultural productivity of corn crops | / | 0.9643 | 0.6152 | 0.7561 | 250 |
| G2 | Agricultural machinery service supply level | The number of agricultural machinery employees per hectare of corn crop sown area | people | 0.6452 | 0.0768 | 0.2953 | 250 | |
| G3 | Agricultural machinery service utilization | Agricultural machinery operation cost as a percentage of total service cost | % | 0.2464 | 0.0000 | 0.0984 | 250 | |
| G4 | Average years of education for farmers | Average years of education of rural residents | year | 8.5421 | 5.6342 | 0.7321 | 250 | |
| G5 | Percentage of farmers in basic education | Rural population with junior high school education or above in the total population | % | 0.6983 | 0.2541 | 0.5223 | 250 | |
| G6 | corn planting scale | Corn crop planting area under a unit farmer | mu | 16.6578 | 0.3452 | 3.0673 | 250 | |
| G7 | Disaster status of corn | Proportion of affected area of corn crops in planted area | % | 0.6783 | 0.0164 | 0.2541 | 250 | |
| G8 | Irrigation status of corn | Proportion of effective irrigation area of corn crops in planting area | % | 0.9217 | 0.1459 | 0.3842 | 250 |
Table 4.
Analysis of provincial panel data.
| Variable Name | Numeric Type | Dynamic Variable Equation | Income Variable Equation | ||
|---|---|---|---|---|---|
| Fixed Effects | Random Effects | Fixed Effects | Random Effects | ||
| Mechanical power resource input | Coefficient value | 0.0976 | 0.0843 | / | / |
| Significance level | 1% | 1% | / | / | |
| Mechanical service revenue | Coefficient value | / | / | 0.0437 | 0.0531 |
| Significance level | / | / | 5% | 1% | |
| Labor input | Coefficient value | 0.0223 | −0.167 | −0.0346 | −0.0533 |
| Significance level | >10% | >10% | >10% | >10% | |
| Land input | Coefficient value | 0.3871 | 0.3581 | 0.4521 | 0.3841 |
| Significance level | 1% | 1% | 1% | 1% | |
| Fertilizer input | Coefficient value | 4265 | 0.5821 | 0.4726 | 0.6563 |
| Significance level | 1% | 1% | 1% | 1% | |
| Crop damage | Coefficient value | −0.2413 | −0.2527 | −0.2543 | −0.2641 |
| Significance level | 1% | 1% | 1% | 1% | |
| Constant term | Coefficient value | 1.2547 | 0.4832 | 1.5022 | 0.5607 |
| Significance level | 1% | >10% | 1% | 5% | |
| Hausman test | Coefficient value | 13.24 | / | 16.52 | / |
| Significance level | 5% | / | 1% | / | |
| F value | Coefficient value | 105.14 | / | 82.91 | / |
| Significance level | 1% | / | 1% | / | |
| VIF range | (1.17, 7.78) | (1.17, 7.78) | (1.19, 7.68) | (1.19, 7.68) | |
| Sample size | 315 | 315 | 315 | 315 | |
Table 5.
Analysis of crop yield per unit area.
| Rice Crop Analysis | Wheat Crop Analysis | Analysis of Corn Crops | |||||||||
|---|---|---|---|---|---|---|---|---|---|---|---|
| Variable Name | Numeric Type | Model Analysis | Variable Name | Numeric Type | Model Analysis | Variable Name | Numeric Type | Model Analysis | |||
| Fixed Effects | Random Effects | Fixed Effects | Random Effects | Fixed Effects | Random Effects | ||||||
| Mechanization cost per mu of rice | Logarithm | 0.0311 | 0.0338 | Mechanization cost per mu of wheat | Logarithm | 0.0827 | 0.0753 | Mechanization cost per mu of corn | Logarithm | 0.0233 | 0.0274 |
| Significance level | 1% | 1% | Significance level | 1% | 1% | Significance level | 5% | 1% | |||
| The amount of labor input per mu of rice | Logarithm | −0.0224 | −0.0128 | The amount of labor input per mu of wheat | Logarithm | −0.0332 | −0.0511 | The amount of labor input per mu of corn | Logarithm | −0.0762 | −0.0735 |
| Significance level | >10% | >10% | Significance level | >10% | 5% | Significance level | >10% | >10% | |||
| Fertilizer input per mu of rice | Logarithm | 0.2781 | 0.2642 | Fertilizer input per mu of wheat | Logarithm | 0.2341 | 0.4032 | Fertilizer input per mu of corn | Logarithm | 0.2122 | 0.2342 |
| Significance level | 1% | 1% | Significance level | 1% | 1% | Significance level | 1% | 1% | |||
| Other expenses per mu of rice | Logarithm | 0.1368 | 0.1783 | Other expenses per mu of rice | Logarithm | 0.1322 | 0.0261 | Other expenses per mu of corn | Logarithm | 0.0913 | 0.0957 |
| Significance level | 1% | 1% | Significance level | 5% | >10% | Significance level | 1% | 1% | |||
| Constant term | Logarithm | 4.6867 | 4.5704 | Constant term | Logarithm | 4.2781 | 4.2317 | Constant term | Logarithm | 5.2312 | 5.0524 |
| Significance level | 1% | 1% | Significance level | 1% | 1% | Significance level | 1% | 1% | |||
| Hausman test | Logarithm | 8.46 | / | Hausman test | Logarithm | 48.33 | / | Hausman test | Logarithm | 15.34 | / |
| Significance level | 10% | / | Significance level | 1% | / | Significance level | 5% | / | |||
| F test | Logarithm | 42.73 | / | F test | Logarithm | 12.27 | / | F test | Logarithm | 19.41 | / |
| Significance level | 1% | / | Significance level | 1% | / | Significance level | 1% | / | |||
| VIF test | (1.38, 2.57) | (1.38, 2.57) | VIF test | (1.36, 3.72) | (1.36, 3.72) | VIF test | (1.52, 2.43) | (1.52, 2.43) | |||
| Sample size | 300 | 300 | Sample size | 190 | 190 | Sample size | 245 | 245 | |||
Table 6.
Data analysis of rice crops.
| Variable Name | Numeric Type | Model Analysis | |
|---|---|---|---|
| Supply Level Model | Utilization Model | ||
| Agricultural machinery service supply level | Logarithm | 0.0192 | / |
| Significance level | 1% | / | |
| Agricultural machinery service utilization | Logarithm | / | 0.0059 |
| Significance level | / | 1% | |
| Average years of education for farmers | Logarithm | −0.0053 | / |
| Significance level | 5% | / | |
| Percentage of farmers in basic education | Logarithm | / | −0.0069 |
| Significance level | / | 1% | |
| Rice planting scale | Logarithm | −0.0415 | −0.0162 |
| Significance level | 1% | 1% | |
| Disaster status of rice | Logarithm | −0.0076 | −0.0061 |
| Significance level | 1% | 1% | |
| Rice irrigation status | Logarithm | 0.0234 | 0.0762 |
| Significance level | 1% | 1% | |
| Constant term | Logarithm | 0.9754 | 0.8973 |
| Significance level | 1% | 1% | |
| LR test | Logarithm | 1892.66 | 1807.92 |
| Significance level | 1% | 1% | |
| VIF test | (1.16, 1.35) | (1.16, 1.35) | |
| Sample size | 300 | 300 | |
Table 7.
Data analysis of wheat crops.
| Variable Name | Numeric Type | Model Analysis | |
|---|---|---|---|
| Supply Level Model | Utilization Model | ||
| Agricultural machinery service supply level | Logarithm | 0.0587 | / |
| Significance level | 1% | / | |
| Agricultural machinery service utilization | Logarithm | / | 0.0148 |
| Significance level | / | 5% | |
| Average years of education for farmers | Logarithm | −0.1041 | −0.1304 |
| Significance level | 1% | 1% | |
| Percentage of farmers in basic education | Logarithm | / | / |
| Significance level | / | / | |
| Wheat planting scale | Logarithm | 0.0097 | 0.0098 |
| Significance level | 1% | 1% | |
| Wheat disaster situation | Logarithm | −0.0121 | −0.0095 |
| Significance level | 1% | 1% | |
| Irrigation status of wheat | Logarithm | 0.0028 | 0.0173 |
| Significance level | >10% | 1% | |
| Constant term | Logarithm | 1.0461 | 0.9013 |
| Significance level | 1% | 1% | |
| LR test | Logarithm | 976.24 | 994.13 |
| Significance level | 5% | 1% | |
| VIF test | (1.24, 1.73) | (1.24, 1.73) | |
| Sample size | 200 | 200 | |
Table 8.
Data analysis of corn crops.
| Variable Name | Numeric Type | Model Analysis | |
|---|---|---|---|
| Supply Level Model | Utilization Model | ||
| Agricultural machinery service supply level | Logarithm | 0.0241 | / |
| Significance level | 1% | / | |
| Agricultural machinery service utilization | Logarithm | / | 0.0607 |
| Significance level | / | 1% | |
| Average years of education for farmers | Logarithm | 0.1087 | / |
| Significance level | 1% | / | |
| Percentage of farmers in basic education | Logarithm | / | 0.0823 |
| Significance level | / | 1% | |
| Corn planting scale | Logarithm | −0.0141 | −0.0211 |
| Significance level | 1% | 1% | |
| Disaster status of corn | Logarithm | −0.0075 | −0.0028 |
| Significance level | 1% | 1% | |
| Irrigation status of corn | Logarithm | 0.0036 | 0.0029 |
| Significance level | 1% | 1% | |
| Constant term | Logarithm | 0.4963 | 0.6587 |
| Significance level | 1% | 1% | |
| LR test | Logarithm | 1082.78 | 1093.43 |
| Significance level | 1% | 1% | |
| VIF test | (1.34, 1.50) | (1.34, 1.50) | |
| Sample size | 250 | 250 | |
Disclaimer/Publisher’s Note: The statements, opinions and data contained in all publications are solely those of the individual author(s) and contributor(s) and not of MDPI and/or the editor(s). MDPI and/or the editor(s) disclaim responsibility for any injury to people or property resulting from any ideas, methods, instructions or products referred to in the content. |
© 2023 by the authors. Licensee MDPI, Basel, Switzerland. This article is an open access article distributed under the terms and conditions of the Creative Commons Attribution (CC BY) license (https://creativecommons.org/licenses/by/4.0/).
Share and Cite
MDPI and ACS Style
Liu, X.; Li, X. The Influence of Agricultural Production Mechanization on Grain Production Capacity and Efficiency. Processes 2023, 11, 487. https://doi.org/10.3390/pr11020487
AMA Style
Liu X, Li X. The Influence of Agricultural Production Mechanization on Grain Production Capacity and Efficiency. Processes. 2023; 11(2):487. https://doi.org/10.3390/pr11020487
Chicago/Turabian StyleLiu, Xiangjuan, and Xibing Li. 2023. "The Influence of Agricultural Production Mechanization on Grain Production Capacity and Efficiency" Processes 11, no. 2: 487. https://doi.org/10.3390/pr11020487
Note that from the first issue of 2016, this journal uses article numbers instead of page numbers. See further details here.