
Sediment Carbon Sequestration and Driving Factors in Seagrass Beds from Hainan Island and the Xisha Islands
by
 ,
,
Qiuying Han
1,2, 
Chongyu Qiu
2,
Wenxuan Zeng
2,
Shiquan Chen
3,*,
Muqiu Zhao
1,2,
Yunfeng Shi
1,2 and
Xiaoli Zhang
4,* 1
Yazhou Bay Innovation Institute, Hainan Tropical Ocean University, Sanya 572022, China
2
Key Laboratory for Coastal Marine Eco-Environment Process and Carbon Sink of Hainan Province, Hainan Tropical Ocean University, Sanya 572022, China
3
Hainan Academy of Ocean and Fisheries Sciences, Haikou 571126, China
4
Yantai Institute of Coastal Zone Research, Chinese Academy of Sciences, Yantai 264003, China
*
Authors to whom correspondence should be addressed.
Processes 2023, 11(2), 456; https://doi.org/10.3390/pr11020456
Submission received: 18 November 2022
/
Revised: 27 January 2023
/
Accepted: 30 January 2023
/
Published: 2 February 2023
(This article belongs to the Special Issue Nitrogen Cycling Processes in Coastal Ecosystems)
Abstract
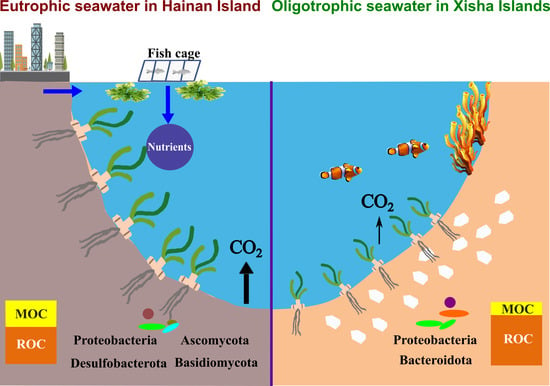
:Seagrass beds are considered to be substantial sinks of “blue carbon”. However, differentiation in the carbon sink capacities of seagrass beds in different regions with distinct nutrient conditions remains unclear. In this study, sediment carbon stocks, seagrass biomass, and microbial community structures and potential functions of seagrass beds in eutrophic seawater adjacent to Hainan Island and oligotrophic seawater around the Xisha Islands were compared. Our results showed that sediment mineralizable organic carbon and dry bulk density were substantially higher on Hainan Island than on the Xisha Islands (t-test, p < 0.05), while sediment carbon stocks and the total organic carbon were comparable between the two regions (p > 0.05). Similarly, seagrass biomass was much higher on Hainan Island (p < 0.05). Sediment carbon stocks positively correlated with sediment nitrogen and negatively correlated to sediment pH and grain size (p < 0.05). Bacterial diversities were similar in the two regions, while fungi were more diverse on Hainan Island (p < 0.05). Proteobacteria, Desulfobacterota, Ascomycota and Basidiomycota could account for degrading organic carbon on Hainan Island. Proteobacteria and Bacteroidota may contribute primarily to carbon loss in the seagrass beds of the Xisha Islands. This study strengthens our understanding of the effects of human activities on carbon sequestration in seagrass bed ecosystems.
1. Introduction
Seagrass beds can perform important ecological functions [1,2], for example, maintaining high biodiversity, being critical habitats or nursery grounds for marine animals [3,4], stabilising the sea floor, and preventing erosion of coastal zones [5,6]. High primary production of seagrasses can effectively sequester carbon [7,8]; therefore seagrass beds are considered to be substantial sinks of “blue carbon” [9,10]. On one hand, seagrass beds store carbon in their living biomass [11,12]. On the other hand, seagrasses can trap allochthonous-suspended organic debris in the sediments and prevent resuspension of the sediments [13,14].
Seagrass beds only occupy about 0.2% of the global sea surface area, but bury about 27.4 Tg C yr−1, contributing to 10% of the yearly stored organic carbon (Corg) in the oceans, which is equivalent to 10 times the amount stored in the terrestrial soils [15,16]. The number of carbon stocks (Cstocks) in the global living seagrass biomass is on average 2.52 ± 0.48 Mg C ha−1, most of which is buried in the sediment in the form of rhizomes and roots [15]. There is significant diversity in sediment Cstocks between different regions of the world and seagrass beds composed of different seagrass species [17,18,19,20].
In addition to seagrass biomass and productivity, the seawater nutrient condition is a vital factor affecting Cstocks in seagrass sediments. In oligotrophic environments, nutrient addition contributes to increased primary productivity of seagrasses, which will increase the yield of seagrass organic matter and support the trapping of allochthonous carbon [21,22]. However, seawater eutrophication may lead to the reduction of seagrass beds Cstocks by inhibiting seagrass growth [23,24,25] and stimulating microbial activities to mineralize sediment Corg [26,27]. Conversely, increased nutrient loads could increase the total carbon sequestration in seagrass beds by stimulating the accumulation of allochthonous carbon in sediments or the overgrowth of microalgae and epiphyte [28,29]. These contradictory results suggested that further work should be conducted on the response of sediment Cstocks to seawater nutrient status.
Recently, the microbial community has been recognized as a critical element influencing sediment and soil Corg storage, remineralization, and stability [30,31]. Microbial decomposition and respiration usually lead carbon to flow out of the sediment [27]. Moreover, sediment microbes specifically release extracellular enzymes to enhance Corg decomposition [32,33]. The decomposition rate of sediment Corg mainly depends on the quality of Corg [34,35]. Holme et al. (2004) reported that microbes tend to use algal Corg sources because they are generally more labile, causing a relatively lower carbon burial efficiency of algal materials than seagrasses [35]. However, fungi are more important in degrading recalcitrant litter (such as lignin and cellulose) [36]. As yet, the relationships between microbial communities and sediment Cstocks in seagrass beds remains largely unknown.
Hainan Island and the Xisha Islands are rich in seagrass resources due to the unique geographical position and climate condition [37,38]. Previous studies have focused on seagrass species, biomass and distributions in these two regions [37,38], but neglected the amount, composition and affecting factors of Cstocks in seagrass sediments. In this study, we hypothesized that there were different sediment Cstocks in seagrass beds between the Xisha Islands, with little human interference, and Hainan Island, which is affected by intense human activities. In addition, we assessed the relationships between sediment Cstocks and seawater nutrients, sediment characteristics, extracellular enzyme activities and microbial communities. This study may strengthen understanding of the effects of human activities on the carbon sequestration characteristics of tropical seagrass beds.
2. Materials and Methods
2.1. Study Regions
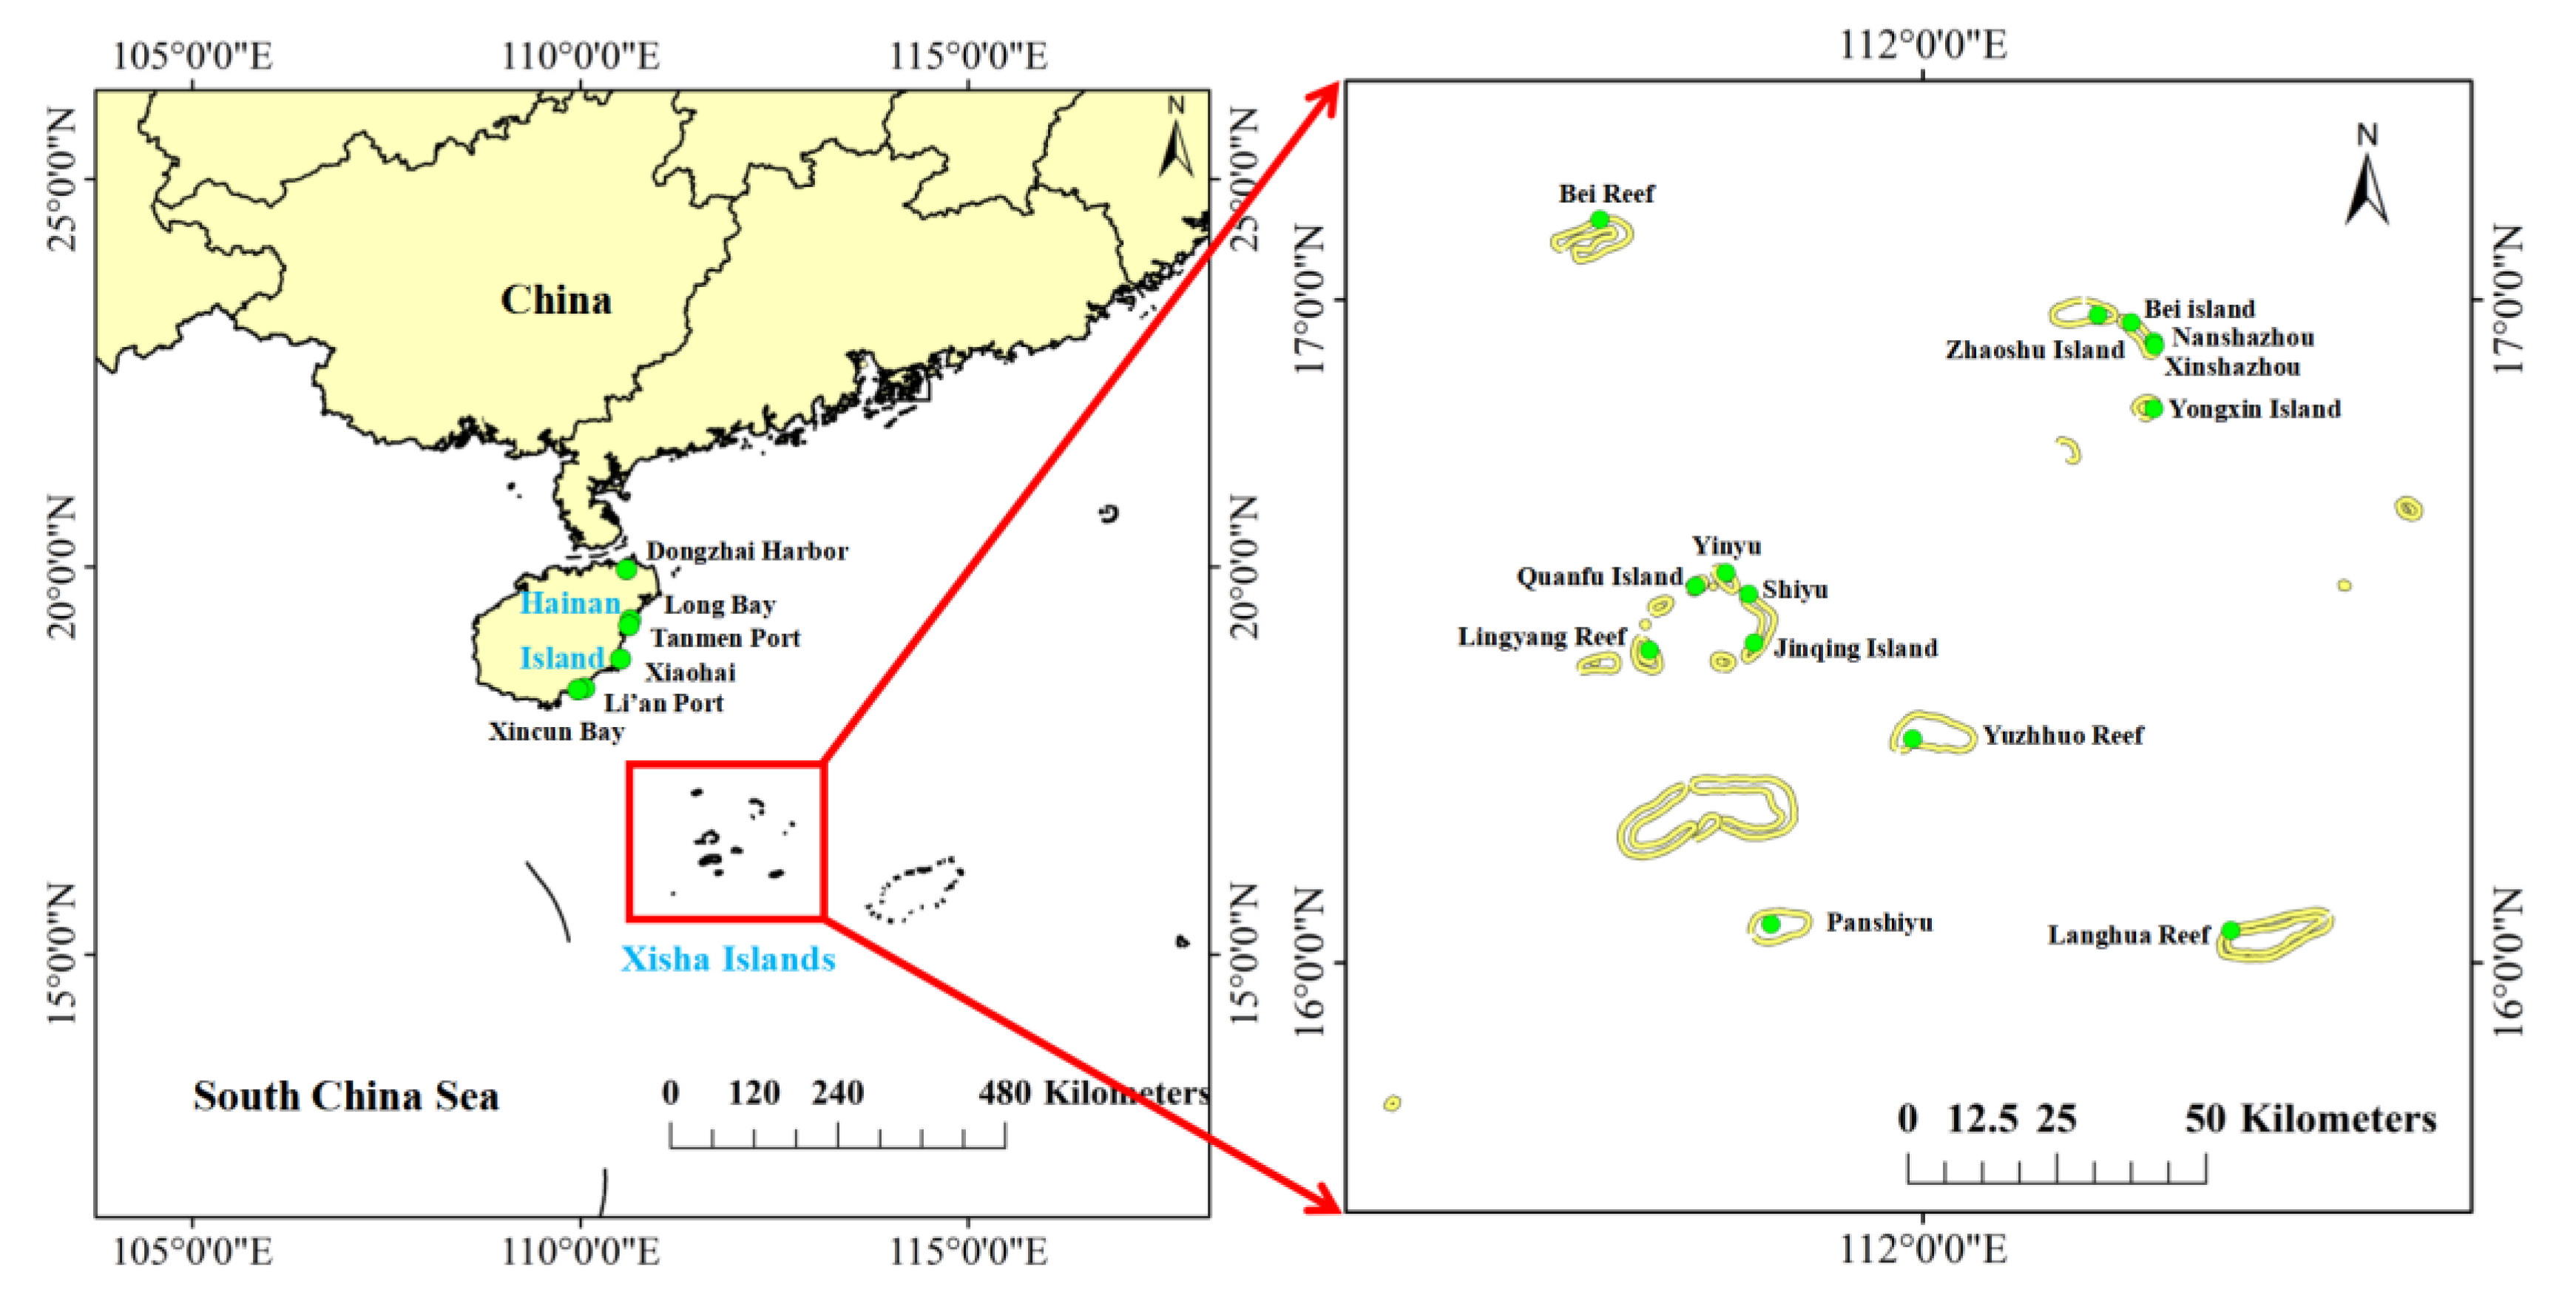
Hainan Island (18°10′–20°10′ N and 108°37′–111°03′ E) is a large island located in the northwest of the South China Sea, which covers an area of 33,920 km2 with a maritime tropical monsoon climate (Figure 1). The area of seagrass beds on Hainan Island is about 56.34 km2, mostly distributed in the eastern and southern coast areas. There are 13–14 species of seagrass belonging to 8 genera on Hainan Island. The widely distributed seagrass species include Thalassia hemprichii, Enhalus acoroides, Cymodocea rotunda, Halodule uninervis and Halophila ovalis. The Xisha Islands (15°46′–17°08′ N and 111°11′–112°54′ E) are also located in the South China Sea, 250 km south of Hainan Island. They comprise more than 30 islands, sandbanks, reefs and shoals (Figure 1). The extensively distributed seagrass species on the Xisha Islands are T. hemprichii, H. ovalis, H. uninervis, Syringodium isoetifolium, and Thalassodendron ciliatum.
The average annual temperature, rainfall, and salinity on Hainan Island are 22–26 °C, 1600 mm, and 22.86, respectively [39], and those on the Xisha Islands are 26.5 °C, 1506 mm and 32–33.5, respectively [40]. The sediments on the eastern coast of Hainan Island are mainly composed of coral debris and sand, and silt in some areas, and those on the southern coast of Hainan Island and the Xisha Islands are primarily coral detritus and sand [39,40]. According to the China Fishery Statistical Yearbook, the area of coastal mariculture on Hainan Island was 20,510 ha in 2019, resulting in eutrophication of the seawater [39], which may seriously impact seagrass ecosystems.
2.2. Sampling and Sample Preparation
Field surveys were conducted in October of 2021, and the specimens were collected from 14 islands on the Xisha Islands and 6 locations on Hainan Island during low tide (Figure 1). Sediment (0–5 cm), seagrass and seawater samples were separately collected from E. acoroides, Halophila sp. and T. hemprichii beds. Sediments were collected in quadrates with a diameter of 10 cm, and then the seawater and sediment were, respectively, put into sterilized polyethylene bottles and PE Ziploc bags. In total, 26 sediment, seagrass, and seawater samples with three replicates were obtained, respectively. All samples were stored on ice and transported to the laboratory within a few hours. Seawater samples were promptly filtered through 0.45 μm GF/F filters (Whatman, Maidstone, UK) and the filtrate was stored at −20 °C for nutrients analysis. Seagrasses were carefully washed to remove filamentous macroalgae and invertebrates and then separated into above-ground and below-ground tissues. Sediments for microbial community analysis were immediately retained at −80 °C.
2.3. Determination of Seawater Nutrients, Sediment Characteristics and Carbon Stocks
The dissolved inorganic nitrogen (DIN) including nitrate (NO3−-N), nitrite (NO2−-N), and ammonium (NH4+-N), and the dissolved inorganic phosphorus (DIP) of seawater were measured using a continuous-flow analyzer (SAN plus, Skalar Analytical B.V., Breda, The Netherlands).
The above-ground and below-ground tissues of seagrass were dried at 60 °C for 72 h to a constant weight, and then the biomass was measured [41]. After grinding, the plant power was passed through a 150 μm sieve, and the carbon (C) and nitrogen (N) contents of seagrass tissues were measured using a CHN element analyzer (Elementar, Vario EL-III, Germany).
The grain size of sediments was analyzed using a laser diffractometer (Mastersizer, 2000, Malvern Instruments Ltd, Worcestershire, UK). The pH of sediment was measured using a pH meter (pH3S-3C, Leici, China). The total organic carbon (Corg) and total nitrogen (TN) of sediments were analyzed with a CHN elemental analyzer (Elementar, Vario EL-III, Germany). The dissolved organic carbon (DOC) was extracted using potassium sulfate solution (0.5 mol/L) and determined using a dichromate oxidation method [42]. The content of sediments mineralizable organic carbon (MOC) was determined according to the method mentioned by Blair et al. (1995) [43].
The dry bulk density (DBD) and the total sediment Cstocks were calculated using the following equations derived by Howard et al. (2014) [41]:
DBD (g/cm3) = Mass of dry sediment (g)/Original volume (cm3),
Sediment Cstocks (Mg C/ha) = Summed core carbon (g/cm2) × (1 Mg/1,000,000 g) × (100,000,000 cm2/1 ha),
Summed core carbon (g/cm2) = Amount carbon in core section A (g/cm2) + Amount carbon in core section B (g/cm2) + Amount carbon in core section C (g/cm2) + …all the samples from a single core,
Amount carbon in core section (g/cm2) = Sediment carbon density (g/cm3) × thickness interval (cm),
Sediment carbon density (g/cm3) = DBD (g/cm3) × (%Corg/100)
2.4. Analysis of Microbial Enzymes
Sediments were dried at 37 °C, and the urease and polyphenol oxidase activities were analyzed using the indophenol blue colorimetry and pyrogallol oxidase method, respectively [44]. Invertase and cellulase activities were determined using the 3, 5-dinitrosalicylic acid colorimetric method [44,45]. Disodium diphenyl phosphate spectrophotometry was used to test the alkaline phosphatase activity [44]. One unit (U) is the amount of the enzyme that catalyzes the reaction of 1 mM of substrate per minute under standard assay.
2.5. DNA Extraction and PCR Amplification
Microbial genomic DNA was extracted from 0.5 g sediment using the E.Z.N.A.® Soil DNA Kit (Omega Bio Tek, GA, USA) following the manufacturer’s instructions. The quality and purity of the isolated genomic DNA was confirmed by agarose gel-electrophoresis and spectrophotometry on a NanoDrop 2000 device (Thermo Scientific, Wilmington, DE, USA).
The V3-V4 hypervariable regions of bacterial 16S rRNA gene were amplified by using primers 338F (5′-ACTCCTACGGGAGGCAGCAG-3′) and 806R (5′-GGACTACHVGGGTWTCTAAT-3′) [46]. The ITS1 hypervariable region of the fungal ITS gene was amplified with primers ITS1F (5′-CTTGGTCATTTAGAGGAAGTAA-3′) and ITS2R (5′-GCTGCGTTCTTCATCG ATGC-3′) [46]. PCR products from each sample were quantified using a Qubit Fluorometer (Invitrogen, Eugene, OR, USA), equally pooled by mass, and sequenced by Shanghai Majorbio Bio-pharm Technology Co., Ltd. on an Illumina MiSeq plat platform.
2.6. Bioinformatics Analyses
Raw sequencing files were de-multiplexed and quality filtered using QIIME at a quality threshold of 20. Operational taxonomic units (OTUs) were clustered at a 97% similarity threshold using UPARSE [46], and chimeric sequences were identified and removed with UCHIME [46]. The taxonomy was assigned using the RDP classifier algorithm, and the Silva SSUrRNA database (Version 138) was referenced with a confidence threshold of 0.7. The OTU matrices were rarefied using a standard of sequence numbers corresponding to the sample with the least reads. The alpha diversity was analyzed with Mothur (Version 1.30.2) based on the rarefied data. Beta diversity indexes were calculated in Qiime and nonmetric multidimensional scaling (NMDS) analysis was conducted, with the Bray–Curtis dissimilarities of the communities tested using ANOSIM in Primer v6 [47,48]. Functional prediction of bacterial communities related to the carbon cycle was performed using the Functional Annotation of Prokaryotic Taxa (FAPROTAX) database [49].
The raw reads in this study have been deposited into the NCBI SRA database with the project accession number PRJNA918849 for the bacterial 16S rDNA sequences and PRJNA918853 for the fungal ITS sequences.
2.7. Statistical Analysis
All data were firstly checked for normality and homogeneity of variance using the Shapiro–Wilk’s test and Levene’s test, respectively, and the raw data were log-transformed when necessary. The Student’s t-test was conducted to test the statistical difference in seagrass biomass between above-ground and below-ground tissues, as well as seawater nutrients, seagrass biomass, sediment characteristics and carbon stocks, microbial diversity indexes and relative abundance of dominant bacterial and fungal taxa between Hainan Island and the Xisha Islands. A one-way analysis of variance (ANOVA) followed by the least significant difference (LSD) was used to check if the difference in seawater, seagrass, sediment and microbial traits was significant among different seagrass species. Pearson’s correlation was used to test the relationships between environmental factors and Corg, Cstocks, MOC and DOC. All above statistical analyses were performed with IBM SPSS Statistics 26.0.
3. Results
3.1. Seawater Nutrients
The seawater nutrients of seagrass beds on Hainan Island and the Xisha Islands are described in Table 1. Generally, NO3−-N was the primary component of the dissolved inorganic nitrogen (DIN, the sum of NH4+-N, NO2−-N and NO3−-N) on Hainan Island, while NO3−-N and NH4+-N were the principal nitrogen nutrient on the Xisha Islands. The concentrations of DIN, NO3−-N and NH4+-N on the Xisha Islands were significantly lower than those on Hainan Island (ANOVA test, p < 0.05), and the highest value appeared in Long Bay, Xiaohai and Xincun Bay, respectively. The NO2−-N concentration peaked in Xiaohai (2.20 ± 0.65 μmol/L), and was lowest on the Xisha Islands (~0.06 μmol/L). DIP concentrations varied largely among sampling sites, and in general were apparently higher on Hainan Island (on average 0.89 μmol/L) than on the Xisha Islands (0.34 μmol/L). Among different seagrass species, substantially higher both nitrogen and phosphorus nutrients were observed in the E. acodoides bed, while Halophila sp. and T. hemprichii beds had comparable nutrient levels (Table 1).
3.2. Sediment Characteristics and Carbon Stocks
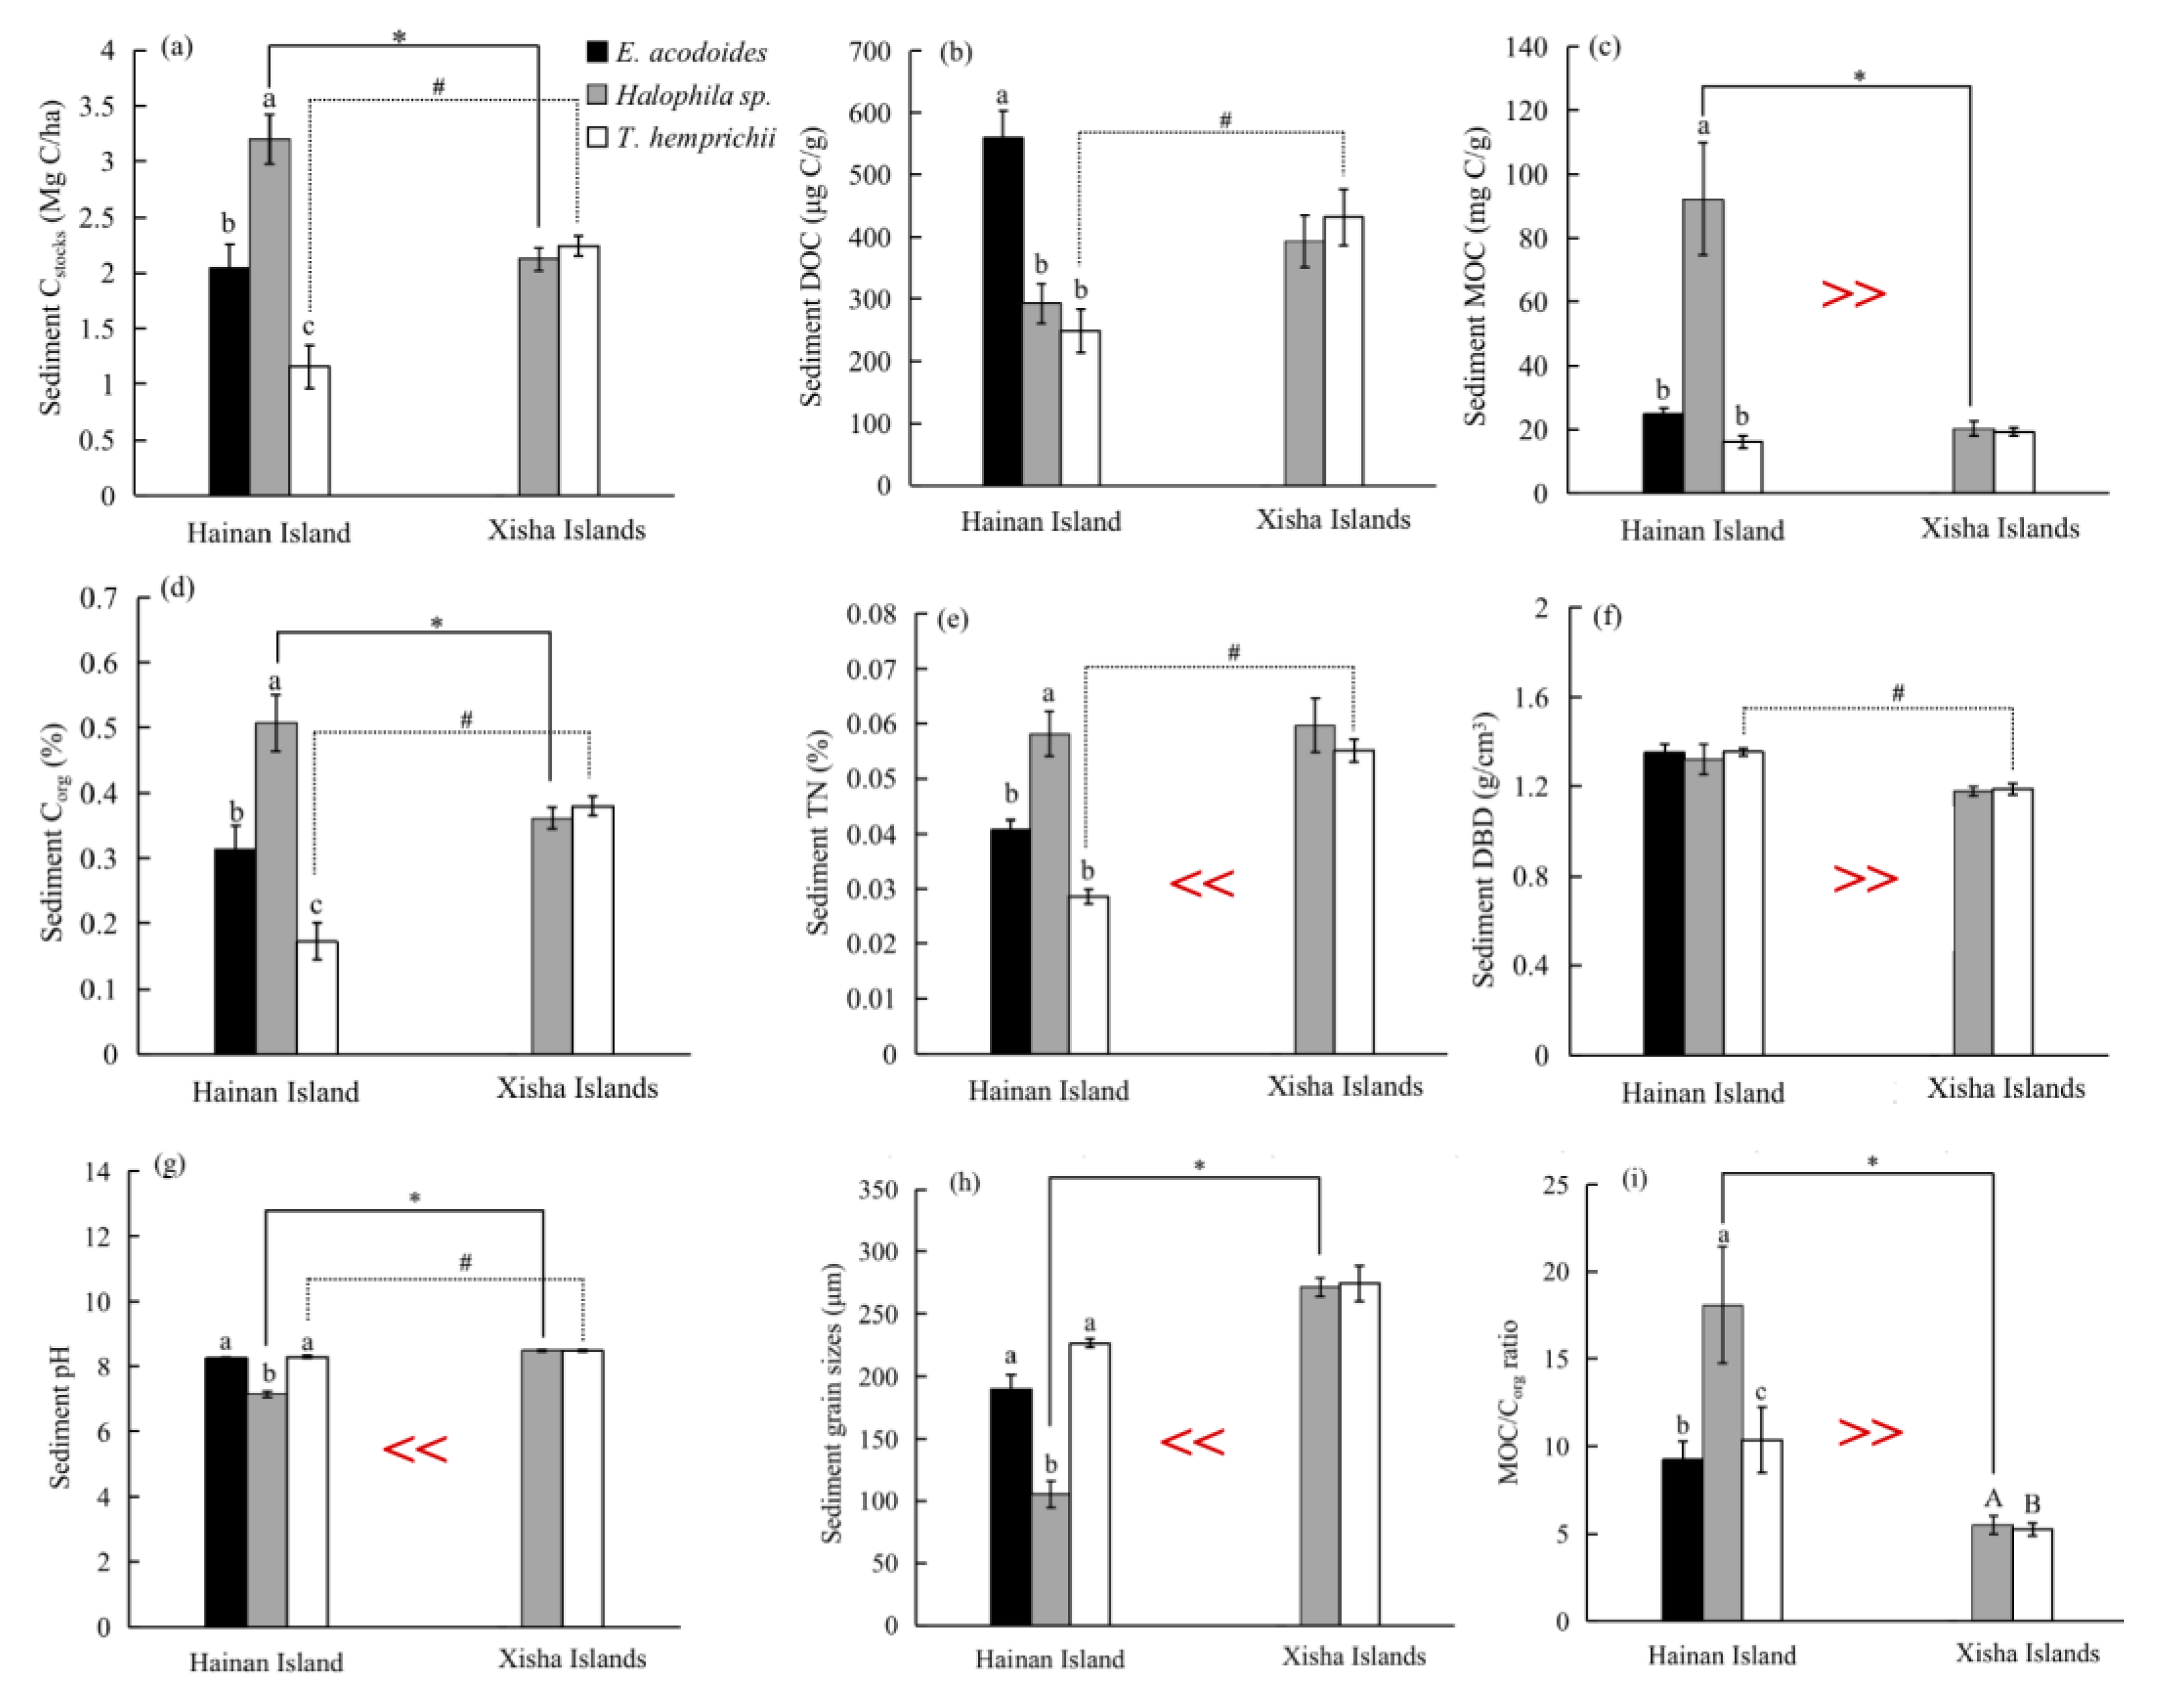
Across all samples, sediment MOC, DBD and MOC/Corg ratio were substantially higher on Hainan Island than on the Xisha Islands, while sediment TN content, pH and grain size were apparently higher on the Xisha Islands (t-test, p < 0.05, Figure 2 and Table S1). However, sediment Cstocks, DOC and Corg had similar values in the two study regions (p > 0.05, Figure 2 and Table S1).
On Hainan Island, sediment characteristics and carbon stocks varied largely among different seagrass beds, with the highest Cstocks, MOC, Corg and TN values occurring in the Halophila sp. bed and the lowest in the T. hemprichii bed (ANOVA test, p < 0.05, Figure 2a,c–e). The highest and lowest MOC/Corg ratios were recorded in Halophila sp. and E. acodoides beds, separately (p < 0.05, Figure 2i). Conversely, the Halophila sp. bed had the lowest sediment pH and grain size (p < 0.05, Figure 2g,h). Sediment DOC was highest in the E. acodoides bed (559.29 ± 43.58 μg C/g), and also lowest in the T. hemprichii bed (248.39 ± 34.99 μg C/g) (Figure 2b). On the Xisha Islands, the MOC/Corg ratio in the Halophila sp. bed was conspicuously higher than that in the T. hemprichii bed (p < 0.05, Figure 2i), whereas there was no significant discrepancy in other sediment characteristics among the seagrass beds on the Xisha Islands (p > 0.05, Figure 2).
Meanwhile, sediment characteristics and carbon stocks in a same seagrass species were compared between Hainan Island and Xisha Islands. In the Halophila sp. bed, Cstocks, MOC, Corg and MOC/Corg ratio were higher on Hainan Island than on the Xisha Islands (t-test, p < 0.05, Figure 2a,c,d,i), while sediment DOC, TN and DBD were comparable between the two regions (p > 0.05, Figure 2b,e,f). However, in the T. hemprichii bed, there were higher sediment Cstocks, DOC, Corg, TN content and pH on the Xisha Islands (p < 0.05, Figure 2a,b,d,e,g), but higher DBD on Hainan Island (p < 0.05, Figure 2f).
3.3. Seagrass Biomass and Biochemical Properties
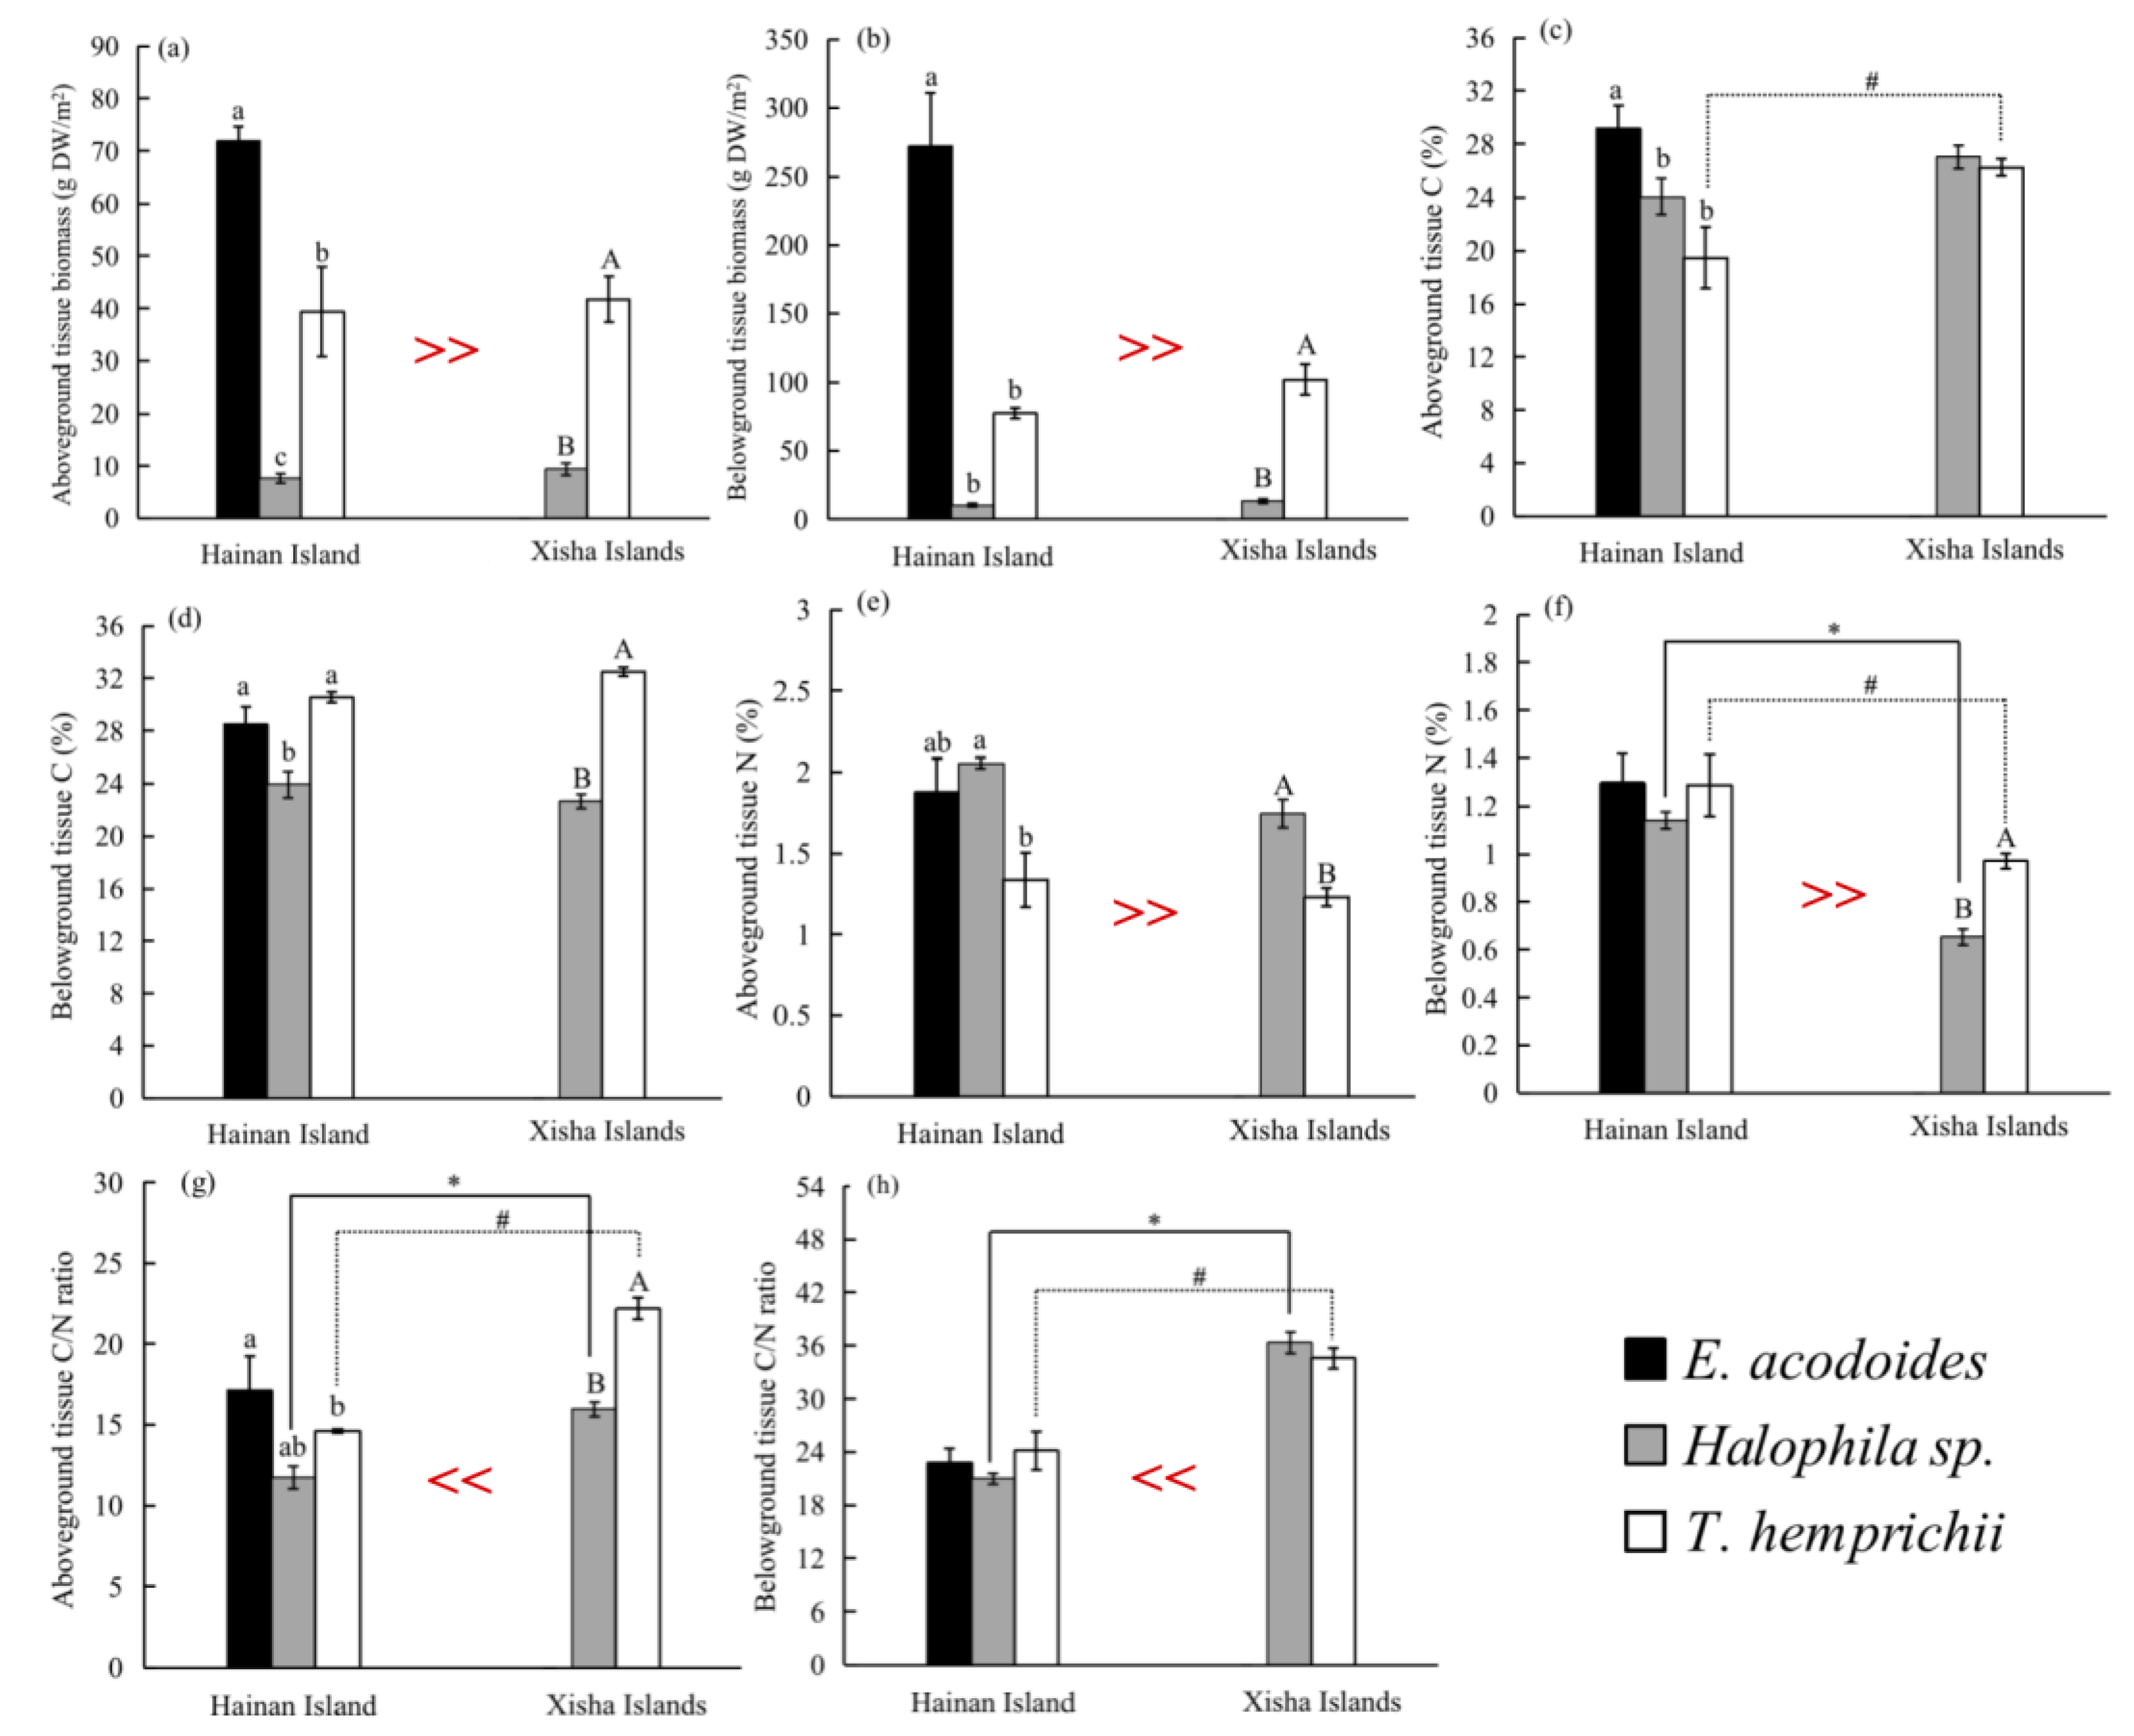
Overall, the above-ground biomass (31.29 ± 3.09 gDW/m2) of all seagrass species were generally lower than the below-ground biomass (82.92 ± 11.12 gDW/m2) (t-test, p < 0.05, Table S2). Between Hainan Island and the Xisha Islands, seagrass’s above-ground (45.00 ± 7.23 vs. 27.17 ± 3.23 gDW/m2) and under-ground biomass (152.54 ± 35.01 vs. 62.04 ± 8.47 gDW/m2) were significantly higher on Hainan Island (p < 0.05, Figure 3 and Table S3). Among three seagrass species, E. acodoides had the highest both above-ground and below-ground biomass, while Halophila sp. had the lowest (ANOVA test, p < 0.05, Figure 3a,b).
The N content was obviously lower in the below-ground tissues (0.92 ± 0.03%) than in the above-ground tissues (1.55 ± 0.06%) (p < 0.05), but the difference in C contents between the two parts of tissue were weak (p > 0.05), and so the ratio of C/N was higher in the below-ground tissues (below-ground vs. above-ground, 32.38 ± 0.91% vs. 18.34 ± 0.56%) (p < 0.05, Table S2). There was significantly higher tissue N content on Hainan Island than on the Xisha Islands (p < 0.05, Figure 3 and Table S3). The E. acodoides had the highest above-ground tissue C; instead, T. hemprichii had the highest below-ground tissue C and the lowest above-ground tissue C and N (Figure 3c–e).
3.4. Sediment Enzyme Activities
The activities of sediment alkaline phosphatase, urease, invertase, cellulose and polyphenol oxidase had a range of 0.47–0.50 U/g, 8.10–8.43 U/g, 5.80–6.03 U/g, 0.83–0.85 U/g and 2.35–2.37 U/g, respectively (Table S4). No significant differences in enzyme activities were observed between Hainan Island and the Xisha Islands, or among different seagrass beds (p > 0.05, Figure S1).
3.5. Microbial Community Diversities, Compositions and Distributions
After quality filtering, a total of 4,055,261 bacterial 16S rDNA and 4,375,303 fungal ITS valid sequences were obtained, which were clustered into 30,407 bacterial OTUs and 5288 fungal OTUs with 97% sequence similarity, separately. Bacterial α-diversities including OTUs, Shannon and Chao 1 showed no difference between Hainan Island and the Xisha Islands, and among seagrass species (p > 0.05, Table 2). However, the OTUs and Chao 1 index of fungal community were significantly higher on Hainan Island than on the Xisha Islands (t-test, p < 0.05, Table 2). In addition, Halophila sp. sediments had the highest fungal OTUs and Chao 1, while T. hemprichii had the lowest (ANOVA test, p < 0.05, Table 2).
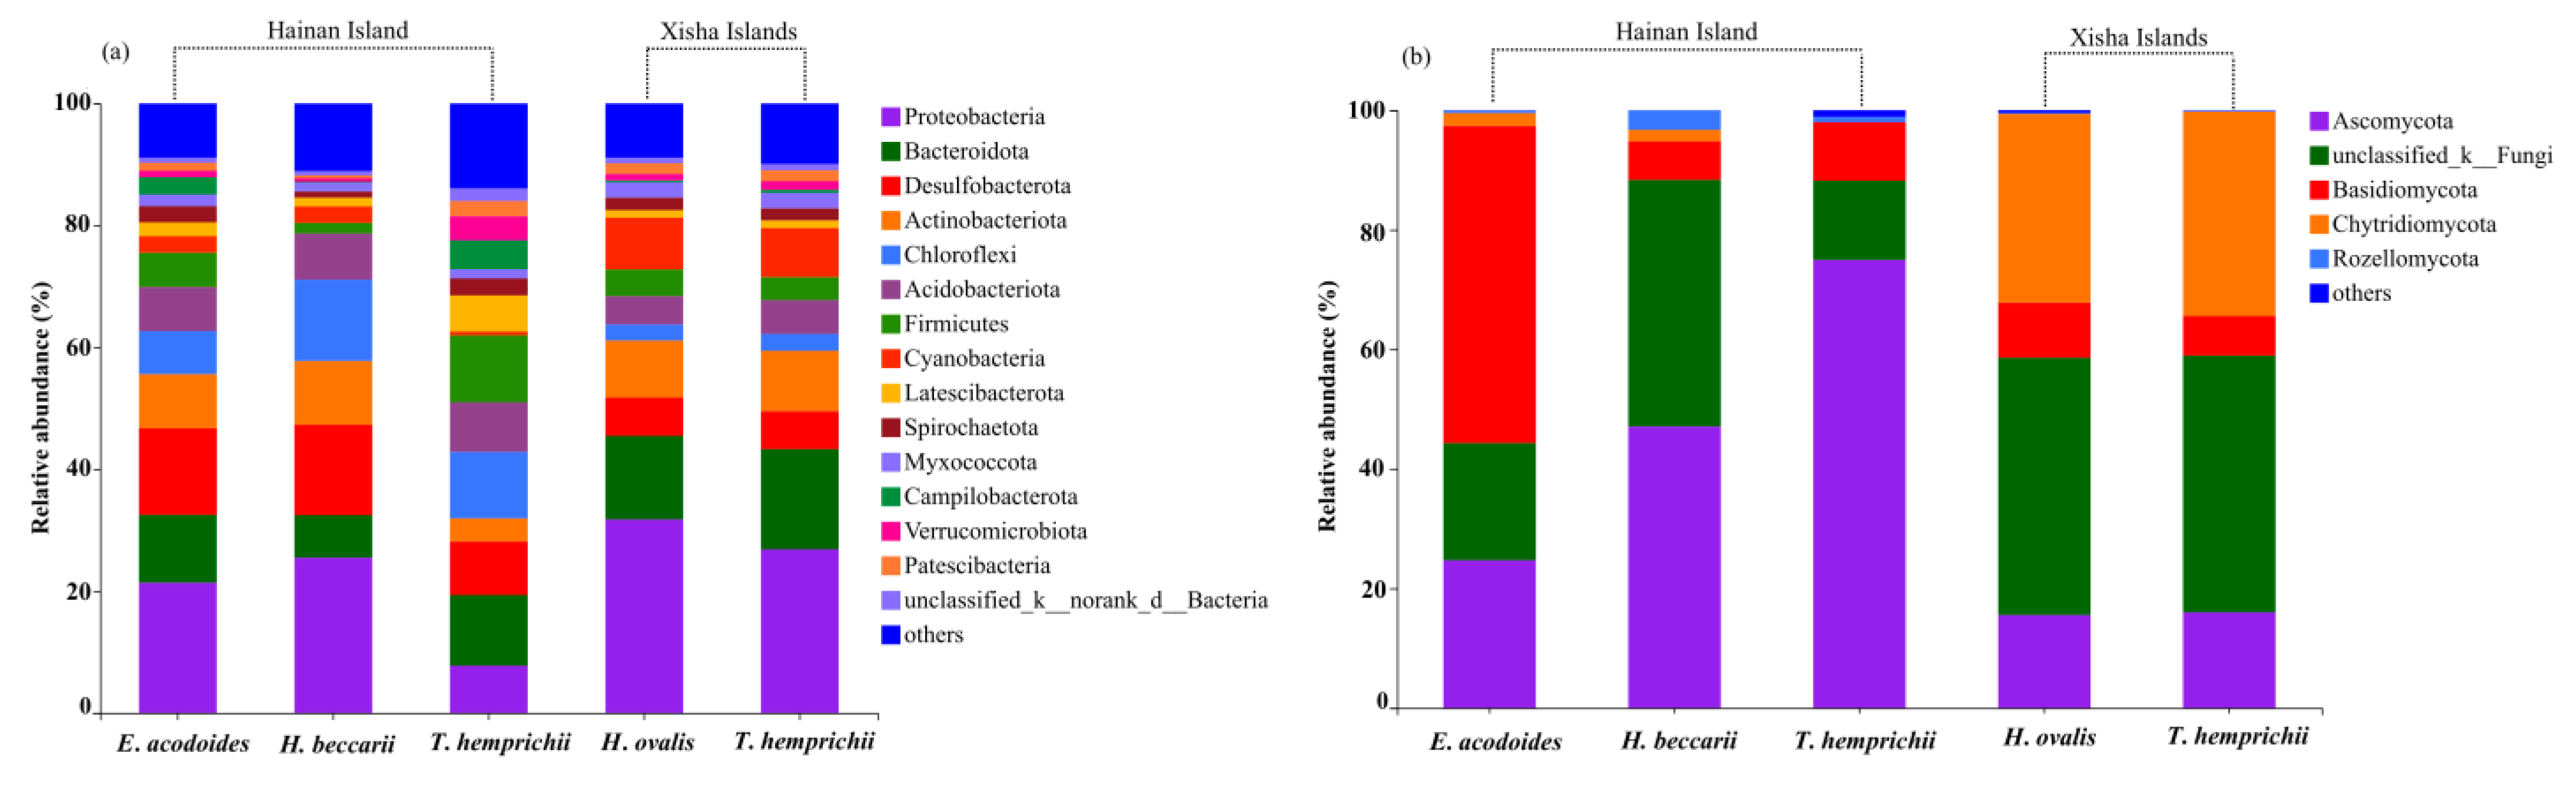
Proteobacteria (relative abundance, 7.84–31.70%) was the dominant bacteria in all seagrass beds, followed by Bacteroidota (6.98–16.50%), Desulfobacterota (6.18–14.78%), Actinobacteriota (3.78–10.47%), Chloroflexi (2.62–13.26%), Acidobacteriota (4.69–8.11%), Firmicutes (1.74–10.96%), Cyanobacteria (0.61–8.50%), Latescibacterota (1.24–5.92%), Spirochaetota (1.01–2.77%), Myxococcota (1.45–2.55%), Campilobacterota (0.15–4.75%), Verrucomicrobiota (0.57–3.91%) and Patescibacteria (0.48–2.51%) (Figure 4a). Among them, Desulfobacterota, Acidobacteriota, Chloroflexi, Latescibacterota and Campilobacterota presented more frequently on Hainan Island, and Proteobacteria, Bacteroidota, Cyanobacteria and Myxococcota prevailed on the Xisha Islands (t-test, p < 0.05, Table S5). Desulfobacterota, Latescibacterota and Campilobacterota were the dominant bacterial phylum of the E. acodoides bed, while T. hemprichii and Halophila sp. beds had the highest abundance of Bacteroidota and Cyanobacteria (ANOVA, p < 0.05, Table S5).
The most abundant fungal phyla in the seagrass sediments included Ascomycota (15.57–75.00%), Basidiomycota (6.41–53.06%), Chytridiomycota (0–34.24%) and Rozellomycota (0.12–3.34%) (Figure 4b). Ascomycota and Basidiomycota were more abundant on Hainan Island, while Chytridiomycota was highly presented on the Xisha Islands (t-test, p < 0.05, Table S5). The E. acodoides beds had the highest abundance of Basidiomycota (ANOVA, p < 0.05), the highest abundance of Chytridiomycota were detected in Halophila sp. and T. hemprichii beds (p < 0.05), while Ascomycota had similar proportions in the three seagrass beds (p > 0.05) (Table S5).
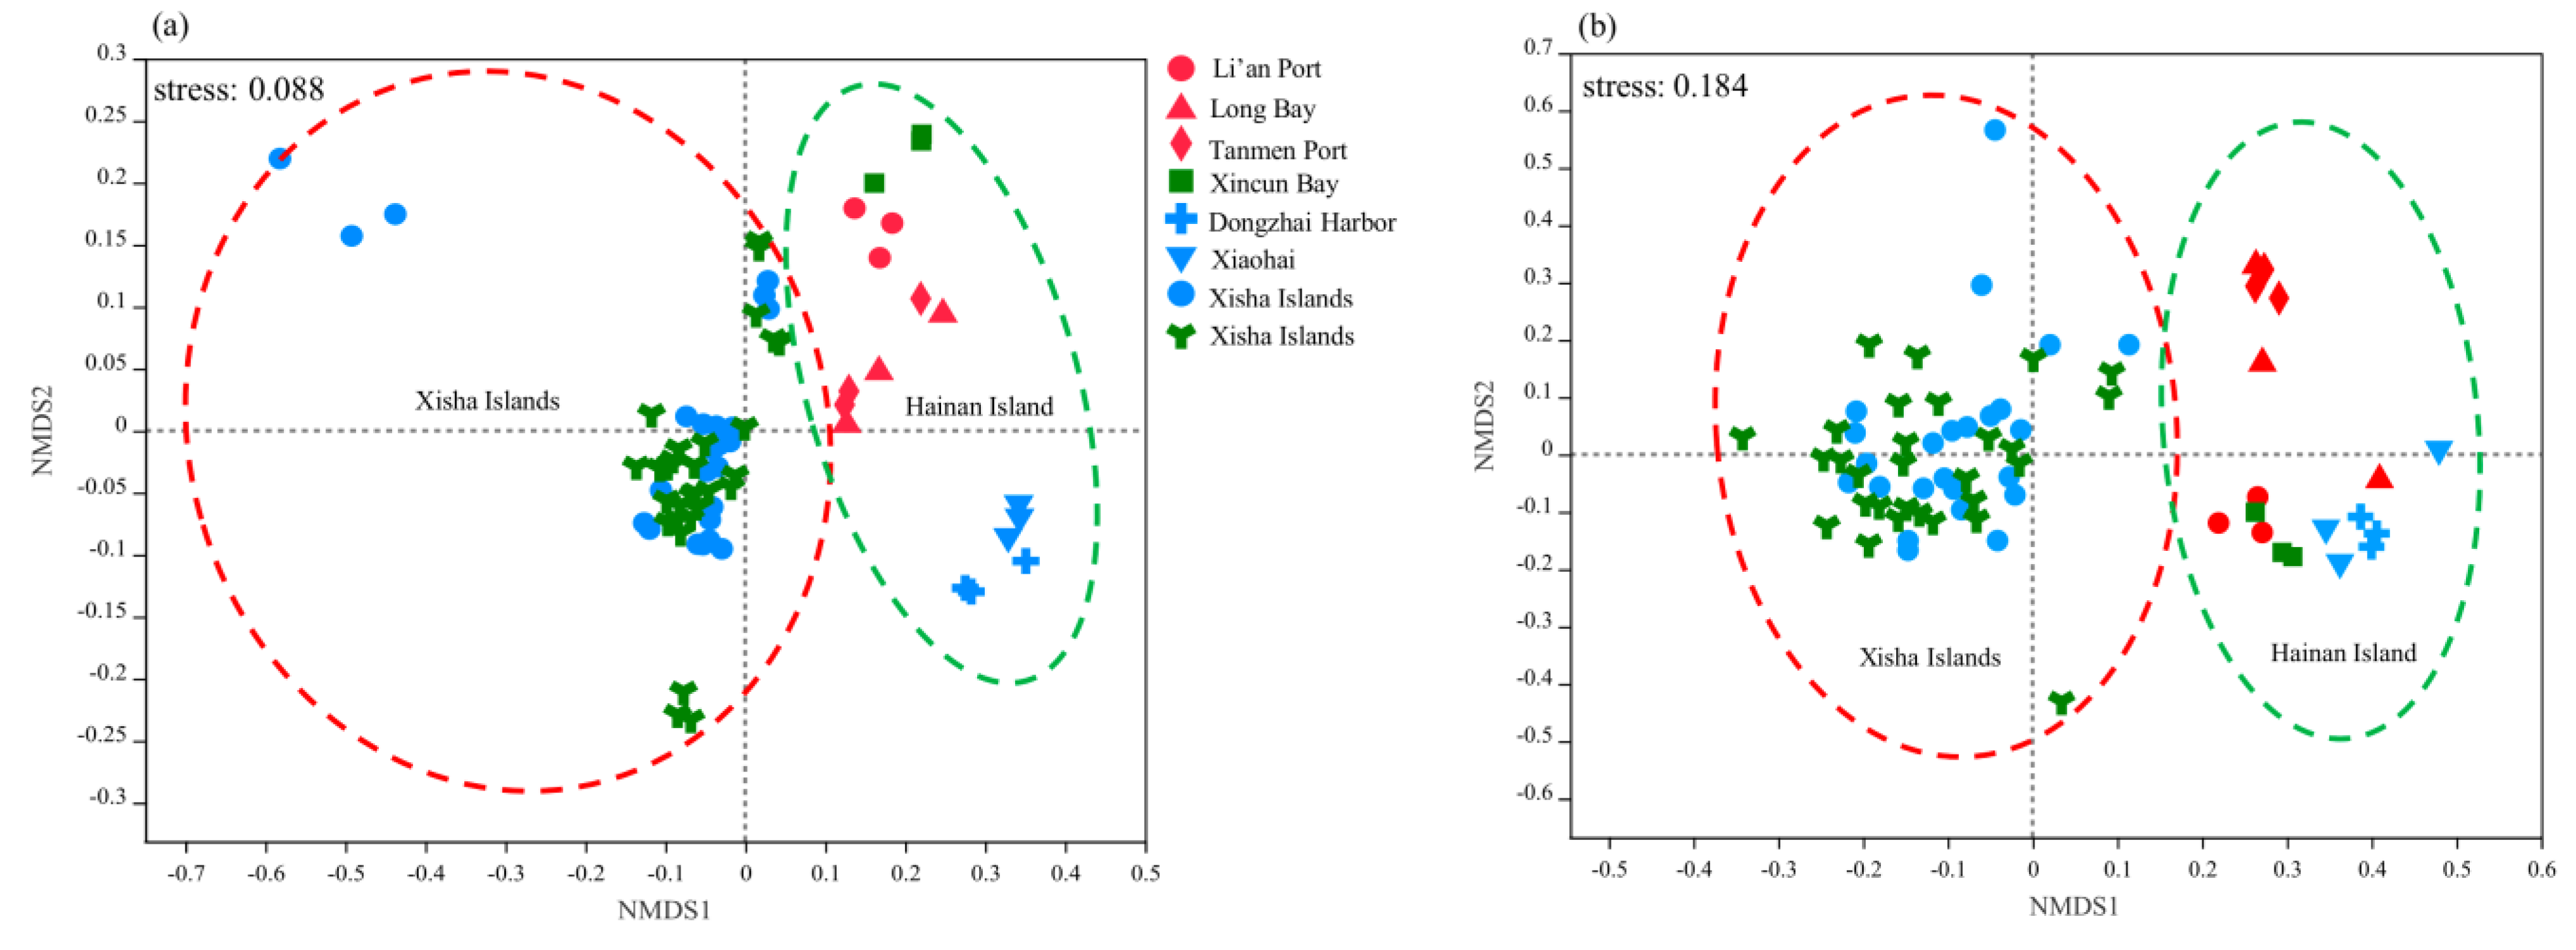
To investigate distribution patterns of bacterial and fungal communities, the NMDS analysis was performed (Figure 5). Both bacterial and fungal communities were primarily structured by study regions with communities on Hainan Island, clustered separately from those on the Xisha Islands across all samples (ANOSIM, p = 0.00, Table S6). However, compared with T. hemprichii, bacterial communities between E. acodoides and Halophila sp. beds were more homologous (ANOSIM, r = 0.09, p = 0.18) (Table S6). Similarly, we found that fungal communities between Halophila sp. and T. hemprichii beds were also more analogous (ANOSIM, r = 0.00, p = 0.34) (Table S6).
3.6. Bacterial Putative Metabolic Functions Involved in Carbon Cycle
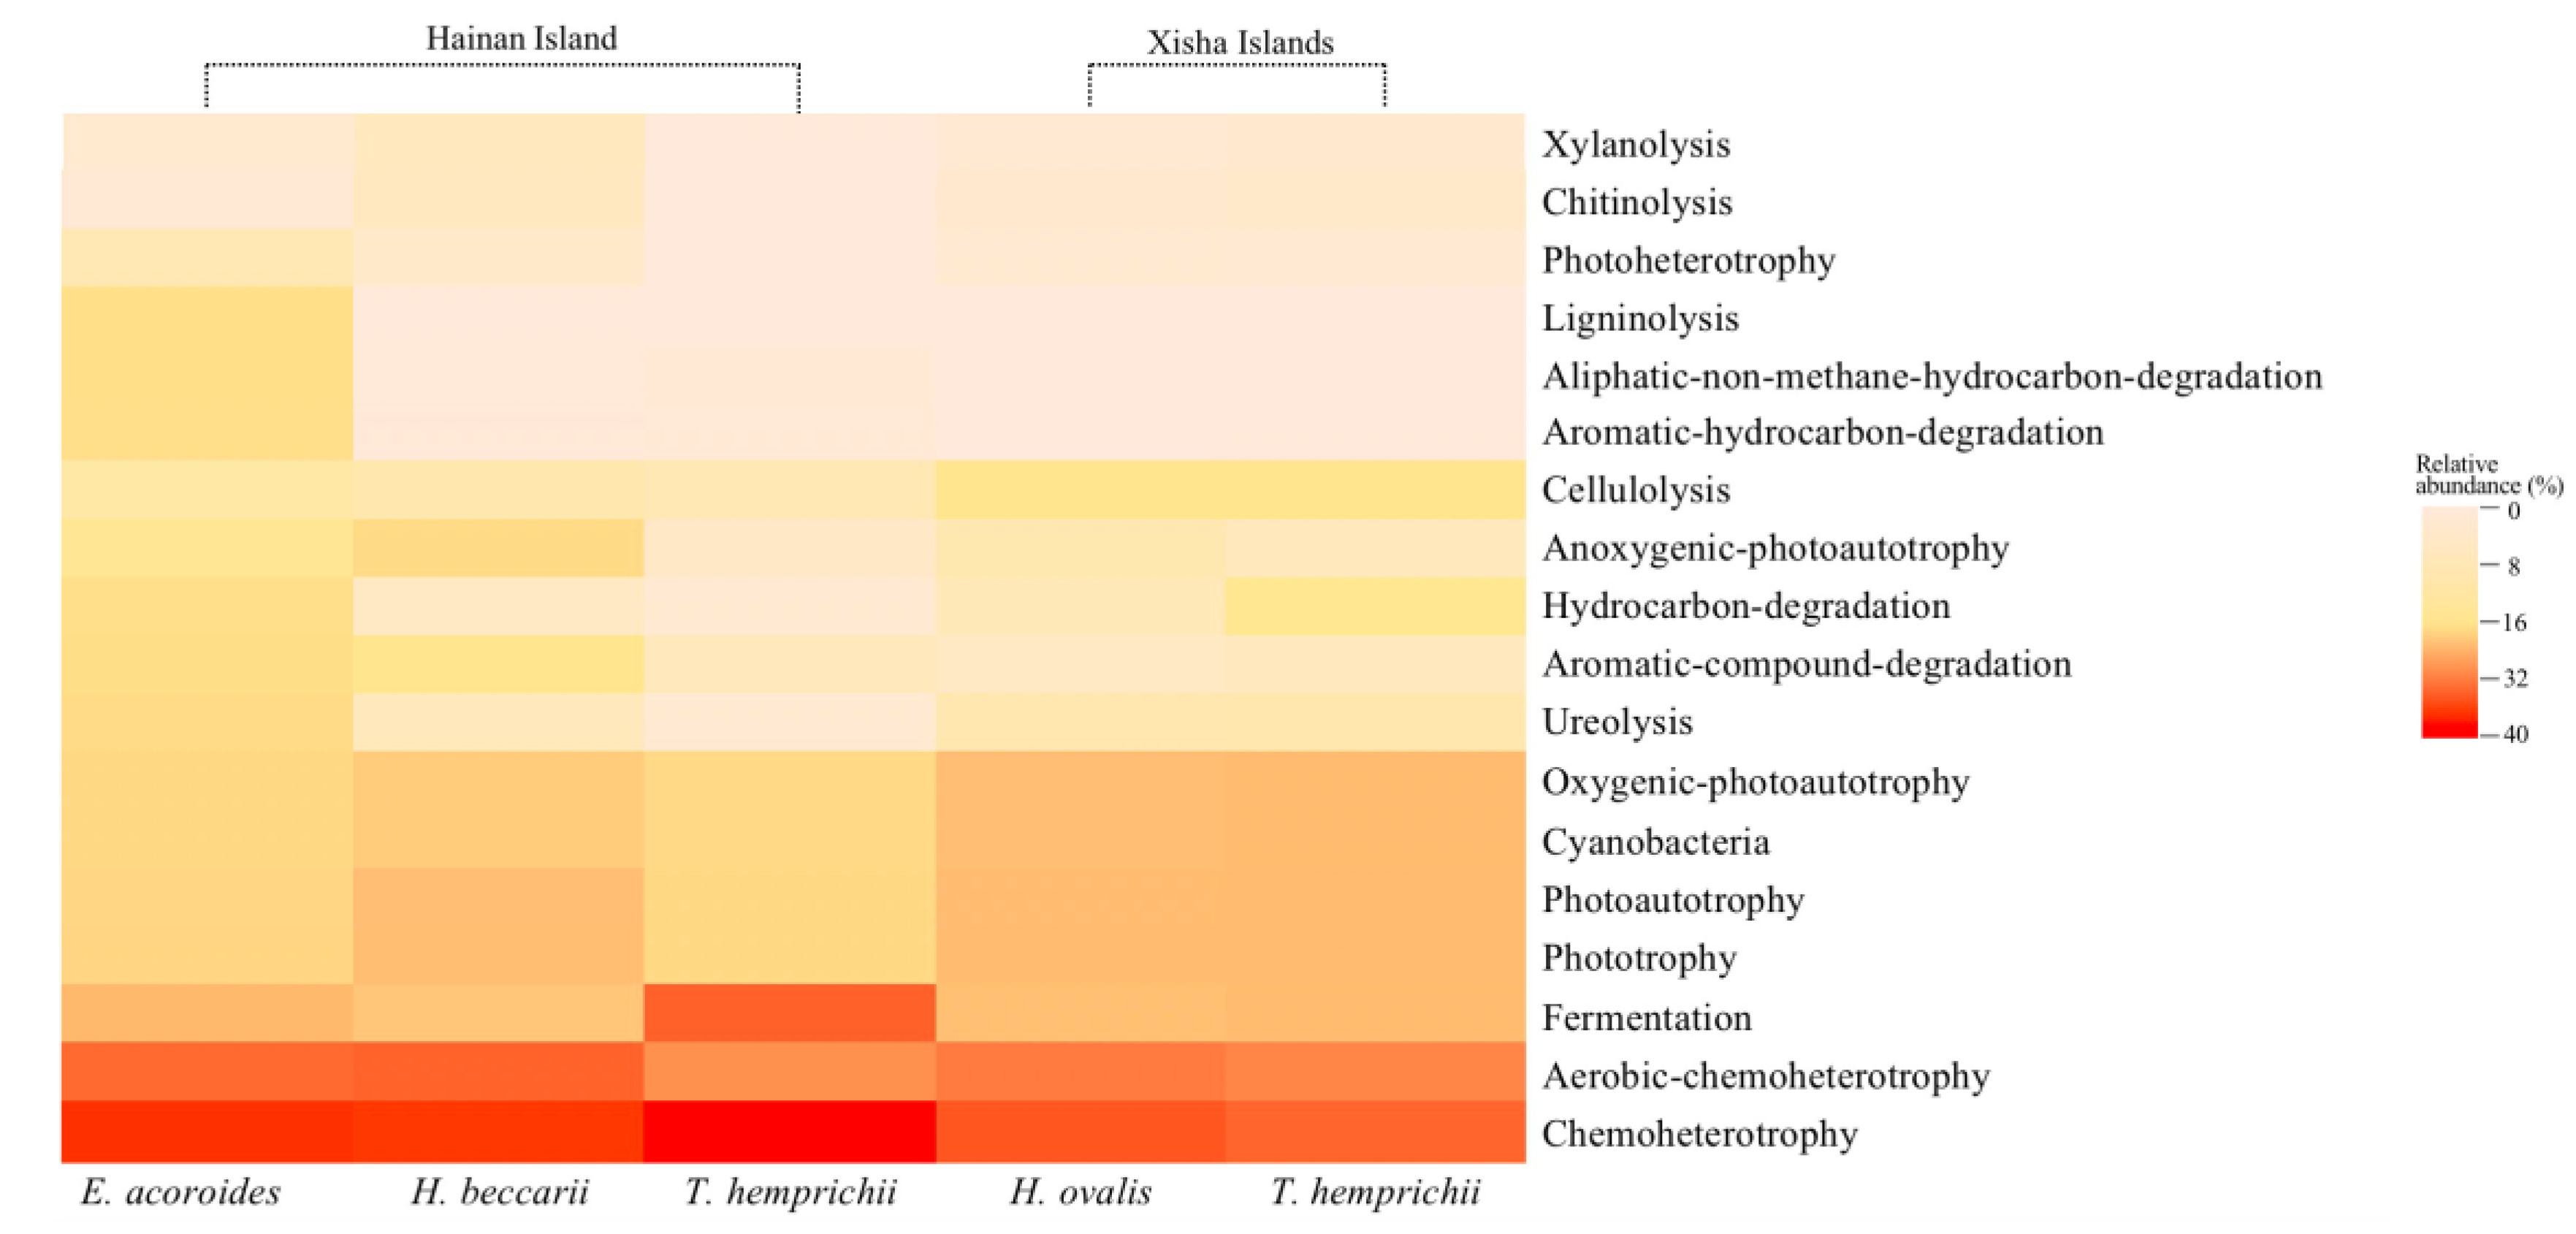
In the predicted bacteria-derived C cycle, chemoheterotrophy (21.97–29.05%) and aerobic-chemotherophy (15.82–20.33%) seemed to be the most active processes (Figure 6 and Table S7). Other active processes included fermentation (6.41–9.45%), phototrophy (3.09–7.31%), photoautotrophy (2.88–7.26%), oxygenic photoautotrophy (2.51–7.06%), ureolysis (0.22–1.80%), aromatic compound degradation (0.14–1.69%), hydrocarbon degradation (0.18–1.48%), and so on (Figure 6 and Table S7). The relative abundances of phototrophy, photoautotrophy, oxygenic photoautotrophy and cellulolysis were considerably higher on the Xisha Islands than on Hainan Island (p < 0.05, Table S7). However, more active chemoheterotrophy, aromatic compound degradation, aromatic hydrocarbon-degradation, anoxygenic photoautotrophy, aliphatic non-methane hydrocarbon degradation and ligninolysis were observed on Hainan Island compared with the Xisha Islands (p < 0.05, Table S7).
Among seagrass beds, the relative abundance of ureolysis, aromatic compound degradation, hydrocarbon degradation, aromatic hydrocarbon degradation, aliphatic non-methane hydrocarbon degradation, and ligninolysis were substantially higher in the E. acodoides bed than in other seagrass beds (p < 0.05), while that of oxygenic photoautotrophy and cellulolysis was highest in T. hemprichii beds (p < 0.05, Figure 6 and Table S7).
3.7. The Key Environmental Drivers of Sediment Cstocks
Pearson’s correlation demonstrated that both sediment Corg and Cstocks positively related to MOC and TN content (n = 26, r > 0.40, p < 0.01) (Table 3). However, Corg negatively correlated with sediment pH, grain size, DBD and seawater NH4+-N (r < −0.26, p < 0.05) (Table 3). Cstocks had a significant correlation with invertase activity (r = −0.22, p < 0.05) (Table 3). Moreover, sediment MOC appeared to increase with increasing sediment TN content, seawater N and P nutrients and seagrass below-ground tissue N (r > 0.23, p < 0.05), while decline with sediment pH, grain size and below-ground tissue C/N ratio (r < −0.24, p < 0.05). There was no significant correlation between any environmental factor determined and sediment DOC (p > 0.05, Table 3).
4. Discussion
It has been widely recognised that seagrass biomass is a determining predictor for sediments Corg [50]. A total of 30–70% of the seagrass structural carbohydrate is composed of cellulose and lignin [51], which are resistant to microbial decomposition, contributing importantly to sediment Corg storage [34]. In this study, the biomass of seagrass were much higher on Hainan Island than on the Xisha Islands (Figure 3), but the leaf and root C/N ratios on Hainan Island were lower compared with the Xisha Islands (Figure 3 and Table S3). These results support the conclusion that nutrient input improves seagrass primary productivity and biomass [21,22]. Moreover, nutrient enrichment could raise the nutrient content in seagrass [52,53], leading to lower C/N ratios in seagrass tissues. Theoretically, the sediment Cstocks in the seagrass beds of Hainan Island should be higher than that on the Xisha Islands, but actually, the average sediment Cstocks between the two regions was comparable (Figure 2 and Table S1), suggesting that seagrass productivity and biomass were not the only decisive factor for sediment Cstocks in these seagrass beds [54,55]. Consistent with our results, the seagrass beds in Florida Bay had extremely high carbon storage potential, even in nutrient-limited areas with low seagrass biomass or productivity [55].
In addition to seagrass biomass, nutrient inputs profoundly influenced the carbon storage of seagrass sediments [55]. We found that sediment MOC was considerably higher on Hainan Island (Figure 2), and positively correlated with seawater N and P nutrients (Table 3). Similarly, previous studies also proposed that an increase in seawater nutrient loads induced the increase of active organic carbon in seagrass beds [35,56]. Sediment MOC mainly consisted of low-molecular weight, relatively nutrient-rich organic carbon originating from sedimentary organic particles, algae detritus, seagrass faded tissues and root exudates. In the seagrass beds of Hainan Island, the N and P nutrient loading was accompanied by organic particles input, such as farming residual feed and excrement. Moreover, nutrient enrichment would lead to excess nutrients being stored in seagrass tissues as amino acids or proteins, and reduce the transfer of carbon from above-ground to below-ground tissues, thus increasing the proportion of labile organic carbon (LOC) in seagrass tissues [53,57]. Additionally, nutrient enrichment enhanced the release of dissolved organic matter from seagrass leaf litters [57]. All of these contribute to high sediment MOC in the eutrophic seagrass beds of Hainan Island. Nonetheless, ammonia enrichment appeared to reduce carbon storage in seagrass sediments [35,52], which was supported by the negative correlation between sediment Corg and seawater NH4+-N in our study (Table 3). As mentioned above, N enrichment induced a larger ratio of labile organic carbon pools into seagrass sediments, which is easily decomposed by microorganisms. On the other hand, the LOC supply can promote the degradation of recalcitrant organic carbon (ROC) through priming effects, that is, improving the enzyme activities and biomass of bacteria, and accelerating carbon efflux from the sediments [55].
Apart from seawater nutrients, sediment characteristics could regulate seagrass carbon sink potential [25,58]. Our results showed that sediment pH was significantly lower on Hainan Island than on the Xisha Islands (Figure 2 and Table S1), and negatively correlated with MOC, Corg and Cstocks (Table 3). Decomposition of labile organic matter enhanced the release of CO2, which apparently reduced the pH of sediments on Hainan Island. Furthermore, the ability of mineral phases to adsorb Corg intensively decreased with the increase in pH value [59]. Due to the sedimentation of amounts of allochthonous organic particles and hydrological and geological features, Hainan Island had finer sediments than the Xisha Islands (Figure 2 and Table S1) [38,60]. Sediment Corg and Cstocks were significantly negatively correlated with grain size (Table 3). Sediment grain size determined the sediment adsorption capacity of organic matter with finer sediments holding more organic matter [58]. Besides, the grain size was an important factor for regulating oxygen concentration in sediments, and indirectly influences microbial activities of degrading Corg [58,61]. Contrary to the negative effect of seawater N nutrients on sediment Cstocks, we were surprised to find that sediment TN content had significantly positive correlations with sediment Corg and Cstocks across all samples (Table 3). This result was in line with the results of Fourqurean et al. (2012) and Li (2018) [15,62]. Neff et al. (2002) reported that nitrogen addition strongly accelerated decomposition of LOC fraction, while further stabilizing the ROC fraction in heavier mineral-related compounds with multidecadal to century lifetimes [63]. In addition, some studies displayed that the increase of sediment TN significantly reduced the abundance and diversity of genes related to the production of extracellular enzymes involved in the degradation of ROC, resulting in a decrease in microbial activities, which then has a positive impact on sediment Cstocks [64,65]. Sediment enzymes were the direct executors of decomposing organic matter in sediments [32]. Among all enzymes determined in this study, the activity of invertase remarkably negatively correlated with sediment Cstocks (Table 3). Invertase could hydrolyze sucrose into glucose and fructose [45,66] and accelerate the loss of sediment organic carbon.
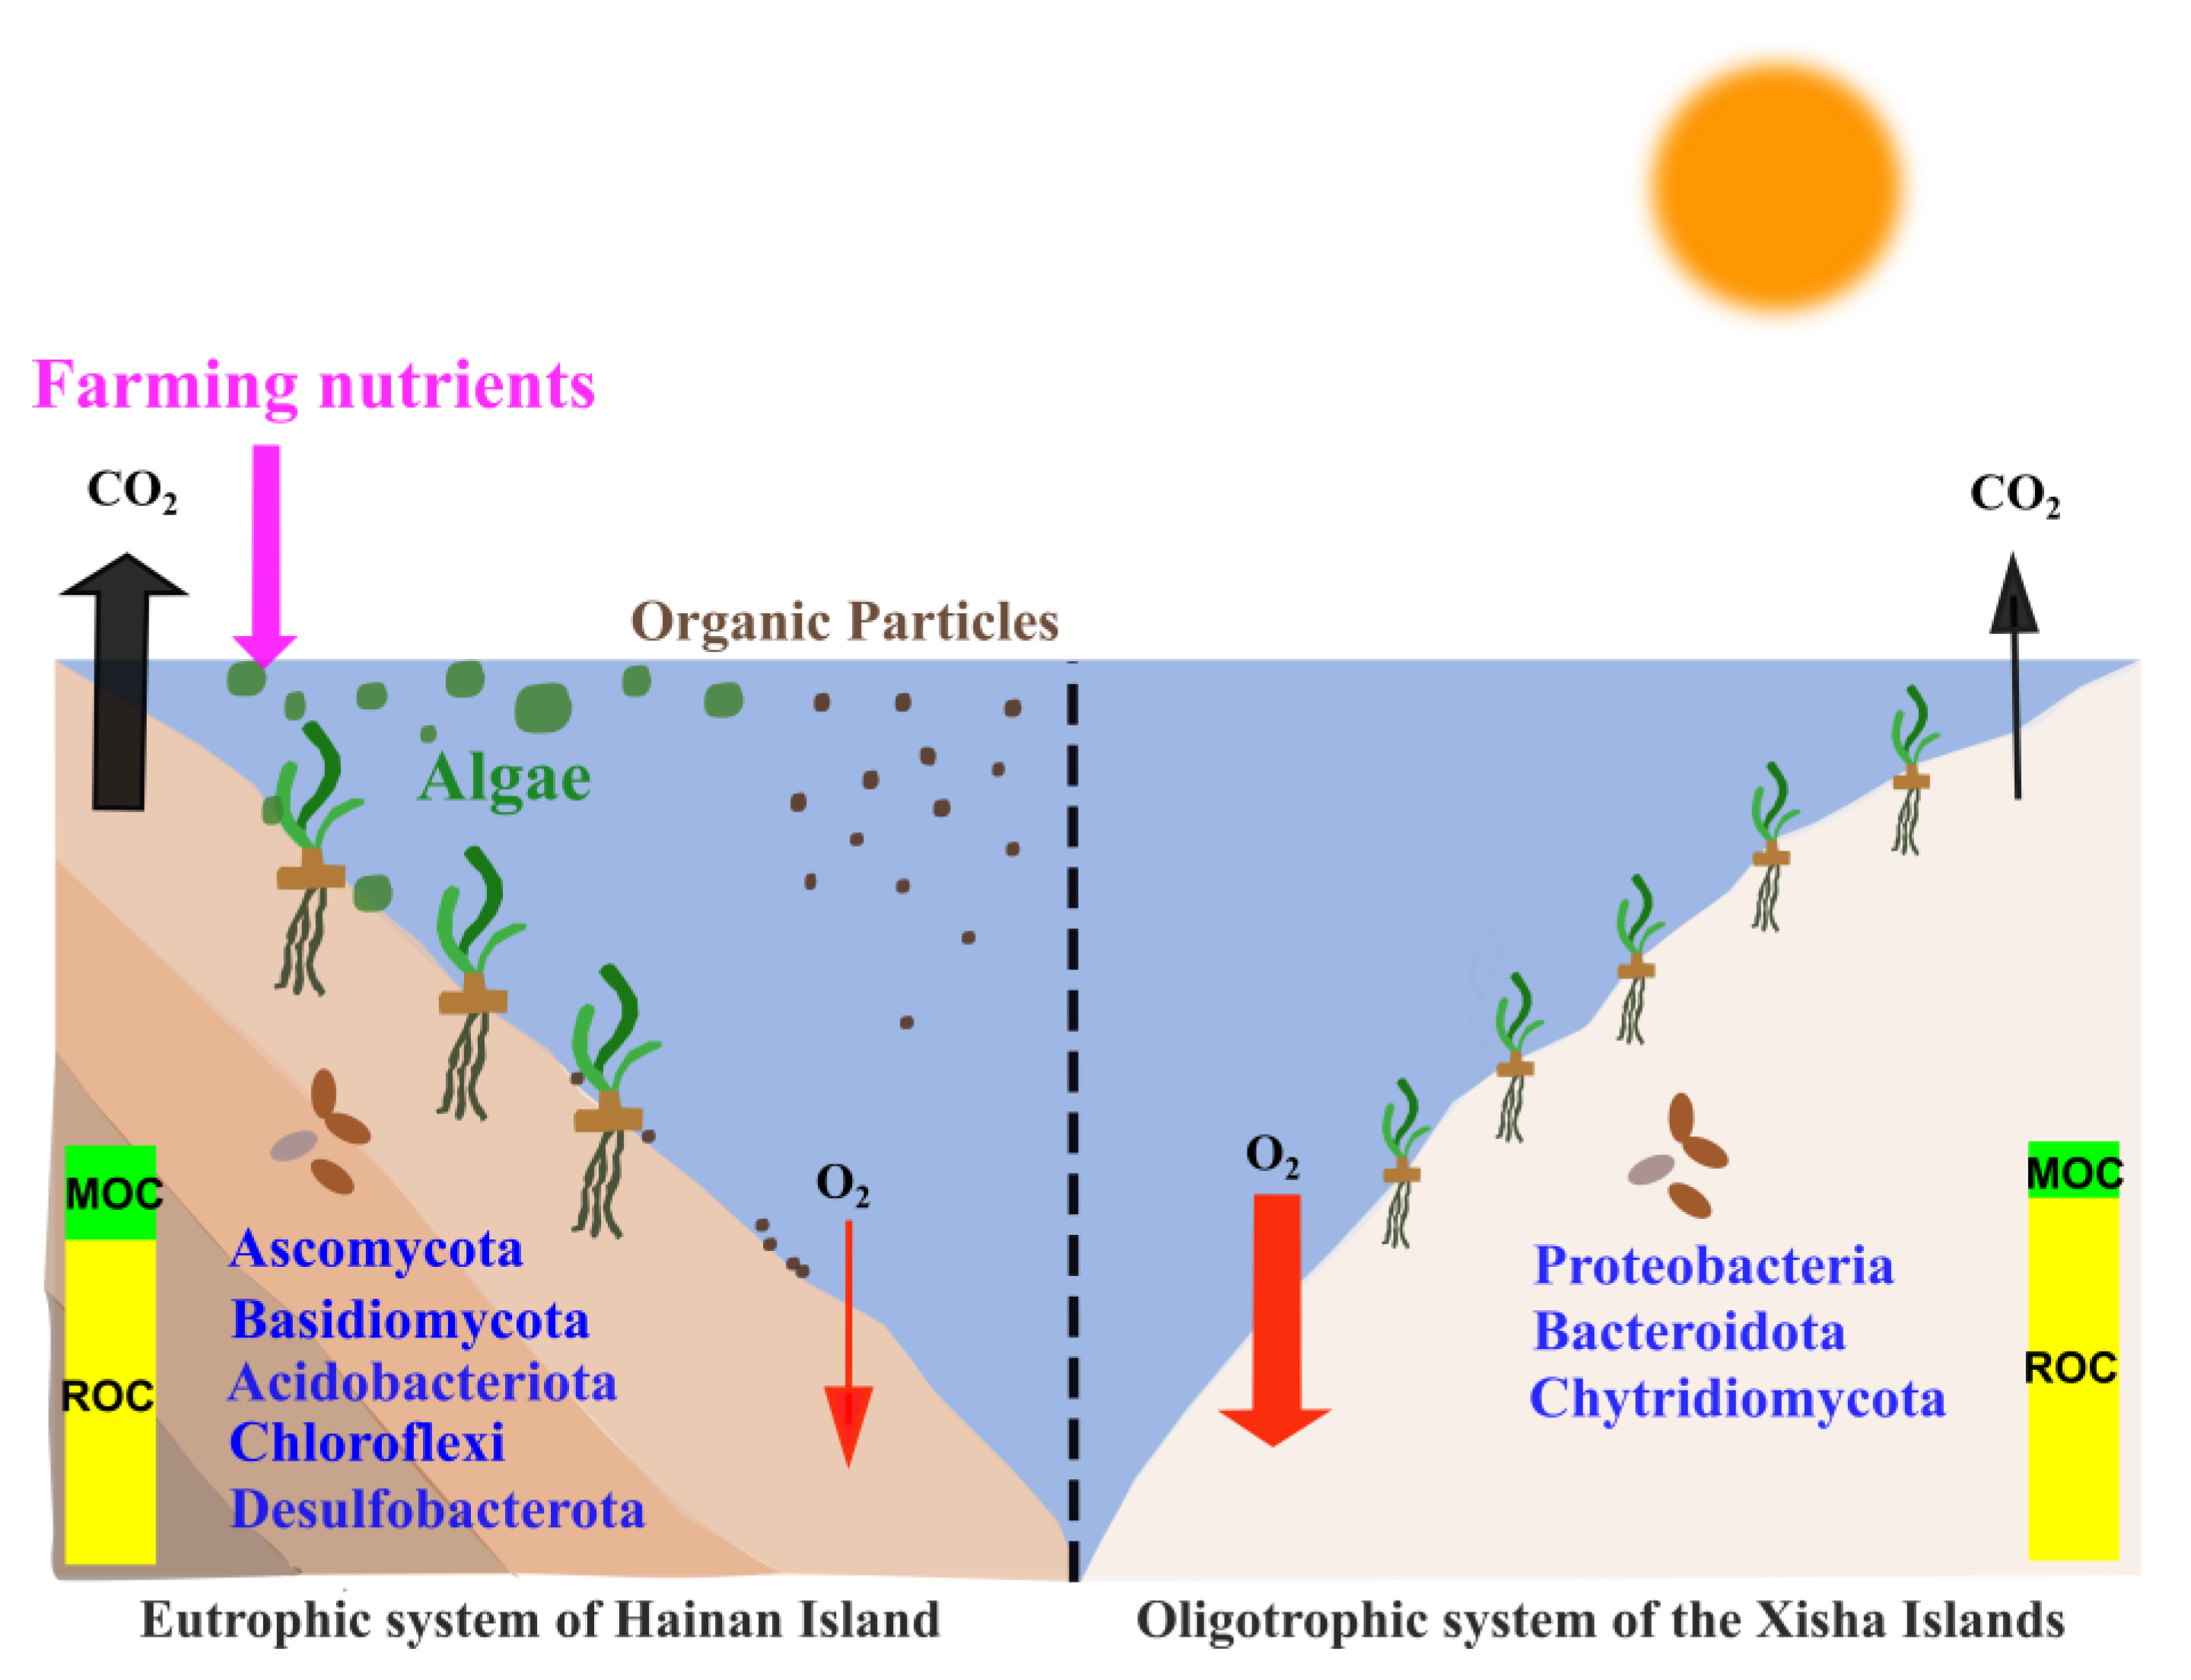
To our knowledge, this was the first study linking microbial communities and potential functions to sediment Cstocks in seagrass bed systems (Figure 7). Interestingly, our results showed that the fast-growing bacteria Proteobacteria were largely enriched (>29%) on the Xisha Islands (Figure 4a and Table S5). Proteobacteria primarily consumed more LOC, rather than ROC, by aerobic digestion [67,68]. In addition, the well-known ROC-degrading bacteria Bacteroidota (Bacteroidetes), which produces enzymes targeting complex organic polymers such as cellulose, hemicellulose, lignin and protein [69], occurred more frequently on the Xisha Islands (Figure 4a and Table S5). These bacterial groups could contribute significantly to carbon loss in the oligotrophic environment. On the contrary, Acidobacteriota, Chloroflexi and Desulfobacterota prevailed on Hainan Island (Figure 4a and Table S5). Trivedi et al. (2013) supplied a metagenomic evidence that higher sediment Corg was associated with bacterial communities dominated by Acidobacteriota, and showed that the group promoted sediment Cstocks not only due to its slow growth and lower metabolic activities, but also through the production of polysaccharides for sediment structural stability [67]. In the seagrass beds of Hainan Island, a high proportion of labile organic matter stimulated the growth and aerobic respiration of heterotrophic bacteria, consuming O2, and possibly leading to an anaerobic and reduced condition in sediments. Chloroflexi and the sulfate-reducing bacteria Desulfobacterota could degrade organic matter under anaerobic conditions [70,71], which was a low-efficiency way of consuming organic matter compared with aerobic digestion [72]; hence, more organic carbon could be retained in sediments in Hainan seagrass beds. FAPROTAX results further showed that a significantly higher proportion of phototrophy, photoautotrophy and cellulolysis (hydrolyzing cellulose, the main structure carbon of seagrass tissue) was present in the seagrass beds of the Xisha Islands (Figure 6 and Table S7); nonetheless, various carbon metabolic processes including aromatic compound/hydrocarbon degradation, ureolysis, and ligninolysis were more active in seagrass sediments of Hainan Island, suggesting that there were distinct carbon metabolic processes in seagrass sediments between the eutrophic and oligotrophic environments, and allochthonous organic matter contributed importantly to the sediment carbon pools of Hainan Island seagrass beds.
The fungal community impacts the decomposition of recalcitrant litter and carbon sequestration in sediments [73,74]. It was generally believed that fungi (particularly Ascomycota and Basidiomycota) dominated the decomposition of lignin, cellulose and hemi-cellulose, all of which were important components of Corg in seagrass bed systems [36,75,76,77]. In this study, we newly found distinctly higher fungal diversity and relative abundances of Ascomycota and Basidiomycota (30.29–40.54%) on Hainan Island compared with the Xisha Islands (7.76–15.81%) (Figure 4b and Table S5). This phenomenon could be attributed to high nutrients, seagrass biomass and sediment MOC on Hainan Island, since previous reports had suggested that nitrogen supplementation could stimulate fungal growth [78]. Conversely, Chytridiomycota dominated (more than 33%) fungal communities on the Xisha Islands (Figure 4b and Table S5), which was similar to the results found in Bohai and the North Yellow Sea [79]. Chytridiomycota or chytrids are a polyphyletic group of mobile water fungi that are pathogens of phytoplankton and amphibians [79,80,81]. Recently, a few studies have found Chytridiomycota in coral-associated fungi [82,83], which even accounted for a fairly high proportion (69.4%) of coral (Pocillopora) substrates revealed with 18S rDNA metabarcoding [83]; however, the ecological roles of chytrids in corals remain unknown. We speculated that the abundant Chytridiomycota in seagrass sediments of the Xisha Islands could be derived from coral substrates.
5. Conclusions
In the present study, we compared the sediment carbon stocks in seagrass beds between Hainan Island, which is affected by intense human activities, and the Xisha Islands, which have little human interference, and deeply analyzed the factors driving the distinction in sediment Cstocks between the two environments. We found that despite seagrass biomass being much higher on Hainan Island than on the Xisha Islands, the amount of sediment Cstocks was similar in the two regions. Apart from seagrass biomass, seawater nutrients, sediment properties and enzymes were involved in the regulation of sediment carbon storage. Importantly, we first explored the effects of sediment microbes on Cstocks in seagrass bed systems. It should be noted that although sediment Cstocks was comparable, Hainan Island had a significantly higher ratio of MOC/Corg in sediments than the Xisha Islands, meaning that carbon in Hainan Island seagrass beds was more likely to escape if the system was disturbed (Figure 7). Our study highlighted the mechanism of carbon storage in seagrass beds, which will be an important reference for evaluating the carbon sink capacity of seagrass systems, and informative for managing and conserving seagrass beds.
Supplementary Materials
The following supporting information can be downloaded at: https://www.mdpi.com/article/10.3390/pr11020456/s1. Table S1: Comparison of sediment characteristics of seagrass beds between Hainan Island and the Xisha Islands (t-test, mean ± S.E.), Table S2: Comparison of seagrass biomass between above-ground and below-ground tissues (t-test, mean ± S.E.), Table S3: Comparison of seagrass tissue biomass between Hainan Island and the Xisha Islands (t-test, mean ± S.E.), Table S4: Sediment enzyme activities of seagrass beds on Hainan Island and the Xisha Islands (mean ± S.E.), Table S5: Relative abundance (%) of the main bacterial and fungal phyla in seagrass bed sediments of Hainan Island and the Xisha Islands (mean ± S.E.), Table S6: ANOSIM analysis of bacterial (a) and fungal (b) communities among study regions and seagrass species, Table S7: Relative abundance (%) of predicted bacterial functions related to the carbon cycle in seagrass beds of Hainan Island and the Xisha Islands (mean ± S.E.), Figure S1: Variations of alkaline phosphatase (a), urease (b), invertase (c), cellulase (d) and polyphenol oxidase (e) activities in seagrass beds between Hainan Island and the Xisha Islands, and among different seagrass species (mean ± S.E.).
Author Contributions
Conceptualization, Q.H. and X.Z.; methodology, Q.H. and C.Q.; software, W.Z., M.Z. and Y.S.; validation, W.Z., M.Z. and Y.S.; formal analysis, W.Z., M.Z. and Y.S.; investigation, Q.H. and C.Q.; resources, S.C.; data curation, S.C.; writing—original draft preparation, Q.H. and C.Q.; writing—review and editing, Q.H. and X.Z.; project administration, Q.H. and S.C.; funding acquisition, Q.H. and S.C. All authors have read and agreed to the published version of the manuscript.
Funding
This research was funded by the projects of National Natural Science Foundation of China [41730529, 41676154, 42276161 and 42166006], and the High-Level Talented Person Project of Natural Science Foundation of Hainan Province [420RC657, 421RC662].
Institutional Review Board Statement
Not applicable.
Informed Consent Statement
Not applicable.
Data Availability Statement
Data will be available on request.
Conflicts of Interest
The authors declare no conflict of interest.
References
- Duarte, C.M. The future of seagrass meadows. Environ. Conserv. 2002, 29, 192–206. [Google Scholar] [CrossRef]
- Lee, C.L.; Lin, W.J.; Liu, P.J.; Shao, K.T.; Lin, H.J. Highly productive tropical seagrass beds support diverse consumers and a large organic carbon pool in the sediments. Diversity 2021, 13, 544. [Google Scholar] [CrossRef]
- Parrish, J.D. Fish communities of interacting shallow-water habitats in tropical oceanic regions. Mar. Ecol. Prog. Ser. 1989, 58, 143–160. [Google Scholar] [CrossRef]
- Connolly, R.; Jenkins, G.; Loneragan, N. Seagrass dynamics and fisheries sustainability. In Seagrass in Australia; Strategic Review and Development of an R&D Plan; Butler, A., Jernakoff, P., Eds.; CSIRO Publishing: Sydney, Australia, 1999; pp. 25–62. [Google Scholar]
- Orth, R.J.; Carruthers, T.J.B.; Dennison, W.C.; Duarte, C.M.; Fourqurean, J.W.; Heck, K.L., Jr.; Hughes, A.R.; Kendrick, G.A.; Kenworthy, W.J.; Olyarnik, S.; et al. A global crisis for seagrass ecosystems. BioScience 2006, 56, 987–996. [Google Scholar] [CrossRef]
- Adrinao, S.; Chiara, F.; Antonia, M. Sedimentation rates and erosion processes in the lagoon of Venice. Environ. Int. 2005, 31, 983–992. [Google Scholar] [CrossRef]
- Casal-Porras, I.; de los Santos, C.B.; Martins, M.; Santos, R.; Pérez-Lloréns, J.L.; Brun, F.G. Sedimentary organic carbon and nitrogen stocks of intertidal seagrass meadows in a dynamic and impacted wetland: Effects of coastal infrastructure constructions and meadow establishment time. J. Environ. Manag. 2022, 322, 115841. [Google Scholar] [CrossRef] [PubMed]
- Jiang, Z.J.; Li, L.L.; Fang, Y.; Lin, J.Z.; Liu, S.L.; Wu, Y.C.; Huang, X.P. Eutrophication reduced the release of dissolved organic carbon from tropical seagrass roots through exudation and decomposition. Mar. Environ. Res. 2022, 179, 105703. [Google Scholar] [CrossRef] [PubMed]
- Nellemann, C.; Corcoran, E.; Duarte, C.M.; Valdes, L.; De Young, C.; Fonseca, L.; Grimsditch, G. Blue Carbon: The Role of Healthy Oceans in Binding Carbon. A Rapid Response Assessment; United Nations Environment Programme: Nairobi, Kenya; GRID-Arendal: Arendal, Norway, 2009. [Google Scholar]
- Garrard, S.L.; Beaumont, N.J. The effect of ocean acidification on carbon storage and sequestration in seagrass beds; a global and UK context. Mar. Pollut. Bull. 2014, 86, 138–146. [Google Scholar] [CrossRef]
- Kennedy, H.; Beggins, J.; Duarte, C.M.; Fourqurean, J.W.; Holmer, M.; Marbà, N.; Middelburg, J.J. Seagrass sediments as a global carbon sink: Isotopic constraints. Glob. Biogeochem. Cycles 2010, 24, 6696–6705. [Google Scholar] [CrossRef]
- McLeod, E.; Chmura, G.L.; Bouillon, S.; Salm, R.; Björk, M.; Duarte, C.M.; Lovelock, C.E.; Schlesinger, W.H.; Silliman, B.R. A blueprint for blue carbon: Toward an improved understanding of the role of vegetated coastal habitats in sequestering CO2. Front. Ecol. Environ. 2011, 9, 552–560. [Google Scholar] [CrossRef] [Green Version]
- Duarte, C.M.; Losada, I.J.; Hendriks, I.E.; Mazarrasa, I.; Marbà, N. The role of coastal plant communities for climate change mitigation and adaptation. Nat. Clim. Chang 2013, 3, 961–968. [Google Scholar] [CrossRef]
- Howard, J.; Sutton-Grier, A.; Herr, D.; Kleypas, J.; Landis, E.; Mcleod, E. Clarifying the role of coastal and marine systems in climate mitigation. Front. Ecol. Environ. 2017, 15, 42–50. [Google Scholar] [CrossRef]
- Fourqurean, J.W.; Duarte, C.M.; Kennedy, H.; Marbà, N.; Holmer, M.; Mateo, M.A.; Apostolaki, E.T.; Kendrick, G.A.; Krause-Jensen, D.; McGlathery, K.J.; et al. Seagrass ecosystems as a globally significant carbon stock. Nat. Geosci. 2012, 5, 505–509. [Google Scholar] [CrossRef]
- Duarte, C.M.; Kennedy, H.; Marbà, N.; Hendriks, I. Assessing the capacity of seagrass meadows for carbon burial: Current limitations and future strategies. Ocean Coast. Manag. 2013, 83, 32–38. [Google Scholar] [CrossRef]
- Huang, Y.H.; Lee, C.L.; Chung, C.Y.; Hsiao, S.C.; Lin, H.J. Carbon budgets of multispecies seagrass beds at Dongsha Island in the South China Sea. Mar. Environ. Res. 2015, 106, 92–102. [Google Scholar] [CrossRef] [PubMed]
- Lima, M.A.C.; Raymond, D.W.; Chris, B.J. Environmental drivers of sediment carbon storage in temperate seagrass meadows. Hydrobiologia 2020, 847, 1773–1792. [Google Scholar] [CrossRef]
- Cuellar-Martinez, T.; Ruiz-Fernández, A.C.; Sanchez-Cabeza, J.A.; Pérez-Bernal, L.H.; Sandoval-Gil, J. Relevance of carbon burial and storage in two contrasting blue carbon ecosystems of a north-east Pacific coastal lagoon. Sci. Total Environ. 2019, 675, 581–593. [Google Scholar] [CrossRef] [PubMed]
- Potouroglou, M.; Whitlock, D.; Milatovic, L.; MacKinnon, G.; Kennedy, H.; Diele, K.; Huxham, M. The sediment carbon stocks of intertidal seagrass meadows in Scotland. Estuar. Coast. Shelf Sci. 2021, 258, 107442. [Google Scholar] [CrossRef]
- Madsen, J.D.; Chambers, P.A.; James, W.F.; Koch, E.W.; Westlake, D.F. The interaction between water movement, sediment dynamics and submersed macrophytes. Hydrobiologia 2001, 444, 71–84. [Google Scholar] [CrossRef]
- Gacia, E.; Duarte, C.M.; Middelburg, J.J. Carbon and nutrient deposition in the Mediterranean seagrass (Posidonia oceanica). Limnol. Oceanogr. 2002, 47, 23–32. [Google Scholar] [CrossRef]
- Leoni, V.; Vela, A.; Pasqualini, V.; Pergent-Martini, C.; Pergent, G. Effects of experimental reduction of light and nutrient enrichments (N and P) on seagrasses: A review. Aquat. Conserv. 2008, 18, 202–220. [Google Scholar] [CrossRef]
- Jiang, Z.; Huang, X.; Zhang, J. Effect of nitrate enrichment and salinity reduction on the seagrass Thalassia hemprichii previously grown in low light. J. Exp. Mar. Biol. Ecol. 2013, 443, 114–122. [Google Scholar] [CrossRef]
- Dahl, M.; Deyanova, D.; Gütschow, S.; Asplund, M.E.; Lyimo, L.D.; Karamfilov, V.; Santos, R.; Björk, M.; Gullström, M. Sediment properties as important predictors of carbon storage in Zostera marina meadows: A comparison of four european areas. PLoS ONE 2016, 11, e0167493. [Google Scholar] [CrossRef]
- Fontaine, S.; Mariotti, A.; Abbadie, L. The priming effect of organic matter: A question of microbial competition? Soil Biol. Biochem. 2003, 35, 837–843. [Google Scholar] [CrossRef]
- Carney, K.M.; Hungate, B.A.; Drake, B.G.; Megonigal, J.P. Altered soil microbial community at elevated CO2 leads to loss of soil carbon. Proc. Natl. Acad. Sci. USA 2007, 104, 4990–4995. [Google Scholar] [CrossRef]
- Serrano, O.; Ricart, A.M.; Lavery, P.S.; Mateo, M.A.; Arias-Ortiz, A.; Masque, P.; Steven, A.; Duarte, C.M. Key biogeochemical factors affecting soil carbon storage in Posidonia meadows. Biogeosciences 2016, 13, 4581–4594. [Google Scholar] [CrossRef]
- Samper-Villarreal, J.; Mumby, P.J.; Saunders, M.I.; Roelfsema, C.; Lovelock, C.E. Seagrass organic carbon stocks show minimal variation over short time scales in a heterogenous subtropical seascape. Estuar. Coast. 2018, 41, 1732–1743. [Google Scholar] [CrossRef]
- Chambers, L.G.; Guevara, R.; Boyer, J.N.; Troxler, T.G.; Davis, S.E. Effects of salinity and inundation on microbial community structure and function in a mangrove peat soil. Wetlands 2016, 36, 361–371. [Google Scholar] [CrossRef]
- Yang, J.J.; Li, A.; Yang, Y.F.; Li, G.H.; Zhang, F. Soil organic carbon stability under natural and anthropogenic-induced perturbations. Earth Sci. Rev. 2020, 205, 103199. [Google Scholar] [CrossRef]
- Karaca, A.; Cetin, S.C.; Turgay, O.C.; Kizilkaya, R. Soil enzymes as indication of soil quality. In Soil Enzymology; Shukla, G., Varma, A.A., Eds.; Springer: Berlin/Heidelberg, Germany, 2011; pp. 119–148. [Google Scholar]
- Li, X.; Hou, L.; Liu, M.; Lin, X.; Li, Y.; Li, S. Primary effects of extracellular enzyme activity and microbial community on carbon and nitrogen mineralization in estuarine and tidal wetlands. Appl. Biochem. Biotechnol. 2015, 99, 2895–2909. [Google Scholar] [CrossRef]
- Jones, W.B.; Cifuentes, L.A.; Kaldy, J.E. Stable carbon isotope evidence for coupling between sedimentary bacteria and seagrasses in a sub-tropical lagoon. Mar. Ecol. Prog. Ser. 2003, 255, 15–25. [Google Scholar] [CrossRef]
- Holmer, M.; Duarte, C.M.; Boschker, H.T.S. Carbon cycling and bacterial carbon sources in pristine and impacted Mediterranean seagrass sediments. Aquat. Microb. Ecol. 2004, 36, 227–237. [Google Scholar] [CrossRef]
- de Boer, W.; Folman, L.B.; Summerbell, R.C.; Boddy, L. Living in a fungal world: Impact of fungi on soil bacterial niche development. FEMS Microbiol. Rev. 2005, 29, 795–811. [Google Scholar] [CrossRef] [PubMed]
- Jiang, Z.J.; Liu, S.L.; Zhang, J.P.; Zhao, C.Y.; Wu, Y.C.; Yua, S.; Zhanga, X.; Huangd, C.; Huang, X.P.; Kumare, M. Newly discovered seagrass beds and their potential for blue carbon in the coastal seas of Hainan Island, South China Sea. Mar. Pollut. Bull. 2017, 125, 513–521. [Google Scholar] [CrossRef] [PubMed]
- Jiang, Z.J.; Zhao, C.Y.; Yu, S.; Liu, S.L.; Cui, L.J.; Wu, Y.C.; Fang, Y.; Huang, X.P. Contrasting root length, nutrient content and carbon sequestration of seagrass growing in offshore carbonate and onshore terrigenous sediments in the South China Sea. Sci. Total Environ. 2019, 662, 151–159. [Google Scholar] [CrossRef] [PubMed]
- Wu, Z.J.; Chen, S.Q.; Cai, Z.F.; Shen, J.; Luo, L.Z.; Wang, D.R. Distribution and restoration of seagrass beds in Hainan Island. Mar. Environ. Sci. 2021, 40, 542–549. (In Chinese) [Google Scholar]
- Xing, F.W.; Li, Z.X.; Ye, H.G.; Chen, B.H.; Wu, D.L. Floristic geography of Xisha Islands in China. Trop. Geogr. 1993, 13, 250–257. (In Chinese) [Google Scholar]
- Howard, J.; Hoyt, S.; Isensee, K.; Telszewski, M.; Pidgeon, E. Coastal Blue Carbon: Methods for Assessing Carbon Stocks and Emissions Factors in Mangroves, Tidal Salt Marshes, and Seagrasses; Conservation International: Arlington, VA, USA; Intergovernmental Oceanographic Commission of UNESCO: Paris, France; International Union for Conservation of Nature: Gland, Switzerland, 2014. [Google Scholar]
- Singh, B.; Ryden, J.C.; Whitchead, D.C. Some relationships between denitrification potential and fractions of organic carbon in air-dried and field-moist soils. Soil Biol. Biochem. 1988, 20, 737–741. [Google Scholar] [CrossRef]
- Blair, G.J.; Lefroy, R.D.B.; Lisle, L. Soil carbon fractions based on their degree of oxidation, and the development of a carbon management index for agricultural systems. Aust. J. Agric. Res. 1995, 46, 1459–1466. [Google Scholar] [CrossRef]
- Yin, R.; Deng, H.; Wang, H.L.; Zhang, B. Vegetation type affects soil enzyme activities and microbial functional diversity following re-vegetation of a severely eroded red soil in sub-tropical China. Catena 2014, 115, 96–103. [Google Scholar] [CrossRef]
- Shao, X.X.; Yang, W.Y.; Wu, M. Seasonal dynamics of soil labile organic carbon and enzyme activities in relation to vegetation types in Hangzhou Bay tidal flat wetland. PLoS ONE 2015, 10, e0142677. [Google Scholar] [CrossRef] [PubMed]
- Zhao, M.Q.; Wang, H.; Wang, S.; Han, Q.Y.; Shi, Y.F. Phosphorus forms in the sediment of seagrass meadows affected mainly by fungi rather than bacteria: A preliminary study based on 31P-NMR and high-throughput sequencing. Oceanol. Hydrobiol. St. 2020, 49, 408–420. [Google Scholar] [CrossRef]
- Kwak, S.N.; Park, J.M.; Im, S.O.; Jawad, L.A. Influences of diel and tidal cycles on fish assemblage in eelgrass (Zostera marina) bed of southern Korea during autumn. Acta Oceanol. Sin. 2018, 37, 40–47. [Google Scholar] [CrossRef]
- Liu, S.L.; Jiang, Z.J.; Wu, Y.C.; Deng, Y.Q.; Chen, Q.M.; Zhao, C.Y.; Cui, L.J.; Huang, X.P. Macroalgae bloom decay decreases the sediment organic carbon sequestration potential in tropical seagrass meadows of the South China Sea. Mar. Pollut. Bull. 2019, 138, 598–603. [Google Scholar] [CrossRef]
- Louca, S.; Parfrey, L.W.; Doebeli, M. Decoupling function and taxonomy in the global ocean microbiome. Science 2016, 353, 1272–1277. [Google Scholar] [CrossRef] [PubMed]
- Gullström, M.; Lyimo, L.D.; Dahl, M.; Samuelsson, G.S.; Eggertsen, M.; Anderberg, E.; Rasmusson, L.M.; Linderholm, H.W.; Knudby, A.; Bandeira, S.; et al. Blue carbon storage in tropical seagrass meadows relates to carbonate stock dynamics, plant-sediment processes, and landscape context: Insights from the western indian ocean. Ecosystems 2018, 21, 551–566. [Google Scholar] [CrossRef]
- Trevathan-Tackett, S.M.; Kelleway, J.J.; Macreadie, P.I.; Beardall, J.; Ralph, P.; Bellgrove, A. Comparison of marine macrophytes for their contributions to blue carbon sequestration. Ecology 2016, 96, 3034–3057. [Google Scholar] [CrossRef]
- Macreadie, P.I.; Allen, K.; Kelaher, B.P.; Ralph, P.J.; Skilbeck, C.G. Paleoreconstruction of estuarine sediments reveal human-induced weakening of coastal carbon sink. Glob. Change Biol. 2012, 8, 891–901. [Google Scholar] [CrossRef]
- Jiang, Z.J.; Liu, S.L.; Zhang, J.P.; Wu, Y.C.; Zhao, C.Y.; Lian, Z.L.; Huang, X.P. Eutrophication indirectly reduced carbon sequestration in a tropical seagrass bed. Plant Soil 2018, 426, 135–152. [Google Scholar] [CrossRef]
- Campbell, J.E.; Lacey, E.A.; Decker, R.A.; Crooks, S.; Fourqurean, J.W. Carbon storage in seagrass beds of Abu Dhabi, United Arab Emirates. Estuar. Coasts 2015, 38, 242–251. [Google Scholar] [CrossRef]
- Armitage, A.R.; Fourqurean, J.W. Carbon storage in seagrass soils: Long-term nutrient history exceeds the effects of near-term nutrient enrichment. Biogeosciences 2016, 13, 313–321. [Google Scholar] [CrossRef]
- Zhang, J.P.; Huang, X.P.; Jiang, Z.J. Physiological responses of the seagrass Thalassia hemprichii (Ehrenb.) Aschers as indicators of nutrient loading. Mar. Pollut. Bull. 2014, 83, 508–515. [Google Scholar] [CrossRef] [PubMed]
- Invers, O.; Kraemer, G.P.; Perez, M.; Romero, J. Effects of nitrogen addition on nitrogen metabolism and carbon reserves in the temperate seagrass Posidonia oceanica. J. Exp. Mar. Biol. Ecol. 2004, 303, 97–114. [Google Scholar] [CrossRef]
- Mazarrasa, I.; Samper-Villarreal, J.; Serrano, O.; Lavery, P.S.; Lovelock, C.E.; Marba, N.; Duarte, C.M. Habitat characteristics provide insights of carbon storage in seagrass meadows. Mar. Pollut. Bull. 2018, 134, 106–117. [Google Scholar] [CrossRef] [PubMed]
- Avena, M.J.; Koopal, L.K. Kinetics of humic acids adsorption at solid-water interfaces. Environ. Sci. Technol. 1999, 33, 2739–2744. [Google Scholar] [CrossRef]
- Ye, J.Z. Environmental hydrologic features of the Xisha Archipelago. Acta Sci. Nat. Univ. Sunyatseni 1996, S1, 19–25. (In Chinese) [Google Scholar]
- Enriquez, S.; Duarte, C.M.; Sand-Jensen, K. Patterns in decomposition rates among photosynthetic organisms: The importance of detritus C:N:P content. Oecologia 1993, 94, 457–471. [Google Scholar] [CrossRef]
- Li, M. Carbon Storage in the Seagrass Sediments of Guangxi, China. Master’s Thesis, Guangxi Normal University, Guangxi, China, 2018. (In Chinese). [Google Scholar]
- Neff, J.C.; Townsend, A.R.; Gleixner, G.; Lehman, S.J.; Turnbull, J.; Bowman, W.D. Variable effects of nitrogen additions on the stability and turnover of soil carbon. Nature 2002, 419, 915–917. [Google Scholar] [CrossRef]
- Fierer, N.; Lauber, C.L.; Ramirez, K.S.; Zaneveld, J.; Bradford, M.A.; Knight, R. Comparative metagenomics, phylogenetic, and physiological analyses of soil microbial communities across nitrogen gradients. ISME J. 2012, 6, 1007–1017. [Google Scholar] [CrossRef]
- Eisenlord, S.D.; Freedman, Z.; Zak, D.R.; Xue, K.; He, Z.; Zhou, J.Z. Microbial mechanisms mediating increased soil C storage under elevated atmospheric N deposition. Appl. Environ. Microbiol. 2013, 79, 1191–1199. [Google Scholar] [CrossRef]
- Waldrop, M.P.; Zak, D.R.; Sinsabaugh, R.L. Microbial community response to nitrogen deposition in northern forest ecosystems. Soil Biol. Biochem. 2004, 36, 1443–1451. [Google Scholar] [CrossRef]
- Trivedi, P.; Anderson, I.C.; Singh, B.K. Microbial modulators of soil carbon storage: Integrating genomic an metabolic knowledge for global prediction. Trends Microbiol. 2013, 21, 641–651. [Google Scholar] [CrossRef] [PubMed]
- Shi, Z.; Xu, J.; Li, X.F.; Li, R.H.; Li, Q. Links of extracellular enzyme activities, microbial metabolism, and community composition in the river-impacted coastal waters. J. Geophys. Res. Biogeo. 2019, 124, 3507–3520. [Google Scholar] [CrossRef]
- Kitamura, M.; Okuyama, M.; Tanzawa, F.; Mori, H.; Kitago, Y.; Watanabe, N.; Kimura, A.; Tanaka, I.; Yao, M. Structural and functional analysis of a glycoside hydrolase family 97 enzyme from Bacteroides thetaiotaomicron. J. Biol. Chem. 2008, 283, 36328–36337. [Google Scholar] [CrossRef]
- Raskin, L.; Rittmann, B.E.; Stahl, D.A. Competition and coexistence of sulfate-reducing and methanogenic populations in anaerobic biofilms. Appl. Environ. Microbiol. 1996, 62, 3847–3857. [Google Scholar] [CrossRef]
- Li, S.D.; Fang, J.; Zhu, X.S.; Spencer, R.G.M.; Álvarez-Salgado, X.A.; Deng, Y.C.; Huang, T.; Yang, H.; Huang, C.C. Properties of sediment dissolved organic matter respond to eutrophication and interact with bacterial communities in a plateau lake. Environ. Pollut. 2022, 301, 118996. [Google Scholar] [CrossRef]
- Macreadie, P.I.; Atwood, T.B.; Seymour, J.R.; Schmitz Fontes, M.L.; Sanderman, J.; Nielsen, D.A.; Connolly, R.M. Vulnerability of seagrass blue carbon to microbial attack following exposure to warming and oxygen. Sci. Total Environ. 2019, 686, 264–275. [Google Scholar] [CrossRef]
- Strickland, M.S.; Rousk, J. Considering fungal: Bacterial dominance in soils-methods, controls, and ecosystem implications. Soil Biol. Biochem. 2010, 42, 1385–1395. [Google Scholar] [CrossRef]
- Van der Heijden, M.G.A.; Bardgett, R.D.; van Straalen, N.M. The unseen majority: Soil microbes as drivers of plant diversity and productivity in terrestrial ecosystems. Ecol. Lett. 2008, 11, 296–310. [Google Scholar] [CrossRef]
- Rayner, A.D.M.; Boddy, L. Wood Decomposition: Its Biology and Ecology; John Wiley: Chichester, NY, USA, 1988. [Google Scholar]
- Worrall, J.J.; Anagnost, S.E.; Zabel, R.D. Comparison of wood decay among diverse lignicolous fungi. Mycologia 1997, 89, 199–219. [Google Scholar] [CrossRef]
- Lynd, L.R.; Weimer, P.J.; van Zyl, W.H.; Pretorius, I.S. Microbial cellulose utilization: Fundamentals and biotechnology. Mol. Biol. Rev. 2002, 66, 506–577. [Google Scholar] [CrossRef] [PubMed]
- Güsewell, S.; Gessner, M.O. N:P ratios influence litter decomposition and colonization by fungi and bacteria in microcosms. Funct. Ecol. 2009, 23, 211–219. [Google Scholar] [CrossRef]
- Wang, Y.P.; Guo, X.H.; Zheng, P.F.; Zou, S.B.; Li, G.H.; Gong, J. Distinct seasonality of chytrid-dominated benthic fungal communities in the neritic oceans (Bohai Sea and North Yellow Sea). Fungal Ecol. 2017, 30, 55–66. [Google Scholar] [CrossRef]
- Kagami, M.; Miki, T.; Takimoto, G. Mycoloop: Chytrids in aquatic food webs. Front. Microbiol. 2014, 5, 166. [Google Scholar] [CrossRef]
- Gleason, F.H.; Kagami, M.; Lefevre, E.; Sime-Ngando, T. The ecology of chytrids in aquatic ecosystems: Roles in food web dynamics. Fung. Biol. Rev. 2008, 22, 17–25. [Google Scholar] [CrossRef]
- Thurber, R.V.; Willner-Hall, D.; Rodriguez-Mueller, B.; Desnues, C.; Edwards, R.A.; Angly, F.; Dinsdale, E.; Kelly, L.; Rohwer, F. Metagenomic analysis of stressed coral holobionts. Environ. Microbiol. 2009, 11, 2148–2163. [Google Scholar] [CrossRef]
- Góes-Neto, A.; Marcelino, V.R.; Verbruggen, H.; da Silva, F.F.; Badotti, F. Biodiversity of endolithic fungi in coral skeletons and other reef substrates revealed with 18S rDNA metabarcoding. Coral. Reefs 2020, 39, 229–238. [Google Scholar] [CrossRef]
Figure 1.
Distribution of seagrass beds on Hainan Island and the Xisha Islands, South China Sea. The left figure shows sampling sites on Hainan Island, and the right indicates the sites on the Xisha Islands.
Figure 1.
Distribution of seagrass beds on Hainan Island and the Xisha Islands, South China Sea. The left figure shows sampling sites on Hainan Island, and the right indicates the sites on the Xisha Islands.

Figure 2.
Sediment Cstocks (a), DOC (b), MOC (c), Corg (d), TN content (e), and DBD (f), pH (g), grain size (h), and MOC/Corg ratio (i) on Hainan Island and the Xisha Islands (mean ± S.E.). The much greater than (>>) or less than (<<) symbols indicate significant difference in these characteristics between Hainan Island and the Xisha Islands across all samples (t-test, p < 0.05). Different lowercase and capital letters indicate significant statistical difference among seagrass beds on Hainan Island and the Xisha Islands, respectively (ANOVA test, p < 0.05). The asterisk (*) and pound sign (#) over the bars show statistical significance between the Halophila sp. and T. hemprichii beds from Hainan Island and the Xisha Islands, respectively (t-test, p < 0.05).

Figure 3.
Variations of seagrass above-ground tissue biomass (a), below-ground tissue biomass (b), above-ground tissue C (c), below-ground tissue C (d), above-ground tissue N (e), below-ground tissue N (f), above-ground tissue C/N ratio (g) and below-ground tissue C/N ratio (h) in seagrass beds from Hainan Island and the Xisha Islands (mean ± S.E.). The much greater than (>>) or less than (<<) symbols indicate significant difference in seagrass properties between Hainan Island and the Xisha Islands across all samples (t-test, p < 0.05). Different lowercase and capital letters indicate significant difference among seagrass beds on Hainan Island and the Xisha Islands, respectively (ANOVA test, p < 0.05). The asterisk (*) and pound sign (#) over the bars show statistical significance between Halophila sp. and T. hemprichii beds from Hainan Island and the Xisha Islands, separately (t-test, p < 0.05).

Figure 4.
Relative abundance (%) of the dominant bacterial (a) and fungal (b) taxa at the phylum level in seagrass bed sediments of Hainan Island and the Xisha Islands.
Figure 4.
Relative abundance (%) of the dominant bacterial (a) and fungal (b) taxa at the phylum level in seagrass bed sediments of Hainan Island and the Xisha Islands.

Figure 5.
Distribution patterns of bacterial (a) and fungal (b) communities based on the unweighted UniFrac metric in seagrass sediments of Hainan Island and the Xisha Islands. The sites were colored by seagrass species with E. acodoides in red, T. hemprichii in green, and Halophila sp. in blue.
Figure 5.
Distribution patterns of bacterial (a) and fungal (b) communities based on the unweighted UniFrac metric in seagrass sediments of Hainan Island and the Xisha Islands. The sites were colored by seagrass species with E. acodoides in red, T. hemprichii in green, and Halophila sp. in blue.

Figure 6.
Relative abundance (%) of the predicted functions related to the carbon cycle of the bacterial community.
Figure 6.
Relative abundance (%) of the predicted functions related to the carbon cycle of the bacterial community.

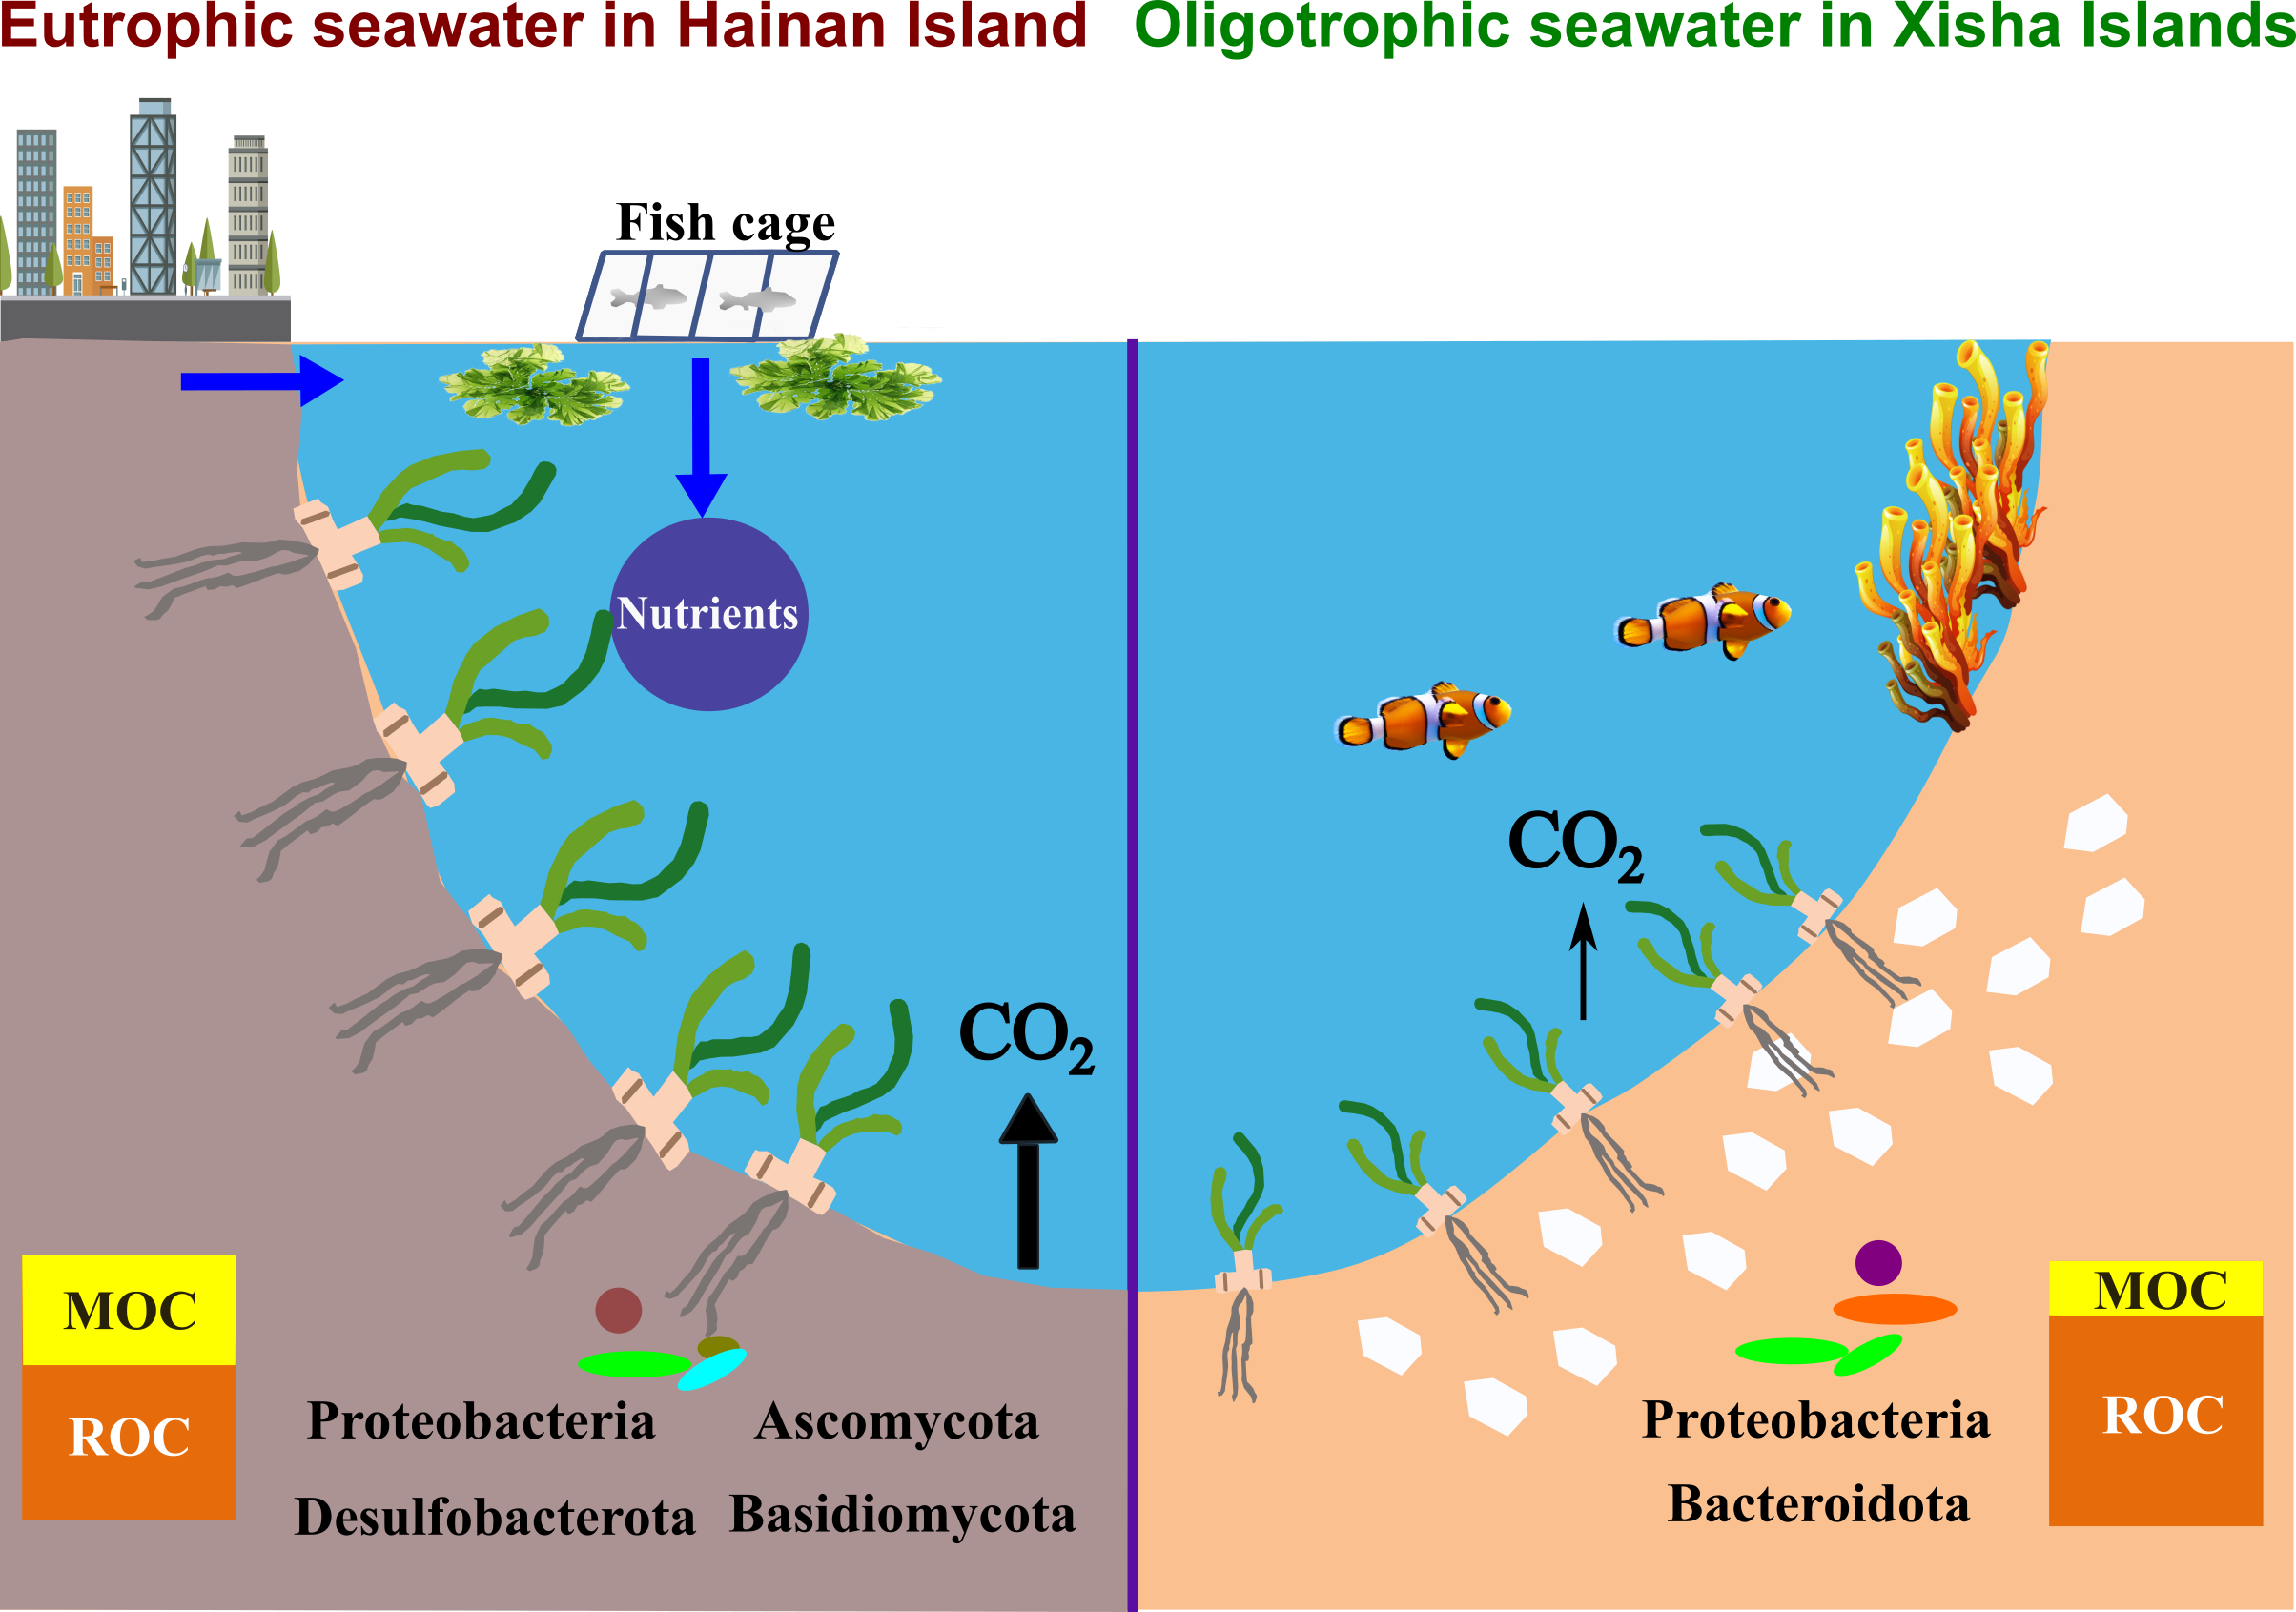
Figure 7.
Sediment carbon sequestration and transformation in seagrass beds from eutrophic seawater of Hainan Island and oligotrophic seawater of the Xisha Islands.
Figure 7.
Sediment carbon sequestration and transformation in seagrass beds from eutrophic seawater of Hainan Island and oligotrophic seawater of the Xisha Islands.


Table 1.
Seawater nitrogen and phosphorus concentrations in the seagrass beds of Hainan Island and the Xisha Islands (mean ± S.E.).
Table 1.
Seawater nitrogen and phosphorus concentrations in the seagrass beds of Hainan Island and the Xisha Islands (mean ± S.E.).
| NO3−-N (μmol/L) | NO2−-N (μmol/L) | NH4+-N (μmol/L) | DIN (μmol/L) | DIP (μmol/L) | ||
|---|---|---|---|---|---|---|
| Study site | ||||||
| Hainan Island | Li’an Port | 5.83 ± 0.77 b | 0.08 ± 0.03 bd | 2.96 ± 0.16 b | 8.87 ± 0.87 b | 0.13 ± 0.01 b |
| Long Bay | 20.80 ± 1.46 a | 2.00 ± 0.17 a | 4.72 ± 0.60 b | 27.52 ± 0.96 a | 0.74 ± 0.06 a | |
| Tanmen Port | 12.68 ± 1.31 c | 0.37 ± 0.05 c | 3.73 ± 0.03 b | 16.78 ± 1.28 c | 1.35 ± 0.20 a | |
| Xincun Bay | 14.53 ± 2.18 c | 0.17 ± 0.01 bc | 12.16 ± 1.13 a | 26.87 ± 1.87 a | 1.08 ± 0.10 a | |
| Dongzhai Harbor | 14.36 ± 0.53 c | 0.39 ± 0.06 c | 3.06 ± 0.50 b | 17.81 ± 0.68 c | 1.20 ± 0.28 a | |
| Xiaohai | 22.24 ± 3.89 a | 2.20 ± 0.65 a | 3.06 ± 0.34 b | 27.49 ± 3.88 a | 0.82 ± 0.03 a | |
| Xisha Islands | 1.28 ± 0.03 d | 0.06 ± 0.00 d | 1.06 ± 0.06 c | 2.40 ± 0.06 d | 0.34 ± 0.02 c | |
| Seagrass species | ||||||
| E. acodoides | 13.10 ± 2.25 | 0.816 ± 0.302 A | 3.80 ± 0.31 A | 17.72 ± 2.75 A | 0.74 ± 0.19 | |
| Halophila sp. | 4.31 ± 1.24 | 0.284 ± 0.119 B | 1.56 ± 0.15 B | 6.16 ± 1.45 B | 0.42 ± 0.06 | |
| T. hemprichii | 2.44 ± 0.64 | 0.069 ± 0.007 B | 1.86 ± 0.54 B | 4.37 ± 1.16 B | 0.43 ± 0.04 | |
Notes: different lowercase (a, b, c, d) and capital letters (A, B) indicate significant difference among study sites and seagrass species in the same column, respectively (ANOVA test, p < 0.05).
Table 2.
The α-diversities (including OTUs, Shannon, and Chao 1 indexes) of bacterial and fungal communities in the seagrass beds of the Xisha Islands and Hainan Island (mean ± S.E.).
Table 2.
The α-diversities (including OTUs, Shannon, and Chao 1 indexes) of bacterial and fungal communities in the seagrass beds of the Xisha Islands and Hainan Island (mean ± S.E.).
| OTUs | Shannon | Chao 1 | ||
|---|---|---|---|---|
| Study region | ||||
| Bacteria | Hainan Island | 3570.89 ± 65.01 | 6.74 ± 0.04 | 5329.50 ± 107.42 |
| Xisha Islands | 3577.09 ± 108.60 | 6.31 ± 0.17 | 5237.62 ± 139.58 | |
| Fungi | Hainan Island | 341.22 ± 67.37 a | 3.44 ± 0.45 | 356.89 ± 68.29 a |
| Xisha Islands | 111.47 ± 3.57 b | 2.84 ± 0.10 | 120.02 ± 4.00 b | |
| Seagrass species | ||||
| Bacteria | E. acodoides | 3737.22 ± 72.30 | 6.74 ± 0.07 | 5591.00 ± 113.48 |
| Halophila sp. | 3405.57 ± 178.76 | 6.13 ± 0.30 | 5048.95 ± 228.21 | |
| T. hemprichii | 3697.75 ± 60.41 | 6.60 ± 0.05 | 5369.04 ± 98.15 | |
| Fungi | E. acodoides | 206.44 ± 35.07 AB | 2.32 ± 0.58 | 218.26 ± 35.18 AB |
| Halophila sp. | 215.17 ± 45.94 A | 3.22 ± 0.23 | 226.85 ± 46.65 A | |
| T. hemprichii | 117.03 ± 5.54 B | 2.96 ± 0.13 | 125.30 ± 5.76 B | |
Notes: different lowercase letters indicate significant difference in microbial diversities between Hainan and the Xisha Islands (t-test, p < 0.05), and different capital letters denote significant difference of microbial diversities among different seagrass species (ANOVA test, p < 0.05).
Table 3.
Pearson’s correlations between environmental factors and sediment Corg, Cstocks, MOC and DOC (n = 26).
Table 3.
Pearson’s correlations between environmental factors and sediment Corg, Cstocks, MOC and DOC (n = 26).
| MOC | DOC | Corg | Cstocks | ||
|---|---|---|---|---|---|
| Sediment | MOC | – | – | 0.490 ** | 0.418 ** |
| DOC | – | – | −0.036 | −0.049 | |
| TN | 0.276 ** | −0.032 | 0.449 ** | 0.409 ** | |
| Alkaline phosphatase | 0.178 | 0.015 | −0.008 | −0.035 | |
| Urease | 0.055 | 0.091 | −0.03 | −0.012 | |
| Invertase | −0.032 | 0.067 | −0.181 | −0.223 * | |
| Cellulose | −0.188 | 0.163 | −0.075 | −0.089 | |
| Polyphenol Oxidase | 0.105 | 0.008 | −0.044 | −0.042 | |
| pH | −0.689 ** | 0.147 | −0.347 ** | −0.449 ** | |
| Grain sizes | −0.578 ** | −0.044 | −0.278 ** | −0.306 ** | |
| DBD | −0.068 | −0.046 | −0.308 ** | 0.012 | |
| Seawater | NO3-N | 0.585 ** | −0.184 | −0.015 | −0.018 |
| NH4+-N | 0.234 * | 0.01 | −0.256 * | −0.208 | |
| DIN | 0.553 ** | −0.149 | −0.071 | −0.066 | |
| DIP | 0.253 * | −0.208 | 0.007 | 0.092 | |
| Seagrass above-ground tissue | C | 0.135 | −0.054 | 0.038 | 0.015 |
| N | 0.206 | −0.012 | −0.02 | −0.047 | |
| C/N ratio | −0.109 | −0.024 | 0.059 | 0.054 | |
| Seagrass below-ground tissue | C | 0.051 | −0.094 | 0.017 | −0.03 |
| N | 0.342 ** | −0.108 | −0.089 | −0.095 | |
| C/N ratio | −0.285 * | 0.048 | 0.09 | 0.055 |
* p < 0.05, ** p < 0.01.
Disclaimer/Publisher’s Note: The statements, opinions and data contained in all publications are solely those of the individual author(s) and contributor(s) and not of MDPI and/or the editor(s). MDPI and/or the editor(s) disclaim responsibility for any injury to people or property resulting from any ideas, methods, instructions or products referred to in the content. |
© 2023 by the authors. Licensee MDPI, Basel, Switzerland. This article is an open access article distributed under the terms and conditions of the Creative Commons Attribution (CC BY) license (https://creativecommons.org/licenses/by/4.0/).
Share and Cite
MDPI and ACS Style
Han, Q.; Qiu, C.; Zeng, W.; Chen, S.; Zhao, M.; Shi, Y.; Zhang, X. Sediment Carbon Sequestration and Driving Factors in Seagrass Beds from Hainan Island and the Xisha Islands. Processes 2023, 11, 456. https://doi.org/10.3390/pr11020456
AMA Style
Han Q, Qiu C, Zeng W, Chen S, Zhao M, Shi Y, Zhang X. Sediment Carbon Sequestration and Driving Factors in Seagrass Beds from Hainan Island and the Xisha Islands. Processes. 2023; 11(2):456. https://doi.org/10.3390/pr11020456
Chicago/Turabian StyleHan, Qiuying, Chongyu Qiu, Wenxuan Zeng, Shiquan Chen, Muqiu Zhao, Yunfeng Shi, and Xiaoli Zhang. 2023. "Sediment Carbon Sequestration and Driving Factors in Seagrass Beds from Hainan Island and the Xisha Islands" Processes 11, no. 2: 456. https://doi.org/10.3390/pr11020456
Note that from the first issue of 2016, this journal uses article numbers instead of page numbers. See further details here.