Article

Diagnosis of Osteoarthritis at an Early Stage via Infrared Spectroscopy Combined Chemometrics in Human Serum: A Pilot Study

by
Atiqah Ab Aziz
1,*,
Veenesh Selvaratnam
2,
Yasmin Fadzlin Binti Ahmad Fikri
1,
Muhamad Shirwan Abdullah Sani
3 and
Tunku Kamarul
1,4,*
1
Tissue Engineering Group (TEG), National Orthopaedic Centre of Excellence for Research and Learning (NOCERAL), Department of Orthopaedic Surgery, Faculty of Medicine, Universiti Malaya, Kuala Lumpur 50603, Malaysia
2
Joint Reconstruction Unit (JRU), National Orthopaedic Centre of Excellence in Research and Learning (NOCERAL), Department of Orthopaedic Surgery, Faculty of Medicine, Universiti Malaya, Kuala Lumpur 50603, Malaysia
3
International Institute for Halal Research and Training, Level 3, KICT Building, International Islamic University Malaysia (IIUM), Kuala Lumpur 53100, Malaysia
4
Advanced Medical and Dental Institute (AMDI), Universiti Sains Malaysia, Bertam 13200, Malaysia
*
Authors to whom correspondence should be addressed.
Processes 2023, 11(2), 404; https://doi.org/10.3390/pr11020404
Submission received: 19 December 2022 / Revised: 16 January 2023 / Accepted: 17 January 2023 / Published: 29 January 2023

Abstract

:
Methods applied for early diagnosis of osteoarthritis (OA) are limited. Early prevention and treatment can effectively reduce the pain of OA patients and save costs. The present study aimed to develop a rapid non-destructive detection method for early diagnosis of OA by evaluating infrared (IR) spectroscopy combined chemometrics. Our cohort consisted of (a) 15 patients with osteoarthritis (OA) and (b) 10 without clinical signs of the disease and they were used as controls. Attenuated total reflection Fourier-transform infrared (ATR-FTIR) spectroscopy was used to investigate serum samples (50 µL) collected from these patients. A supervised classification algorithm namely discriminant analysis (DA) was applied to evaluate the diagnostic accuracy spectral processing and chemometrics analysis allowed for detecting spectral biomarkers that discriminated the two cohorts. About 250 infrared spectra were statistically important for separating the groups. Peaks at 1000 cm−1 in OA serum were associated mainly with C–O stretching vibration associated with the changes in the proteoglycan contents previously reported in OA. A good overall classification accuracy of 74.47% was obtained from the DA model. Our findings indicated that this discriminating model, which incorporated the ATR-FTIR spectrum, could provide a rapid and cost-effective blood test, thus facilitating the early diagnosis of human OA.

1. Introduction

Osteoarthritis (OA) is a well-known condition involving the degeneration of the articular joints that, over the years, has caused much pain, disability, and loss of economy worldwide. The disease is common in the elderly as age is the most prominent risk factor for the development and progression of OA [1]. Knee OA is more important not only for its high prevalence rate compared with other types of OA but also because the incidence of knee OA increases with age and further increases with a longer lifetime and higher average weight of the population [2]. Large weight-bearing joints like the knee and hip are frequently afflicted [3]. These joints are characterised by reactive bone hyperplasia at the joint edge and beneath the cartilage, synovial distension, inflammation, thin and rough articular cartilage [4]. OA is characterised as a failure of the joint organ that impacts all the tissues in and around the joint. These effects include changes to the periarticular muscles, nerves, bursa, and local fat pads as well as articular cartilage degradation, thickening of the subchondral bone, osteophyte formation, varying degrees of synovial inflammation, degeneration of ligaments, and hypertrophy of the joint capsule [5]. In OA, dysregulation brought on by the presence of various bio factors results in the loss of cartilage homeostasis, which in turn causes the extracellular matrix (ECM), which is rich in collagen and proteoglycans, to degrade. Cell death, matrix calcification, and vascular invasion are other effects that follow [6].
Ageing, obesity, genetic predisposition, acute trauma, chronic overload, gender, hormone profile, and metabolic syndrome are all known risk factors for OA [7]. Reactive oxygen and nitrogen species produced by mitochondria and cellular stress responses, respectively, are the main causes of this damage in ageing. The accumulation of somatic mutations and DNA damage, telomere shortening, protein and lipid degradation, and mitochondrial dysfunction are the immediate effects of these reactive oxygen species (ROS). These molecular alterations lower the threshold of damage-inducing stress and decrease the ability of chondrocytes to maintain cartilage homeostasis [8]. Another illustration is post-traumatic osteoarthritis caused by traumatic injuries such anterior cruciate ligament (ACL) tears and meniscal resection, which frequently result in joint instability or intraarticular fractures (PTOA) [9].
The disease, which man has recognised since the early part of human civilisation, has never been treated successfully. Many treatment regimens have been tried to address this problem, besides using prosthetic implants for joint replacement and other similar means to overcome the issues. Although these treatments have brought limited success in the long term, they remain the mainstay practice for over 70 years, with minor improvements seen along the way. The fact is that, without tissue repair, artificial tissues would not yield good tissue functioning. Typical diagnostic methods for osteoarthritis consists of imaging tests such as X-rays [10], magnetic resonance imaging (MRI) [11], ultrasound [12], micro CT [13] as well as alternative methods such as vibroarthrography [14]. However, the current diagnostic methods are inconvenient, time-consuming, expensive, invasive, and in most cases, painful. Meanwhile, the only lab test available is joint fluid analysis [15]. By far, there is no blood test available for osteoarthritis diagnosis, and the only medications available are focused on decreasing the symptoms of the disease, such as pain-relieving medications including acetaminophen and non-steroidal anti-inflammatory drugs (NSAIDs) [16]. Besides, conducting physical examinations such as examining muscle atrophy, limb alignment and passive and active knee range of motion (ROM) [17] could be done. Physical examination alone is not sufficient to diagnose clinically significant hip osteoarthritis [18]. As such, the treatments of OA have been relatively limited, and the use of more biological approaches has been promoted more aggressively, albeit with limited long-term success. Considering that the formation of osteoarthritis typically develops over decades [19], this gives us plenty of windows to alter its course. We believe that precautions are the primary key to avoiding getting into this critical condition. Hence, early diagnosis of OA is vital.
When the whole joint is affected by OA, it results in molecular and macroscopic changes within the articular cartilage, synovium, subchondral bone, ligaments, meniscus, and synovial fluid [20]. Identifying OA at its early stages may represent a critical clinical window for effective intervention strategies. However, currently, there are no sensitive biomarkers for early-stage OA, and the clinical diagnosis is mainly made at the later stages. Thus, serum research is crucial to understand the serum metabolomics network indicating ageing in OA pathogenesis and determining the variation of biomarkers’ potential diagnostic utility [21,22]. In this study, we investigated the capability of infrared spectroscopy to classify the sera from patients with OA and controls.
Vibrational spectroscopy is a promising method for the diagnostics of a great variety of disorders. Non-invasive biofluids such as blood, urine, tears, and saliva have been investigated as essential sources of biological information [23]. Each type of these fluids has their specific functional groups, which are structural units within organic compounds defined by specific atom and bond arrangements. Attenuated total reflection Fourier-transform infrared (ATR-FTIR) spectroscopy is an amazing device for the identification of functional groups as it can provide a fingerprint of the biochemical substances present in a sample by highlighting their atomic vibrations (bending, stretching, and torsions of the chemical bonds) after the sample has absorbed the infrared [24]. The fingerprinting approach using a combination of FTIR and chemometric tools offer various advantages, including rapid, low-cost, sensitive, and reliable [25]. The ATR-FTIR spectroscopy uses a diamond crystal to direct the infrared (IR) beam to the sample, thus creating an evanescent wave. The latter penetrates the sample for a few microns to derive its chemical information to the detector as peaks known as spectrum data, which present promising results as a potential diagnostic or screening tool [26]. The performance of ATR-FTIR spectroscopy in detecting OA in human serum has, however, not been investigated. Validation of the ability of an ATR-FTIR-based approach to detect and monitor the progression of OA is considered a critical step before adapting this approach to future preclinical screening. Additionally, ATR-FTIR provides additional specificity for isomers where mass spectrometry (MS) often fails due to similar fragmentation patterns.
Therefore, one approach that has been identified is to develop a rapid non-destructive detection method for the early diagnosis of OA by evaluating the IR spectroscopy combined chemometrics and by providing potential spectral markers indicative of disease. The ATR-FTIR spectroscopy is advantageous as it allows easy sample preparation and is inexpensive and reliable when combined with chemometrics. We hypothesised that circulating biomarkers of disease were reflected in the spectral profile. By using a classification algorithm through chemometrics, segregation between the OA and control groups was undertaken, and subsequent diagnostic accuracy was assessed. The levels of the discriminatory spectral markers indicative of disease were also calculated and correlated with certain bonds within the biological molecules.

2. Methodology

2.1. Ethical Approval

Medical Research Ethics Committee, University Malaya Medical Centre (MREC ID No.: 2016927-4288) approved this prospective observational cohort research.

2.2. Sample Size Calculation

Sample size calculation based on a 95% power range using a two-tailed t-test estimated a group size of 14 in the OA group (an effect size of 0.50) based on a hypothetical 50% detection rate of OA.

2.3. Participants

Inclusion criteria for the OA group included a range of age of 60–80 years old, regardless of gender (female or male), osteoarthritis stage (end-stage/stage 4), primary osteoarthritis, and knee joint as the location of interest. We focued on patients needing a knee replacement (Table 1). Meanwhile, the exclusion criteria included inflammatory diseases (rheumatoid arthritis), age below 60, early stage of osteoarthritis, secondary osteoarthritis, hips and hands as the locations of interest, and secondary osteoarthritis. Most early OA patients did not visit the hospital for treatment and relied on painkillers (Table 1). Due to the lack of data from these early-stage OA patients, the inclusion criteria were focused on end-stage OA instead. For control group, volunteers with no clinical diagnosis of OA were assigned to the healthy group (n = 10). The control group had no orthopaedic or systematic abnormalities based on physical and orthopaedic examinations.

2.4. Serum Collection

After the blood withdrawal, the blood samples were centrifuged at 1320 g for 15 min, and the supernatant was taken off. The serum samples were collected and aliquoted into typical 1 mL microtubes before further use. Each group used a volume of 50 µL serum for spectroscopic analysis.

2.5. ATR-FTIR Spectral Acquisition

About 15 OA serum samples and 10 control serum samples were scanned 10 times for each formulation using an ABB MB3000 ATR-FTIR spectrometer (Clairet Scientific, Northampton, UK) equipped with a diamond crystal of ATR GladiATR platform (Perkin Elmer, MA, US). An amount of 1–2 g of samples was put in touch with the diamond crystal at 20 °C. The scanning was carried out in the mid-infrared range of 450 cm−1 to 4000 cm−1 at 4 cm−1 resolution. A total of 250 produced absorbance spectra were pre-processed using Horizon MB ATR-FTIR software version 3.0.13.1 (ABB, Montreal, QC, Canada) to facilitate the differentiation process among the samples. All spectra were subjected to baseline and smooth corrections to obtain a better spectrum. The spectra were analysed for chemo metrics analysis as shown in the Figure 1.

2.6. Chemometrics

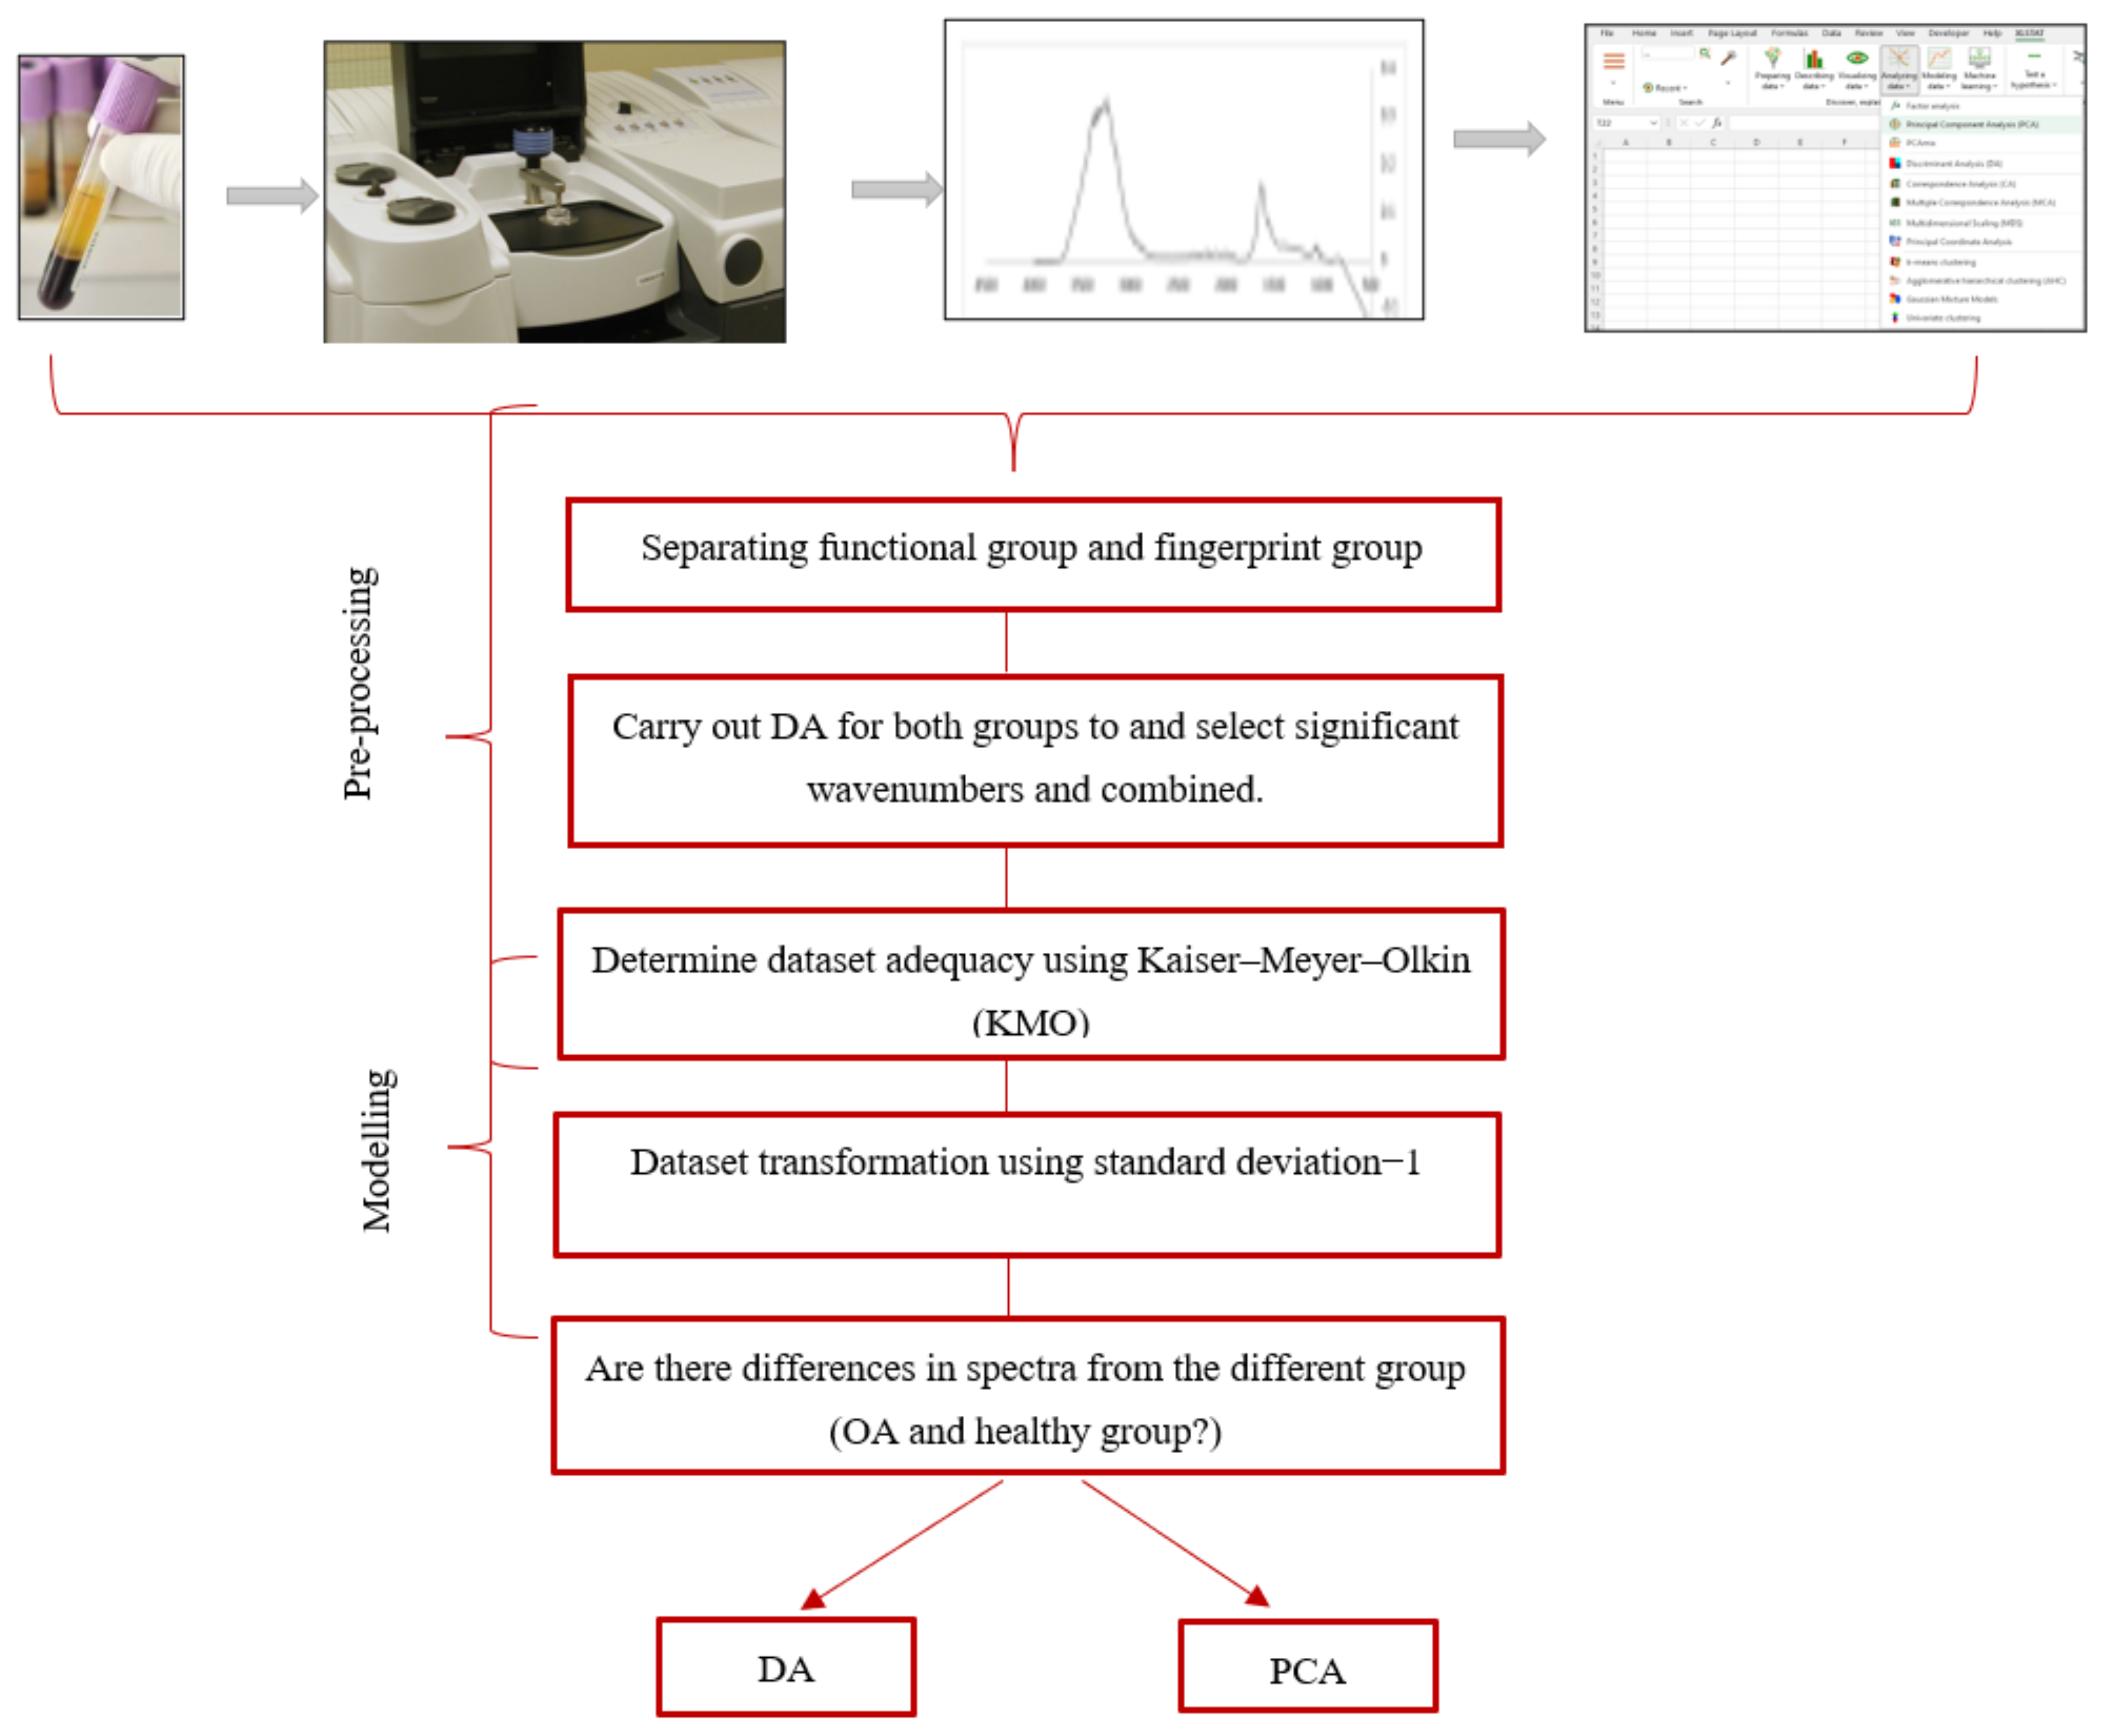
2.6.1. Data Pre-Processing

The spectra were converted into comma-separated values (CVS) and imported to the dataset table in XLSTAT 2016 software [27]. At first, the functional group (4000 to 1701 cm−1) and fingerprint group (1700 to 450 cm−1) were separated. Then, DA was carried out on both functional fingerprinting groups and the most significant wavenumbers from these groups were combined (104 spectrum data). Subsequently, the Kaiser-Meyer-Olkin (KMO) test verified dataset adequacy before carrying out a second DA with the combined wavenumbers [28]. Meanwhile, 47 data were utilised for cross-validation, 24 data were used for the testing dataset, and 24 data were used for the verification dataset. Then, the most significant wavenumbers were selected from DA and proceeded with principal component analysis (PCA) to find the apportionment of wavenumber on serum.

2.6.2. Kaiser-Meyer-Olkin Test

The dataset was analysed for dataset adequacy by the KMO test. An adequate dataset determines the ability of a generated model to extract latent variables from the dataset. In this study, the KMO test was employed at a significant level (α) of 0.01. The calculated KMO was ranked as KMO < 0.5 = inadequate, 0.5 < KMO < 0.7 = mediocre, 0.7 < KMO < 0.8 = good, 0.8 < KMO < 0.9 = very good, and KMO > 0.9 excellent to indicate the dataset adequacy [29].

2.6.3. Dataset Transformation

To ensure that the dataset followed a normal distribution before the PCA, the dataset normality was tested using Shapiro-Wilk test at α of 0.01. The dataset was transformed using standard deviation (n−1) methods.

2.6.4. Discriminant Analysis (DA)

Each group (OA and non-OA serum) was used as training, cross-validation, and testing dataset in DA. The OA sera were marked as “100%”, and the non-OA sera were marked as “0%”, which indicated serum from the healthy group. Furthermore, the developed DA model was used to classify the unknown serum for verification.

2.6.5. Dataset Exploratory by PCA

The PCA of Pearson correlation was applied to recognise the dataset pattern, to explore the contribution of each fatty acid (FA) to the cosmetic soap formulations, to find and explain the variance of intercorrelated FAs, and to transform the dataset into smaller sets of new independent variables called principal components (PCs). The principle of PCA was to significantly reduce the dataset dimensionality (p < 0.01) to achieve these aims.

3. Results and Discussion

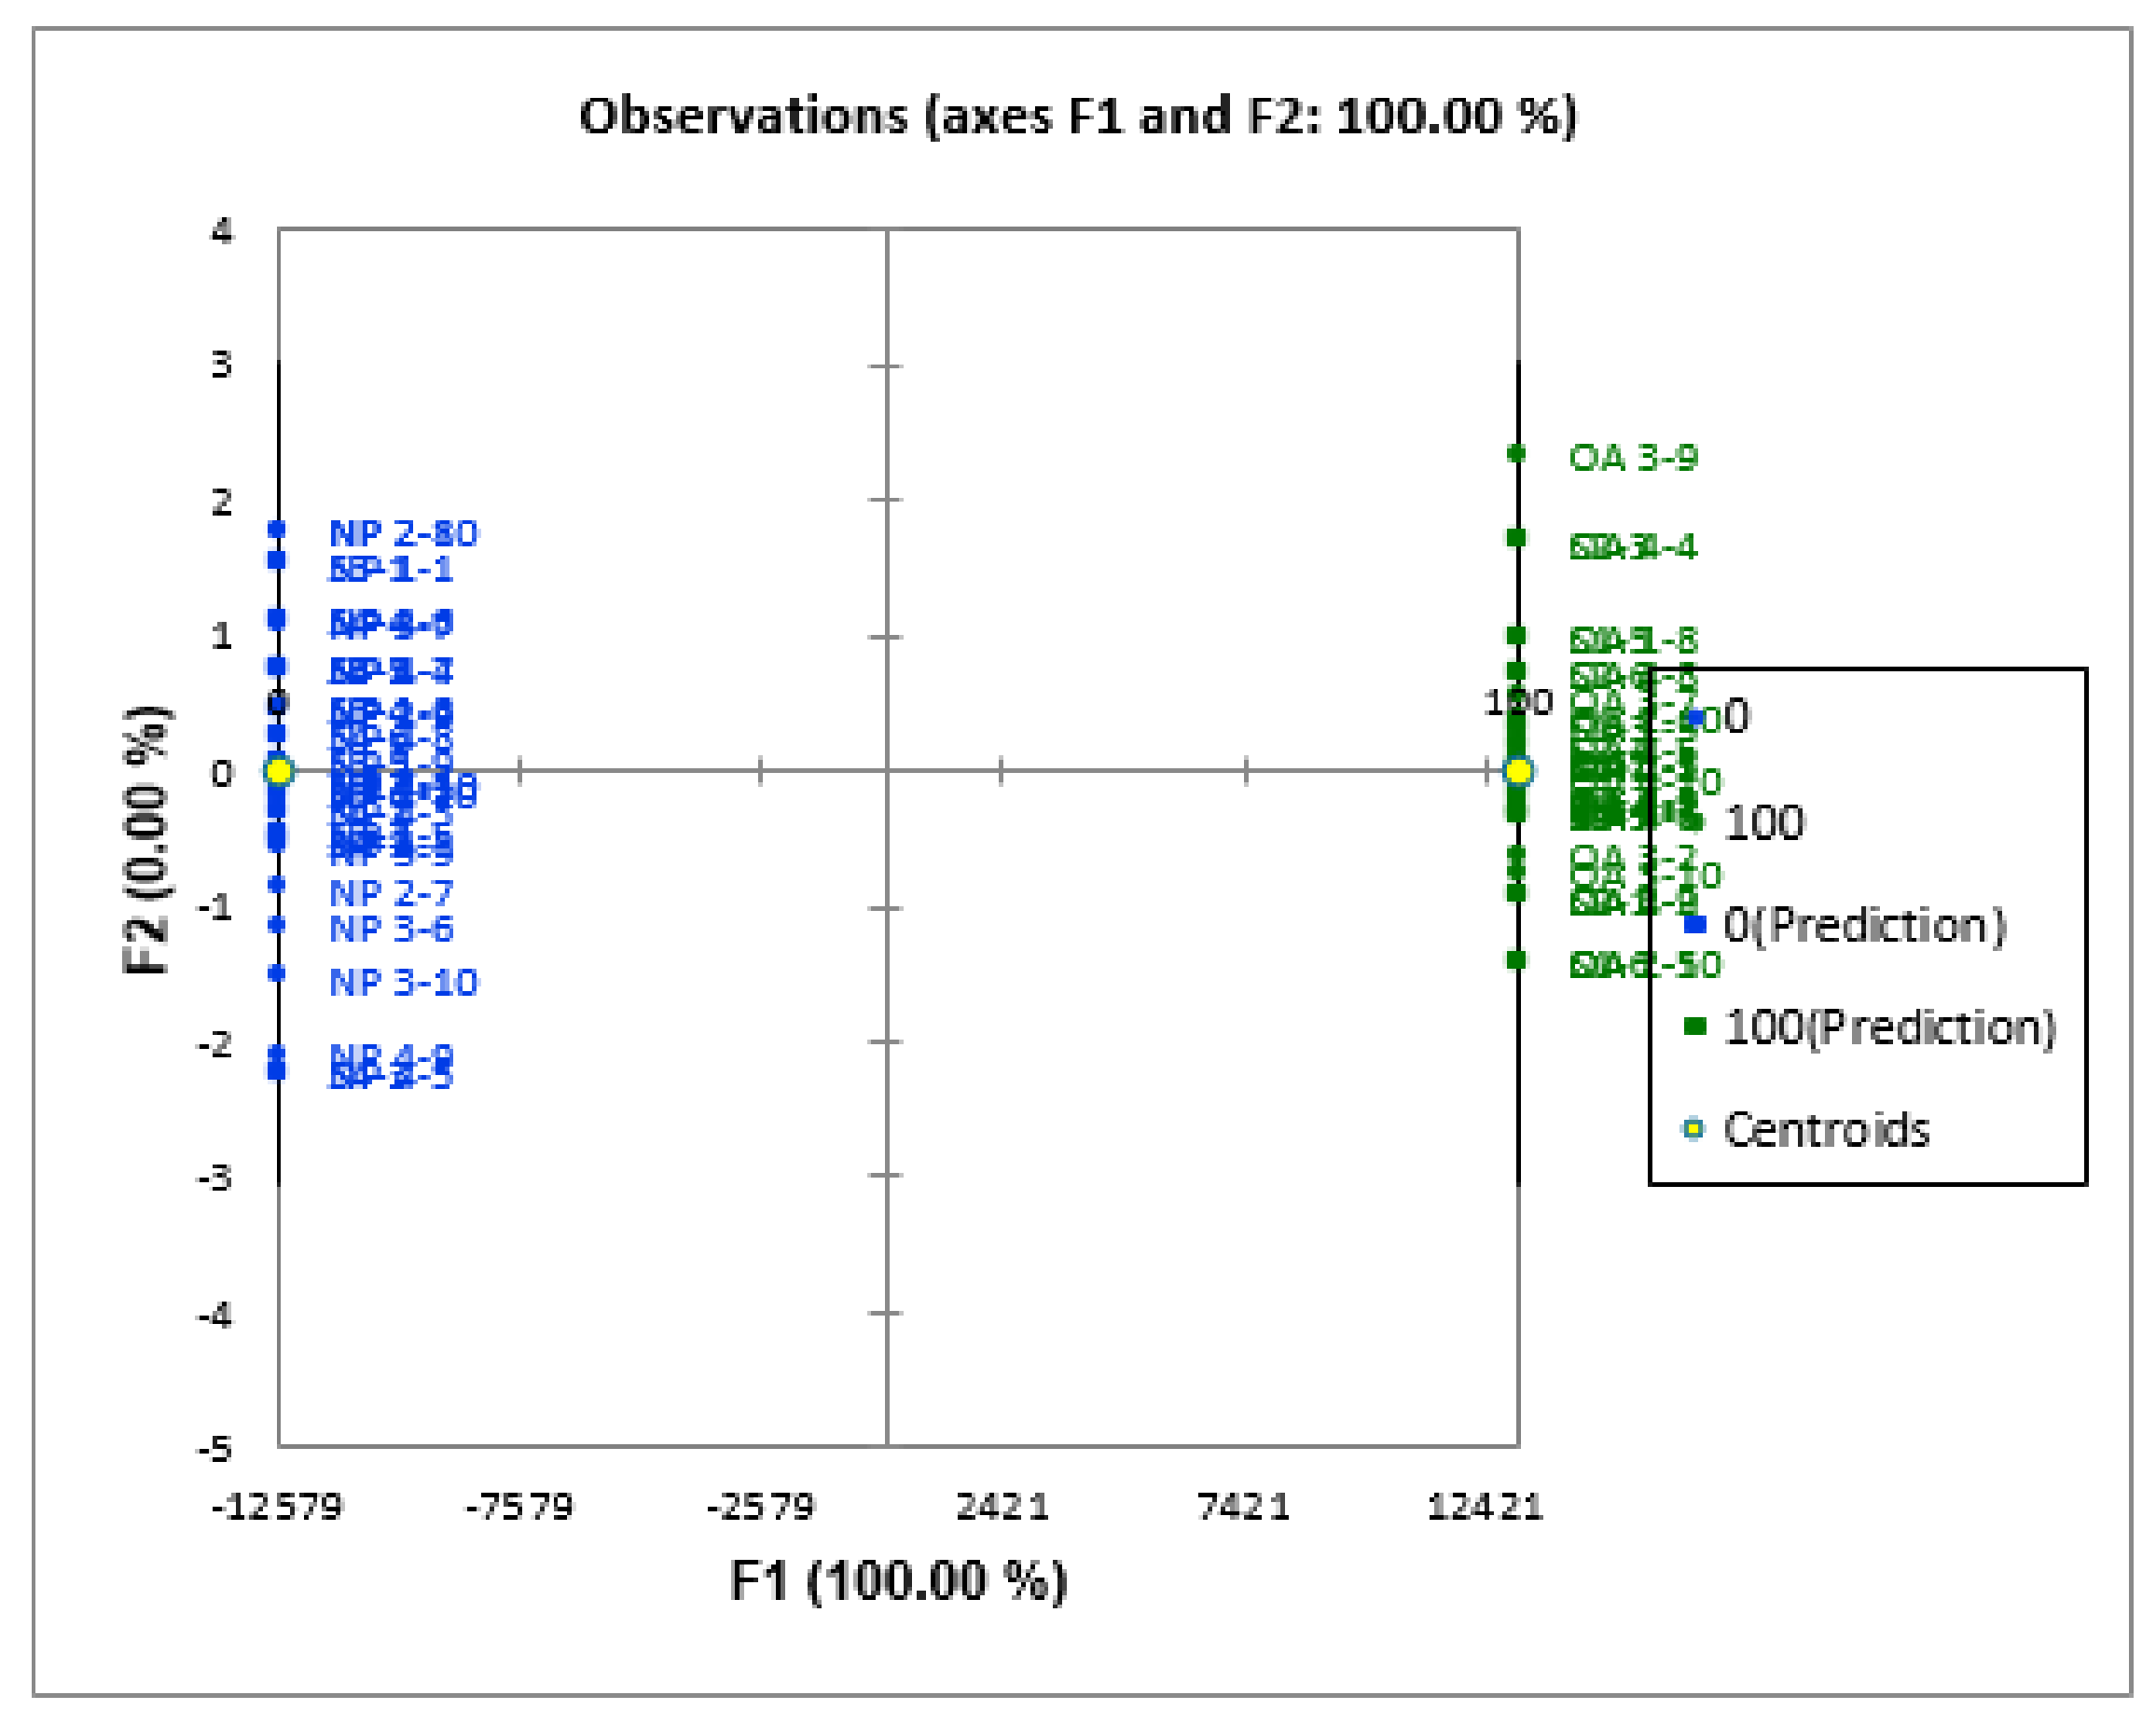
3.1. Validation and Verification of the DA Model between OA and Healthy Serum Samples

To achieve relevant findings, pre-requisite MDA must be carried out [30], beginning with choosing the appropriate dataset for the study using the KMO test. For the 250 datasets, the KMO test produced a KMO score of 0.820 (Table 2). A lack of the KMO test may result in reporting inaccurate findings and interpretations because of a small dataset [31]. According to a general report, the KMO value of 0.8 to 0.9 was deemed good [32]. Many different research areas such as analytical chemistry, multivariate statistical process control, food, pharmaceutical, and biomedical investigations used standardised (n−1) transformation while assuring the normal distribution of the dataset.
There is a lack in the studies that have mentioned any dataset transformation. Hence, our study recommended that all variables be transformed by using the standard deviation (n−1) method. The dataset transformation simultaneously corrects the linearity issue as well. Hence, the linearity test is on a case-by-case basis. The last step before MDA is performing assumption testing, which involves normalisation. The normalisation of the dataset was conducted by performing the Shapiro-Wilk test at α of 0.01, which allows only a 1% chance of a false positive as this study was designed for authentication analysis. Therefore, it should be very effective in reducing errors.
In this study, discriminant analysis (DA) was employed to develop a discriminating model (DM) differentiate to differentiate controls from human with OA by calculating the distance from each class evaluated in distance units. The classification of unknown samples to one of the specific classes can be predicted after the classification model was obtained [33]. Discriminant analysis classifiers are routinely used in the spectroscopic analysis of biological tissues [34,35]. The validation of the DA model is essential for a reliable estimation of model accuracy using root mean square error of prediction (RMSEP) for instance [36]. Several validating models are available, including cross-validation across replicates. Previous publications on multivariate data analysis (MDA) are not always clear whether the technical replicates of the same specimen or specimen extracted from the same individual are used in both the training and the test sets. However, in the present study, cross-validation across replicates was used by systematically taking all replicates for the same physical sample [36] for the DA model validation. Thus, the validation tests how precisely one can re-measure the same physical sample.
Significant wavelengths were identified by the DA in OA and healthy serum (OAHS) samples (Figure 2). The DA model was established by highlighting the wavelength that can differentiate one source to another, known as the supervised pattern recognition technique. Moreover, DA in OAHS can accurately classify 100% for the training dataset, 74.47% for the cross-validation dataset, and 100% for the testing dataset to its classes (Table 3). In other words, there were almost no samples being misclassified from their group’s validation. The created models were also utilised to predict whether or not an unknown blood serum sample would be suspected of having OA. The question of whether the unidentified samples resembled OA or the healthy group was decided. With the value of the verification dataset at 100%, the analysed blood serum samples from OA and healthy serum were clearly distinguished using the OAHS model. In general, the OAHS DA model accurately classified training, cross-validation, testing, and verification datasets for differentiating the presence of OA in the blood serum samples.
Routine radiography in early OA has insufficient discriminative power to predict future OA, it is difficult to identify people at risk for incident disease or disease progression [37]. Other radiography drawbacks include its low sensitivity to longitudinal change and lack of sensitivity and specificity for the diagnosis of OA-associated articular tissue deterioration [38]. The confirmation of biochemical and imaging biomarkers that identify patients at risk for progressive disease and the identification of genetic processes that detect early disease is thus necessary [39]. Therefore, this study has highlighted the use of ATR-FTIR combined with chemometrics due to its excellent capacity for rapidly distinguishing between diseases and healthy groups [40].

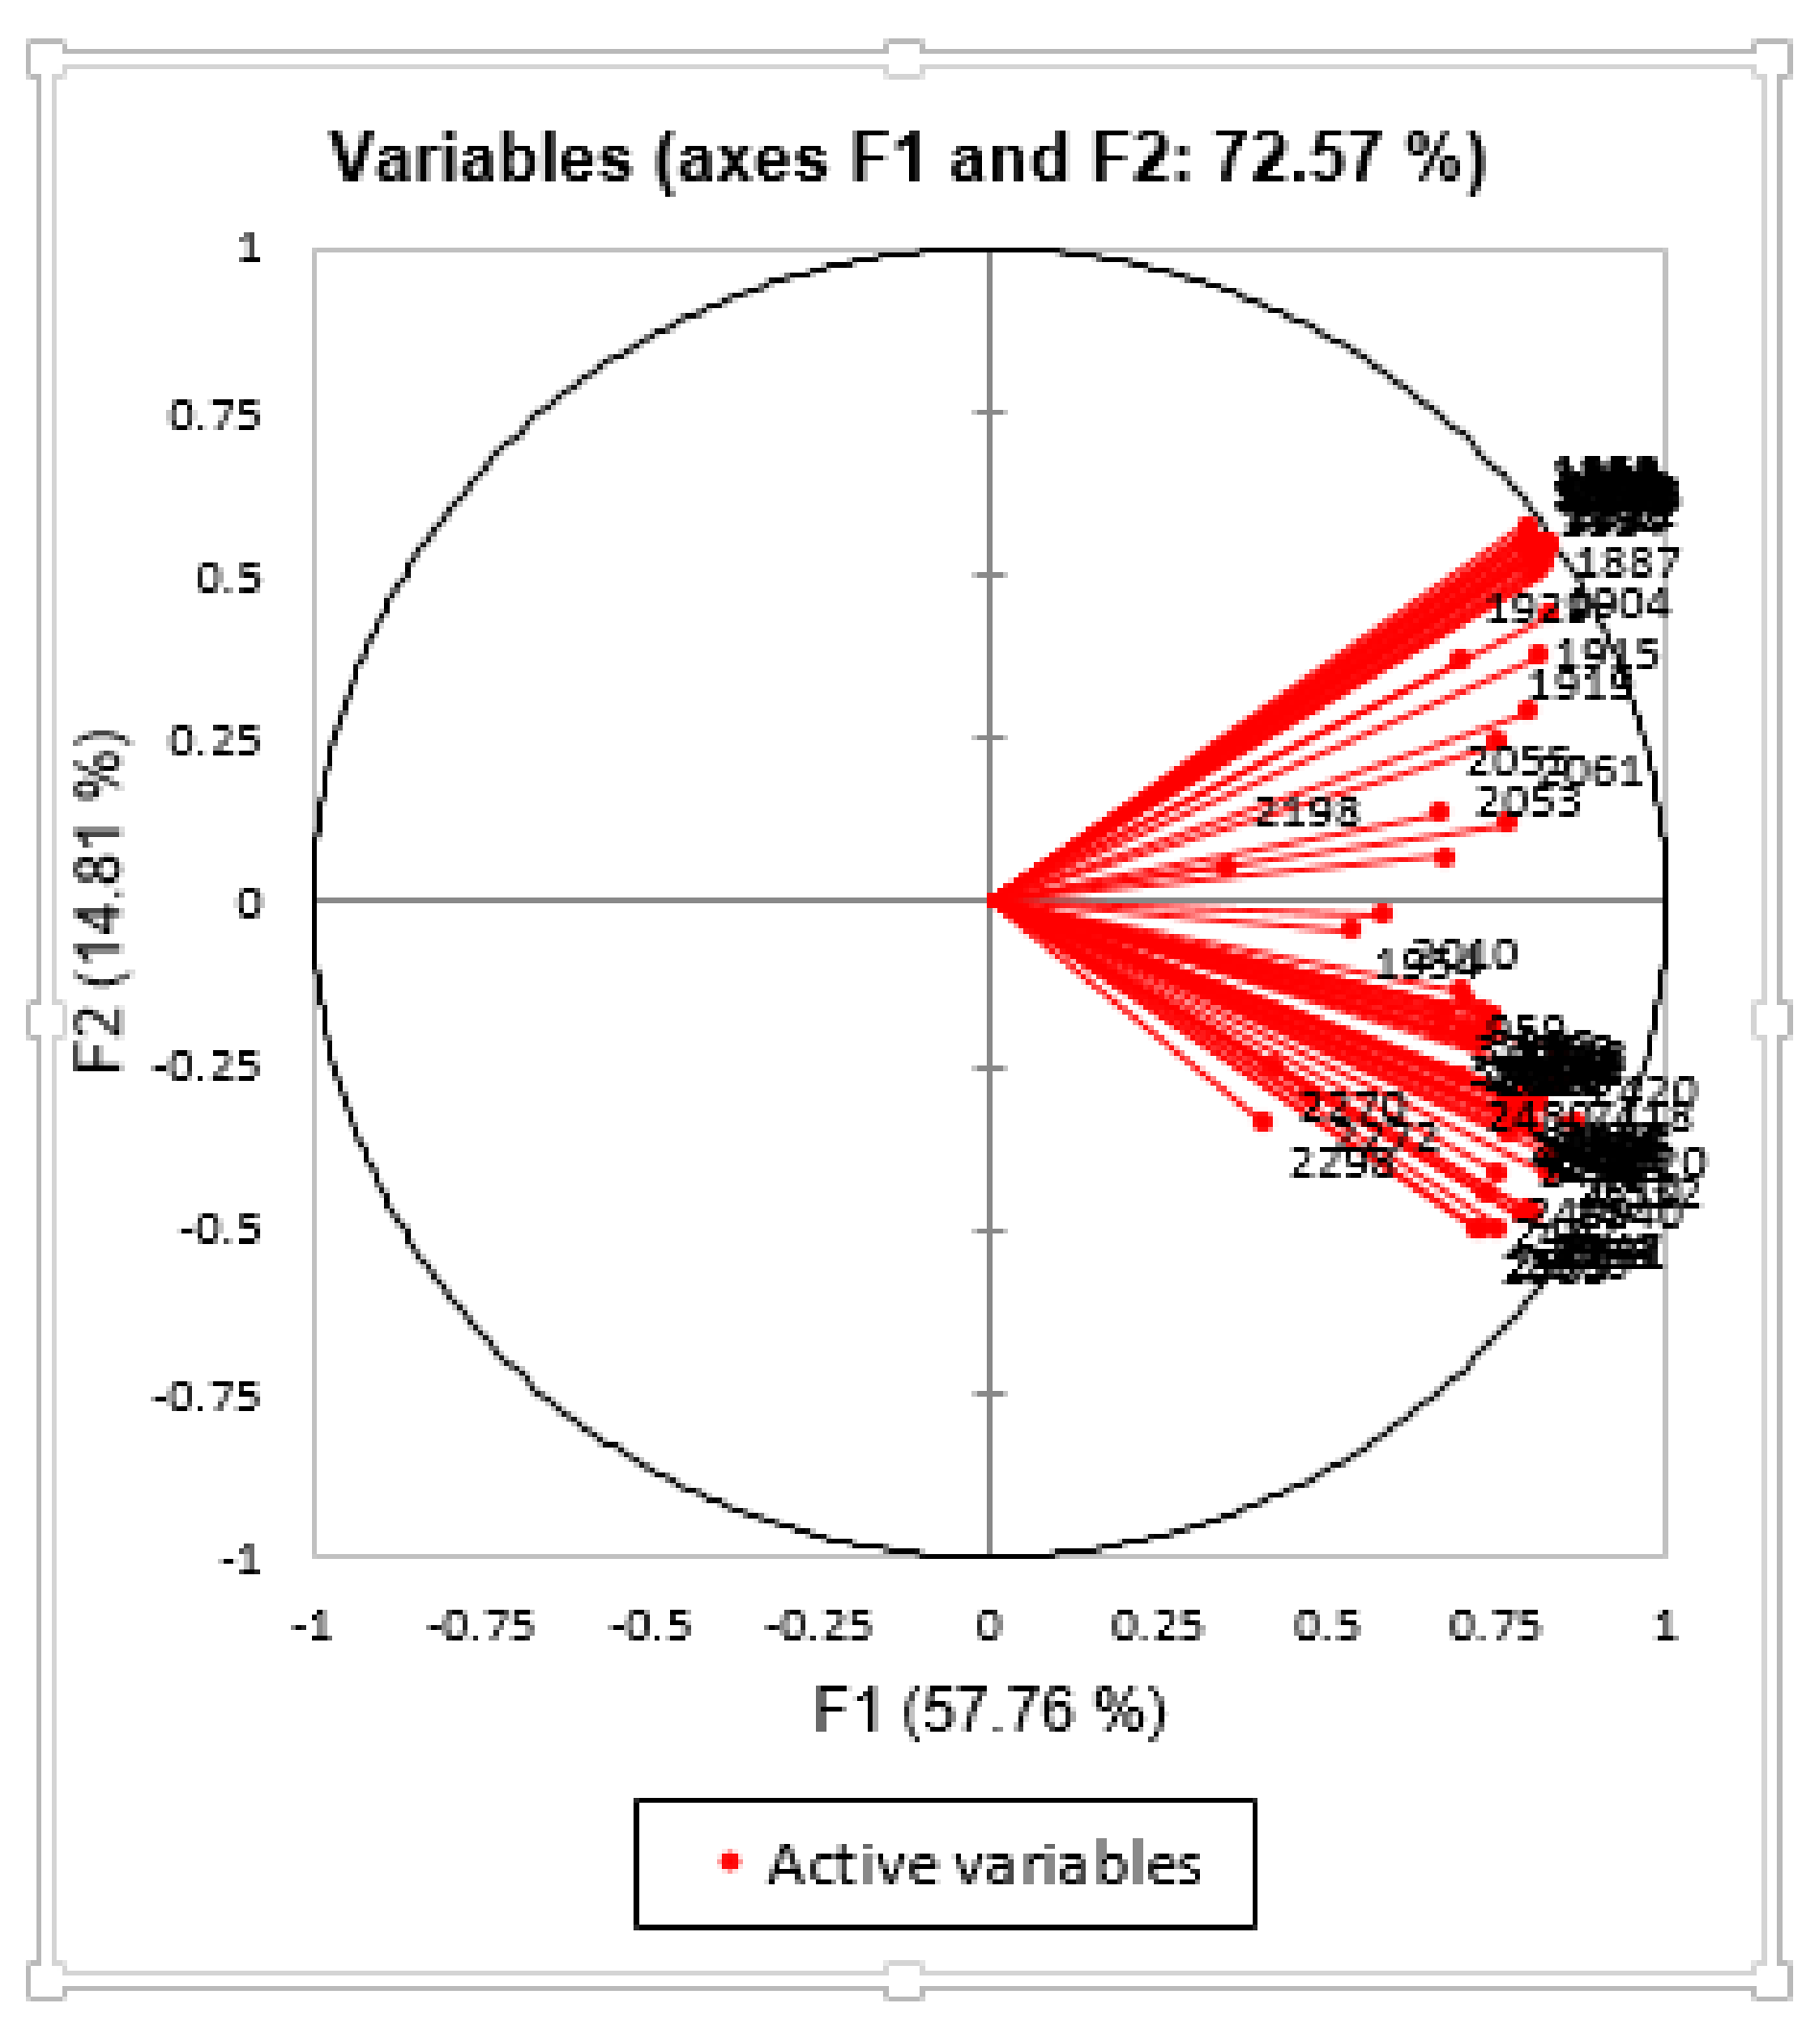
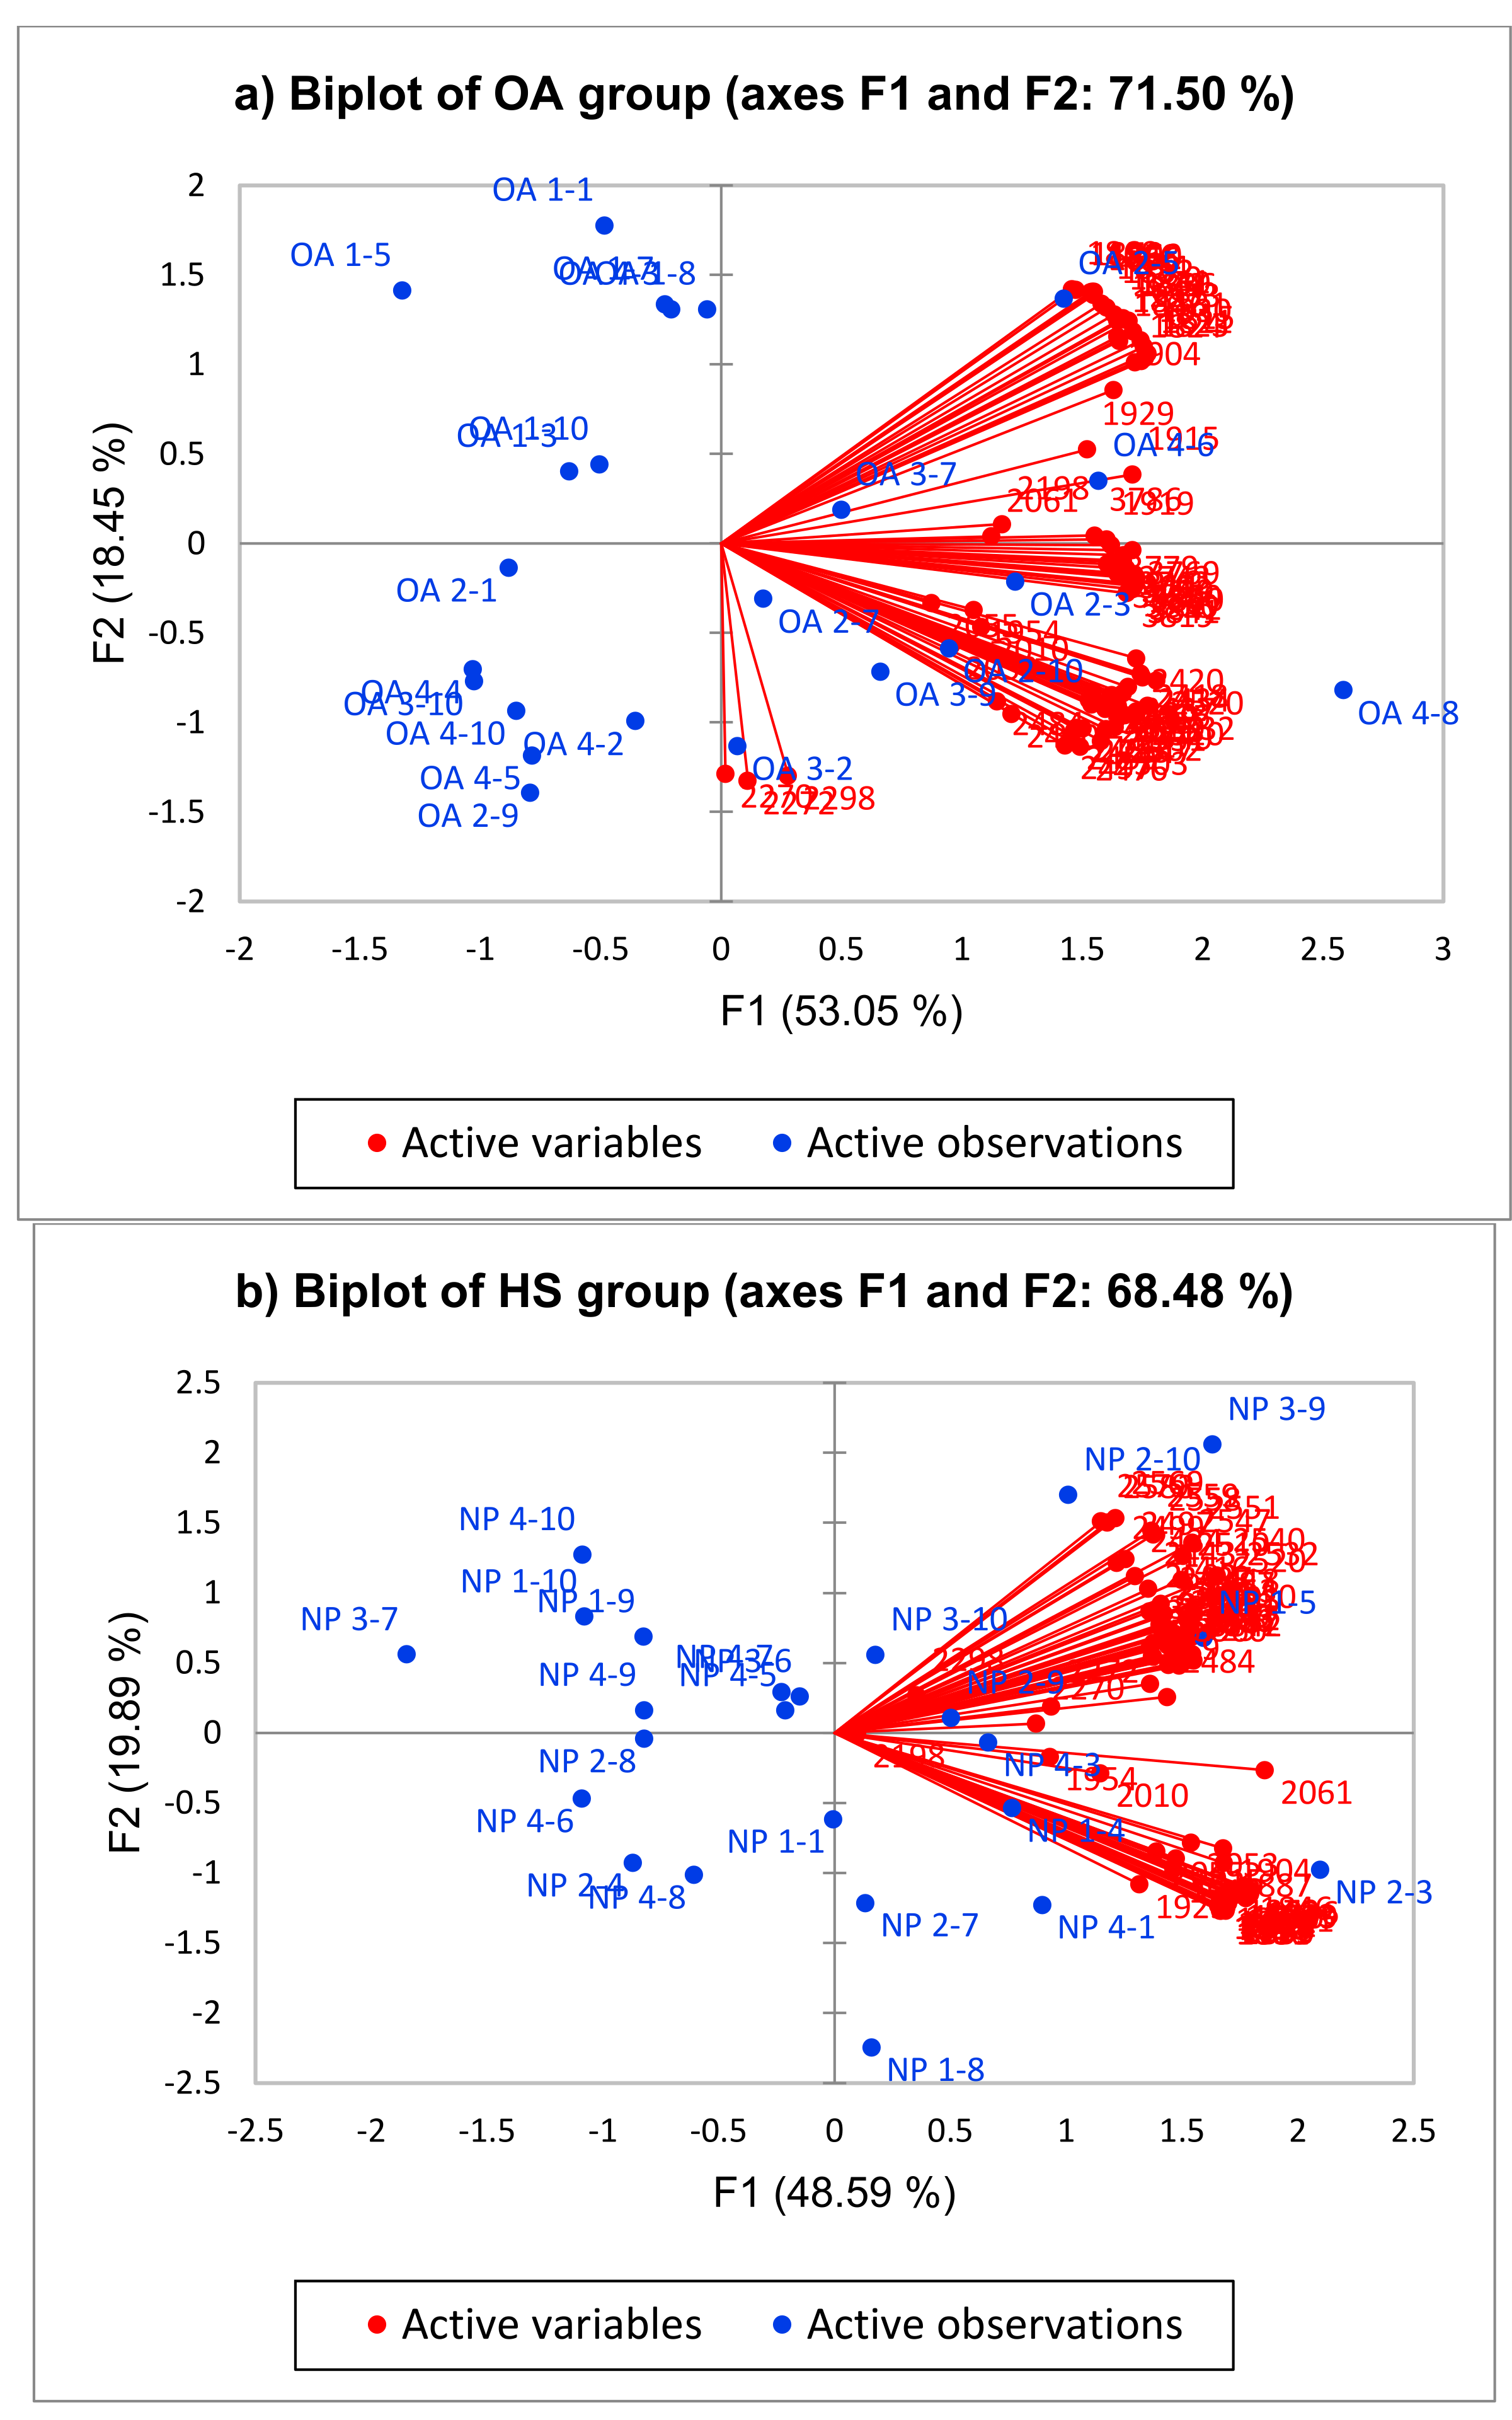
3.2. Apportionment of Wavenumber Contributing to OA in Serum

The greatest options for osteoarthritis biomarkers are most likely structural molecules or fragments associated with cartilage, bone, or synovium and may also include other biological fluids like serum [41]. Diagnostic biomarkers should identify patients at the stage of osteoarthritis where the highest benefit from treatment may be expected. A previous report has shown that serum could be used to determine potential predictive markers such as serum hyaluronan, urinary collagen type II C-telopeptide (uCTX-II) and cartilage oligomeric protein (COMP), all of which are high in populations of individuals with hip or knee osteoarthritis [39]. A recent meta-analysis by [42] found that serum COMP was elevated in patients with knee osteoarthritis and was sensitive to osteoarthritis disease severity. Serum levels of COMP and type II collagen cleavage product (C2C) have also been shown to correlate with knee degeneration in patients with symptomatic knee osteoarthritis [41]. Hence, blood serum was used as the sample of choice in this present study since the relevance of using the blood serum in the diagnosis of OA has been previously reported [43].
Besides performing DA from ATR-FTIR spectral data derived from OA and healthy serum in the present study, PCA was also conducted and it is one of the unsupervised pattern recognition techniques used in multivariate analysis. The reason of conducting PCA is to simplifies the complexity in high-dimensional data and showing the trends or patterns between OA and control groups. Moreover, PCA projects the original data in reduced dimensions defined by the PCs. This technique is useful when there is a correlation between data [44]. In this study, PCA was accomplished using ATR- FTIR spectra wavelength of blood serum from OA and healthy groups at the frequency region of 3994–509 cm−1 after the data were transformed. The OAHS model had two formulas (Formula (1) and (2)), which explained the observation/variables value of 72.57% (Figure 3) for the whole dataset. This observation/variables value indicated that the OAHS model could explain the dataset very well as the CV value was greater than 70% [45]. The ATR-FTIR analysis supported the significant wavelengths from the PCA results, which demonstrated peaking at the wavelengths of 2019–2015 cm−1, 1745–1740cm−1, 1456–1453 cm−1, and 1152–1145 cm−1. Additionally, PCA highlighted the overall significant wavelength from the ATR-FTIR data, describe the correlation and distribution of significant wavelength as identified by the DA in OAHS model as well as demonstrated pattern classification between groups (Figure 4).
The ATR-FTIR analysis revealed the presence of various characteristic functional groups in the serum samples derived from OA and normal subjects. The frequency range and functional groups obtained from the absorption spectra in OA group are presented in Table 4.
With this classification, the spectral differences between the OA and healthy serum samples can be seen, especially in the carboxylic acid (3248 cm−1), alcohol (1000 cm−1), and halo compound (643 cm−1) regions. Osteoarthritis is a degenerative, complex, multifaceted joint disease that eventually causes substantial joint pain. The first signs of cartilage degeneration are proteoglycan (PG) loss and collagen degeneration, leading to higher tissue permeability [48]. This present study found that a peak at wavelength 1000 cm−1, shows changes in proteoglycan, as also recorded in the previous studies [26]. The previous study showed that the accumulated polyunsaturated fatty acids (PUFAs) under an imbalance of lipid metabolism stimulated the release of pro-inflammatory cytokines in the joints driving the cartilage into a stress-induced condition [49] and underwent auto-degradation through chondrocyte death. High PUFA levels can lead to a newly discovered cell death known as ferroptosis [50]. Ferroptosis is the outcome of depleted antioxidant enzymes known as glutathione peroxidase 4 (GPX4) that scavenges PUFA. It has been found that omega-3 (ω-3) and omega-6 (ω-6) are two main families of PUFA, and they are strongly involved in the ferroptosis process [51]. Highly oxidised PUFA enriched in the cell membrane can be hazardous as it can convert the PUFA to PUFA phosphatidyl etherolamine (PUFA-PE) with the help of ACSL4 and LPCAT3 genes leading to the formation of lipid peroxide. This process eventually undergoes lipid peroxidation, thereby leading to ferroptosis. Hence, this information supports the present study’s findings, which showed the presence of FA that was significantly higher in the OA serum samples compared to the serum samples of healthy group.
Referring to the spectrum data from OA serum, a halo compound was also seen at a wavelength of 1000 cm−1. This can be linked to the receipt of knee pain injections containing 6-halo-4-quinolone compound, which is a producing agent administered once a week based on the severity condition of the OA patient [52,53]. The 6-halo-4-quinolone compound is usually used for treating osteoarthritis and in pharmaceutical compositions. The compound is an organic compound that has hydrogen atoms occupying the molecular sites of the halogen atoms in halocarbons. The infrared spectrum table by frequency range showed a wavelength of 635cm−1, which was due to the ring deformation of phenyl compounds. This discovery made sense considering that the halo compound and phenyl compound are often mixed and referred to as halophenyl, a compound used in knee injection for knee injection due to their therapeutic potentials such as an an antimicrobial [54]. While these changes can be visually seen in the average and difference spectra, they might not be statistically significant by themselves, thus requiring the utilisation of the multivariate methods.
The biplot of OA and control group serum samples exhibited two PCs in accordance with 34 and 48 significant wavelengths (p < 0.01), respectively. Figure 5 of the wavelengths in the OA plot shows positive correlations due to same plot direction among 887~1815cm−1 that associated to the extended carbohydrate region (950–1400 cm−1), the amide I region (1585–1720 cm−1), the amide II region (1485–1585 cm−1), and the combination of the carbohydrate, amide I, and amide II regions [55], whereas the wavenumber observed between 3814~3960 cm−1 due to CH, OH, and NH stretch bands was located in the target region for understanding the hydration of cartilage [56]. The biplot of the control group in Figure 5 were grouped in two clusters and showed positive correlations for wavenumber 1815~1954 cm−1 and 2010~2583 cm−1 results from CO2 vibrations [57].

4. Limitations

The limitations of the present study are the fact that the control and OA groups had a wide range of gender. The obtained results were promising considering the limited amount of data for modelling in the current study and it only focused on primary OA instead of taking into account secondary OA as well. In terms of a future strategy, gender groups should be established, and patients might be enrolled based on whether they are in the early, mid, or late stages of OA. The study’s focus can further be narrowed by emphasizing OA in a young population such as among athletes who suffer from stress fracture tibia. To pinpoint precisely which substances are present in the control and OA groups, a more sophisticated analytical tool, like an LCMS or GCMS, could be used.

5. Conclusions

The present study was limited by the relatively low number of samples. However, the overall performance of the DA model was good as the accuracy and PCA were 74.47% and 72.57%, respectively. Furthermore, the ATR-FTIR spectroscopy supported by the chemometric method was successfully employed to discriminate the OA and healthy groups based on the analyses of the blood serum samples. Chemometric tools such as PCA aided in pattern recognition, whereas DA enabled differentiation of the chemical bonding presence between two groups. The results can be further applied to other biological fluids in humans. In conclusion, this was the first study using ATR-FTIR spectroscopy as a potential serum-based screening test for OA in humans. Prospective studies evaluating the predictive model’s performance in a larger population of OA patients with stricter selection criteria are warranted.

Author Contributions

Conceptualization, T.K.; methodology, A.A.A. and M.S.A.S.; software, A.A.A.; validation, A.A.A. and M.S.A.S.; formal analysis, A.A.A. and Y.F.B.A.F.; investigation, A.A.A.; resources, V.S.; data curation, Y.F.B.A.F.; writing—original draft preparation, A.A.A. and V.S.; writing—review and editing, A.A.A., V.S. and M.S.A.S.; visualization, T.K.; supervision, T.K.; project administration, A.A.A. and Y.F.B.A.F.; funding acquisition, T.K. All authors have read and agreed to the published version of the manuscript.

Funding

This work is financially supported by Ministry of Higher Education under the Fundamental Research Grant Scheme (FRGS/1/2022/SKK10/UM/01/2) FP015-2022.

Institutional Review Board Statement

The study was conducted in accordance with the Medical Research Ethics Committee and approved by the University of Malaya Medical Centre (UMMC), MREC ID NO: 2016927-4288.

Informed Consent Statement

Informed consent was obtained from all subjects involved in the study.

Data Availability Statement

Data available in a publicly accessible repository.

Conflicts of Interest

The authors declare no conflict of interest.

References

  1. Hsu, H.; Siwiec, R.M. Knee Osteoarthritis; StatPearls Publishing: Treasure Island, FL, USA, 2018. [Google Scholar]
  2. Migliorini, F.; Pintore, A.; Torsiello, E.; Oliva, F.; Spiezia, F.; Maffulli, N. Intensive Physical Activity Increases the Risk of Knee and Hip Arthroplasty: A Systematic Review. Sport. Med. Arthrosc. Rev. 2022, 30, 111–116. [Google Scholar] [CrossRef] [PubMed]
  3. Hulshof, C.T.J.; Pega, F.; Neupane, S.; Colosio, C.; Daams, J.G.; Kc, P.; Kuijer, P.P.F.M.; Mandic-Rajcevic, S.; Masci, F.; van der Molen, H.F. The effect of occupational exposure to ergonomic risk factors on osteoarthritis of hip or knee and selected other musculoskeletal diseases: A systematic review and meta-analysis from the WHO/ILO Joint Estimates of the Work-related Burden of Disease and Injury. Environ. Int. 2021, 150, 106349. [Google Scholar] [PubMed]
  4. Hunter, D.J.; March, L.; Chew, M. Osteoarthritis in 2020 and beyond: A Lancet Commission. Lancet 2020, 396, 1711–1712. [Google Scholar] [CrossRef] [PubMed]
  5. He, Y.; Li, Z.; Alexander, P.G.; Ocasio-Nieves, B.D.; Yocum, L.; Lin, H.; Tuan, R.S. Pathogenesis of osteoarthritis: Risk factors, regulatory pathways in chondrocytes, and experimental models. Biology 2020, 9, 194. [Google Scholar] [CrossRef]
  6. Rim, Y.A.; Nam, Y.; Ju, J.H. The role of chondrocyte hypertrophy and senescence in osteoarthritis initiation and progression. Int. J. Mol. Sci. 2020, 21, 2358. [Google Scholar] [CrossRef] [Green Version]
  7. Jiménez, G.; Cobo-Molinos, J.; Antich, C.; López-Ruiz, E. Osteoarthritis: Trauma vs disease. In Osteochondral Tissue Engineering; Springer: Berlin/Heidelberg, Germany, 2018; pp. 63–83. [Google Scholar]
  8. Bolduc, J.A.; Collins, J.A.; Loeser, R.F. Reactive oxygen species, aging and articular cartilage homeostasis. Free Radic. Biol. Med. 2019, 132, 73–82. [Google Scholar] [CrossRef]
  9. Thomas, A.C.; Hubbard-Turner, T.; Wikstrom, E.A.; Palmieri-Smith, R.M. Epidemiology of posttraumatic osteoarthritis. J. Athl. Train. 2017, 52, 491–496. [Google Scholar] [CrossRef] [Green Version]
  10. Brahim, A.; Jennane, R.; Riad, R.; Janvier, T.; Khedher, L.; Toumi, H.; Lespessailles, E. A decision support tool for early detection of knee OsteoArthritis using X-ray imaging and machine learning: Data from the OsteoArthritis Initiative. Comput. Med. Imaging Graph. 2019, 73, 11–18. [Google Scholar] [CrossRef]
  11. Hayashi, D.; Roemer, F.W.; Guermazi, A. Imaging of Osteoarthritis by Conventional Radiography, MR Imaging, PET–Computed Tomography, and PET–MR Imaging. PET Clin. 2019, 14, 17–29. [Google Scholar] [CrossRef]
  12. Yeğin, T.; Altan, L.; Aksoy, M.K. The effect of therapeutic ultrasound on pain and physical function in patients with knee osteoarthritis. Ultrasound Med. Biol. 2017, 43, 187–194. [Google Scholar] [CrossRef]
  13. Sulaiman, S.Z.S.; Tan, W.M.; Radzi, R.; Shafie, I.N.F.; Ajat, M.; Mansor, R.; Mohamed, S.; Ng, A.M.H.; Lau, S.F. Comparison of bone and articular cartilage changes in osteoarthritis: A micro-computed tomography and histological study of surgically and chemically induced osteoarthritic rabbit models. J. Orthop. Surg. Res. 2021, 16, 663. [Google Scholar] [CrossRef]
  14. Karpiński, R. Knee joint osteoarthritis diagnosis based on selected acoustic signal discriminants using machine learning. Appl. Comput. Sci. 2022, 18, 71–85. [Google Scholar] [CrossRef]
  15. Qiu, X.; Liu, Z.; Zhuang, M.; Cheng, D.; Zhu, C.; Zhang, X. Fusion of cnn1 and cnn2-based magnetic resonance image diagnosis of knee meniscus injury and a comparative analysis with computed tomography. Comput. Methods Programs Biomed. 2021, 211, 106297. [Google Scholar] [CrossRef]
  16. Zhang, W.; Robertson, W.B.; Zhao, J.; Chen, W.; Xu, J. Emerging trend in the pharmacotherapy of osteoarthritis. Front. Endocrinol. 2019, 10, 431. [Google Scholar] [CrossRef]
  17. Krakowski, P.; Nogalski, A.; Jurkiewicz, A.; Karpiński, R.; Maciejewski, R.; Jonak, J. Comparison of diagnostic accuracy of physical examination and MRI in the most common knee injuries. Appl. Sci. 2019, 9, 4102. [Google Scholar] [CrossRef] [Green Version]
  18. Chong, T.; Don, D.W.; Kao, M.C.; Wong, D.; Mitra, R. The value of physical examination in the diagnosis of hip osteoarthritis. J. Back Musculoskelet. Rehabil. 2013, 26, 397–400. [Google Scholar] [CrossRef]
  19. Maheu, E.; Bannuru, R.R.; Herrero-Beaumont, G.; Allali, F.; Bard, H.; Migliore, A. Why we should definitely include intra-articular hyaluronic acid as a therapeutic option in the management of knee osteoarthritis: Results of an extensive critical literature review. Semin. Arthritis Rheum. 2019, 48, 563–572. [Google Scholar] [CrossRef]
  20. Zhang, H.; Cai, D.; Bai, X. Macrophages regulate the progression of osteoarthritis. Osteoarthr. Cartil. 2020, 28, 555–561. [Google Scholar] [CrossRef]
  21. Anderson, J.R.; Chokesuwattanaskul, S.; Phelan, M.M.; Welting, T.J.; Lian, L.Y.; Peffers, M.J.; Wright, H.L. 1H NMR metabolomics identifies underlying inflammatory pathology in osteoarthritis and rheumatoid arthritis synovial joints. J. Proteome Res. 2018, 17, 3780–3790. [Google Scholar] [CrossRef] [Green Version]
  22. Shi, X.; Wu, P.; Jie, L.; Zhang, L.; Mao, J.; Yin, S. Integrated Serum Metabolomics and Network Pharmacology to Reveal the Interventional Effects of Quzhi Decoction against Osteoarthritis Pain. Int. J. Anal. Chem. 2022, 2022, 9116175. [Google Scholar] [CrossRef]
  23. Leal, L.B.; Nogueira, M.S.; Canevari, R.A.; Carvalho, L.F.C.S. Vibration spectroscopy and body biofluids: Literature review for clinical applications. Photodiagnosis Photodyn. Ther. 2018, 24, 237–244. [Google Scholar] [CrossRef] [PubMed]
  24. Balan, V.; Mihai, C.T.; Cojocaru, F.D.; Uritu, C.M.; Dodi, G.; Botezat, D.; Gardikiotis, I. Vibrational spectroscopy fingerprinting in medicine: From molecular to clinical practice. Materials 2019, 12, 2884. [Google Scholar] [CrossRef] [PubMed] [Green Version]
  25. Jamwal, R.; Kumari, S.; Sharma, S.; Kelly, S.; Cannavan, A.; Singh, D.K. Recent trends in the use of FTIR spectroscopy integrated with chemometrics for the detection of edible oil adulteration. Vib. Spectrosc. 2021, 113, 103222. [Google Scholar] [CrossRef]
  26. Virtanen, V.; Tafintseva, V.; Shaikh, R.; Nippolainen, E.; Haas, J.; Afara, I.O.; Töyräs, J.; Kröger, H.; Solheim, J.; Zimmermann, B.; et al. Infrared spectroscopy is suitable for objective assessment of articular cartilage health. Osteoarthr. Cartil. Open 2022, 4, 100250. [Google Scholar] [CrossRef]
  27. Enders, A.A.; North, N.M.; Fensore, C.M.; Velez-Alvarez, J.; Allen, H.C. Confidential Manuscript: Functional group identification for FTIR spectra using image-based machine learning models. Anal. Chem. 2021, 93, 9711–9718. [Google Scholar] [CrossRef]
  28. Feng, A.L.; Wesely, N.C.; Hoehle, L.P.; Phillips, K.M.; Yamasaki, A.; Campbell, A.P.; Gregorio, L.L.; Killeen, T.E.; Caradonna, D.S.; Meier, J.C.; et al. A validated model for the 22-item Sino-Nasal Outcome Test subdomain structure in chronic rhinosinusitis. Int. Forum Allergy Rhinol. 2017, 7, 1140–1148. [Google Scholar] [CrossRef]
  29. Ismail, A.M.; Sani, M.S.A.; Azid, A.; Zaki, N.N.M.; Arshad, S.; Tukiran, N.A.; Abidin, S.A.S.Z.; Samsudin, M.S.; Ismail, A. Food forensics on gelatine source via ultra-high-performance liquid chromatography diode-array detector and principal component analysis. SN Appl. Sci. 2021, 3, 79. [Google Scholar] [CrossRef]
  30. Sani, M.S.A.; Ismail, A.M.; Azid, A.; Samsudin, M.S. Establishing forensic food models for authentication and quantification of porcine adulterant in gelatine and marshmallow. Food Control 2021, 130, 108350. [Google Scholar] [CrossRef]
  31. Liang, D.; Xu, W.; Bai, X. An end-to-end transformer model for crowd localisation. arXiv 2022, arXiv:2202.13065. [Google Scholar]
  32. Santiago, D.D.B.; Barbosa, H.A.; Correia Filho, W.L.F.; Oliveira-Júnior, J.F.D. Interactions of Environmental Variables and Water Use Efficiency in the Matopiba Region via Multivariate Analysis. Sustainability 2022, 14, 8758. [Google Scholar] [CrossRef]
  33. Morais, C.L.; Lima, K.M.; Singh, M.; Martin, F.L. Tutorial: Multivariate classification for vibrational spectroscopy in biological samples. Nat. Protoc. 2020, 15, 2143–2162. [Google Scholar] [CrossRef] [PubMed]
  34. Talari, A.C.S.; Movasaghi, Z.; Rehman, S.; Rehman, I.U. Raman spectroscopy of biological tissues. Appl. Spectrosc. Rev. 2015, 50, 46–111. [Google Scholar] [CrossRef]
  35. Yu, K.; Wang, G.; Cai, W.; Wu, D.; Wei, X.; Zhang, K.; Liu, R.; Sun, Q.; Wang, Z. Identification of antemortem, perimortem and postmortem fractures by FTIR spectroscopy based on a rabbit tibial fracture model. Spectrochim. Acta Part A: Mol. Biomol. Spectrosc. 2020, 239, 118535. [Google Scholar] [CrossRef]
  36. Westad, F.; Marini, F. Validation of chemometric models–a tutorial. Anal. Chim. Acta 2015, 893, 14–24. [Google Scholar] [CrossRef] [PubMed]
  37. Van Oudenaarde, K.; Jobke, B.; Oostveen, A.C.M.; Marijnissen, A.C.A.; Wolterbeek, R.; Wesseling, J.; Bierma-Zeinstra, S.M.A.; Bloem, H.L.; Reijnierse, M.; Kloppenburg, M. Predictive value of MRI features for development of radiographic osteoarthritis in a cohort of participants with pre-radiographic knee osteoarthritis—The CHECK study. Rheumatology 2016, 56, 113–120. [Google Scholar] [CrossRef] [Green Version]
  38. Guermazi, A.; Burstein, D.; Conaghan, P.; Eckstein, F.; Le Graverand-Gastineau, M.P.H.; Keen, H.; Roemer, F.W. Imaging in osteoarthritis. Rheum. Dis. Clin. North Am. 2008, 34, 645–687. [Google Scholar] [CrossRef]
  39. Attur, M.; Krasnokutsky-Samuels, S.; Samuels, J.; Abramson, S.B. Prognostic biomarkers in osteoarthritis. Curr. Opin. Rheumatol. 2013, 25, 136. [Google Scholar] [CrossRef] [Green Version]
  40. Wang, Y.Y.; Li, J.Q.; Liu, H.G.; Wang, Y.Z. Attenuated total reflection-Fourier transform infrared spectroscopy (ATR-FTIR) combined with chemometrics methods for the classification of Lingzhi species. Molecules 2019, 24, 2210. [Google Scholar] [CrossRef] [Green Version]
  41. Lotz, M.; Martel-Pelletier, J.; Christiansen, C.; Brandi, M.L.; Bruyère, O.; Chapurlat, R.; Collette, J.; Cooper, C.; Giacovelli, G.; Kanis, J.A.; et al. Republished: Value of biomarkers in osteoarthritis: Current status and perspectives. Postgrad. Med. J. 2014, 90, 171–178. [Google Scholar] [CrossRef] [Green Version]
  42. Hoch, J.M.; Mattacola, C.G.; McKeon, J.M.; Howard, J.S.; Lattermann, C. Serum cartilage oligomeric matrix protein (sCOMP) is elevated in patients with knee osteoarthritis: A systematic review and meta-analysis. Osteoarthr. Cartil. 2011, 19, 1396–1404. [Google Scholar] [CrossRef] [Green Version]
  43. Heard, B.J.; Rosvold, J.M.; Fritzler, M.J.; El-Gabalawy, H.; Wiley, J.P.; Krawetz, R.J. Blood serum to diagnose osteoarthritis–biomarkers and machine learning. Osteoarthr. Cartil. 2014, 22, S64. [Google Scholar] [CrossRef]
  44. Reedy, J.; Lerman, J.L.; Krebs-Smith, S.M.; Kirkpatrick, S.I.; Pannucci, T.E.; Wilson, M.M.; Subar, A.F.; Kahle, L.L.; Tooze, J.A. Evaluation of the healthy eating index-2015. J. Acad. Nutr. Diet. 2018, 118, 1622–1633. [Google Scholar] [CrossRef] [PubMed]
  45. Elkorashey, R.M. Utilising chemometric techniques to evaluate water quality spatial and temporal variation. A case study: Bahr El-Baqar drain—Egypt. Environ. Technol. Innov. 2022, 26, 102332. [Google Scholar] [CrossRef]
  46. Alberto-Silva, C.; Malheiros, F.B.M.; Querobino, S.M. Fourier-transformed infrared spectroscopy, physicochemical and biochemical properties of chondroitin sulfate and glucosamine as supporting information on quality control of raw materials. Future J. Pharm. Sci. 2020, 6, 98. [Google Scholar] [CrossRef]
  47. Talari, A.C.S.; Martinez, M.A.G.; Movasaghi, Z.; Rehman, S.; Rehman, I.U. Advances in Fourier transform infrared (FTIR) spectroscopy of biological tissues. Appl. Spectrosc. Rev. 2017, 52, 456–506. [Google Scholar] [CrossRef]
  48. Mononen, M.E.; Tanska, P.; Isaksson, H.; Korhonen, R.K. New algorithm for simulation of proteoglycan loss and collagen degeneration in the knee joint: Data from the osteoarthritis initiative. J. Orthop. Res. 2018, 36, 1673–1683. [Google Scholar] [CrossRef]
  49. Loh, K.W.; Shaz, N.; Singh, S.; Raman, M.M.; Raghavendran, H.R.B.; Kamarul, T. Cytokine release by human bone marrow stromal cells isolated from osteoarthritic and diabetic osteoarthritic patients in vitro. J. Basic Clin. Physiol. Pharmacol. 2021. [Google Scholar] [CrossRef]
  50. Stockwell, B.R.; Angeli, J.P.F.; Bayir, H.; Bush, A.I.; Conrad, M.; Dixon, S.J.; Fulda, S.; Gascón, S.; Hatzios, S.K.; Kagan, V.E. Ferroptosis: A regulated cell death nexus linking metabolism, redox biology, and disease. Cell 2017, 171, 273–285. [Google Scholar] [CrossRef] [Green Version]
  51. Xu, Y.; Qian, S.Y. Anti-cancer activities of ω-6 polyunsaturated fatty acids. Biomed. J. 2014, 37, 112. [Google Scholar]
  52. Caruso, I. Use of 6-halo-4-quinolone Compounds and Pharmaceutical Compositions Thereof for the Preparation of a Medicament for the Therapeutical Application in Rheumatoid Arthritis. EP0361177A2. Available online: https://patents.google.com/patent/EP0361177A2/en (accessed on 29 August 1988).
  53. Brighty, K.E.; Gootz, T.D. Chemistry and mechanism of action of the quinolone antibacterials. In The Quinolones; Academic Press: Cambridge, MA, USA, 1990; pp. 33–97. [Google Scholar]
  54. Abdel-Aziz, H.A.; Eldehna, W.M.; Fares, M.; Al-Rashood, S.T.A.; Abdel-Aziz, M.M.; Soliman, D.H. Synthesis, biological evaluation and 2D-QSAR study of halophenyl bis-hydrazones as antimicrobial and antitubercular agents. Int. J. Mol. Sci. 2015, 16, 8719–8743. [Google Scholar] [CrossRef] [Green Version]
  55. Oinas, J.; Rieppo, L.; Finnilä, M.A.J.; Valkealahti, M.; Lehenkari, P.; Saarakkala, S. Imaging of osteoarthritic human articular cartilage using fourier transform infrared microspectroscopy combined with multivariate and univariate analysis. Sci. Rep. 2016, 6, 30008. [Google Scholar] [CrossRef] [Green Version]
  56. Unal, M.; Akkus, O. Shortwave-infrared Raman spectroscopic classification of water fractions in articular cartilage ex vivo. J. Biomed. Opt. 2018, 23, 015008. [Google Scholar] [CrossRef]
  57. Yavorskyy, A.; Hernandez-Santana, A.; McCarthy, G.; McMahon, G. Detection of calcium phosphate crystals in the joint fluid of patients with osteoarthritis–analytical approaches and challenges. Analyst 2008, 133, 302–318. [Google Scholar] [CrossRef]
Figure 1. The framework of the infrared spectroscopy combined chemometrics in osteoarthritis human serum.
Processes 11 00404 g001
Figure 2. Comparison of FTIR spectra of OA and healthy serum.
Processes 11 00404 g002
Figure 3. Principle component analysis (PCA) of OAHS model by showing the significant wavelength involved in the OAHS dataset with observation/variables value of 72.57%. The observation/variables value indicated that PCA of OAHS model could explain the dataset very well as the CV value was greater than 70% [45].
Processes 11 00404 g003
Figure 4. The Principle Component Analysis (PCA) in OAHS model. The PCA model could explain the dataset very well by showing Observation/Variables value of 100% and demonstrated well pattern classification between two groups. (Green classes: OA group & Blue classes: HS).
Processes 11 00404 g004
Figure 5. Biplot of OA and HS group by showing the significant and different wavelength involved in each groups.
Processes 11 00404 g005
Table 1. Criteria for selection of each study group.
Inclusion Control Group
(Non-OA)
Inclusion Experimental Group
(OA Group)
Exclusion Control and Experimental Group
  • Individuals around 60–80 years from normal population which came to the Blood Bank for donating in UM Medical Centre (UMMC), Malaysia.
  • Patients with symptomatic radiographic primary knee OA, attending the orthopaedic clinic in UM Medical Centre (UMMC), Malaysia will be recruited.
  • Patients with end-stage OA disease that were planned to receive an arthroplasty (OA group).
  • Patient with mild to established OA that had no indication for an arthroplasty.
  • Individual who are unable and unwilling to provide written informed consent (signature or thumbprint if unable to write).
  • Individual who has medical history of inflammatory diseases such as autoimmune disease.
  • Individual who has been taking anti-inflammatory drugs especially nonsteroidal anti-inflammatory drugs (NSAIDs).
Table 2. The KMO test produced a KMO score of 0.820 for 250 datasets.
Kaiser-Mayer Measure of Sampling Adequacy:
KMO: 0.820
Table 3. Classification matrix of training, validation, testing and verification datasets by discriminant analysis (DA). DA in OAHS model can accurately classify 100% for the training dataset, 74.47% for the cross-validation dataset, and 100% for the testing dataset to its classes.
Discriminating Model (DM)Ranking of Significant of Functional Group (cm−1) Contributed to Discriminating Model (p < 0.01)DatasetCorrect Classification (100%)
OAHS: Osteoarthritis & healthy serum3960, 3880, 3860, 3850, 3842, 3841, 3819, 3816, 3814, 3786, 3779, 3769, 3743, 3742, 3729, 2583, 2579, 2569, 2559, 2558, 2551, 2547, 2540, 2532, 2520, 2510, 2503, 2502, 2499, 2497, 2487, 2484, 2480, 2476, 2459, 2458, 2455, 2453, 2443, 2439, 2437, 2434, 2420, 2418, 2416, 2298, 2272, 2270, 2198, 2061, 2055, 2053, 2010, 1954, 1929, 1919, 1915, 1904, 1887, 1870, 1869, 1866, 1865, 1860, 1858, 1856, 1854, 1852, 1850, 1846, 1843, 1841, 1839, 1836, 1833, 1831, 1830, 1824, 1823, 1821, 1815, 959Training dataset
0%100%
100%100%
Total100%
Cross-validation dataset
0%79.17%
100%69.57%
Total74.47%
Testing dataset
0%100%
100%100%
Total100%
Verification dataset
0%100%
100%100%
Total100%
Table 4. FTIR frequency range and functional groups obtained from absorption spectra in serum from osteoarthritis patients.
PeakFrequency Range (cm−1)Functional GroupCompound ClassDescriptionReferences
13248O-H StretchingCarboxylic AcidCarboxylic Acid Indicates Fatty Acids Level[46]
21000C-O StretchingAlcoholAssociated With The Changes In The Proteoglycan Contents[26,27,28,29,30,31,32,33,34,35,36,37,38,39,40,41,42,43,44,45,46,47]
3635C-Ci StretchingHalo CompoundDue To The Presence Of Ring Deformation Of Phenyl Compounds.[34]
Disclaimer/Publisher’s Note: The statements, opinions and data contained in all publications are solely those of the individual author(s) and contributor(s) and not of MDPI and/or the editor(s). MDPI and/or the editor(s) disclaim responsibility for any injury to people or property resulting from any ideas, methods, instructions or products referred to in the content.

