Review

Review of Development and Comparison of Surface Thermometry Methods in Combustion Environments: Principles, Current State of the Art, and Applications

State Key Laboratory of Clean Energy Utilization, Zhejiang University, Hangzhou 310027, China
*
Author to whom correspondence should be addressed.
Processes 2022, 10(12), 2528; https://doi.org/10.3390/pr10122528
Submission received: 2 September 2022 / Revised: 11 October 2022 / Accepted: 16 November 2022 / Published: 28 November 2022
(This article belongs to the Special Issue Advanced Combustion and Combustion Diagnostic Techniques)

Abstract

:
Temperature is one of the most important parameters in the combustion processes. Accurate surface temperature can help to gain insight into the combustion characteristics of various solid or liquid fuels, as well as to evaluate the operating status of combustion power facilities such as internal combustion engines and gas turbines. This paper mainly summarizes and compares the main surface thermometry techniques, from the aspects of their principles, current state of development, and specific applications. These techniques are divided into two categories: contact-based thermometry and non-intrusive thermometry. In contact-based thermometry, conventional thermocouples as well as thin-film thermocouples are introduced. These methods have been developed for a long time and are simple and economical. However, such methods have disadvantages such as interference to flow and temperature field and poor dynamic performance. Furthermore, this paper reviews the latest non-intrusive thermometry methods, which have gained more interest in recent years, including radiation thermometry, laser-induced phosphorescence, liquid crystal thermography, the temperature-sensitive paint technique, and the temperature-indicating paint technique. Among them, we highlighted radiation thermometry, which has the widest measurement ranges and is easy to acquire results with spatial resolution, as well as laser-induced phosphorescence thermometry, which is not interfered with by the emissivity and surrounding environment, and has the advantages of fast response, high sensitivity, and small errors. Particularly, laser-induced phosphoresce has attracted a great deal of attention, as it gets rid of the influence of emissivity. In recent years, it has been widely used in the thermometry of various combustion devices and fuels. At the end of this paper, the research progress of the above-mentioned laser-induced phosphorescence and other techniques in recent years for the surface thermometry of various solid or liquid fuels is summarized, as well as applications of combustion facilities such as internal combustion engines, gas turbines, and aero engines, which reveal the great development potential of laser-induced phosphorescence technology in the field of surface thermometry.

1. Introduction

Combustion is a fast chemical process in which fuels react rapidly with oxidants and give off heat and light [1]. It is widely applied in power engineering and industry, either for heating purposes or electricity generation by driving a turbine. In addition, for aircrafts or rockets, combustion plays an important role in their propulsion systems, where thrust is generated. To characterize the combustion process, various parameters such as temperature, pressure, velocity, and species concentrations should be accurately measured. In particular, temperature information is virtually indispensable in the study of combustion, since it is closely related to the chemical reaction process, energy conversion efficiency and operation safety. Therefore, temperature measurement in different environments and conditions arouses numerous investigations.
Temperature is the fundamental thermodynamic parameter to weight the ‘hotness’ of matter [2,3]. From the microscopic view, temperature reflects the intensity of the thermal motion of molecules. Temperature is measured by its relationship with some phenomena such as thermal expansion, thermoelectric effects, fluorescence, phosphorescence, radiation, etc. Generally speaking, all the temperature-dependent effects could be used for thermometry. For example, a mercury-filled glass thermometer, one of the most common thermometers, exploits differences between the expansion coefficient of mercury and glass to indicate temperature. Like the mercury thermometer, there are quite a lot of thermometers that utilize medium expansion effect to measure temperatures, e.g., alcohol thermometers. However, their measurement ranges are dependent on the physical properties of the medium, and usually the upper limit of temperature measurement is low. Thus, they are seldom employed in combustion environments in recent years. For a typical combustion system, temperature measurement could be divided into surface temperature measurement and gas temperature measurement, according to different objectives and correspondingly different measurement methods. Apparently, the former refers to the wall temperature of the heating surface, e.g., wall of combustor chamber, turbine blade, or heat exchanger surface, as well as the temperature of liquid or solid fuels in the combustion system. The latter usually refers to the flame temperature, or the temperature of flue gas after combustion. In this review, we only focus on the current state of surface temperature measurement techniques with their principles, developments, and applications. Therefore, some well-known temperature methods such as coherent anti-Stokes Raman spectroscopy (CARS) [4] are not involved in this work.
Techniques for surface temperature measurement could be broadly divided into two categories: contact-based thermometry, which is mainly composed of various types of thermocouples and thermistors, as well as non-intrusive thermometry, e.g., radiation thermometry and laser-based techniques. Strictly speaking, there is a third category that is called the semi-intrusive method [5]. The representative methods are laser-induced phosphorescence (LIP), thermochromic liquid crystal (TLC) thermography, temperature-sensitive paint (TSP) technique, and temperature-indicating paint technique. In these methods, temperature-dependent coatings are applied to the target surface and optical detectors are utilized to monitor the surface temperature. Since these methods generally do not interfere with the measured temperature field, they are also classified as non-contact measurement methods in this review. To select a proper technique in a certain combustion environment, accuracy, sensitivity, measurement range, resolution, reliability, life span, and cost need to be considered. Thus, thermometry techniques have been gradually developed and novel thermometry methods have been invented to meet people’s requirements for the above considerations. In addition, development of temperature measurements is heading in the direction of wider temperature range, faster response speed, higher measurement accuracy and more reliability in harsh environments. In the following section, both contact-based thermometry (in Section 2) and non-intrusive thermometry (in Section 3) are introduced. Particularly, phosphor thermometry, as one of the state-of-the-art techniques, is thoroughly discussed. These will give some advice for readers to choose a suitable technique for their situation. Finally, applications of the introduced techniques in different environments and outlook for future development are given in Section 4 and Section 5, respectively.

2. Contact-Based Thermometry

As the name suggests, contact-based thermometry is the temperature measurement method using sensors directly in contact with the target surface to be measured. To achieve an accurate measurement of the surface temperature, equilibrium between the target surface and the sensor should be reached. A thermocouple is the most common equipment based on contact thermometry. Other instruments such as liquid-in-glass thermometers and temperature-dependent resistance devices are also convenient contact measurement means. However, as we mentioned above, the techniques involved in this work are under the circumstance of combustion. Therefore, only thermocouples are illustrated here. In this section, the principle and development of a thermocouple are introduced. In addition, a thin-film thermocouple is introduced separately, due to its great advantages and applications in aero engines where the environment is usually quite harsh. At the end of this section, limitations of contact-based thermometry are discussed to give readers an idea of why there are more and more demands for non-contact temperature measurement methods.

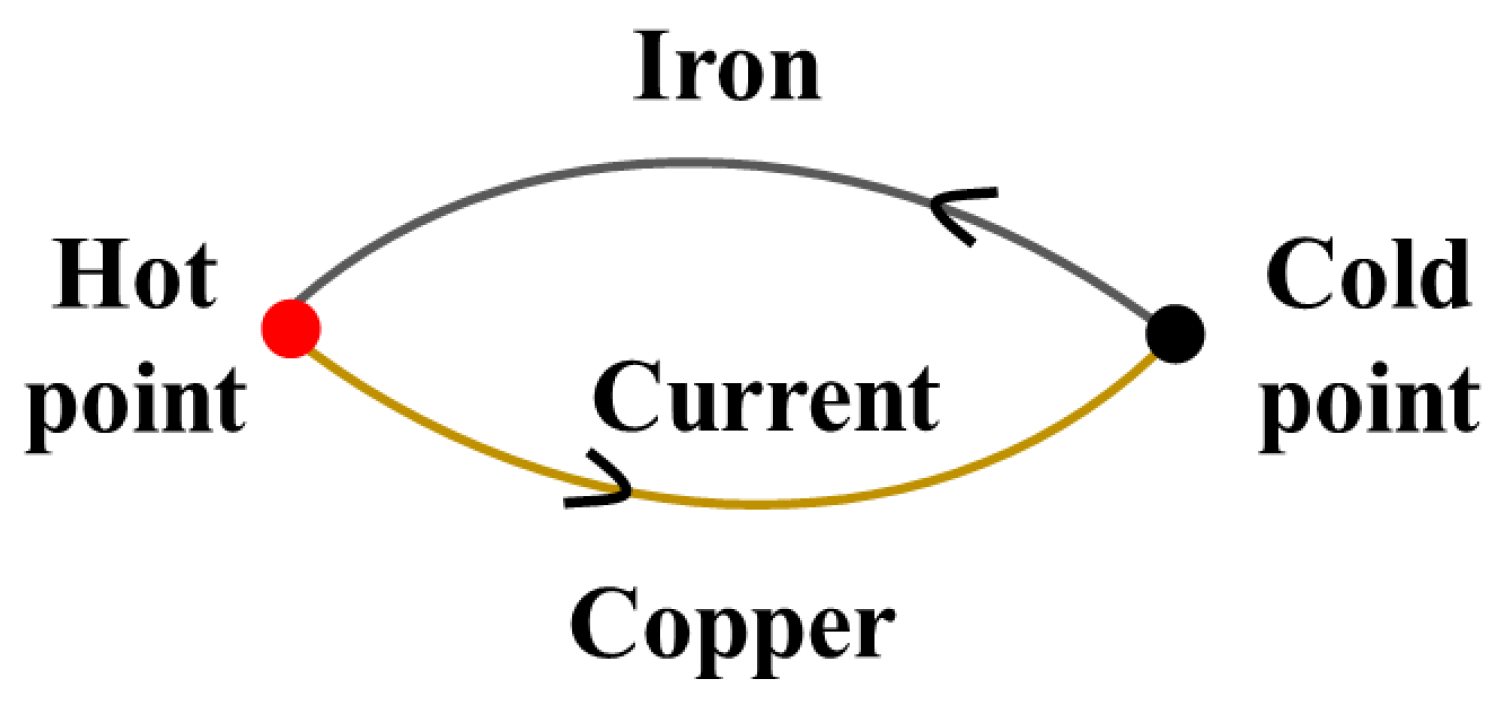
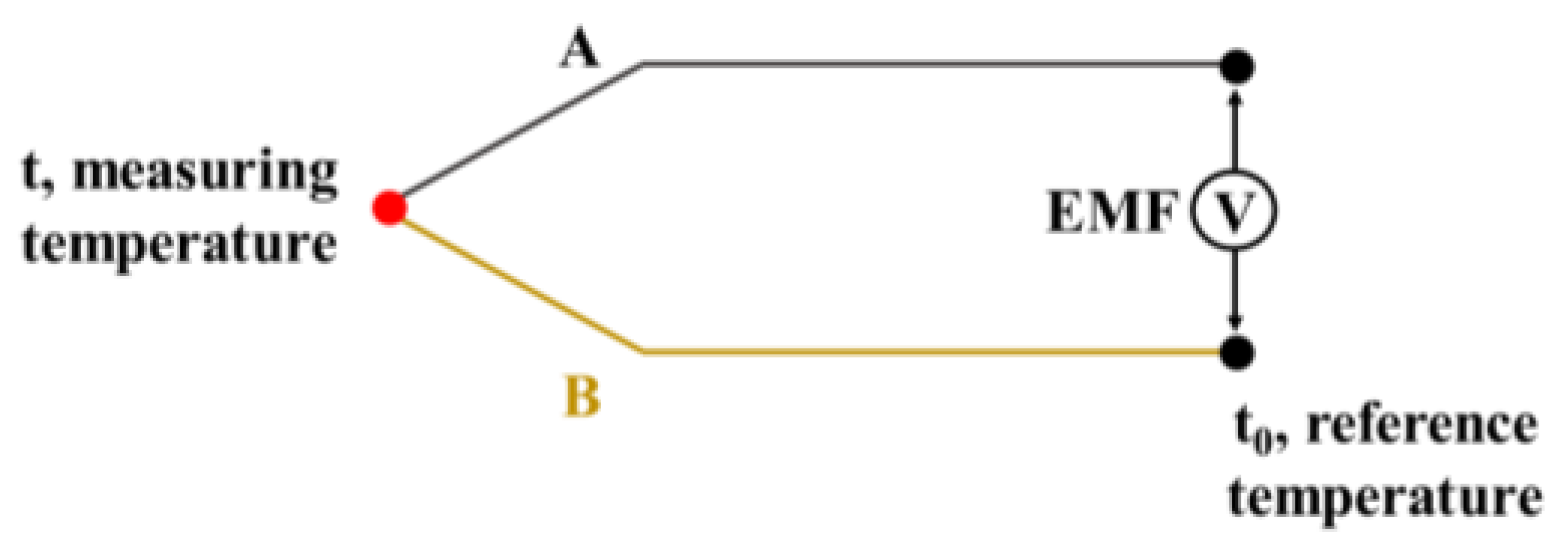
2.1. Thermocouple Method

A thermocouple is a device consisting of two conductors made by dissimilar materials and is applied to measure temperature using the junction of two conductors. It is based on the thermoelectric effect (Seebeck effect), in which temperature difference is converted to electric voltage. This effect was first discovered in 1821; the German physicist Seebeck found that a magnetic needle held near a circuit composed of two dissimilar metals would be deflected when one of the metal junctions was heated. Hence, this phenomenon is called the Seebeck effect, and a simple schematic of this effect is shown in Figure 1. However, at that time, he did not recognize an electric current was generated. Instead, he believed this phenomenon was because of the magnetism induced by temperature difference. With the development of electromagnetism, it was realized that the above effect was due to the induced electric current caused by temperature difference and was named the thermoelectric effect.
For a thermocouple, when the two junctions are at different temperatures, electromotive force (EMF) will be generated in the circuit as a result of thermoelectric effect.
Figure 2 illustrates a typical configuration of a thermocouple. The resultant EMF is the function of temperature difference between the two junctions. To achieve temperature measurement, temperature at one of the junctions is usually fixed at a known value, and this temperature is called the reference temperature. Meanwhile, the temperature at the other junction is called the measuring temperature. As a result, resultant EMF is determined only by the measuring temperature. For example, the reference temperature is usually set as 0 °C (the melting point of water). Thus, for thermocouples with the same material and reference temperature, the EMF generated in the circuit is a function of measuring temperature. By calibrating the temperature–dependent EMF curves, thermocouples can be used for temperature measurement. However, in practical applications, especially in industrial utilization, it is not always convenient to maintain the reference temperature at 0 °C. Under these circumstances, reference junction temperature compensation should be taken into account [6]. That is, the measured EMF under these situations should be added to the EMF induced by the temperature difference between the actual reference temperature and 0 °C.
As mentioned above, with the same materials and reference temperature, the circuit voltage is dependent on the temperature of the measuring point. However, when the material of one thermocouple is different from that of the other thermocouple, they would be in different performances. Thus, thermocouples can be categorized in different types according to their materials. Nickel, platinum, and their alloys are the most commonly used materials, while some other metals such as tungsten and pure noble metals are also employed. The well-known J-type, K-type, E-type, and N-type thermocouples are made of nickel alloys, and S-type, B-type, and R-type thermocouples are made of platinum and platinum–rhodium alloys. Those thermocouples are standard thermocouples, and their voltage–temperature relationships are identical for each type. A summary of different standard thermocouples commonly used in combustion environments is shown in Table 1. The approximate temperature range of a measurement target is the main consideration when choosing a proper type of thermocouple. In addition, the above types of thermocouples meet most needs. However, for temperatures above the upper limit of them as well as when the atmosphere is non-oxidizing, there is a type of thermocouple made of tungsten–rhenium alloys, which have shown good performance up to 2750 °C and can be used, for short periods, up to 3000 °C [7]. In addition, another important index of thermocouples is their sensitivity. Higher sensitivity usually means higher accuracy. The sensitivity of a thermocouple can be characterized by its Seebeck coefficient, which represents the slope of the EMF–temperature curve and is expressed by the following:
dE d T m = S
where E is the electromotive force caused by temperature difference, T m is the measuring temperature, and S is the Seebeck coefficient.
Applications of thermocouples could be seen everywhere from lab research [9] to industrial processes [10] over the past century. For example, when studying the characteristics of solid fuels in thermal conversion processes, e.g., pyrolysis, gasification, and combustion, temperature profiles were observed by arranging thermocouples on the surface and inside of the pellets [11,12]. Then, the chemical reaction kinetics as well as the heat and mass transfer characteristics during the reaction process were investigated and provided indispensable data for modeling work. When using the heat flux method to measure the laminar flame velocity of fuels, the heat flux of the burner head plate was judged by arranging thermocouples at different positions of the plate [13,14], then the adiabatic laminar flame velocity of the fuel was obtained. For internal combustion (IC) engines, thermocouples were used to investigate the thermal barrier coating (TBC) of a spark ignition internal combustion engine [15] and measure the transient surface heat fluxes [16]. In addition, Chang et al. [17] and Alkidas et al. [18] used fast response thermocouples with crank angle degree (CAD) resolution to measure surface temperatures of combustion chambers in engines, which provided boundary conditions that were necessary to solve the associated heat transfer problems. Applications of thermocouples are usually accompanied by temperature correction to minimize the measurement error caused by heat convection, heat conduction, and radiation. These corrections need comprehensive estimation of heat gain and loss in the measurement environments. As a result, most of the time, the accuracy of the thermocouple is not satisfying. The limitations of thermocouples are thoroughly discussed in Section 2.3. However, these do not prevent thermocouples from being the most widely used temperature measurement method at present, considering they are low cost and convenient to use.

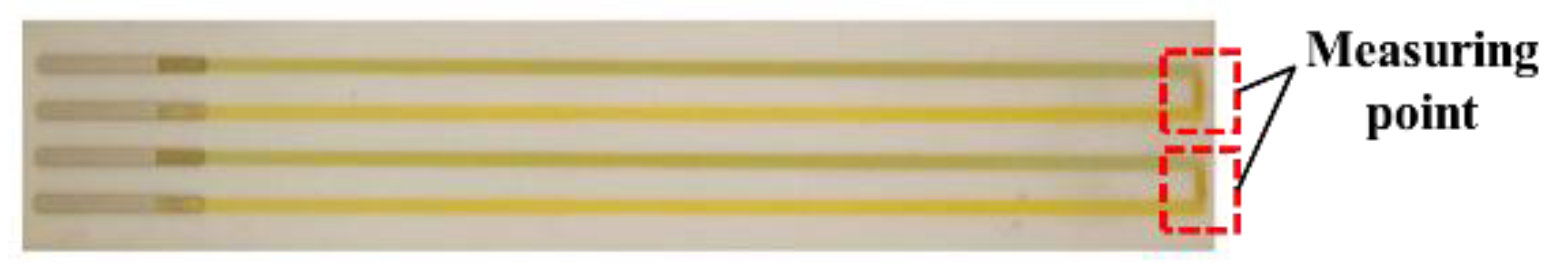
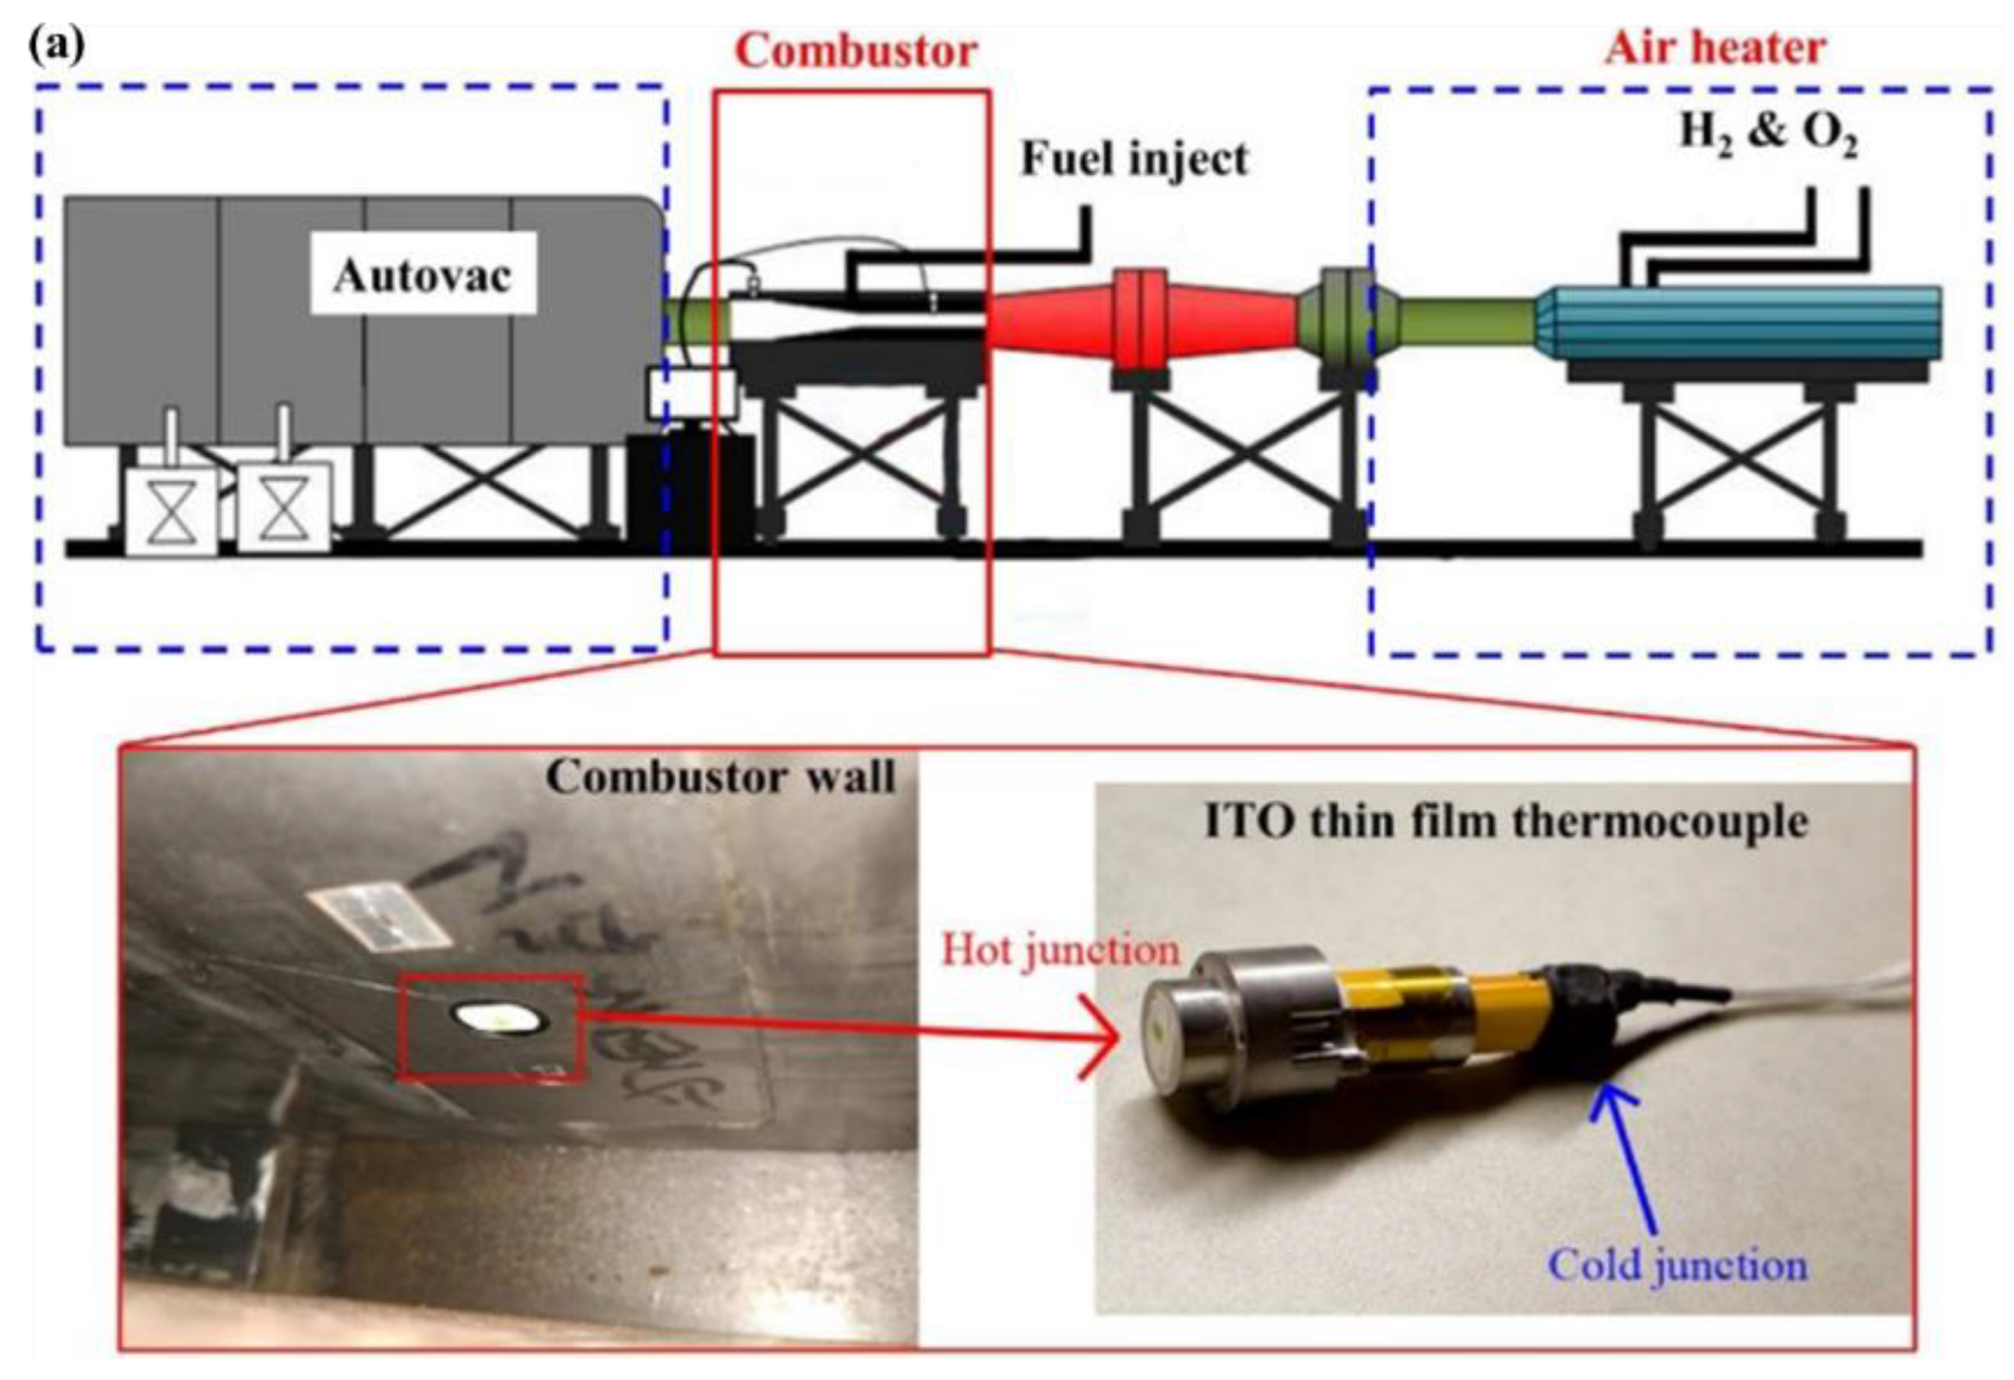
2.2. Thin-Film Thermocouple Methods

When measuring the surface temperature using conventional thermocouples, a hole is usually drilled on the surface in which thermocouples could be fixed. However, this approach would destroy the integrity of the surface. In addition, the bead of a thermocouple would interfere with the flow field around it, which might change the temperature field on the measurement surface. The invention and development of thin-film thermocouples greatly reduced the effects of the above-mentioned problems and made the measurement more flexible. This method has the same principle as conventional thermocouples, while its fabrication procedure is different from the conventional one. Typically, the thin-film thermocouple is fabricated on the measurement surface with the sputter deposit method. Therefore, its thickness is only of a few microns (µm), which is several orders of magnitude thinner than conventional thermocouple wire (cf. Figure 3). This also explains why thin-film thermocouples can reduce disturbances to gas flow near the measurement surface. The thickness of thin-film thermocouples also affects their Seebeck coefficient. Chen et al. [19] found that the Seebeck coefficient of a K-type thin-film thermocouple reached the maximum value with the thickness of 1 µm. A critical factor to achieve surface temperature measurement using thin-film thermocouples is the insulating layer between thermocouples and the base materials, especially as the base material is made of metal. This layer, within a limited thickness, must not only electrically isolate thermocouple elements from the metal base, but also provide the ability to bond thermometry sensors tightly to the measuring surface. Due to the difference between the expansion coefficients of different materials, layer materials were carefully selected, and sometimes multilayer structure was adopted to solve this problem. In addition, to extend the lifetime of thin-film thermocouples under hostile and high-temperature environments, protective film was sometimes utilized. The research of Tian et al. [20] showed that the protective film could avoid the breakdown of thin-film thermocouples under the impact from high-temperature spray.
National Aeronautics and Space Administration (NASA) has been working on developing thin-film thermocouples that could be used on surfaces in harsh environments, such as aero engines and gas turbines, since the 1980s [22,23,24]. They developed a series of thin-film thermocouples with standard materials such as Pt-13% Rh/Pt (R-type) and Pt-10% Rh/Pt (S-type) and applied them to superalloys, ceramics, ceramic composites, and intermetallics. Kreider et al. [25] applied a thin-film thermocouple to three iron-based alloy plates, which represented different internal combustion engine chamber materials. They adopted Al2O3 as the insulating material. In addition, a FeCrAlY alloy layer was coated between the metal base and insulating layer to ensure a high-quality Al2O3 insulating base. The results showed that the insulating layer can survive at over 1100 K in air, with similar accuracy performance as conventional thermocouples. This indicated the feasibility of attaching thin-film thermocouples to almost any iron-based engine alloy. The use of heat treatment processes such as annealing technology are very important to better exert the performance of thin-film thermocouples. Through annealing treatment, the stability of thin-film electrodes can be improved, and thin-film defects can be reduced, thereby improving the performance of thin-film thermocouples. For different types of thermocouples, it is necessary to select proper annealing temperature, duration, and atmospheres [26,27].
In addition to metals and their alloys, ceramic materials can also be used as electrodes of thin-film thermocouples. Compared with traditional metal thermocouples, they can withstand higher temperatures and harsher ambient atmospheres. Another significant advantage is that their thermal expansion coefficients are compatible with ceramic thermal barrier coatings (TBCs) applied to the engine surface, so they are less likely to fall off. Thus, ceramic thin-film thermocouples exhibit huge potential in the surface temperature measurement of aero engines and gas turbines. Indium oxides: indium tin oxides (In2O3: ITO) as well as indium oxynitride: indium tin oxynitride (InON:ITON) are the most common electrode materials of ceramic thin-film thermocouples. They can be used in oxidizing environments with high temperature. A review of ceramic thin-film thermocouples was summarized by Tougas et al. [21].
Since the thickness of a thin-film thermocouple is much thinner than that of the conventional one, it is easier and faster to reach thermal equilibrium. This property shows its potential to be used in transient temperature measurements. Jin et al. [28] investigated the combustion fluctuation of scramjets by monitoring the wall temperature change of the combustor using an indium tin oxide (ITO) thin-film thermocouple (cf. Figure 4). Their results showed the ability for transient temperature measurement using thin-film thermocouples, which is essential in current engine design and performance tests.

2.3. Limitations of Contact-Based Thermometry

Thermocouples are cheap, easy to use, and have a wide temperature measurement range, making them the most widely used temperature measurement methods currently. However, they also have some shortcomings, such as disturbances to the flow field and temperature field and limited response rate and spatial resolution. Limitations of the contact-based temperature measurement method are introduced in the following section.

2.3.1. Intrusive Probe

Contact-based thermometry usually creates disturbances on the temperature field of the surface, which means a difference between the temperature being measured with and without the presence of the instrumentation. Unfortunately, this shortcoming cannot be avoided, considering the fact that thermocouples must be in contact with the measuring surface. One of the reasons causing the difference is that thermocouples lead to the increase in heat loss at the point of attachment by increasing the surface area. Thus, the local temperature may thereby be reduced, causing a phenomenon referred to as thermocouple conduction errors. Another reason is that beads of thermocouples are mounted on the target surface, which creates a disorder of the gas flow around the surface as they alter the surface conditions. This also causes changes in the measured temperature. To avoid disturbing the gas flow, thermocouples could be installed into machined grooves in the surface. However, this method affects the structural integrity of the component, and this may also cause deviation. Figure 5 illustrates the thermal distortion caused by the insertion of thermocouple wires encapsulated in ceramic paste in a steel block for steady-state conditions [29]. The utilization of thin-film thermocouples minimizes disturbances caused by thermocouples and becomes the most promising contact thermometry method to be used in research and industry. However, the difference between the film material and the surface material of a rotation object will also cause disturbance in the temperature distribution, which results in temperature measurement errors.

2.3.2. Heat Transfer Error

The temperatures of the measured object and thermocouples are not identical due to the presence of heat transfer, i.e., radiation, convection, and conduction. Although measurement errors are more distinct while measuring gas temperature, they cannot be ignored with respect to surface temperature measurement. One source causing these errors is the temperature variation along the wires. Since the material of each electrode of the thermocouple cannot be completely uniform, this leads to an extra electric potential on the wire, which affects the temperature measurement accuracy. Even under ideal conditions, i.e., when the electrode material of a thermocouple is homogeneous, all kinds of thermocouples without exception suffer degradation processes during temperature measurements [30], resulting in increased thermoelectric inhomogeneity and temperature measurement errors. However, a much greater error comes from radiation. When the thermocouple is arranged on the surface of the object to be measured, it will be heated by the radiation from the surrounding high-temperature objects (such as flame) and cooled through radiation to the low-temperature object, which causes the value of the measured temperature to represent the temperature at which the thermal balance between the thermocouple and the surrounding environment is reached, rather than the actual temperature of the measured point. Convection with the surrounding gas also disrupts the thermal balance between the thermocouple and the measured object, resulting in different measurement results, and this effect is more pronounced when the gas flow speed increases. Conduction also affects the thermal balance between the thermocouple and the measured surface, but this phenomenon is more relevant to the response rate of the thermocouple.

2.3.3. Spatial and Temporal Resolution

There is an increasing need for spatially resolved temperature information in current testing environments. However, it is difficult to achieve spatial measurement of temperature without the aid of imaging methods. To measure the temperature field by means of thermocouples, it is necessary to arrange several thermocouples at different measured points at the same time, and to reconstruct the temperature field using the measurement results. For traditional thermocouples, it is not easy to arrange a large number of thermocouples on the measured surface, and this has a great influence on the measured temperature field. Although the thin-film thermocouple greatly reduces the influence on the measurement temperature and is easy to fabricate on the measured surface, it is easy for it to fall off due to the influence of the mechanical properties of the material, especially under harsh conditions. Thus, its lifetime is usually only dozens of hours or so [31]. The temporal resolution of the thermocouple method depends on its response rate, which in turn is directly determined by the heat conduction of the thermocouple measuring point. As the thermocouple is heated by the surrounding environment, thermal energy more or less requires some time to transfer from the surface to the bead center, depending on the bead mass [32]. The greater the mass of the bead, the longer it will take. Therefore, when measuring temperature with rapid fluctuations, the thermocouples will lag with respect to the changes in temperature, which limits their applications in certain fields.

2.3.4. Other Problems

In addition to physical intrusion, chemical perturbations from thermocouples are sometimes more significant in some circumstances. Sometimes, there is a catalytic effect when thermocouples are placed directly on the detection surface, especially in reducing environments. This would cause the additional reaction between the surrounding species and the ceramic and lead to the decomposition of the refractory ceramic shield [33]. Thus, a coating is required, and the coating material also needs to be carefully considered. Silicon coatings are less useful in this case because they are likely to participate in the reaction. Beryllia and yttrium oxide ceramics are less reactive, but beryllia is highly toxic and therefore rarely considered. An aluminum oxide coating is better, but it would increase the diameter of thermocouple, which affects the response rate. In addition, the harsh environment will also cause contamination of the thermocouple itself, thereby changing its Seebeck coefficient, which leads to a measurement error.
Inconvenient measurement of the moving system is another application limitation of thermocouples. At present, many measurement objects are high-temperature rotating objects, such as various turbine blades. However, due to the existence of wires, the implementation of thermocouples in moving objects is complex and expensive [34]. In addition, it is time consuming to alter the measurement positions, and thereby thermocouples are unsuitable to use when the temperature of different parts is required. In some situations, installing thermocouples is not trivial, even if the test object is not a rotating part, such as reformer furnaces with tubes located in the center with no access from a sidewall [35].
Since thermocouples measure temperature through a voltage–temperature-dependent profile, their measurement accuracy will be affected by the magnetic field. This is because under the influence of a magnetic field, another electromotive force (EMF) will be generated in the wires of the thermocouple as a result of Nernst–Ettingshausen effect. The direction of the EMF depends on the orientation of the magnetic field, the position of the thermocouple wire, and the temperature gradient. The measurement errors of thermocouples could even reach 150% in a magnetic field when the temperature is below Curie temperature [36].

3. Non-Intrusive Thermometry

There is a great demand for non-intrusive surface thermometry due to the requirements of high spatial and temporal resolution, remote probing, and non-interference of combustion during the measuring process. According to different principles, these techniques can be classified as (1) radiation thermometry, which is based on thermal radiation; (2) laser-induced phosphorescence (LIP) and the temperature-sensitive paint (TSP) method, which are based on the temperature-dependent property of materials after light excitation; (3) thermochromic liquid crystal (TLC) thermography, which is based on temperature dependence of the color of reflected light from liquid crystals; and (4) the temperature-indicating paint method, which is based on coating color change with varied temperature.

3.1. Radiation Thermometry

Radiation thermometry, also known as pyrometry, is a non-intrusive method which measures surface temperature through thermal radiation emitted from the target surface, since the amount of thermal energy in the form of radiation and its wavelength are functions of temperature. To receive a radiation signal emitted from a target surface, a detector is needed in the measurement system. Generally speaking, a device receiving and interpreting a radiation signal to measure temperature based on radiation thermometry is called a pyrometer. To be more specific, a pyrometer usually refers to the device that records temperature information of a single point, and for a temperature field, it is typically known as thermography [37]. A long time ago, experienced workers determined forging temperatures by observing the color of steel. This can be regarded as a rough surface temperature measurement using radiation thermometry, where our eyes and brain constituted a nominal pyrometer. With the discovery of the photoelectric effect and the development of optoelectronic devices, optical detectors became common in scientific research and industrial applications, which led to great progress in radiation thermometry. Compared with the thermocouple method, radiation thermometry has several unique advantages. For example, it can obtain a temperature field with a fast response, has zero interference to the flow and temperature field, can be utilized in harsh environments, and one of the most important, it has a wider dynamic range than other contact or non-contact techniques. As a result, radiation thermometry has become one of the most commonly used techniques.

3.1.1. Principles

The thermal radiation emitted from a blackbody surface as a function of temperature and wavelength is given by Planck’s law:
M b , λ ( λ , T ) = c 1 λ 5 ( exp ( c 2 λ T ) 1 )
where M b , λ is the spectral emittance from a blackbody surface, λ is the wavelength, T is the absolute temperature, and c 1 = 3.7418 × 10⁻¹⁶ W·m2 and c 2 = 1.4388 × 10⁻² m·K are the first and second radiation constants, respectively.
Integrating the above equation over the wavelength will obtain the total radiation emitted over the entire spectral range, which is given by the Stefan–Boltzmann law:
M b ( T ) = σ T 4
where M b is the emittance from a blackbody and σ = 5.67 × 10⁻⁸ W/(m2·K4) is the Stefan–Boltzmann constant.
However, for a real surface, only a fraction of blackbody radiation can be emitted. Therefore, the real radiation emitted from the target surface is give as the following:
M λ ( λ , T ) = ε λ ( λ ) M b ( λ , T )
M b ( T ) = ε σ T 4
where the coefficients ε λ and ε are called emissivity and defined as the ratio of the emitting spectral or total radiation at a given temperature to the radiation emitted from a blackbody at the same temperature. Obviously, the value of emissivity is between 0 and 1.
It can be seen from the above equations that the emissivity of the target surface is a significant parameter in radiation thermometry. Whether Equation (4) or (5) is employed, an accurate value of emissivity is needed to convert radiation intensity into temperature. However, the emissivity of a measured target is generally not a constant. It not only varies with wavelength, but also changes with surface quality, temperature and angle of measurement [38]. As a result, in actual practical measurements, the real emissivity may differ from that obtained in the calibration procedure or the literature, and this would lead to unavoidable errors. To solve this problem, several methods were raised, with some assumptions, e.g., two-color methods and multi-spectral methods. One of the most adopted assumptions is the gray body assumption, which supposes that the emissivity of an object does not vary with wavelength in at least a certain range. For example, coal is typically regarded as a gray body to simplify the calculation [39].

3.1.2. Typical Measurement Methods

As we mentioned, several methods were put forward to acquire surface temperature using thermal radiation, while the errors caused by the uncertainty of emissivity were eliminated as much as possible. Nevertheless, of either strategy, the basic schematic diagram can be illustrated as Figure 6. Using a detector to obtain the thermal radiation emitted by the measured surface of the object, the temperature of the surface can be obtained based on Equation (4) or Equation (5). However, in addition to the radiation emitted by the surface of the object, the signal detected by the detector also includes the radiation emitted from the surrounding surface, which is then reflected by the measuring surface, and the radiation emitted by the surrounding medium and received directly by the detector. In addition, some of the radiation emitted from the surface of the object is absorbed by the surrounding gas medium, so that this portion of radiation cannot reach the detector. Therefore, the amount of radiation reaching the detector is expressed by the following expression:
S = τ ( λ ) [ ε m ( λ ) M b ( λ , T m ) + ( 1 ε m ( λ ) ) M b ( λ , T s ) ] + ε g ( λ ) M b ( λ , T g )
where S is the signal reaching the detector, T m is the temperature of the target surface, T s is the temperature of the surrounding surface, T g is the temperature of the surrounding gas, ε m is the emissivity of the target surface, τ is the transmittance of the gas medium, ε g is the emissivity of surrounding gas and is identical to its absorptivity, and 1 ε m equals the reflectivity of the target surface, supposing the target is an opaque object and the transmittance equals to zero.

Total Radiation Thermometry

In 1879, Stefan deduced from experimental data that the radiation emitted from an objective was proportional to the fourth power of its absolute temperature. Later in 1884, this phenomenon was confirmed theoretically by Boltzmann from thermodynamics. Based on the famous Stefan–Boltzmann law given as Equation (3), total radiation thermometry was proposed. However, the temperature calculated from Equation (3) is usually lower than the actual temperature due to the existence of emissivity and is thus called apparent temperature to distinguish it from the real temperature. The relationship between the real temperature and the apparent temperature derived from Equations (3) and (5) is shown below:
T p = ε 1 / 4 T
d T T = 1 4 d ε ε
where T p is the apparent temperature and ε and T are the total emissivity and real temperature of the measured object, respectively.
Since the invention of the first total radiation pyrometer by Charles Féry in 1901, total radiation thermometry became the primary temperature measurement method before the 1960s [40] and was widely used in surface temperature measurements of internal combustion engines [41], gas turbine engines [42], aircraft turbine blades [40], etc. Burgess et al. [43] summarized the principle involved in utilization of total radiation thermometry as well as their calibration methods and source of errors. However, shortcomings of total radiation thermometry are obvious. It can be seen from Equation (7) that the accuracy of measured temperature is strongly dependent on the emissivity. Emslie et al. [44] estimated the errors caused by the deviation of assumed emissivity from its actual value and found that an error of 20% was made when the true emissivity was 0.2 rather than the assumed value of 0.5. Unfortunately, this is quite possible since the emissivity usually varies with surface conditions and temperature, which frequently change during combustion processes along with the reaction progress. In addition, the received signal in total radiation thermometry is from the whole spectrum. As a result, the influence of environment radiation and absorption is hard to be avoided, which means the calibration and application of total radiation thermometry can only be performed under very constant atmospheric conditions, e.g., in inert gas or vacuum conditions [45]. For this reason, total radiation thermometry is not particularly applicable for surface temperature measurement in industrial applications with very harsh and variable environments [46].

Spectral Radiation Thermometry

Based on Planck’s law (cf. Equation (2)), surface temperature can also be measured through spectral radiation. This method is called spectral radiation thermometry or monochromatic thermometry. Similar to total radiation thermometry, the relationship between the real temperature (cf. Equation (2)) and the apparent temperature derived from Equation (4) can be expressed as the following:
c 1 λ 5 ( exp ( c 2 λ T p ) 1 ) = ε λ c 1 λ 5 ( exp ( c 2 λ T ) 1 )
where T p is the apparent temperature, λ is the measurement wavelength, c 1 and c 2 are the first and second radiation constants, and ε λ and T are the spectral emissivity and real temperature of the measured object, respectively.
In combustion environments, c 2 / λ T is generally much larger than unity, thus, Planck’s law can be simplified as Wien’s approximation:
c 1 λ 5 exp ( c 2 λ T p ) = ε λ c 1 λ 5 exp ( c 2 λ T )
Thus, the real temperature can be calculated as the following:
1 T = λ c 2 ln ε λ + 1 T p
The difference is shown between the real temperature and the apparent temperature through the above formula. Zhang et al. [46] estimated the differences in a target surface at 1000 K at different wavelengths and compared them with the one derived from total radiation thermometry. The results are shown in Figure 7. As can be seen, the difference decreases with shorter wavelength, and all of the wavelengths are smaller than that from total radiation, which means the sensitivity of the measured surface temperature to emissivity reduces with decreasing wavelength.
This result can also be deduced from Equation (11), by multiplying d T on both side and differentiating T with respect to ε λ :
d T T = λ T c 2 d ε λ ε λ
According to Wien’s displacement law, the wavelength at which an object emits the maximum spectral radiation follows the equation
λ p e a k = b T
where b ≈ 2.898 × 10⁻³ m⋅K is called Wien’s displacement constant. With the known values of c 2 and b, we can derive an equation similar to Equation (8) by substituting Equation (13) into Equation (12):
d T T = 1 5 λ λ p e a k d ε ε
It is obvious that with proper measuring wavelength, the spectral radiation thermometry is less affected by the emissivity, so it is more accurate than the total radiation thermometry. Another significant advantage of spectral radiation thermometry is that it can avoid the interference of gas absorption to some extent, if a suitable wavelength is selected. This is evident from Equation (6): in the case where the transmittance is unity, the errors caused by gas absorption and emission can be ignored. This is possible since the transmittance τ is the function of wavelength and varied with gas compositions. Due to these advantages of spectral radiation thermometry, it is extensively adopted in industrial applications, such as gas turbine blades [47,48,49], steel production [50], and petrochemical furnaces [35,51,52,53].

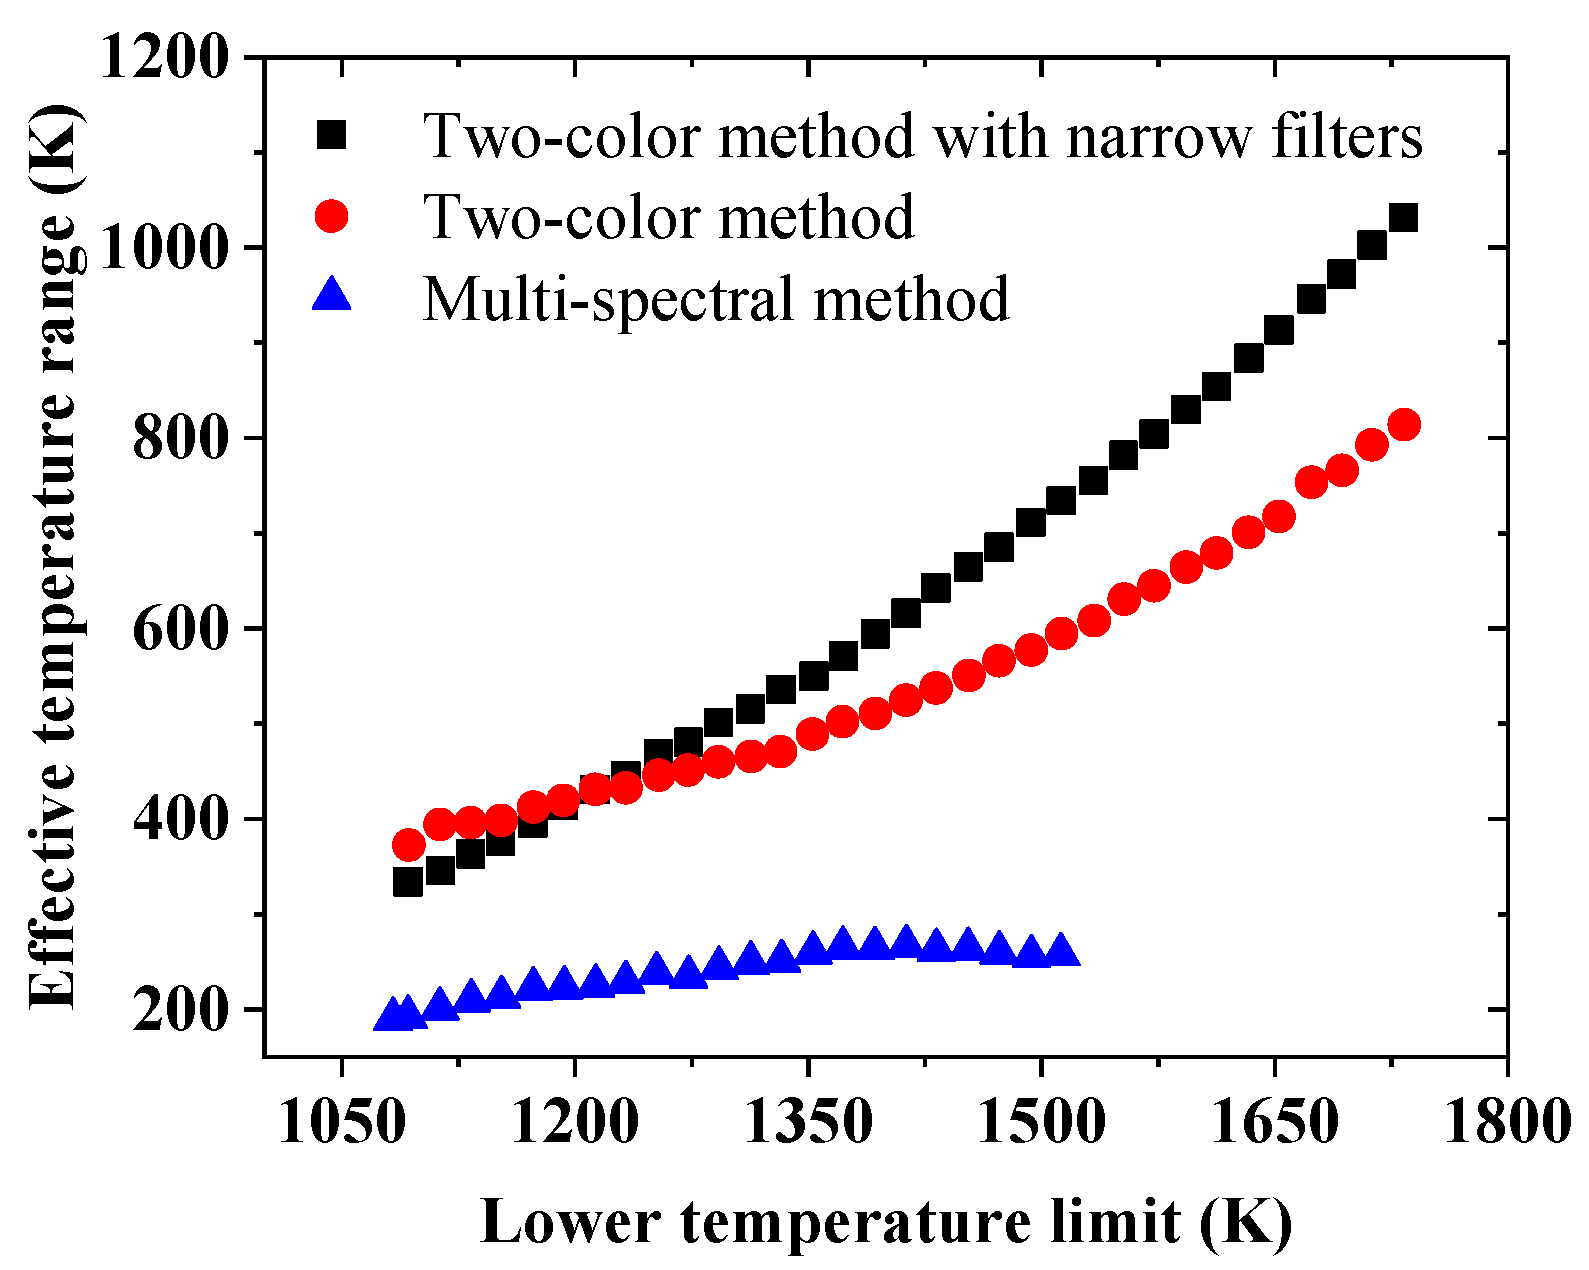
Two-Color Thermometry

Even though errors caused by the uncertainty of emissivity are smaller in spectral radiation thermometry, measurement results still strongly depended on emissivity, especially under the circumstance where the emissivity of the target is small. Furthermore, either the total radiation or spectral radiation method needs to know the exact value of emissivity in advance, which is inconvenient sometimes. Two-color thermometry is a method that acquires the surface temperature according to the ratio of the radiation from two given wavelengths. Based on Planck’s law and Wien’s approximation, the relationship between surface temperature T and the radiation intensity ratio R at λ 1 and λ 2 is given as follows:
T = c 2 ( 1 λ 2 1 λ 1 ) ln R + 5 ln λ 1 λ 2 ln ε λ 1 ε λ 2
One of the advantages of two-color thermometry is that geometric factors, which are necessary to know in total radiation thermometry and spectral radiation thermometry, are eliminated during the ratio process [54]. The ratio of ε λ 1 / ε λ 2 can be determined through the calibration process. However, the most special feature of two-color thermometry is that the emissivity could be assumed almost equal at λ 1 and λ 2 in some cases, if the two given wavelengths are very close [55] or the measured object satisfies the gray body characteristics. As a result, the value of emissivity is not necessary, and the above equation can be simplified as the following:
T = c 2 ( 1 λ 2 1 λ 1 ) ln R + 5 ln λ 1 λ 2
The gray radiation assumption is not always tenable or is probably only acceptable in a limited spectral range. Therefore, it usually needs to be verified experimentally. Spectrometers are often used to verify this assumption by recording the emission characteristics [56,57]. In addition, it is widely recognized that the given wavelengths should obey the following principles [58]: (1) the selected wavelengths should be far away from the ambient gas absorption band range; (2) the detector at the selected wavelengths has a high response and signal-to-noise ratio; (3) saturation of the detector at the selected wavelength should be avoided. Compared with total radiation thermometry and spectral radiation thermometry, two-color thermometry does not need complex calibration of geometric factors and is less affected by the emissivity. Therefore, it is one of the most commonly used temperature measurement methods, whether in industrial applications or in laboratory experiments. It is worth mentioning that, with the rapid development of a charge coupled device (CCD), two-color thermometry based on color CCD cameras received a lot of attention. In addition to the common advantages of two-color thermometry, the strategy based on color CCD cameras can easily obtain the radiation intensities in two different spectral bands by the readily available commercial cameras, which means a complicated optical system can be avoided in this case. In addition, color CCD cameras can obtain information of temperature field, which is very valuable for surface temperature measurement.

Multi-Spectral Thermometry

The acquisition of emissivity has become an important issue in the development of radiation thermometry. Two-color thermometry provides a solution to reduce the influence of emissivity and improve the accuracy of temperature measurement. However, if the spectral emissivity varies with wavelength with an unknown relationship, two-color thermometry might be no longer suitable. For example, in a sooty flame, the absorption coefficient varies proportionally to the reciprocal of wavelength, which indicated that gray radiation assumption would not be appropriate. Multi-spectral thermometry was put forward to solve the emissivity by expressing emissivity as a function of temperature and wavelength. The basic principle of the multi-spectral method is that the radiation characteristics emitted by the subject are measured by different wavelength channels. Supposing the emissivity is a function of wavelength, an equation is established at each channel with some adjustable parameters in the equation. Usually, these equations are of polynomial form. Thus, by solving these equations, both the target temperature and emissivity can be obtained. The formulas involved in the multi-spectral thermometry of n channels are as follows:
S i = k i ε λ i M b ( λ i , T )   ( i = 1 , 2 ,   , n )
ε λ i = a 0 + a 1 λ i + a 2 λ i 2 + + a m 1 λ i m 1
where S i is the response of spectral channel i of the detector; k i represents the factor related to electronic gain, optical arrangement, and detector response; ε λ i is the emissivity at wavelength λ i and is given as a polynomial form function of wavelength (cf. Equation (18)); M b ( λ i , T ) is the blackbody radiation at wavelength λ i and temperature T; and a 0 , a 1 , …, a m 1 are the adjustable parameters. Regarding the exponential term in Planck’s law, the natural logarithm of the emissivity can also be expressed as a polynomial form function of wavelength to simplify the calculation:
ln ε λ i = a 0 + a 1 λ i + a 2 λ i 2 + + a m 1 λ i m 1
According to the number of unknowns and equations, Araújo et al. [59,60] divided multi-spectral thermometry into two categories: (1) determined systems, where m = n − 1 and the equations have a unique solution for parameters of emissivity and surface temperature; (2) overdetermined systems, where m < n − 1 and the equations are solved using the least squares method to obtain optimal solutions. For multi-spectral pyrometers with more than four wavelength channels, overdetermined systems are generally adopted, since the uncertainty of the solutions obtained from determined systems increases with increasing channel number [61,62].
Since emissivity models are introduced in the multi-spectral method, its accuracy is higher than other radiation thermometry and is suitable for objects which need high measurement precision, e.g., gas turbine engines and aero engines. Gao et al. [63] measured the temperature of thermal barrier coatings (TBCs) commonly applied to gas turbine blades in a laboratory furnace using multi-spectral pyrometers and analyzed influences of gas composition and ambient radiation reflection on the results. Estevadeordal et al. [64] from General Electric Company (GE) designed a multi-spectral pyrometer with four channels to achieve turbine blade temperature measurement, while strategies to filter the noise from hot particulates were proposed based on the results. Researchers from the NASA Glenn Research Center utilized a multi-spectral pyrometer to measure the temperature of turbine blades with thermal barrier coatings (TBCs) in order to test the coating performance [65].
Given that color CCD cameras have three different spectral bands, they are also applied as a special type of multi-spectral thermometer. In this case, the measured temperature field is more accurate than that from the two-color method, while the measured range is narrower since responses from all channels need to be taken into account. A comparison of measurement ranges between multi-spectral thermometry and two-color thermometry using color CCD cameras is shown in Figure 8.

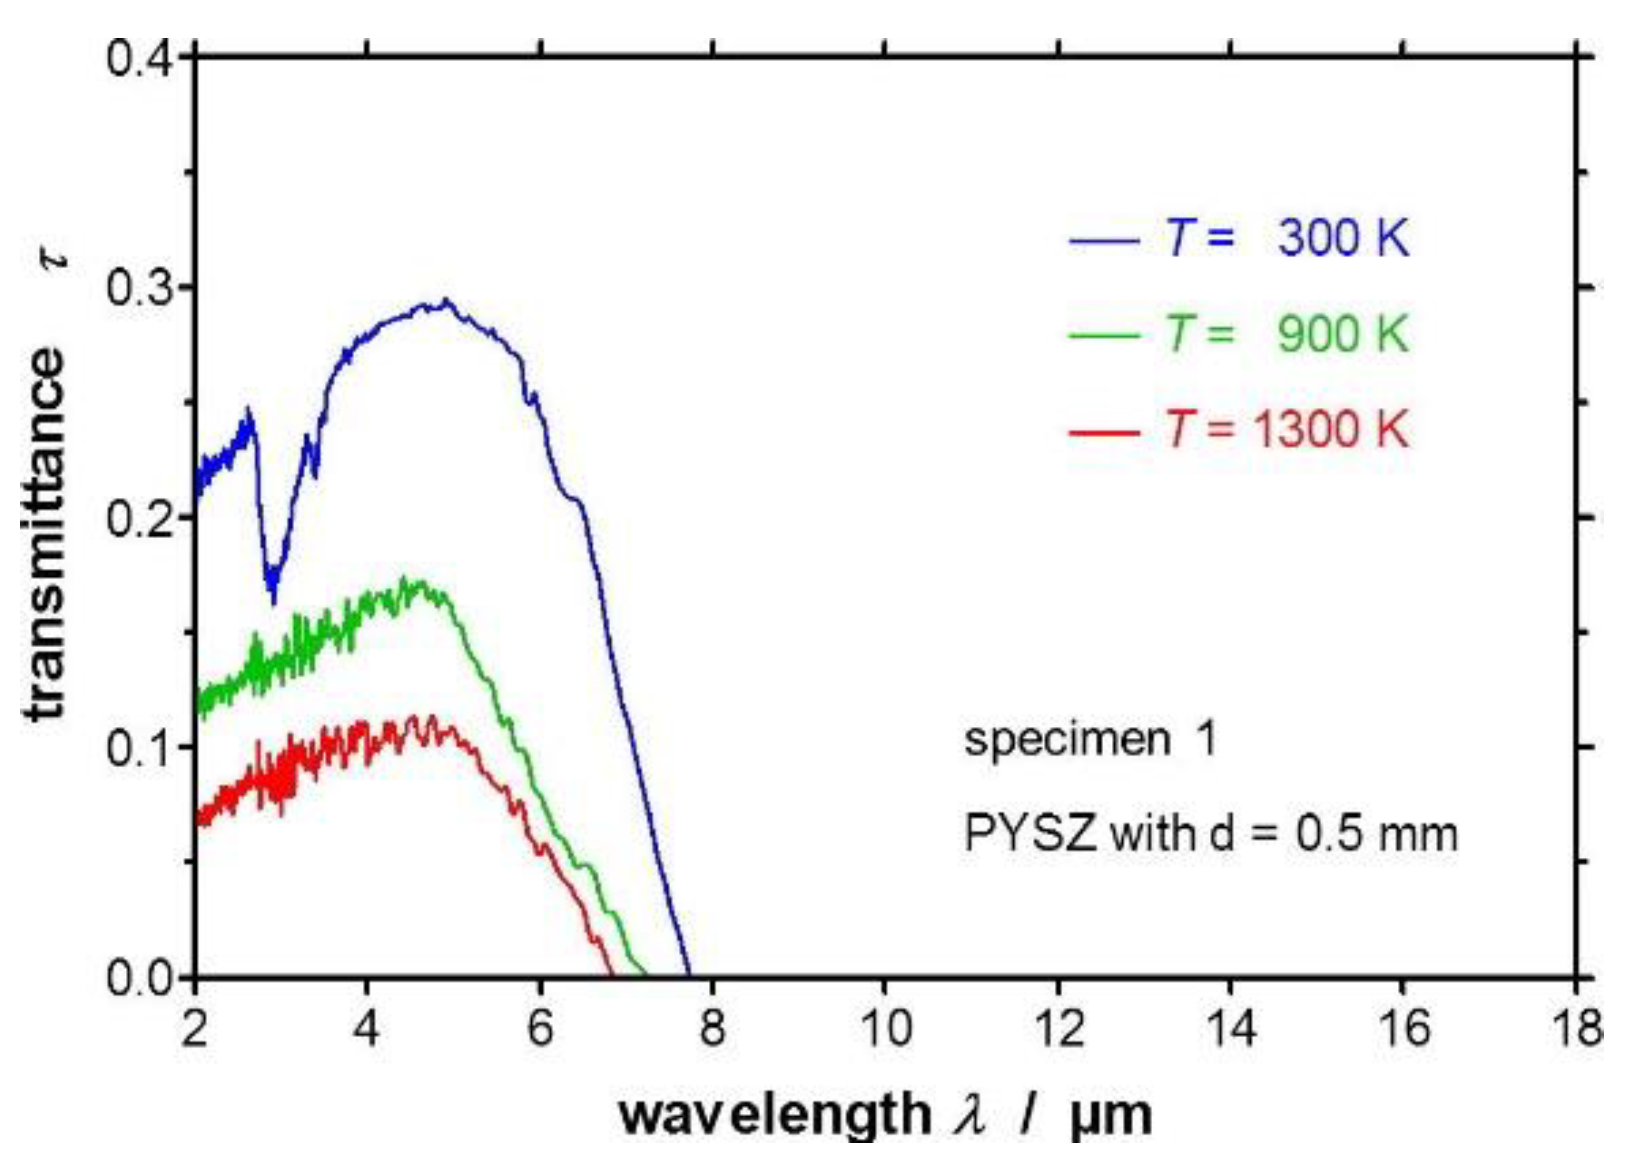
3.1.3. Problems Related with Radiation Thermometry

Emissivity is a critical source of uncertainty. However, it cannot be circumvented in radiation thermometry methods. Therefore, the accuracy of any type of radiation method always depends on the prior knowledge of the emissivity, which, unfortunately, is still a big deal. Compared with other radiation thermometry methods, the multi-spectral method considers the dependence of emissivity on wavelength and temperature to a certain extent, and theoretically more accurate results can be obtained, but this process is usually very complicated. More importantly, in most cases the emissivity model used by the multi-spectral method is an empirical formula, is more from the point of view of making mathematical calculation easier, and may not well reflect the real change in the target emissivity. To date, there is no universal emissivity model, and inappropriate selection of emission function may have a counterproductive impact on accuracy. Another significant source of error is the interference from other radiation sources, as shown in Equation (6).
Martinez et al. [35] analyzed the effects of several error sources on radiation thermometry. They selected the tube surface temperature in a refinery furnace as the research object and studied the tube surface temperature measured at different conditions under different radiation models. The effects of wavelength, emissivity, wall temperature, gas absorption, and radiation on tube temperature were studied with different radiation models. Their results showed that the uncertainty that came from the emissivity was the most significant, regardless of the model. In addition, when the reflection of radiation originating from surrounding walls was considered in the model, it also brought a non-negligible error, especially for some special morphological surface structures, such as concave surface. It is worth mentioning that the effect of emissivity was counteracted when the wall temperature and tube temperature were identical. This can also be derived from Equation (6): when T m = T s , the surface emissivity term ε m ( λ ) was cancelled out. The errors caused by these factors were also observed on other objects, for example, for the measurement of the turbine blade surface temperature. Gao et al. [67] summarized the errors and correlation methods under a high-temperature environment. The high ambient temperature means the influence of high-temperature gas and surrounding walls cannot be negligible. In addition, they proposed spectral window methods to analyze the gas radiation characteristics in different spectral ranges, so as to select the appropriate spectral range for temperature measurement and reduce the measurement errors.
In addition, in radiation thermometry, it is often assumed that the target surface is opaque. However, this assumption is not always valid. For example, for glass, if the selected measurement wavelength is shorter than 2.6 μm, the reflectivity of the glass is extremely low, and the transmittance is high. It is not only difficult to measure the temperature of the glass surface, but also the temperature of the medium behind the glass may be measured due to the high transmittance, which means erroneous temperature information is obtained. This phenomenon also exists in temperature measurements of thermal barrier coatings, which are widely used on the surface of high-temperature objects. Most thermal barrier coatings are translucent materials (cf. Figure 9); when radiation thermometry is applied, it is important to take this into account to choose proper measurement wavelengths.

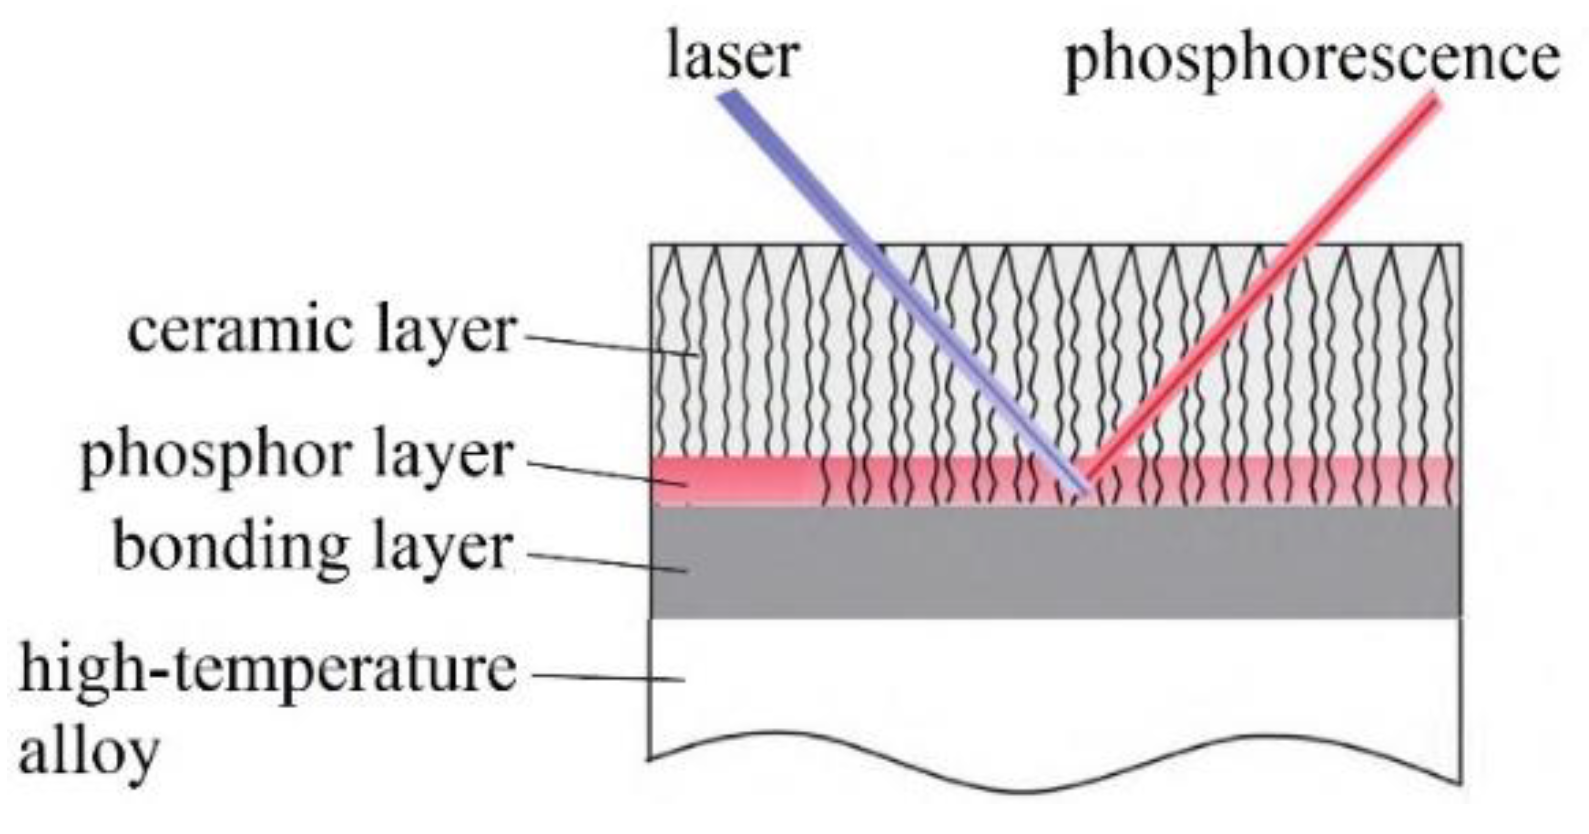
3.2. Laser-Induced Phosphorescence
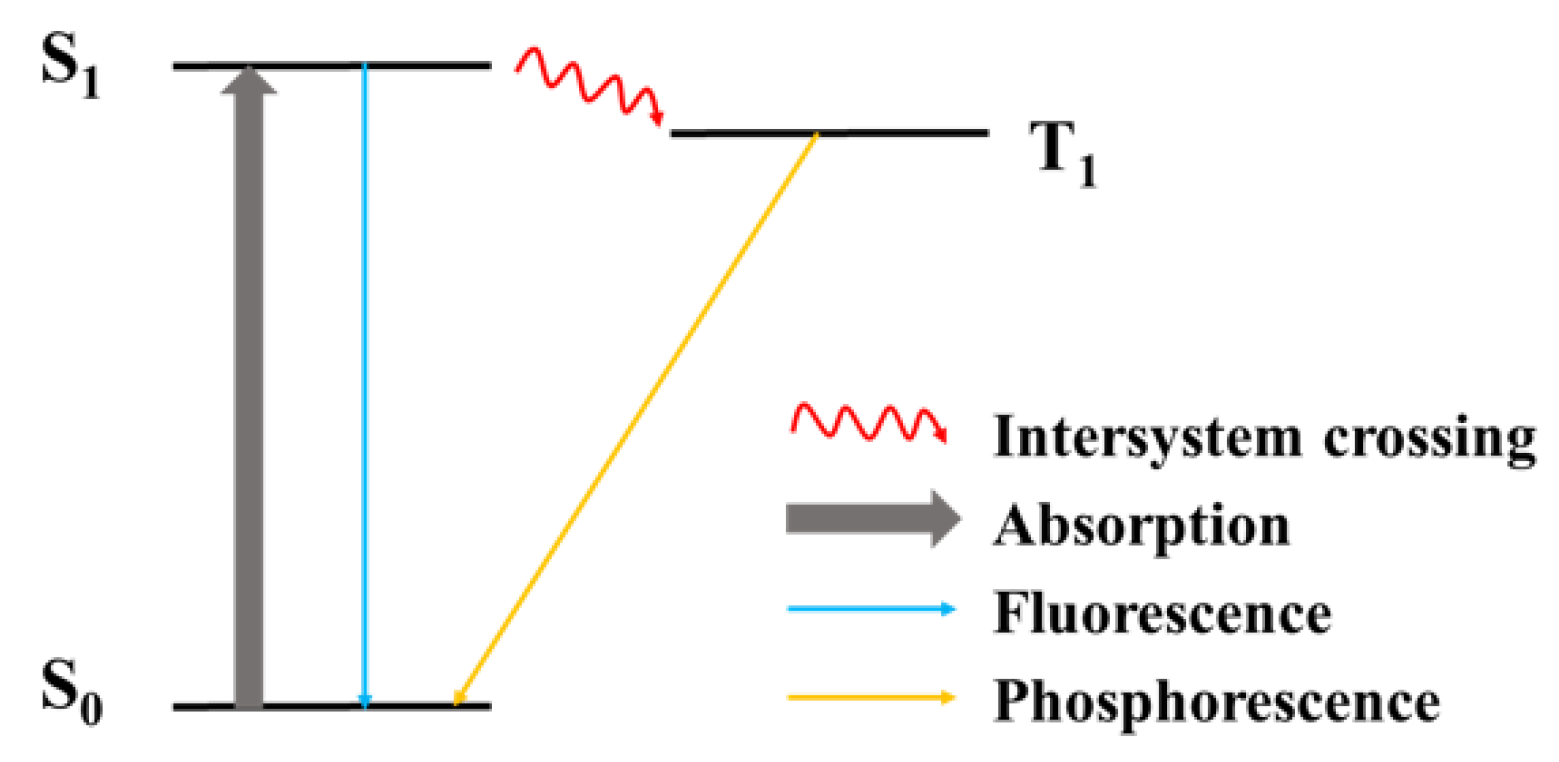
With the development of laser diagnostics, advanced laser techniques such as CARS [68], Raman scattering [69], Rayleigh scattering [70], and LIF [71] are widely used in combustion process. However, most of the above techniques are aimed at measuring the temperature of flames or flue gas. For surface temperature monitoring in industrial operation, such as combustor walls, or temperature of the surface where chemical reactions are going on, such as the surface of a propellant, utilization of the above-mentioned laser techniques is still very limited. A laser diagnostic technique suitable for surface temperature measurement in high-temperature environments is called laser-induced phosphorescence (LIP) or named phosphor thermometry. This technique is based on a type of special material which would emit light after illuminating, and lifetime or intensity of the light is a function of temperature. These materials are known as thermographic phosphors (TP), and the light they emit is called phosphorescence.
Research on the temperature dependence of phosphorescence might date back to the 1930s [72], but this research did not arouse a growing interest in this technique until the second half of the twentieth century. Thureau is believed to be the first man to discuss the temperature dependence of phosphorescence from the view of the spectral distribution [73]. He also employed the ratio of spectral intensities for phosphor thermometry. Until the 1980s, the ratio method was the only phosphor thermometry method used outside the laboratory. Leroux was the first researcher who applied the temporal characteristics of phosphorescence to measure temperature [74]. This was also the precursor of lifetime thermometry. To date, the ratio method and the lifetime method are the most common phosphor thermometry methods. Almost all thermographic phosphors can be used by these two methods, but each kind of phosphor has different sensitivity in different methods. For example, YAG:Dy is more sensitive in the lifetime method, while it is less sensitive in the ratio method. As for ZnO:Zn and ZnO:Ga, they have high sensitivity in the ratio method [34]. In addition, the sensitivity of phosphor materials in each method varies with the temperature measurement range. When using the lifetime method, YAG:Dy is more sensitive at high temperature, i.e., over 800 °C [75].
Due to great interest in laser-induced phosphorescence, several review papers emerged. In 1997, Allison and Gillies [76] published a review of phosphor thermometry. In this article, the history and development of temperature measurement based on laser-induced phosphorescence were introduced, and they also summarized the phosphor materials that had been used, as well as their temperature measurement ranges and application scenarios. Today, this review is still a valuable reference for researchers. Currently, with the increasing demand for non-contact and high-precision temperature measurement tools, the laser-induced phosphorescence technique has been widely studied and exploited. In the past 20 years, many studies on the temperature measurement characteristics of various phosphor materials and review articles have emerged [5,34,77,78]. These review articles introduced phosphor thermometry principles, phosphor preparation methods, surface coating methods, temperature measurement errors, and various applications to help researchers better understand this technology.

3.2.1. Principles

Generally, most electrons of material are at the ground electronic level. When energy from an excitation source, e.g., electromagnetic radiation, particle beams, electrical current, chemical energy, etc., is absorbed by a material, electrons will be excited from the ground state to an unstable excited state. However, electrons cannot stay at this state for a long time, and they will return to the ground state or an intermediate state, releasing energy which can be in the form of light or heat. If the energy is emitted in the form of light, the process is called luminescence. This process can be described by the Jablonski diagram shown in Figure 10. Fluorescence and phosphorescence refer to the same process as luminescence, but with the different duration. For fluorescence, since the transition occurs with the same multiplicity (S1→S0), the process is faster, and the duration is typically of 10−9–10−3 s. As for phosphorescence, due to the electrons experiencing a transition with a different spin multiplicity (T1→S0), the process is much slower and the duration is 10−3–103 s [76]. Because phosphorescence has a longer lifetime, it is more convenient to use in thermometry, where temperature is determined by its relationship with lifetime.
As we mentioned above, the materials exploited in laser-induced phosphorescence are thermographic phosphors, which compose rare-earth or transition-metal-doped host materials. Usually, ceramic materials are selected as host materials, and the dopants, i.e., the rare-earth or transition metals, are called activators or luminescent centers. The reason for deliberately adding a certain concentration of activator to the host material is that it increases the luminous efficiency of the phosphor materials, since rare-earth and transition metals have a strong spin–orbit interaction. Sometimes, another dopant, so-called sensitizer, is also applied to further increase the phosphorescence output. To emit phosphorescence, UV light is employed to illuminate the phosphor materials, while the third (355 nm) and fourth (266 nm) harmonic frequencies generated from the Nd:YAG laser are the most commonly used UV light sources. Phosphor thermometry exploits the fact that the rates of the non-radiative processes are a function of temperature [5]. To understand this, we can take the de-excitation process into account. The rate of the de-excitation of electrons at the excited state can be expressed as follows:
dN ( t ) dt = ( A 12 + W 12 ) N ( t )
where t is time, N ( t ) is the time-dependent population of electrons at the excited state,   A 12 is the spontaneous emission coefficient between the excited state and the ground state, and W 12 is the rate of non-radiative transition between the excited state and the ground state. Solving this equation, we can derive the following relationship:
N ( t ) =   N ( 0 ) exp ( A 12 + W 12 t )
The lifetime τ is defined as the time at which N ( t ) is reduced to 1/e (e ≈ 2.71828) times of its initial value N ( 0 ) . Thus, the lifetime of this process equals 1 / ( A 12 + W 12 ) . Since W 12 varies with temperature while A 12 is temperature independent, the lifetime of phosphorescence is a function of temperature, and this is also the principle of temperature measurement by the lifetime method.

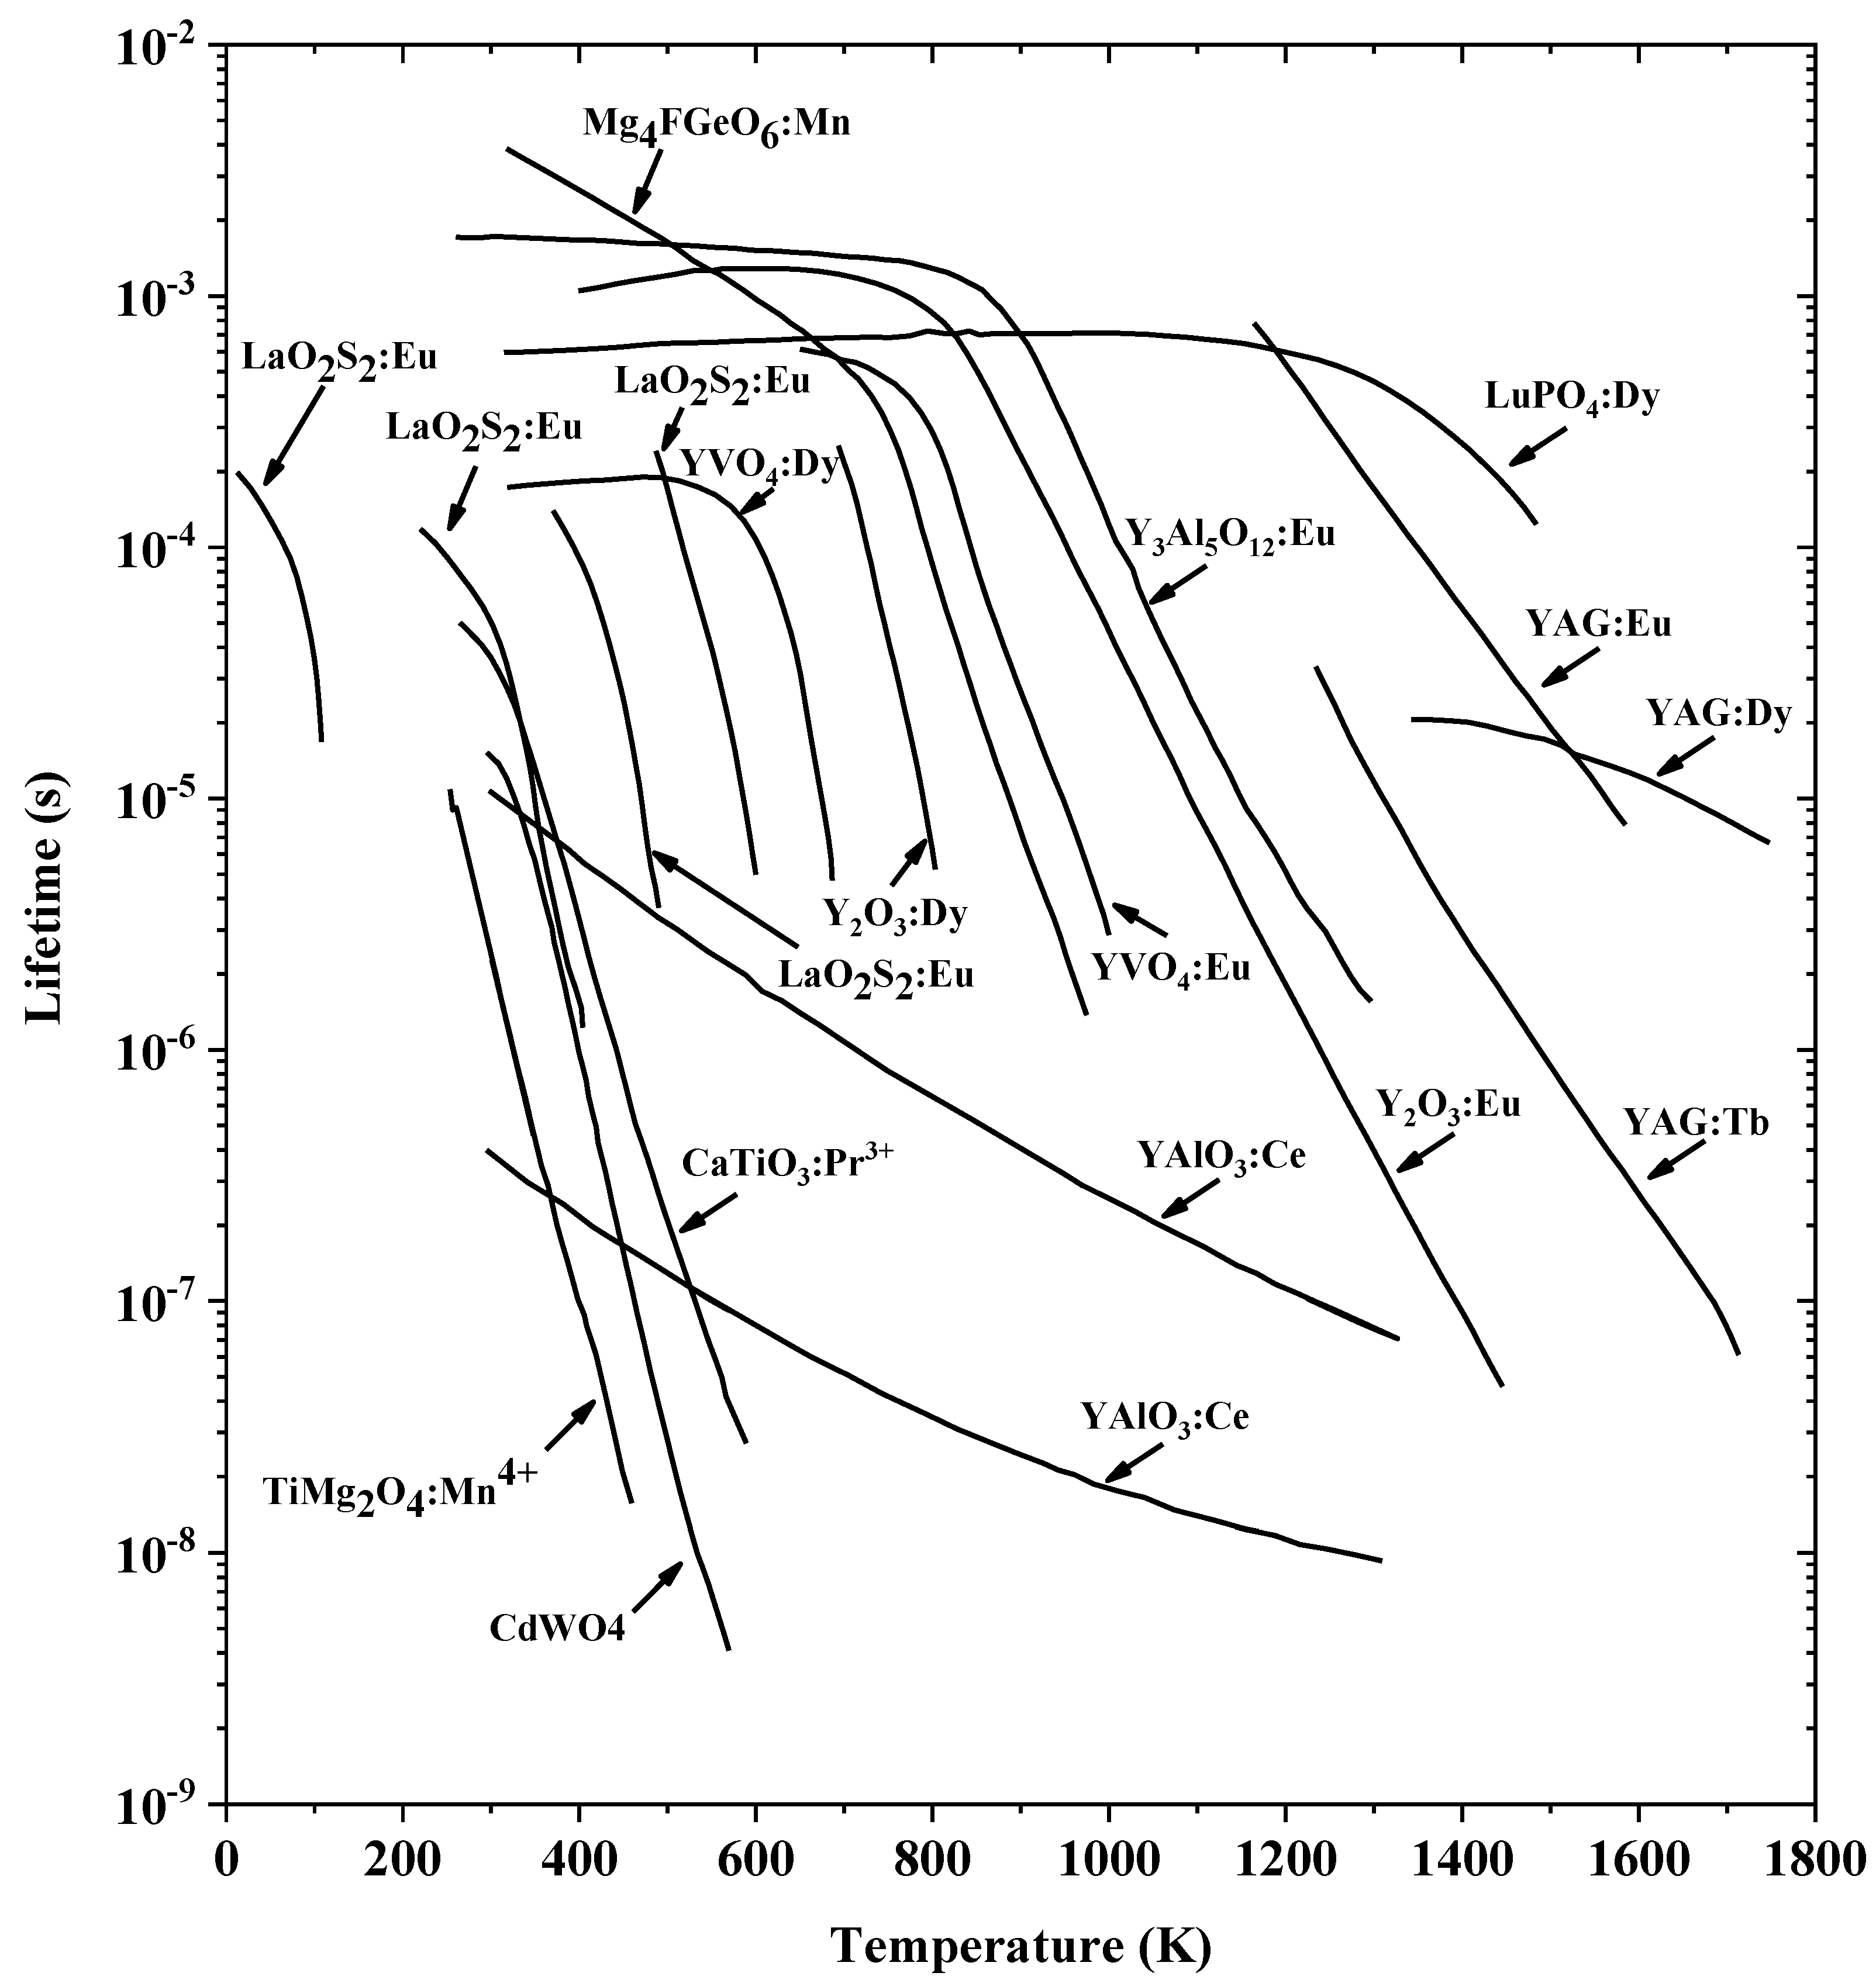
3.2.2. Lifetime Method

As we introduced above, the lifetime of phosphorescence is temperature dependent. Generally, at a determined temperature, the phosphorescence intensity decay characteristics can be expressed by a mono-exponential function of time:
I ( t ) = I 0 exp ( t τ )
where I ( t ) is the phosphorescence intensity as a function of t, I 0 is the initial phosphorescence intensity, and τ is the lifetime. It can be seen that this equation has the same expression as Equation (21). This is easy to explain because the luminescence intensity depends on the electron population of the excited state. At higher temperature, the non-radiative transition rate can be accelerated. As a result, the lifetime τ decreases, and this decreasing trend can be depicted by a calibration curve with varying temperatures. A summary of lifetime–temperature curves of numerous frequently used phosphors is shown in Figure 11. It should be mentioned that some phosphors have more than one temperature dependence curve, and this is due to their different radiation characteristics under different energy levels.
Generally, the phosphorescence signal is collected by a photodiode or a photomultiplier tube (PMT) in the lifetime method. Thus, no spatial information of the temperature is obtained. To achieve two-dimensional (2D) measurement based on the lifetime method, Omrane et al. [79,80,81] exploited a framing camera with eight consecutively gated CCD detectors to record the phosphorescence emission. Since each detector was set a little delayed from the previous one, the decay curve of phosphor was measured. By fitting the measurement results with the calibration curve, temperature field information was obtained. However, the temporal resolution using several consecutively gated CCD detectors is limited by the number of detectors and is much lower than that using PMT. With the rapid development of high-speed imaging technique, another more convenient method to obtain two-dimensional temperature information based on the lifetime method is to obtain decay curves using a high-speed camera [82,83,84,85,86,87,88]. Kissel et al. [84] first used a CMOS (complementary metal oxide semiconductor) high-speed camera to record the phosphorescence emission and achieve 2D surface temperature measurement of a high-temperature stainless steel plate. Someya et al. [85] used a non-intensified high-speed CMOS camera to acquire the temperature distribution of walls of a rapid compression expansion machine. Due to the higher temperature measurement accuracy of the lifetime method [89], the use of a high-speed camera as a detector overcomes the shortcoming that the lifetime method does not have spatial resolution. This approach becomes one of the most promising thermometry methods.

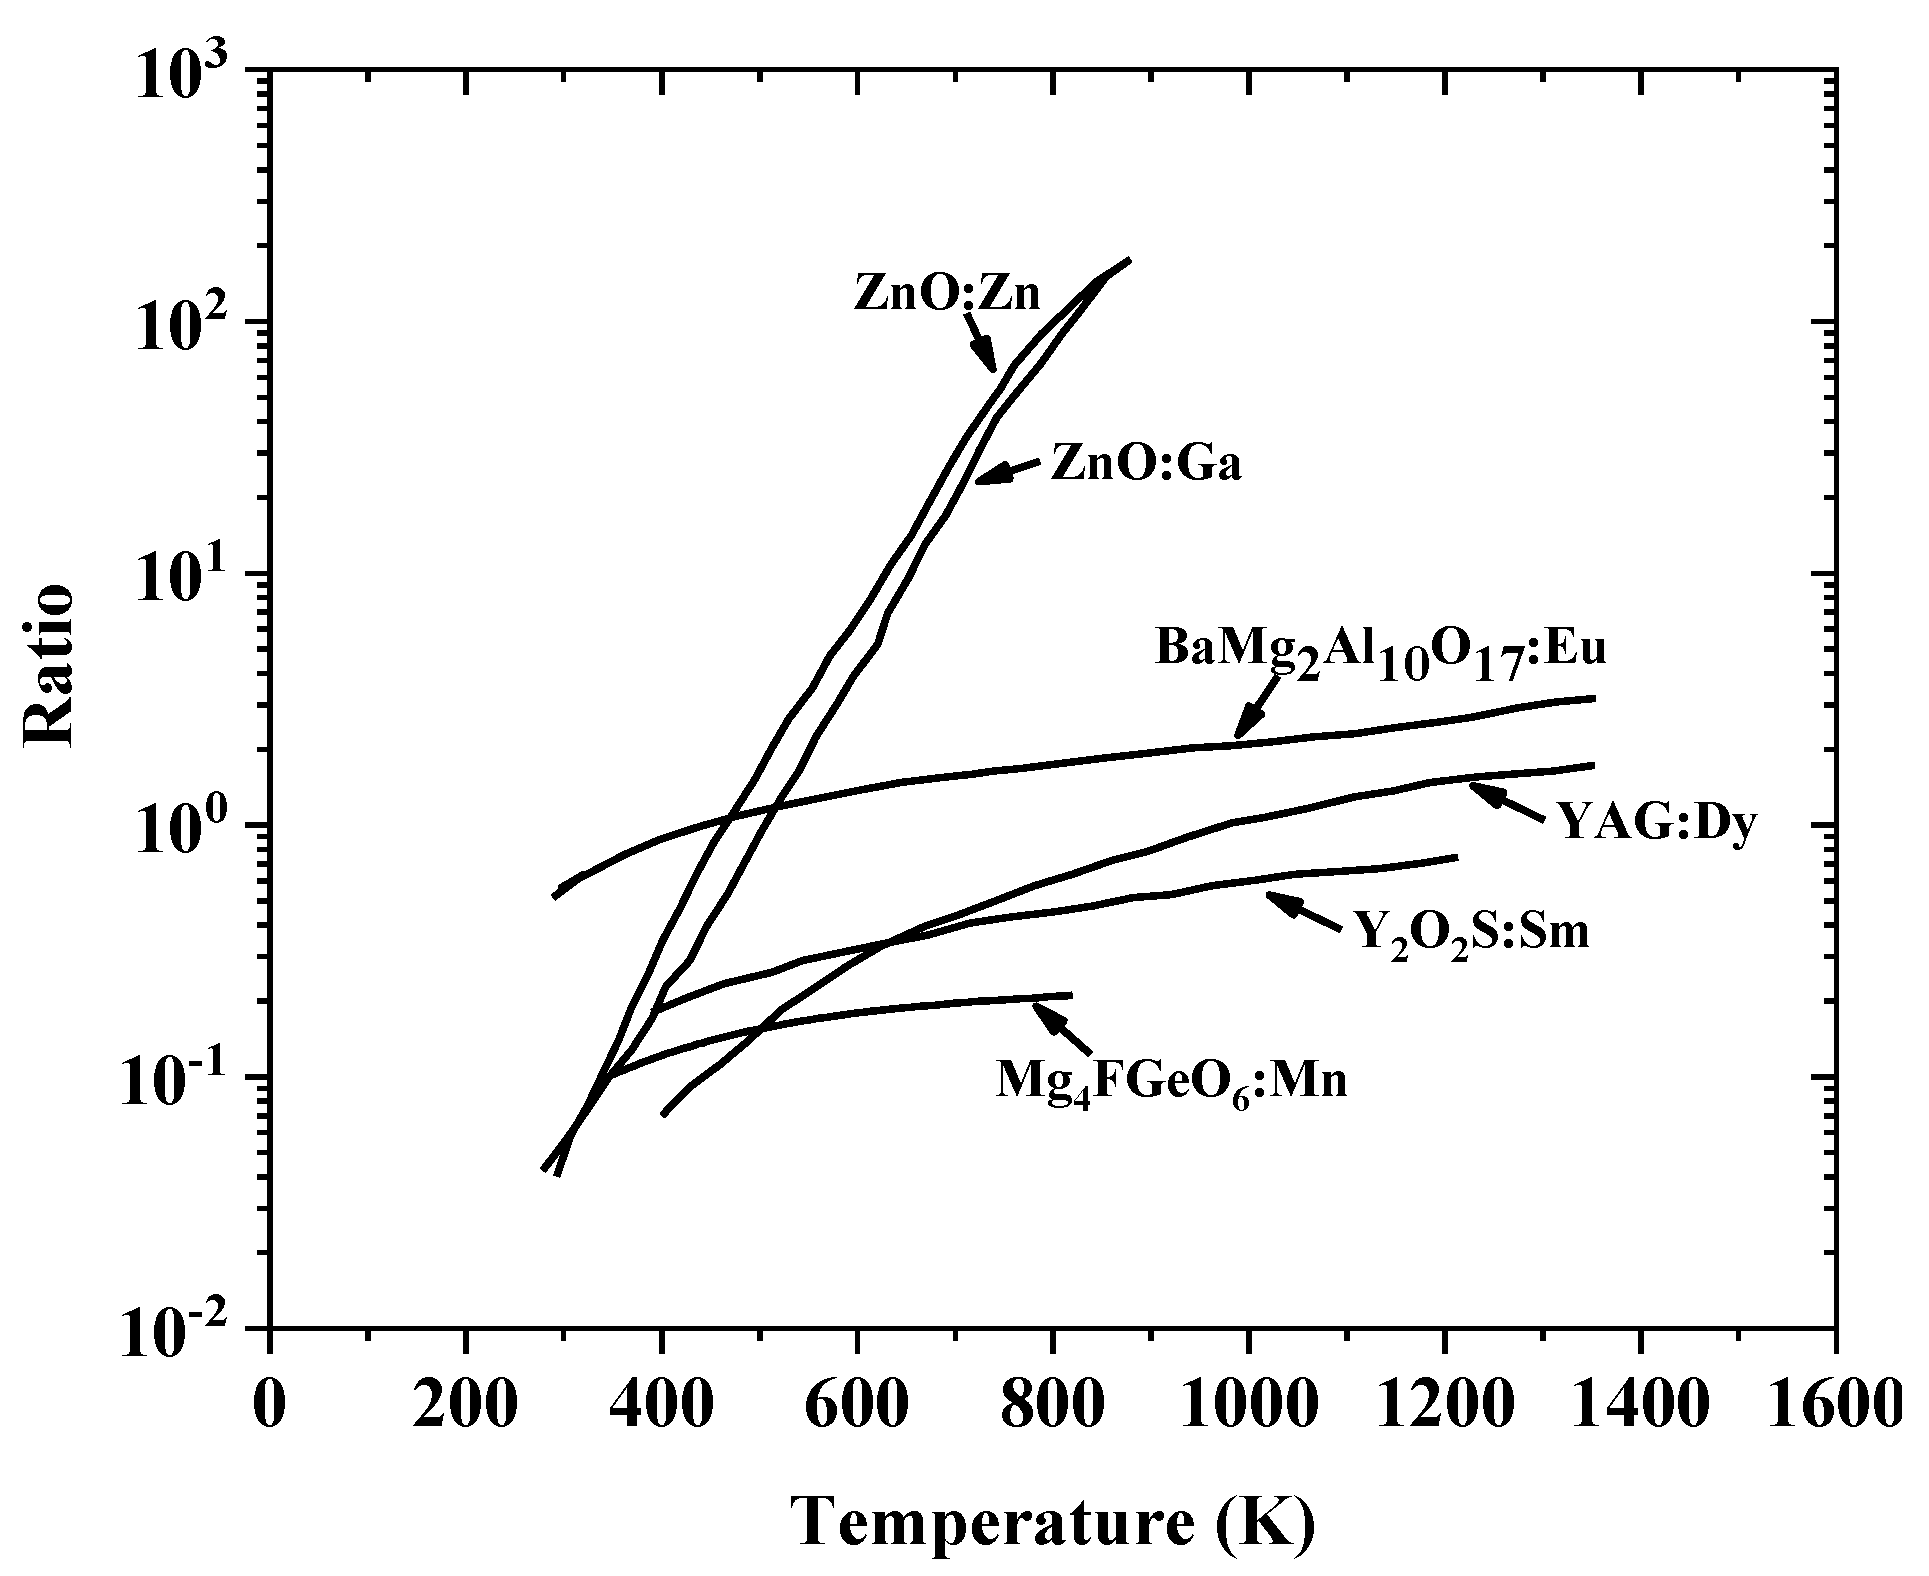
3.2.3. Spectral Intensity Ratio Method

The spectral intensity ratio method is the other widely adopted method in laser-induced phosphorescence [90,91,92,93,94]. The intensity of phosphorescence emitted from phosphors at a certain wavelength or spectral band is also a temperature-dependent function. However, if the surface temperature is determined only by the phosphorescence intensity, it may lead to a large error. This is because the intensity not only depends on temperature, but also relies on incident laser intensity, phosphor coating uniformity, etc. However, by using the spectral intensity ratio, these relevant interferences can be eliminated. The spectral intensity ratios of several phosphors used in laser-induced phosphorescence are shown in Figure 12. Goss et al. [95] used the ratio method to measure the surface temperatures of a ceramic plate heated by a resistance wire and a plastic plate of which the surface was etched by a CO2 laser. They chose dysprosium-doped yttrium aluminum garnet (YAG:Dy) as the phosphor, which showed the temperature sensitivity between 300–1700 K. More importantly, their results demonstrated the possibility of applying this method to the reacting surface. Neither interference from flame nor a problem caused by surface erosion was observed in their experiments. This is an important aspect in which the phosphor thermometry is superior to the radiation thermometry. In the radiation thermometry, especially the imaging thermometry methods, the surface radiation would be dramatically disturbed by the radiation or absorption from sooty flame, etc. This advantage also makes phosphor thermometry quite suitable to be applied to the surface temperature measurement of hot components of gas turbines, where luminous flames, reflected radiation, variations in surface emissivity, and degradation of optical system cleanliness severely limit the feasibility of radiation thermometry [93].
Compared with the lifetime method, fewer phosphors are currently employed in the ratio method, of which YAG:Dy is the most commonly used. YAG:Dy is also known as a phosphor material with the highest temperature measurement limit [75]. Another phosphor which has a ratio–temperature dependence is samarium-doped yttrium oxysulfide (Y2O2S:Sm). It was first proved by Feist and Heyes [90]. Since properties of Sm3+ show similarities to those of Dy3+, the Y2O2S:Sm phosphor also behaves in a similar luminous manner to YAG:Dy. Zinc-doped zinc oxide (ZnO:Zn) and gallium-doped zinc oxide (ZnO:Ga) are two special phosphors with very high temperature sensitivity (cf. Figure 12) [96]. Li et al. [97] exploited laser-induced phosphorescence thermometry, where ZnO:Zn was selected as the phosphor material, to replace thermocouples in a heat flux burner to record the burner plate surface temperature. A temperature sensitivity better than 60 mK was achieved, which reduced the uncertainty of methane/air flame velocity at Φ = 0.7 from 1.5 cm/s to 0.25 cm/s. Since this method does not need to record decay characteristics of phosphorescence, it is easy to achieve 2D temperature measurement using the spectral intensity ratio method. The detector can be an ICCD with an imaging stereoscope or two ICCDs with a beam splitter. In each strategy, a calibration procedure is needed to correct the non-uniformity of the detector [34].
As we mentioned in the previous section, the lifetime method is more accurate than the spectral intensity ratio method. In fact, in terms of reproducibility and sensitivity, the lifetime method is more advantageous. This is due to that the factors affecting lifetime measurements are more controllable than those affecting ratio measurements [5]. In addition, considering the temperature measurement range, the lifetime method usually has a higher upper limit than the ratio method. However, for fast moving objects, such as turbine blades, the spectral ratio method is more applicable than the lifetime method. In addition, the short gate width of detectors used in the spectral intensity ratio method can avoid motion blur [34]. This advantage makes the spectral intensity ratio method promising in the surface temperature measurements of rotor blades, which are significant to the reliability assessment and lifetime prediction of aero engines and gas turbines.

3.3. Other Non-Intrusive Thermometry

3.3.1. Liquid Crystal Thermography

Thermochromic liquid crystals [98] are used in surface temperature measurement because their optical properties are temperature dependent. With the irradiation of light, the color (wavelength) of the reflected light depends on the crystal temperature. This is because the structure of liquid crystal molecules is optical anisotropy. When thermochromic liquid crystals are applied to the measured surface, the temperature change from the measured surface causes the change in the molecular layer spacing of liquid crystals, thus the frequency of the reflected light changes and behaves as a change in color. Using imaging detectors, for example, a CCD camera, the surface temperature distribution of a target object can be determined. However, a significant shortcoming of liquid crystal thermography is that it has a very low upper limit of temperature measurement. Regarding different liquid crystal materials, the temperature measurement ranges are also different, but generally not more than 400 K. As a result, they are seldom used in the hot environment of a combustion system. Nevertheless, because it is economical and capable of 2D measurement, this method is often used to measure the surface temperature of turbine blades with a cooling system, e.g., film cooling [99,100,101,102,103,104]. In these cases, the heat transfer coefficient is derived from the measured wall temperature to assess the cooling efficiency.

3.3.2. Temperature-Sensitive Paint

Temperature-sensitive paint (TSP) [105,106] is very similar to thermographic phosphors (TP). The temperature measurement using TSP is also based on the temperature-dependent non-radiation process of luminescent materials, whose luminescence intensity and lifetime decrease with increasing temperature as a consequence. To measure the surface temperature, TSP is applied to the target surface. Luminescence is emitted from the coating under excitation by an incident illumination light (e.g., LED lamp or laser) and the signal is received by a detector. Different from thermographic phosphors, TSP is generally composed of organic dye molecules and a polymer binder, while TP is composed of rare-earth or transition metals and a ceramic host and is applied in powder or crystal form. The temperature-sensitive paint technique originated almost at the same time as LIP and was originally developed for aerodynamic testing, including surface temperature measurements and heat flux calculations [107]. Like LIP, it is easy to obtain 2D temperature distribution using the temperature-sensitive paint technique. A comprehensive introduction of TSP was given by Liu et al. [108] about its principles, data acquisition, analysis procedures, and applications. A big limitation of TSP utilization in combustion systems is that its upper limit of temperature measurement is very low, i.e., typically under 380 K [5]. This means that, like liquid crystal thermography, it can only be used to measure the temperature of a surface with a low temperature (e.g., surface with cooling system) in combustion environments [109]. The implementation of temperature-sensitive paint technique and phosphor thermometry is similar. However, phosphor thermometry has a much higher upper limit of temperature measurement range. As a result, it is recommended to use phosphor thermometry in high-temperature environments and TSP for low-temperature environments.

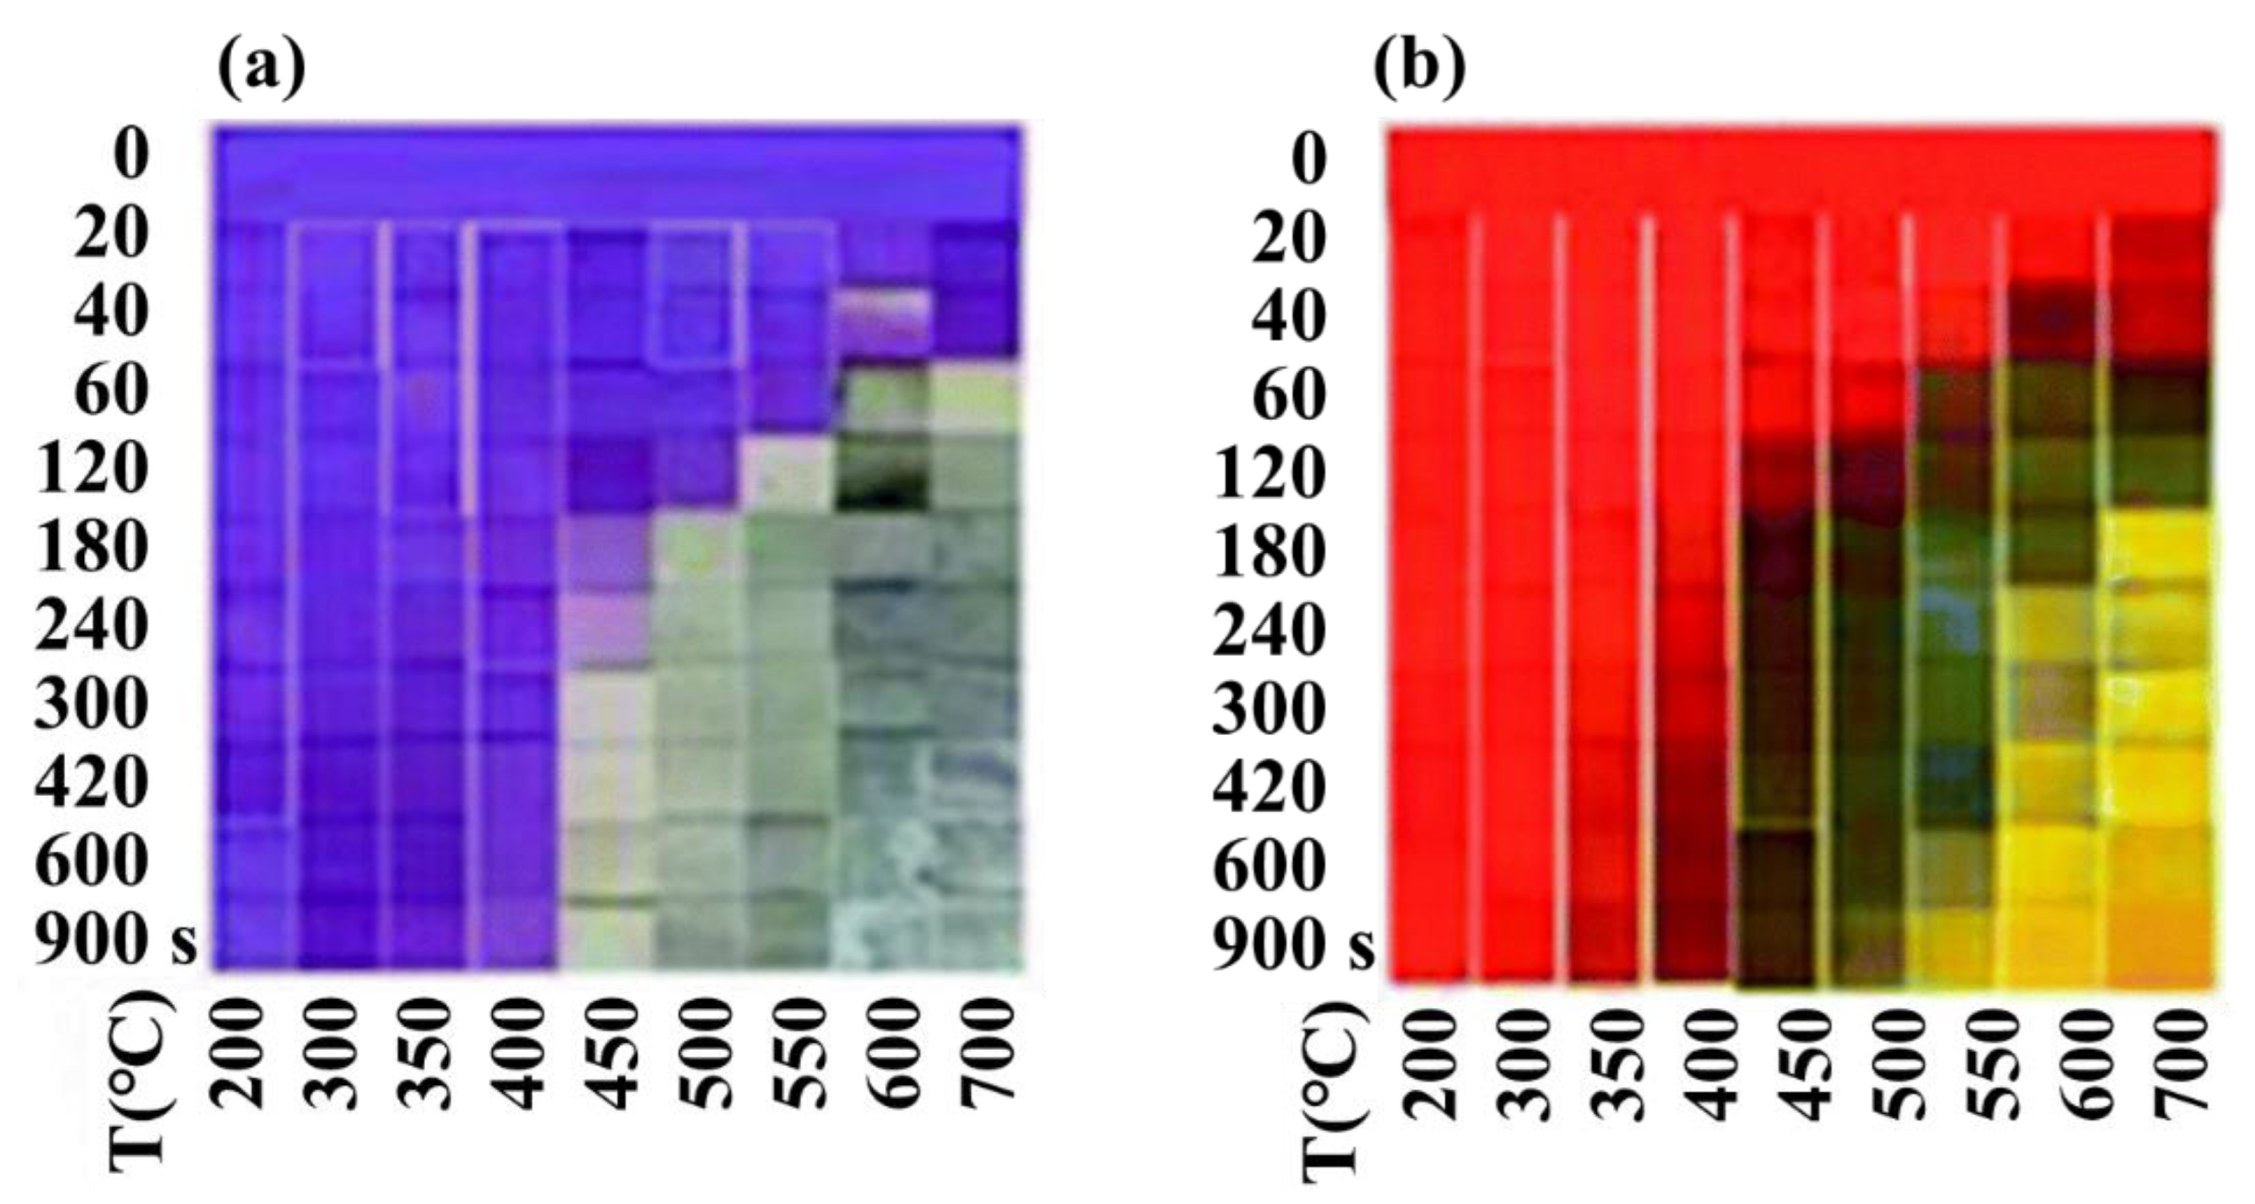
3.3.3. Temperature-Indicating Paint

Temperature-indicating paint (or thermal paint) is a type of coating that measures the surface temperature distribution through color change. It should be noted that, unlike phosphor thermometry and temperature-sensitive paint, the color change of temperature-indicating paint is due to the chemical reaction, therefore, an extra light source is not needed in this method. This method is cheap, easy to implement, and can be used for large-area 2D temperature measurement. Therefore, it is one of the most successful commercial temperature measurement methods and is available in a variety of forms including crayons, pellets, and paints [29]. Most thermal paints are irreversible, which means the color of paint has changed permanently and cannot be restored to the original color after cooling. Two sub-types are employed: (1) single-change-type paints and (2) multiple-change-type paints. The former undergoes only one transition of color, while the latter can transit through several different colors. Figure 13 illustrates the temperature transition of both single-change-type and multi-change-type paints. Temperature-indicating paints have a wide working temperature range, and the upper limit can reach 1350 °C [110], which allows them to be applied in high-temperature environments. However, the resolution of temperature is limited and is generally lower than that of radiation thermometry and phosphor thermometry. One of the features of thermal paint is that it can only provide the information of the peak temperature. This is somewhat disappointing, as it cannot provide online temperature information. However, in some cases the peak temperature distribution is enough, for example to give a warning if the surface temperature exceeds the designed value. In addition, since optical access is not needed, it is suitable for industrial applications with harsh environments, e.g., temperature measurements of gas turbine walls [111], aero engine blades [112] turbine blades [113,114], and components of rockets [115,116].

4. Applications

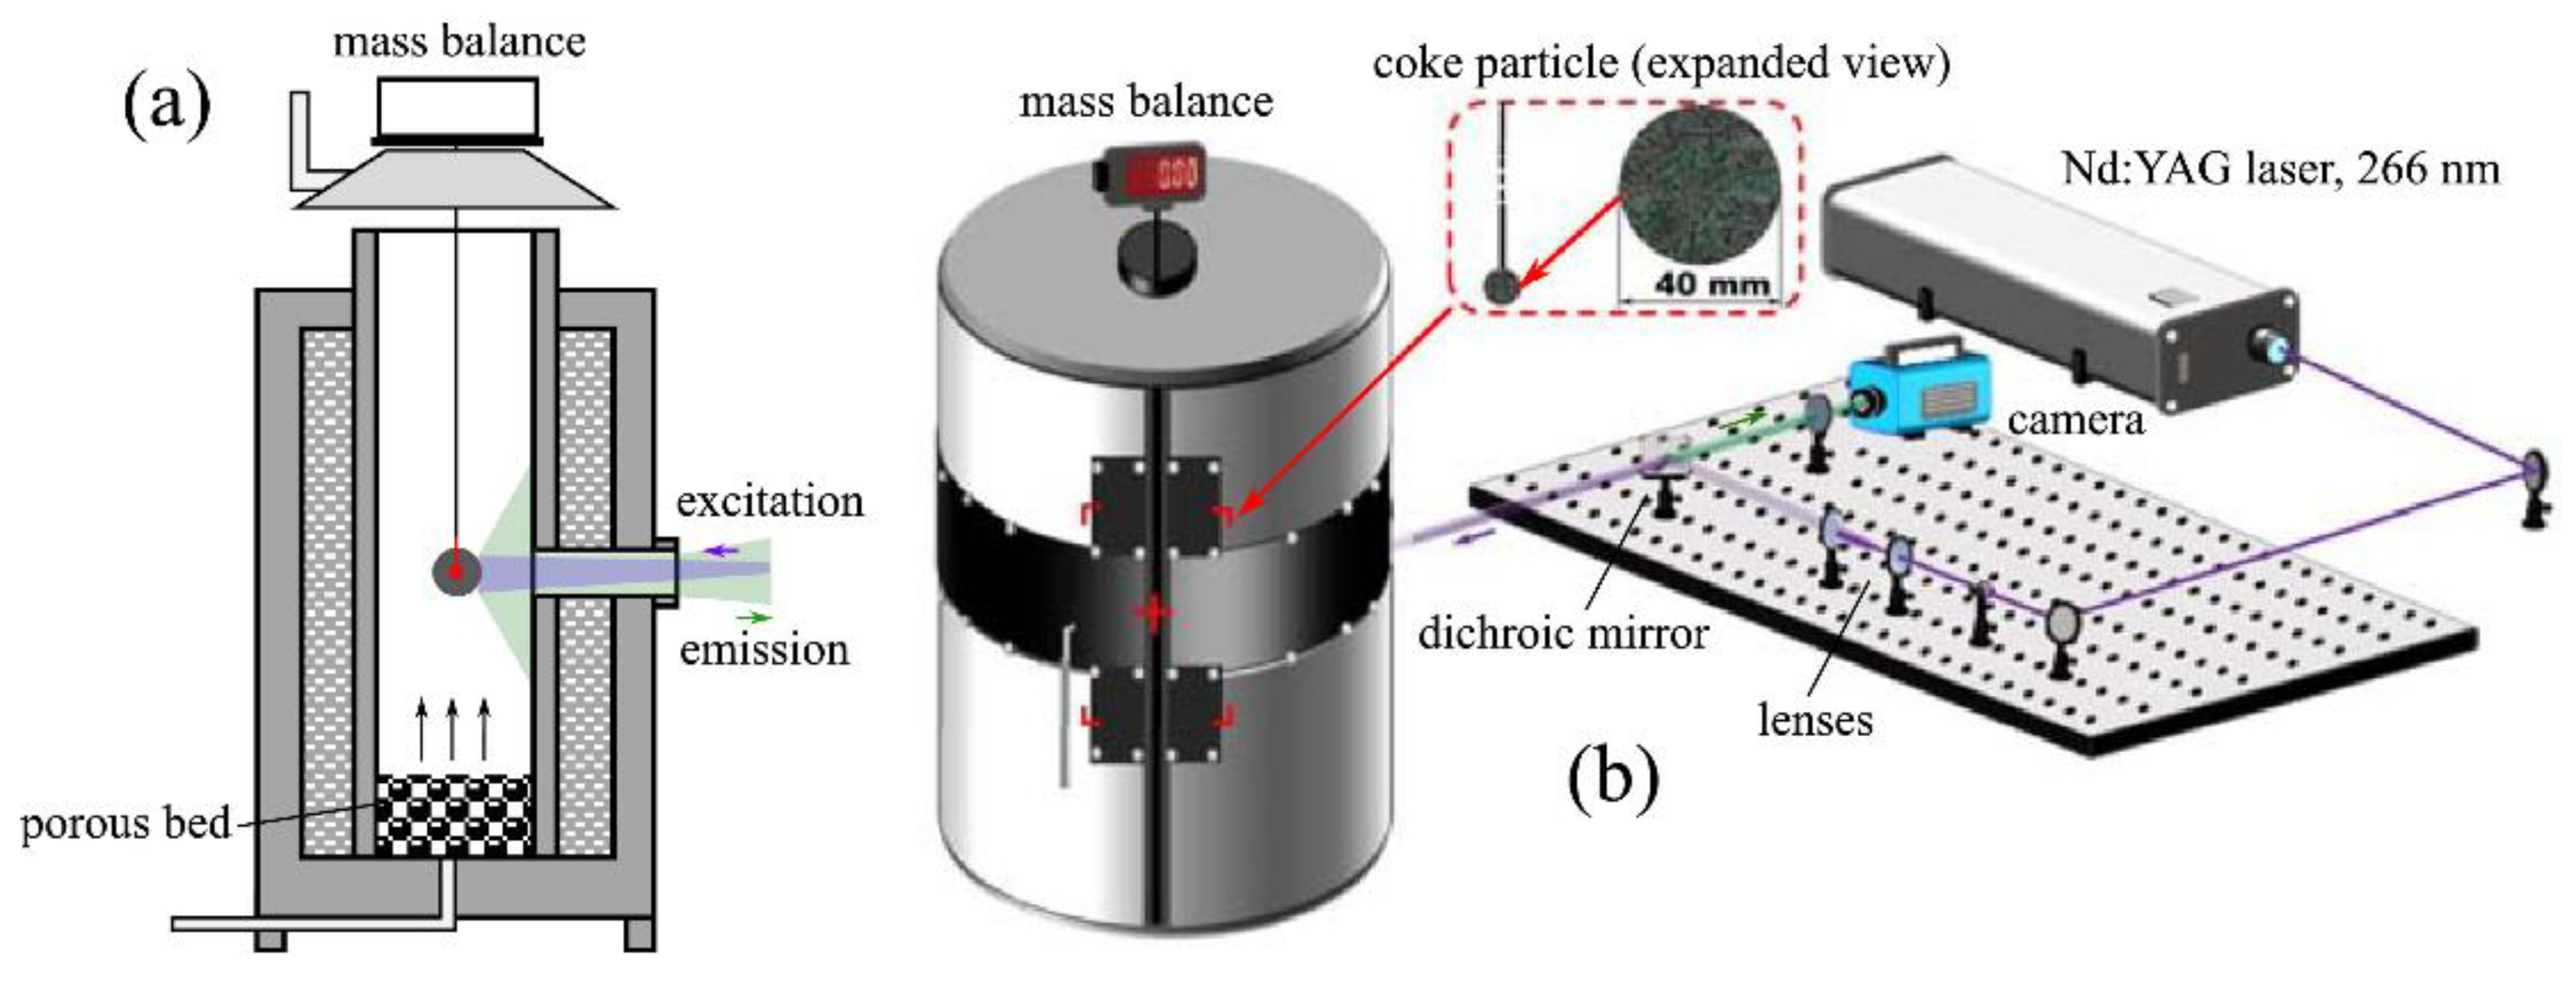
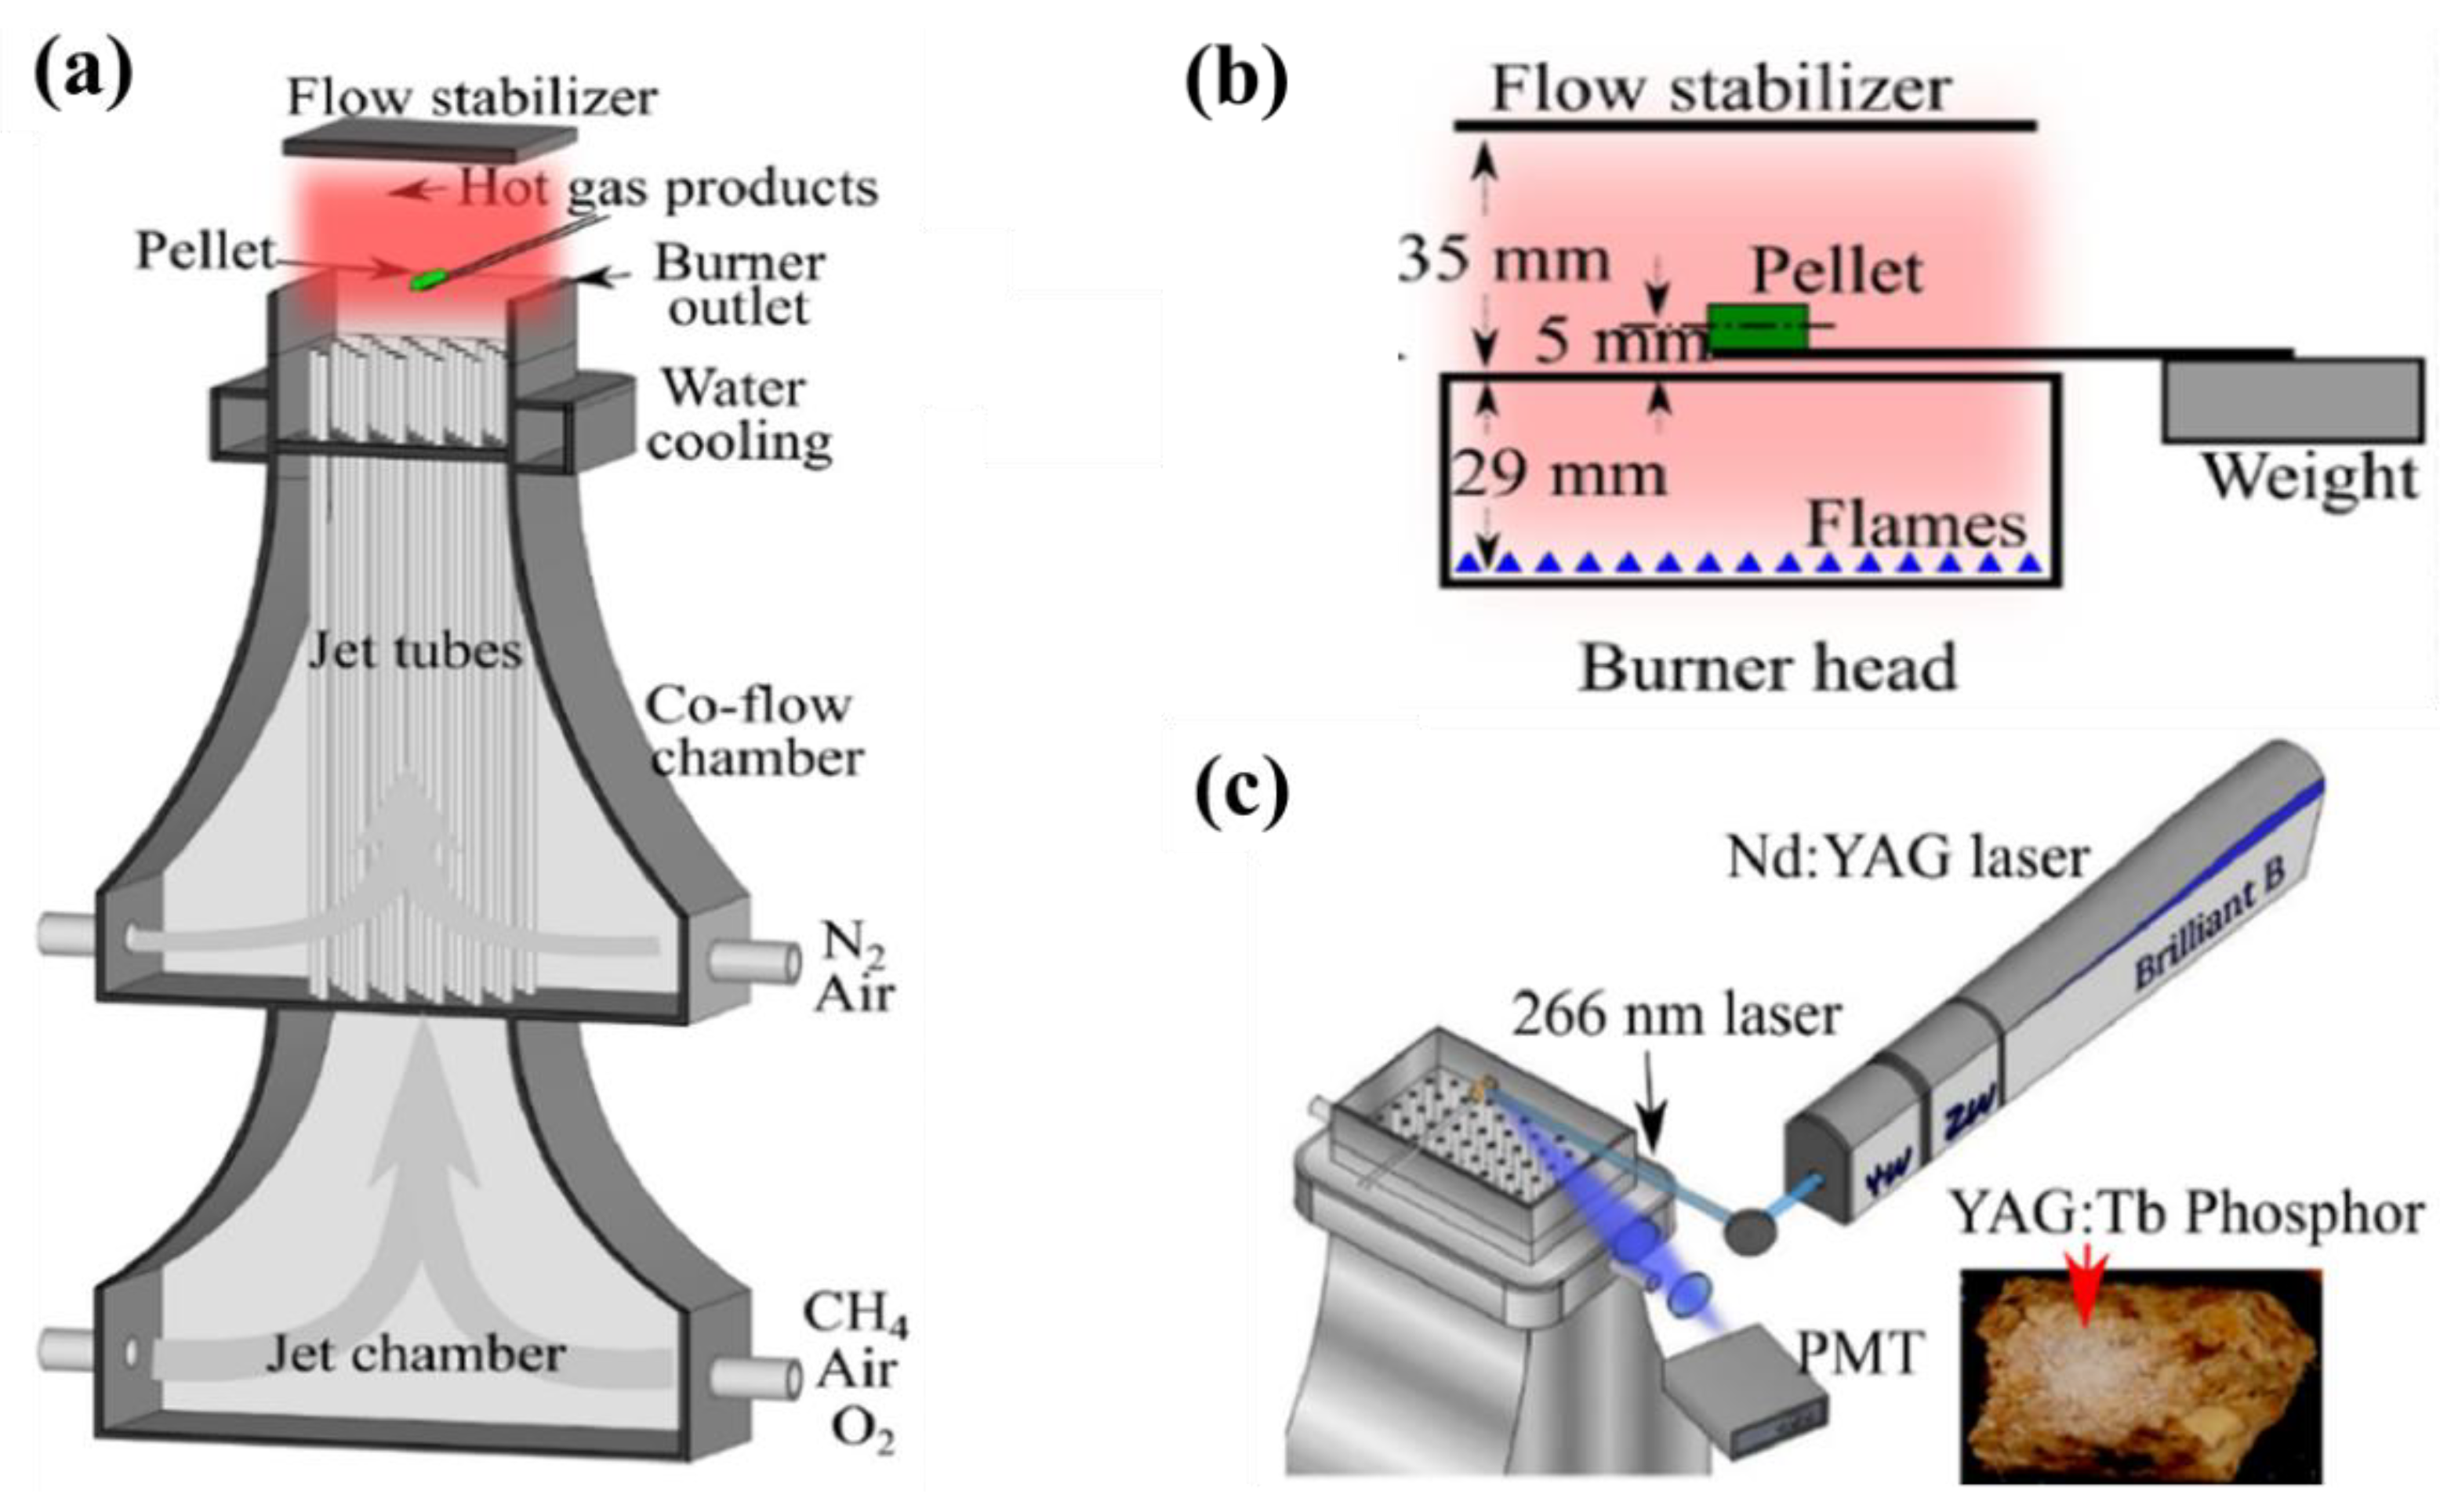
4.1. Surface Temperature of Burning Solid Fuels

Knowledge of temperature is important for burning solid fuels in the aspect of modeling and industrial utilization. In this section, we introduce the surface temperature measurement of burning solid fuels, i.e., biomass and coal, which exploits the above temperature measurement techniques.
Although thermocouples are the most commonly used temperature measurement method in the industry, they are not often used to measure the surface temperature of coal or biomass. This is because, for biomass and coal particles, since their sizes are very small, typically in tens to hundreds of microns, it is difficult for thermocouples to measure their temperature, while biomass and coal pellets will shrink during the combustion process, and there is no guarantee that the thermocouple will always be in contact with the particle surface for temperature measurement during the whole combustion process. Radiation thermometry is the most commonly adopted method, as it is convenient to acquire surface temperature of burning fuels with 2D information. Fletcher et al. [118] measured simultaneously the temperature, size, and velocity of individual coal particles in a heated flow reactor. The temperature was determined using an infrared pyrometer. He et al. [119] and Liu et al. [120,121] measured the surface temperature of coal and biomass pellets using two-color thermometry. The temperature characteristics were related with the alkali release behavior of established alkali release models. Lu et al. [122] used a calibrated multi-spectral pyrometer to measure the surface temperature of biomass pellets in a single-particle reactor and particles in an entrained-flow reactor, respectively. The detector was a commercial three-color camera, which was inexpensive and convenient to use. Weng et al. [123] obtained the surface temperature of wheat straw char particles heated by a McKenna flat flame burner using two-color pyrometry. The temperature profile was compared with a radiation signal to analyze the combustion characteristic of wheat straw char. However, it is difficult to determine the surface temperature of coal and biomass with the presence of sooty flame around them, which is more obvious during the devolatilization stage [124,125]. Phosphor thermometry, which is less effected by sooty flame radiation, was attempted to be applied in surface temperature measurement of coal and biomass pellet. Cai et al. [126] measured the surface temperature of a large-diameter spherical coal coke pellet hanging in packed bed furnaces using phosphor thermometry. The schematic of the furnace and setup of phosphor thermometry is shown in Figure 14. A thin layer of Y3(Al,Ga)5O12:Tb powders was coated to the coke surface. A calibration profile of phosphorescence lifetime as a function of temperature was used to deduce coke surface temperature. A comparison of surface temperature, center temperature (measured by a K-type thermocouple), and mass conversion was made to study the behaviors of coke during the whole combustion process. Weng et al. [127] measured the surface temperature of burning wood and straw pellets from 300 K to 950 K, and from 850 K to 1300 K, with two phosphors, i.e., Mg4FGeO6:Mn and YAG:Tb, respectively. The experiment setup is shown in Figure 15, where a self-made multi-jet burner was used to offer the high temperature atmospheres with changeable temperature and oxygen concentration. A mixture of phosphor powders and HPC binder was applied to the pellet surface as approximately 4 mm diameter spots. They also adopted the lifetime method to determine the temperature. Their results displayed the surface temperature profiles for both devolatilization stage and char and ash combustion stage with varied atmosphere temperatures and oxygen concentrations and showed the ability of applying phosphor thermometry to a surface with ongoing vigorous oxidation reactions.

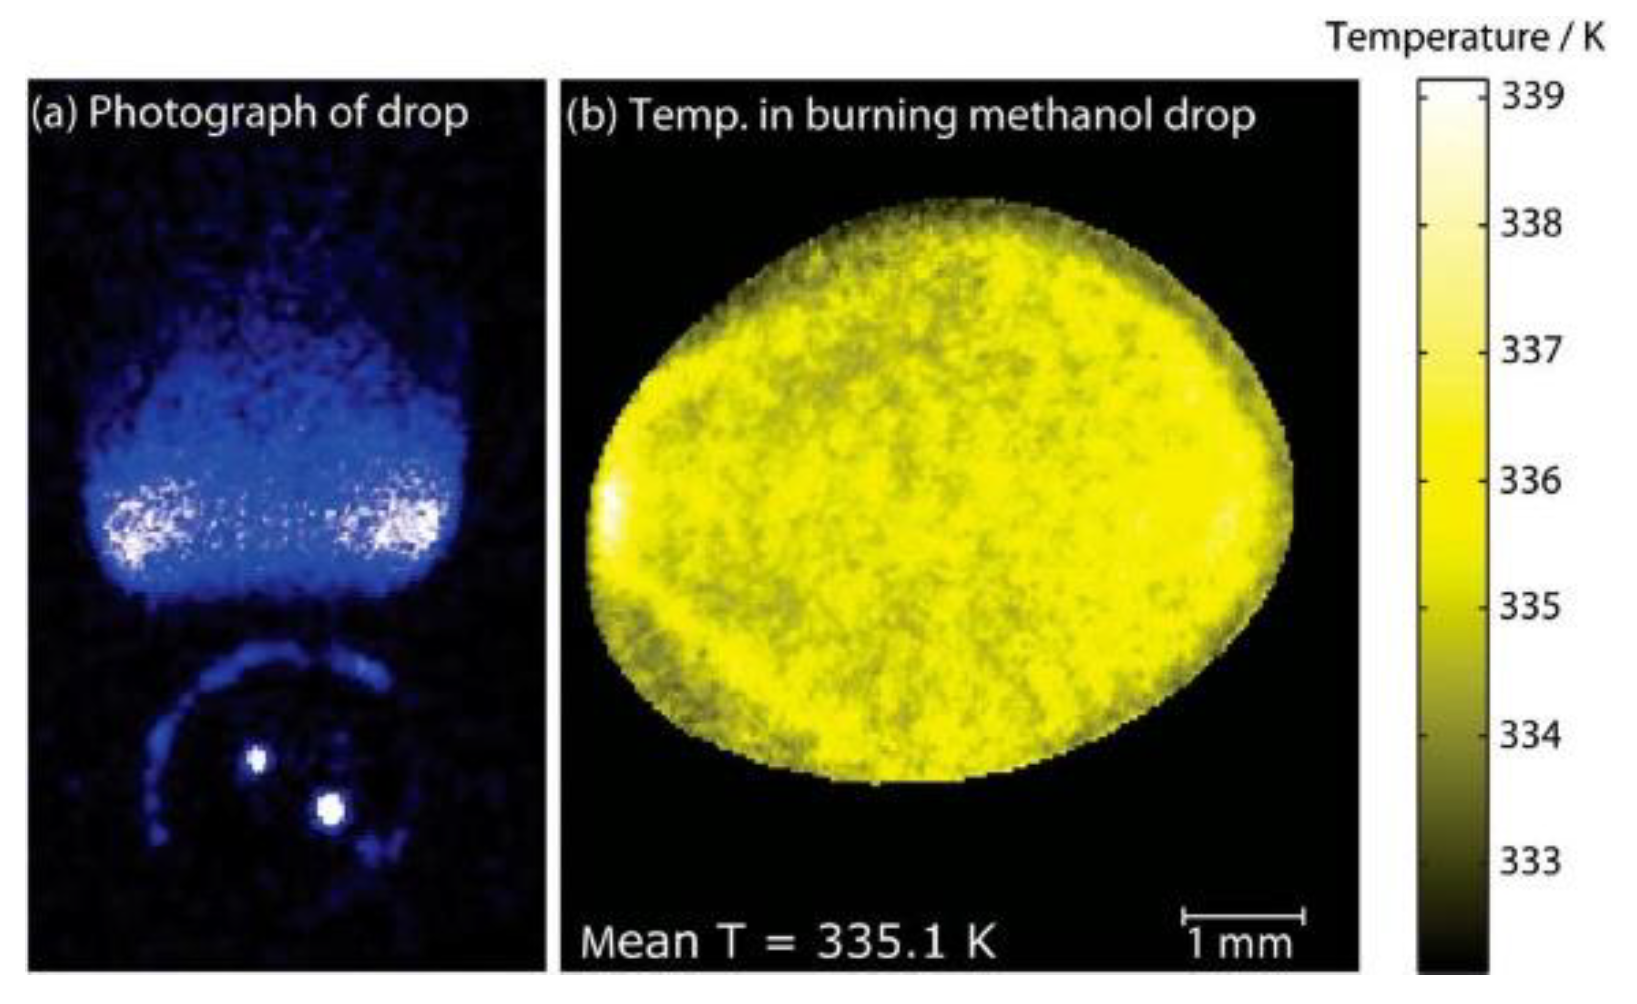
4.2. Droplets and Sprays

Atomization is a very important process during the application of liquid fuel, and the temperature of sprays and droplets plays a crucial role in evaluating the atomization effect, evaporation rates, and heat transfer characteristics of the fuel. In recent years, researchers have applied numerous methods including advanced laser diagnostic technology to the temperature measurement of droplets and sprays and obtained a lot of interesting results. For example, one of the easiest means to measure the temperature of a droplet is to hang it on a thermocouple bead [128]. However, the catalyst effect of thermocouples is observed in some cases and caused a big impact on the measurement. Pyrometry is also widely employed for surface temperature measurement of droplets, e.g., two-color thermometry [129]. However, since some droplets are transparent, the interference from background radiation is great.
The laser-induced phosphorescence (LIP) technique is an ideal approach that can avoid interference from radiation. It was first applied to droplet thermometry by the team of Marcus Aldén at Lund University in 2004 [130]. They used spectral intensity ratio and the lifetime method to measure the temperature of a free-falling water droplet. The experimental device is shown in Figure 16. During the measurement, phosphors (Mg4FGeO6:Mn for spectral intensity ratio method and La2O2S:Eu for lifetime method) were first added to distilled water. The temperature of the water could be regulated by heating wires surrounding the liquid container. Inside the liquid container, a thermocouple was positioned to measure the temperature for reference. A He-Ne laser was used to trigger the measurement system; when the continuous beam of the He-Ne laser was blocked by falling droplets, the trigger signal was immediately sent to the Nd:YAG laser, which would emit a UV laser beam to stimulate phosphors solved in the droplet. For the spectral intensity ratio method, the UV laser wavelength was 266 nm and the phosphorescence spectrum was recorded by a spectrograph and a CCD camera. Thus, the intensity ratios of 631 nm and 657 nm were adopted to calculate droplet temperature. With regard to the lifetime method, the incident wavelength of the UV laser was changed to 355 nm, while the detector was changed to a photomultiplier (PMT). A filter centered at 514 nm was mounted before the PMT, so the phosphorescence lifetime at this wavelength was utilized to obtain the temperature of droplets. The droplet temperature measurement results of the two methods are shown in Figure 17. The results showed that the droplet temperatures measured by both methods agree well with the thermocouple in the liquid tank but differ slightly from it at higher temperatures. Considering that this difference was mainly caused by the heat loss when the droplet left the nozzle and exchanged heat with the surrounding air, the author recalculated the free-falling droplet temperature at the measured point according to a model from reference [131]. In this model, heat convection and droplet evaporation were taken into account, and the results show a good agreement with the temperature measured by the LIP method (cf. Figure 17).
In addition, to test the accuracy of the LIP method for droplet thermometry, the authors made a second container that could control air temperature around the falling droplet to reduce the heat loss and achieve a constant temperature during the droplet free-falling process as much as possible. Then, the lifetime method was used to perform 50 repeated measurements for droplets at each temperature, and the results are shown in Figure 18. It can be seen from the figure that the overall precision and accuracy relative to the reference thermocouple were better than 1%. Therefore, the above work by Aldén et al. demonstrated for the first time that the LIP technique can be applied to droplet thermometry, and the precision and accuracy of better than 1% could be reached.
In order to observe the temperature field of droplets and sprays and thus gain deeper insight into the influence of temperature on the atomization and evaporation of sprays, Omrane et al. [80] extended the application of the above-mentioned lifetime method from single-point temperature measurement to two-dimensional temperature measurement, realizing two-dimensional temperature visualization of free-falling droplets and spray. The experimental setup was similar to Figure 16, with the same thermographic phosphor (La2O2S:Eu), but the detector was replaced from PMT to a fast framing camera, which could detect the phosphorescence through an interference filter centered at 514.5 nm. Before the experiment, the time delay (Δt) between each ICCD detector of the frame camera should be adjusted as shown in Figure 19. It should be noted that Δt should satisfy 1 < τ/Δt < 5 [132], where τ is the phosphor lifetime. After shooting, the data processing similar to the lifetime method was performed separately for the corresponding pixel points in each image to obtain the two-dimensional temperature of the captured image.
Figure 20a shows the temperature field of a free-falling droplet. Overall, the middle temperature of the droplet was slightly higher than its surface boundary. In addition, the temperature of the bottom part was also lower compared to the rest of the droplet. It was inferred that the non-uniform droplet temperature field was mainly caused by the heat convection from the surrounding air which had a lower temperature, the slow thermal diffusion of the liquid, and its effect of internal circulation [133]. Figure 20b shows the result of applying this technology to measure the temperature field of spray. As one can note, the spray was cooler in the middle than at the edges. This was due to that the spray droplets absorbed heat from the inner core to evaporate. Finally, for a measurement target with a temperature of 343 K, comparing the mean value of the temperature field with the result of thermocouple showed that the accuracy of the method was about 0.6–5 K.
For the temperature measurement of high-speed spray, phosphor thermometry using the lifetime method may introduce errors or blurred images due to the spray displacement during the signal acquisition window, but this problem can be solved by using the ratio method, which captures the phosphorescence signals at two wavelengths simultaneously in a short time (generally nanosecond scale). Brübach et al. [92] first measured the two-dimensional temperature of n-dodecane spray using the ratio method. Mg4GeO5.5F:Mn was chosen as the phosphor with a loading of about 1–2% by weight. The experimental results are shown in Figure 21. However, in order to obtain the signal of sufficient intensity, the camera exposure time was set to 1 ms. Within this duration, the moving distance of the droplets was much larger than the camera’s spatial resolution (~1.3 mm), so the signal value of a single pixel in the image was actually the average of phosphorescence of multiple particles passing its corresponding detection position during the exposure time period. This problem can be optimized by choosing phosphors with a shorter lifetime and a shorter exposure time.
In 2008, Särner et al. [96] measured the two-dimensional temperature of burning methanol droplets using the ratio method. Before the temperature measurement, they studied the spectral properties of ZnO:Ga and ZnO:Zn and found a strong temperature-induced line shift phenomenon in the near-band-edge emission lines of them (cf. Figure 22), which means that they were both suitable for 2D temperature measurement with the ratio method. Further, they calibrated the spectral ratios of these two phosphors at different temperatures (cf. Figure 23). An interference filter at 390 ± 5 nm was used for the collection of the short wavelength spectrum, while for the long wavelength part two different long-pass filter sets were used: a glass absorption high-pass filter GG420 and a long-pass edge filter cutting at 441.6 nm. It can be seen from Figure 23 that the ratio varies from 0.03 to 200 in equidistant steps with increasing temperatures, which means a high temperature sensitivity from 300 to 900 K. To measure the temperature of burning methanol droplets, an experimental setup similar to that in reference [130] (cf. Figure 16) was exploited, where methanol was added to the vessel with 1% ZnO:Ga. The droplet was ignited after passing through the Bunsen burner flame, a thin laser sheet was used to pass through the center of the droplet, and the phosphorescence signal subsequently excited was collected by an ICCD camera. The results are shown in Figure 24, of which the precision was about 0.03% at 400 K and 1% at 800 K.
In recent years, more and more researchers have applied the LIP technique to the temperature measurements of droplets or sprays. In 2020, Strizhak et al. [134] selected BaMgAl10O17:Eu2+ (BAM:Eu) as the phosphor and used the ratio method to study the droplet temperature field of four types of widely used liquids (water, kerosene, diesel, and gasoline). They analyzed the effect of different factors, such as phosphor concentration and droplet heating rate, on the temperature measurement results. Subsequently, other researchers of their group [135] analyzed for the first time the difference between the LIP technique and contact measurement techniques for measuring droplet temperatures of gas–vapor mixtures. They found that the LIP technique was more efficient in terms of the number of simultaneous measurement points, recording speed, peak temperature recording (both maximum and minimum), and the ability to conduct measurement with extensive phase transformations [135]. In addition, they also applied this technique to a 2D temperature measurement of fuel water-in-biodiesel microemulsions in the Leiden frost state, in which the forced convection in the drops was studied and the maximum temperatures at which the droplet began to puff were established [136].

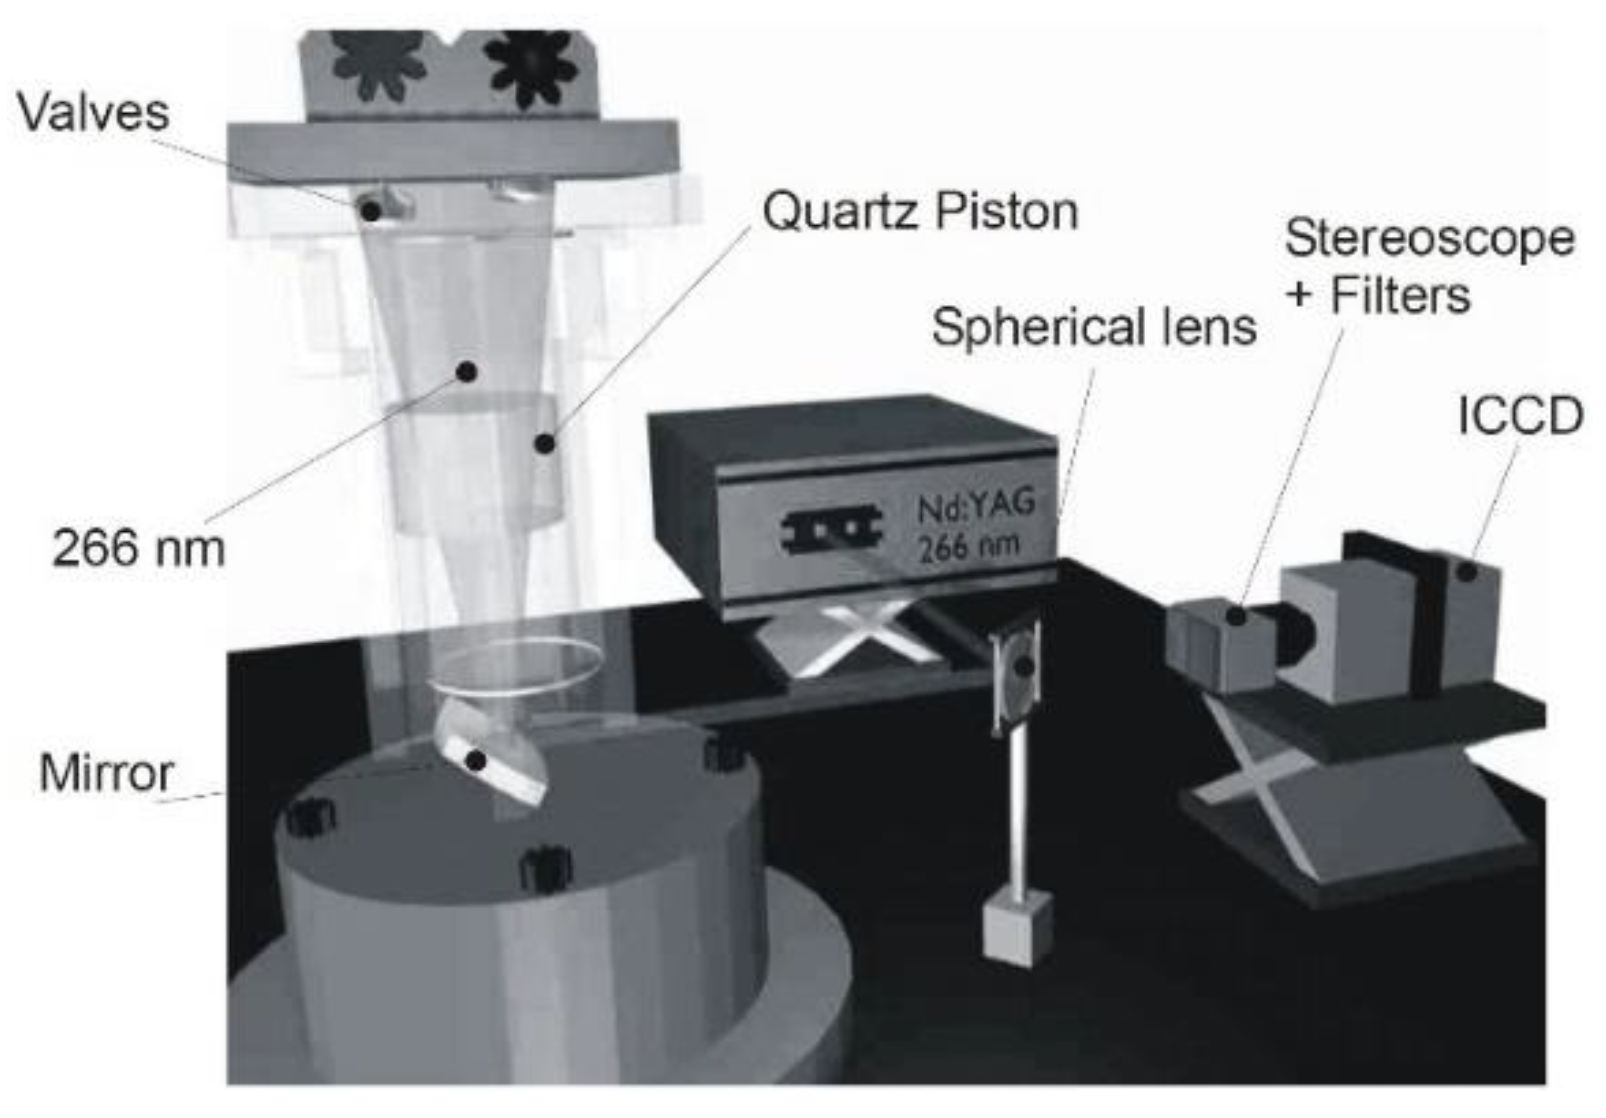
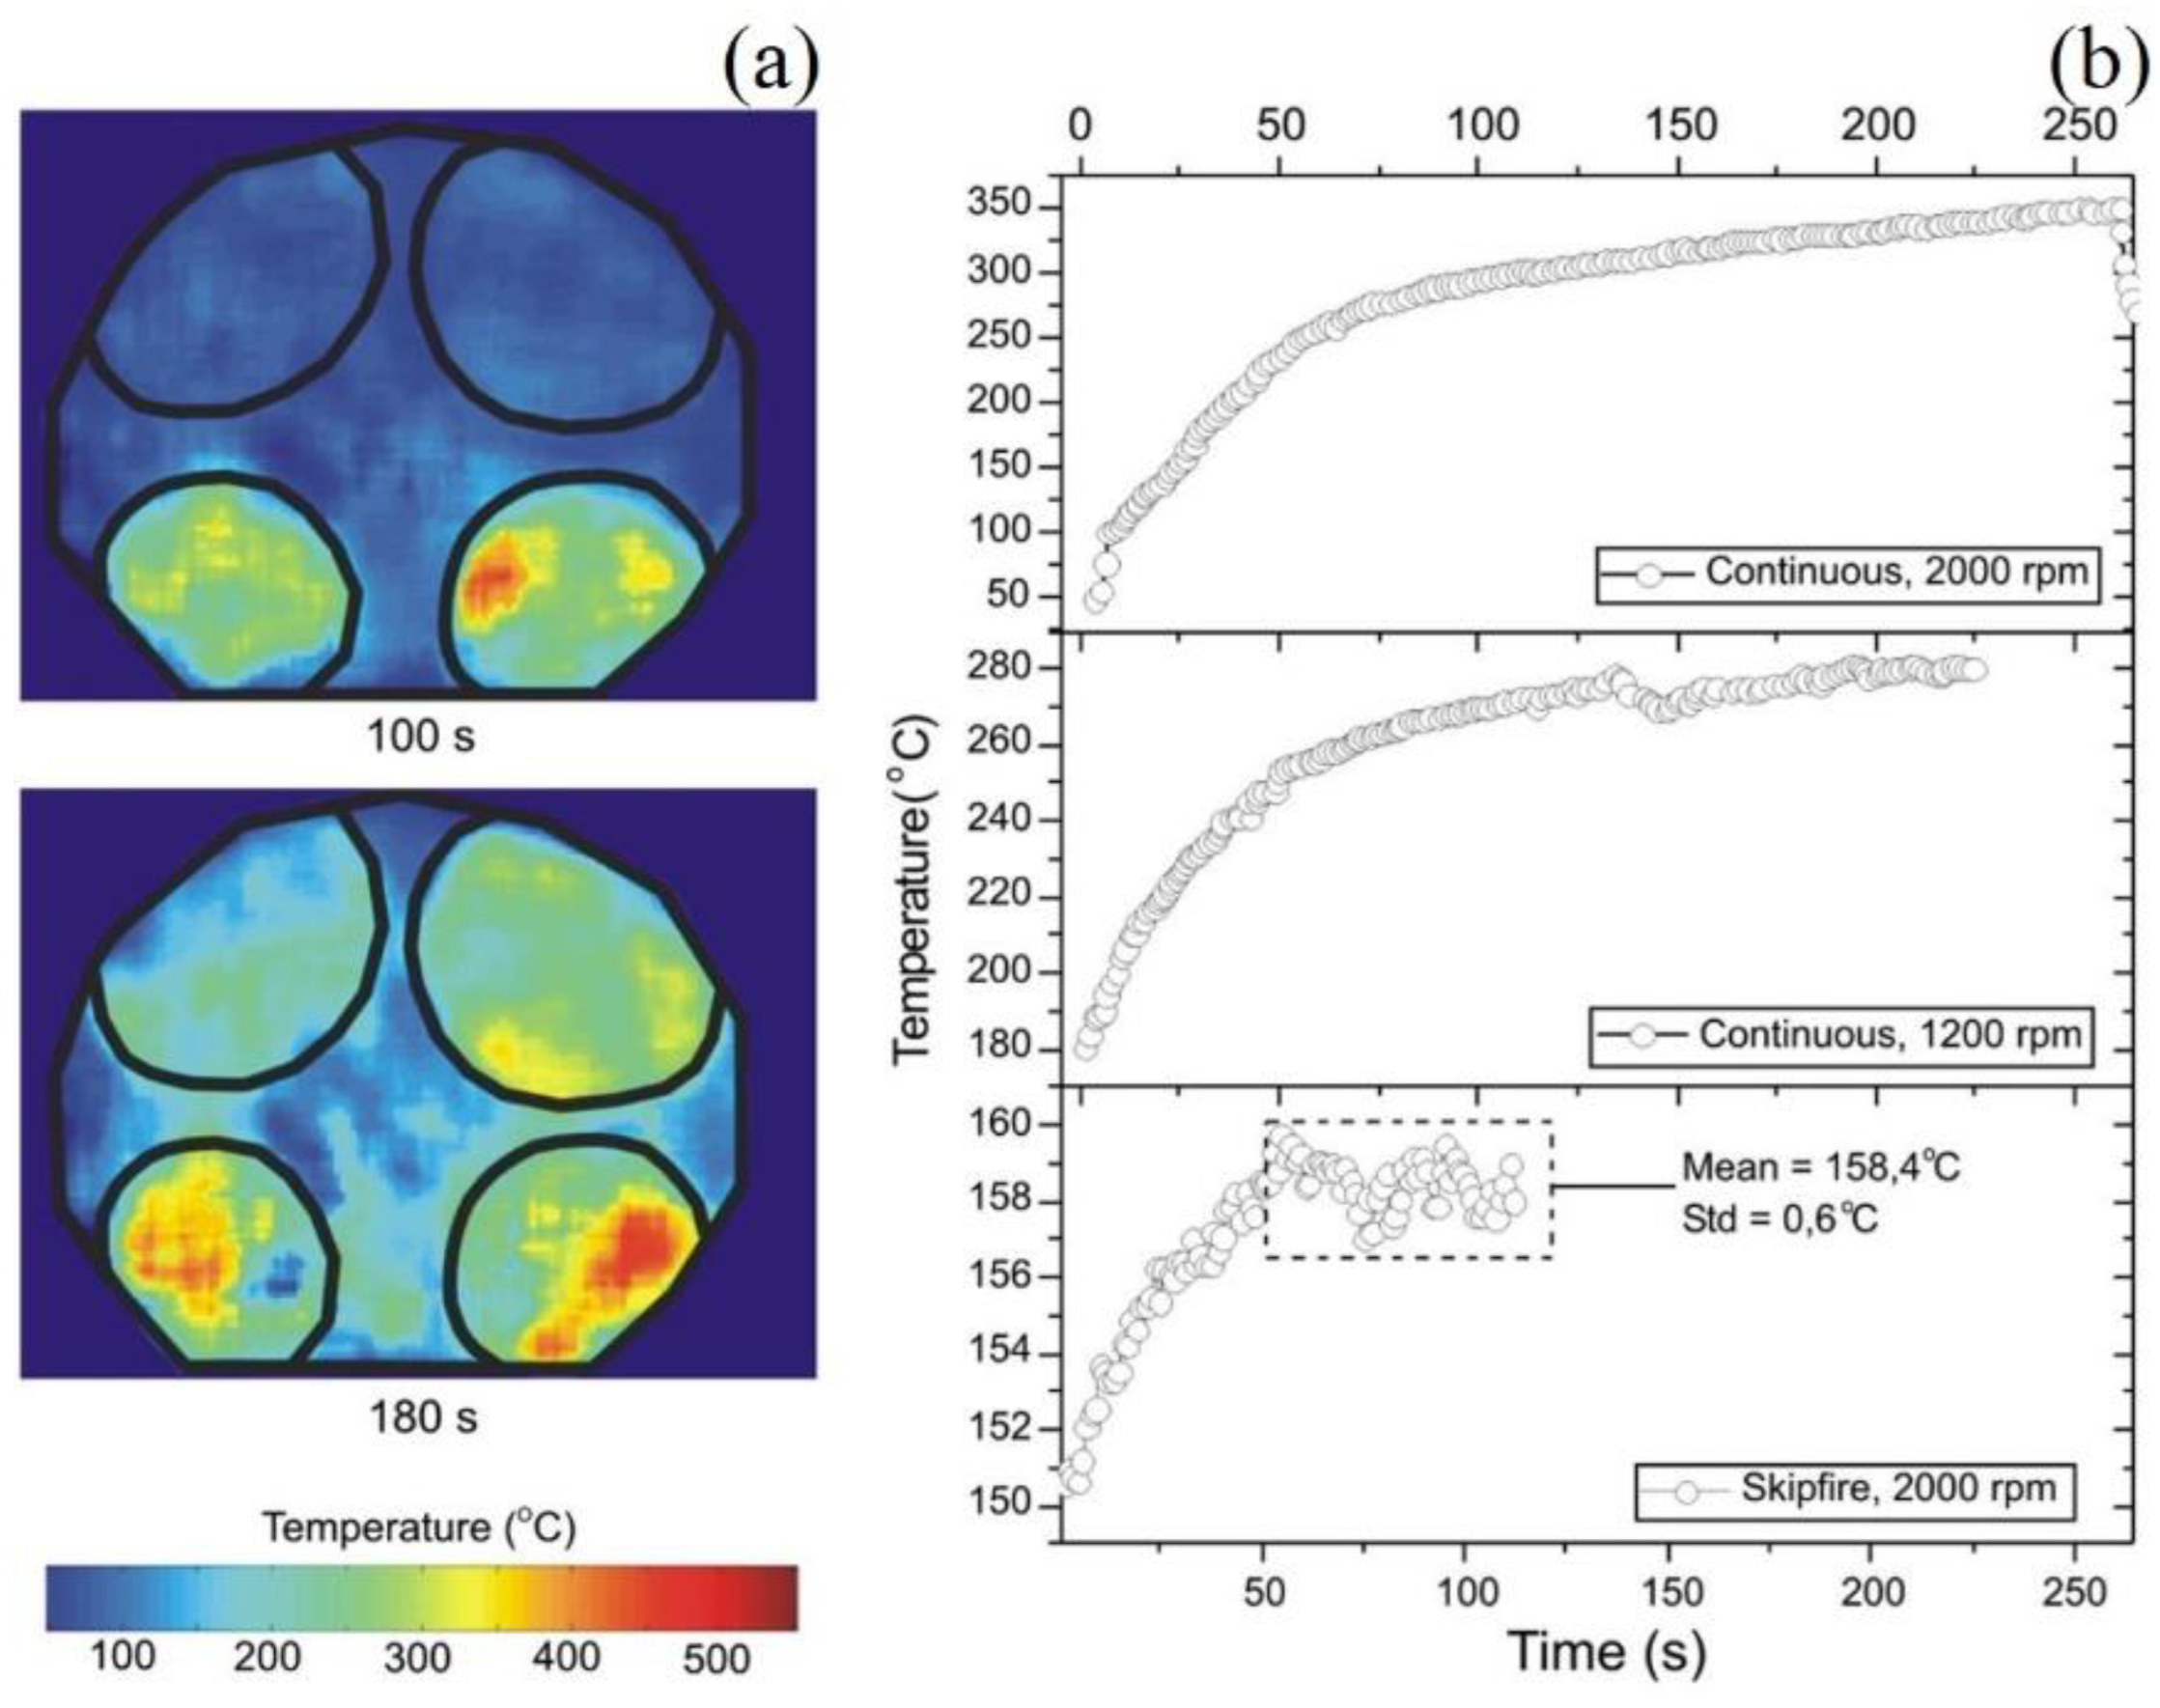
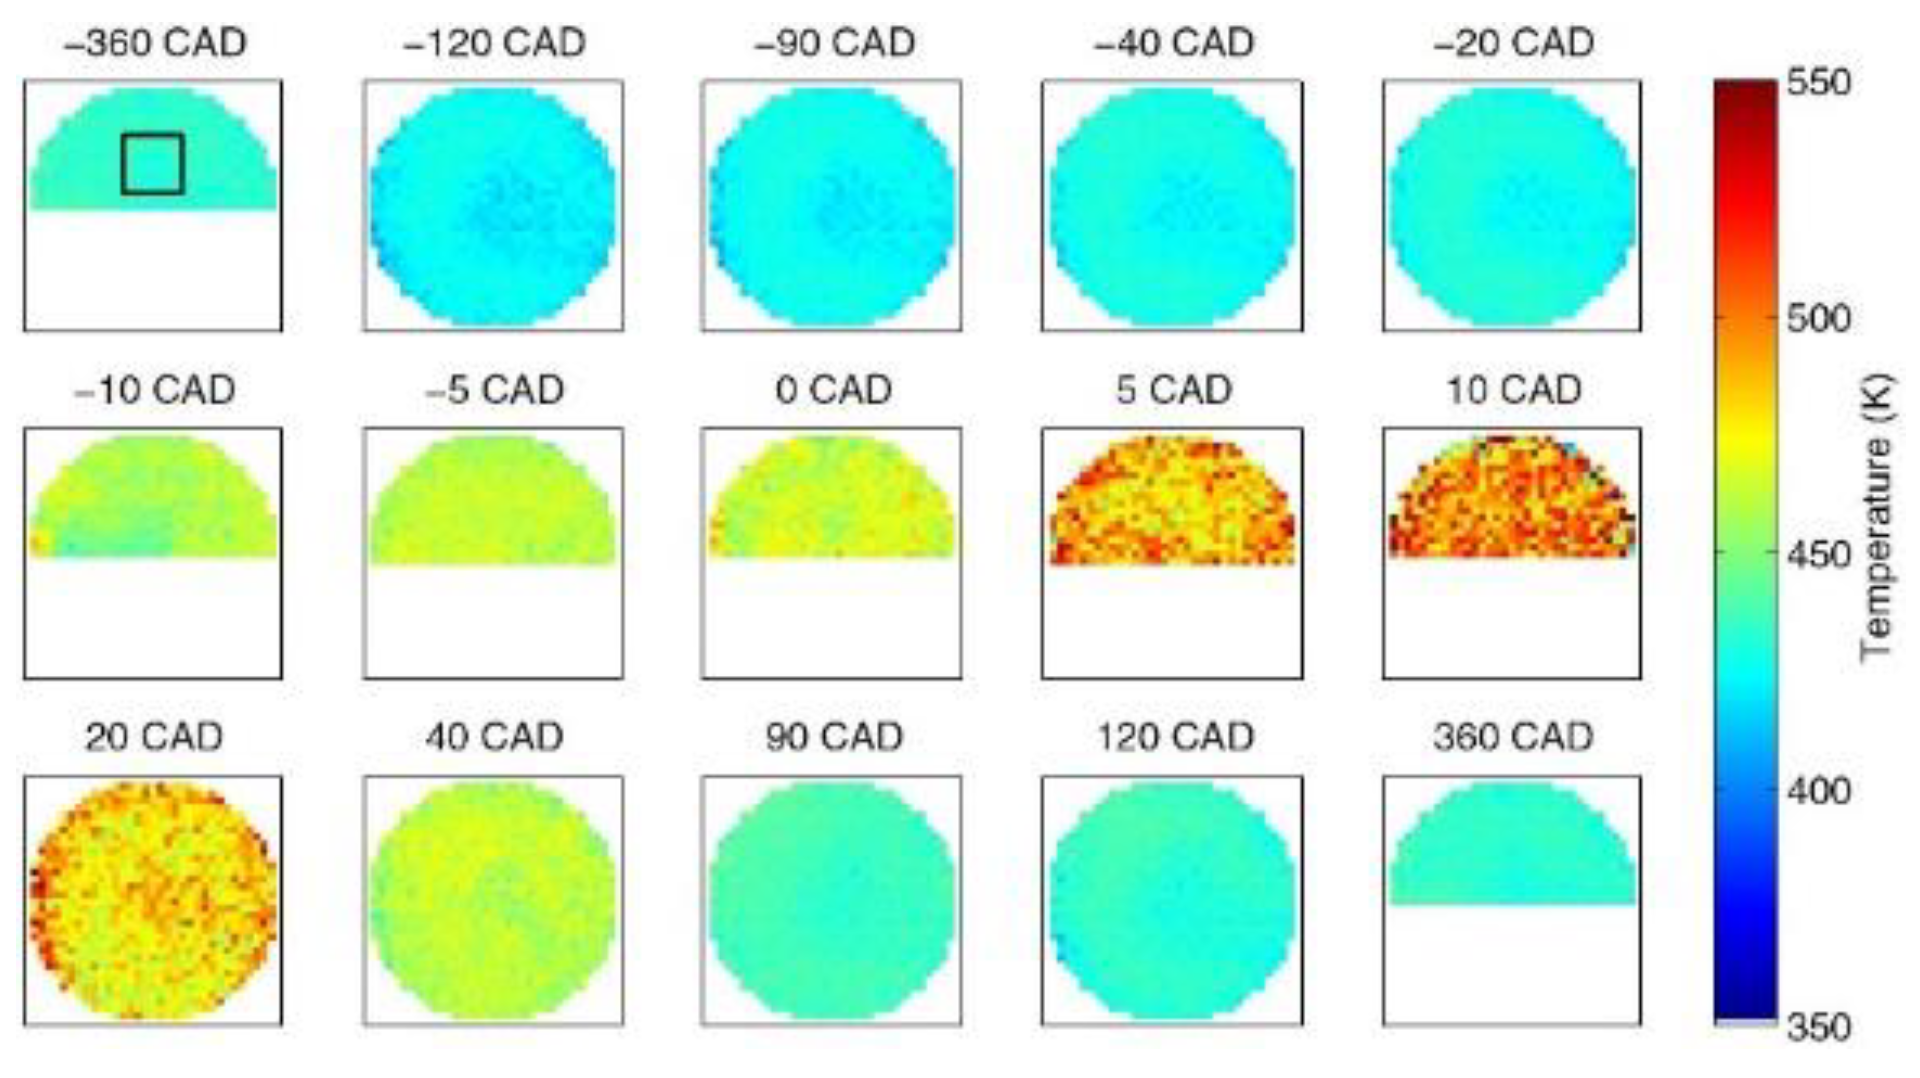
4.3. Internal Combustion Engines

The temperature of the combustion chamber wall, piston, valves, and other components of an internal combustion engine is an important parameter for engine efficiency evaluation and lifetime prediction. Before the application of laser diagnostic technology, researchers mainly used various temperature sensors (thermocouples, thermistors, etc.) to measure the temperature of internal combustion engine components. Among them, thin-film thermocouples are widely used due to their small heat capacity and rapid response. For example, Marr et al. [15] measured the piston wall temperature of a single-cylinder gasoline internal combustion engine with thin-film thermocouples. However, due to the harsh working environment and complex geometry of internal combustion engines, traditional temperature measurement methods often face the problem of signal transmission, and it is difficult to obtain an accurate surface temperature distribution. Therefore, researchers have started to apply laser diagnostic technology to the thermometry of internal combustion engines.
In 1997, Armfield et al. [137] applied the LIP technique to internal combustion engine temperature measurement for the first time. Using the lifetime method, they successfully measured the temperature of components such as piston crown and intake valve with La2O2S:Eu as the phosphor. Although the temperature upper limit was only 200 °C, it demonstrated feasibility of applying LIP technology to internal combustion engines for temperature measurement.
In recent years, Aldén et al. [138,139,140,141,142] have conducted many works in this field. They first measured the temperature of the intake and exhaust valves of a direct-injection gasoline engine [138]. The experimental setup is shown in Figure 25. The Mg4FGeO4:Mn was selected as the phosphor, and the two-dimensional and single-point temperature of the intake and exhaust valves under different running conditions were obtained using the ratio method and the lifetime method, respectively. The results are shown in Figure 26.
Furthermore, they measured the temperature of engine combustion chamber walls [140] and components such as pistons [139], and investigated the effect of coating thickness on the temperature field measurement results [141]. Considering that the engine lubricant oil may affect the behavior of the phosphor coating and thus cause temperature measurement errors, they also investigated the effect of engine lubricant oil on the decay characteristics of six different phosphors and found that only the decay time of ZnO:Zn and ZnS:Ag varied with the lubricant/phosphor mass ratio [142]; the decay times of the remaining phosphors, i.e., BaMg2Al16O27:Eu, Al2O3-coated BaMg2Al16O27:Eu, La2O2S:Eu, and Mg3F2GeO4:Mn, were insensitive to presence of lubricant.
Obtaining an accurate two-dimensional temperature of an internal combustion engine with the lifetime method will promote a deep understanding of its combustion process and facilitate the improvement of the engine performance. In 2011, Fuhrmann et al. [82,88] developed a new phosphor named Gd3Ga5O12:Cr, and they used high-speed CMOS camera to obtain the temperature of an engine cylinder wall under different working conditions based on the lifetime method. Some measurement results are shown in Figure 27.
In addition, the thermographic particle image velocimetry (TPIV) technique, which combines phosphor thermometry and particle image velocimetry (PIV) techniques, is a new measurement technique that allows simultaneous measurement of the velocity and temperature fields of the flow field. The feasibility of this technique has been demonstrated in turbulent gas flows [143], but its application in internal combustion engines still faces challenges such as fast fluid motion, seeding fluctuations due to inherent cyclic variations in the intake manifold, and low signal intensities [144]. Therefore, there are few studies in this area. The technique was first applied to engine measurements by Neal et al. [145] in 2013, and related studies have been conducted by Kopf et al. [144] in recent years. Considering the unique advantages of this technique in probing engine combustion status and other aspects, it is expected that more researchers will conduct related research in the future to maturely apply the TPIV technique to internal combustion engine combustion diagnosis as soon as possible.

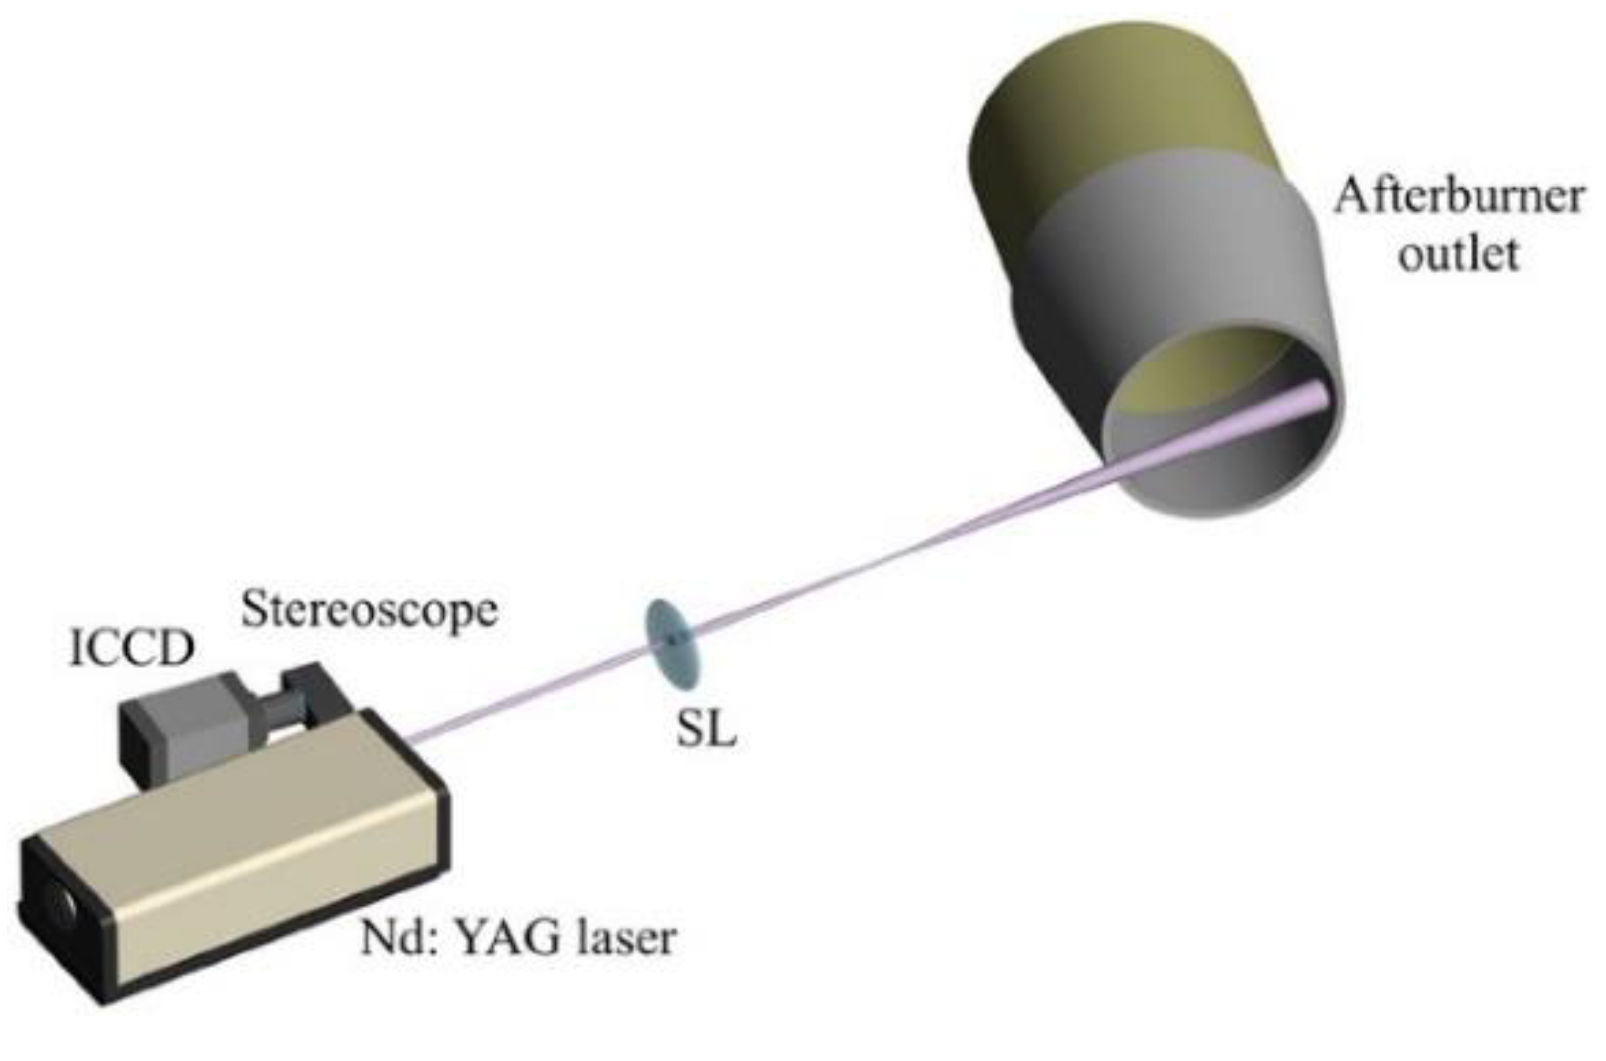
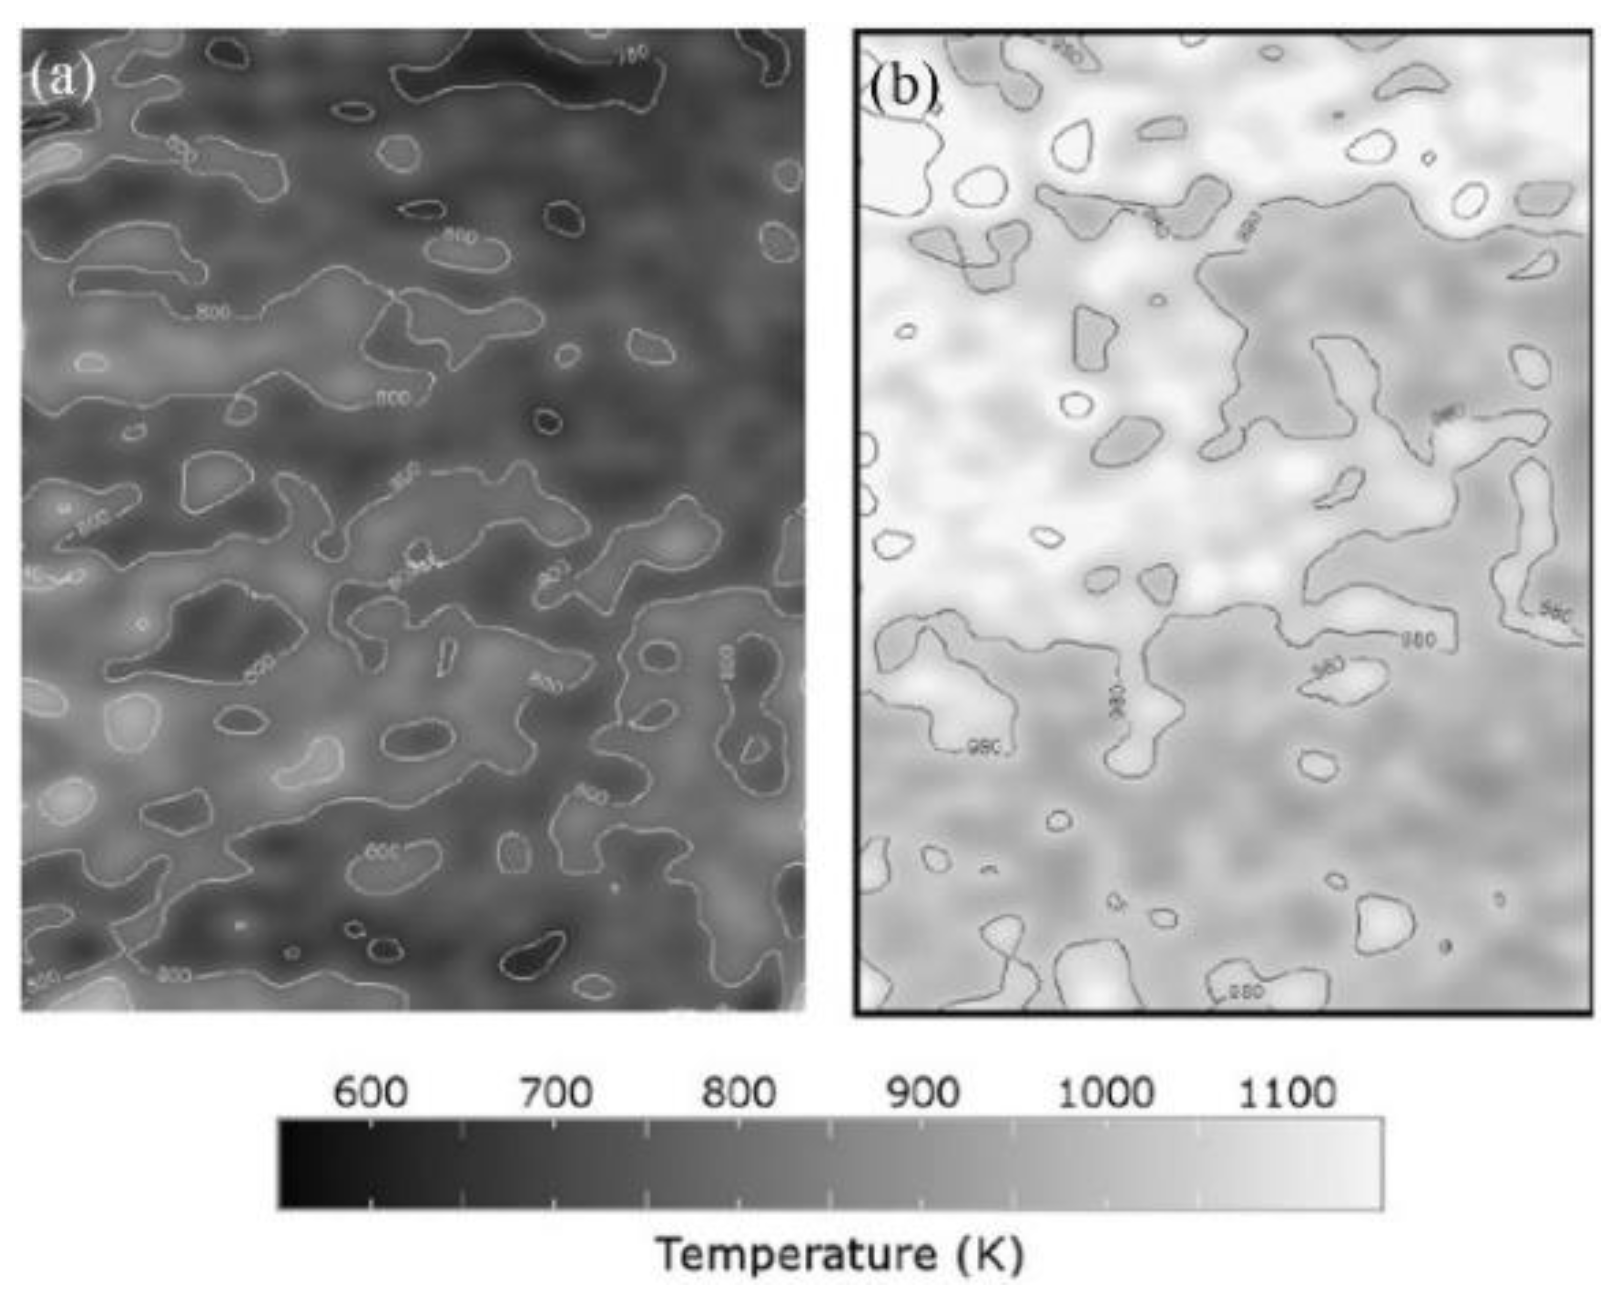
4.4. Gas Turbines and Aero Engines

Components such as turbine blades of gas turbines and aero engines are subjected to centrifugal loads, thermal loads, aerodynamic loads, vibration loads, and high-temperature gas corrosion during operation, resulting in high temperature creep and strength problems that pose a great challenge to engine design. Temperature is the key parameter for engine strength analysis and life prediction, so it is necessary to develop high-precision engine temperature monitoring techniques under high temperature.
The current temperature measurement techniques for aero engine hot-end components can be divided into two categories: contact-based thermometry represented by thermocouples and non-intrusive thermometry represented by radiation thermometry, temperature-sensitive-paint-based thermometry, and laser-induced phosphorescence thermometry. For contact-based thermometry, as described in Section 4.3, thin-film thermocouples are also widely used in the field of gas turbines and aero engines. For example, the Lewis Research Center of NASA [23,146], dedicated to researching the application of thin-film thermocouple technology in turbine engines, has successfully developed a Pt-13%Rh/Pt thin-film thermocouple (R-type) with an upper temperature measurement limit of 1100 °C and an accuracy of ±0.3 °C. However, for high temperature and high rotational speed conditions for an aero engine, the thin film is susceptible to thermal stresses and easily falls off. In addition, the difference in materials between the film and the surface of rotating target can cause local disturbances in the temperature field, resulting in temperature measurement errors, which may increase with speed. Due to the above-mentioned problems of contact-based thermometry, researchers began to study non-intrusive thermometry methods to optimize the measurement. Among them, radiation temperature measurement has been developed for decades and is now becoming a very widely used technique in engineering. In the 1960s, the Rolls-Royce Company initiated research related to gas turbine blade radiometric temperature measurement and proposed ideas for optical system design, as well as solutions for emissivity correction and signal processing [147,148]. Xiong et al. [149] used an infrared thermometer named ROTAMAP Ⅱ produced by the Rolls-Royce Company to measure the back blade temperature field of a gas turbine secondary turbine rotor. The measurement range was 500–1350 °C and the accuracy was ±6 °C. However, since the radiation thermometry employs thermal radiation to determine the target temperature, the spontaneous and reflected radiation from the target surface as well as the absorption of thermal radiation by the medium can affect the measurement of thermal radiation and thus the accuracy of results. Compared with the radiation thermometry, laser-induced phosphorescence technology uses a laser as the excitation source, the physical properties of phosphors are known, and the characteristic wavelength of phosphorescence is independent of environmental radiation, so it is not influenced by the target emissivity or the interference from the surrounding environment. In addition, LIP has advantages of fast response, high accuracy and sensitivity, and wide temperature range, which is an ideal temperature measurement method for gas turbines and aero engines.
In 1986, Noel et al. [150] pioneered the concept of applying the LIP technology for temperature measurement of turbine engines. They measured the temperature of a fixed sample inside an oven using the lifetime method, but the upper limit of its temperature measurement was only 930 °C due to temperature limitation of the oven. Later, they carried out several studies in this field [151,152,153]. It is worth mentioning that in 1991, they fully verified the feasibility of applying the lifetime method to engine blade temperature measurement under high-temperature operating conditions [154]. The temperature measurement upper limit was 700 °C, and the results were consistent with the thermocouple.
In addition, numerous research groups have conducted studies on the LIP temperature measurement technique in the field of turbine engines. For example, Tobin et al. [155,156] used a similar experimental setup and method to measure the single-point temperature of a rotating engine turbine blade up to 1000 °C. Alaruri et al. [157] also measured the surface temperature of stationary turbine engine components using the lifetime method. The spectral response of two different phosphors, Y2O3:Eu and YAG:Tb, were tested, and it was found that Y2O3:Eu was more suitable for turbine engines because it emitted a stronger fluorescence signal at high temperatures. Their subsequent studies showed that Y2O3:Eu was capable of temperature measurements in the range of 400–1000 °C and the estimated overall accuracy of the temperature measurements was ±3% [158].
The above studies have only measured the single-point temperature of one certain part of the engine. However, in order to comprehensively evaluate the engine performance, it is necessary to obtain its two-dimensional temperature under running conditions. In 2005, Seyfried et al. [159] used the spectral intensity ratio method to measure the two-dimensional temperature of an afterburner outlet nozzle of a full-size fighter-jet engine, the Volvo RM12, with different loads. The experimental setup is shown in Figure 28, where YAG:Dy was selected as the phosphor and the measured temperature range was about 400–1400 K. Figure 29 shows the measured nozzle surface temperature of the afterburner at 62% and 100% load, respectively.
In addition, the LIP-based online temperature measurement technique of thermal barrier sensor coating (sensor TBC) has been developed rapidly in recent years. Thermal barrier coating (TBC) is a coating system composed of a thermally insulating ceramic coating, a thermally grown oxide layer, and an anti-oxidative metal bonding layer, which are key materials for high-temperature thermal protection of turbine blades of aero engines and gas turbines with high performance. The concept of sensor TBC was first proposed by Choy et al. in 1998 [160,161], as shown in Figure 30, i.e., using a phosphor layer to modify the composition of the TBC so that it can be used as both a phosphor thermometry layer and a thermal barrier coating, thus realizing the online measurement of TBC temperature and providing a completely new solution for aero engine and gas turbine thermometry.
At present, institutions such as Southside Thermal Sciences Ltd. and Imperial College London in London, United Kingdom [163,164,165], and the NASA Glenn Research Center in the United States [166,167], have taken the lead in carrying out extensive applied research in this field. In 2013, Southside Thermal Sciences Ltd. [164,165] developed an online temperature monitoring system for engine sensor TBC and successfully applied it to the temperature measurement of the Rolls-Royce VIPER 201 engine. They continuously obtained the changing temperature profile of engine blades at the measurement point with different rotational speeds, and the upper measurement limit reached 1000 °C. In the same year, Eldridge et al. from NASA [166] prepared a sensor TBC using YSZ:Eu and applied it to the surface temperature measurement of the HPT stator of the Honeywell TECH7000 demonstration engine with a temperature measurement range up to 1300 °C. In addition, they chose Cr-doped gadolinium aluminum perovskite (Cr:GAP) to prepare a sensor TBC with gas film cooling and measured its two-dimensional surface temperature [167].

5. Conclusions and Outlook

In this work, we reviewed the surface temperature measurement techniques adopted in combustion environments and facilities. We highlighted three approaches, i.e., (1) thermocouples, as a representative of contact-based thermometry; (2) radiation thermometry, as a representative of traditional non-intrusive thermometry; (3) laser-induced phosphorescence, as a representative of laser diagnostic thermometry. The principles, advantages, and disadvantages, as well as examples of applications given in this paper, can provide some references to those who need to choose a proper method to meet their requirements.
In the future, non-intrusive temperature measurement methods are bound to be mainstream. Radiation thermometry will probably remain one of the most important temperature measurement methods. Theoretically, temperatures of all scales can be obtained using radiation signals, and this advantage seems irreplaceable. Even though emissivity has brought great trouble to radiation thermometry currently, with the in-depth understanding of radiation theory, the reliability of the emissivity model will also be continuously improved, thereby improving the accuracy of radiation temperature measurement and reducing barriers to its applications. Laser-induced phosphorescence will be more and more commonly used in industrial application, as it has shown it superiority in some cases, e.g., sooty atmospheres. At present, some factors that limit the use of LIP are the expensive equipment and relatively complicated setup. These shortcomings will be overcome with the development of laser technology. Thermocouples, as an inexpensive and convenient approach, will not be replaced in the short term. In addition, in some heating equipment with a simple working environment, it is a reliable and convenient means to arrange thermocouples as the temperature measuring unit to provide temperature information and give feedback.

Author Contributions

Conceptualization, S.L. and Z.W.; investigation, S.L. and Y.H. (Yu Huang); writing—original draft preparation, S.L. and Y.H. (Yu Huang); writing—review and editing, S.L., Y.H. (Yong He), Y.Z., and Z.W.; supervision, Z.W.; funding acquisition, Z.W. All authors have read and agreed to the published version of the manuscript.

Funding

This work was financially supported by the National Natural Science Foundation of China (52125605) and the Fundamental Research Funds for the Central Universities (2022ZFJH004).

Data Availability Statement

Not applicable.

Conflicts of Interest

The authors declare no conflict of interest.

References

  1. Turns, S.R. Introduction to Combustion; McGraw-Hill Companies: New York, NY, USA, 1996; Volume 287. [Google Scholar]
  2. Michalski, L.; Eckersdorf, K.; Kucharski, J.; McGhee, J. Temperature Scales and Classification of Thermometers. In Temperature Measurement; John Wiley & Sons Ltd.: Chichester, West Sussex, England, 2001; pp. 1–18. [Google Scholar] [CrossRef]
  3. McGee, T.D. Principles and Methods of Temperature Measurement; Wiley: New York, NY, USA, 1988. [Google Scholar]
  4. Druet, S.A.; Taran, J.P.E. CARS spectroscopy. Prog. Quantum. Electron. 1981, 7, 1–72. [Google Scholar] [CrossRef]
  5. Brübach, J.; Pflitsch, C.; Dreizler, A.; Atakan, B. On surface temperature measurements with thermographic phosphors: A review. Prog. Energy Combust. Sci. 2013, 39, 37–60. [Google Scholar] [CrossRef]
  6. Pollock, D.D. Thermocouples: Theory and Properties; Routledge: London, UK, 1991. [Google Scholar]
  7. Quinn, T.J. 6—Thermocouples. In Temperature, 2nd ed.; Quinn, T.J., Ed.; Academic Press: New York, NY, USA, 1990; pp. 286–331. [Google Scholar] [CrossRef]
  8. National Institute of Standards and Technology. NIST ITS-90 Thermocouple Database—SRD 60; National Institute of Standards and Technology: Gaithersburg, MD, USA, 2000.
  9. Hindasageri, V.; Vedula, R.; Prabhu, S. Thermocouple error correction for measuring the flame temperature with determination of emissivity and heat transfer coefficient. Rev. Sci. Instrum. 2013, 84, 024902. [Google Scholar] [CrossRef] [PubMed]
  10. Ghadamgahi, M.; Ölund, P.; Ekman, T.; Andersson, N.; Jönsson, P. Numerical and experimental study on flameless oxy-fuel combustion in a pilot-scale and a real-size industrial furnace. Appl. Therm. Eng. 2018, 141, 788–797. [Google Scholar] [CrossRef]
  11. Salinero, J.; Gómez-Barea, A.; Fuentes-Cano, D.; Leckner, B. The effect of using thermocouples on the char particle combustion in a fluidized bed reactor. Fuel 2017, 207, 615–624. [Google Scholar] [CrossRef]
  12. Park, W.C.; Atreya, A.; Baum, H.R. Experimental and theoretical investigation of heat and mass transfer processes during wood pyrolysis. Combust. Flame 2010, 157, 481–494. [Google Scholar] [CrossRef]
  13. Bosschaart, K.J.; De Goey, L. Detailed analysis of the heat flux method for measuring burning velocities. Combust. Flame 2003, 132, 170–180. [Google Scholar] [CrossRef]
  14. Bosschaart, K.J.; De Goey, L. The laminar burning velocity of flames propagating in mixtures of hydrocarbons and air measured with the heat flux method. Combust. Flame 2004, 136, 261–269. [Google Scholar] [CrossRef]
  15. Marr, M.A.; Wallace, J.S.; Chandra, S.; Pershin, L.; Mostaghimi, J. A fast response thermocouple for internal combustion engine surface temperature measurements. Exp. Therm. Fluid Sci. 2010, 34, 183–189. [Google Scholar] [CrossRef]
  16. Manjhi, S.K.; Kumar, R. Transient surface heat flux measurement for short duration using K-type, E-type and J-type of coaxial thermocouples for internal combustion engine. Measurement 2019, 136, 256–268. [Google Scholar] [CrossRef]
  17. Chang, J.; Filipi, Z.; Assanis, D.; Kuo, T.-W.; Najt, P.; Rask, R. Characterizing the thermal sensitivity of a gasoline homogeneous charge compression ignition engine with measurements of instantaneous wall temperature and heat flux. Int. J. Engine Res. 2005, 6, 289–310. [Google Scholar] [CrossRef]
  18. Alkidas, A.C. Heat Transfer Characteristics of a Spark-Ignition Engine. J. Heat Transf. 1980, 102, 189–193. [Google Scholar] [CrossRef]
  19. Chen, Y.Z.; Jiang, H.C.; Zhang, W.L.; Liu, X.Z.; Jiang, S.W. Film Thickness Influences on The Thermoelectric Properties of NiCr/NiSi Thin Film Thermocouples. Mod. Phys. Lett. B 2013, 27, 1350103. [Google Scholar] [CrossRef]
  20. Tian, B.; Zhang, Z.; Shi, P.; Zheng, C.; Yu, Q.; Jing, W.; Jiang, Z. Tungsten-rhenium thin film thermocouples for SiC-based ceramic matrix composites. Rev. Sci. Instrum. 2017, 88, 015007. [Google Scholar] [CrossRef] [PubMed]
  21. Tougas, I.M.; Amani, M.; Gregory, O.J. Metallic and Ceramic Thin Film Thermocouples for Gas Turbine Engines. Sensors 2013, 13, 15324–15347. [Google Scholar] [CrossRef]
  22. Holanda, R. Development of thin film thermocouples on ceramic materials for advanced propulsion system applications. In Proceedings of the Conference for Preparation for Temperature: Its Measurement and Control in Science and Industry, Toronto, ON, Canada, 28 April–2 May 1992. [Google Scholar]
  23. Martin, L.C.; Holanda, R. Applications of thin-film thermocouples for surface temperature measurement. In Proceedings of the SPIE’s 1994 International Symposium on Optics, Imaging, and Instrumentation, San Diego, CA, USA, 24 July 1994; pp. 65–76. [Google Scholar]
  24. Wrbanek, J.; Fralick, G.; Farmer, S.; Sayir, A.; Blaha, C.; Gonzalez, J. Development of thin film ceramic thermocouples for high temperature environments. In Proceedings of the 40th AIAA/ASME/SAE/ASEE Joint Propulsion Conference and Exhibit, Fort Lauderdale, FL, USA, 11–14 July 2004; p. 3549. [Google Scholar]
  25. Kreider, K.G. Thin film thermocouples for internal combustion engines. J. Vac. Sci. Technol. A 1986, 4, 2618–2623. [Google Scholar] [CrossRef]
  26. Zhao, X.; Wang, Y.; Chen, Y.; Jiang, H.; Zhang, W. Enhanced thermoelectric property and stability of NiCr–NiSi thin film thermocouple on superalloy substrate. Rare Metals 2017, 36, 512–516. [Google Scholar] [CrossRef]
  27. Zhao, X.; Liang, X.; Jiang, S.; Zhang, W.; Jiang, H. Microstructure evolution and thermoelectric property of Pt-PtRh thin film thermocouples. Crystals 2017, 7, 96. [Google Scholar] [CrossRef]
  28. Jin, X.; Tian, Y.; Zhao, K.; Ma, B.; Deng, J.; Luo, J. Experimental study on supersonic combustion fluctuation using thin-film thermocouple and time–frequency analysis. Acta Astronaut. 2021, 179, 33–41. [Google Scholar] [CrossRef]
  29. Childs, P.R.N.; Greenwood, J.R.; Long, C.A. Review of temperature measurement. Rev. Sci. Instrum. 2000, 71, 2959–2978. [Google Scholar] [CrossRef] [Green Version]
  30. Jun, S.; Kochan, O.; Chunzhi, W.; Kochan, R. Theoretical and Experimental Research of Error of Method of Thermocouple with Controlled Profile of Temperature Field. Meas. Sci. Rev. 2015, 15, 304–312. [Google Scholar] [CrossRef] [Green Version]
  31. Grant, H.; Przybyszewski, J.; Claing, R. Turbine Blade Temperature Measurements Using Thin Film Temperature Sensors. No. PWA-5604-31, 17 March 1981. [Google Scholar]
  32. Shannon, K.; Butler, B. A review of error associated with thermocouple temperature measurement in fire environments. In Proceedings of the 2nd Fire Ecology Congress, Orlando, Florida, USA, 16 November 2003. [Google Scholar]
  33. Heitor, M.V.; Moreira, A.L.N. Thermocouples and sample probes for combustion studies. Prog. Energy Combust. Sci. 1993, 19, 259–278. [Google Scholar] [CrossRef]
  34. Aldén, M.; Omrane, A.; Richter, M.; Särner, G. Thermographic phosphors for thermometry: A survey of combustion applications. Prog. Energy Combust. Sci. 2011, 37, 422–461. [Google Scholar] [CrossRef]
  35. Martinez, I.; Otamendi, U.; Olaizola, I.G.; Solsona, R.; Maiza, M.; Viles, E.; Fernandez, A.; Arzua, I. A novel method for error analysis in radiation thermometry with application to industrial furnaces. Measurement 2022, 190, 110646. [Google Scholar] [CrossRef]
  36. Anderson, R.; Adams, R.; Duggins, B. Limitations of Thermocouples in Temperature Measurements; Oak Ridge National Lab.: Oak Ridge, TN, USA, 1979.
  37. Glückert, U.L.; Schmidt, R. Pyrometry and Thermography. In Optical Measurements: Techniques and Applications; Mayinger, F., Feldmann, O., Eds.; Springer: Berlin/Heidelberg, Germany, 2001; pp. 271–300. [Google Scholar] [CrossRef]
  38. Carvill, J. 3—Thermodynamics and heat transfer. In Mechanical Engineer’s Data Handbook; Carvill, J., Ed.; Butterworth-Heinemann: Oxford, UK, 1993; pp. 102–145. [Google Scholar] [CrossRef]
  39. Khatami, R.; Levendis, Y.A. On the deduction of single coal particle combustion temperature from three-color optical pyrometry. Combust. Flame 2011, 158, 1822–1836. [Google Scholar] [CrossRef]
  40. Barber, R. A radiation pyrometer designed for in-flight measurement of turbine blade temperatures. SAE Trans. 1969, 78, 1591–1597. [Google Scholar]
  41. Hershey, A. Flame Radiation and Temperature Measurements on an Internal-Combustion Engine. Ind. Eng. Chem. 1932, 24, 867–870. [Google Scholar] [CrossRef]
  42. Curwen, K.R. Turbine blade radiation pyrometer system. Aircr. Eng. Aerosp. Technol. 1972, 44, 16–21. [Google Scholar] [CrossRef]
  43. Burgess, G.K.; Foote, P.D. Characteristics of Radiation Pyrometers; US Department of Commerce, Bureau of Standards: Washington, DC, USA, 1916.
  44. Emslie, A.; Blau, H. On the measurement of the temperatures of unenclosed objects by radiation methods. J. Electrochem. Soc. 1959, 106, 877. [Google Scholar] [CrossRef]
  45. Hollandt, J.; Hartmann, J.; Struß, O.; Gärtner, R. Chapter 1—Industrial Applications of Radiation Thermometry. In Experimental Methods in the Physical Sciences; Zhang, Z.M., Tsai, B.K., Machin, G., Eds.; Academic Press: Cambridge, MA, USA, 2010; Volume 43, pp. 1–56. [Google Scholar]
  46. Zhang, Z.; Tsai, B.K.; Machin, G. Radiometric Temperature Measurements: I. Fundamentals; Academic Press: Cambridge, MA, USA, 2009. [Google Scholar]
  47. Brunner, M.H.; Rose, M.G.; Mühlbauer, K.; Abhari, R.S. In-engine turbine heat transfer measurement. Proc. Inst. Mech. Eng. Part A J. Power Energy 2007, 221, 727–734. [Google Scholar] [CrossRef]
  48. Manara, J.; Zipf, M.; Stark, T.; Arduini, M.; Ebert, H.-P.; Tutschke, A.; Hallam, A.; Hanspal, J.; Langley, M.; Hodge, D. Long wavelength infrared radiation thermometry for non-contact temperature measurements in gas turbines. Infrared Phys. Technol. 2017, 80, 120–130. [Google Scholar] [CrossRef]
  49. Shin, D.H.; Kim, M.; Kim, J.S.; Lee, B.J.; Lee, J. Precise infrared thermometry with considering background radiation for gas turbine air cooling application. Int. J. Therm. Sci. 2020, 158, 106534. [Google Scholar] [CrossRef]
  50. Murray, T. Use of Silicon-Cell Pyrometers on Continuous Annealing Lines. Iron Steel Eng. 1971, 48, 33–39. [Google Scholar]
  51. Saunders, P. Radiation Thermometry: Fundamentals and Applications in the Petrochemical Industry; SPIE Press: Bellingham, WA, USA, 2007; Volume 78. [Google Scholar]
  52. Pregowski, P.; Goleniewski, G.; Komosa, W.; Korytkowski, W.; Zwolenik, S. Heating medium absorption and emission as factors in thermographic investigations of petrochemical furnaces. In Thermosense XXXI; SPIE: Bellingham, WA, USA, 2009; Volume 7299, pp. 131–141. [Google Scholar]
  53. Lopez, F.; Huot, A. Advanced signal processing applied to thermographic inspection of petrochemical furnaces. In Thermosense: Thermal Infrared Applications XLI; SPIE: Bellingham, WA, USA, 2019; Volume 11004, pp. 26–32. [Google Scholar]
  54. Fu, T.; Yang, Z.; Wang, L.; Cheng, X.; Zhong, M.; Shi, C. Measurement performance of an optical CCD-based pyrometer system. Opt. Laser Technol. 2010, 42, 586–593. [Google Scholar] [CrossRef]
  55. Brisley, P.M.; Lu, G.; Yan, Y.; Cornwell, S. Three-dimensional temperature measurement of combustion flames using a single monochromatic CCD camera. IEEE Trans. Instrum. Meas. 2005, 54, 1417–1421. [Google Scholar] [CrossRef]
  56. Cai, X.; Cheng, Z.; Wang, S. Flame measurement and combustion diagnoses with spectrum analysis. AIP Conf. Proc. 2007, 914, 60–66. [Google Scholar]
  57. Sun, Y.; Lou, C.; Zhou, H. A simple judgment method of gray property of flames based on spectral analysis and the two-color method for measurements of temperatures and emissivity. Proc. Combust. Inst. 2011, 33, 735–741. [Google Scholar] [CrossRef]
  58. Huang, Y.; Yan, Y.; Riley, G. Vision-based measurement of temperature distribution in a 500-kW model furnace using the two-colour method. Measurement 2000, 28, 175–183. [Google Scholar] [CrossRef]
  59. Khan, M.A.; Allemand, C.; Eagar, T.W. Noncontact temperature measurement. I. Interpolation based techniques. Rev. Sci. Instrum. 1991, 62, 392–402. [Google Scholar] [CrossRef]
  60. Khan, M.A.; Allemand, C.; Eagar, T.W. Noncontact temperature measurement. II. Least squares based techniques. Rev. Sci. Instrum. 1991, 62, 403–409. [Google Scholar] [CrossRef]
  61. Coates, P. Multi-wavelength pyrometry. Metrologia 1981, 17, 103. [Google Scholar] [CrossRef]
  62. Araújo, A. Multi-spectral pyrometry—A review. Meas. Sci. Technol. 2017, 28, 082002. [Google Scholar] [CrossRef]
  63. Gao, S.; Feng, C.; Wang, L.; Li, D. Multi-spectral temperature measurement method for gas turbine blade. Opt. Rev. 2016, 23, 17–25. [Google Scholar] [CrossRef]
  64. Estevadeordal, J.; Wang, G.; Nirmalan, N.; Wang, A.; Harper, S.P.; Rigney, J.D. Multicolor Techniques for Identification and Filtering of Burst Signals in Jet Engine Pyrometers. J. Turbomach. 2013, 136, 031004. [Google Scholar] [CrossRef]
  65. Ng, D.; Fralick, G. Use of a multiwavelength pyrometer in several elevated temperature aerospace applications. Rev. Sci. Instrum. 2001, 72, 1522–1530. [Google Scholar] [CrossRef] [Green Version]
  66. Fu, T.; Zhao, H.; Zeng, J.; Zhong, M.; Shi, C. Two-color optical charge-coupled-device–based pyrometer using a two-peak filter. Rev. Sci. Instrum. 2010, 81, 124903. [Google Scholar] [CrossRef] [PubMed]
  67. Gao, S.; Wang, L.; Feng, C.; Kipngetich, K.D. Analyzing the influence of combustion gas on a gas turbine by radiation thermometry. Infrared Phys. Technol. 2015, 73, 184–193. [Google Scholar] [CrossRef]
  68. Cutler, A.D.; Gallo, E.C.; Cantu, L.M.; Rockwell, R.D.; Goyne, C.P. Coherent anti-Stokes Raman spectroscopy of a premixed ethylene–air flame in a dual-mode scramjet. Combust. Flame 2018, 189, 92–105. [Google Scholar] [CrossRef]
  69. Raffius, T.; Schulz, C.; Ottenwälder, T.; Grünefeld, G.; Koß, H.-J.; Brands, T.; Pischinger, S. Flame-temperature, light-attenuation, and CO measurements by spontaneous Raman scattering in non-sooting diesel-like jets. Combust. Flame 2017, 176, 104–116. [Google Scholar] [CrossRef]
  70. Hoffman, D.; Münch, K.-U.; Leipertz, A. Two-dimensional temperature determination in sooting flames by filtered Rayleigh scattering. Opt. Lett. 1996, 21, 525–527. [Google Scholar] [CrossRef]
  71. Meier, U.E.; Wolff-Gaßmann, D.; Stricker, W. LIF imaging and 2D temperature mapping in a model combustor at elevated pressure. Aerosp. Sci. Technol. 2000, 4, 403–414. [Google Scholar] [CrossRef]
  72. Allison, S.W. A brief history of phosphor thermometry. Meas. Sci. Technol. 2019, 30, 072001. [Google Scholar] [CrossRef]
  73. Thureau, P. Etude d’und methode de mesure des temperatures utilisant las sensibilite thermique des couleurs de fluorescence. Doctoral Thesis, University of Paris, Paris, France, 1955. [Google Scholar]
  74. Leroux, J.-P. Étude sur la détermination des températures de surfaces (de 0 à 400° C), par l’intermédiaire des émissions de minces revêtements photoluminescents: Par Jean-Pierre Leroux; Service de documentation et d’information technique de l’aéronautique (Impr. du SDIT); 1962. [Google Scholar]
  75. Allison, S.; Beshears, D.; Cates, M.; Scudiere, M.; Shaw, D.; Ellis, A. Luminescence of YAG: Dy and YAG: Dy, Er crystals to 1700° C. Meas. Sci. Technol. 2020, 31, 044001. [Google Scholar] [CrossRef]
  76. Allison, S.; Gillies, G. Remote thermometry with thermographic phosphors: Instrumentation and applications. Rev. Sci. Instrum. 1997, 68, 2615–2650. [Google Scholar] [CrossRef]
  77. Khalid, A.H.; Kontis, K. Thermographic phosphors for high temperature measurements: Principles, current state of the art and recent applications. Sensors 2008, 8, 5673–5744. [Google Scholar] [CrossRef] [Green Version]
  78. Chambers, M.; Clarke, D. Doped oxides for high-temperature luminescence and lifetime thermometry. Annu. Rev. Mater. Sci. 2009, 39, 325–359. [Google Scholar] [CrossRef] [Green Version]
  79. Omrane, A.; Ossler, F.; Aldén, M. Two-dimensional surface temperature measurements of burning materials. Proc. Combust. Inst. 2002, 29, 2653–2659. [Google Scholar] [CrossRef]
  80. Omrane, A.; Särner, G.; Aldén, M. 2D-temperature imaging of single droplets and sprays using thermographic phosphors. Appl. Phys. B 2004, 79, 431–434. [Google Scholar] [CrossRef]
  81. Omrane, A.; Ossler, F.; Aldén, M. Temperature measurements of combustible and non-combustible surfaces using laser induced phosphorescence. Exp. Therm. Fluid Sci. 2004, 28, 669–676. [Google Scholar] [CrossRef]
  82. Fuhrmann, N.; Kissel, T.; Dreizler, A.; Brübach, J. Gd3Ga5O12: Cr—A phosphor for two-dimensional thermometry in internal combustion engines. Meas. Sci. Technol. 2011, 22, 045301. [Google Scholar] [CrossRef]
  83. Fuhrmann, N.; Schild, M.; Bensing, D.; Kaiser, S.A.; Schulz, C.; Brübach, J.; Dreizler, A. Two-dimensional cycle-resolved exhaust valve temperature measurements in an optically accessible internal combustion engine using thermographic phosphors. Appl. Phys. B 2012, 106, 945–951. [Google Scholar] [CrossRef]
  84. Kissel, T.; Baum, E.; Dreizler, A.; Brübach, J. Two-dimensional thermographic phosphor thermometry using a CMOS high speed camera system. Appl. Phys. B 2009, 96, 731–734. [Google Scholar] [CrossRef]
  85. Someya, S.; Furutani, H.; Okamoto, K. Instantaneous phosphor thermometry applicable to walls exposed to flames. Exp. Therm. Fluid Sci. 2013, 47, 224–231. [Google Scholar] [CrossRef]
  86. Someya, S.; Uchida, M.; Tominaga, K.; Terunuma, H.; Li, Y.; Okamoto, K. Lifetime-based phosphor thermometry of an optical engine using a high-speed CMOS camera. Int. J. Heat Mass Transf. 2011, 54, 3927–3932. [Google Scholar] [CrossRef]
  87. Yi, S.J.; Kim, H.D.; Kim, K.C. Decay-slope method for 2-dimensional temperature field measurement using thermographic phosphors. Exp. Therm. Fluid Sci. 2014, 59, 1–8. [Google Scholar] [CrossRef]
  88. Fuhrmann, N.; Schneider, M.; Ding, C.; Brübach, J.; Dreizler, A. Two-dimensional surface temperature diagnostics in a full-metal engine using thermographic phosphors. Meas. Sci. Technol. 2013, 24, 095203. [Google Scholar] [CrossRef]
  89. Fuhrmann, N.; Brübach, J.; Dreizler, A. Phosphor thermometry: A comparison of the luminescence lifetime and the intensity ratio approach. Proc. Combust. Inst. 2013, 34, 3611–3618. [Google Scholar] [CrossRef]
  90. Feist, J.; Heyes, A. The characterization of Y2O2S: Sm powder as a thermographic phosphor for high temperature applications. Meas. Sci. Technol. 2000, 11, 942. [Google Scholar] [CrossRef]
  91. Kontis, K. Surface heat transfer measurements inside a supersonic combustor by laser-induced fluorescence. J. Thermophys. Heat Trans. 2003, 17, 320–325. [Google Scholar] [CrossRef]
  92. Brübach, J.; Patt, A.; Dreizler, A. Spray thermometry using thermographic phosphors. Appl. Phys. B 2006, 83, 499–502. [Google Scholar] [CrossRef]
  93. Heyes, A.; Seefeldt, S.; Feist, J. Two-colour phosphor thermometry for surface temperature measurement. Opt. Laser Technol. 2006, 38, 257–265. [Google Scholar] [CrossRef]
  94. Särner, G.; Richter, M.; Aldén, M. Investigations of blue emitting phosphors for thermometry. Meas. Sci. Technol. 2008, 19, 125304. [Google Scholar] [CrossRef]
  95. Goss, L.; Smith, A.; Post, M. Surface thermometry by laser-induced fluorescence. Rev. Sci. Instrum. 1989, 60, 3702–3706. [Google Scholar] [CrossRef]
  96. Särner, G.; Richter, M.; Aldén, M. Two-dimensional thermometry using temperature-induced line shifts of ZnO:Zn and ZnO:Ga fluorescence. Opt. Lett. 2008, 33, 1327–1329. [Google Scholar] [CrossRef]
  97. Li, B.; Lindén, J.; Li, Z.; Konnov, A.; Aldén, M.; De Goey, L. Accurate measurements of laminar burning velocity using the heat flux method and thermographic phosphor technique. Proc. Combust. Inst. 2011, 33, 939–946. [Google Scholar] [CrossRef]
  98. Sage, I. Thermochromic liquid crystals. Liq. Cryst. 2011, 38, 1551–1561. [Google Scholar] [CrossRef]
  99. Ireland, P.T.; Neely, A.J.; Gillespie, D.R.; Robertson, A.J. Turbulent heat transfer measurements using liquid crystals. Int. J. Heat Fluid Flow 1999, 20, 355–367. [Google Scholar] [CrossRef]
  100. Ekkad, S.V.; Han, J.-C. A transient liquid crystal thermography technique for gas turbine heat transfer measurements. Meas. Sci. Technol. 2000, 11, 957. [Google Scholar] [CrossRef]
  101. Okamura, T.; Koga, A.; Itoh, S.; Kawagishi, H. Evaluation of 1700C Class Turbine Blades in Hydrogen Fueled Combustion Turbine System. In Turbo Expo: Power for Land, Sea, and Air; American Society of Mechanical Engineers: New York, NY, USA, 2000; p. V001T003A100. [Google Scholar]
  102. Poser, R.; Von Wolfersdorf, J. Liquid crystal thermography for transient heat transfer measurements in complex internal cooling systems. In Proceedings of the TURBINE-09, International Symposium on Heat Transfer in Gas Turbine Systems, Antalya, Turkey, 9–14 August 2009. [Google Scholar]
  103. Wang, C. Heat Transfer Investigations by Liquid Crystal Thermography in Gas Turbine Related Applications. Ph.D. Thesis, Lund University, Lund, Sweden, 2014. [Google Scholar]
  104. Ekkad, S.V.; Singh, P. Liquid Crystal Thermography in Gas Turbine Heat Transfer: A Review on Measurement Techniques and Recent Investigations. Crystals 2021, 11, 1332. [Google Scholar] [CrossRef]
  105. Fey, U.; Engler, R.H.; Egami, Y.; Iijima, Y.; Asai, K.; Jansen, U.; Quest, J. Transition detection by temperature sensitive paint at cryogenic temperatures in the European Transonic Wind tunnel (ETW). In Proceedings of the 20th International Congress on Instrumentation in Aerospace Simulation Facilities, ICIASF ‘03, Göttingen, Germany, 25–29 August 2003; pp. 77–88. [Google Scholar]
  106. Morris, M.; Donovan, J. Application of pressure-and temperature-sensitive paints to high-speed flows. In Proceedings of the Fluid Dynamics Conference, Colorado, CO, USA, 20–23 June 1994; p. 2231. [Google Scholar]
  107. Liu, T.; Campbell, B.T.; Burns, S.P.; Sullivan, J.P. Temperature-and pressure-sensitive luminescent paints in aerodynamics. Appl. Mech. Rev. 1997, 50, 227–246. [Google Scholar] [CrossRef]
  108. Liu, T.; Sullivan, J.P.; Asai, K.; Klein, C.; Egami, Y. Pressure and Temperature Sensitive Paints; Springer: Berlin/Heidelberg, Germany, 2005; Volume 1. [Google Scholar]
  109. Navarra, K.R.; Rabe, D.C.; Fonov, S.D.; Goss, L.P.; Hah, C. The application of pressure-and temperature-sensitive paints to an advanced compressor. J. Turbomach. 2001, 123, 823–829. [Google Scholar] [CrossRef]
  110. Lempereur, C.; Andral, R.; Prudhomme, J. Surface temperature measurement on engine components by means of irreversible thermal coatings. Meas. Sci. Technol. 2008, 19, 105501. [Google Scholar] [CrossRef]
  111. Arulprakasajothi, M.; Rupesh, P.L. Surface temperature measurement of gas turbine combustor using temperature-indicating paint. Int. J. Ambient Energy 2022, 43, 2324–2327. [Google Scholar] [CrossRef]
  112. Yang, L.; Zhimin, L. The research of temperature indicating paints and its application in aero-engine temperature measurement. Procedia Eng. 2015, 99, 1152–1157. [Google Scholar] [CrossRef]
  113. Pilgrim, C.; González, A.Y.; Krewinkel, R.; Blaswich, M.; Feist, J.; Orth, U.; Rabs, M.; Frank, D.; Rodriguez, S. Surface temperature measurements in an industrial gas turbine using thermal history paints. In Proceedings of the 12th European Conference on Turbomachinery Fluid dynamics and Thermodynamics, Stockholm, Sweden, 3–7 April 2017. [Google Scholar]
  114. Rupesh, P. Thermal distribution on gas turbine blade using thermal paint. In Innovative Design, Analysis and Development Practices in Aerospace and Automotive Engineering; Springer: Berlin/Heidelberg, Germany, 2021; pp. 101–113. [Google Scholar]
  115. Saunders, G.; Yen, J. A3 subscale rocket hot fire testing. In Proceedings of the 45th AIAA/ASME/SAE/ASEE Joint Propulsion Conference & Exhibit, Denver, CO, USA, 2–5 August 2009; p. 5099. [Google Scholar]
  116. Neely, A.; Choudhury, R.; Riesen, H.; Paukner, D.; Odam, J. Measurement of aerothermal heating on HIFiRE-0. In Proceedings of the 17th AIAA International Space Planes and Hypersonic Systems and Technologies Conference, San Francisco, CA, USA, 11–14 April 2011; p. 2356. [Google Scholar]
  117. Rupesh, P.; Arul Prakasajothi, M.; Chandrasekhar, U.; Mycherla, R.; Bhanu Teja, M. Study on temperature indicating paint for surface temperature measurement—A review. In Innovative Design, Analysis and Development Practices in Aerospace and Automotive Engineering (I-DAD 2018); Springer: Singapore, 2019; pp. 223–231. [Google Scholar]
  118. Fletcher, T.H. Time-resolved temperature measurements of individual coal particles during devolatilization. Combust. Sci. Technol. 1989, 63, 89–105. [Google Scholar] [CrossRef]
  119. He, Y.; Qiu, K.; Whiddon, R.; Wang, Z.; Zhu, Y.; Liu, Y.; Li, Z.; Cen, K. Release characteristic of different classes of sodium during combustion of Zhun-Dong coal investigated by laser-induced breakdown spectroscopy. Sci. Bull. 2015, 60, 1927–1934. [Google Scholar] [CrossRef] [Green Version]
  120. Liu, Y.; He, Y.; Wang, Z.; Wan, K.; Xia, J.; Liu, J.; Cen, K. Multi-point LIBS measurement and kinetics modeling of sodium release from a burning Zhundong coal particle. Combust. Flame 2018, 189, 77–86. [Google Scholar] [CrossRef]
  121. Wang, Z.; Liu, Y.; Whiddon, R.; Wan, K.; He, Y.; Xia, J.; Cen, K. Measurement of atomic sodium release during pyrolysis and combustion of sodium-enriched Zhundong coal pellet. Combust. Flame 2017, 176, 429–438. [Google Scholar] [CrossRef] [Green Version]
  122. Lu, H.; Ip, L.-T.; Mackrory, A.; Werrett, L.; Scott, J.; Tree, D.; Baxter, L. Particle surface temperature measurements with multicolor band pyrometry. AIChE J. 2009, 55, 243–255. [Google Scholar] [CrossRef]
  123. Weng, W.; Li, S.; Costa, M.; Li, Z. Quantitative imaging of potassium release from single burning pulverized biomass char particles. Fuel 2020, 264, 116866. [Google Scholar] [CrossRef]
  124. Zhang, Z.; Song, Q.; Alwahabi, Z.T.; Yao, Q.; Nathan, G.J. Temporal release of potassium from pinewood particles during combustion. Combust. Flame 2015, 162, 496–505. [Google Scholar] [CrossRef]
  125. McLean, W.; Hardesty, D.; Pohl, J. Direct observations of devolatilizing pulverized coal particles in a combustion environment. Proc. Symp. (Int.) Combust. 1981, 18, 1239–1248. [Google Scholar] [CrossRef]
  126. Cai, T.; Khodsiani, M.; Hallak, B.; Abram, C.; Beyrau, F.; Specht, E. Phosphor thermometry at the surface of single reacting large-diameter spherical coke particles to characterise combustion for packed bed furnaces. Proc. Combust. Inst. 2021, 38, 4225–4232. [Google Scholar] [CrossRef]
  127. Weng, W.; Feuk, H.; Li, S.; Richter, M.; Aldén, M.; Li, Z. Temporal temperature measurement on burning biomass pellets using phosphor thermometry and two-line atomic fluorescence. Proc. Combust. Inst. 2021, 38, 3929–3938. [Google Scholar] [CrossRef]
  128. McGaughey, A.; Ward, C. Temperature discontinuity at the surface of an evaporating droplet. J. Appl. Phys. 2002, 91, 6406–6415. [Google Scholar] [CrossRef]
  129. Israel, F.; Taylor, A.; Whitelaw, J. Simultaneous measurement of droplet velocity and size and flame mantle temperature by phase Doppler anemometry and two-colour pyrometry. Meas. Sci. Technol. 1995, 6, 727. [Google Scholar] [CrossRef]
  130. Omrane, A.; Juhlin, G.; Ossler, F.; Alden, M. Temperature measurements of single droplets by use of laser-induced phosphorescence. Appl. Opt. 2004, 43, 3523–3529. [Google Scholar] [CrossRef]
  131. Kincaid, D.C.; Longley, T.S. A water droplet evaporation and temperature model. Trans. ASAE 1989, 32, 457–463. [Google Scholar]
  132. Sharman, K.K.; Periasamy, A.; Ashworth, H.; Demas, J.N. Error Analysis of the Rapid Lifetime Determination Method for Double-Exponential Decays and New Windowing Schemes. Anal. Chem. 1999, 71, 947–952. [Google Scholar] [CrossRef]
  133. Winter, M.; Melton, L.A. Measurement of internal circulation in droplets using laser-induced fluorescence. Appl. Opt. 1990, 29, 4574–4577. [Google Scholar] [CrossRef]
  134. Strizhak, P.; Volkov, R.; Antonov, D.; Castanet, G.; Sazhin, S.S.; Transfer, M. Application of the laser induced phosphorescence method to the analysis of temperature distribution in heated and evaporating droplets. Int. J. Heat Mass Transf. 2020, 163, 120421. [Google Scholar] [CrossRef]
  135. Volkov, R.S.; Voytkov, I.S.; Strizhak, P.A.J.A.S. Temperature fields of the droplets and gases mixture. Appl. Sci. 2020, 10, 2212. [Google Scholar] [CrossRef] [Green Version]
  136. Khomutov, N.; Misyura, S.; Piskunov, M.; Semyonova, A.; Strizhak, P.; Volkov, R.J.E.T.; Science, F. Convective heat transfer in droplets of fuel microemulsions during conductive heating. Exp. Therm. Fluid Sci. 2021, 120, 110258. [Google Scholar] [CrossRef]
  137. Armfield, J.S.; Graves, R.; Beshears, D.; Cates, M.R.; Smith, T.; Allison, S. Phosphor thermometry for internal combustion engines. SAE Tech. Pap. 1997, 971642, 55–59. [Google Scholar]
  138. Omrane, A.; Juhlin, G.; Aldén, M.; Josefsson, G.; Engström, J.; Benham, T. Demonstration of two-dimensional temperature characterization of valves and transparent piston in a GDI optical engine. SAE Tech. Pap. 2004, 2004-01-0609, 449–457. [Google Scholar]
  139. Husberg, T.; Gjirja, S.; Denbratt, I.; Omrane, A.; Aldén, M.; Engström, J. Piston temperature measurement by use of thermographic phosphors and thermocouples in a heavy-duty diesel engine run under partly premixed conditions. SAE Tech. Pap. 2005, 2005-01-1646. [Google Scholar]
  140. Särner, G.; Richter, M.; Aldén, M.; Vressner, A.; Johansson, B. Cycle resolved wall temperature measurements using laser-induced phosphorescence in an HCCI engine. SAE Tech. Pap. 2005, 2005-01-3870, 1–7. [Google Scholar]
  141. Knappe, C.; Algotsson, M.; Andersson, P.; Richter, M.; Tunér, M.; Johansson, B.; Aldén, M.J.C. Thickness dependent variations in surface phosphor thermometry during transient combustion in an HCCI engine. Combust. Flame 2013, 160, 1466–1475. [Google Scholar] [CrossRef]
  142. Abou Nada, F.; Alden, M.; Richter, M. Investigation of the effect of engine lubricant oil on remote temperature sensing using thermographic phosphors. J. Lumin. 2016, 179, 568–573. [Google Scholar] [CrossRef]
  143. Fond, B.; Abram, C.; Heyes, A.L.; Kempf, A.M.; Beyrau, F. Simultaneous temperature, mixture fraction and velocity imaging in turbulent flows using thermographic phosphor tracer particles. Opt. Express 2012, 20, 22118–22133. [Google Scholar] [CrossRef] [PubMed]
  144. Kopf, A.; Frattina, V.; Bardi, M.; Endres, T.; Bruneaux, G.; Schulz, C. In-cylinder thermographic PIV combined with phosphor thermometry using ZnO:Zn. Int. J. Engine Res. 2021. [Google Scholar] [CrossRef]
  145. Neal, N.J.; Jordan, J.; Rothamer, D. Simultaneous Measurements of In-Cylinder Temperature and Velocity Distribution in a Small-Bore Diesel Engine Using Thermographic Phosphors. SAE Int. J. Engines 2013, 6, 300–318. [Google Scholar] [CrossRef]
  146. Liebert, C.H.; Mazaris, G.A.; Brandhorst, H.W. Turbine Blade Metal Temperature Measurement with a Sputtered Thin Film Chromel-Alumel Thermocouple. NASA Tech. Memo. 1975, No. E-8569, 1–13. [Google Scholar]
  147. Bird, C.; Parrish, C.J. Component temperature measuring method. US Patent No. 7003425, 2006. [Google Scholar]
  148. Wang, C.; Gou, X.; Duan, Y.; Hu, J. A review of aero-engine turbine blade temperature measurement. J. Infrared Millim. Waves 2018, 37, 501–512. [Google Scholar]
  149. Xiong, B.; Hou, M.; Chen, H.; Xu, F. Application of Infrared Thermometer in Turbine Blade Temperature Field. Gas Turbine Exp. Res. 2008, 21, 50–54. (In Chinese) [Google Scholar]
  150. Noel, B.W.; Borella, H.M.; Franks, L.A.; Marshall, B.R.; Allison, S.W.; Cates, M.R.; Stange, W.A. Proposed laser-induced fluorescence method for remote thermometry inturbine engines. J. Propuls. Power 1986, 2, 565–568. [Google Scholar] [CrossRef]
  151. Noel, B.W.; Allison, S.W.; Beshears, D.L.; Cates, M.R.; Borella, H.M. Evaluating and testing thermographic phosphors for turbine-engine temperature measurements. In Proceedings of the 23rd Joint Propulsion Conference, San Diego, CA, USA, 29 June–2 July 1987; p. 1761. [Google Scholar]
  152. Noel, B.W.; Bibby, M.C.; Borella, H.M.; Woodruff, S.E.; Hudson, C.L. Environmental tests of thermographic phosphors for turbine-engine temperature measurements. In Proceedings of the 25th Joint Propulsion Conference, Monterey, CA, USA, 12–16 July 1989; p. 2913. [Google Scholar]
  153. Noel, B.W.; Turley, W.D.; Allison, S.W. Thermographic-Phosphor Temperature Measurements: Commercial and Defense-Related Applications; EG and G Energy Measurements, Inc.: Goleta, CA, USA, 1994. [Google Scholar]
  154. Noel, B.W.; Borella, H.M.; Lewis, W.; Turley, W.D.; Beshears, D.L.; Capps, G.J.; Cates, M.R.; Muhs, J.D.; Tobin, K.W. Evaluating Thermographic Phosphors in an Operating Turbine Engine. J. Eng. Gas Turbine Power 1991, 113, 242–245. [Google Scholar] [CrossRef]
  155. Tobin, K.W.; Allison, S.W.; Gates, M.R.; Capps, G.J.; Beshears, D.L.; Cyr, M.; Noel, B.W. High-temperature phosphor thermometry of rotating turbine blades. AIAA J. 1990, 28, 1485–1490. [Google Scholar] [CrossRef]
  156. Tobin, K.W. Fiber-sensor design for turbine engines. In Proceedings of the Fiber Optic and Laser Sensors IX, Boston, MA, USA, 3–5 September 1991; p. 23. [Google Scholar]
  157. Alaruri, S.D.; Brewington, A.J.; Thomas, M.A.; Miller, J.A. High-temperature remote thermometry using laser-induced fluorescence decay lifetime measurements of Y2O3:Eu and YAG: Tb thermographic phosphors. IEEE Trans. Instrum. Meas. 1993, 42, 735–739. [Google Scholar] [CrossRef]
  158. Alaruri, S.; McFarland, D.; Brewington, A.; Thomas, M.; Sallee, N. Development of a fiber-optic probe for thermographic phosphor measurements in turbine engines. Opt. Lasers Eng. 1995, 22, 17–31. [Google Scholar] [CrossRef]
  159. Seyfried, H.; Sarner, G.; Omrane, A.; Richter, M.; Schmidt, H.; Alden, M. Optical diagnostics for characterization of a full-size fighter-jet afterburner. In Proceedings of the 50th ASME Turbo-Expo, Reno, NV, USA, 6–9 June 2005; pp. 813–819. [Google Scholar]
  160. Choy, K.; Feist, J.; Heyes, A.J.U.P.N. Smart Thermal Barrier Coatings for Gas Turbines. UK Patent No, 9823749, 1998. [Google Scholar]
  161. Choy, K.; Heyes, A.L.; Feist, J.P. Thermal barrier coating with thermoluminescent indicator material embedded therein. US Patent No, 8173266, 2012. [Google Scholar]
  162. Yang, L.; Fu, Y.; Zhao, X. Research progress of on-line/off-line phosphor thermometry technology for thermal barrier coatings. Aeronaut. Manuf. Technol. 2022, 65, 71–81. (In Chinese) [Google Scholar]
  163. Feist, J.; Heyes, A. Photo-Stimulated Phosphorescence for Thermal Condition Monitoring and Nondestructive Evaluation in Thermal Barrier Coatings. Heat Transf. Eng. 2009, 30, 1087–1095. [Google Scholar] [CrossRef]
  164. Feist, J.; Sollazzo, P.; Berthier, S.; Charnley, B.; Wells, J. Application of an Industrial Sensor Coating System on a Rolls-Royce Jet Engine for Temperature Detection. J. Eng. Gas Turbine Power 2013, 135. [Google Scholar] [CrossRef]
  165. Sollazzo, P.; Feist, J.; Berthier, S.; Charnley, B.; Wells, J.; Heyes, A. Application of a production line phosphorescence sensor coating system on a jet engine for surface temperature detection. AIP Conf. Proc. 2013, 1552, 897–902. [Google Scholar]
  166. Eldridge, J.I. Luminescence-Based Diagnostics of Thermal Barrier Coating Health and Performance. In Proceedings of the 37th International Conference on Advanced Ceramics and Composites, Daytona Beach, FL, USA, 27 January–1 February 2013. [Google Scholar]
  167. Eldridge, J.I.; Shyam, V.; Wroblewski, A.C.; Zhu, D.; Cuy, M.D.; Wolfe, D.E. Temperature Mapping of Air Film-Cooled Thermal Barrier Coated Surfaces Using Cr-Doped GdAlO3 Phosphor Thermography. In Proceedings of the International Conference and Expo on Advanced Ceramics and Composites, Daytona Beach, FL, USA, 24–29 January 2016. [Google Scholar]
Figure 1. A simple schematic of Seebeck effect.
Processes 10 02528 g001
Figure 2. A typical arrangement of thermocouple.
Processes 10 02528 g002
Figure 3. Two thin-film thermocouples fabricated by sputtering onto a ceramic substrate [21].
Processes 10 02528 g003
Figure 4. (a) The arrangement of the ITO thin-film thermocouple on the combustor wall. (b,c) Wall temperatures of the combustor measured by the ITO thin-film thermocouple under different cases [28]. Reprinted with permission from [28]. Elsevier, 2021.
Processes 10 02528 g004aProcesses 10 02528 g004b
Figure 5. (a) Boundary conditions for a chrome steel component with a thermocouple installed in a channel filled by ceramic paste, and (b) calculated thermal disturbance caused by the installation of thermocouple wires [29]. Reprinted with permission from [29]. AIP Publishing, 2000.
Processes 10 02528 g005
Figure 6. A basic schematic diagram of radiation thermometry.
Processes 10 02528 g006
Figure 7. Temperature difference between the real temperature and the apparent temperature of the target surface at 1000 K with varied wavelength and emissivity [46]. Reprinted with permission from [46]. Elsevier, 2009.
Processes 10 02528 g007
Figure 8. Comparison of effective temperature ranges using color CCD cameras with different strategies. The square symbols and circle symbols represent results using two-color thermometry with and without multi-peak interference in front of CCD cameras, respectively. The triangle symbols represent results from multi-spectral thermometry [54,66].
Processes 10 02528 g008
Figure 9. Transmittance of partially yttria-stabilized zirconia (PYSZ) at different temperatures with a thickness of 0.5 mm [48]. Reprinted with permission from [48]. Elsevier, 2017.
Processes 10 02528 g009
Figure 10. Jablonski diagram of fluorescence and phosphorescence.
Processes 10 02528 g010
Figure 11. Lifetime of different thermographic phosphors used in laser−induced phosphorescence [5,34,76].
Processes 10 02528 g011
Figure 12. Spectral intensity ratio of different phosphors used in laser-induced phosphorescence technique [34,89].
Processes 10 02528 g012
Figure 13. Standard color changes observed at different temperatures from (a) a single-change-type paint and (b) a multi-change-type paint [117]. Reprinted with permission from [117]. Springer Nature, 2019.
Processes 10 02528 g013
Figure 14. (a) The schematic of the furnace and (b) setup of phosphor thermometry [126]. Reprinted with permission from [126]. Elsevier, 2021.
Processes 10 02528 g014
Figure 15. Schematics of (a) the multi-jet burner, (b) the measured biomass pellet position, and (c) experimental setup of phosphor thermometry [127].
Processes 10 02528 g015
Figure 16. Experimental device for single-droplet temperature measurement [130]. Reprinted with permission from [130]. Optica Publishing Group, 2004.
Processes 10 02528 g016
Figure 17. Droplet temperature measured by thermocouple and LIP method: (a) spectral intensity ratio method; (b) lifetime method [130]. Reprinted with permission from [130]. Optica Publishing Group, 2004.
Processes 10 02528 g017
Figure 18. Average value of 50 droplet temperature measurements by lifetime method at different temperatures and the results from thermocouple [130]. Reprinted with permission from [130]. Optica Publishing Group, 2004.
Processes 10 02528 g018
Figure 19. Lifetime computed from the single exponential decay at each pixel position. An overlap of 50% was used between the individual detectors [80]. Reprinted with permission from [80]. Springer Nature, 2004.
Processes 10 02528 g019
Figure 20. (a) Single-shot two-dimensional temperature measurement of a free-falling droplet; (b) single-shot water spray temperature measurement using thermographic phosphors [34]. Reprinted with permission from [34]. Elsevier, 2011.
Processes 10 02528 g020
Figure 21. Temperature fields of spray with different initial liquid-phase temperatures: (a) T = 296 K, (b) T = 343 K, (c) T = 393 K [92]. Reprinted with permission from [92]. Springer Nature, 2006.
Processes 10 02528 g021
Figure 22. Normalized spectra of (a) ZnO:Ga and (b) ZnO:Zn. The position of the emission peak is plotted on the right axis as a function of temperature [96]. Reprinted with permission from [96]. Optica Publishing Group, 2008.
Processes 10 02528 g022
Figure 23. Characteristic spectral ratio calibration of ZnO:Zn and ZnO:Ga with two different long-pass filter sets [96]. Reprinted with permission from [96]. Optica Publishing Group, 2008.
Processes 10 02528 g023
Figure 24. (a) A falling, burning methanol droplet photographed by an ICCD camera without filters; (b) a temperature image of a free-falling methanol droplet burning in the middle of the Bunsen burner [96]. Reprinted with permission from [96]. Optica Publishing Group, 2008.
Processes 10 02528 g024
Figure 25. The experimental setup of valve temperature measurement using the ratio method [138]. Reprinted with permission from [138]. SAE International, 2004.
Processes 10 02528 g025
Figure 26. (a) Two-dimensional temperature field of exhaust and intake valves; (b) single-point temperature of exhaust valve temperatures under different running conditions [138]. Reprinted with permission from [138]. SAE International, 2004.
Processes 10 02528 g026
Figure 27. Phase-locked temperature distribution of the cylinder wall under fired conditions [88]. Reprinted with permission from [88]. IOP Publishing, Ltd., 2013.
Processes 10 02528 g027
Figure 28. Experimental setup for two-dimensional wall temperature field measurements based on the LIP technology [34]. Reprinted with permission from [34]. Elsevier, 2011.
Processes 10 02528 g028
Figure 29. Single measured nozzle surface temperature field of the afterburner at the loads of (a) 62% and (b) 100% [34]. Reprinted with permission from [34]. Elsevier, 2011.
Processes 10 02528 g029
Figure 30. Schematic diagram of sensor TBC with phosphorescence coating [162]. Reprinted with permission from [162]. Aeronautical Manufacturing Technology, 2022.
Processes 10 02528 g030
Table 1. A summary of thermocouple properties commonly used in combustion environments [8].
TypeMaterial (Positive/Negative)Measurement Range (°C)Sensitivity (µV/°C)
ENi-Cr alloy/Cu-Ni alloy−270–100040–80
JFe/Cu-Ni alloy−210–120050–60
KNi-Cr alloy/Ni-Al alloy−270–137228–42
NNi-Cr-Si alloy/Ni-Si-Mg alloy−270–130024–38
BPt-30% Rh/Pt-6% Rh0–18205–10
RPt-13% Rh/Pt−50–17688–14
SPt-10% Rh/Pt−50–17688–12
Publisher’s Note: MDPI stays neutral with regard to jurisdictional claims in published maps and institutional affiliations.

