Article

Frequency-Dependent Dielectric Spectroscopy of Insulating Nanofluids Based on GTL Oil during Accelerated Thermal Aging †

1
Department of Electric Power Engineering, Faculty of Electrical Engineering and Informatics, Technical University of Košice, Letná 9, 04200 Košice, Slovakia
2
Institute of Experimental Physics SAS, Watsonová 47, 04001 Košice, Slovakia
*
Author to whom correspondence should be addressed.
This paper is an extended version of our paper published in Conference Proceedings of the 2022 22nd International Scientific Conference on Electric Power Engineering (EPE), Kouty nad Desnou, Czech Republic, 8–10 June 2022.
Processes 2022, 10(11), 2405; https://doi.org/10.3390/pr10112405
Submission received: 5 October 2022 / Revised: 1 November 2022 / Accepted: 8 November 2022 / Published: 15 November 2022
(This article belongs to the Special Issue Recent Advances in Electrical Power Engineering)

Abstract

:
Improving the dielectric properties of liquid-insulating materials is a current problem in research into the insulation system of a power transformer. Modern optimization of insulating liquids involves the potential use of unique synthetic esters enriched with nanoparticles. This study presents the results of the dielectric response of liquefied gas-based (GTL) insulating liquids during accelerated thermal aging. The dielectric relaxation spectroscopy method was used in the frequency domain to point out power losses as an imaginary part of a complex electric modulus. The relaxation spectra express the validity of applying this complex dielectric parameter. The polarization processes of the base oil alternately change position in the low-frequency band during thermal aging. Fullerene nanofluid undergoes three phases of dielectric loss changes during thermal aging. In the case of magnetic nanofluid, the effect of electric double-layer polarization disappeared after 500 h of thermal aging. It was found that with the gradual increase in the thermal aging time, there is no gradual increase in the dielectric losses investigated in the measured frequency spectrum. This study shows that the concentration of the two types of nanoparticles independently causes a different dielectric response to an applied AC electric field in the GTL base fluid.

1. Introduction

Power transformers are an essential part of the electrical system. Therefore, it is necessary to keep the insulation system of these devices in the best possible condition [1,2]. The motivation of world researchers is to optimize the insulation system in terms of thermal factors and dielectric losses with the aim of the lowest possible ecological load in the event of a potential transformer accident [3,4,5,6]. The current topic is the investigation of insulating liquids enriched with nanoparticles because they have improved properties in specific directions, which can outweigh their disadvantages [7,8]. Magnetodielectric anisotropy [9], thermomagnetic convection [10], higher thermal conductivity [11,12], partial discharge activity, and electrical breakdown strength [13] belong to the favorable properties of magnetic nanofluids. Negative properties of magnetic nanofluids include increased dielectric losses [14,15,16,17]. The decisive factors are the base liquid, the surfactant, and the appropriate concentration of magnetic nanoparticles [18]. Research is currently underway on the samples of insulating nanofluids modified with fullerene nanoparticles. The results show a positive effect of fullerene nanoparticles on the loss factor and electrical breakdown strength [19]. Fullerene nanoparticles contained in transformer oil reduce dielectric losses at operating frequencies of 50 Hz and 60 Hz [16,19,20], which represents an interesting property of these insulating nanofluids. A change in the concentration of nanoparticles in the insulating liquid causes a change in the dielectric response in the frequency spectrum, which is related to the nature of the dielectric losses [21]. Undoubtedly, thermal aging, to which it is subjected in operating conditions, also contributes to the increase in dielectric losses of the insulating liquid. Thermal aging generates oxidation processes in the oil, resulting in the gradual degradation of the oil with the formation of by-products, such as acids, dissolved gases, moisture, and sludge. The mentioned products affect the oil’s electrical, physical, and chemical properties. The electrical properties include a decrease in electrical breakdown strength and resistivity [22] and, conversely, an increase in the dissipation factor [22,23]. Interfacial tension, viscosity, and flash point belong to the physical properties of the oil. During thermal aging, there is a decrease in interfacial tension (formation of polar compounds) and flash points due to the distribution of flammable products in the liquid. At the same time, the viscosity does not change [24,25]. The chemical properties of the oil include water content and acidity. These parameters increase during thermal aging with the help of oxidation processes in the oil. All the parameters mentioned above show certain limits that must be monitored during the transformer operation to assess the condition of the transformer oil [26,27,28].
Since the insulating liquid enriched with Fe3O4 magnetic nanoparticles shows inhomogeneity and a decrease in insulating performance during thermal aging [2], the behavior of the insulating liquid enriched with fullerene C60 nanoparticles with the same concentration as the sample with the concentration of Fe3O4 magnetic nanoparticles will be studied and compared in this paper. The aim is to point out the effect of thermal aging on the dielectric response of insulating liquids suspended with different types of nanoparticles. Emphasis will be placed on the frequency band of dielectric losses and the polarization spectra in the complex plane of the Cole–Cole diagram, based on which it is possible to express the parameter of the distribution of relaxation times α as different from the ideal Debye behavior.
The investigation of dielectric losses in the frequency band of the measuring device represents the most accurate method within dielectric spectroscopy for capturing polarization and conductivity processes in the insulating material [29,30,31]. Polarization processes can be present in the entirety of investigated frequency spectrums [16], while the conduction process is a current that is exclusively in the band of low-to-ultra-low frequencies [16,32]. The distribution of relaxation times α reflects the capture of the frequency-dependent polarization spectrum in an alternating electric field, which characterizes the analysis using dielectric relaxation spectroscopy. Through this method, the polarization processes taking place in the dielectric material are better understood [7,33,34].

2. Theoretical Background

The dielectric and its response to an applied electric field can be described using simple and more complex models. Simple models include the description of the dielectric material through the capacitance C and the dissipation factor tan δ. A more complex model is often used for a more thorough and accurate investigation of polarization and conductivity processes, which presents the values of the real ε′ and the imaginary part of the complex permittivity ε″. These values are obtained through the relations:
ε′ = C/C0
ε″ = ε‒ tan δ
where C0 is the geometric capacitance of the electrode arrangement. The difference between these models is that in technical practice, a simple model of the capacity C and the dissipation factor tan δ is most often used to describe the state of the insulating material. However, in the research area, it is necessary to characterize the processes, their nature, and their origin more closely in the insulating material when an electric field is applied [33,35]. A more complex dielectric parameter separates the conductive component and more accurately describes polarization events (except for electrode polarization), such as the complex permittivity ε*. It is a complex electric modulus M*, whose real M′ and imaginary part M″ is derived from the equation [16,36,37]:
M* = 1/ε* = (ε′/ε2 + ε2) + i(ε″/ε2 + ε2) = M′ + iM
Figure 1 shows the frequency spectra of the models mentioned above to present the dielectric spectroscopy of insulating materials. Specifically, these are the frequency spectra of the liquid dielectric based on GTL (gas to liquid) Shell Diala S4 ZX-1 transformer oil, which we measured at an alternating electric field intensity of 0.5 kV/m. The results of the measurements represented a simple data model of the capacitance C and the dissipation factor tan δ, which were converted to real and imaginary components of the complex permittivity and the complex electric modulus using Equations (1)–(3). Data in Figure 1 are presented to compare individual dielectric models.
Even though at least two dielectric spectra (ε′ and ε″) are observed in dielectric spectroscopy, the dominant parameter in the analysis and discussion of polarization mechanisms is the spectrum of dielectric losses ε″, tan δ, and M″. The first reason is to reveal more details about the dielectric processes, especially in the case of overlapping relaxation peaks, where the shape of the curves is copied by the measured frequency characteristic. The second reason is the equivalence of both spectra (ε′ and ε″) because they are interconnected through Kramers–Kronig transformations, which have the form [37]:
ε′(ω0) = ε+ ((2/π)0(ε″(ω)(ω/ω2ω02)))
ε″(ω0) = (σdc/ε0ω0) + ((2/π)0(ε′(ω)(ω/ω2ω02)))
The first part of the sum in Equation (5) is the contribution of conductive (ionic) losses, where ε is the optical permittivity, ε0 is the vacuum permittivity, σdc is the DC electrical conductivity, and ω is the angular frequency. Ionic conductivity is present in the low-frequency band and causes the overlap of the low-frequency relaxation spectrum. It means that the relaxation process, which is captured in the low-frequency band, is suppressed by the conductive contribution of dielectric losses. Ionic conductivity should, therefore, be eliminated due to the characterization of polarization processes in the low-frequency spectrum [37].
The technique of eliminating the ionic conductivity contribution from the measured frequency spectrum consists of the Kramers–Kronig transformation of the real part of the complex permittivity ε′ to εKK to describe the relaxation response of the material only. This excludes ionic conductivity from the measured spectrum [37].
Another more effective way of eliminating ionic conductivity is the application or the conversion of the complex permittivity ε* to the complex electric modulus M*, according to relation (3). The components of the complex electric modulus show lower values than the components of the complex permittivity (Figure 1) due to the position of ε′ and ε″ in the denominator of Equation (3). When transforming ε* to M*, the degree of distribution of relaxation times α is invariant, according to the Cole–Cole principle. However, in terms of the position of the captured relaxation peaks Mmax″ and εmax″, Mmax″ is at the position (ωτ)Mmaxα = εs in the band of higher frequencies, compared to εmax″, whose position is (ωτ)εmax = 1. It is caused by changing the low-frequency increase in ε″ into a conductive peak characterizing the ohmic relaxation time. It can be argued that applying a complex electric modulus causes a perfect separation between polarization and conduction losses with a distinction distribution, like the analysis by the complex permittivity. Thus, we can summarize that in the low-frequency bands, the dissipation factor and complex permittivity are significantly influenced by electrode polarization and ion conductivity [36,37]. The separation of the influence of these factors is offered by the complex electric module M*, as shown in Figure 1.

3. Materials and Methods

The dielectric response was investigated on nanofluids with the carrier insulating medium Shell Diala S4 ZX-1 (hereafter referred to as SD). This insulating oil is based on gas-to-liquid technology, which converts natural gas into liquid waxy hydrocarbons with minimal sulfur content. It has low viscosity (16 mPa·s at 293.15 K) and low density (786 kg/m3 at 296.15 K). The nanofluids consisted of magnetic Fe3O4 nanoparticles and C60 fullerene nanoparticles. Iron oxide nanofluid was produced using a co-precipitation process, followed by stabilization using oleic acid and mixing with a carrier-insulating medium. A sample was prepared with Fe3O4 with a concentration of 0.01 %w/V (the ratio of the mass of nanoparticles to the volume of the liquid). A more detailed explanation of preparing a sample of transformer oil suspended with magnetic nanoparticles is published in [38,39]. Nanofluid production with fullerene was realized by dispersing powdered fullerene (99.5% purity, Merck, Boston, MA, USA) with a density of 1600 kg/m3 without surfactant in a carrier-insulating medium. For comparison with the sample with Fe3O4, the sample was enriched with a fullerene concentration of 0.01 %w/V. To obtain such a suspension, the powder fullerene of a known mass was added to the oil and mechanically stirred. Then, the suspension was exposed to ultrasonication at temperature of 330 K during a period of 90 min. Owing to the good solubility of C60 fullerene in non-polar solvents, a homogenous and stable nanofluid of violet coloration was achieved. The stability of both nanofluids was observed for 6 months. No sedimentation or visual changes in color were confirmed during this period.
Particle size distribution was measured using the dynamic light scattering method with Malvern Instruments Ltd., Malvern, UK. Figure 2a shows the hydrodynamic size distribution of magnetic nanoparticles in SD oil. The average value of the hydrodynamic distribution is 13.3 nm. The window in Figure 2a shows the average value of the magnetic core of a magnetic nanoparticle obtained using magnetization measurements with an instrument obtained from Cryogenic Limited, UK. The y-axis represents the probability density function as a function of the size distribution of the magnetic core. Its value is 9.5 nm. By comparing the average size distribution values of 13.3 nm and 9.5 nm, the difference of 4 nm is attributed to the dead layer of magnetic nanoparticles and surfactant as a surfactant for stabilizing magnetic nanoparticles in SD carrier oil. In Figure 2b, we present the size distribution of fullerene nanoparticles. It can be seen that the continuous curve shows two peaks. The first indicates the presence of fullerene nanoparticles with a size of 1.1 nm in diameter. The given size is consistent with the standard size, as well as the one used in the study [40]. The second peak signals the presence of larger fullerene nanoparticles with a size of approximately 180 nm. The existence of larger fullerene nanoparticles in SD oil is due to the aggregation of nanoparticles in the presence of light during sample handling, as exposure to light has been shown to cause aggregation of fullerene nanoparticles.
The nanoparticle size has also been verified by transmission electron microscopy (JEOL JEM-2100F UHR microscope equipped with Schottky FEG source operating at 200 kV). The lower quality of the obtained images (Figure 3) stems from the contamination of the illuminated sample surface by the vaporized transformer oil. The arithmetic mean of the TEM image’s magnetic nanoparticles’ size is 11.3 nm (from Figure 3a). This size is smaller than that obtained from DLS because it represents the core size without the surfactant layer. The imaging of C60 fullerene is more complicated, as the transformer oil completely hides the C60 fullerene molecules. The single C60 molecules with diameter around 1.1 nm can be observed on the edge of bigger agglomerates (Figure 3b).
The relaxation mechanisms were analyzed by dielectric relaxation spectroscopy in the frequency domain. The IDAX 300 measuring device was used for the analysis using this method, which has a frequency range of 0.1 mHz–10 kHz. The high-frequency range limited the measurements to up to 3 kHz due to the application of a relatively high electric field intensity to the examined material. Two shielded wires were brought out of the measuring device, which was connected to the high-voltage and low-voltage parts of the Keysight 16,452 A Liquid Test Fixture electrode system, into which the examined liquid sample with a volume of 3.4 mL was filled. An alternating electric field intensity of 333.3 kV/m with a changing frequency was applied to the samples. The measuring device automatically converted the measured electric current data to complex permittivity recorded on a computer with IDAX 4.1.16 software. The measurement was performed in an EMC chamber (electromagnetic compatibility) due to the elimination of external frequency interference, where individual measurement components were grounded. The measurement conditions included typical values: air temperature 294.15 K, air humidity 36%, and air pressure 1013 hPa. The circuit diagram of the experimental workplace is shown in Figure 4.
The samples of insulating nanofluids were subjected to accelerated thermal aging at a temperature of 363.15 K using a universal oven UF55plus. Measurements of insulating nanofluids were performed with the following thermal aging times. At 0 h, after 500 h, after 1000 h, after 1500 h, after 2000 h, after 3000 h, and after 4500 h. Insulating liquids were, thus, stressed by accelerated thermal aging for 4500 h. After each thermal aging period, the samples were removed from the oven and cooled to a room temperature of 294.15 K before the actual measurement. Accelerated thermal aging at a constant temperature of 363.15 K for 4500 h was converted to the real operating time of the transformer, according to the half-time rule, similarly to studies [27,28]. They state that increasing the operating temperature by 7 K doubles the transformer oil thermal aging rate. The average operating temperature of transformer oil is 333.15 K. For one day at a temperature of 363.15 K, the oil has the same state of thermal aging as 19.5 days at an average operating temperature of 333.15 K. This conversion is presented in the following equations [27,28]:
Aging accelerating factor = (363.15 K − 333.15 K)/7 K = 4.286
Time factor = 24.286 = 19.5
Thus, dielectric relaxation spectroscopy data of samples of insulating nanofluids based on SD oil and pure SD transformer oil were obtained after the following period of real operation of the transformer (in years at 333.15 K): after 1.11 years (500 h at 363.15 K), after 2.23 years (1000 h at 363.15 K), after 3.34 years (1500 h at 363.15 K), after 4.45 years (2000 h at 363.15 K), after 6.68 years (3000 h at 363.15 K) and after 10.01 years (4500 h at 363.15 K). It is worth noting that the applied conditions of the thermal aging did not cause any destabilization of both nanofluids, as no sedimentation or color changes were observed after each thermal aging period. This is quite reasonable, especially for magnetic nanofluids, as the applied temperature is far below the boiling point of the stabilizing layer of oleic acid (633 K), at which the oleic acid decomposes. On the other hand, the dissociation of the carboxylate–iron (iron oxide) bonds was also proven at significantly higher temperatures [41,42].

4. Results and Discussion

We present the results of this study in three subsections. The first two subsections focus on the frequency spectra of dielectric losses with different comparisons of insulating nanofluids in accelerated thermal aging. The third chapter will explain the dynamics of the distribution of relaxation times in the measured frequency band during accelerated thermal aging. The third subchapter points to the behavior of the captured dielectric response function, which was characterized by the parameter of the distribution of relaxation times through the Cole–Cole diagram.

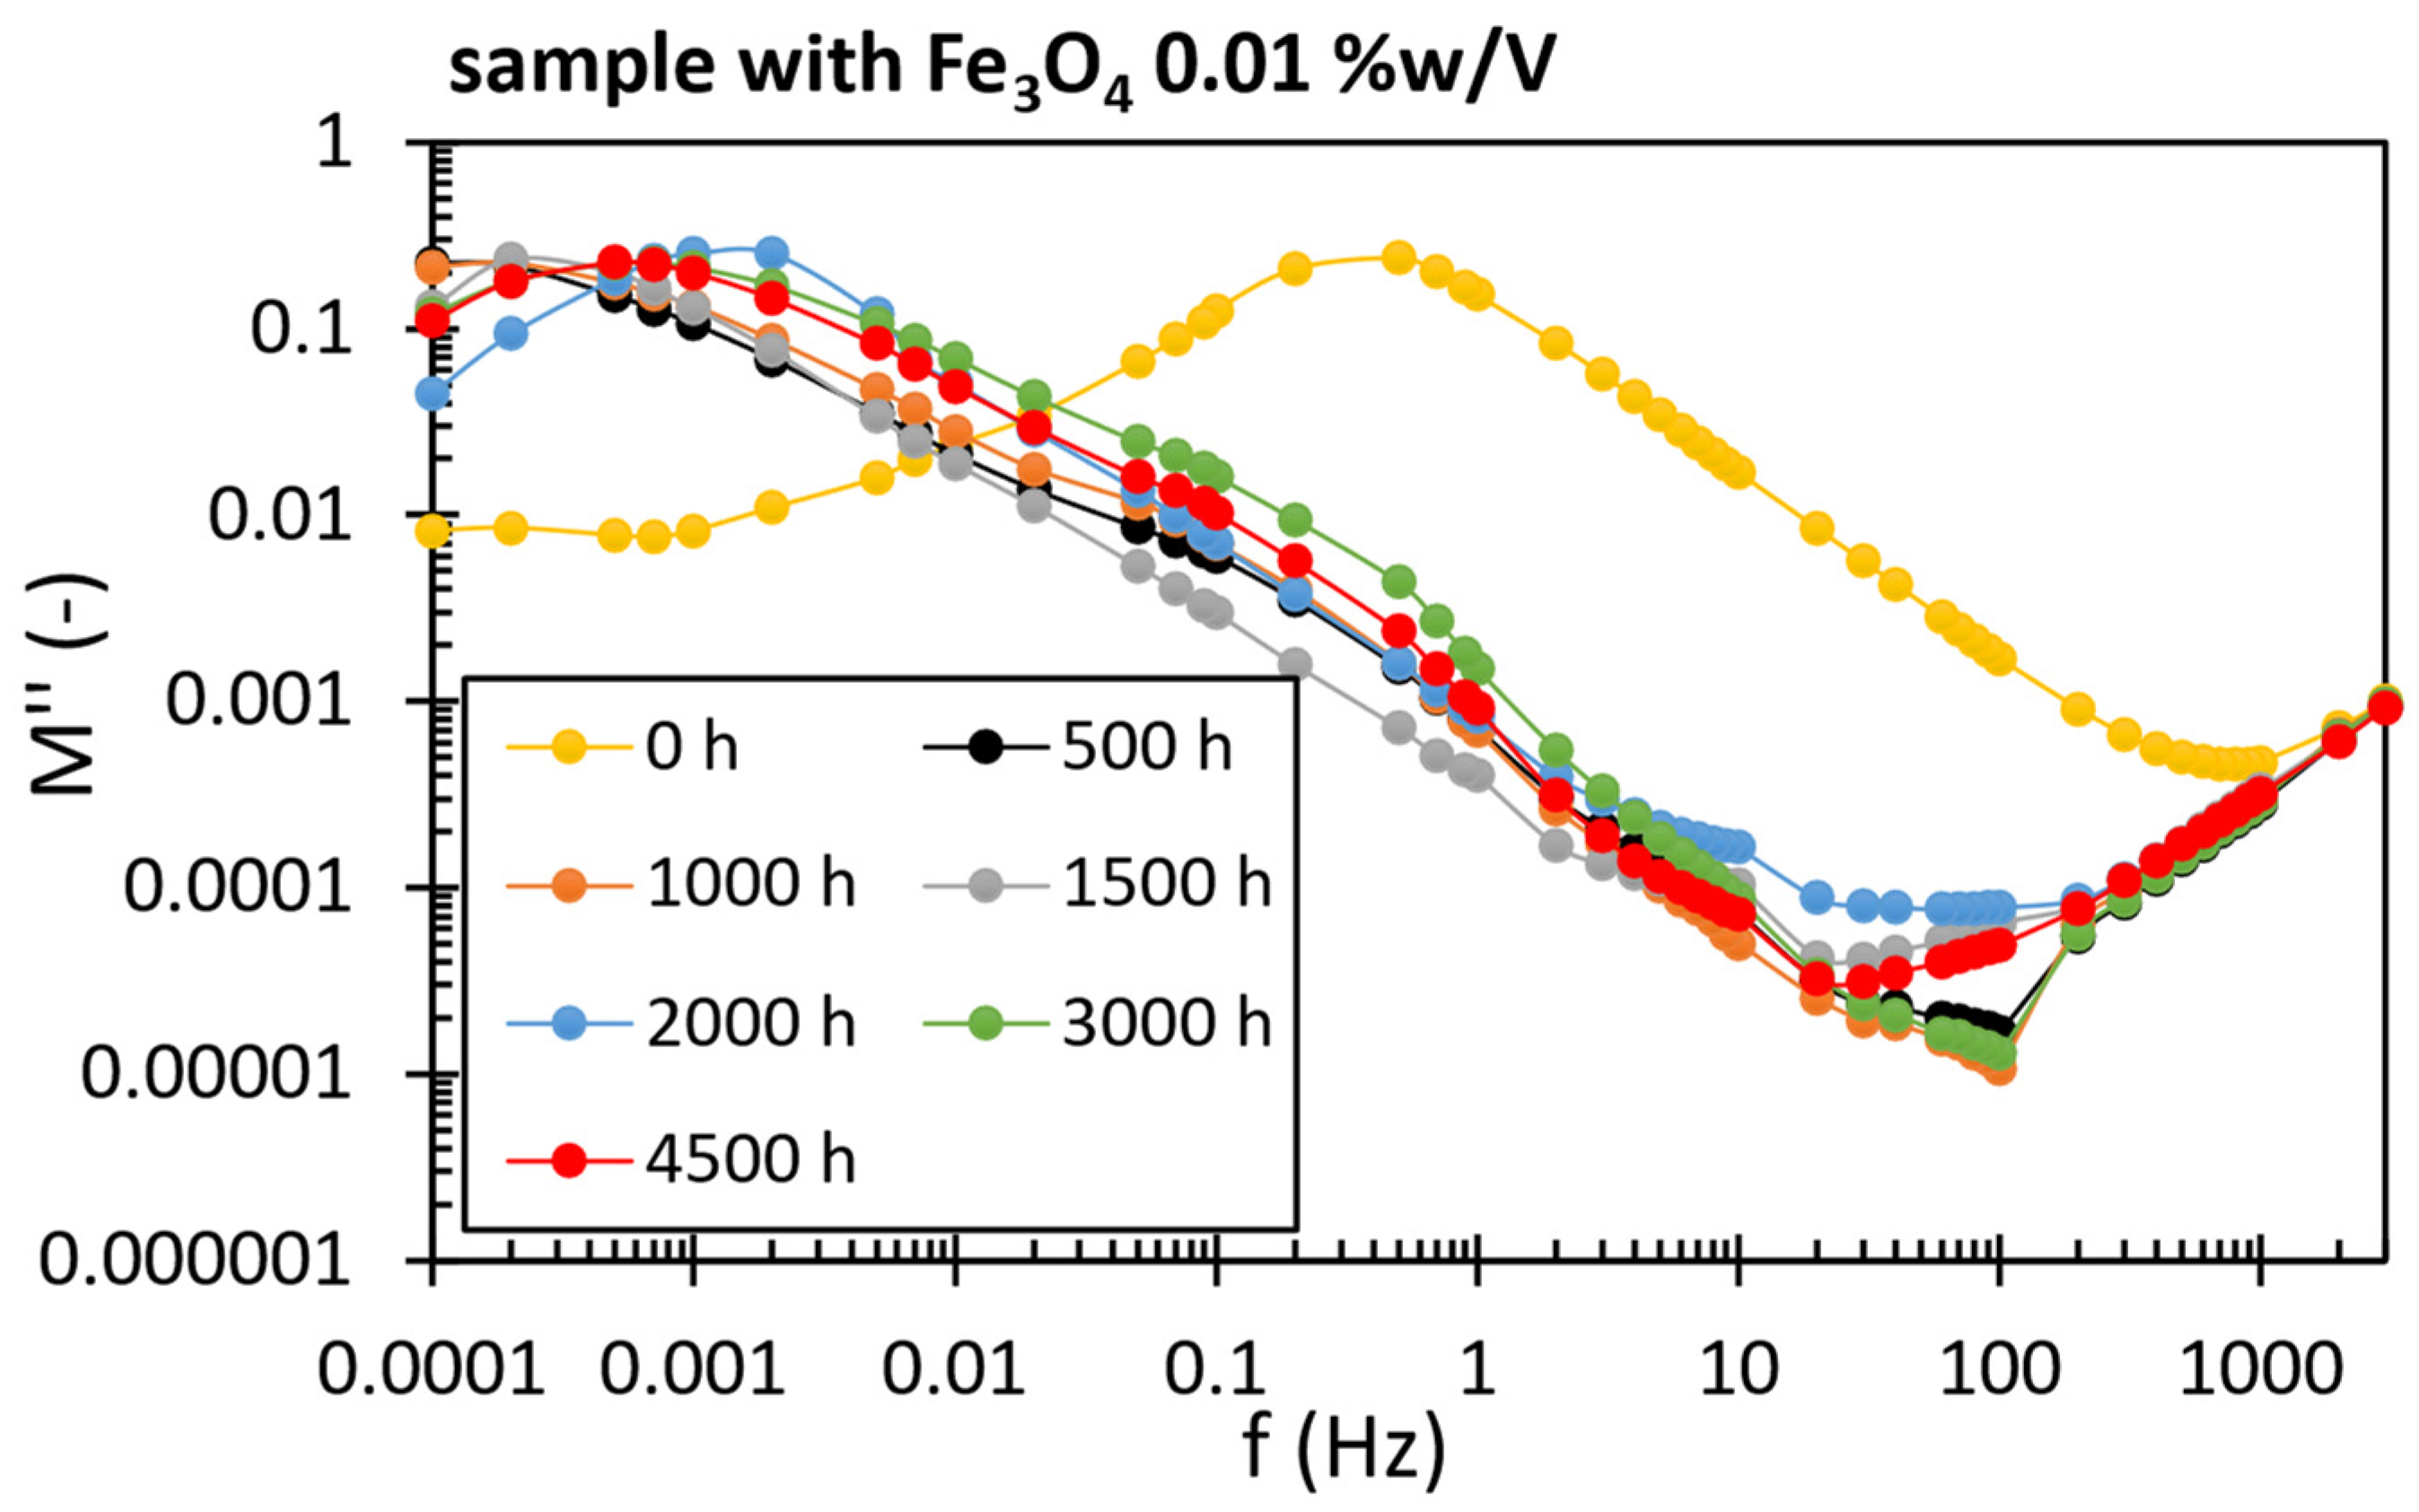
4.1. Frequency Spectra of Dielectric Losses of a Complex Electric Modulus during Accelerated Thermal Aging

In this subsection, we analyze the frequency spectra of dielectric losses using the dielectric relaxation spectroscopy method. The complex electric modulus M* analyzes the captured dielectric response. Figure 5, Figure 6 and Figure 7 show the imaginary part of the complex electric modulus M″ of the investigated liquid samples, depending on the frequency during accelerated thermal aging. The reason for focusing on the loss characteristics of the complex electric modulus is that the dissipation factor tan δ reflects the same relaxation response at lower frequencies [37]. Since the captured polarization processes in the ultra-low frequency band can be seen from the graphic dependences in Figure 5, Figure 6 and Figure 7, the application of the imaginary modulus is justified. Figure 5 shows the frequency characteristics of the dielectric losses of pure SD transformer GTL oil during accelerated thermal aging of 4500 h at a temperature of 363.15 K. Relaxation peaks appear in the low-frequency band 0.1 mHz–2 mHz. They are caused by polar impurities or moisture with strong polar bonds, since transformer oil is a non-polar insulating liquid. The relaxation peaks of the recorded polarization processes during thermal aging change their position in the low-frequency band in the range mentioned above. At the reference dielectric response of SD oil (0 h), the relaxation peak is at a frequency of 0.2 mHz at 500 h; it is at a frequency of 1 mHz at 1000 h; it is around 0.6 mHz at 1500 h; it is at a frequency of 2 mHz at 2000 h; at 3000 h, it is at a frequency of 0.2 mHz; and at 4500 h, the frequency of the relaxation mechanism is 0.5 mHz. It alternately changes position in the low-frequency band during accelerated thermal aging. Since the slope of the increase in dielectric losses with decreasing frequency in the band 2 mHz–20 Hz is approximately the same during thermal aging, the mentioned alternately changing position of the relaxation process causes the increase and decrease in dielectric losses in the band close to the operating frequencies. From measurements of dielectric losses during 4500 h of thermal aging at a temperature of 363.15 K (10.01 years of the regular operation of the transformer), it was found that the values at 4500 h are not significantly increased, compared to the results of measurements at shorter periods of thermal aging. In the study [43], transformer GTL oil SD and its dielectric properties were investigated using dielectric spectroscopy during accelerated thermal aging at a temperature of 363.15 K. Thermal aging was simulated for a shorter time, namely up to 1830 h, but with more frequent measurements. The results pointed to an alternately changing size of the capacitance C in the examined frequency spectrum of 20 Hz–2 MHz, similar to the results of the dielectric losses M″ presented by us in the lower frequency band of 0.1 mHz–3 kHz. Thus, the synthetic SD ester alternately changes its dielectric properties during thermal aging in a wide frequency range of 0.1 mHz–2 MHz. From the measured data in Figure 5 at 0 h and 3000 h near the operating frequencies of 50 Hz and 60 Hz, a suspicious reduction in dielectric losses can be seen. This reduction is unlikely due to the specific dielectric properties of SD oil. Therefore, we believe that it is caused by the electromagnetic interference of the electrical network, operating at a frequency of 50 Hz, which affected the measurement results.
Figure 6 shows the investigation results of SD transformer oil enriched with C60 nanoparticles during thermal aging. The dielectric response of this nanofluid to an external electric field resembles the dielectric response of pure SD transformer oil. Captured relaxation mechanisms in the ultra-low frequency band appear at approximately the same relaxation frequencies. However, there are differences in the measured loss dependencies, which will be described in more detail in the following subsections. The course of thermal aging and its impact on dielectric losses are not directly proportional, similarly to pure SD oil. It means that with a gradual increase in the thermal aging time, there is no gradual increase in dielectric losses in the measured frequency spectrum. The behavior of this nanofluid undergoes three phases during thermal aging. The first phase reflects the gradual increase in dielectric losses until the thermal aging time of 1500 h (3.34 years at regular operation at 333.15 K). The second phase reflects a gradual decrease in dielectric losses between 1500 h and 3000 h (3.34–6.68 years at 333.15 K), and the third phase again shows an increase in dielectric losses between 3000 h and 4500 h by approximately 57.7% (6.68–10.01 years at 333.15 K).
The thermal aging process of SD transformer oil with Fe3O4 magnetic nanoparticles stabilized by oleic acid is shown in Figure 7. Before thermal aging (0 h), the dielectric response of the magnetic nanofluid shows a different characteristic shape than during the thermal aging period. At 0 h, a relaxation peak around the frequency of 0.5 Hz is recorded. As a magnetic nanofluid, the relaxation peak is attributed to the electric double layer polarization. Colloidal particles (Fe3O4 particles) trap ions that form a second electrical layer on the particle surface. When an external electric field is applied, this system becomes polarized due to the displacement of the ions relative to the particle. The first electrical layer is formed by binding the polar head of the surface-active substance (surfactant) and nanoparticles. It creates a negatively charged particle that electrostatically attracts the positive ions contained in the nanofluid. The presence of this mechanism is also described in studies [7,8,9,16,21]. After 500 h of thermal aging, the characteristics of dielectric losses are recorded, reminiscent of pure SD transformer oil characteristics. Subsequently, all investigated aging times reflect a similar dielectric behavior after 500 h. It is, therefore, possible to claim that after 500 h of thermal aging (after 1.11 years), the effect of electric double layer polarization on the frequency spectrum of dielectric losses disappears. The loss of the electric double layer polarization effect can be caused by the inhomogeneity of the surfactant (oleic acid), with respect to the carrier substance. It is important to note that the presence of oleic acid in magnetic nanofluids based on transformer oil poses a risk in separating this liquid due to degradation, since the relative permittivity of this acid is approximately 20 times higher than in the case of inhibited transformer oil. In the same way, due to the dissociation of the surfactant, it can interact with the transformer oil, which can change the properties of the given oil. The course of thermal aging and its impact on dielectric losses is not directly proportional, similarly to pure SD oil and SD oil suspended with C60 nanoparticles. It means that with a gradual increase in the thermal aging time, there is no gradual increase in the dielectric losses in the measured frequency spectrum. The dielectric losses of the magnetic nanofluid do not decrease and increase proportionally with the thermal aging time, even during phase separation, as in the thermal aging of the fullerene nanofluid. The characteristics of dielectric losses at 4500 h of aging are not significantly increased, compared to the results of measurements at shorter thermal aging times, similar to pure SD oil. The difference is that the magnetic nanofluid has an increased number of polar particles obtained by the presence of a hydrophilic polar head of the surfactant. These particles may be responsible for additional polarization processes with certain relaxation times that attract attention in the frequency band 0.1 Hz–1 Hz, with a slight undulation of the curves, especially at thermal aging of 3000 h and 4500 h (6.68 and 10.01 years of regular operation).

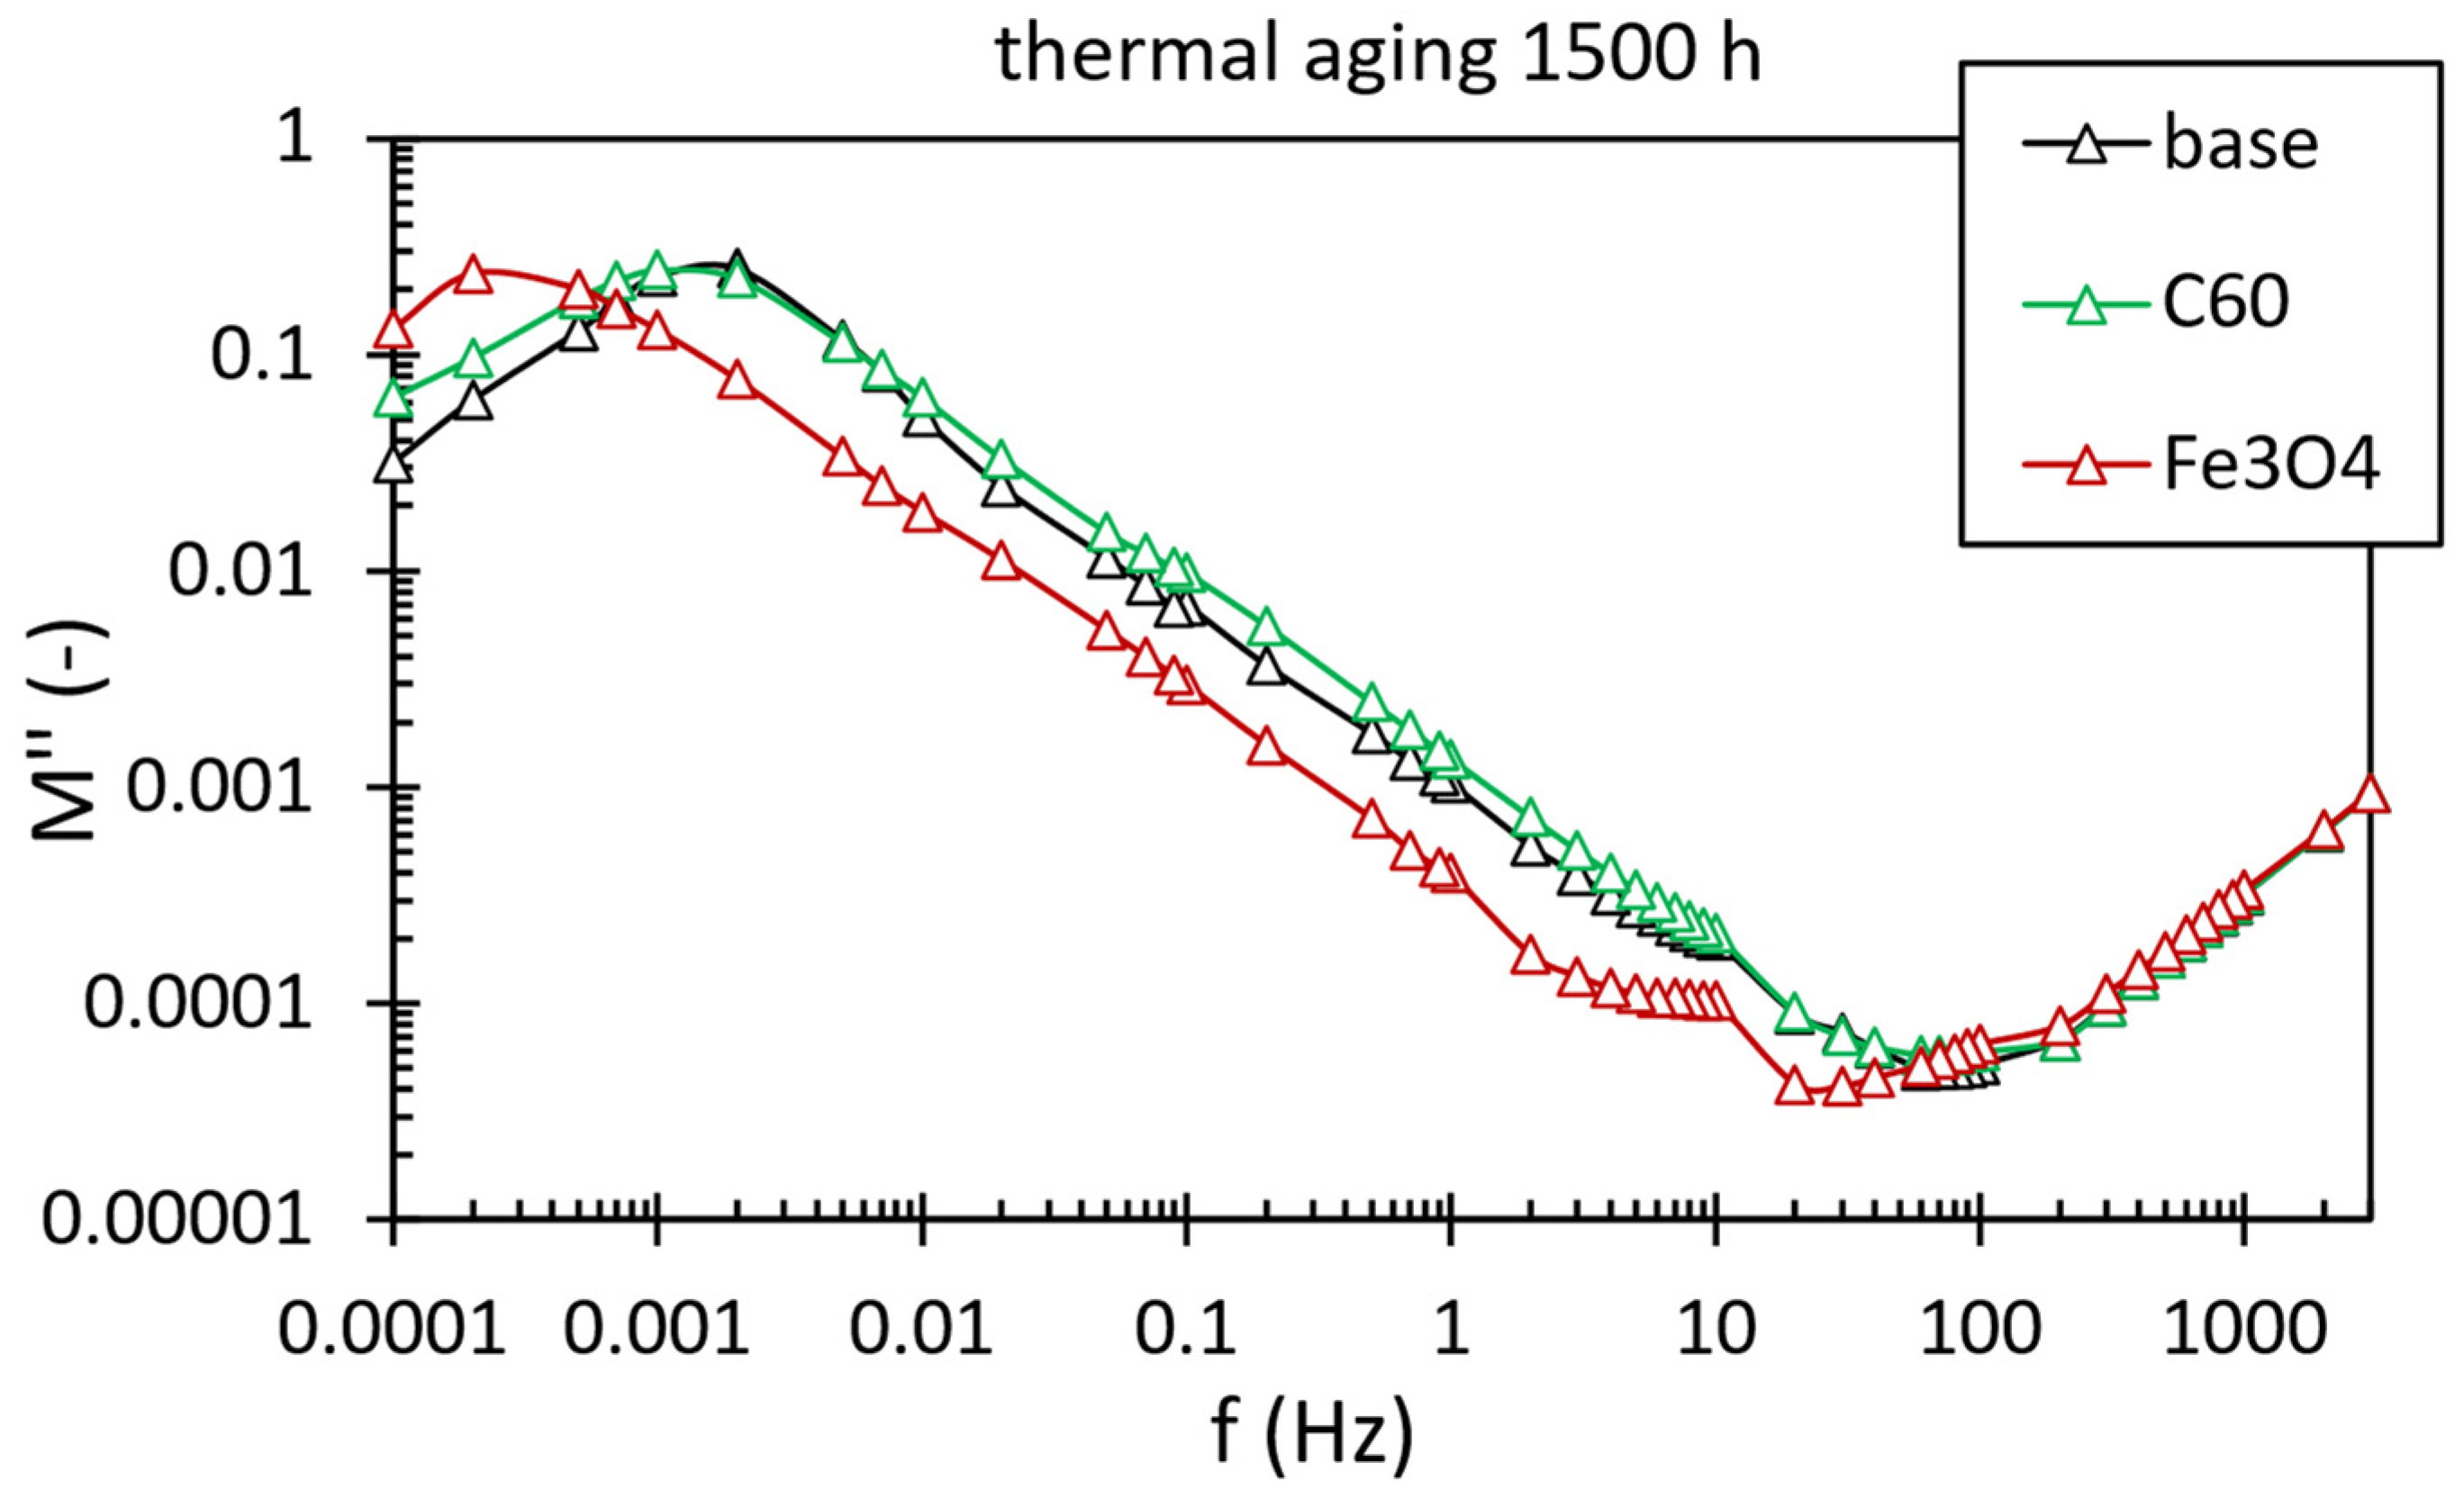
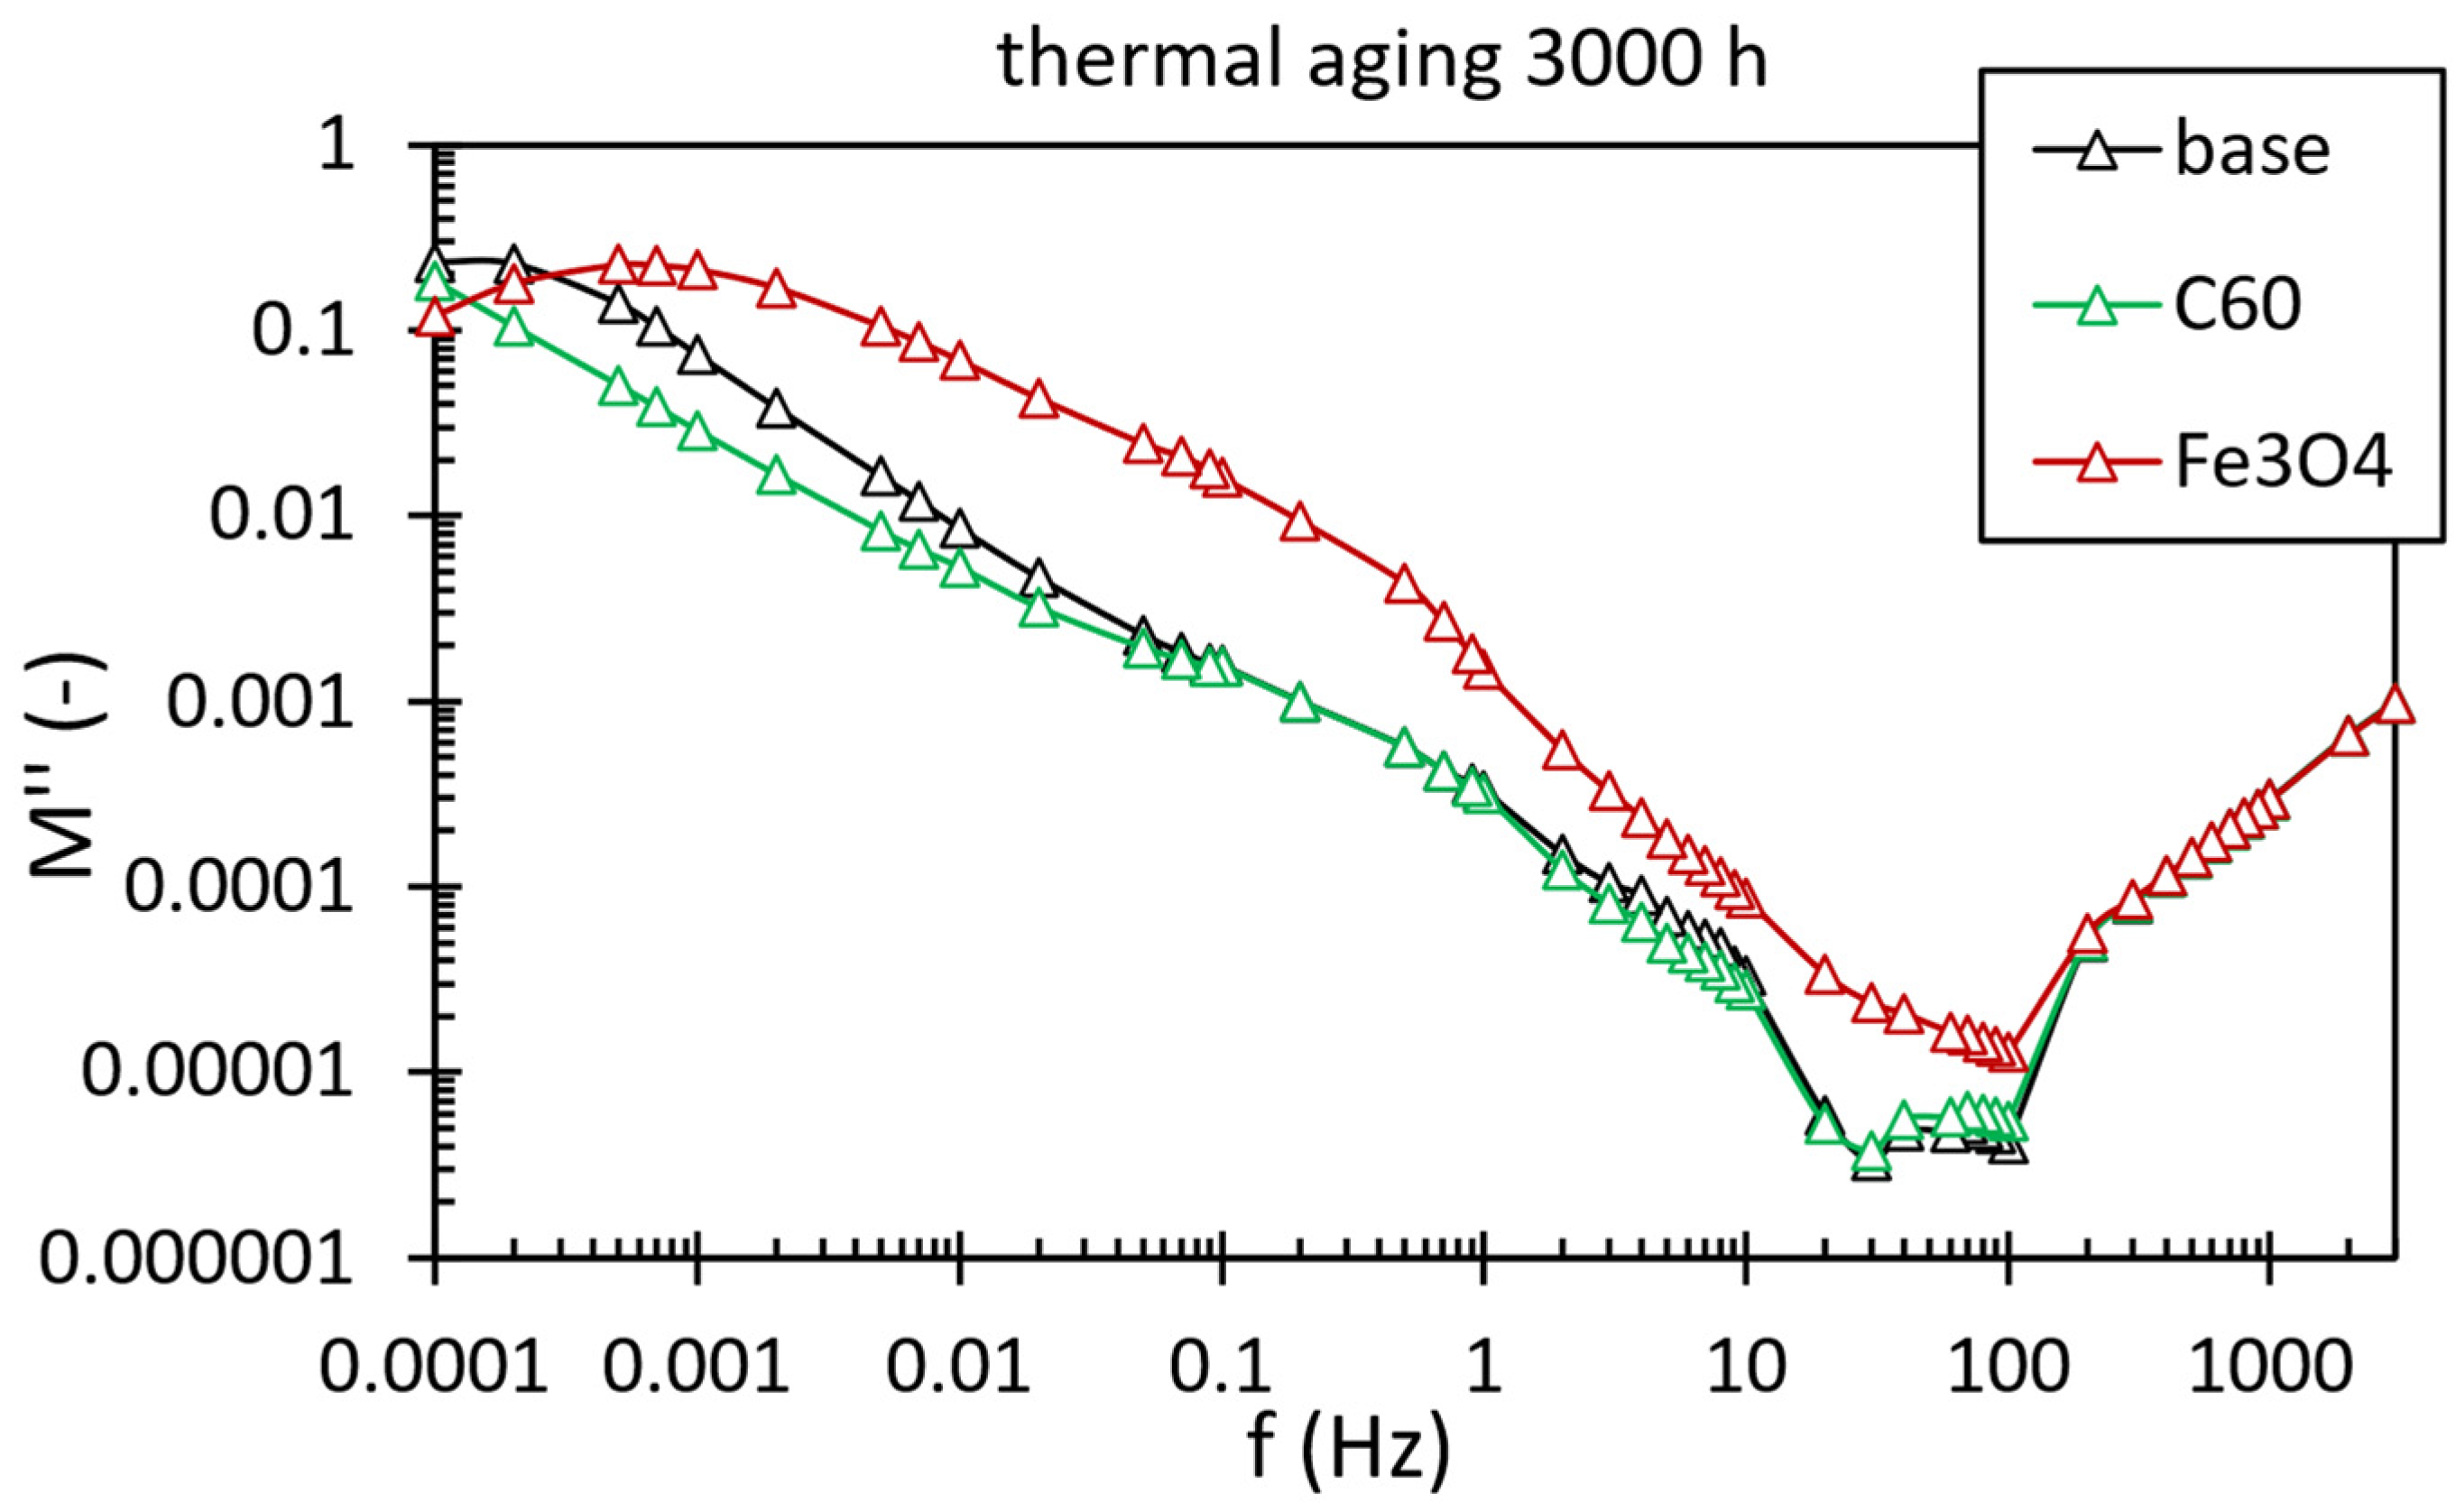
4.2. Comparison of the Dielectric Response of Investigated Liquids

This subchapter compares the frequency spectra of dielectric losses of investigated insulating liquids in accelerated thermal aging using the complex electric modulus M*. Figure 8, Figure 9, Figure 10, Figure 11, Figure 12, Figure 13 and Figure 14 show the imaginary part of the complex electric modulus M″ of the examined liquid samples, depending on the frequency during accelerated thermal aging. The reference characteristics of the liquids (0 h, Figure 8) show differences in the frequency nature of the dispersed nanoparticles. The sample with a concentration of magnetic nanoparticles shows a relaxation response in the medium frequency band (0.5 Hz). The base liquid and the sample with fullerene nanoparticles have a relaxation peak at the same frequency (0.2 mHz). The frequency spectra of the pure base fluid (GTL oil) dielectric losses and the nanofluid with fullerene are the same, except for the frequency band 10 Hz–100 Hz.
500 h of thermal degradation causes a significant change in the position of the relaxation response in the frequency spectrum for the sample with magnetic nanoparticles (Figure 9). The reason is the loss of the electric double layer polarization effect, as mentioned in Section 4.1. After 500 h of thermal aging, there is a change in the low-frequency relaxation response between the base oil sample and the sample with fullerenes, while the dielectric losses of the sample with C60 nanoparticles decreased with a shift of the relaxation peak to lower frequencies. It means that after 500 h of thermal aging, the relaxation time of the polarization processes of samples with Fe3O4 and C60 nanoparticles was prolonged, compared to the base transformer oil sample.
After thermal aging of 1000 h (Figure 10), relaxation peaks at a frequency of 0.2 mHz with the same value of dielectric losses equal to 0.2 were equalized. The main difference is in the dielectric losses of the magnetic nanofluid in the frequency band 1 mHz–3 Hz when higher values were achieved than the base oil and the oil with fullerenes. The given dispersion can be caused by interfacial polarization at the magnetic nanoparticle–oil interface. By capturing a higher number of relaxation maxima, a higher distribution of relaxation times α occurs. A higher distribution of relaxation times also causes a decrease in the dielectric loss value of the relaxation peak at a given frequency.
Thermal aging for 1500 h in Figure 11 shows the loss of the interfacial polarization effect in the sample with magnetic nanoparticles. The shift of the entire loss spectrum to lower frequencies is also noteworthy. There is only a minimal difference between the samples of base oil and oil with fullerenes in the form of higher dielectric losses of the sample with fullerenes.
After thermal aging of 2000 h, the polarization process shifted to higher frequencies in the sample with magnetic nanoparticles, compared to that after 1500 h. On the contrary, the frequency characteristics of the dielectric losses of the base oil sample and oil with fullerenes show a relaxation process at a frequency of 0.2 mHz. Between samples with different types of nanoparticles, the position of the low-frequency relaxation process changed with a change in relaxation times.
Thermal aging of 3000 h causes a shift of the polarization process to lower frequencies in the sample with fullerene nanoparticles. It can also be seen that the value of the dielectric losses of the relaxation peak of the sample with magnetic nanoparticles is again the same as the value of the peak of the base liquid sample. In the frequency band 0.01 Hz–1 Hz, we register a remarkable increase in dielectric losses, reminiscent of the recapture of nanoparticle–liquid interfacial polarization. This process represents an imaginary peak around the frequency of 0.2 Hz, dispersedly increasing the dielectric losses.
From the point of view of the dispersion of the dielectric responses of the investigated insulating liquids in the frequency band, the results are the most balanced at the thermal aging of 4500 h. This means that the dielectric losses of the investigated liquids differ only with a minimal difference. The difference is mainly in the band 0.1 Hz–1 Hz when the interfacial polarization is again recorded in the sample with magnetic nanoparticles. The sample with fullerene nanoparticles also shows the same effect, which may be caused by the interfacial polarization of the fullerene–liquid system. The characteristics after thermal aging of 4500 h show that the examined samples do not show a polarization process at the main frequencies of 50 Hz and 60 Hz, which is important from the application’s point of view during operation. Otherwise, there would be an increase in dielectric losses directly impacting the cooling of the power transformer.

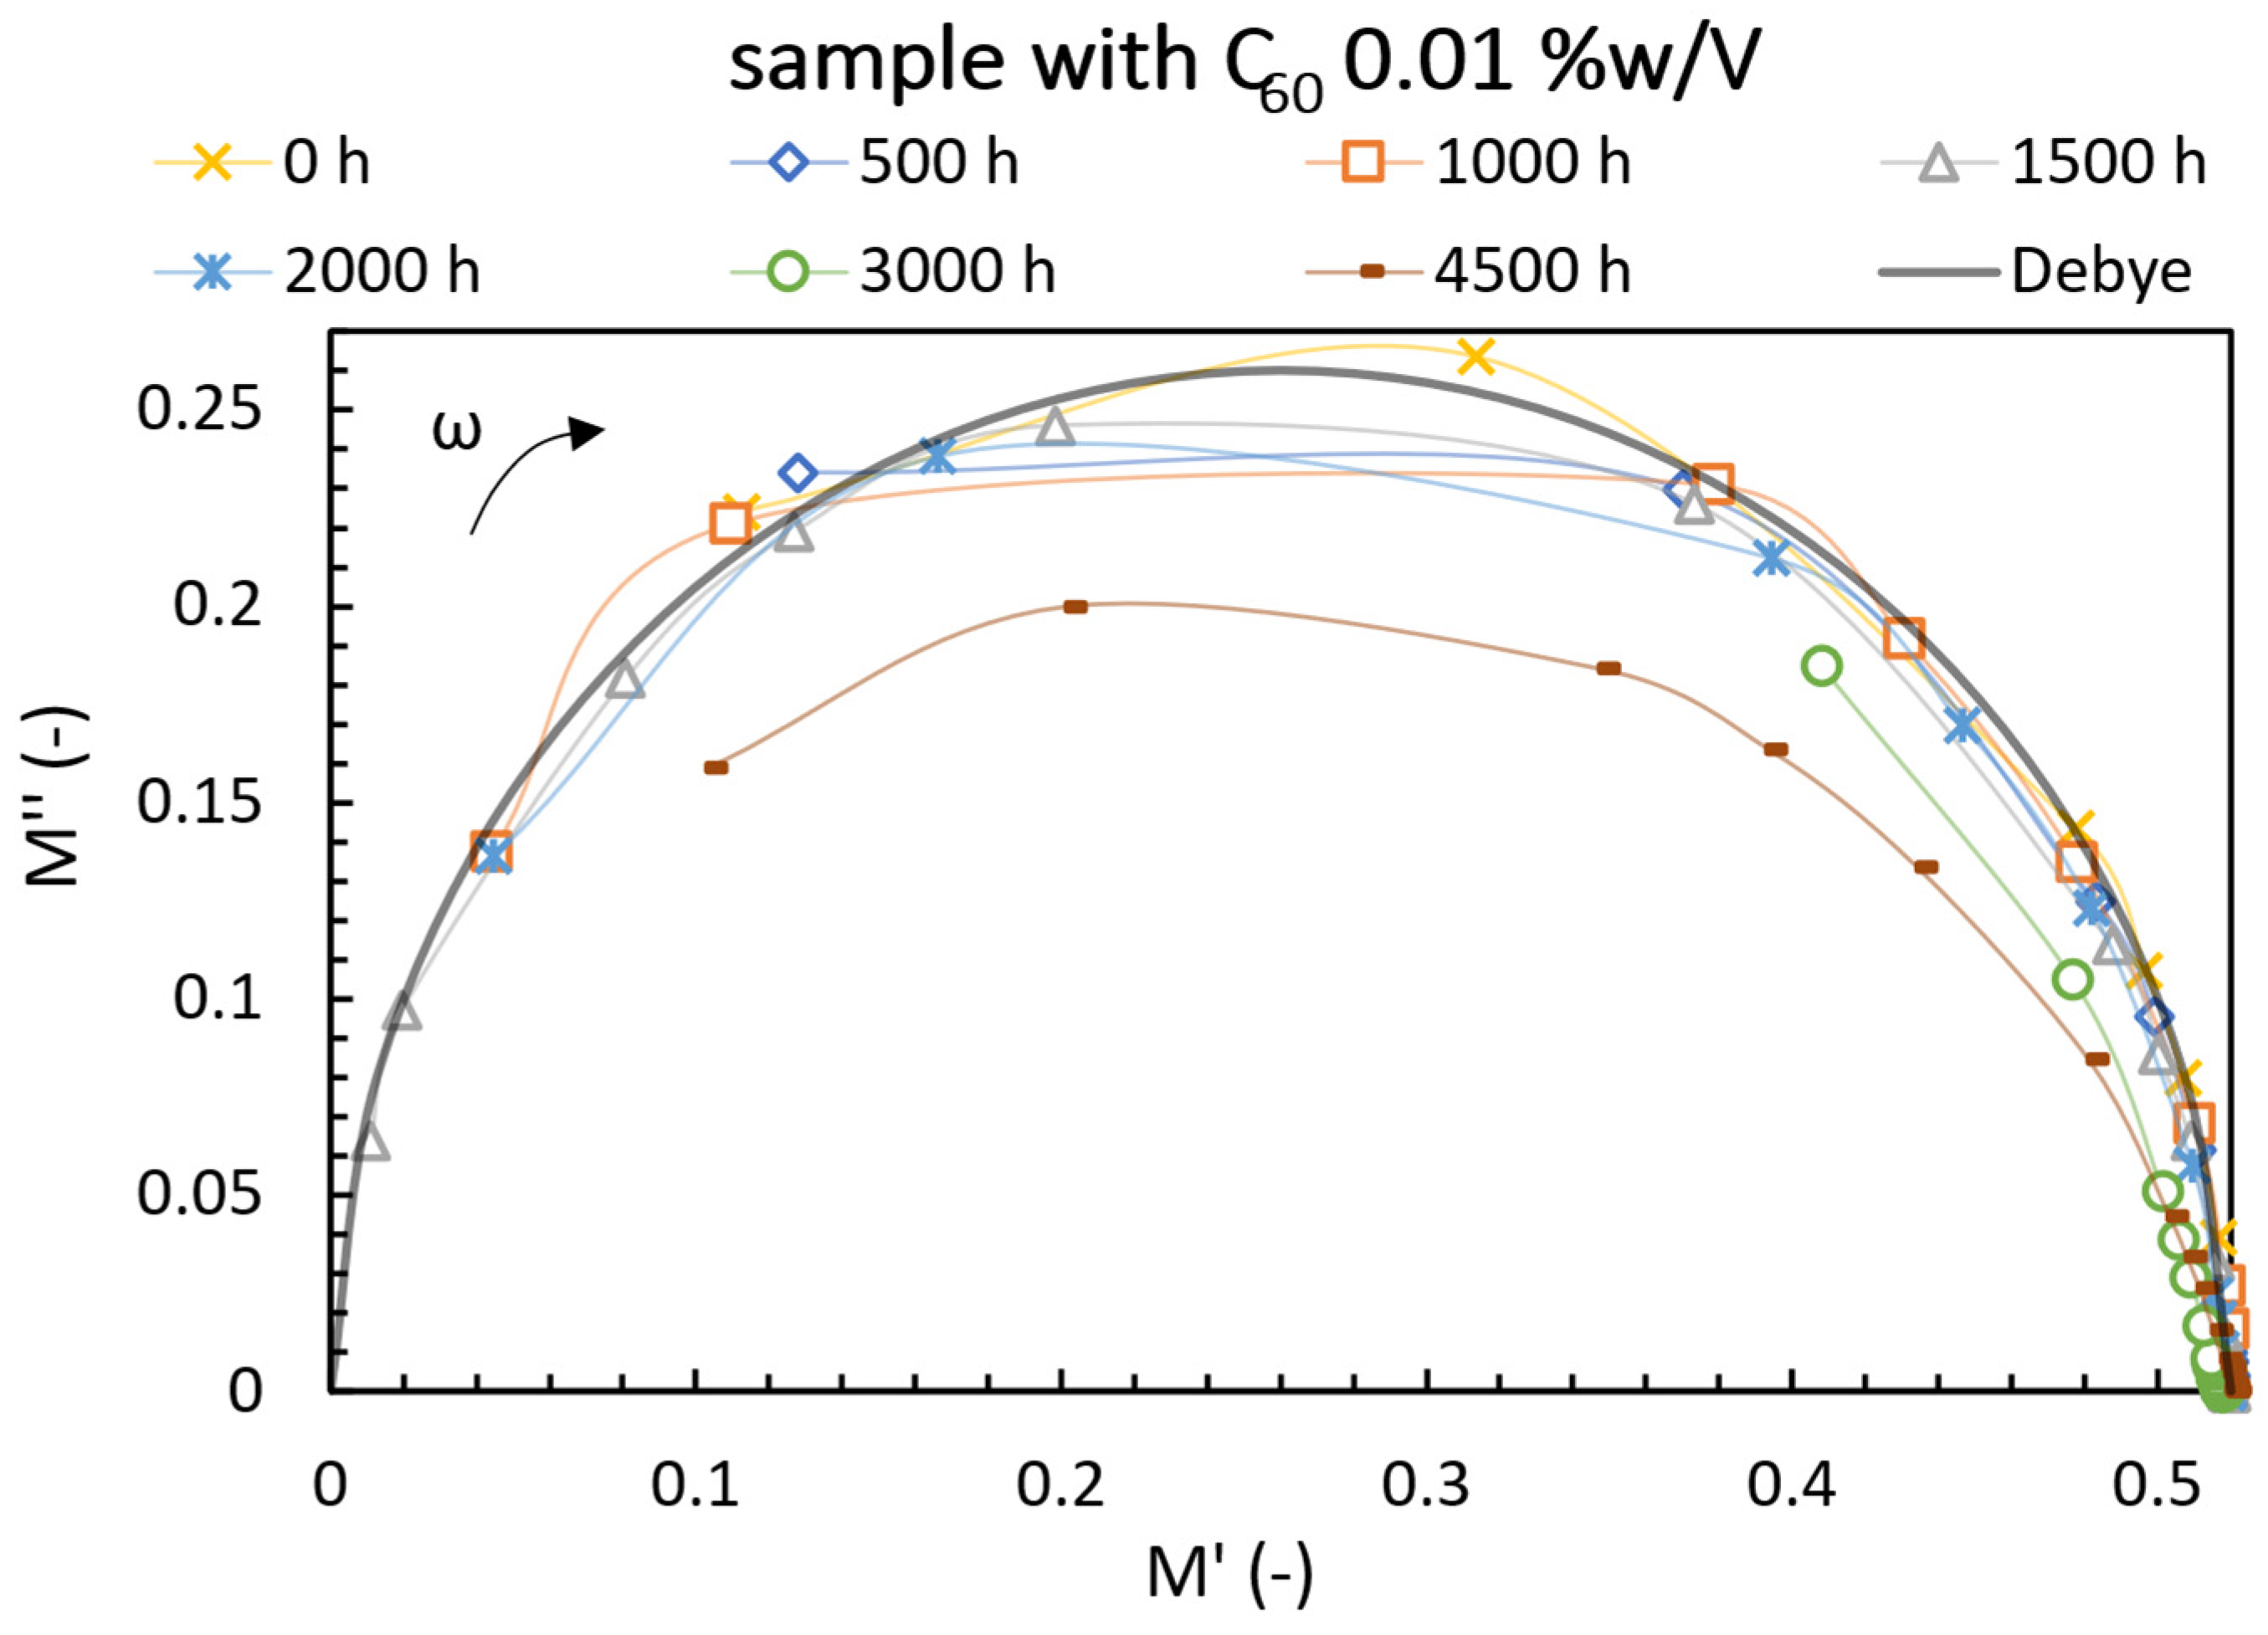
4.3. Cole–Cole Distribution of Relaxation Times

Figure 15 shows the spectra of M* in the complex plane of the Cole–Cole diagram of pure base liquid SD at the thermal aging of 4500 h. To determine the parameter of the distribution of relaxation times α, according to the Cole–Cole formalism, the ideal Debye characteristic with the parameters of the static modulus Ms = 0 and the optical modulus M = 0.52 was plotted.
Figure 16 presents the Cole–Cole diagrams of the insulating liquid SD with fullerene C60 nanoparticles at a concentration of 0.01 %w/V. Figure 17 shows the insulating liquid SD with nanoparticles of iron oxide Fe3O4 with the same concentration of 0.01 %w/V. Compared to the complex permittivity, the advantage in applying the complex electric modulus consists of eliminating the effect of electrode polarization and selecting relaxation information from the conduction process. Figure 15, Figure 16 and Figure 17, therefore, only show the change of the relaxation information of the investigated insulating nanofluids in accelerated thermal degradation. From the Cole–Cole diagrams, it can be seen that for the sample of base oil and oil with fullerene nanoparticles, the distribution of relaxation times increases with the increasing time of thermal aging. It is related to a more significant displacement of the center of the plotted semicircle below the real axis M′.
The essence of the Cole–Cole principle of the distribution of relaxation times is the expression of the parameter α (range of values from 0 to 1) from the detected angle π · α/2, which is enclosed by the line segment (between 0;0 and the center of the Cole–Cole semicircle) and the M′ axis [44]. The obtained values of the parameter α for individual samples of insulating liquids are shown in Table 1. However, it is important to remember that the distribution of relaxation times for Debye behavior is α = 0.
From Table 1 and graphical dependencies in Figure 15, Figure 16 and Figure 17, it can be seen that the nature of the distribution of relaxation times is different for individual samples of insulating liquids. The concentration of the two nanoparticles independently causes a different dielectric response to the applied alternating electric field in the SD base liquid. At 0 h of thermal aging, the insulating liquids show the smallest distribution of relaxation times, compared to the values at thermal aging (≥500 h). This fact follows the knowledge obtained so far about the dielectric properties of insulating materials during thermal aging [2,44,45,46]. Figure 18 shows the nature of the relaxation time distribution of the examined samples during accelerated thermal aging. It reflects the graphic curves from the values in Table 1. We find that the distribution of relaxation times of the investigated liquids does not have a linearly increasing character with increasing thermal aging time. An increase in α at a thermal aging of 500 h was observed for all samples, which could be expected. Subsequently, all samples show a decrease in α base liquid at 1500 h, samples with fullerene nanoparticles at 1000 h, and samples with magnetic nanoparticles at 1000 h, 1500 h, and 2000 h. It means that the increase in α in the thermal aging process has slowed down. This effect is consistent with some studies in which insulating properties are improved at the beginning of the aging process [18,47,48]. In this case, it is the strength of the reaction of the insulating material to the applied alternating electric field in terms of polarization mechanisms. Between the thermal aging times of 2000 h and 3000 h, α increases again in the magnetic nanofluid. By comparing samples of insulating liquids after thermal aging of 3000 h, we find that the most extensive distribution of relaxation times is for the sample with magnetic nanoparticles, and the smallest is for the base liquid. Based on the explicit dependencies in Figure 10, Figure 13, and Figure 14, it is possible to claim that the additionally captured relaxation of the sample with magnetic nanoparticles is caused by the interfacial polarization (liquid–magnetic nanoparticle) with the contribution of the polarization of the electric double layer [21,49]. It explains the more significant distribution of relaxation times, compared to the sample with fullerene nanoparticles. In this sample, the origin of the additional relaxation is the liquid–fullerene interfacial polarization. The polarization process in the base fluid can be caused by dirt or moisture. These polar substances are also responsible for the occurrence of relaxation mechanisms in the sample with Fe3O4 and C60 in the low-frequency band during the entire period of thermal aging. The increase in α at the end of the observed thermal aging of 4500 h, compared to the reference values (0 h), is related to the breaking of the C-H bonds of the liquid molecules [50]. This causes the release of polar substances into the liquid volume, increasing the relaxation time τ and the distribution of relaxation times α.

5. Conclusions

This study approximates the dielectric relaxation spectroscopy of samples of insulating nanofluids based on SD oil and SD base transformer oil during accelerated thermal aging of 4500 h at a temperature of 363.15 K. Accelerated thermal aging of insulating liquids can be converted to the approximate state of the investigated liquids during real operations of the power transformer through half-time rules. Through the experimental procedure, the data of frequency-dependent dielectric spectroscopy of insulating liquids were obtained after approximately ten years of thermal stress in real operating conditions. The results point to the validity of the application of the complex electric modulus because another complex dielectric parameter could not specify the captured relaxation mechanisms in the low-frequency band. Some studies write about the progressivity of GTL oil. However, few publications present the dielectric relaxation response of GTL oil and nanofluids based on this oil with different types of nanoparticles during accelerated thermal aging. We found that the relaxation processes of GTL base oil change position in the low-frequency band during thermal aging. It is an alternately changing position of the polarization peak in the low-frequency band. Dielectric losses of GTL oil at 4500 h (363.15 K) are not significantly increased, compared to the measurements’ results at shorter thermal aging times.
A remarkable feature is the alternately changing dielectric properties during a wide frequency range of thermal aging. We found that the fullerene nanofluid undergoes three phases of dielectric loss changes during thermal aging. The dielectric response of the nanofluid with the fullerene fraction approximately corresponds to the dielectric response of the SD base oil. In the magnetic nanofluid based on GTL oil, the effect of electric double layer polarization disappeared after 500 h of thermal aging. The course of thermal aging and its impact on dielectric losses is not directly proportional, similar to the case of SD base oil and SD oil suspended with C60 nanoparticles. It means that with a gradual increase in the thermal aging time, there is no gradual increase in dielectric losses in the measured frequency spectrum. The distribution of relaxation times is different for individual samples of insulating liquids. The concentration of the two nanoparticles independently causes a different dielectric response to the applied AC electric field in the SD base fluid. The distribution of the relaxation times of the investigated liquids does not have a linearly increasing character with increasing thermal aging time. However, compared to the reference values, the distribution of relaxation times at the end of thermal aging is larger.

6. Contribution of the Study

This study provides a remarkable insight into the spectroscopic analysis of changes in the electrophysical structure of insulating nanofluids during thermal degradation with the application of a complex electric modulus to describe the dynamic distribution of relaxation times in the form of dielectric response. A liquid of the unique Shell Diala S4 ZX-1 type was studied. Recent results show significant progressivity of this oil, compared to conventional mineral oils. Some studies, such as [51,52], compared GTL oil and mineral oil at lower and higher intensities of the alternating electric field with the distribution of investigated dielectric losses in thermal and frequency dependence. The paper [43] dealt with pure GTL base oil in the process of accelerated thermal aging for 1830 h with the results of capacitance and dielectric losses in a relatively high-frequency spectrum of 20 Hz–2 MHz. In other publications, magnetic nanofluids based on GTL oil were investigated, while in [16], remarkable Debye relaxation of ferrofluid and hybrid nanofluids, which were composed of magnetic and fullerene nanoparticles, was revealed. Regarding the comparison of the breakdown strength and partial discharge activity of mineral and GTL ferrofluid, interesting results can be found in the study [13]. The contribution [53] is devoted to thermal dependencies and the cooling mechanism of ferrofluid based on GTL oil, where the better cooling effect of ferrofluid with a lower fraction is pointed out. The effect of magnetic and electric fields on dielectric losses of ferrofluid is described in [54]. However, the issue of thermal aging for dielectric losses of ferrofluid based on GTL oil is barely explored. There is not even a registered study comparing magnetic nanofluids with fullerene nanofluids in accelerated thermal aging. We consider the research of dielectric losses and the distribution of relaxation spectra in the accelerated thermal aging of nanofluids based on GTL oil with different types of nanoparticles to be an added value of this study. New results comparing pure GTL oil and nanofluids with different types of nanoparticles were presented in chapter 4 of this study. Data were obtained in the process of thermal aging of liquids during 10.01 years of the normal operation of the power transformer. The results at the end of this period point to minimal differences in the loss spectra of the investigated liquids. This study also provides a springboard for continuing research on these nanofluids in the thermal aging process after ten years of simulated power transformer operation. Since the base GTL oil shows good oxidation stability [55], we are motivated to reveal the degradation process through dielectric losses even after ten years of thermal aging. The findings of this study represent unique results in the given issue of the potential application of the investigated nanofluids in practice.

Author Contributions

Conceptualization, P.H., R.C. and B.D.; methodology, S.B. and J.K. (Jozef Király).; software, P.H.; validation, R.C. and J.K. (Juraj Kurimský); formal analysis, M.R.; investigation, P.H. and R.C.; resources, R.C.; data curation, P.H.; writing—original draft preparation, P.H., R.C., J.K. (Jozef Király), J.K. (Juraj Kurimský) and S.B.; writing—review and editing, P.H., R.C. and M.R.; visualization, M.R. and B.D.; supervision, R.C.; project administration, R.C. and J.K. (Juraj Kurimský); funding acquisition, R.C. and J.K. (Juraj Kurimský). All authors have read and agreed to the published version of the manuscript.

Funding

This research was funded by the Ministry of Education, Youth, and Sports within the project VE-GA 2/0011/20 and 1/0154/21 and the Slovak Agency for Research and Development based on contracts no. APVV-15-0438, APVV-17-0372, and APVV-18-0160.

Data Availability Statement

The data presented in this study are available on request from the corresponding author. The data are not publicly available because it is confidential.

Acknowledgments

The authors acknowledge Katarina Paulovicova for preparation of the studied samples and Vladimir Girman and Maksym Lisnichuk for TEM imaging.

Conflicts of Interest

The authors declare no conflict of interest. The funders had no role in the design of the study.

References

  1. Ojha, S.K.; Purkait, P.; Chakravorti, S. Modeling of relaxation phenomena in transformer oil-paper insulation for understanding dielectric response measurements. IEEE Trans. Dielectr. Electr. Insul. 2016, 23, 3190–3198. [Google Scholar] [CrossRef]
  2. Kurimský, J.; Rajňák, M.; Bartko, P.; Paulovičová, K.; Cimbala, R.; Medveď, D.; Džamová, M.; Timko, M.; Kopčanský, P. Experimental study of AC breakdown strength in ferrofluid during thermal aging. J. Magn. Magn. Mater. 2018, 465, 136–142. [Google Scholar] [CrossRef]
  3. Thomas, P.; Hudedmani, N.E.; Prasath, R.T.A.R.; Roy, N.K.; Mahato, S.N. Synthetic ester oil based high permittivity CaCu3Ti4O12 (CCTO) nanofluids an alternative insulating medium for power transformer. IEEE Trans. Dielectr. Electr. Insul. 2019, 26, 314–321. [Google Scholar] [CrossRef]
  4. Mentlik, V.; Trnka, P.; Hornak, J.; Totzauer, P. Development of a Biodegradable Electro-Insulating Liquid and Its Subsequent Modification by Nanoparticles. Energies 2018, 11, 508. [Google Scholar] [CrossRef] [Green Version]
  5. Muangpratoom, P.; Pattanadech, N. Dielectric properties of mineral oil-based nanofluids under temperature variations. IET sci. Meas. Technol. 2019, 13, 1318–1325. [Google Scholar] [CrossRef]
  6. Saman, N.M.; Zakaria, I.H.; Ahmad, M.H.; Abdul-Malek, Z. Effects of Plasma Treated Alumina Nanoparticles on Breakdown Strength, Partial Discharge Resistance, and Thermophysical Properties of Mineral Oil-Based Nanofluids. Materials 2021, 14, 3610. [Google Scholar] [CrossRef]
  7. Kúdelčík, J.; Hardoň, Š.; Varačka, L. Measurement of Complex Permittivity of Oil-Based Ferrofluid in Magnetic Field. Acta Phys. Pol. A 2017, 131, 931–933. [Google Scholar] [CrossRef]
  8. Rajňák, M.; Timko, M.; Kopčanský, P.; Paulovičová, K.; Kuchta, J.; Franko, M.; Kurimský, J.; Dolník, B.; Cimbala, R. Transformer Oil-based Magnetic Nanofluid with High Dielectric Losses Tested for Cooling of a Model Transformer. IEEE Trans. Dielectr. Electr. Insul. 2019, 26, 1343–1349. [Google Scholar] [CrossRef]
  9. Hardoň, Š.; Kúdelčík, J.; Jahoda, E.; Kúdelčíková, M. The Magneto-Dielectric Anisotropy Effect in the Oil-Based Ferrofluid. Int. J. Thermophys. 2019, 40, 24. [Google Scholar] [CrossRef]
  10. Lee, M.; Kim, Y.-J. Thermomagnetic Convection of Ferrofluid in an Enclosure Channel with an Internal Magnetic Field. Micromachines 2019, 10, 553. [Google Scholar] [CrossRef]
  11. Kosterec, M.; Kurimský, J.; Cimbala, R.; Čonka, Z.; Kruželák, L.; Rajňák, M.; Timko, M.; Kopčanský, P.; Vargová, B. Analysis of Thermal Field in Mineral Transformer Oil Based Magnetic Fluids. Acta Phys. Pol. A 2017, 131, 937–939. [Google Scholar] [CrossRef]
  12. Rajňák, M.; Wu, Z.; Dolník, B.; Paulovičová, K.; Tóthová, J.; Cimbala, R.; Kurimský, J.; Kopčanský, P.; Sunden, B.; Wadso, M.; et al. Magnetic Field Effect on Thermal, Dielectric, and Viscous Properties of a Transformer Oil-Based Magnetic Nanofluid. Energies 2019, 12, 4532. [Google Scholar] [CrossRef] [Green Version]
  13. Kurimský, J.; Rajňák, M.; Cimbala, R.; Paulovičová, K.; Rozynek, Z.; Kopčanský, P.; Timko, M. Electrical discharges in ferrofluids based on mineral oil and novel gas-to-liquid oil. J. Mol. Liq. 2021, 325, 115244. [Google Scholar] [CrossRef]
  14. Kole, M.; Khandekar, S. Engineering applications of ferrofluids: A review. J. Magn. Magn. Mater. 2021, 537, 168222. [Google Scholar] [CrossRef]
  15. Bahiraei, M.; Hangi, M. Flow and heat transfer characteristics of magnetic nanofluids: A review. J. Magn. Magn. Mater. 2015, 374, 125–138. [Google Scholar] [CrossRef]
  16. Cimbala, R.; Havran, P.; Király, J.; Rajňák, M.; Kurimský, J.; Šárpataky, M.; Dolník, B.; Paulovičová, K. Dielectric response of a hybrid nanofluid containing fullerene C60 and iron oxide nanoparticles. J. Mol. Liq. 2022, 359, 119338. [Google Scholar] [CrossRef]
  17. Ghasemi, J.; Jafarmadar, S.; Nazari, M. Effect of magnetic nanoparticles on the lightning impulse breakdown voltage of transformer oil. J. Magn. Magn. Mater. 2015, 389, 148–152. [Google Scholar] [CrossRef]
  18. Šárpataky, M.; Kurimský, J.; Rajňák, M. Dielectric Fluids for Power Transformers with Special Emphasis on Biodegradable Nanofluids. Nanomaterials 2021, 11, 2885. [Google Scholar] [CrossRef]
  19. Aksamit, P.; Zmarzly, D.; Boczar, T.; Szmechta, M. Aging properties of fullerene doped transformer oils. In Proceedings of the 2010 IEEE International Symposium on Electrical Insulation, San Diego, CA, USA, 6 June 2010. [Google Scholar] [CrossRef]
  20. Huang, Z.; Wang, F.; Wang, Q.; Yao, W.; Sun, K.; Zhang, R.; Zhao, J.; Lou, Z.; Li, J. Significantly Enhanced Electrical Performances of Eco-Friendly Dielectric Liquids for Harsh Conditions with Fullerene. Nanomaterials 2019, 9, 989. [Google Scholar] [CrossRef]
  21. Hardoň, Š.; Kúdelčík, J.; Gutten, M. Dielectric Spectroscopy of Two Concentrations of Magnetic Nanoparticles in Oil-Based Ferrofluid. Acta Phys. Pol. A 2020, 137, 961–963. [Google Scholar] [CrossRef]
  22. Singh, J.; Sood, Y.R.; Verma, P. The influence of service aging on transformer insulating oil parameters. IEEE Trans. Dielectr. Electr. Insul. 2012, 19, 421–426. [Google Scholar] [CrossRef]
  23. Emara, M.M.; Mansour, D.-E.A.; Azmy, A.M. Dielectric properties of aged mineral oil filled with TiO2 nanoparticles. In Proceedings of the 2015 4th International Conference on Electric Power and Energy ConveFrsion Systems (EPECS), Sharjah, United Arab Emirates, 24–26 November 2015. [Google Scholar] [CrossRef]
  24. Abdi, S.; Boubakeur, A.; Haddad, A.; Harid, N. Influence of artificial thermal aging on transformer oil properties. Electr. Power Compon. Syst. 2011, 39, 1701–1711. [Google Scholar] [CrossRef]
  25. Yang, Z.; Zhou, Q.; Wu, X.; Zhao, Z. A Novel Measuring Method of Interfacial Tension of Transformer Oil Combined PSO Optimized SVM and Multi Frequency Ultrasonic Technology. IEEE Access 2019, 7, 182624–182631. [Google Scholar] [CrossRef]
  26. Rao, U.M.; Fofana, I.; Betie, A.; Senoussaoui, M.L.; Brahami, M.; Briosso, E. Condition monitoring of in-service oil-filled transformers: Case studies and experience. IEEE Electr. Insul. Mag. 2019, 35, 33–42. [Google Scholar] [CrossRef]
  27. Kohtoh, M.; Ueta, G.; Okabe, S.; Amimoto, T. Transformer insulating oil characteristic changes observed using accelerated degradation in consideration of field transformer conditions. IEEE Trans. Dielectr. Electr. Insul. 2010, 3, 808–818. [Google Scholar] [CrossRef]
  28. Alshehawy, A.M.; Mansour, D.-E.A.; Ghali, M.; Lehtonen, M.; Darwish, M.M.F. Photoluminescence Spectroscopy Measurements for Effective Condition Assessment of Transformer Insulating Oil. Processes 2021, 9, 732. [Google Scholar] [CrossRef]
  29. Zaengl, W.S. Application of dielectric spectroscopy in time and frequency domain for HV power equipment. IEEE Electr. Insul. Mag. 2003, 19, 9–22. [Google Scholar] [CrossRef]
  30. Liu, J.; Fan, X.; Zhang, Y.; Zheng, H.; Jiao, J. Temperature Correction to Dielectric Modulus and Activation Energy Prediction of Oil-Immersed Cellulose Insulation. IEEE Trans. Dielectr. Electr. Insul. 2020, 27, 956–963. [Google Scholar] [CrossRef]
  31. Hao, J.; Xie, Y.; Taylor, N. Frequency-Domain Spectroscopy of Oil and Oil-Impregnated Pressboard with DC Bias. IEEE Trans. Dielectr. Electr. Insul. 2022, 29, 370–377. [Google Scholar] [CrossRef]
  32. Li, L.; Ren, Q.; Xiao, S.; Yang, W.; Xiong, W.; Fu, B. Study of frequency domain dielectric properties of vegetable oil and mineral oil transformer. J. Eng. 2019, 2019, 1599–1601. [Google Scholar] [CrossRef]
  33. Grosse, C. A program for the fitting of Debye, Cole–Cole, Cole–Davidson, and Havriliak–Negami dispersions to dielectric data. J. Coll. Interf. Sci. 2014, 419, 102–106. [Google Scholar] [CrossRef]
  34. Iglesias, T.P.; Vilão, G.; Reis, J.C.R. An approach to the interpretation of Cole–Davidson and Cole–Cole dielectric functions. J. Appl. Phys. 2017, 122, 074102. [Google Scholar] [CrossRef]
  35. Raju, G.G. Dielectric Loss and Relaxation. In Dielectrics in Electric Fields: Tables, Atoms, and Molecules, 2nd ed.; Taylor Francis, CRC Press: Boca Raton, FL, USA, 2016; p. 796. [Google Scholar]
  36. Tian, F.; Ohki, Y. Electric modulus powerful tool for analyzing dielectric behavior. IEEE Trans. Dielectr. Electr. Insul. 2014, 21, 929–931. [Google Scholar] [CrossRef]
  37. Wübbenhorst, M.; Turnhout, J. Analysis of complex spectra. I. One-dimensional derivative techniques and three-dimensional modeling. J. Non-Cryst. Sol. 2002, 305, 40–49. [Google Scholar] [CrossRef]
  38. Paulovičová, K.; Tóthová, J.; Rajňák, M.; Timko, M.; Kopčanský, P.; Lisý, V. Nanofluid Based on New Generation Transformer Oil: Synthesis and Flow Properties. Acta Phys. Pol. A 2020, 137, 908–910. [Google Scholar] [CrossRef]
  39. Vékás, L.; Bica, D.; Avdeev, M.V. Magnetic nanoparticles and concentrated magnetic nanofluids: Synthesis, properties and some applications. China Particuology 2007, 5, 43–49. [Google Scholar] [CrossRef]
  40. Hou, J.G.; Zhao, A.D.; Huang, T.; Lu, S. C60-Based Materials. ChemInform 2005, 36, 409–474. [Google Scholar] [CrossRef]
  41. Kataby, G.; Prozorov, T.; Koltypin, Y.; Cohen, H.; Sukenik, C.N.; Ulman, A.; Gedanken, A. Self-Assembled Monolayer Coatings on Amorphous Iron and Iron Oxide Nanoparticles: Thermal Stability and Chemical Reactivity Studies. Langmuir 1997, 13, 6151–6156. [Google Scholar] [CrossRef]
  42. Kataby, G.; Cojocaru, M.; Prozorov, R.; Gedanken, A. Coating Carboxylic Acids on Amorphous Iron Nanoparticles. Langmuir 1999, 15, 1703–1708. [Google Scholar] [CrossRef]
  43. Havran, P.; Cimbala, R.; Bartko, P. Accelerated Thermal Aging of the Liquid Dielectrics. In Proceedings of the 2019 International IEEE Conference and Workshop in Óbuda on Electrical and Power Engineering (CANDO-EPE), Budapest, Hungary, 20–21 November 2019. [Google Scholar] [CrossRef]
  44. Dolník, B.; Molčan, P.; Hájnik, S. The Changes of Electrical Properties of ZnO-based Varistors Initiated with Current Pulses. In Proceedings of the 10th International Scientific Symposium ELEKTROENERGETIKA, Stará Lesná, Slovakia, 16 September 2019. [Google Scholar]
  45. Hu, Z.; Ma, K.; Wang, W.; Rafiq, M.; Zhou, Y.; Wang, Q.; Du, Y.; Li, C.; Lv, Y. Thermal Aging Properties of Transformer Oil-Based TiO2 Nanofluids. In Proceedings of the 2014 IEEE 18th International Conference on Dielectric Liquids (ICDL), Bled, Slovenia, 8 September 2014. [Google Scholar] [CrossRef]
  46. Subocz, J. Dielectric Spectroscopy of Composite Insulating Materials. In Proceedings of the ICSD’01, 2001 IEEE 7th International Conference on Solid Dielectrics (Cat. No.01CH37117), Eindhoven, The Netherlands, 7 August 2002. [Google Scholar] [CrossRef]
  47. Chmura, L.; Adeep, S.; van Nes, P.; Heller, R.; Mor, A.R.; Niasar, M.G.; Bergsma, D. DC Breakdown Behavior of Liquid-Solid Interfaces Formed in Silicone Based Materials. In Proceedings of the 2020 IEEE Electrical Insulation Conference (EIC), Knoxville, TN, USA, 22 June 2020. [Google Scholar] [CrossRef]
  48. Husnayain, F.; Latif, M.; Garniwa, I. Transformer Oil Lifetime Prediction Using the Arrhenius Law based on Physical and Electrical Characteristics. In Proceedings of the 2015 International Conference on Quality in Research (QiR), Lombok, Indonesia, 10 August 2015. [Google Scholar] [CrossRef]
  49. Hardoň, Š.; Kúdelčík, J.; Burry, P.; Gutten, M. Influence of Electric and Magnetic Fields on Dielectric Response of Oil-Based Ferrofluid. Acta Phys. Pol. A 2018, 133, 477–479. [Google Scholar] [CrossRef]
  50. Cimbala, R.; Bucko, S.; Kruželák, L.; Kosterec, M. Thermal degradation of transformer pressboard impregnated with magnetic nanofluid based on transformer oil. In Proceedings of the 2017 18th International Scientific Conference on Electric Power Engineering (EPE), Kouty and Desnou, Czech Republic, 17 May 2017. [Google Scholar] [CrossRef]
  51. Cimbala, R.; Havran, P.; Bartko, P. Comparison of behavior of electroinsulating oils using thermos-hysteresis dependencies. In Proceedings of the 2020 21st International Scientific Conference on Electric Power Engineering (EPE), Prague, Czech Republic, 19–21 October 2020. [Google Scholar] [CrossRef]
  52. Havran, P.; Cimbala, R.; Kurimský, J.; Dolník, B.; Kolcunová, I.; Medveď, D.; Király, J.; Kohan, V.; Šárpataky, Ľ. Dielectric Properties of Electrical Insulating Liquids for High Voltage Electric Devices in a Time-Varying Electric Field. Energies 2022, 15, 391. [Google Scholar] [CrossRef]
  53. Rajňák, M.; Franko, M.; Paulovičová, K.; Karpets, M.; Parekh, K.; Upadhyay, R.; Kurimský, J.; Dolník, B.; Cimbala, R.; Havran, P.; et al. Effect of ferrofluid magnetization on transformer temperature rise. J. Phys. D Appl. Phys. 2022, 55, 345002. [Google Scholar] [CrossRef]
  54. Hardoň, Š.; Kúdelčík, J. The influence of a magnetic field on the properties of ferrofluids based on new generation of transformer oil Shell. In Proceedings of the 2022 ELEKTRO (ELEKTRO), Krakow, Poland, 23–26 May 2022. [Google Scholar] [CrossRef]
  55. Shell Lubricants. Technical Paper. Available online: https://www.shell.com/promos/lubes/btb-products/the-perfect-partner/ (accessed on 30 October 2022).
Figure 1. Comparison of frequency spectra of three different dielectric models.
Processes 10 02405 g001
Figure 2. (a) Size distribution of magnetic nanoparticles. The window shows the size distribution of the magnetic core. (b) Size distribution of fullerene nanoparticles.
Processes 10 02405 g002
Figure 3. TEM image of the magnetic nanoparticles (a) and fullerene C60 nanoparticles (b).
Processes 10 02405 g003
Figure 4. Experimental measuring setup.
Processes 10 02405 g004
Figure 5. Dielectric loss spectra of GTL base oil during accelerated thermal aging.
Processes 10 02405 g005
Figure 6. Dielectric loss spectra of the sample with C60 during accelerated thermal aging.
Processes 10 02405 g006
Figure 7. Dielectric loss spectra of the sample with Fe3O4 during accelerated thermal aging.
Processes 10 02405 g007
Figure 8. Frequency dependences M″ = f(f) of the examined samples at 0 h of thermal aging.
Processes 10 02405 g008
Figure 9. Frequency dependences M″ = f(f) of the examined samples at 500 h of thermal aging.
Processes 10 02405 g009
Figure 10. Frequency dependences M″ = f(f) of the examined samples at 1000 h of thermal aging.
Processes 10 02405 g010
Figure 11. Frequency dependences M″ = f(f) of the examined samples at 1500 h of thermal aging.
Processes 10 02405 g011
Figure 12. Frequency dependences M″ = f(f) of the examined samples at 2000 h of thermal aging.
Processes 10 02405 g012
Figure 13. Frequency dependences M″ = f(f) of the examined samples at 3000 h of thermal aging.
Processes 10 02405 g013
Figure 14. Frequency dependences M″ = f(f) of the examined samples at 4500 h of thermal aging.
Processes 10 02405 g014
Figure 15. Cole–Cole diagram of GTL base oil during thermal aging.
Processes 10 02405 g015
Figure 16. Cole–Cole diagram of the sample with C60 during thermal aging.
Processes 10 02405 g016
Figure 17. Cole–Cole diagram of the sample with Fe3O4 during thermal aging.
Processes 10 02405 g017
Figure 18. Distribution of relaxation times of investigated fluids during accelerated thermal aging.
Processes 10 02405 g018
Table 1. Distribution of relaxation times during thermal aging.
Distribution of Relaxation Times α (-)
Aging Time (h)GTL Base OilC60 0.01 %w/VFe3O4 0.01 %w/V
00.01250.00280.0216
5000.02210.01250.0999
10000.02940.0110.0846
15000.01720.01790.0343
20000.02450.01790.0125
30000.04170.07870.0901
45000.05830.13510.0805
Publisher’s Note: MDPI stays neutral with regard to jurisdictional claims in published maps and institutional affiliations.

