Article

Arduino Soft Sensor for Monitoring Schizochytrium sp. Fermentation, a Proof of Concept for the Industrial Application of Genome-Scale Metabolic Models in the Context of Pharma 4.0

1
Departamento de Procesos Industriales, Facultad de Ingeniería, Universidad Católica de Temuco, Temuco 4781312, Chile
2
Departament of Chemical Engineering, Engineering Faculty and Center of Food Biotechnology and BIOREN, Universidad de La Frontera, Temuco 4811230, Chile
*
Author to whom correspondence should be addressed.
Processes 2022, 10(11), 2226; https://doi.org/10.3390/pr10112226
Submission received: 2 September 2022 / Revised: 11 October 2022 / Accepted: 21 October 2022 / Published: 29 October 2022

Abstract

:
Schizochytrium sp. is a microorganism cultured for producing docosahexaenoic acid (DHA). Genome-scale metabolic modeling (GEM) is a promising technique for describing gen-protein-reactions in cells, but with still limited industrial application due to its complexity and high computation requirements. In this work, we simplified GEM results regarding the relationship between the specific oxygen uptake rate (−rO2), the specific growth rate (µ), and the rate of lipid synthesis (rL) using an evolutionary algorithm for developing a model that can be used by a soft sensor for fermentation monitoring. The soft sensor estimated the concentration of active biomass (X), glutamate (N), lipids (L), and DHA in a Schizochytrium sp. fermentation using the dissolved oxygen tension (DO) and the oxygen mass transfer coefficient (kLa) as online input variables. The soft sensor model described the biomass concentration response of four reported experiments characterized by different kLa values. The average range normalized root-mean-square error for X, N, L, and DHA were equal to 1.1, 1.3, 1.1, and 3.2%, respectively, suggesting an acceptable generalization capacity. The feasibility of implementing the soft sensor over a low-cost electronic board was successfully tested using an Arduino UNO, showing a novel path for applying GEM-based soft sensors in the context of Pharma 4.0.

1. Introduction

A soft sensor is a mathematical model that uses online measured variables to estimate another associated that cannot be directly measured with electronic probes. Soft sensors are part of the modernization efforts started by the process analytical technologies guidelines, PAT [1], and later concepts such as Pharma or Fermentation 4.0 [2,3,4]. This digitalization of bioprocesses, part of industry 4.0, has been fueled by the incorporation of computers and low-cost electronic boards, such as Arduino [5,6,7]. The soft sensor estimation method is designed offline using previous knowledge of the process represented in the form of mathematical models that allow making input–output associations [7,8]. Soft sensors have been used to estimate the specific growth rate, biomass, product concentration, and the specific oxygen uptake rate of the biomass of various microorganisms [4,6,9,10]. State of the art shows that the most common input variables used in research to estimate the specific growth rate are data from spectrophotometry and gas analyzers [4,11,12], sensors not often present in industrial fermentation setups. Depending on the complexity of the soft sensor, its implementation can require computers with a high computational capacity [13] and the use of additional microcontrollers for data acquisition [6,14].
Genome-scale metabolic models (GEMs) are the mathematical representation of gene-protein-reactions in cells through a network of chemical reactions reconstructed from the genome and literature [15]. GEMs can be used to analyze fluxes and metabolic responses using constraint-based modeling approaches for determining the biotechnological potential of certain strains [16]. Flux balance analysis (FBA) allows calculating the optimal flow of metabolites from a network input to a network output [17]. The optimal flux solutions predicted by FBA are often not unique [18]. Flux variability analysis (FVA) can be used to identify the range of possible fluxes to reduce the solution space [19,20]. Dynamic flux balance analysis (dFBA) is an established approach used to obtain metabolite and biomass concentration through metabolic functions [21]. The dFBA performs FBA iteratively at each time point, where the estimated fluxes are used to calculate the nutrient uptake kinetics [22]. The use of dFBA appears as a powerful tool to estimate microbial dynamics related to the state of the cells and the effects of substrate limitation [23]. Moreover, artificial intelligence and machine learning methods applied in conjunction with GEMs have attracted recent attention due to the potential improvement of prediction capabilities for certain strains [24,25,26] and the reduction of the computing effort when running the models [27,28]. Nevertheless, the use of GEMs and the related optimization algorithms have had limited industrial application due to their computation requirements, which exceed those of traditional off-the-shelf electronic control and monitoring equipment offered in the market [29].
Thraustochytrids are aerobic and heterotrophic microorganisms. Particularly, those of the genus Schizochytrium have been used to produce the economically valuable docosahexaenoic acid molecule (DHA, C22:6n-3) through industrial-scale fermentation [30,31]. Improving the productivity of lipids and DHA in thraustochytrid fermentation is an active research topic [31,32,33,34,35,36,37]. Thraustochytrid fermentations are complex and highly affected by culture conditions. Dissolved oxygen concentration and the volumetric oxygen mass transfer coefficient (kLa) are factors known to affect lipids and DHA accumulation in Schizochytrium strains [38,39,40]. After a rigorous literature search, only one work [38] has explicitly reported comparative pilot-scale experiments with dissolved oxygen, oxygen mass transfer coefficients with step changes, biomass, substrate, lipids, and DHA concentration values throughout the fermentation runs.
Regarding our research, three main knowledge gaps have been identified:
  • A method for adapting GEM estimations into an online soft sensor for culture fermentation monitoring has not yet been reported.
  • No research has stated if a soft sensor can be implemented directly into low-cost electronic boards instead of computers.
  • No reported mathematical model has been able to describe the effect of dissolved oxygen on biomass growth and DHA accumulation of Schizochytrium sp.
In this work, a soft sensor for monitoring a Schizochytrium sp. carbon fed-batch fermentation was proposed. The soft sensor was based on a mathematical model and the dynamic relationship between the specific oxygen uptake rate (rO2), the specific growth rate (µ), and the specific lipid synthesis rate (rL). The relationship between these rates was first analyzed using a GEM. The GEM results were then simplified using an evolutionary algorithm and tuned to describe reported data [38] of four experiments of Schizochytrium sp. fermentation. The possibility of implementing the algorithm with a low-cost electronic board was tested using an Arduino UNO, considering offline data and the previously determined model parameters received from a computer connected through the serial port of the electronic board.

2. Materials and Methods

2.1. Mathematical Model for Schizochytrium Carbon-Fed-Batch Fermentations

In a carbon-fed-batch fermentation of Schizochytrium sp., nitrogen and carbon sources are added at the beginning of the culture, with the later addition of only a carbon source to maintain a stable concentration. The total biomass (TB) was equal to the sum of the biomass free of neutral lipids (LFB) and the neutral lipids (L) accumulated in the cells:
TB = LFB + L
Shortly after the depletion of nitrogen sources, the concentration of the active part of biomass (X) should remain constant; increases in the LFB can occur due to lipid turnover in the form of carbohydrates. However, additional active biomass has no catabolic activity [41,42,43]:
X = LFB(tN = 0)
Regarding the stoichiometric reaction, assuming that the carbon and nitrogen sources were glucose (S) and glutamate (N), respectively, the synthesis of active biomass (X’) depends on the specific growth rate µ:
a1S’ + b1N’ + c1O2′ (μ →) X’+ d1CO2′
with (’) representing variables expressed in mol units. Similarly, a simplified stoichiometric reaction for the synthesis of neutral lipids (L’) depends on the specific rate of lipid synthesis:
a2S’ + c2O2′(rL →) L’ + d2CO2′
Reactions in Equations (3) and (4) are lumped equations that include biochemical reactions needed for the synthesis of the active biomass, neutral lipids, and the energy required. The fermentation model was represented by a set of differential equations for each component in the culture medium as follows:
dX/dt = μX
dL/dt = rLX
dN/dt = −μX/Y(X/N)
dS/dt = −(μ/Y(X/S) + ms + rL/Y(L/S))X
dO2/dt = OTR − rO2X
OTR = kLa(O2* − O2)
In these equations, the volume change was assumed to be negligible, considering that the culture is continuously fed with a highly concentrated carbon source solution. In Equation (10), OTR is the oxygen transfer rate, kLa is the volumetric oxygen mass transfer coefficient, and O2* the oxygen concentration of the culture broth in equilibrium with the partial pressure of oxygen in the gas used for aeration. The dissolved oxygen level measured by a dissolved oxygen sensor (DO) is related to the oxygen concentration in the culture (O2) by:
O2 = O2*∙DO/100%
The fraction between DHA and lipids is constant when no important oxygen-related limitation occurs [44]:
DHA(t) = kDHA∙L(t)
Stoichiometric reactions (Equations (3) and (4)) are related to the kinetic relations in Equations (7)–(9) through the yield and maintenance coefficients:
Y(X/S) = MX/a1∙MS; Y(X/N) = MX/b1∙MN; Y(X/O2) = MX/c1∙MO2; Y(X/CO2) = MX/d1∙MCO2
Y(L/S) = ML/a2∙MS; Y(L/O2) = ML/c2∙MO2; Y(L/CO2) = ML/d2∙MCO2
where Mi are the molecular weights of the i components. The rates measured in mol/h can be represented in g/h, using the molecular weight. If c1 and c2, which describe the relationship between r’O2-µ and r’O2-r’L, respectively, are known, μ and r’L can be calculated:
μ = r’O2/c1
r’L = r’O2/c2
rL = r’L∙ML
An estimate of rO2 can be obtained from reordering Equation (9), using online measurements of dissolved oxygen level and the value of kLa:
rO2= (kLa(O2* − O2) − dO2/dt)/X
For solving the derivative term in Equation (5), the finite approximation was used as follows, with ∆t depending on the sample time of the input data:
dX/dt ≅ (X(t) − X(t − ∆t))/∆t

2.2. Kinetic Relationships on Thraustochytrid Culture Described by a GEM

To analyze the relationship of the specific oxygen uptake rate (rO2) on the specific growth rate (µ) and the specific rate of lipid synthesis (rL), a GEM for an Oblongichytrium strain, a microorganism of the same Schizochytrium family, was used [45]. The GEM distinguishes a biomass equation representing the growth of the active part of the biomass and a different reaction for the synthesis of storage lipids. Flux distribution in the reaction network depends on the specific nutrient (glucose, glutamate, oxygen) consumption rates. FBA [46] was used to determine the maximum specific growth rate of the active biomass in the solution space constrained by the given values of lower bounds assigned to the specific consumption rates of glucose (−r’(S,lb)), glutamate (−r’(N,lb)), and oxygen (−r’(O2,lb)). Although the maximum specific growth rate estimate with FBA is unique, this solution can be obtained with different flux distributions. FVA was carried out to determine the maximum specific rate of lipid synthesis (rL’) that can be obtained when the biomass grows at the maximum rate [20]. The specific rate of nutrients and oxygen consumption were assumed to be equal to the minimum (absolute) values given by FVA, after the flux through the reactions that produce the active biomass and lipids were fixed to their maximum values. This was conducted to avoid the synthesis of other products that might consume oxygen, require energy, or produce CO2 or other metabolites. Results obtained with FBA and FVA solutions were compared with those determined by minimizing the norm of the fluxes, a strategy suggested for loop-removing and for detecting possible thermodynamic inconsistencies [47].
In this work, the theoretical values of the coefficients in Equation (3) were calculated as:
a1 = |−r’S|/max(μ); b1 = |−r’N|/max (μ); c1 = |−r’O2|/max (μ)
In the same way, stoichiometric coefficients in the simplified reaction for lipid synthesis were obtained, assuming that only the carbon source was consumed for neutral lipid (energy storage) synthesis in this reaction (Equation (4)):
a2 = |−r’S|/max (r’L); c2 = |−r’O2|/max (r’L)
The molecular weight of the biomass was considered as 1 g/mmol [48], and the molecular weight of the neutral lipids was obtained from the lipid profile reported [45], as 0.848 g/mmol.
All GEM simulations were performed using MATLAB R2017b and the COBRA toolbox software packages with Gurobi LP/MILP solvers (version 8.1.1, Gurobi Optimization, Inc., Houston, TX, USA).

2.3. Evolutionary Algorithm for Simplified Kinetic Relations

The initial r’O2-µ-r’L relationship obtained from the GEM was simplified and tuned to data reported [38] using an evolutionary algorithm. The evolutionary algorithm was implemented in MATLAB R2017b (MathWorks Inc., Natick, MA, USA), minimizing the normalized root mean square error (NRMSE), here E, between the estimated Z ^ and the experimental data Z, calculated as:
E ( % ) = k = 1 n ( Z k Z ^ k ) 2 n Z m a x Z m i n · 100
The evolutionary algorithm parameters were as follows: 110 individuals in every generation, each consisting of six parameters (µmax, rLmax, kc1, kc2, kDHA, and YX/N), and elitism of 10/110. Ten new groups of parameter values were obtained from every elite individual. The new individual consisted of the random multiplication of three of the six parameters by another random number between (0.5, 1.5) at each iteration. The initial solution consisted of the initial values obtained from the GEM, randomly multiplied by a value in the range (0.5, 1.5). Training data consisted of the experiments performed at kLa = 27.3, and 150.1 h−1 [38]. Validation data for avoiding under- and overfitting corresponded to the experiment with kLa = 88.5 h−1 [38]. The evolutionary algorithm was restarted 100 times and executed 1000 epochs. Then the following analysis over the error per epoch was performed: when the error between the validation data increased after a continuous decrease, the set of values for this iteration and epoch was stored. Testing of the model generalization capacity was performed over the fourth experiment, which consisted of kLa = 150.1 h−1 from t = 0 to t = 40 h, and then after kLa = 88.5 h−1 [38] which corresponded to data not used in the training stage.

2.4. Reported Data Used for Parameter Fitting

Experimental data reported in [38] were used to train and validate the soft sensor. In that study, Schizochytrium sp. HX-308 was grown in carbon fed-batch cultures (glucose was fed to keep its concentration above 15 g/L) performed with different agitation rates and aeration rates to modify the volumetric oxygen mass transfer coefficient (kLa) at values determined as 27.3 h−1 (100 rev/min, 1 vvm), 88.5 h−1 (200 rev/min, 1 vvm), and 150.1 h−1 (250 rev/min, 1.4 vvm), with kLa values calculated following a similar method [39,49]. The reported data also showed a two-stage oxygen supply control strategy in which, during the first 40 h, kLa was controlled at 150 h−1 and then decreased to 88.5 h−1. The inoculum preparation steps determine the initial concentration of the biomass and lipid content of this biomass. These protocols provide cultures having biomass concentration and composition with a low variability for starting the fermentation under study.

2.5. Soft Sensor Testing on Electronic Board

The soft sensor based on relationships in Equations (5)–(7), (9)–(12) and (16)–(20) was implemented in an Arduino UNO electronic board (Arduino CC, Turin, Italy), specifically on the ATmega328P microcontroller. The Arduino UNO was programmed using the Arduino IDE Software (Arduino CC, Italy) for receiving an array of data consisting of time, dissolved oxygen concentration, and kLa. After receiving the input array, the microcontroller calculated the kinetic parameters (rO2 followed by µ and rL) and then estimated the concentrations (X, N, L, and DHA); these values were returned through the microcontroller serial output. All calculations for testing and plotting the results of the soft sensor were performed in Arduino UNO (The algorithms used in this work can be downloaded at: https://www.researchgate.net/publication/363696038_Suplementary_Materials_Alarcon_Shene_2022 (accessed on 20 October 2022)).

3. Results

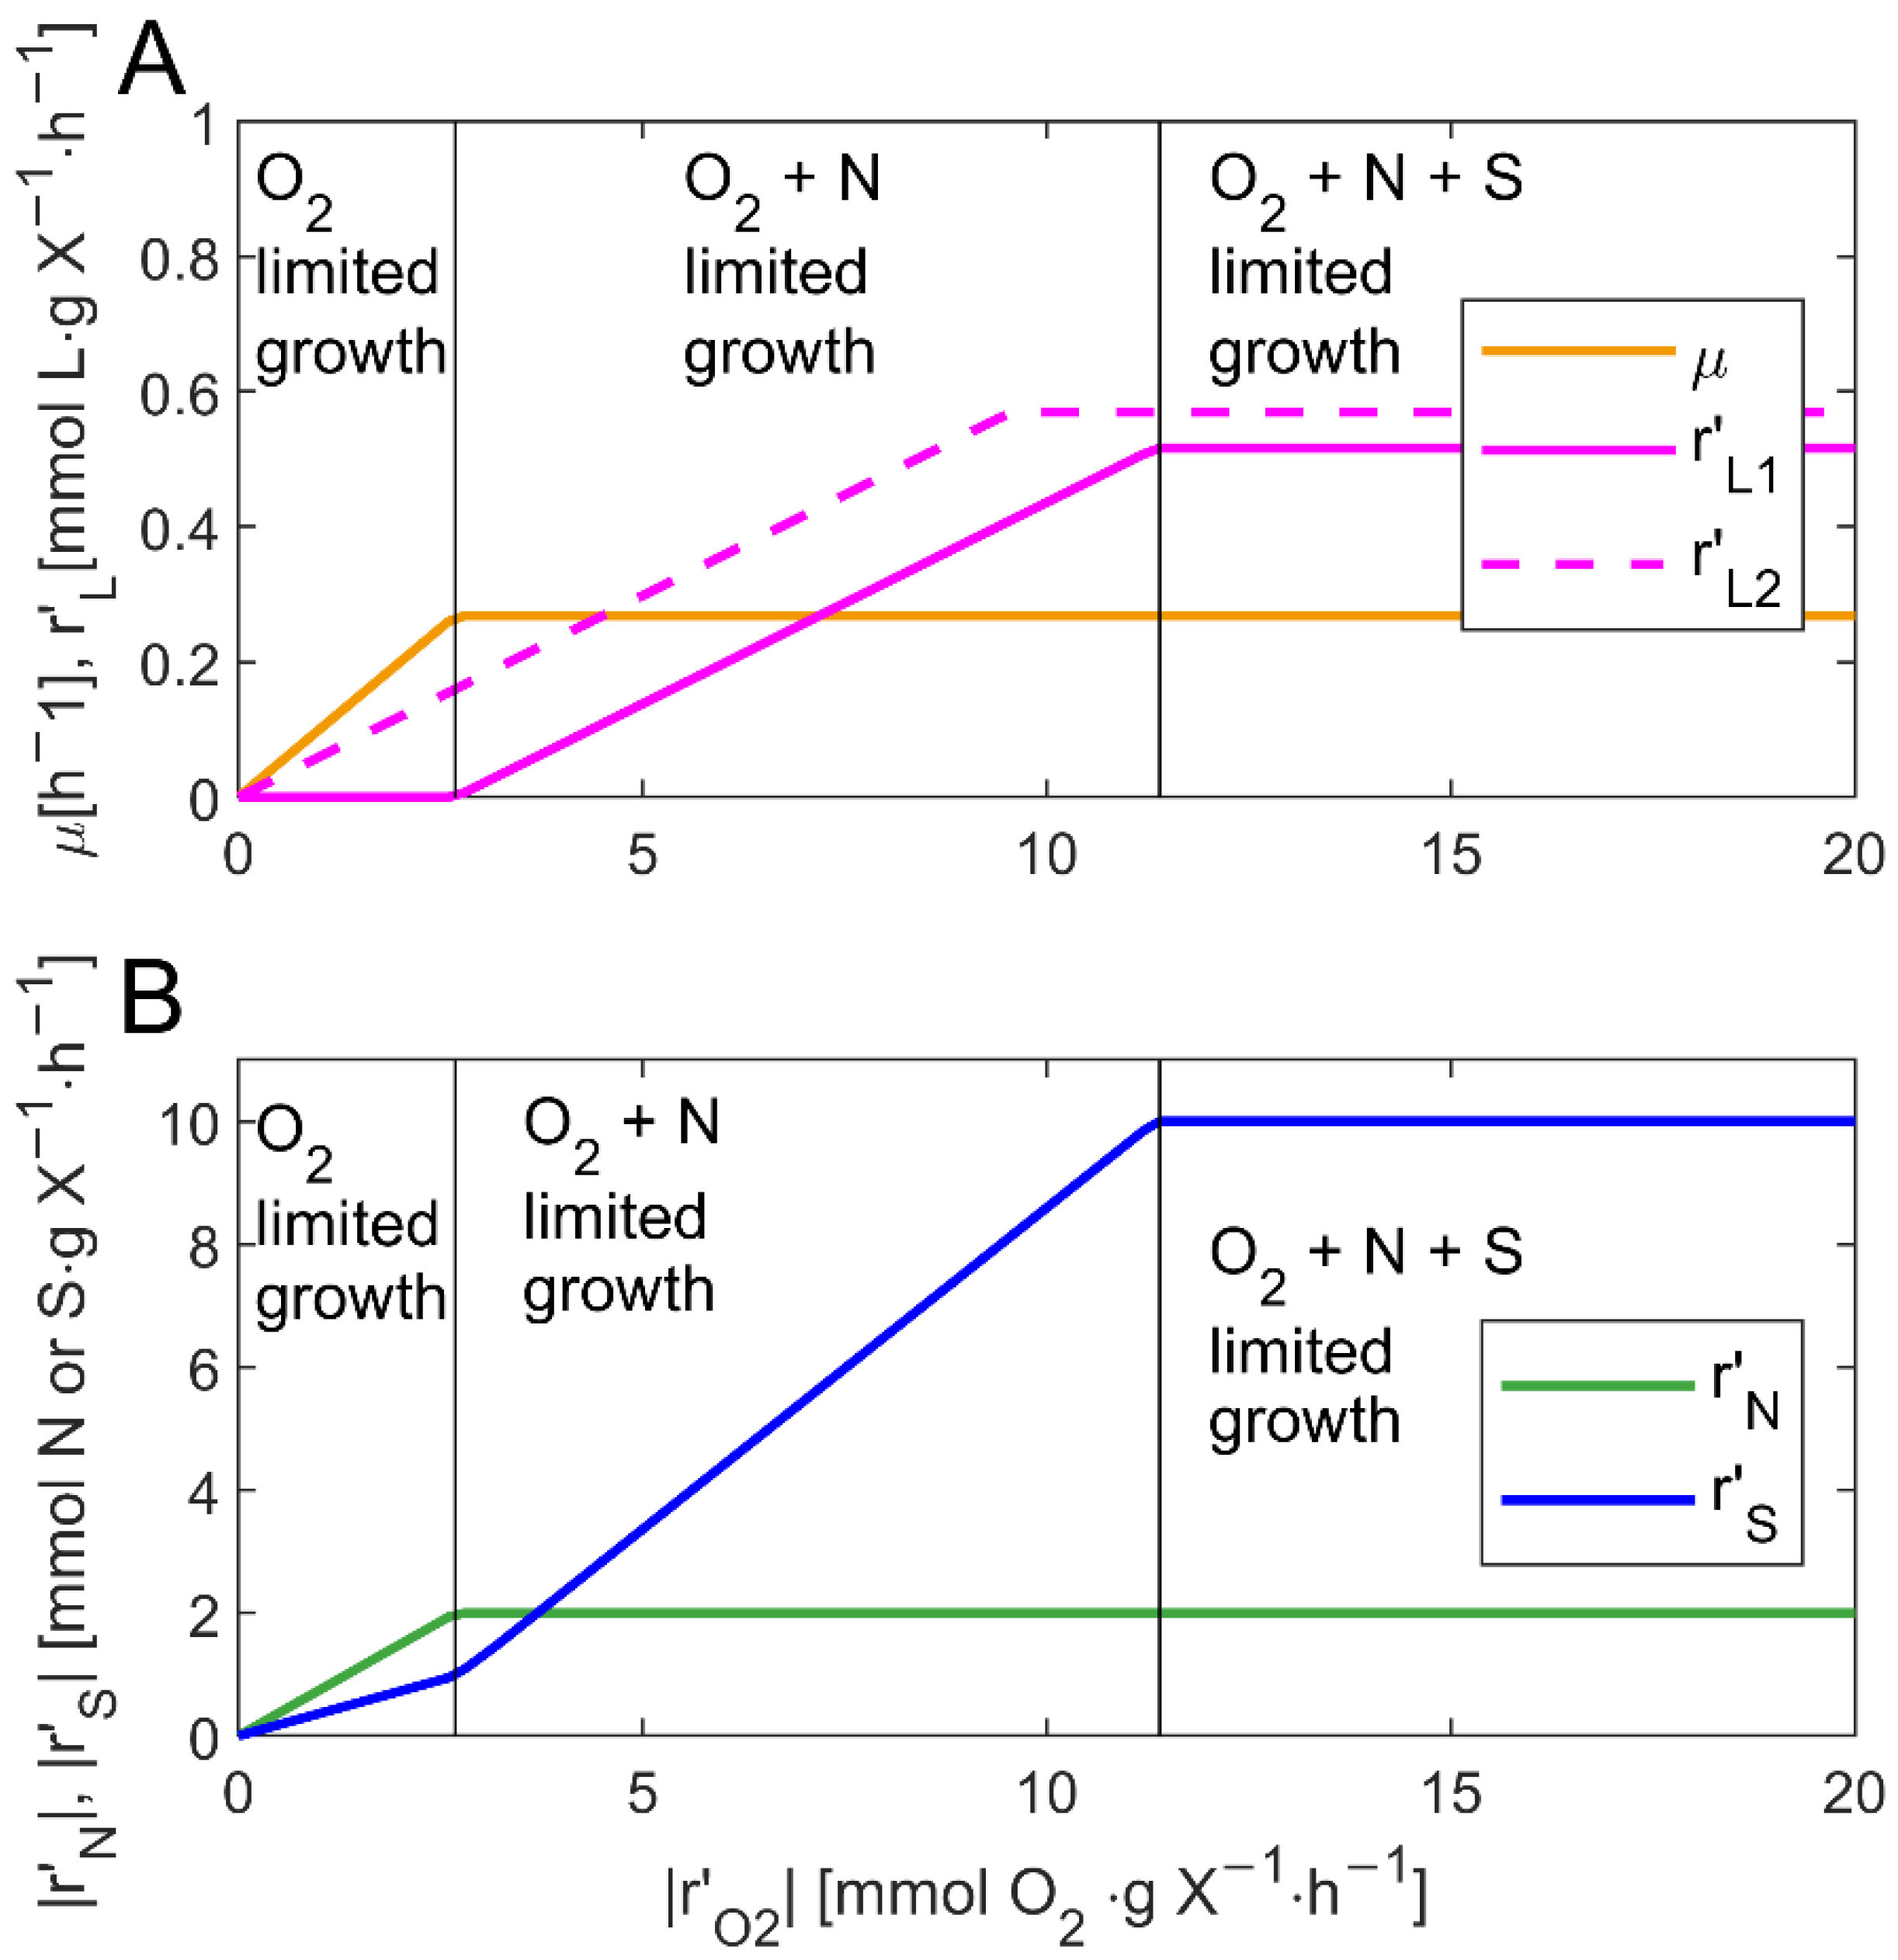
3.1. Effect of Nutrient and Oxygen Consumption on the Growth and Lipid Synthesis by Thraustochytrids Analyzed Using GEM

Figure 1A shows the results obtained with GEM. Results in Figure 1 were obtained assuming that the specific rate of ATP synthesis for maintenance |r’ATP,m| was zero. When this rate is different from zero, the specific growth rate will be equal to zero if the specified |−r’O2,lb| does not allow the production of the energy for maintenance. The specific growth rate of the active biomass (µ) is shown as a function of the lower bound of the specific oxygen uptake rate |−r’O2,lb|, when the lower bound of the specific consumption rates of glucose |−r’S,lb| and glutamate |−r’N,lb| were fixed at 10 mmol S/(g X∙h) and 2 mmol N/(g X∙h), respectively. In Figure 1A,B, each µ value is the maximum for the given set of |−r’O2,lb|, |−r’S,lb|, and |−r’N,lb| values, and one or more of these will be the limiting factor. As |−r’O2,lb| increases, µ increases linearly because cell growth is limited by oxygen consumption for the specified lower bounds of the specific glucose and glutamate consumption rates. In the range of low values of |−r’O2,lb| < 2.7 (mmol O2/gX∙h), all the consumed glucose and oxygen were used in the synthesis of active biomass. When |−r’O2,lb| was equal to 2.7 (mmol O2/g X∙h), µ reached a maximum, with no further increases possible because the specific consumption rate of glutamate is equal to |−r’N,lb| (Figure 1B). Further increases in |-r’O2,lb| allow the synthesis of lipids through the consumption of glucose (lipids synthesis does not require glutamate). Figure 1A shows that r’L (r’L1) increased as |−r’O2,lb| increased. For comparison, Figure 1A also shows changes in r’L (r’L2) when biomass growth is not allowed. In this case, r’L is different from zero as soon as |−r’O2,lb| is different from zero. The results presented in Figure 1 were obtained for the specified composition of active biomass and fatty acids in the neutral lipids in the original GEM [45], in specific culture conditions that resulted in the growth of active biomass (first), followed by lipids synthesis.

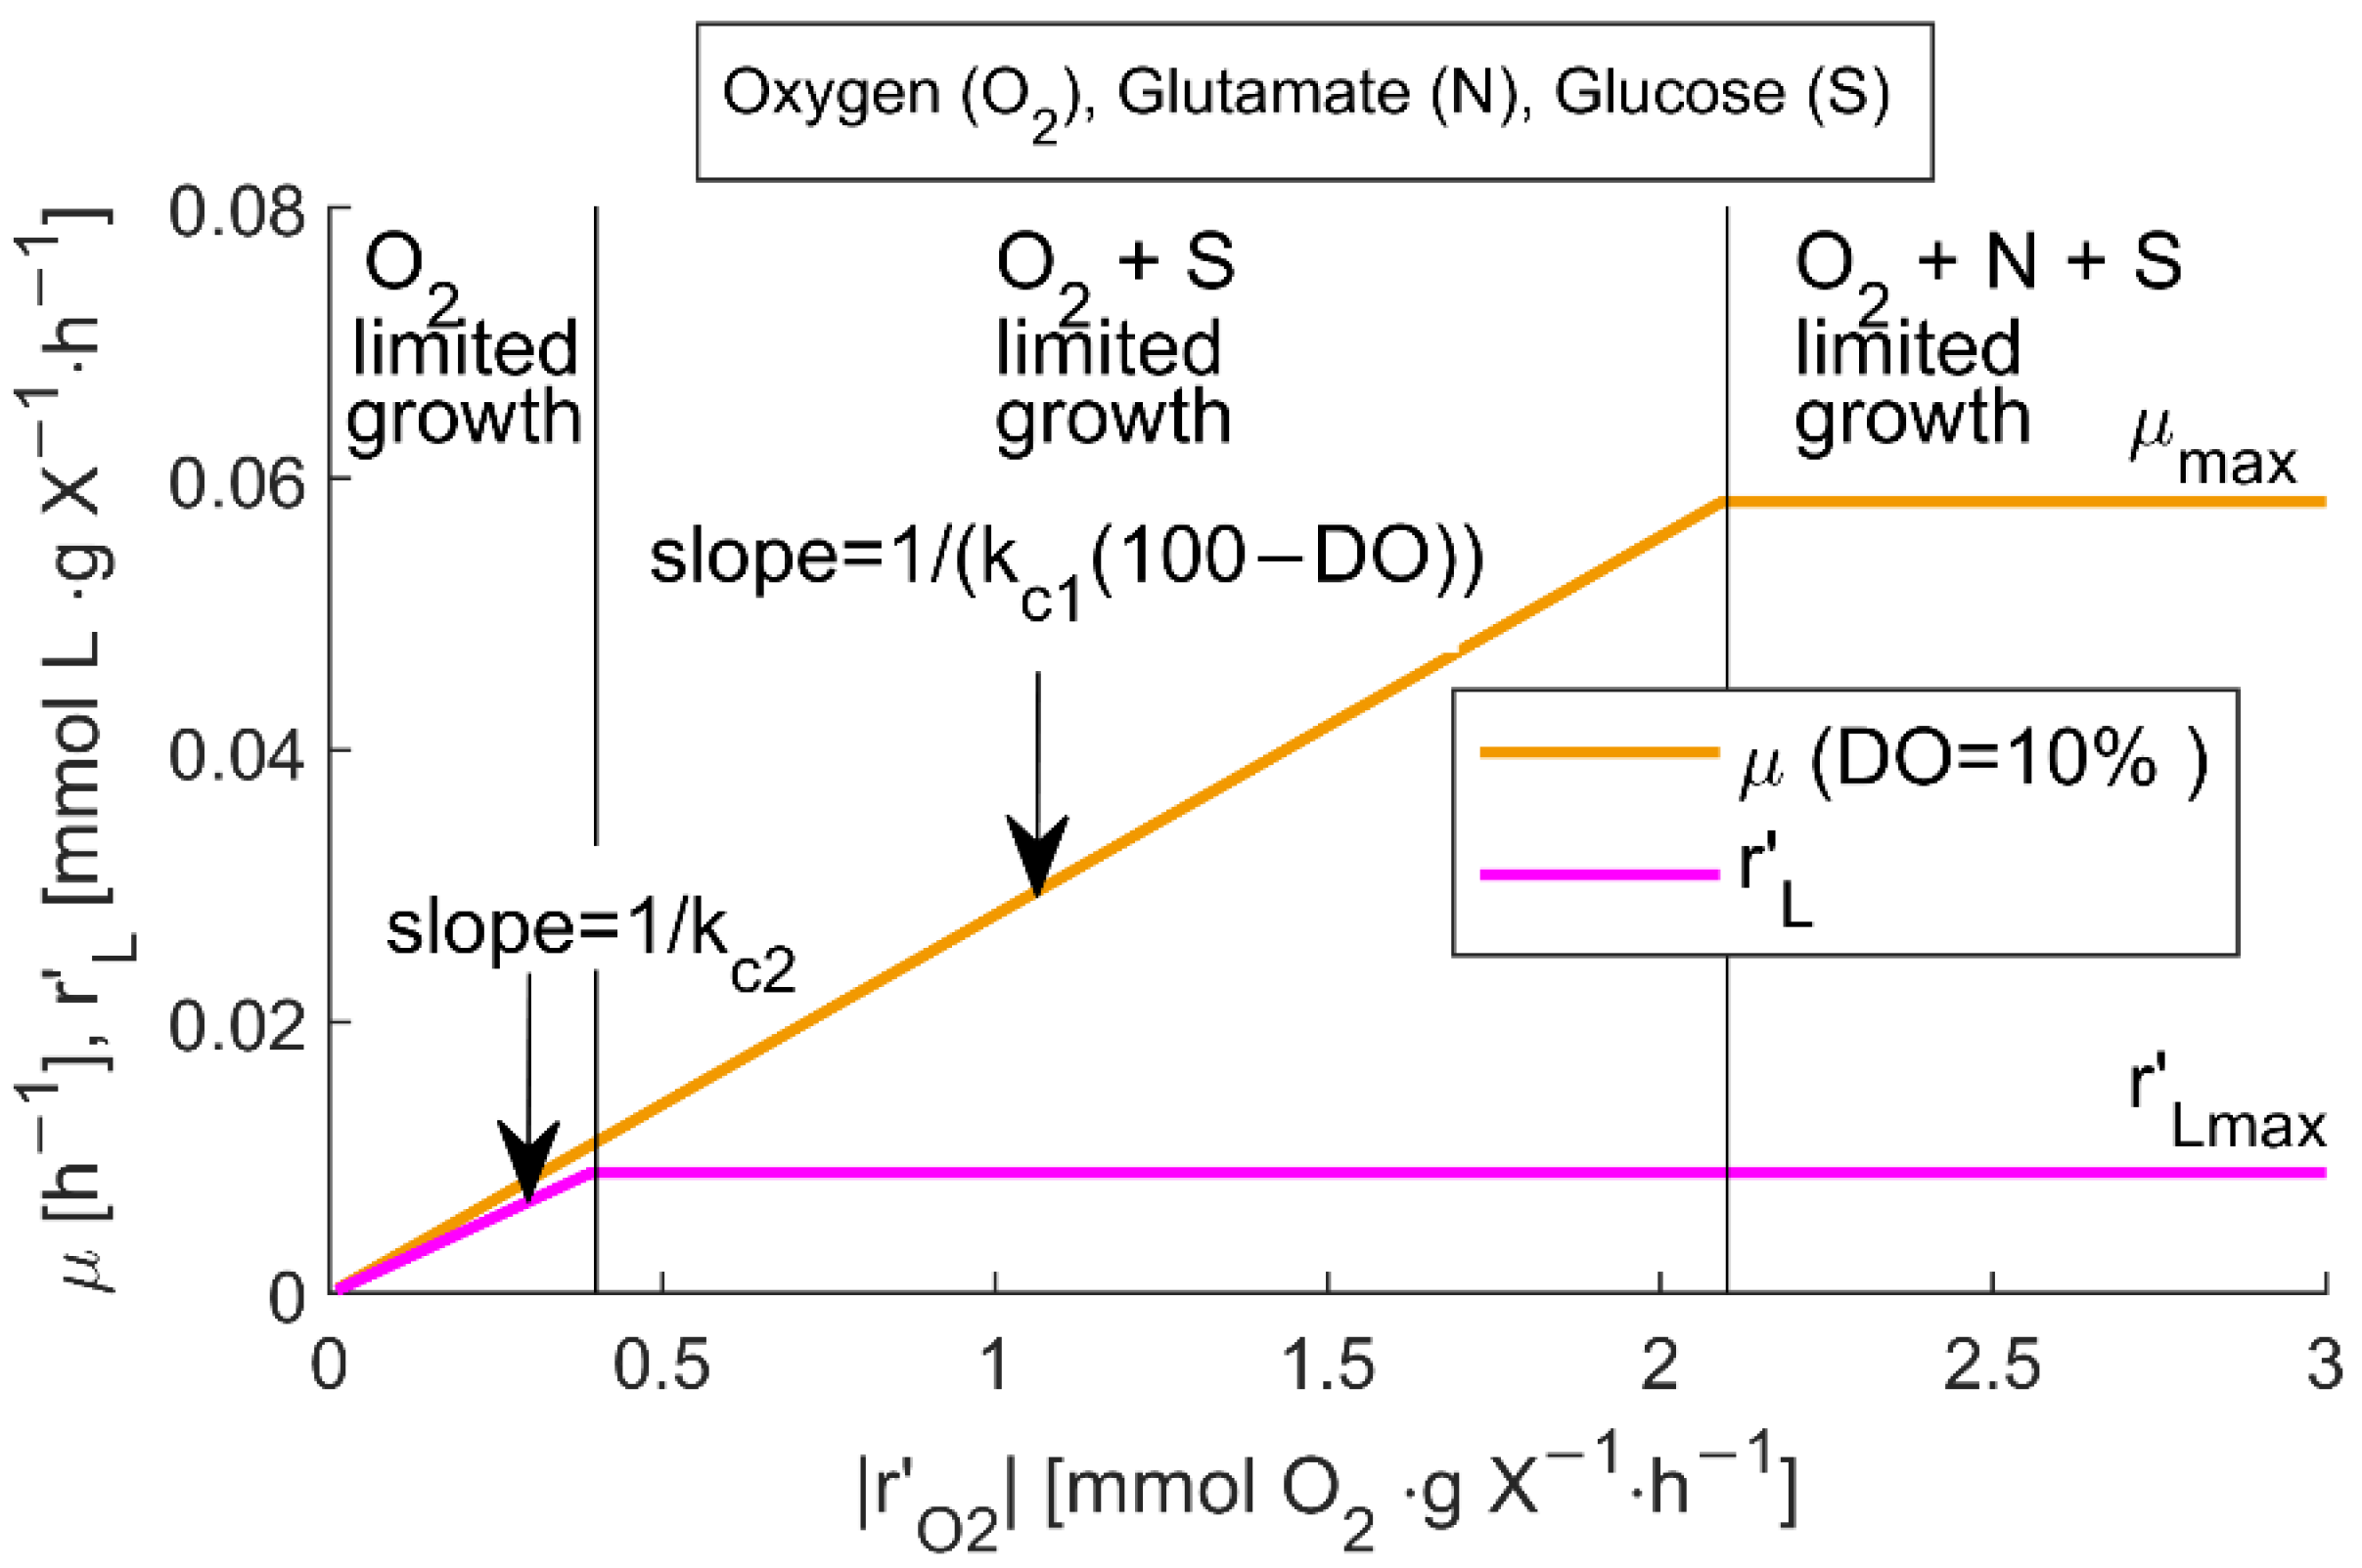
3.2. Mathematical Model for the Soft Sensor Using Simplified GEM Results

Figure 2 shows the relationship between r’O2-µ-r’L based on the simplification of the results shown in Figure 1 using the evolutionary algorithm, which adjusted the mathematical model (Equation (5) to Equations (7), (12) and (18)) to reported data [38]. The presence of µ’max and r’Lmax in the relationships are insights provided by the GEM, based on the lower bound of the specific consumption rates of glucose |−r’S,lb| and glutamate. Figure 2 describes a culture in which the specific growth rate of active biomass, µ, and the rate of lipid accumulation, r’L are linearly related with |r’O2| while DO is constant and the lower bounds of carbon and nitrogen consumption are not reached. This linear relationship ends at r’O2 = rLmax∙kC2 which accounts for 0.393 (mmol O2/(gX∙h); over this |r’O2| value, rL remain at rLmax. In the case of µ, the linear relationship with |r’O2| ends at r’O2 = µmax∙kC1∙(100-DO), which is equal to 2.093 (mmol O2/gX∙h) when DO = 10%; further increases in |r’O2| do not affect the values of µ which remain at µmax. The simplified r’O2-µ-r’L relationship (shown in Figure 2) does not explicitly require values of |−r’O2|, |−r’S| or |−r’N|.
Table 1 shows the parameters used for describing all four experimental runs using the r’O2-µ-r’L simplified relationship (Figure 2) and the mathematical model (Equation (5) to Equations (7), (12) and (18)) using the initial state of the system (given by the initial concentrations of X, N, L, and DHA), kLa, and the online measurements of DO. Parameters were adjusted with the evolutionary algorithm, considering exp I and II for training, exp III for validation, and exp IV for testing.

3.3. Soft Sensor Implemented in Arduino UNO

Figure 3 shows the soft sensor estimations implemented over the Arduino UNO board. The average normalized mean square error (Equation (22)) for the concentration of active biomass (Xerror), glutamate (Nerror), lipids (Lerror), and DHA were in all cases, below 5% (Table 1). The Arduino UNO microcontroller had stored in its internal memory the parameters of the model (Table 1), acquiring the inputs (time of the measurement, the dissolved oxygen level DO, and the value of the volumetric oxygen mass transfer coefficient kLa) at each time step through a serial communication port. The soft sensor algorithm implemented in Arduino UNO calculated the time variation for dissolved oxygen concentration (dDO/dt). This value was used for estimating |rO2| (Equation (19)) from which µ and rL were calculated. The use of float variables in Arduino UNO, allowed the calculation of X, N, L, and DHA with six digits after the decimal point.

4. Discussion

GEMs are the most comprehensive mathematical models available for describing certain cell strains with complex behavior. GEMs consider a constant cell composition that in practice depends on the environment conditions. One source of variability in cell composition is the accumulation of lipids (or carbohydrates in other systems) triggered by changes in the culture medium (such as nitrogen exhaustion). Due to this, in this work, the cell biomass was assumed to be formed by the active biomass and the stored lipids (Equation (1)), which is an approach that has been used to model the growth of a related thraustochytrid [45]. It is known that the accumulation of certain metabolites is related to changes in phenotypic traits, which will also impact the behavior of the strain. Recent literature offers some approaches for dealing with this situation [50], however, this level of detail is above the scope of the present work, and can be considered as part of the limitation of the presented model.
The direct use of GEM for fermentation monitoring was not investigated further in this work, considering the high computational requirements of the algorithms over the hardware (computing power, volatile memory, and data storage) which are incompatible with the capabilities of off-the-shelf industrial control equipment. Instead, our research focused on using predictions of GEM to derive a relationship between the kinetic terms: r’O2, µ, and r’L (Figure 2) that can be used in a soft sensor capable of being implemented over low-cost electronic hardware. This relationship was derived from GEM predictions shown in Figure 1. The simulations were made considering the specific rate of ATP synthesis for maintenance was zero. GEM predictions with a specific rate of ATP synthesis for maintenance different from zero (not shown) showed that biomass growth and lipid synthesis were not allowed until the lower bound of the specific rate of oxygen consumption has a value that allow the synthesis of ATP for maintenance. In this case, the maximum value for the specific lipid synthesis was lower than the value obtained when the specific rate of ATP synthesis for maintenance was set to zero (Figure 1), a difference that is explained because a fraction of the consumed carbon is used for the synthesis of ATP. Regarding the comparison between the fluxed obtained using FBA and FVA, and those determined by minimizing the norm of the fluxes for detecting possible thermodynamic inconsistencies, no differences were detected.
The reported GEM [45] assumed that if the N source is available, the growth of active biomass was favored first, and then afterward, the lipids synthesis. This assumption, successfully used in the reported work, was tested here but proved insufficient to describe the experimental data [38]. For the case study of Schizochytrium sp., parameters in the simplified relationship (graphically shown in Figure 2) were obtained by the evolutionary algorithm in which growth of the active biomass and lipid synthesis can occur simultaneously even at low r’O2 values, a consideration that coincides with the observation reported by others [44]. In Figure 2, after reaching the highest specific rate of lipid synthesis, with r’O2 = 0.393 (mmol O2/g X∙h), the specific growth of active biomass can still increase if r’O2 increases. The behavior of the specific lipid synthesis rate as a function of r’O2 could be explained by metabolic limitations rather than oxygen and glucose uptake limitations. Moreover, for values of r’O2 above 2.093 (mmol O2/g X∙h), further increases in the specific growth of active biomass would not be possible due to oxygen, nitrogen, and carbon uptake limitations. Then, after glutamate is depleted, the consumed oxygen is only used for lipid synthesis. When deriving the mathematical model for the soft sensor, it was considered that glucose depletion limited neither cell growth nor lipid synthesis as the fermentations were performed with a glucose concentration controlled above 15 g/L [38,44].
The simplified version of the r’O2-µ-r’L (shown in Figure 2) allowed its further testing on the low-cost Arduino electronic board, a transition not possible with the direct use of GEM. The adapted relationship, in our opinion, is one of the main contributions of this work and shows a novel path for using GEM prediction in low-cost hardware, one of the main challenges for GEM industrial application, as stated by others [29]. This resulted in a soft sensor that uses typical inputs from online sensors with software requirements at a level compatible with typical control equipment hardware. Additionally, the implementation of the soft sensor on the Arduino UNO explored the capabilities of using the electronic board not only for data acquisition, as was previously shown [5,6,14], but for the complete algorithm execution without the need for an additional computer; results not previously presented in the related literature, which translate into a cost reduction when compared to the cost of an implementation that requires an additional computer.
An evolutionary algorithm was used for parameter adjustment in the simplified r’O2-µ-r’L relationship (shown in Figure 2). With regard to the optimization algorithm, gradient-based methods are useful when analyzing solution spaces with few local minima points. Considering that no previous information about the solution space was available, and that the quantity of local minima points was unknown, a direct search algorithm was preferable. For this reason, an evolutionary algorithm appeared as the preferable option. Evolutionary algorithms are considered part of the so-called artificial intelligence techniques, methods that are increasingly used in soft sensor implementations to speed up online estimation [27,28].
The development presented in this work differentiates from the recent literature, considering that here, the objective was not to speed up the solution of GEM but rather to reduce the computational complexity of the model for its implementation with low-cost hardware and reduced data requirements. The soft sensor presented can be considered part of Pharma 4.0 due to incorporating elements of advanced computation, such as evolutionary algorithms, data acquisition, processing, and storing.
The soft sensor used the dissolved oxygen concentration and the volumetric oxygen mass transfer coefficient as online input variables, measurements that are common in industrial aerobic fermentation setups. Specifically, kLa can be estimated through empirical relationships that involve agitation rate and aeration rate for a given bioreactor geometry. In this regard, this soft sensor can be implemented using typical off-the-shelf sensors and simple measurements, reducing the complexity and cost of the implementation, showing potential application in industrial fermentations. The r’O2-µ-r’L relationship (Figure 2) would not limit the applicability for the development of a soft sensor for other systems because its parameters have to be fitted using data obtained from the operation of the system under conditions similar to those in which the sensor will be used. It should be considered that in an industrial fermentation, operational conditions (or the profile of operational conditions) are kept nearly constant (batch to batch) for the production, in this case, of a biomass with a defined composition. For this purpose, the use of the simplified relationship can fit the requirement for monitoring and control. Parameters in the r’O2-µ-r’L relationship can be adjusted through the use of the evolutive algorithm, as more data become available, especially for conditions close to those defined as optimal for the production of a biomass enriched with lipids containing DHA.
The average prediction error of the soft sensor shown in this work (expressed as NRMSE) was below 1.3% for X, N, and L, and 3.2 % for DHA. These errors are in the range of other reported soft sensors, such as those designed for estimating the biomass concentration of Trichoderma reesei (1.6%) and Pichia pastoris (10.9%) [51,52]. Still, the comparison with related soft sensors is difficult due to the different physical measurements used: online gas analyzers, capacitance sensors, and substrate concentration from laboratory analysis, a variable that, if required, makes the automatization difficult. In contrast, the soft sensor presented in this work did not require concentration measurements after the initial values, which appears as an advantage for automating the monitoring process. Incorporating different terms for the growth of active biomass and lipid synthesis is an important difference from related soft sensors.

5. Conclusions

In this work, a soft sensor for monitoring a Schizochytrium sp. fermentation process was designed and its implementation was tested.
Contribution 1: A novel mathematical model was proposed to describe the fermentation of Schizochytrium sp. as a response to oxygen-related variables. This contribution allows considering the growth of the active biomass and lipid synthesis dependent on oxygen-related parameters, a factor known to alter the biomass composition but which has not been addressed in a kinetic model of strains of the thraustochytrid family previously.
Contribution 2: A soft sensor was derived from the GEM insights. The relations between the specific oxygen uptake rate, rO2, the specific growth rate, µ, and the rate of lipid synthesis, rL, were derived from GEM and analyzed using FBA and FVA. Then, these relations were simplified for its use in a set of kinetic equations, using an evolutive algorithm. The soft sensor was able to estimate the specific growth rate of active biomass and the specific lipid synthesis rate, internal variables which in turn were used to estimate the concentration of active biomass, glutamate, lipid, and DHA. The inputs to the soft sensor were the dissolved oxygen and the volumetric oxygen mass transfer coefficient, kLa, (variables measured in industrial fermentations), in addition to the initial state of the system given by a concentration of biomass, glutamate, and lipids. A potential application of the designed soft sensor could be to estimate the time at which glutamate was depleted, and the time at which oxygen uptake decreases, a signal of reaching a maximum DHA content in the biomass, for enhanced fermentation efficiency.
Contribution 3: The designed soft sensor was implemented and tested on an Arduino UNO microcontroller. The implementation of the soft sensor model in the low-cost microcontroller has not been previously reported and shows a novel route for adapting GEM results for its potential industrial application using off-the-shelf electronic boards in the context of Pharma 4.0.

Author Contributions

C.A.: Conceptualization, Methodology, Software, Data curation, Visualization, Investigation, Writing—Original draft preparation, Writing—Reviewing and Editing. C.S.: Conceptualization, Methodology, Software, Data curation, Visualization, Investigation, Writing—Reviewing and Editing. All authors have read and agreed to the published version of the manuscript.

Funding

This research was funded by the ANID/CONICYT PFCHA/Doctorado Nacional/2018-21180806 and ANID/CONICYT project: Basal Centre for Biotechnology and Bioengineering (CeBiB) FB-0001.

Institutional Review Board Statement

Not applicable.

Data Availability Statement

Data is available by contacting the corresponding author.

Conflicts of Interest

The authors declare no conflict of interest.

References

  1. Narayanan, H.; Luna, M.F.; von Stosch, M.; Cruz Bournazou, M.N.; Polotti, G.; Morbidelli, M.; Butté, A.; Sokolov, M. Bioprocessing in the Digital Age: The Role of Process Models. Biotechnol. J. 2020, 15, 1900172. [Google Scholar] [CrossRef] [PubMed]
  2. Nargund, S.; Guenther, K.; Mauch, K. The Move toward Biopharma 4.0. Genet. Eng. Biotechnol. News 2019, 39, 53–55. [Google Scholar] [CrossRef]
  3. Alarcon, C.; Shene, C. Fermentation 4.0, a Case Study on Computer Vision, Soft Sensor, Connectivity, and Control Applied to the Fermentation of a Thraustochytrid. Comput. Ind. 2021, 128, 103431. [Google Scholar] [CrossRef]
  4. Tokuyama, K.; Shimodaira, Y.; Kodama, Y.; Matsui, R.; Kusunose, Y.; Fukushima, S.; Nakai, H.; Tsuji, Y.; Toya, Y.; Matsuda, F.; et al. Soft-Sensor Development for Monitoring the Lysine Fermentation Process. J. Biosci. Bioeng. 2021, 132, 183–189. [Google Scholar] [CrossRef] [PubMed]
  5. Kusuda, M.; Shimizu, H.; Toya, Y. Reactor Control System in Bacterial Co-Culture Based on Fluorescent Proteins Using an Arduino-Based Home-Made Device. Biotechnol. J. 2021, 16, 2100169. [Google Scholar] [CrossRef] [PubMed]
  6. Wilken, S.E.; Leggieri, P.A.; Kerdman-Andrade, C.; Reilly, M.; Theodorou, M.K.; O’Malley, M.A. An Arduino Based Automatic Pressure Evaluation System to Quantify Growth of Non-Model Anaerobes in Culture. AIChE J. 2020, 66, e16540. [Google Scholar] [CrossRef]
  7. Curreri, F.; Patanè, L.; Xibilia, M.G. Soft Sensor Transferability: A Survey. Appl. Sci. 2021, 11, 7710. [Google Scholar] [CrossRef]
  8. Biechele, P.; Busse, C.; Solle, D.; Scheper, T.; Reardon, K. Sensor Systems for Bioprocess Monitoring. Eng. Life Sci. 2015, 15, 469–488. [Google Scholar] [CrossRef]
  9. Wang, B.; Shahzad, M.; Zhu, X.; Ur Rehman, K.; Ashfaq, M.; Abubakar, M. Soft-Sensor Modeling for l-Lysine Fermentation Process Based on Hybrid ICS-MLSSVM. Sci. Rep. 2020, 10, 11630. [Google Scholar] [CrossRef] [PubMed]
  10. Wechselberger, P.; Sagmeister, P.; Herwig, C. Real-Time Estimation of Biomass and Specific Growth Rate in Physiologically Variable Recombinant Fed-Batch Processes. Bioprocess Biosyst. Eng. 2013, 36, 1205–1218. [Google Scholar] [CrossRef] [PubMed]
  11. Winckler, S.; Krueger, R.; Schnitzler, T.; Zang, W.; Fischer, R.; Biselli, M. A Sensitive Monitoring System for Mammalian Cell Cultivation Processes: A PAT Approach. Bioprocess Biosyst. Eng. 2014, 37, 901–912. [Google Scholar] [CrossRef] [PubMed]
  12. Gustavsson, R.; Mandenius, C.F. Soft Sensor Control of Metabolic Fluxes in a Recombinant Escherichia Coli Fed-Batch Cultivation Producing Green Fluorescence Protein. Bioprocess Biosyst. Eng. 2013, 36, 1375–1384. [Google Scholar] [CrossRef] [PubMed]
  13. Gu, B.; Pan, F. A Soft Sensor Modelling of Biomass Concentration during Fermentation Using Accurate Incremental Online V-Support Vector Regression Learning Algorithm. Am. J. Biochem. Biotechnol. 2015, 11, 149–159. [Google Scholar] [CrossRef]
  14. Imtiaz, U.; Jamuar, S.S.; Sahu, J.N.; Ganesan, P.B. Bioreactor Profile Control by a Nonlinear Auto Regressive Moving Average Neuro and Two Degree of Freedom PID Controllers. J. Process Control 2014, 24, 1761–1777. [Google Scholar] [CrossRef]
  15. Baart, G.J.E.; Martens, D.E. Genome-Scale Metabolic Models: Reconstruction and Analysis. In Methods in Molecular Biology; Humana Press: Totova, NJ, USA, 2012; Volume 799, pp. 107–126. ISBN 9781617793455. [Google Scholar]
  16. Zhang, C.; Hua, Q. Applications of Genome-Scale Metabolic Models in Biotechnology and Systems Medicine. Front. Physiol. 2016, 6, 413. [Google Scholar] [CrossRef] [Green Version]
  17. Orth, J.D.; Thiele, I.; Palsson, B.O. What Is Flux Balance Analysis? Nat. Biotechnol. 2010, 28, 245–248. [Google Scholar] [CrossRef]
  18. Kuriya, Y.; Inoue, M.; Yamamoto, M.; Murata, M.; Araki, M. Knowledge Extraction from Literature and Enzyme Sequences Complements FBA Analysis in Metabolic Engineering. Biotechnol. J. 2021, 16, 2000443. [Google Scholar] [CrossRef]
  19. O’Brien, E.J.; Monk, J.M.; Palsson, B.O. Using Genome-Scale Models to Predict Biological Capabilities. Cell 2015, 161, 971–987. [Google Scholar] [CrossRef] [Green Version]
  20. Mahadevan, R.; Schilling, C.H. The Effects of Alternate Optimal Solutions in Constraint-Based Genome-Scale Metabolic Models. Metab. Eng. 2003, 5, 264–276. [Google Scholar] [CrossRef]
  21. Mahadevan, R.; Edwards, J.S.; Doyle, F.J. Dynamic Flux Balance Analysis of Diauxic Growth in Escherichia Coli. Biophys. J. 2002, 83, 1331–1340. [Google Scholar] [CrossRef]
  22. Kuriya, Y.; Araki, M. Dynamic Flux Balance Analysis to Evaluate the Strain Production Performance on Shikimic Acid Production in Escherichia Coli. Metabolites 2020, 10, 198. [Google Scholar] [CrossRef] [PubMed]
  23. Schroeder, W.L.; Saha, R. Introducing an Optimization- and Explicit Runge-Kutta-Based Approach to Perform Dynamic Flux Balance Analysis. Sci. Rep. 2020, 10, 9241. [Google Scholar] [CrossRef] [PubMed]
  24. Liu, F.; Heiner, M.; Gilbert, D. Hybrid Modelling of Biological Systems: Current Progress and Future Prospects. Brief. Bioinform. 2022, 23, bbac081. [Google Scholar] [CrossRef] [PubMed]
  25. Dale, J.M.; Popescu, L.; Karp, P.D. Machine Learning Methods for Metabolic Pathway Prediction. BMC Bioinform. 2010, 11, 15. [Google Scholar] [CrossRef] [Green Version]
  26. Pearcy, N.; Hu, Y.; Baker, M.; Maciel-Guerra, A.; Xue, N.; Wang, W.; Kaler, J.; Peng, Z.; Li, F.; Dottorini, T. Genome-Scale Metabolic Models and Machine Learning Reveal Genetic Determinants of Antibiotic Resistance in Escherichia Coli and Unravel the Underlying Metabolic Adaptation Mechanisms. mSystems 2021, 6, e00913-20. [Google Scholar] [CrossRef]
  27. Wu, S.G.; Wang, Y.; Jiang, W.; Oyetunde, T.; Yao, R.; Zhang, X.; Shimizu, K.; Tang, Y.J.; Bao, F.S. Rapid Prediction of Bacterial Heterotrophic Fluxomics Using Machine Learning and Constraint Programming. PLoS Comput. Biol. 2016, 12, e1004838. [Google Scholar] [CrossRef] [PubMed] [Green Version]
  28. Frioux, C.; Huet, S.; Labarthe, S.; Martinelli, J.; Sherman, D.J.; Taupin, M.; Ugalde-salas, P.; Frioux, C.; Huet, S.; Labarthe, S.; et al. Accelerating Metabolic Models Evaluation with Statistical Metamodels: Application to Salmonella Infection Models. 2022. Available online: https://hal.inrae.fr/hal-03635862 (accessed on 22 July 2022).
  29. Richelle, A.; David, B.; Demaegd, D.; Dewerchin, M.; Kinet, R.; Morreale, A.; Portela, R.; Zune, Q.; von Stosch, M. Towards a Widespread Adoption of Metabolic Modeling Tools in Biopharmaceutical Industry: A Process Systems Biology Engineering Perspective. npj Syst. Biol. Appl. 2020, 6, 6. [Google Scholar] [CrossRef] [Green Version]
  30. Xie, N.; Sen, B.; Song, Z.; Zhao, Y.; Chen, Z.; Shi, W.; Zhang, Y.; Zhang, J.; Johnson, Z.I.; Wang, G. High Phylogenetic Diversity and Abundance Pattern of Labyrinthulomycete Protists in the Coastal Waters of the Bohai Sea. Environ. Microbiol. 2018, 20, 3042–3056. [Google Scholar] [CrossRef] [PubMed]
  31. Finco, A.M.D.O.; Mamani, L.D.G.; Carvalho, J.C.D.; de Melo Pereira, G.V.; Thomaz-Soccol, V.; Soccol, C.R. Technological Trends and Market Perspectives for Production of Microbial Oils Rich in Omega-3. Crit. Rev. Biotechnol. 2017, 37, 656–671. [Google Scholar] [CrossRef] [PubMed]
  32. Bekatorou, A.; Dima, A.; Tsafrakidou, P.; Boura, K.; Lappa, K.; Kandylis, P.; Pissaridi, K.; Kanellaki, M.; Koutinas, A.A. Downstream Extraction Process Development for Recovery of Organic Acids from a Fermentation Broth. Bioresour. Technol. 2016, 220, 34–37. [Google Scholar] [CrossRef] [PubMed]
  33. Chen, C.-Y.; Yang, Y.-T. Combining Engineering Strategies and Fermentation Technology to Enhance Docosahexaenoic Acid (DHA) Production from an Indigenous Thraustochytrium sp. BM2 Strain. Biochem. Eng. J. 2018, 133, 179–185. [Google Scholar] [CrossRef]
  34. Kim, H.; Choi, O.; Seung, B.; Choe, W.; Sang, B. Bioresource Technology Impact of Feedstocks and Downstream Processing Technologies on the Economics of Caproic Acid Production in Fermentation by Megasphaera Elsdenii T81. Bioresour. Technol. 2020, 301, 122794. [Google Scholar] [CrossRef]
  35. Nazir, Y.; Shuib, S.; Kalil, M.S.; Song, Y.; Hamid, A.A. Optimization of Culture Conditions for Enhanced Growth, Lipid and Docosahexaenoic Acid (DHA) Production of Aurantiochytrium SW1 by Response Surface Methodology. Sci. Rep. 2018, 8, 8909. [Google Scholar] [CrossRef] [PubMed] [Green Version]
  36. Nor, M.; Sohedein, A.; Abd, W.; Qadr, A. Optimisation of Biomass and Lipid Production of a Tropical Thraustochytrid Aurantiochytrium sp. UMACC-T023 in Submerged-Liquid Fermentation for Large-Scale Biodiesel Production Biocatalysis and Agricultural Biotechnology Optimisation of Biomass and Lipid. Biocatal. Agric. Biotechnol. 2020, 23, 101496. [Google Scholar] [CrossRef]
  37. Ye, H.; He, Y.; Xie, Y.; Sen, B.; Wang, G. Fed-Batch Fermentation of Mixed Carbon Source Significantly Enhances the Production of Docosahexaenoic Acid in Thraustochytriidae sp. PKU#Mn16 by Differentially Regulating Fatty Acids Biosynthetic Pathways. Bioresour. Technol. 2020, 297, 122402. [Google Scholar] [CrossRef] [PubMed]
  38. Qu, L.; Ji, X.-J.; Ren, L.-J.; Nie, Z.-K.; Feng, Y.; Wu, W.-J.; Ouyang, P.-K.; Huang, H. Enhancement of Docosahexaenoic Acid Production by Schizochytrium sp. Using a Two-Stage Oxygen Supply Control Strategy Based on Oxygen Transfer Coefficient. Lett. Appl. Microbiol. 2011, 52, 22–27. [Google Scholar] [CrossRef]
  39. Qu, L.; Ren, L.J.; Huang, H. Scale-up of Docosahexaenoic Acid Production in Fed-Batch Fermentation by Schizochytrium sp. Based on Volumetric Oxygen-Transfer Coefficient. Biochem. Eng. J. 2013, 77, 82–87. [Google Scholar] [CrossRef]
  40. Heggeset, T.M.B.; Ertesvåg, H.; Liu, B.; Ellingsen, T.E.; Vadstein, O.; Aasen, I.M. Lipid and DHA-Production in Aurantiochytrium sp.—Responses to Nitrogen Starvation and Oxygen Limitation Revealed by Analyses of Production Kinetics and Global Transcriptomes. Sci. Rep. 2019, 9, 19470. [Google Scholar] [CrossRef] [PubMed] [Green Version]
  41. Ren, L.J.; Sun, G.N.; Ji, X.J.; Hu, X.C.; Huang, H. Compositional Shift in Lipid Fractions during Lipid Accumulation and Turnover in Schizochytrium sp. Bioresour. Technol. 2014, 157, 107–113. [Google Scholar] [CrossRef] [PubMed]
  42. Guo, D.S.; Ji, X.J.; Ren, L.J.; Li, G.L.; Yin, F.W.; Huang, H. Development of a Real-Time Bioprocess Monitoring Method for Docosahexaenoic Acid Production by Schizochytrium sp. Bioresour. Technol. 2016, 216, 422–427. [Google Scholar] [CrossRef]
  43. Wang, S.; Wan, W.; Wang, Z.; Zhang, H.; Liu, H.; Arunakumara, K.K.I.U.; Cui, Q.; Song, X. A Two-Stage Adaptive Laboratory Evolution Strategy to Enhance Docosahexaenoic Acid Synthesis in Oleaginous Thraustochytrid. Front. Nutr. 2021, 8, 795491. [Google Scholar] [CrossRef]
  44. Jakobsen, A.N.; Aasen, I.M.; Josefsen, K.D.; Strøm, A.R. Accumulation of Docosahexaenoic Acid-Rich Lipid in Thraustochytrid aurantiochytrium sp. Strain T66: Effects of N and P Starvation and O2 Limitation. Appl. Microbiol. Biotechnol. 2008, 80, 297–306. [Google Scholar] [CrossRef] [PubMed]
  45. Shene, C.; Paredes, P.; Flores, L.; Leyton, A.; Asenjo, J.A.; Chisti, Y. Dynamic Flux Balance Analysis of Biomass and Lipid Production by Antarctic Thraustochytrid oblongichytrium sp. RT2316-13. Biotechnol. Bioeng. 2020, 117, 3006–3017. [Google Scholar] [CrossRef]
  46. Orth, J.D.; Conrad, T.M.; Na, J.; Lerman, J.A.; Nam, H.; Feist, A.M.; Palsson, B. A Comprehensive Genome-Scale Reconstruction of Escherichia coli Metabolism—2011. Mol. Syst. Biol. 2011, 7, 535. [Google Scholar] [CrossRef] [PubMed]
  47. De Martino, D.; Capuani, F.; Mori, M.; De Martino, A.; Marinari, E. Counting and Correcting Thermodynamically Infeasible Flux Cycles in Genome-Scale Metabolic Networks. Metabolites 2013, 3, 946–966. [Google Scholar] [CrossRef] [PubMed]
  48. Chan, S.H.J.; Cai, J.; Wang, L.; Simons-Senftle, M.N.; Maranas, C.D. Standardizing Biomass Reactions and Ensuring Complete Mass Balance in Genome-Scale Metabolic Models. Bioinformatics 2017, 33, 3603–3609. [Google Scholar] [CrossRef] [PubMed]
  49. Qu, L.; Ren, L.-J.; Sun, G.-N.; Ji, X.-J.; Nie, Z.-K.; Huang, H. Batch, Fed-Batch and Repeated Fed-Batch Fermentation Processes of the Marine Thraustochytrid schizochytrium sp. for Producing Docosahexaenoic Acid. Bioprocess Biosyst. Eng. 2013, 36, 1905–1912. [Google Scholar] [CrossRef] [PubMed]
  50. Schulz, C.; Kumelj, T.; Karlsen, E.; Almaas, E. Genome-Scale Metabolic Modelling When Changes in Environmental Conditions Affect Biomass Composition. PLoS Comput. Biol. 2021, 17, e1008528. [Google Scholar] [CrossRef] [PubMed]
  51. Murugan, C.; Natarajan, P. Estimation of Fungal Biomass Using Multiphase Artificial Neural Network Based Dynamic Soft Sensor. J. Microbiol. Methods 2019, 159, 5–11. [Google Scholar] [CrossRef] [PubMed]
  52. Barrigón, J.M.; Ramon, R.; Rocha, I.; Valero, F.; Ferreira, E.C.; Montesinos, J.L. State and Specific Growth Estimation in Heterologous Protein Production by Pichia Pastoris. AIChE J. 2012, 58, 2966–2979. [Google Scholar] [CrossRef]
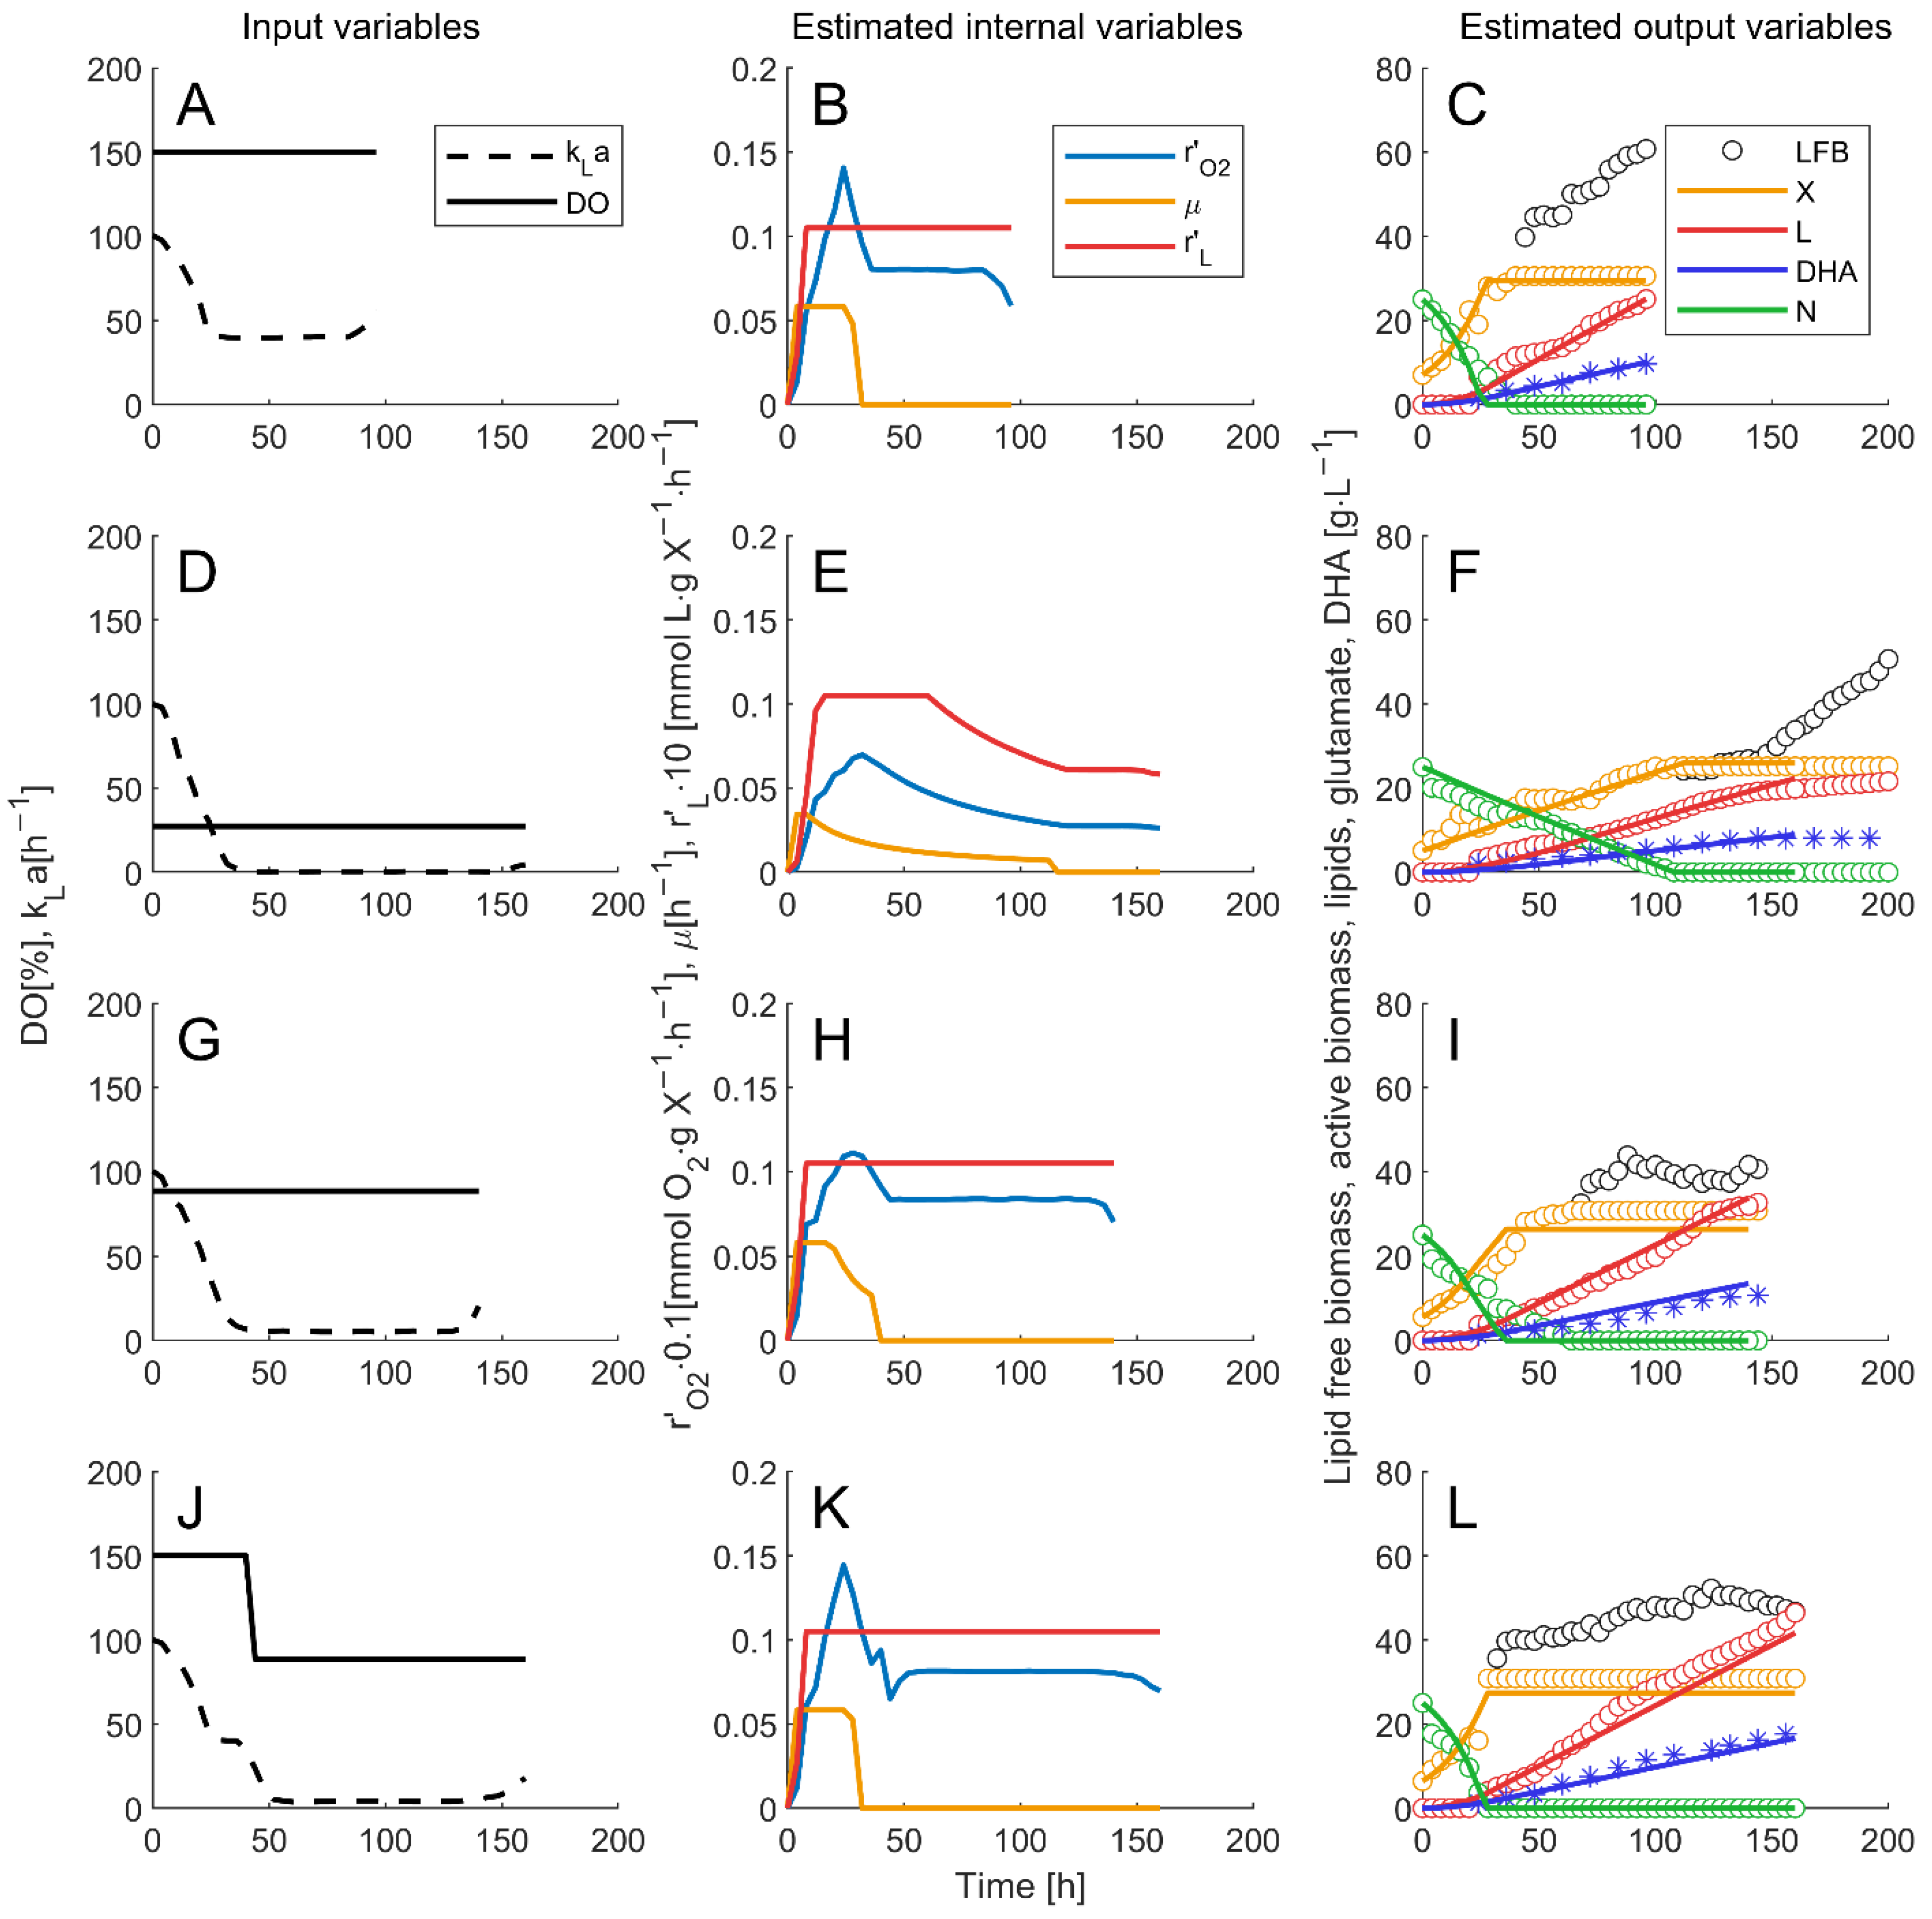
Figure 1. Effect of the specific oxygen uptake rate | r O 2 .| on (A) the specific growth rate (µ) and the specific rate of lipid synthesis ( r L ; r’L1 is the maximum value of r L after µ was maximized, and r’L2 is the maximum value of r L when the flux through the biomass equation was set to zero) and (B) the specific consumption rate of glutamate | r N | and glucose | r S |.
Processes 10 02226 g001
Figure 2. Simplified relation between specific oxygen uptake rate |r’O2|, the specific growth rate of active lipid-free biomass (µ), and the specific rate of lipid synthesis ( r L .), following the insights from GEM, for describing the simultaneous growth of the active lipid-free biomass and lipid synthesis observed. Increases in |r’O2| lead to total biomass growth, which accounts for active lipid-free biomass and lipids, first limited by oxygen mass transfer, then by glucose uptake (S), and finally, glucose and nitrogen (N) uptake.
Processes 10 02226 g002
Figure 3. Soft sensor output variables in (C,F,I,L) obtained from estimated internal variables related to the state of the fermentation (r’O2-µ-r’L in (B,E,H,K)) calculated from input (kLa and DO in (A,D,G,J)). The soft sensor was implemented in Arduino UNO, with experiment I: kLa = 150 h−1 (first row); experiment II: kLa = 27.3 h−1 (second row); experiment III: kLa = 88.5 h−1 (third row), and experiment IV: kLa = 150 h−1 until time 40 h, and then 88.5 h−1 (fourth row).
Processes 10 02226 g003
Table 1. Soft sensor parameters and the error between experimental and model results regarding the concentration of the active lipid-free biomass Xerror, glutamate Nerror, lipids Lerror, and DHAerror. Units: µmax h−1, r’Lmax (mmol L/g X∙h), kc1 (mmol O2/g X), kc2 (mmol O2/g X), kDHA (-), YX/N (g X/g N).
ExpkLa
(h−1)
Model Parameters *Xerror
(%)
Nerror
(%)
Lerror
(%)
DHAerror
(%)
I150.1µmax = 0.0583
rLmax = 0.0089
kc1 = 0.3988
kc2 = 44.1433
kDHA = 0.3730
YX/N = 0.8053
1.11.71.83.3
II27.31.21.20.82.1
III88.52.32.00.73.9
IVstep 150.1 to 88.5 at 40 h1.80.81.23.7
Average ± std 1.1 ± 0.41.3 ± 0.41.1 ± 0.53.2 ± 0.8
* Parameters shown in Figure 2.
Publisher’s Note: MDPI stays neutral with regard to jurisdictional claims in published maps and institutional affiliations.

