
Recovery of N-Butanol from a Complex Five-Component Reactive Azeotropic Mixture


Faculty of Chemistry and Chemical Engineering, University of Maribor, SI-2000 Maribor, Slovenia
*
Author to whom correspondence should be addressed.
Processes 2022, 10(2), 364; https://doi.org/10.3390/pr10020364
Submission received: 25 January 2022
/
Revised: 8 February 2022
/
Accepted: 10 February 2022
/
Published: 14 February 2022
(This article belongs to the Special Issue Tools, Approaches and Modeling for Energy System Design Increasing Economic and Environmental Sustainability)
Abstract
:This paper proposes a concept of a process design for the separation and recovery of n-butanol from a five-component mixture, consisting of n-butanol, isobutanol, formaldehyde, water and methanol. The mixture is a common waste stream in the production of butylated amino resins; therefore, recovery of n-butanol is crucial to the efficiency of the process. The results show that up to 94% of the n-butanol present in the waste stream can be recovered. Under the studied conditions, 99.76% pure n-butanol can be obtained, while formaldehyde, water and methanol are present only in traces. The energy intensity of the process is estimated at 2.42 MJ/kg of purified n-butanol. The economic analysis of the process shows that the process is economically viable over a wide range of production capacities, as evidenced by high net present values and high return on investment values.
1. Introduction
Butyl alcohol (n-butanol) is an important industrial chemical used as a solvent [1], extracting agent [2], and as a reactant in the production of chemicals such as butyl acrylate [3] and butylated amino resins (BAR) [4]. In the production of BAR, relatively large amounts of n-butanol are disposed of as waste (incinerated), because of contamination with formaldehyde, which prevents its direct reuse. The ratio between the mass of the product and the mass of the waste stream, in which mass fraction of n-butanol can reach up to 85%, can be as high as 1:1. It is common for the waste stream to contain water, methanol and traces of isobutanol in addition to formaldehyde. Therefore, to recover n-butanol, it must be separated from a highly nonideal five-component mixture known to contain at least two heterogeneous azeotropes [5] (n-butanol-water and isobutanol-water) and highly complex chemistry due to the reactive equilibrium in the formaldehyde–water–methanol system [6].
Separation of n-butanol from n-butanol-water solution can be carried out by several methods. Among others, these include extractive distillation [7] and heterogeneous azeotropic distillation using a two-column distillation system [8]. The latter is the most commonly used method. On the other hand, the removal of any of the components from aqueous solutions containing methanol and formaldehyde by either distillation [9] or more recently studied pervaporation [10] is an extremely difficult task. This is due to the complex chemical equilibria leading to the formation of higher molecular weight species such as methylene glycol, hemiformal, poly(oxymethylene)glycols and poly(oxymethylene) hemiformals [11]. The latter difficulty suggests that it would be quite futile to attempt to solve the n-butanol recovery problem by distillation column sequencing alone.
Under alkaline conditions, formaldehyde is disproportionated in aqueous solutions by a rather slow [12] Cannizzaro reaction (CR) to methanol and formate. Additionally, under alkaline conditions and at temperatures above 70 °C [13], a competitive and faster formose reaction (FR) takes place, converting formaldehyde into sugars and sugar-like substances [14]. Although the reactions are controlled by different reaction mechanisms [15,16] (see Appendix A), they can be considered in a common framework (CR/FR) in which CR dominates the consumption of formaldehyde until the onset of rapid FR [17]. Therefore, the hypothesis is that a combination of formaldehyde conversion by CR/FR followed by azeotropic distillation provides a viable scheme for recovery of n-butanol from the complex reactive azeotropic mixture.
This work focuses on the recovery of n-butanol from the waste stream generated in the BAR production process. The remainder of the paper is organized as follows. In chapters 2–3, experimental methods and experimental results used to determine the feasibility of formaldehyde removal by CR/FR are presented. In chapter 4, a conceptual design of the n-butanol process is proposed. Chapter 5 presents the results of improving the energy efficiency of the process. Finally, in chapter 6, the process is economically evaluated.
2. Materials and Methods
The crude n-butanol solution was obtained from a company that manufactures BAR. The solution was a clear, stable, homogenous one-phase system. According to the company, the solution consisted of n-butanol (w = 85.49%), water (w = 12.15%), formaldehyde (w = 1.70%) and traces of isobutanol (w = 0.17%) and methanol (w = 0.49%). The pH of the solution was 5.3 and density 0.837 g/mL. The boiling point of crude n-butanol was 96 °C, which is close to the boiling point of the water-butanol azeotrope (93 °C [5]). Sodium hydroxide was obtained from Merck.
The residual concentration of formaldehyde was determined using the NANOCOLOR Formaldehyde 8 tube test kit (Macherey-Nagel, Düren, Germany). If dilution of the sample was required to attain the measuring range of the test kit (0.1 mg/L ≤ γCH2O ≤ 8.0 mg/L), the solution was diluted with analytical grade n-butanol (100%, Merck). Temperature and pH were measured with the GMH 3500 Series set (Greisinger GHM Messertechnik GmbH, Regenstauf, Germany). For the determination of n-butanol, isobutanol and methanol, among others, gas chromatographic analyses were performed on a Nexis GC-2030 (Shimadzu; Shimadzu Europa GmbH, Duisburg, Germany) with Zebron ZB-624 column (60 m, 0.32 mm, 1.8 μm; Phenomenex; Phenomenex LTD, Aschaffenburg, Germany) with flame ionization detector FID. Helium was used as carrier gas. The water content was determined by Karl Fisher titration on a V30 instrument (Mettler Toledo; Mettler Toledo GmbH, Greifensee, Switzerland).
3. Experimental Section
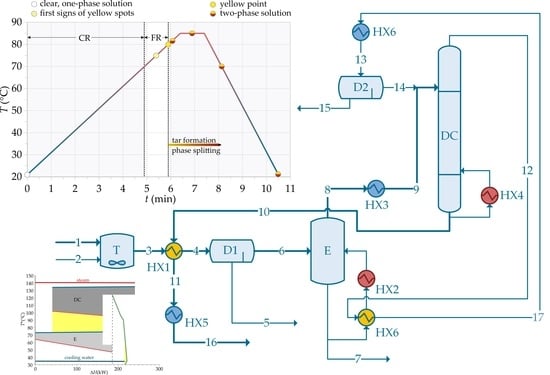
Experiments were conducted to determine the feasibility of formaldehyde removal by CR /FR under strongly alkaline conditions. In order to assess the statistical significance of the results, three parallel experiments were conducted in each case. Four different initial NaOH concentrations (2.4 g/L, 3.6 g/L, 4.8 g/L, and 7.2 g/L) were selected to pre-screen the effect of initial NaOH concentration on formaldehyde removal. To avoid additional introduction of water into the mixture, NaOH was added to crude n-butanol solution (250 mL) in pellets. The reaction was carried out under total reflux. The solution was stirred and heated from room temperature (21 °C) to 85 °C at a rate of 10 °C/min. The reaction mixture was then kept at 85 °C for 1 min. Within this time, the “yellow point” was reached, indicating a completed FR/CR [14] (conversion of formaldehyde to sugars and their subsequent polymerization and dehydration to chromophoric species [18]). The mixture was then cooled to room temperature under cold running water and the pH was measured. The reaction time-temperature profile is shown in Figure 1. Assuming that the “yellow point” indicates complete conversion of formaldehyde, the reaction time was approximately 6 min.
The solution obtained formed a two-phase system. The heavy phase was decanted and discarded. Presumably, the heavy phase consists mainly of water and condensed/polymerized products of FR (tar-like substances) [18]. The lighter phase was distilled under atmospheric pressure in a laboratory glass distillation apparatus consisting of a distillation flask, a water-cooled condenser and a collecting flask.
The distillation was stopped when the liquid in the distillation flask had almost completely boiled off. The distillate represented on average 95% of the light phase mass. The distillation flask was placed in a dryer (200 °C) for 24 h. The dry matter in the light phase was determined gravimetrically based on the dry matter remaining in the distillation flask. The residual formaldehyde was determined in the distillate.
In addition to the temperature profile, three regions are shown schematically in Figure 1. Based on the literature [13] and experimental observations, a region in which formaldehyde is predominantly consumed by CR (0–5 min), a region in which FR is the dominant reaction and in which formaldehyde is completely consumed (5–6 min), and a region of tar formation (from 6 min).
3.1. Experimental Results
The results of the four CR/FR experimental conditions are summarized in this section. However, before moving on to the quantitative results, a review of some qualitative observations is presented. The crude n-butanol solution received from the company was a one-phase solution. The added NaOH did not readily dissolve; however, it was completely dissolved by the time the temperature of the mixture reached 40 °C. During heating to 85 °C, the first signs of localized light-yellow droplet-sized spots were observed at about 75 °C. The spots dispersed through mixing without any visible change in the color of the solution. When the temperature reached 80 °C, the solution turned yellow and dark brown droplet-sized spots became visible (see Figure 1). As soon as stirring was stopped, these spots settled as a heavy phase, as shown in Figure 2.
The density of the light phase at 21 °C was determined to be 0.816 g/mL ± 0.003 g/mL and that of the heavy phase 1.209 g/mL ± 0.011 g/mL. The relatively large difference in densities ensures rapid separation of the two phases. The pH of the light phase ranged from 8.19 ± 0.01 at the lowest initial NaOH concentration to 8.89 ± 0.02 at the highest initial NaOH concentration. The average content of dry matter in the light phase was 5.4 g/L ± 0.5 g/L, with no significant correlation to the initial NaOH concentration.
3.1.1. Effect of the Initial NaOH Concentration on Concentration of Residual Formaldehyde
If n-butanol is to be reused in the production of BAR, it is required that as little formaldehyde as possible be present in the n-butanol. The upper bound on the mass fraction of residual formaldehyde is, however, set at 0.1%, which corresponds to a mass concentration of about 830 mg/L. Figure 3 shows the mass concentration and mass fraction of residual formaldehyde for the four different initial concentrations of NaOH. All the samples but for γNaOH = 2.4 g/L had to be diluted to reach the measuring range of the test kit used to determine the formaldehyde content. This explains the wider error bars observed at low NaOH concentrations, as they are a consequence of multiplying the standard deviation calculated for the diluted samples by the dilution factor.
The results show that the mass fraction of residual formaldehyde is below the established limit, even at the lowest initial concentration of NaOH. As a general trend, increasing the initial concentration of NaOH decreases the mass concentration of formaldehyde from 167 mg/L ± 7.6 mg/L (γNaOH = 2.4 g/L) to 3 mg/L ± 0.2 mg/L (γNaOH = 7.4 g/L). Based on these results, it can be concluded that the CR/FR scheme is a viable way to remove formaldehyde from the crude n-butanol solution.
3.1.2. Effect of the Initial NaOH Concentration on Volume of Heavy Phase Formation and Content of Water in the Light Phase
The results presented in Figure 4 show that the initial concentration of NaOH affects the volume of the heavy phase formed. The volume of the heavy phase increases with the concentration of NaOH and ranges from 2 mL (γNaOH = 2.4 g/L) to 10 mL (γNaOH = 7.2 g/L). The heavy phase formed thus accounts for 1% to 4% of the original solution volume. In addition, a considerable decrease in the mass fraction of water in the light phase was observed. In contrast to the initial 12% in the crude n-butanol solution, the average mass fraction of water in the light phase was 4.3% ± 0.4%.
3.1.3. Separation of N-Butanol from CR/FR Products
In reactive systems, where multiple products are formed, isolating the main product to the desired purity often becomes a difficult task. To verify the suitability of distillation for the separation of n-butanol from CR/FR reaction products, the distillates were analyzed by gas chromatography. Figure 5 shows the comparison of the chromatograms of the crude n-butanol solution and one of the distillates (γNaOH = 7.2 g/L).
Additional quantitative data can be found in Table 1. In both, Figure 5 and Table 1, only the peaks whose area fraction (ϕAtotal) is greater than 0.05% in crude butanol sample are noted.
The two most pronounced peaks correspond to methanol (A) and n-butanol (C). Among the remaining peaks, the one labeled B corresponds to isobutanol, while peaks D and E correspond to unidentified components. It should be pointed out that the experiment performed at γNaOH = 3.6 g/L has the largest number of components detected. Compared to the other samples, the peak count is about 30% higher than the average peak count of the other four samples analyzed (peaks = 37). Based on the data collected during the study, the reason for this discrepancy cannot be accurately determined, as it could be due to either the unique concentration of NaOH, the slightly unpredictable course of the CR /FR reaction, or some other uncontrolled experimental variable.
In general, however, it can be concluded that if additional volatile reaction products are present in the distillate, they are present in trace amounts comparable to those in crude n-butanol. Therefore, distillation or, in the context of process development, evaporation is a viable method for separating n-butanol from CR/FR reaction products.
4. Separation Process Design
Based on the experimental results, a conceptual scheme for a continuous process for n-butanol recovery can be constructed (Figure 6). Crude n-butanol solution (1) and NaOH (2) are mixed in a mixing tank (T). The solution is heated in a heat exchanger (HX1), which can be considered as a plug flow reactor. The two-phase reaction mixture is fed to the decanter (D1), where the light phase is separated from the heavy phase. The heavy phase represents a waste product (5). The light phase (6) is fed to evaporator (E). The concentrate (7), which contains non-volatile products, is disposed of as waste. The vapor phase (8) containing n-butanol, isobutanol, methanol, water and traces of residual formaldehyde is condensed and fed to the distillation column (DC). The bottoms product (10) is a mixture of n-butanol/isobutanol with traces of water and formaldehyde. The distillate (12) is condensed and fed to the decanter (D2), where the organic phase (n-butanol reach) is separated from the inorganic phase (n-butanol lean). The n-butanol reach phase is mixed with the feed of the distillation column. The n-butanol lean phase is considered as a waste stream (15). To obtain mass and energy balances, the process scheme shown in Figure 6 was simulated in Aspen Plus v10 using universal quasichemical thermodynamic model (UNIQUAC) under the following simplification and assumptions:
- Mass flowrate of crude n-butanol solution is 1 t/h;
- Mass concentration of NaOH is 5 g/L;
- Formaldehyde is converted exclusively by FR with 99% fractional conversion;
- Reaction takes place at 85 °C;
- Mixture of CR/FR products are considered as a single lumped component (simulated by glucose);
- Nonvolatile substances are completely removed in decanter (D1) and evaporator (E).
- Waste stream leaving decanter (D1) represents approximately 10% of the feed stream by volume;
- NaOH is equally distributed between the heavy and light phase;
- Recovery of volatile substances in the evaporator is 95%;
- Mass fraction of water in the evaporation condensate is between 4% and 5%.
- Distillation column containing 10 equilibrium stages is fed at the top stage;
- Process operates at atmospheric conditions.
The simulation results show that, under the above assumptions, 0.8 t/h of high purity n-butanol can be recovered from the crude n-butanol feed, thus the separation efficiency of the process is about 94%. The purity of n-butanol in product stream (11) is 99.76%. The remaining 0.24% is distributed among isobutanol (0.2%), water (0.02%) and residual formaldehyde (0.02%). Cumulative flowrate of waste streams (5, 7, 15) is 0.204 t/h, of which 60% is water, 26% n-butanol and 14% mainly products of CR/FR and NaOH. The properties of the streams are given in supplementary material (Table S1). The process requires 443 kW of hot utility and 417 kW of cold utility. The energy intensity of the process is thus 3.86 MJ/kg of purified n-butanol.
5. Improving Energy Efficiency through Heat Integration
Heat integration plays a key role in increasing energy efficiency and thus reducing operating costs in the process industry. Pinch analysis [19] is one of the approaches [20] to systematically exploit the energy potential of a process at an early stage of its development. Hot and cold process streams extracted from the simulation are given in Table 2.
According to the flowsheet in Figure 6, there are three hot streams and three cold streams in total. However, note that streams HX3 and HX6 are segmented to account for subcooling of the condensates.
From the composite curves in Figure 7a, it is evident that relatively small amount of heat can be recovered through heat integration. The only possible heat exchange among the process streams is highlighted in yellow. The target minimal hot utility consumption is 385 kW and cold utility 359 kW. The main reason for this is that the condensers and reboilers of the distillation column and of the evaporator operate at similar temperatures (see grand composite curve in Figure 7b).
In principle, the utility consumption can be reduced by changing the operating pressure of the evaporator and distillation column. If the pressure in the evaporator is increased and the pressure in the distillation column is decreased, partial heat integration can be achieved between the condenser of the evaporator and the reboiler of the distillation column. Conversely, partial integration can be achieved between the distillation column condenser and the evaporator reboiler.
Considering that the products of CR/FR form significant deposits on the heat exchange surfaces at higher temperatures, reducing the pressure in the evaporator and increasing the pressure in the distillation column offers a more effective alternative.
In this context, it is proposed to operate the evaporator at 0.15 bar and the distillation column at 1.5 bar. Changing the operating conditions in the two process units, not only changes the values of the target and target temperatures, but also slightly changes the enthalpy content of the process streams. Partly due to the design, partly due to the circumstances, the subcooling of the evaporator condensate is no longer necessary. Hot and cold process streams of the process under optimized conditions are given in Table 3.
As can be seen in Figure 8a, the potential for heat recovery increases in comparison to the one shown in Figure 7a. The target hot and cold utility consumption is more than halved to 211 kW and 187 kW, respectively. However, the full potential of heat recovery in composite curves cannot always be fully exploited, as such an endeavor can lead to complex process schemes that can cause problems in process controllability, flexibility, reliability and, last but not least, safety [21]. To reduce the complexity of the heat-integrated process, the decision was made in advance to avoid the heat exchange between the process background streams (streams HX1, HX5 and HX6-SC) and the streams associated with the evaporator and condenser (streams HX2, HX4, HX3-C and HX6-C). A grand composite curve satisfying this constraint is shown in Figure 8b. As expected, the minimum utility targets are not met. However, 180 kW of the potential 210 kW (86%) of heat can be recovered. The enthalpy of condensation from the distillation column condenser can be fully recovered in the evaporator. In addition, a small amount of heat can be exchanged among the streams in the process background.
The heat-integrated process according to the grand composite curve in Figure 8b is shown in Figure 9. The utility-driven heat exchangers are shown in blue (cooling water) and red (steam), while the heat exchangers where heat is recovered are shown in yellow.
The heat of condensation of the distillation column distillate is used to reduce the steam consumption of the evaporator (HX6). The waste heat of the distillation column bottoms product is used to preheat the reaction mixture to the desired 85 °C (HX5).
Keeping the system under vacuum becomes expensive when large amounts of non-condensable gasses must be evacuated from the system. The production capacity of the studied process is, however, small and all the vapors from the single-effect evaporator are condensable. Therefore, the vacuum pump only needs to evacuate the leakage gasses (air). If the system is well sealed, one can expect rather low leakage. According to the data [22], the air leakage for a 3 m3 system (evaporator) should be well below 2.5 kg/h, which corresponds to 16.4 m3/h at 0.15 bar and 70 °C. This volume flowrate would require a relatively small vacuum pump (0.75 kW [23]), which accounts for less than 0.2% of the total hot and cold utility consumption.
Thus, the heat-integrated process shown in Figure 9 requires 241 kW of hot utility and 217 kW of cold utility. The resulting energy intensity of the process is 2.42 MJ/kg of purified n-butanol.
6. Economic Evaluation
The process scheme (Figure 9) is evaluated using net present value (NPV) and after-tax return on investment (ROI) as metrics. The production of butylated amino- resins is a rather specialized chemical production process with production capacities significantly lower than those of bulk chemicals. In this context, the need for a capacity of 1 t/h is probably at the upper limit. Therefore, the scenarios were compared for capacities of 1 t/h, considered as an industrial application, and 0.1 t/h, considered as a pilot-scale application.
The crude n-butanol stream (1), if not treated, would represent a waste stream to be disposed of at a price of 300 EUR/t. The price of pure n-butanol is 1000 EUR/t, of sodium hydroxide 500 EUR/t, of waste-stream disposal 300 EUR/t, of hot utility 0.0318 EUR/(kW∙h) and of cold utility 0.0031 EUR/(kW∙h). The prices were adopted as proposed by the cooperating company. The following additional assumptions were used in the analysis:
- The process operates 8400 h/a;
- The estimated life of the project is 10 years;
- A uniform rate of depreciation and a salvage value of 10% is assumed;
- The tax rate on profit (rt) 25%;
- The interest rate is 20%;
- Cost of maintenance represents 5.5% of total depreciable cost.
The estimated values of capital investment, operating costs, revenues, etc. needed for the analysis, as well as the values of the metrics for the two scenarios, are shown in Table 4. As indicated by the positive NPV and ROI values, the process can be considered economically viable. The high NPV and ROI values are primarily a consequence of the fact that significant savings are achieved in two ways. Firstly, in the cost of disposing of the waste n-butanol (≈80% reduction) and secondly, in the cost of purchasing fresh n-butanol (≈94% reduction). Unlike the more common cases where an increase in prices of raw materials tends to reduce the economic viability of a process, here an increase in the price of n-butanol and, to some extent, waste stream disposal increases both the NPV and ROI.
During the life of the process, however, several unexpected or difficult-to-predict events may occur that could significantly affect the economic viability of the process. These may be changes in prices of raw materials, products, waste disposal and treatment, utilities, etc., changes in production capacity due to changes in market demand or due to downtime (equipment failure, unavailability of raw materials, etc.). With this in mind, a sensitivity analysis was carried out to determine the resilience of the design to changes in values of selected parameters. The parameters considered were the production capacity, the annual operating time expressed as a percent of the assumed full operating time, and the price of fresh n-butanol. The capital investment was considered as a function of production capacity, while the total annual costs and revenue were considered as functions of production capacity (qm), percent of operating time (ϕt; ϕt = 8400 h/a = 100%), and price of fresh butanol (CB). The sensitivity analysis can be written in a condensed form by the pseudocode shown in Algorithm 1.
| Algorithm 1 Sensitivity Analysis |
| 1: Input: Cn-butanol |
| 2: i = 1 |
| 3: j = 1 |
| 4: for qm = 0.1:Δqm:1 |
| 5: for ϕt = 0:Δϕt:100 |
| 6: Ii,j = f(qm) |
| 7: R i,j, Ctotal i,j = f(ϕt, qm, Cn-butanol) |
| 8: NPV i,j, ROI i,j = f(Ii,j, R i,j, Ctotal i,j) |
| 9: j = j + 1 |
| 10: end |
| 11: i = i + 1 |
| 12: end |
The analysis was carried out for production capacities between 0.1 t/h and 1 t/h, percent of operating time between 0% and 100%, and three distinct prices of n-butanol:
- Nominal price (1000 EUR/t);
- Critical price (235 EUR/t), at which the NPV of the process with a production capacity of 0.1 t/h becomes negative even at ϕt = 100%;
- Limiting price (0 EUR/t), at which the only factor contributing to the profit is the savings in the costs of the waste disposal.
The results of the analysis are shown in Figure 10. Each plot in the figure shows three distinct regions. These are: iii) region of negative NPVs, ii) region of positive NPVs for which the ROIs are lower than 30% and iii) region of positive NPVs for which the ROIs are greater than 30%.
For the sake of discussion, let us accept that the process is economically viable if NPV is positive, and ROI is greater than 30%. Under the nominal price assumption (Figure 10a), it can be determined that process operating at maximum production capacity is economically viable, even if it operates for only 10% of the assumed full operating time. On the other hand, the process operating at the minimum capacity (0.1 t/h) needs to operate at least 40% of the assumed full operating time. In the case of the critical price (Figure 10b), the process operating at minimum capacity is not economically viable as NPV is negative for all values of ϕt. However, in comparison to the previous case, the process operating at its maximum capacity needs to operate slightly more than 20% of the full operating time to be economically viable (positive NPV). The last case (Figure 10c) is the case of the limiting price. The lowest capacity that makes the process economically viable is slightly above 0.4 t/h. In this case, the process needs to operate full-time. Additionally, at the maximum capacity, the process needs to operate more than 55% of the full operating time.
In the analysis thus far, it was assumed the generated profit is taxed (25%). However, if the proposed n-butanol purification process is to operate within the resins production company, the profit can be tax-exempted. Eliminating the tax increases the profit and, thus, NPV and ROI. However, as seen in Figure 11, the effect is hardly noticeable in the cases of nominal price and critical price. The latter is, however, reduced from 235 EUR/t to 185 EUR/t. A somewhat more noticeable impact is observed in the limiting price case (Figure 11c).
7. Conclusions
The proposed concept of the process for recovery of n-butanol from n-butanol-reach waste streams originating in BAR production process was found to be efficient in terms of n-butanol recovery efficiency and energy intensity. It also proved to be economically viable.
The experiments conducted to determine the feasibility of formaldehyde removal from crude n-butanol solution by CR/FR confirmed that formaldehyde can be rapidly and efficiently converted to CR/FR products and at reasonable temperature and mass concentration of NaOH. There is, however, much room for optimization of formaldehyde conversion because it is known that the presence of organic co-catalysts, such as lower monosaccharides at concentrations as low as 3 mg/L [24], shortens the induction phase of the formose reaction. In addition, to determine the optimal conditions for CR/FR, a more systematic approach based on the design of experiments coupled with response surface methodology [25] could be used. This would allow us to methodically scan and test the operating conditions and derive surrogate mathematical models which would be used to determine the optimal operating conditions.
In the context of the proposed process scheme, the most enticing upgrade that would further increase recovery efficiency would be to introduce an additional column to obtain the common two-column configuration. However, in addition to a relatively low flowrate of n-butanol lean stream (the potential feed to the second column), considerable purging might be needed in order to obtain high-purity n-butanol. Both of these factors may render the two-column scheme unjustified. Last but not least, CR/FR products may cause difficulties in the evaporation due to scaling. Although evaporation under vacuum may diminish the scaling to a certain extent due to lower operating temperatures, the solids content (CR/FR products) could be further reduced by pre-filtration (e.g., with activated carbon).
Supplementary Materials
The following supporting information can be downloaded at: https://www.mdpi.com/article/10.3390/pr10020364/s1, Table S1: Material streams.
Author Contributions
Conceptualization, M.B., Z.K. and A.N.; methodology, M.B. and A.N.; writing—original draft preparation, M.B.; writing—review and editing, M.B., Z.K. and A.N; visualization, M.B.; All authors have read and agreed to the published version of the manuscript.
Funding
This research was funded by the Ministry of Education, Science and Sport of the Republic of Slovenia (OP20.03535) and the Slovenian Research Agency (P2-0414 and J7-1816).
Institutional Review Board Statement
Not applicable.
Informed Consent Statement
Not applicable.
Data Availability Statement
Not applicable.
Acknowledgments
The authors would like to acknowledge Team BAmBi and are particularly grateful to Tatjana Strnad and Igor Mihelič for fruitful discussions and advice. The authors would also like to acknowledge David Majer for performing GC analyses.
Conflicts of Interest
The authors declare no conflict of interest.
Nomenclature
Symbols
| C | Annual cost (EUR/a): price (EUR) |
| H | Enthalpy flowrate (kW) |
| I | Investment (EUR) |
| N | Number of samples |
| qm | Mass flowrate (kg/h) |
| R | Revenue (EUR/a) |
| rt | Tax rate (%) |
| T | Temperature (°C) |
| t | Time (h) |
| U | Voltage (V) |
| V | Volume (mL) |
| w | Mass fraction (%) |
| γ | Mass concentration (g/L) |
| σ | Standard deviation |
| ϕ | Fraction (/), percent (%) |
Subscripts/Superscripts
| R | Retention |
| S | Supply |
| T | Target |
| * | Shifted |
Abbreviations
| BAR | Butylated amino resins |
| CR | Cannizzaro reaction |
| FID | Flame Ionization Detector |
| FR | Formose reaction |
| NPV | Net Present Value |
| ROI | Return on Investment |
Appendix A
References
- Wang, L.; Sun, J.; Hua, Y.; Xu, L.; Liu, G. Solubility Behaviour and Thermodynamic Analysis of Methyleneaminoacetonitrile in Binary (Ethanol + Water, Ethanol + 2-Propanol, Ethanol + n-Butanol) Solvents. J. Chem. Thermodyn. 2019, 138, 272–281. [Google Scholar] [CrossRef]
- König, G.; Reetz, M.T.; Thiel, W. 1-Butanol as a Solvent for Efficient Extraction of Polar Compounds from Aqueous Medium: Theoretical and Practical Aspects. J. Phys. Chem. B 2018, 122, 6975–6988. [Google Scholar] [CrossRef]
- Sert, E.; Atalay, F.S. N-Butyl Acrylate Production by Esterification of Acrylic Acid with n-Butanol Combined with Pervaporation. Chem. Eng. Processing: Process Intensif. 2014, 81, 41–47. [Google Scholar] [CrossRef]
- Barrett, R.M. Amino Resins. In Surf. Coat.; Springer: Dordrecht, The Netherlands, 1993; pp. 134–145. ISBN 978-94-010-4534-6. [Google Scholar]
- Stockhardt, J.S.; Hull, C.M. Vapor-Liquid Equilibria and Boiling-Point Composition Relations for Systems n-Butanol–Water and Isobutanol–Water. Ind. Eng. Chem. 1931, 23, 1438–1440. [Google Scholar] [CrossRef]
- Albert, M.; Coto García, B.; Kuhnert, C.; Peschla, R.; Maurer, G. Vapor–Liquid Equilibrium of Aqueous Solutions of Formaldehyde and Methanol. AIChE J. 2000, 46, 1676–1687. [Google Scholar] [CrossRef]
- Gai, H.; Lin, K.; Feng, Y.; Xiao, M.; Guo, K.; Song, H. Conceptual Design of an Extractive Distillation Process for the Separation of Azeotropic Mixture of N-Butanol-Isobutanol-Water. Chin. J. Chem. Eng. 2018, 26, 2040–2047. [Google Scholar] [CrossRef]
- Luyben, W.L. Control of the Heterogeneous Azeotropic N-Butanol/Water Distillation System. Energy Fuels 2008, 22, 4249–4258. [Google Scholar] [CrossRef]
- Ott, M.; Schoenmakers, H.; Hasse, H. Distillation of Formaldehyde Containing Mixtures: Laboratory Experiments, Equilibrium Stage Modeling and Simulation. Chem. Eng. Processing: Process Intensif. 2005, 44, 687–694. [Google Scholar] [CrossRef]
- Schmitz, N.; Breitkreuz, C.F.; Ströfer, E.; Burger, J.; Hasse, H. Separation of Water from Mixtures Containing Formaldehyde, Water, Methanol, Methylal, and Poly(Oxymethylene) Dimethyl Ethers by Pervaporation. J. Membr. Sci. 2018, 564, 806–812. [Google Scholar] [CrossRef]
- Detcheberry, M.; Destrac, P.; Meyer, X.-M.; Condoret, J.-S. Phase Equilibria of Aqueous Solutions of Formaldehyde and Methanol: Improved Approach Using UNIQUAC Coupled to Chemical Equilibria. Fluid Ph. Equilibria 2015, 392, 84–94. [Google Scholar] [CrossRef] [Green Version]
- Kolah, A.K.; Sharma, M.M. Removal of Formaldehyde from Aqueous Solutions. Sep. Technol. 1995, 5, 13–22. [Google Scholar] [CrossRef]
- van Meerakker, J.E.A.M.; Scholtens, E. Side Reactions in Electroless Copper Solutions with Formaldehyde as Reducing Agent. Ber. Der Bunsenges. FÜR Phys. Chem. 1989, 93, 786–791. [Google Scholar] [CrossRef]
- Delidovich, I.V.; Simonov, A.N.; Taran, O.P.; Parmon, V.N. Catalytic Formation of Monosaccharides: From the Formose Reaction towards Selective Synthesis. ChemSusChem 2014, 7, 1833–1846. [Google Scholar] [CrossRef]
- Swain, C.G.; Powell, A.L.; Sheppard, W.A.; Morgan, C.R. Mechanism of the Cannizzaro Reaction. J. Am. Chem. Soc. 1979, 101, 3576–3583. [Google Scholar] [CrossRef]
- Simonov, A.N.; Pestunova, O.P.; Matvienko, L.G.; Parmon, V.N. The Nature of Autocatalysis in the Butlerov Reaction. Kinet Catal. 2007, 48, 245–254. [Google Scholar] [CrossRef]
- Weiss, A. Homogeneously Catalyzed Condensation of Formaldehyde to Carbohydrates V. Complexing and PH Behavior with Glucose Cocatalyst. J. Catal. 1977, 48, 354–364. [Google Scholar] [CrossRef]
- Omran, A.; Menor-Salvan, C.; Springsteen, G.; Pasek, M. The Messy Alkaline Formose Reaction and Its Link to Metabolism. Life 2020, 10, 125. [Google Scholar] [CrossRef]
- Linnhoff, B.; Sahdev, V. Pinch Technology. In Ullmann’s Encyclopedia of Industrial Chemistry; WILEY-VCH Verlag GmbH & Co. KGaA: Weinheim, Germany, 2000; p. b03_13. ISBN 978-3-527-30673-2. [Google Scholar]
- Klemeš, J.J.; Kravanja, Z. Forty Years of Heat Integration: Pinch Analysis (PA) and Mathematical Programming (MP). Curr. Opin. Chem. Eng. 2013, 2, 461–474. [Google Scholar] [CrossRef]
- Marton, S.; Svensson, E.; Harvey, S. Operability and Technical Implementation Issues Related to Heat Integration Measures—Interview Study at an Oil Refinery in Sweden. Energies 2020, 13, 3478. [Google Scholar] [CrossRef]
- Bannwarth, H. Liquid Ring Vacuum Pumps, Compressors and Systems; WILEY-VCH Verlag GmbH & Co. KGaA: Weinheim, Germany, 2005; p. 336. [Google Scholar]
- Liquid ring pumps, Compressors & Systems, Vectra SX Series, Gardner Denver NASH, LLC, USA. 2019. Available online: https://bit.ly/3J3eetZ (accessed on 15 January 2022).
- Socha, R. Homogeneously Catalyzed Condensation of Formaldehyde to Carbohydrates VII. An Overall Formose Reaction Model. J. Catal. 1981, 67, 207–217. [Google Scholar] [CrossRef]
- Khuri, A.I.; Mukhopadhyay, S. Response Surface Methodology. WIREs Comp. Stat. 2010, 2, 128–149. [Google Scholar] [CrossRef]
Figure 1.
Reaction time-temperature profile.

Figure 2.
Two-phase system (γNaOH = 3.6 g/L).

Figure 3.
Mass concentration (γ ± σ, N = 3) and mass fraction (w ± σ, N = 3) of residual formaldehyde as a function of NaOH mass concentration.
Figure 3.
Mass concentration (γ ± σ, N = 3) and mass fraction (w ± σ, N = 3) of residual formaldehyde as a function of NaOH mass concentration.

Figure 4.
Volume of heavy phase (V ± σ, N = 3) and mass fraction of water (w ± σ, N = 3) in the light phase as a function of initial NaOH mass concentration.
Figure 4.
Volume of heavy phase (V ± σ, N = 3) and mass fraction of water (w ± σ, N = 3) in the light phase as a function of initial NaOH mass concentration.

Figure 5.
Chromatograms obtained for crude n-butanol solution and light phase distillate (γNaOH = 7.2 g/L).
Figure 5.
Chromatograms obtained for crude n-butanol solution and light phase distillate (γNaOH = 7.2 g/L).

Figure 6.
Conceptual process flowsheet for n-butanol recovery (T-mixing tank, HX-heat exchanger, D-decanter, E-evaporator, DC-distillation column).
Figure 6.
Conceptual process flowsheet for n-butanol recovery (T-mixing tank, HX-heat exchanger, D-decanter, E-evaporator, DC-distillation column).

Figure 7.
Temperature vs. enthalpy flowrate curves of the proposed design operating at atmospheric pressure (ΔTmin = 10 °C). (a) Composite curves; (b) Grand Composite Curve (T*-shifted temperature).
Figure 7.
Temperature vs. enthalpy flowrate curves of the proposed design operating at atmospheric pressure (ΔTmin = 10 °C). (a) Composite curves; (b) Grand Composite Curve (T*-shifted temperature).

Figure 8.
Temperature vs. enthalpy flowrate curves of the proposed design operating under optimized conditions (ΔTmin = 10 °C). (a) Composite curves; (b) Grand composite curve (T*-shifted temperature).
Figure 8.
Temperature vs. enthalpy flowrate curves of the proposed design operating under optimized conditions (ΔTmin = 10 °C). (a) Composite curves; (b) Grand composite curve (T*-shifted temperature).

Figure 9.
Flowsheet of heat-integrated process (T-mixing tank, HX-heat exchanger, D-decanter, E-evaporator, DC-distillation column).
Figure 9.
Flowsheet of heat-integrated process (T-mixing tank, HX-heat exchanger, D-decanter, E-evaporator, DC-distillation column).

Figure 10.
Results of sensitivity analysis at 25% tax rate on profit. (a) Nominal price; (b) Critical price; (c) Limiting price.
Figure 10.
Results of sensitivity analysis at 25% tax rate on profit. (a) Nominal price; (b) Critical price; (c) Limiting price.

Figure 11.
Results of sensitivity analysis at 0% tax rate on profit. (a) Nominal price; (b) Critical price; (c) Limiting price.
Figure 11.
Results of sensitivity analysis at 0% tax rate on profit. (a) Nominal price; (b) Critical price; (c) Limiting price.


Table 1.
Gas chromatography peak table.
| ΦAtotal (%) | |||||||
|---|---|---|---|---|---|---|---|
| Name | Component | tr (min) | Crude N-Butanol | γNaOH (2.4 g/L) | γNaOH (3.6 g/L) | γNaOH (4.8 g/L) | γNaOH (7.2 g/L) |
| A | methanol | 4.62 | 0.574 | 0.399 | 0.586 | 0.373 | 0.689 |
| B | isobutanol | 10.01 | 0.050 | 0.055 | 0.056 | 0.054 | 0.058 |
| C | n-butanol | 11.36 | 98.928 | 99.124 | 98.877 | 99.310 | 98.929 |
| D | / | 16.90 | 0.097 | 0.099 | 0.100 | 0.096 | 0.102 |
| E | / | 17.95 | 0.092 | 0.001 | 0.008 | 0.001 | 0.005 |
| ΣϕA | 99.741 | 99.678 | 99.627 | 99.834 | 99.783 | ||
| Npeaks | 37 | 38 | 52 | 33 | 41 | ||
Table 2.
Hot and cold process streams (nominal operating conditions).
| Name | TS (°C) | TT (°C) | H (kW) | Type |
|---|---|---|---|---|
| HX1 | 25 | 85 | 58 | Cold |
| HX2 | 114 | 115 | 183 | Cold |
| HX4 | 117 | 118 | 202 | Cold |
| HX3-C | 115 | 114 | 164 | Hot |
| HX3-SC | 114 | 52 | 41 | Hot |
| HX5 | 117 | 40 | 55 | Hot |
| HX6-C | 96 | 89 | 136 | Hot |
| HX6-SC | 89 | 40 | 21 | Hot |
C–condensation; SC–subcooling.
Table 3.
Hot and cold process streams (optimized operating conditions).
| Name | TS (°C) | TT(°C) | H(kW) | Type |
|---|---|---|---|---|
| HX1 | 25 | 85 | 58 | Cold |
| HX2 | 68 | 69 | 163 | Cold |
| HX4 | 129 | 130 | 200 | Cold |
| HX3-C | 69 | 52 | 186 | Hot |
| HX5 | 129 | 40 | 65 | Hot |
| HX6-C | 107 | 101 | 122 | Hot |
| HX6-SC | 101 | 40 | 24 | Hot |
C–condensation; SC–subcooling.
Table 4.
Profitability analysis results.
| Scenario 1 | Scenario 2 | |
|---|---|---|
| Capacity (t/h) | 1.0 | 0.1 |
| Equipment cost a (MEUR) | 0.877 | 0.352 |
| Working capital (MEUR) | 0.201 | 0.080 |
| Total capital investment (MEUR) | 1.539 | 0.617 |
| Operating cost (MEUR/a) b | 0.599 | 0.060 |
| Total cost (MEUR/a) c | 0.874 | 0.227 |
| Revenue (MEUR/a) | 9.110 | 0.911 |
| NPV (MEUR) | 23.722 | 1.634 |
| ROI (%) | 383 | 79 |
a Estimated using Aspen Process Economic Analyzer. The equipment cost includes vacuum system cost. b COperating = CSodium Hydroxide + CHot Utility + CCold Utility + Celectricity + CWaste Disposal. c CTotal = COperating + CMaintenance + CLabor.
Publisher’s Note: MDPI stays neutral with regard to jurisdictional claims in published maps and institutional affiliations. |
© 2022 by the authors. Licensee MDPI, Basel, Switzerland. This article is an open access article distributed under the terms and conditions of the Creative Commons Attribution (CC BY) license (https://creativecommons.org/licenses/by/4.0/).
Share and Cite
MDPI and ACS Style
Bogataj, M.; Kravanja, Z.; Nemet, A. Recovery of N-Butanol from a Complex Five-Component Reactive Azeotropic Mixture. Processes 2022, 10, 364. https://doi.org/10.3390/pr10020364
AMA Style
Bogataj M, Kravanja Z, Nemet A. Recovery of N-Butanol from a Complex Five-Component Reactive Azeotropic Mixture. Processes. 2022; 10(2):364. https://doi.org/10.3390/pr10020364
Chicago/Turabian StyleBogataj, Miloš, Zdravko Kravanja, and Andreja Nemet. 2022. "Recovery of N-Butanol from a Complex Five-Component Reactive Azeotropic Mixture" Processes 10, no. 2: 364. https://doi.org/10.3390/pr10020364
Note that from the first issue of 2016, this journal uses article numbers instead of page numbers. See further details here.