
Assessment of the Influence of Protective Polymer Coating on Panda Fiber Performance Based on the Results of Multivariant Numerical Simulation


Abstract
:1. Introduction
1.1. Research Objectives
- Influence analysis of the effect of optical fiber material behavior models on technological residual stresses during workpiece cooling.
- Influence analysis of the effect of quartz glass and material behavior models on deformation and contact parameters of Panda fiber during its indentation into aluminum half-space.
- Influence analysis of the effect of load, in the presence of one layer of protective coating, on deformation, optical and contact parameters of the system “fiber-half-space” during indentation.
1.2. Problem Context
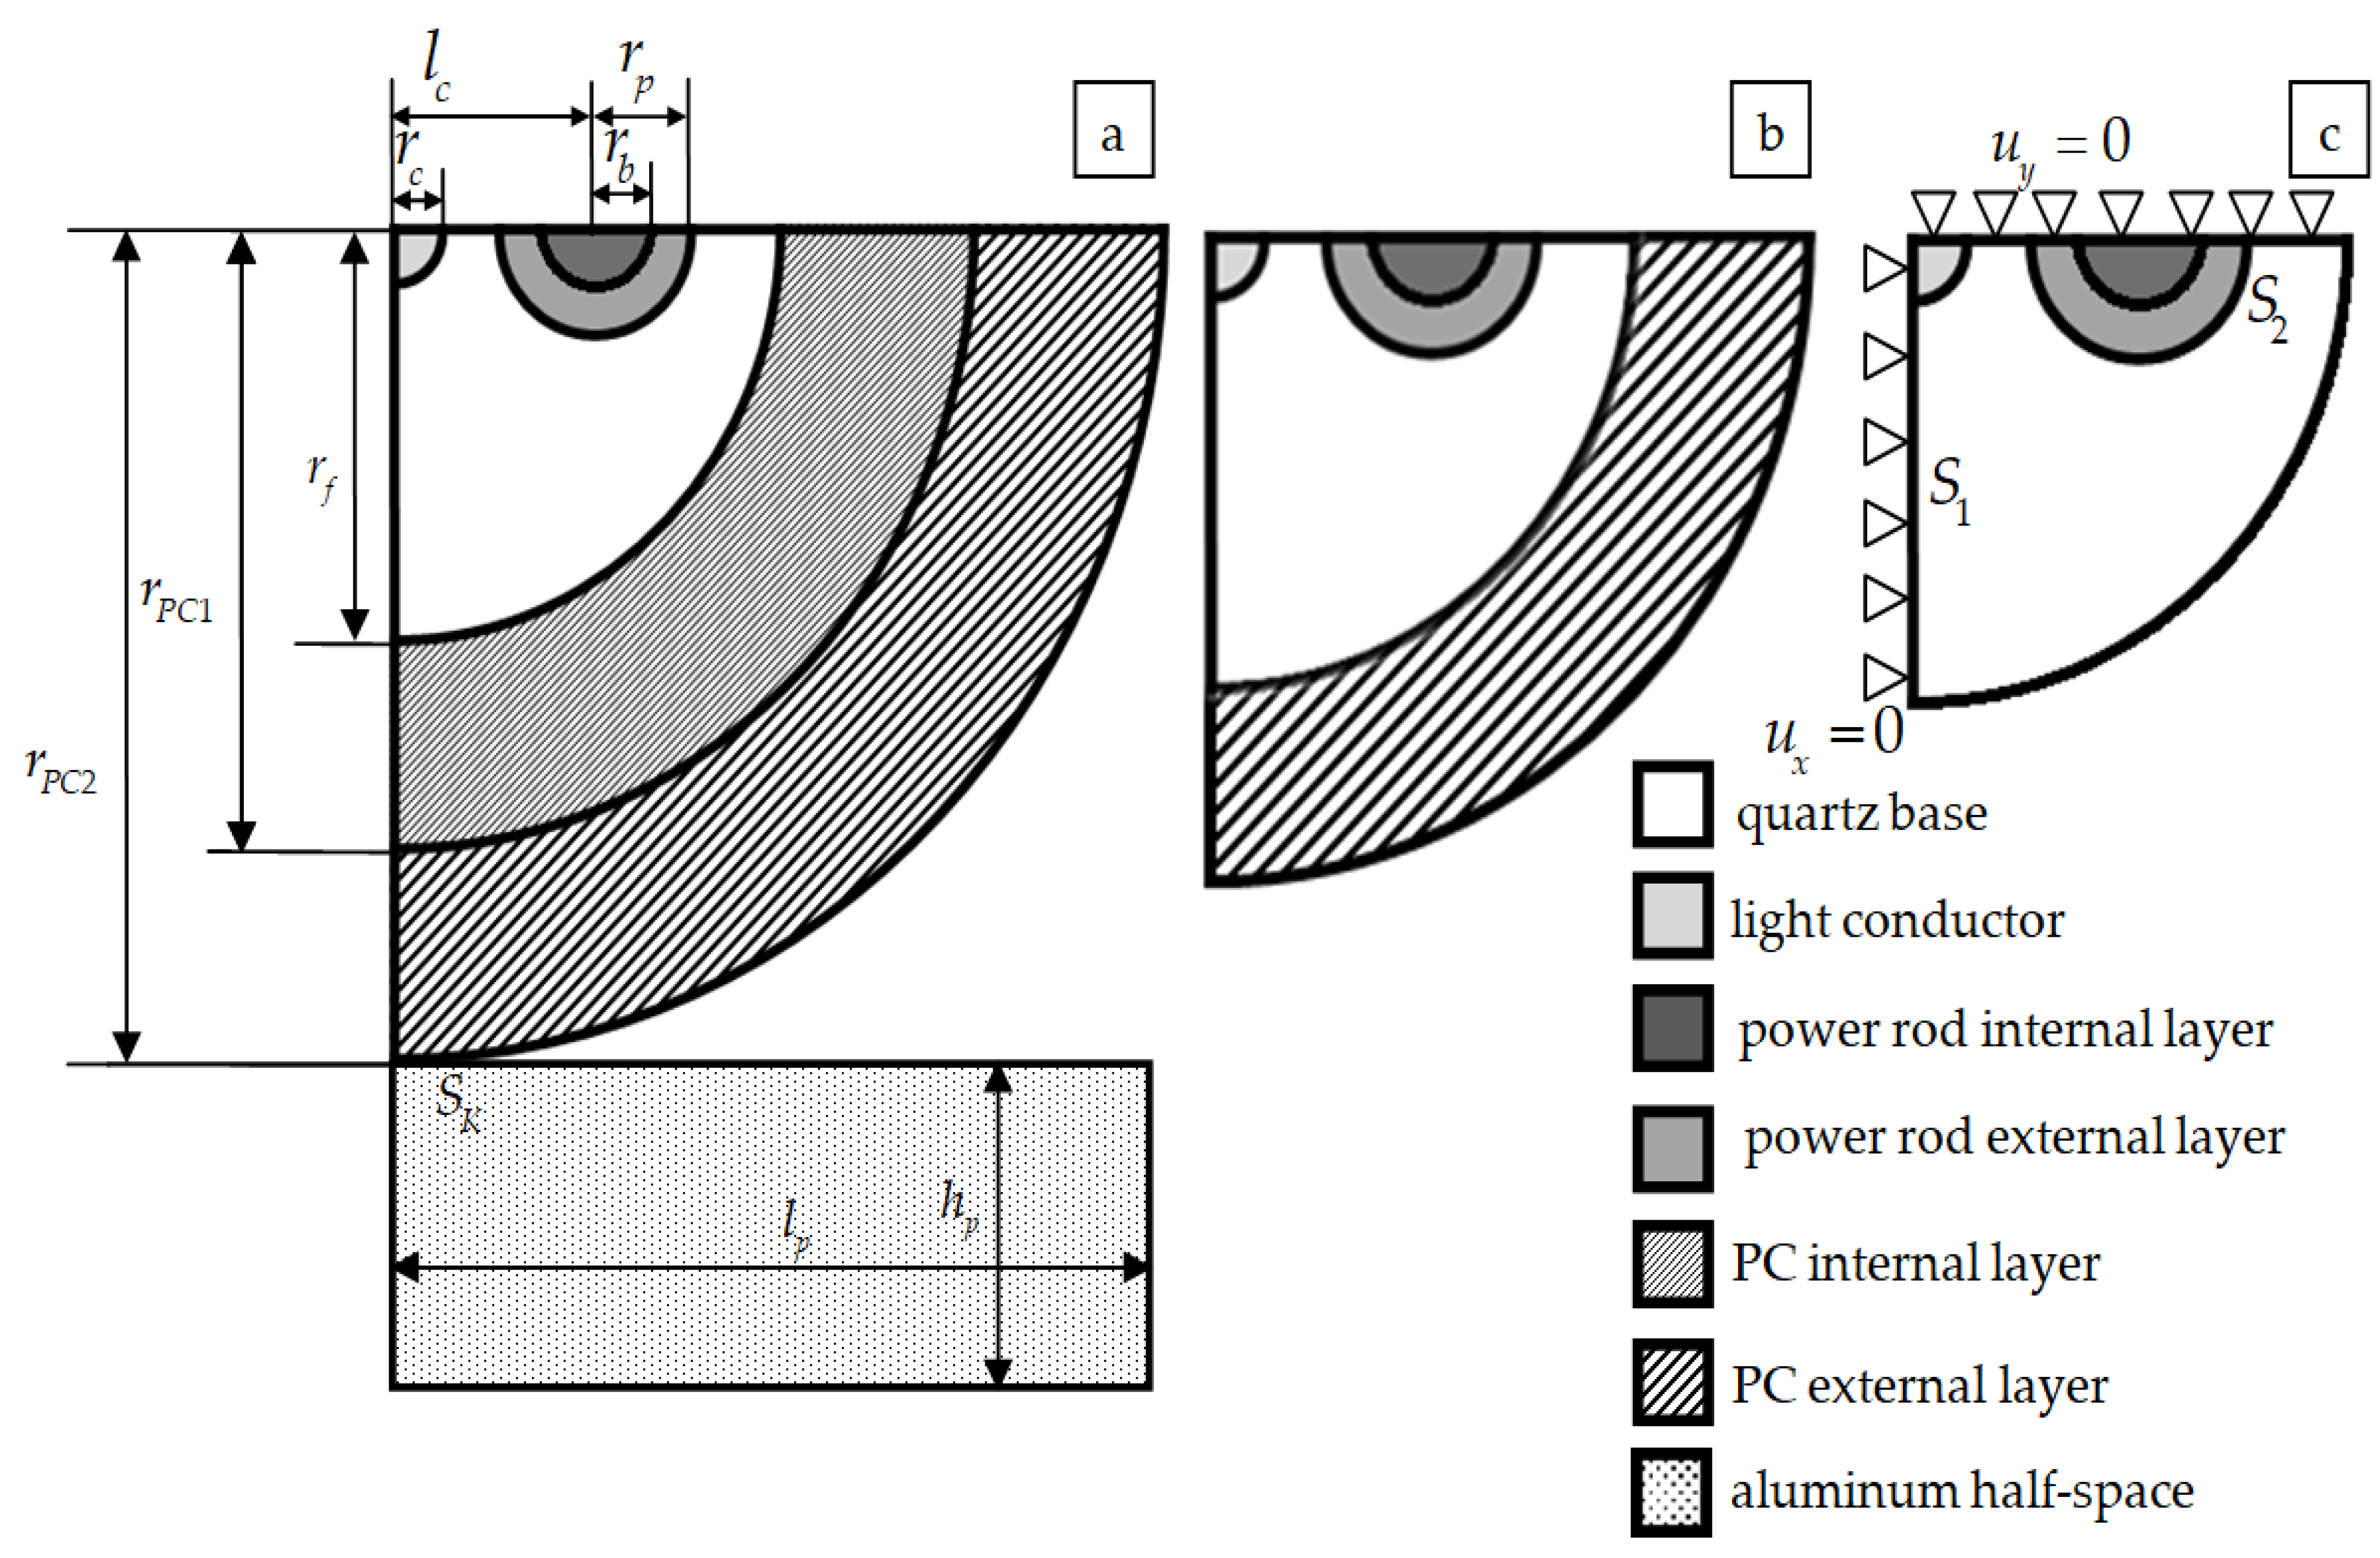
1.3. Problem Description
2. Materials and Methods
2.1. Optical Fiber Models for the Study of Stress–Strain State
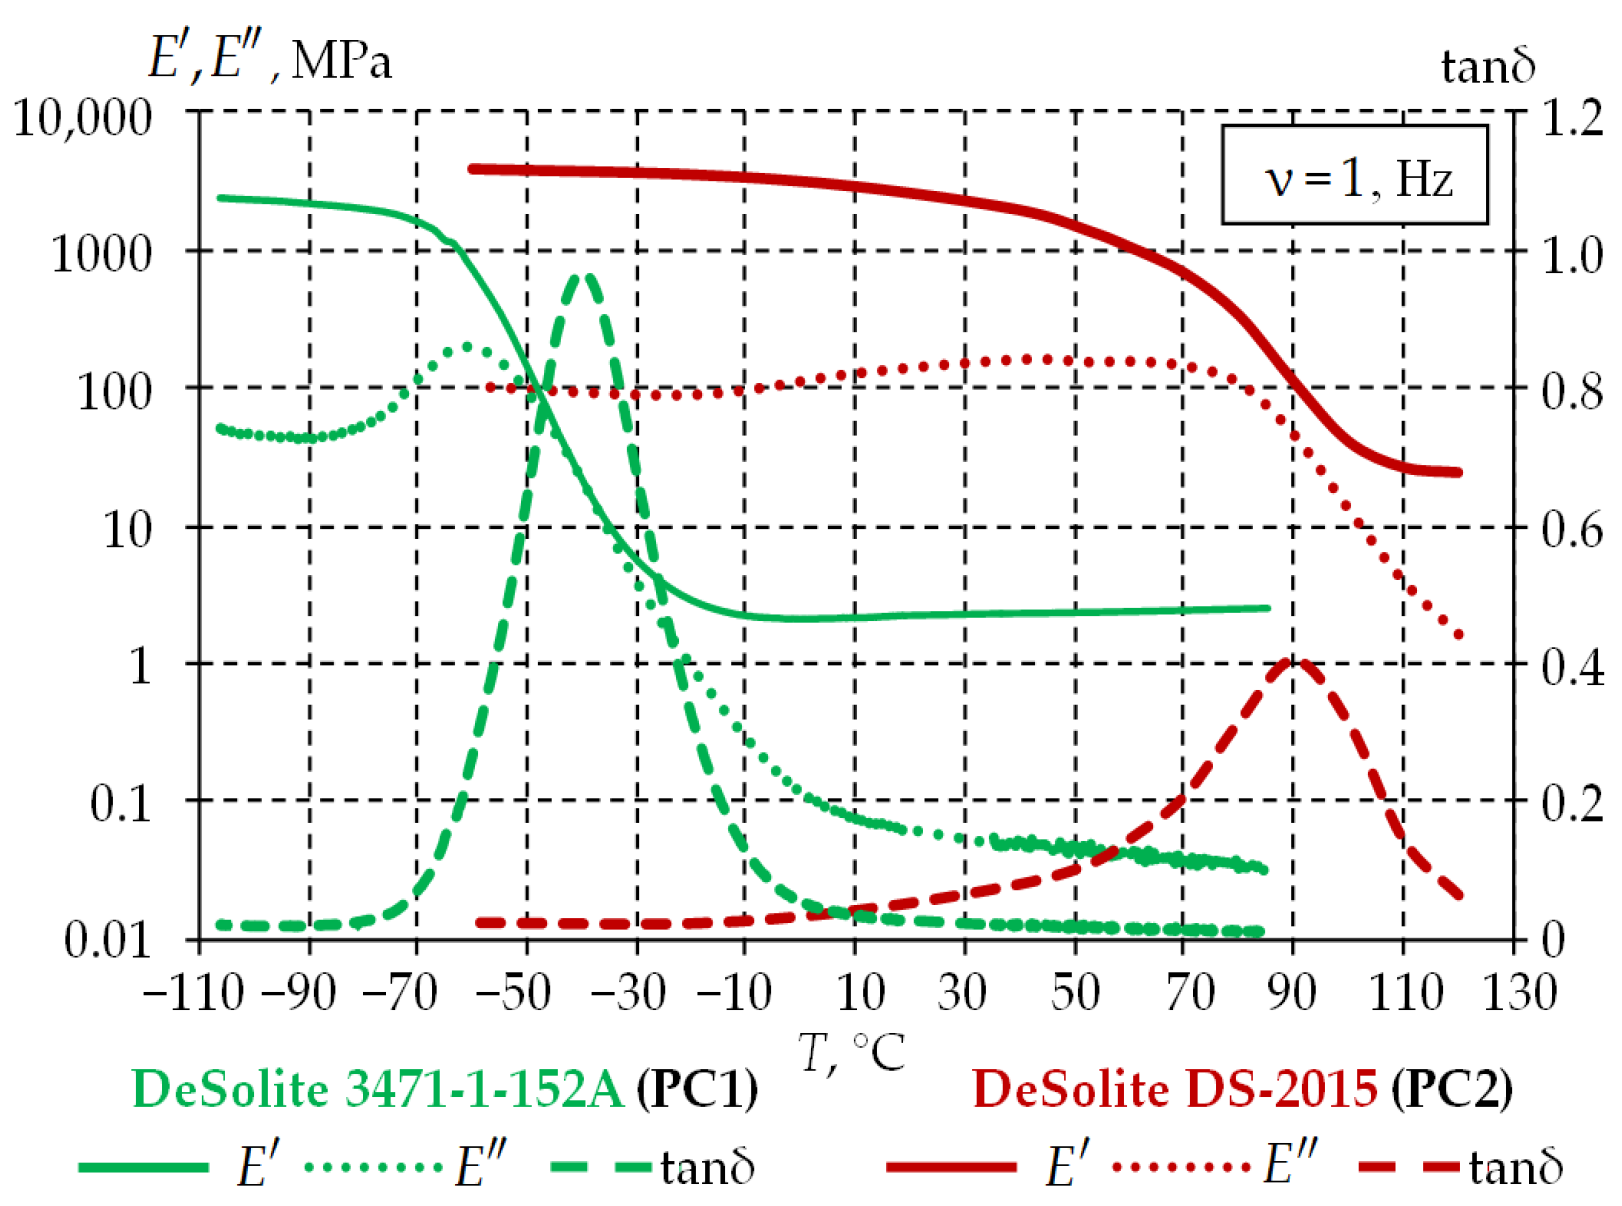
2.2. Materials
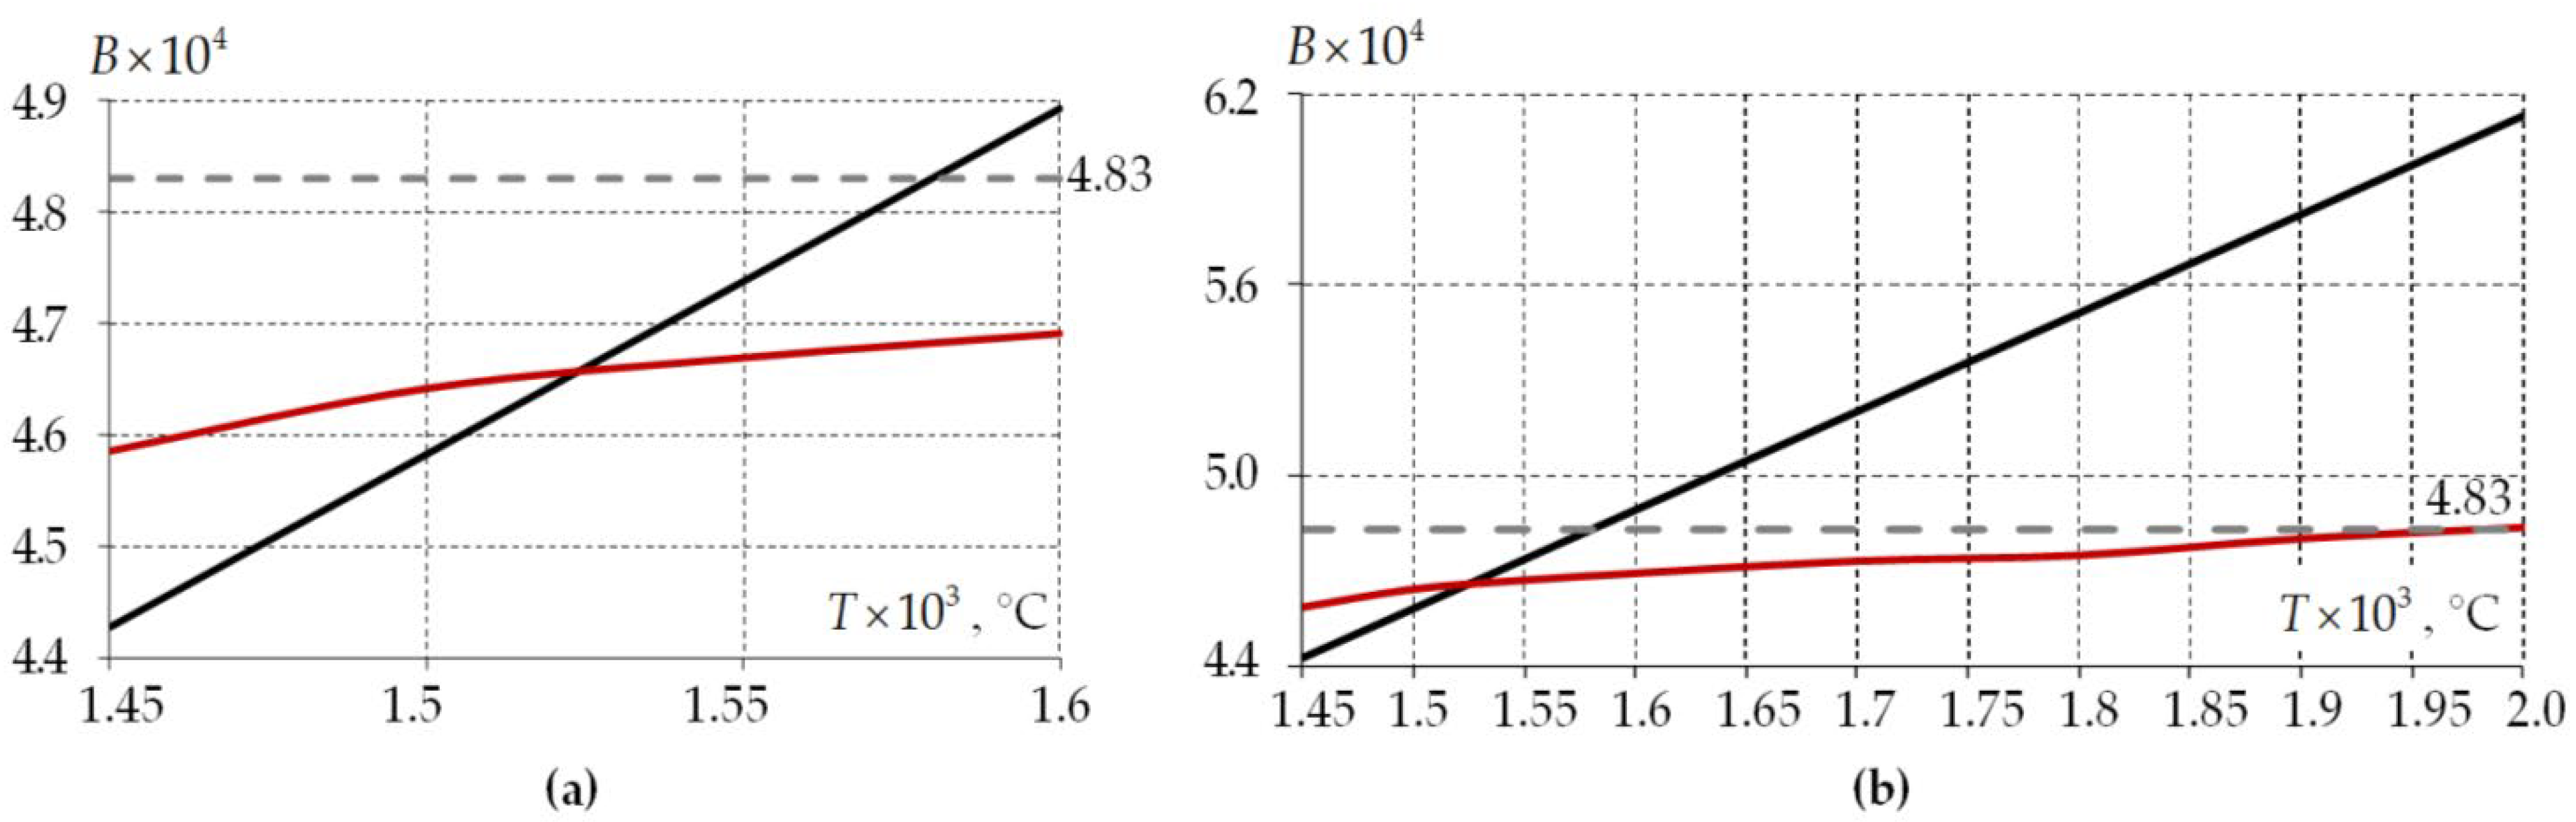
2.3. Fiber Optical Parameters
2.4. Numerical Finite Element and Methods
3. Results
3.1. The Influence Investigation of the Effect of the Glass Material Behavior Model on the Residual Stresses during Cooling of the Workpiece
3.2. Comparative Analysis of Deformation Parameters of the Solution of the Fiber Indentation Problem with Single- and Two-Layer Polymer Coating under Different Models of Material Behavior
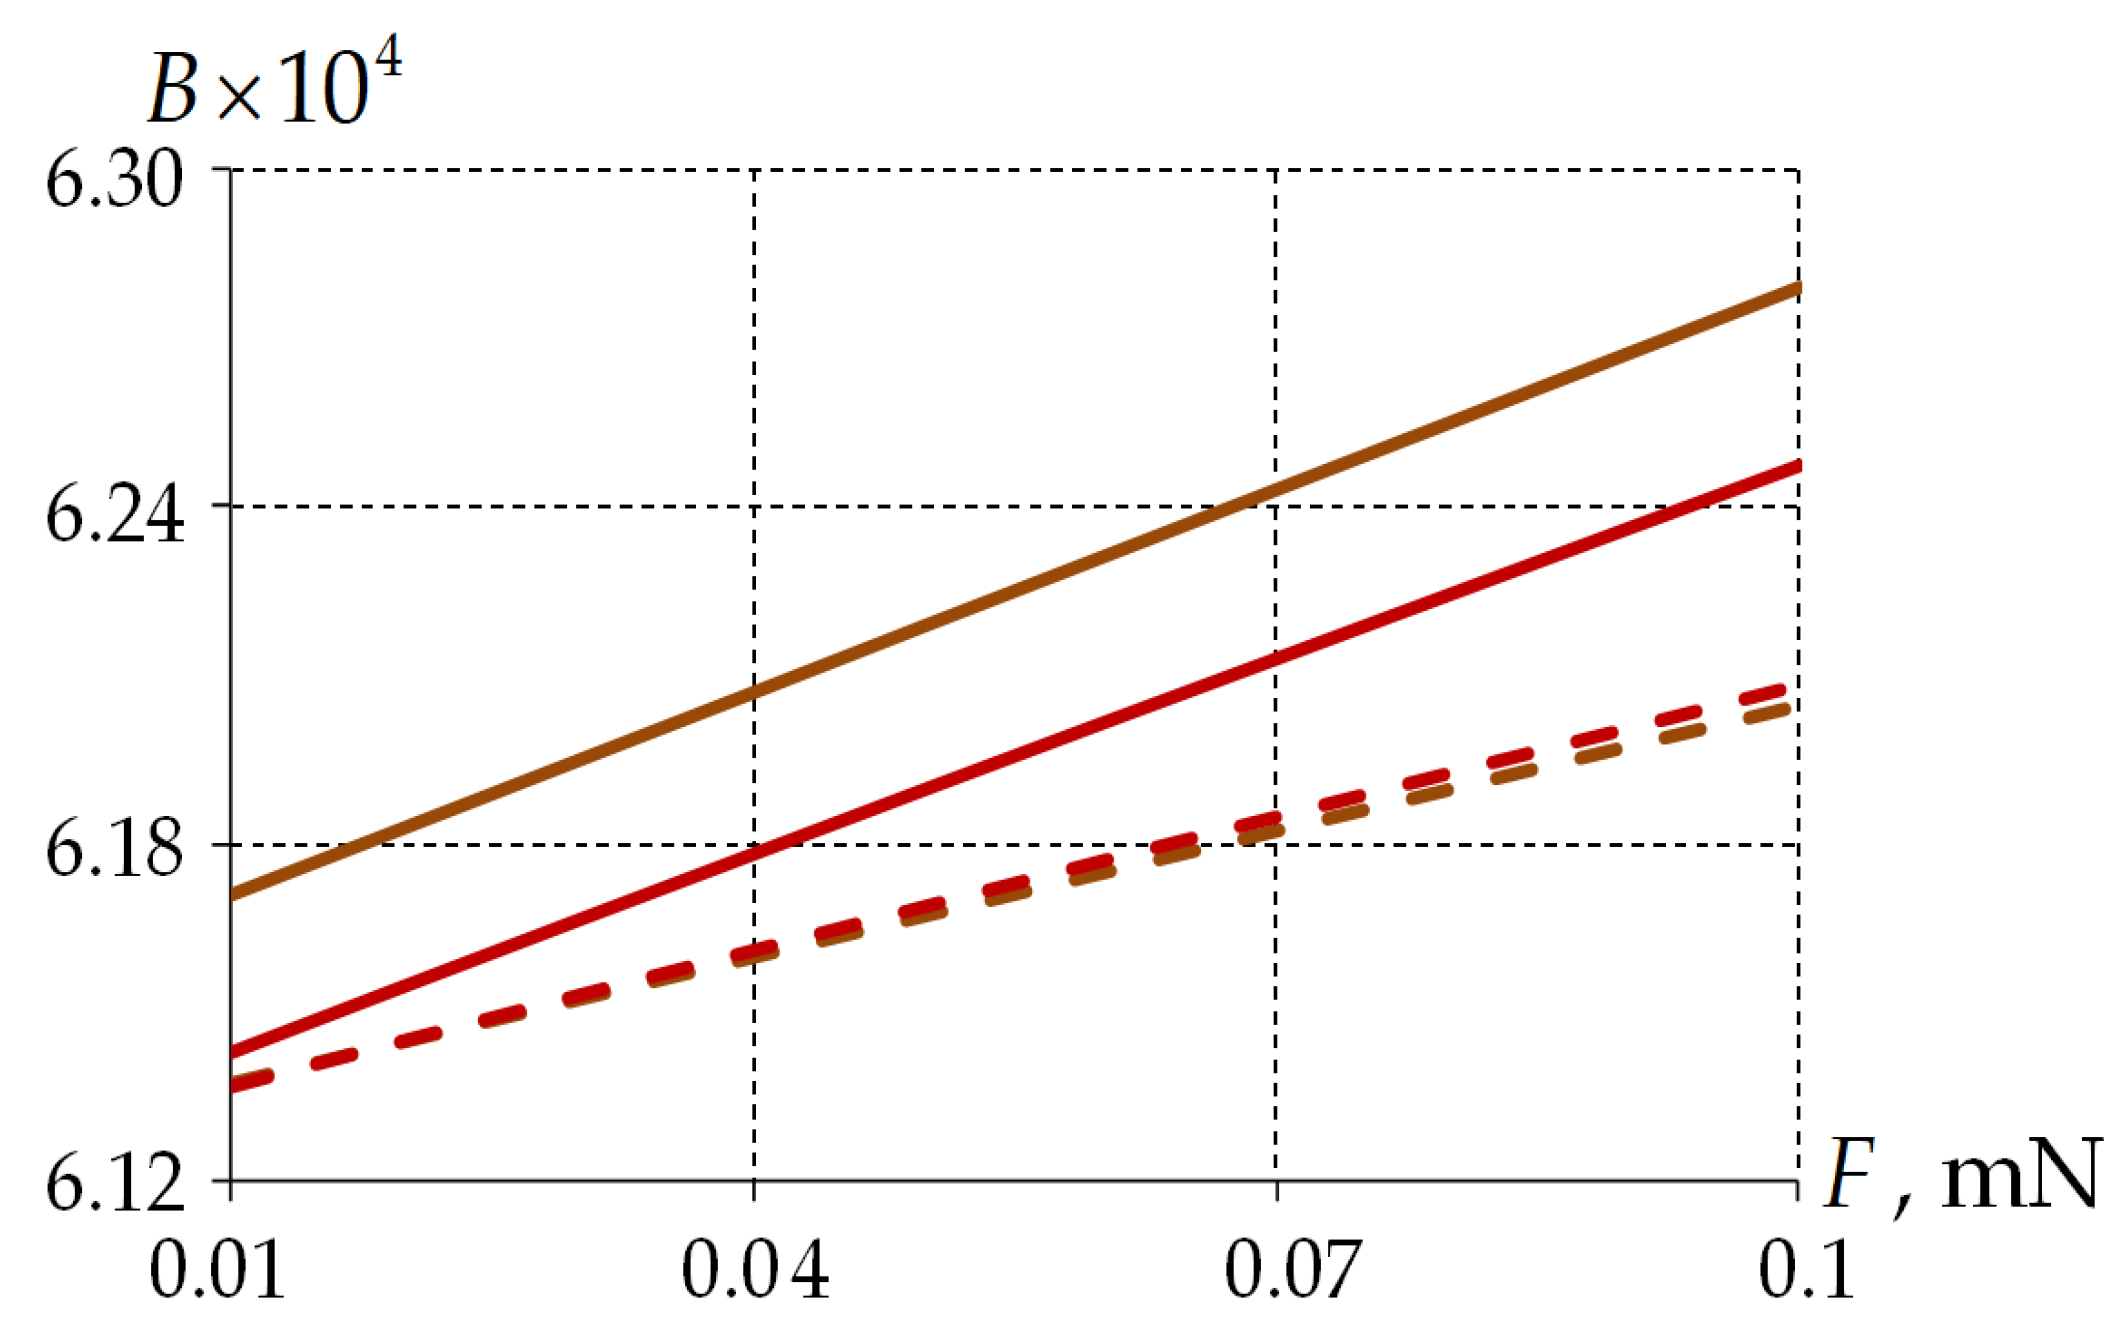
3.3. Assessment of the Load Level Effect on the Behavior of Panda-Type Optical Fibers in Single- and Double-Layer Protective Coatings
- -
- Single-layer PC—increase in by 3.55 and 9.19 times, by 3.55 and 9.19 times with elastic and viscoelastic behaviors of PC2 material, respectively.
- -
- Two-layer PC—increase in by 7.33 and 7.37 times, by 7.29 and 7.37 times for elastic and viscoelastic behaviors of PC2 material, respectively.
- -
- is on average 90.17% and 84.82% smaller for single-layer and two-layer PCs, respectively;
- -
- is on average 10.14 and 15.64 times larger for single-layer and two-layer PCs, respectively.
- -
- Single-layer PC—increase in by 3.18 and 3.41 times, radius of contact by 2.89 and 2.77 times for elastic and viscoelastic behaviors of PC2 material, respectively.
- -
- Two-layer PC—increase in by 2.95 and 3.38 times, radius of contact by 3.19 and 2.68 times for elastic and viscoelastic behaviors of PC2 material, respectively.
- -
- is on average 88% larger regardless of the PC geometry.
- -
- The contact radius is on average 7.34 and 7.68 times larger for single-layer and two-layer PCs, respectively.
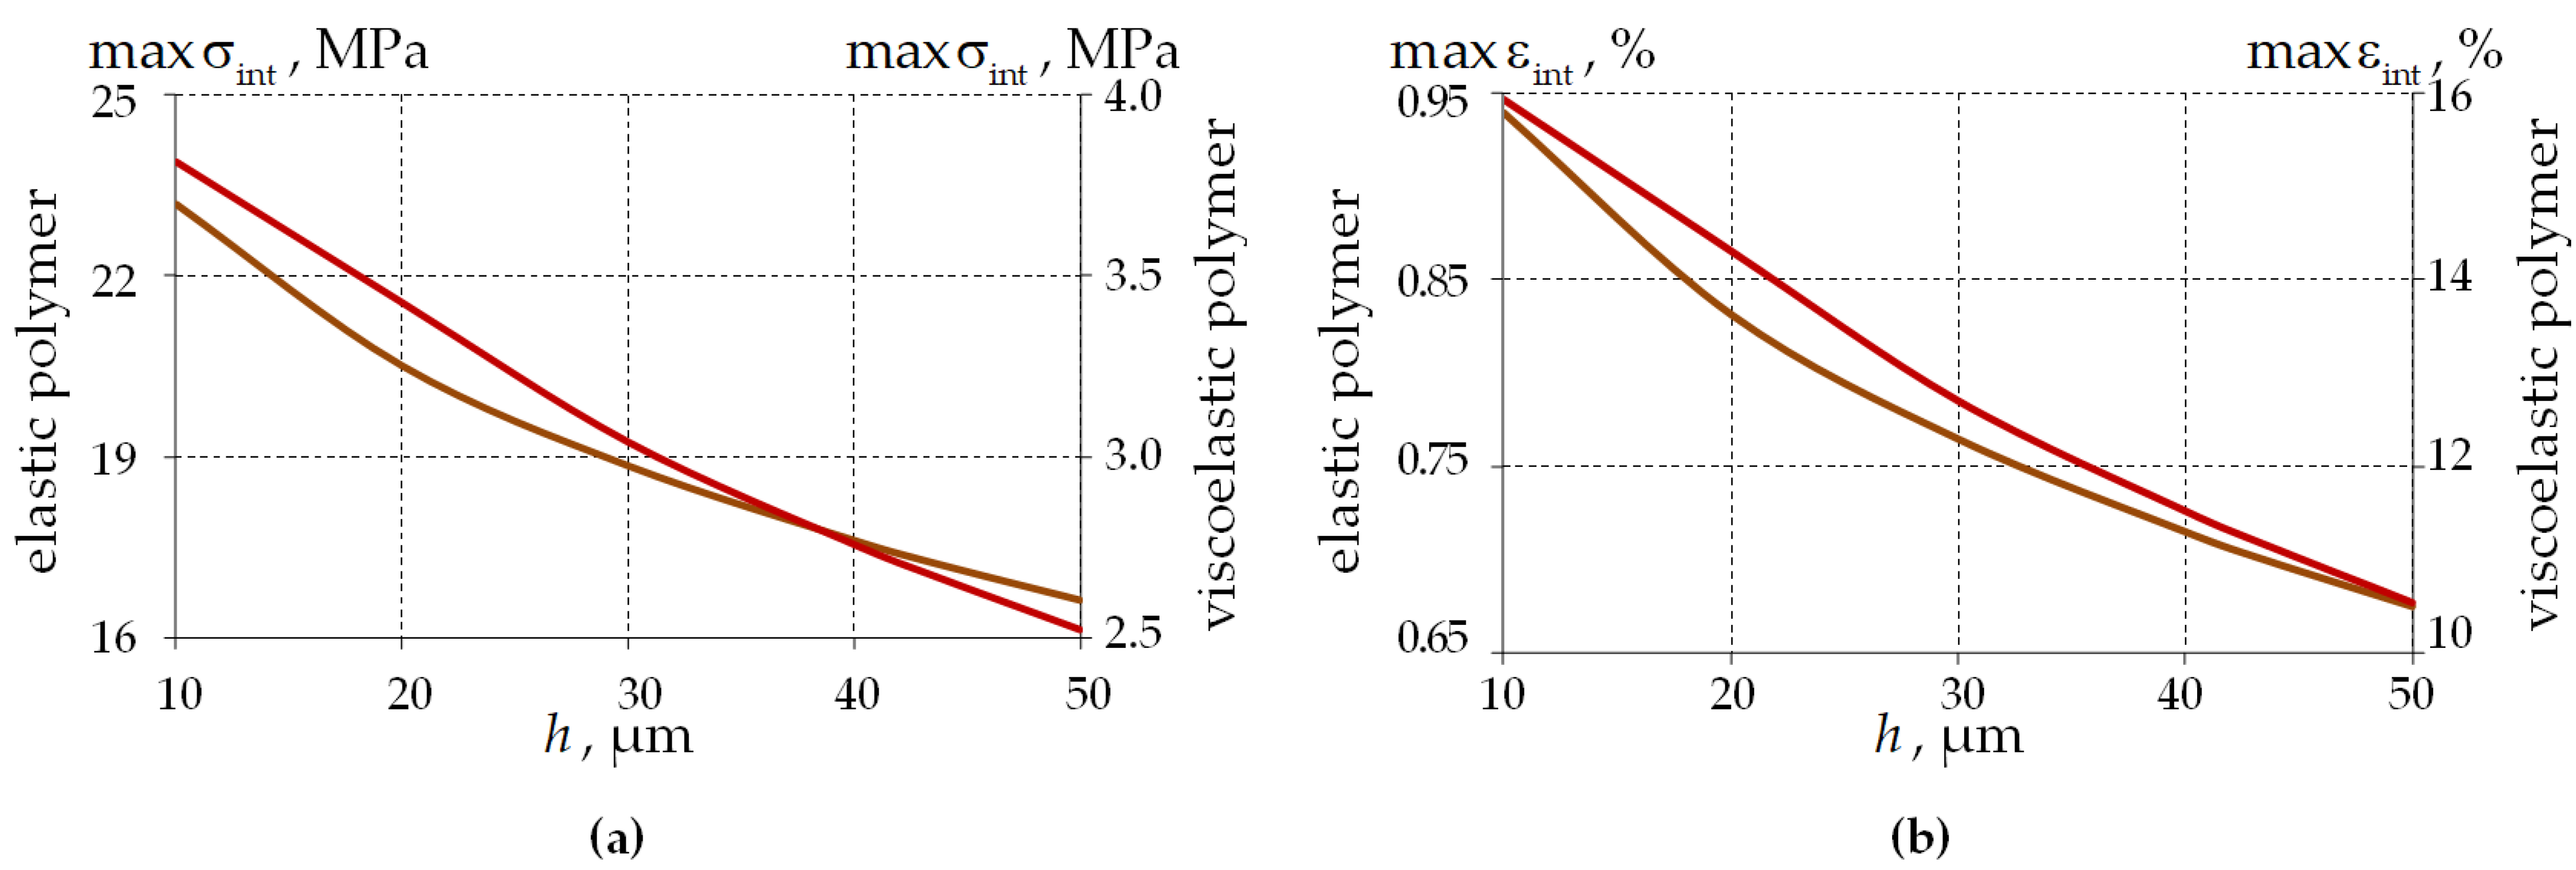
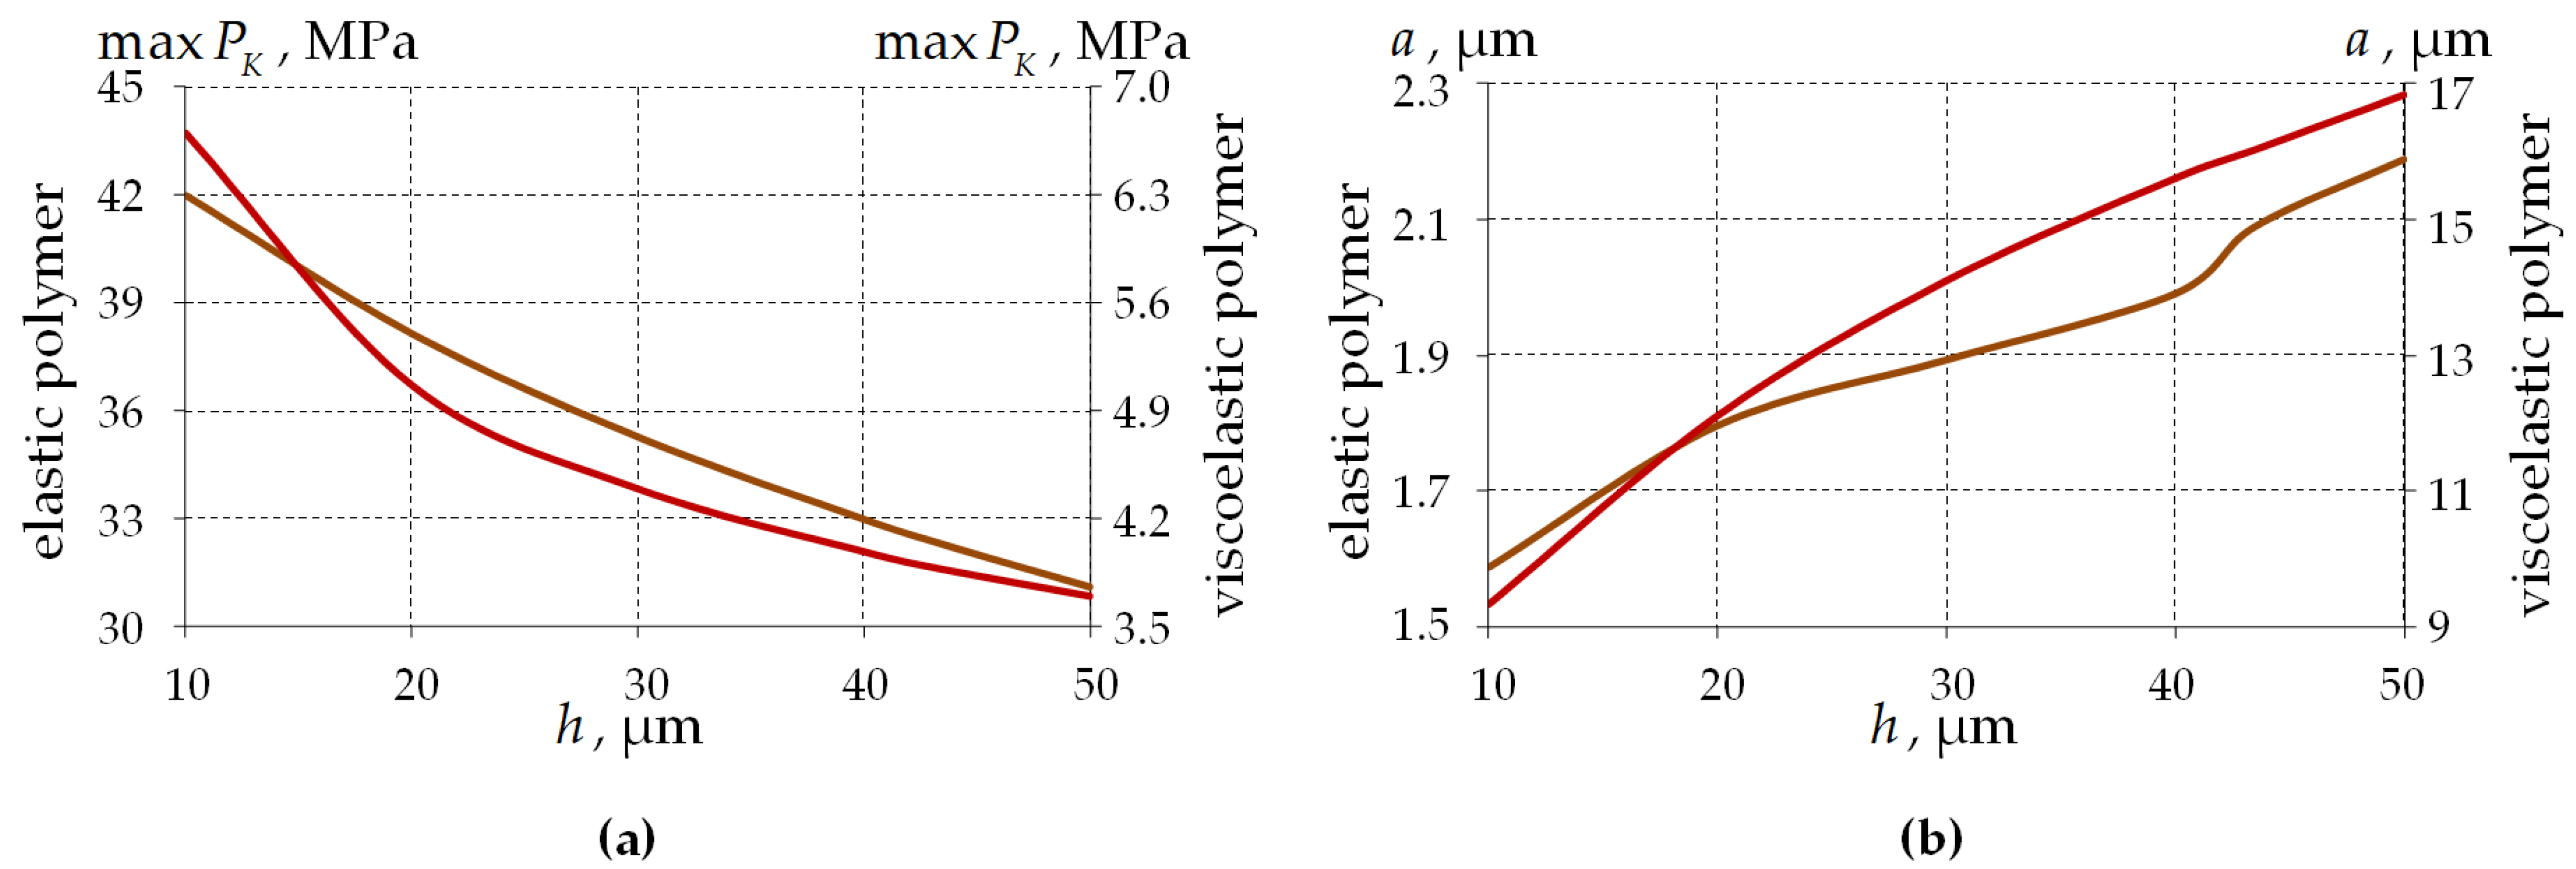
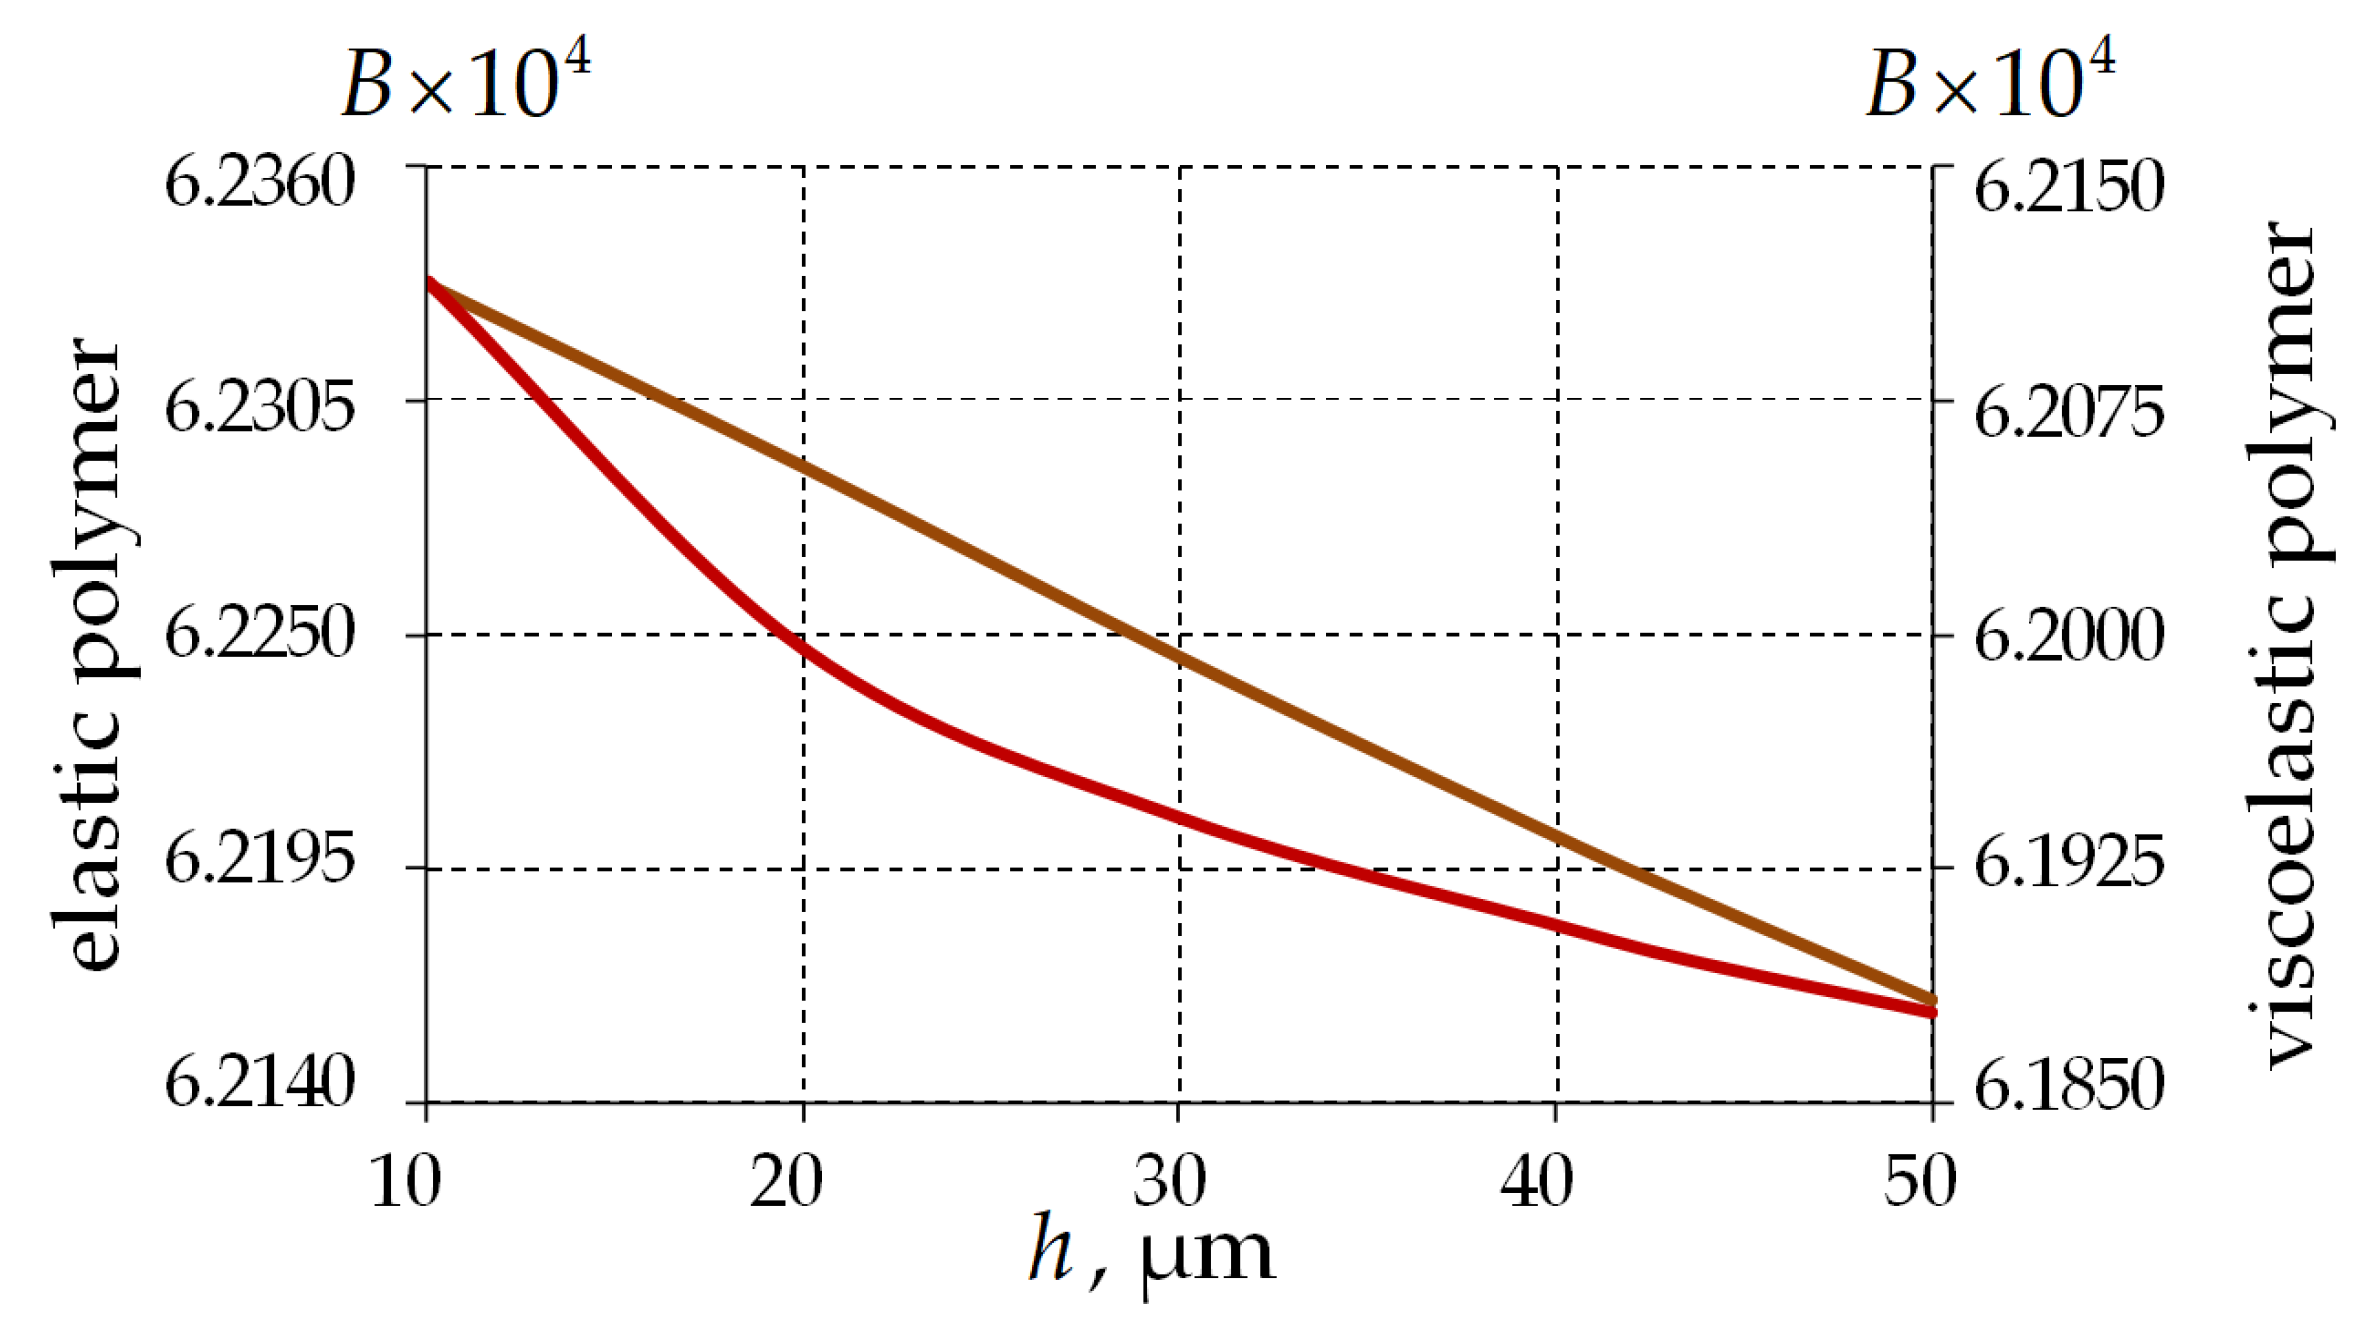
3.4. Analysis of the Effect of the Thickness of the Single-Layer Protective Coating on the Behavior of the Panda-Type Optical Fiber
4. Discussion
4.1. Limitation Statement
- The joint deformation of the surfaces of protective coatings and quartz fiber is considered.
- The constant coefficient of thermal expansion (CTE) of materials is used in the model. In [42], the temperature dependence of the CTE of protective coatings materials was established.
- Models for describing the viscoelastic behavior of materials are considered: glasses are the Anand model; PC polymers are the Prony series. The dependence of material constants on temperature was not taken into account in the first approximation of the simulation.
- The fiber has an ideal cross-sectional geometry.
- Experimental studies of frictional properties of polymer coating materials will be conducted. Friction parameters will be refined. Experimentally determined values and dependencies of the friction coefficient at different operating modes should be introduced into the model.
- The PC materials’ behavior during its curing with UV emitting on the technological stress fields of Panda optical fiber should be taken into account.
- Contact interaction at the boundaries of the fiber–coating interface and between PC layers (for multilayer PC) should be considered. The influence of the interface character (ideal contact, frictional contact, full adhesion) on the behavior of the numerical fiber model should be analyzed. Influence analysis of the effect of frictional properties of PC materials for quartz–polymer, polymer–polymer and polymer–aluminum material pairs on the behavior of the fiber–PC system should be conducted.
- Temperature variation should be accounted for in the model. The description of thermocycles should take into account real working temperatures of the study object. The influence investigation of thermocycle parameters on fiber performance at the constant coefficient of thermal expansion of protective coating polymers should be conducted.
- The behavior model of protective coating materials should be refined by taking into account the dependence of the CTE of PC materials on temperature. Influence analysis of the effect of the refined model of material behavior on the optical and deformation characteristics of Panda optical fiber should be conducted.
4.2. Main Results
5. Conclusions
Author Contributions
Funding
Institutional Review Board Statement
Data Availability Statement
Conflicts of Interest
References
- Drissi-Habti, M.; Abhijit, N.; Sriharsha, M.; Carvelli, V.; Bonamy, P.-J. Concept of Placement of Fiber-Optic Sensor in Smart Energy Transport Cable under Tensile Loading. Sensors 2022, 22, 2444. [Google Scholar] [CrossRef] [PubMed]
- Wu, D.; Fang, F. Development of surface reconstruction algorithms for optical interferometric measurement. Front. Mech. Eng. 2021, 16, 1–31. [Google Scholar] [CrossRef]
- Kishida, K.; Imai, M.; Kawabata, J.; Guzik, A. Distributed Optical Fiber Sensors for Monitoring of Civil Engineering Structures. Sensors 2022, 22, 4368. [Google Scholar] [CrossRef]
- Lu, R.; Judd, J. Field-Deployable Fiber Optic Sensor System for Structural Health Monitoring of Steel Girder Highway Bridges. Infrastructures 2022, 7, 16. [Google Scholar] [CrossRef]
- Shiryayev, O.; Vahdati, N.; Yap, F.F.; Butt, H. Compliant Mechanism-Based Sensor for Large Strain Measurements Employing Fiber Optics. Sensors 2022, 22, 3987. [Google Scholar] [CrossRef] [PubMed]
- Guo, J.; Geng, T.; Yan, H.; Du, L.; Zhang, Z.; Sun, C. Implementation of a Load Sensitizing Bridge Spherical Bearing Based on Low-Coherent Fiber-Optic Sensors Combined with Neural Network Algorithms. Sensors 2021, 21, 37. [Google Scholar] [CrossRef]
- Bassil, A.; Chapeleau, X.; Leduc, D.; Abraham, O. Concrete Crack Monitoring Using a Novel Strain Transfer Model for Distributed Fiber Optics Sensors. Sensors 2020, 20, 2220. [Google Scholar] [CrossRef] [PubMed]
- Yan, L.; Wang, Q.; Yin, B.; Xiao, S.; Li, H.; Wang, M.; Liu, X.; Wu, S. Research on Simultaneous Measurement of Magnetic Field and Temperature Based on Petaloid Photonic Crystal Fiber Sensor. Sensors 2023, 23, 7940. [Google Scholar] [CrossRef] [PubMed]
- Fu, T.; Wei, P.; Han, X.; Liu, Q. Application of Fiber Bragg Grating Acoustic Emission Sensors in Thin Polymer-Bonded Explosives. Sensors 2018, 18, 3778. [Google Scholar] [CrossRef] [PubMed]
- Velarte, A.; Otin, A.; Giménez-Gómez, P.; Muñoz-Berbel, X.; Pueyo, E. Fiber-Optic-Based System for High-Resolution Monitoring of Stretch in Excised Tissues. Biosensors 2023, 13, 900. [Google Scholar] [CrossRef]
- Qiao, H.; Lin, Z.; Sun, X.; Li, W.; Zhao, Y.; Guo, C. Fiber Optic-Based Durability Monitoring in Smart Concrete: A State-of-Art Review. Sensors 2023, 23, 7810. [Google Scholar] [CrossRef]
- Kyselak, M.; Vavra, J.; Slavicek, K.; Grenar, D.; Hudcova, L. Long Distance Military Fiber-Optic Polarization Sensor Improved by an Optical Amplifier. Electronics 2023, 12, 1740. [Google Scholar] [CrossRef]
- Zheng, W.; Sugawara, H.; Malinsky, B. Fourier Analysis Method for Asymmetric Polarization-Maintaining Fiber Alignment. In National Fiber Optic Engineers Conference; Optica Publishing Group: Washington, DC, USA, 2012. [Google Scholar] [CrossRef]
- Wang, L.; Liao, M.; Yu, F.; Li, W.; Xu, J.; Hu, L.; Gao, W. Thermal Sensitivity of Birefringence in Polarization-Maintaining Hollow-Core Photonic Bandgap Fibers. Photonics 2023, 10, 103. [Google Scholar] [CrossRef]
- Chen, J.; Wang, J.; Wang, N.; Ruan, J.; Zhang, J.; Zhu, Y. An Improved Acoustic Pick-Up for Straight Line-Type Sagnac Fiber Optic Acoustic Sensing System. Sensors 2022, 22, 8193. [Google Scholar] [CrossRef] [PubMed]
- Zhang, Q.; Li, C.; Li, H.; Liu, Y.; Wang, J.; Wang, X.; Wang, Y.; Cheng, F.; Han, H.; Zhang, P. A High-Precision Quartz Resonant Ultra-High Pressure Sensor with Integrated Pressure Conversion Structure. Micromachines 2023, 14, 1657. [Google Scholar] [CrossRef]
- McGovern, F.R.; Hernik, A.; Grogan, C.; Amarandei, G.; Naydenova, I. The Development of Optomechanical Sensors—Integrating Diffractive Optical Structures for Enhanced Sensitivity. Sensors 2023, 23, 5711. [Google Scholar] [CrossRef] [PubMed]
- Park, K.; Kim, C.; Kulkarni, A.; Shin, D.; Kim, H.-U.; Kim, K.; Kim, T. Effect of elastomer characteristics on fiber optic force sensing performance in biomedical robotics applications. J. Mech. Sci. Technol. 2018, 32, 5631–5636. [Google Scholar] [CrossRef]
- Kim, H.M.; Park, J.H.; Lee, S.K. Fabrication and measurement of optical waveguide sensor based on localized surface plasmon resonance. Micro Nano Syst. Lett. 2019, 7, 7. [Google Scholar] [CrossRef]
- Tang, Q.; Ruan, J.; Zuo, X.; Xie, Z.; Chen, X. All-Fiber In-Line Twist Sensor Based on a Capillary Optical Fiber. Photonics 2023, 10, 1052. [Google Scholar] [CrossRef]
- Pieniak, D.; Walczak, A.; Niewczas, A.M.; Przystupa, K. The Effect of Thermocycling on Surface Layer Properties of Light Cured Polymer Matrix Ceramic Composites (PMCCs) Used in Sliding Friction Pair. Materials 2019, 12, 2776. [Google Scholar] [CrossRef]
- Nečas, D.; Yarimitsu, S.; Rebenda, D.; Shinmori, H.; Vrbka, M.; Sawae, Y.; Murakami, T.; Křupka, I. On the Replacement of Articular Cartilage: The Friction of PVA Hydrogel Layer in Hip Simulator Test. Tribol. Int. 2023, 178, 108100. [Google Scholar] [CrossRef]
- Birleanu, C.; Pustan, M.; Pop, G.; Cioaza, M.; Popa, F.; Lazarescu, L.; Contiu, G. Experimental Investigation of the Tribological Behaviors of Carbon Fiber Reinforced Polymer Composites under Boundary Lubrication. Polymers 2022, 14, 3716. [Google Scholar] [CrossRef] [PubMed]
- Han, D.; Chen, Y.; Pan, Y.; Wang, C.; Zhang, D. Research on Friction and Wear Properties of Rubber Composites by Adding Glass Fiber during Mixing. Polymers 2022, 14, 2849. [Google Scholar] [CrossRef] [PubMed]
- Wu, J.; Li, Z.; Wen, G.; Liu, H.; Gao, Z.; Li, Y.; Zhao, Y.; Jin, M. Structure analysis of friction layer of copper matrix composites reinforced by composite ceramic (TiC-B4C) powder. Ceram. Int. 2023, 49, 23140–23152. [Google Scholar] [CrossRef]
- Pedroso, J.M.; Enger, M.; Bandeira, P.; Magalhães, F.D. Comparative Study of Friction and Wear Performance of PEK, PEEK and PEKK Binders in Tribological Coverings. Polymers 2022, 14, 4008. [Google Scholar] [CrossRef]
- Nirmal, U. Friction Performance of Aged T-BFRP Composite for Bearing Applications. Polymers 2018, 10, 1066. [Google Scholar] [CrossRef]
- Seward, O.; Cepero-Mejías, F.; Fairclough, J.P.A.; Kerrigan, K. Development of a Novel Friction Model for Machining Simulations in Unidirectional Composite Materials. Polymers 2022, 14, 847. [Google Scholar] [CrossRef] [PubMed]
- Huang, J.; Zhu, Z.; Zhang, L.; Guo, D.; Niu, Z.; Zhang, W. Effect of Contact Angle on Friction Properties of Superhydrophobic Nickel Surface. Photonics 2023, 10, 829. [Google Scholar] [CrossRef]
- Rinaldi, D.; Montalto, L.; Lebeau, M.; Mengucci, P. Influence of a Surface Finishing Method on Light Collection Behavior of PWO Scintillator Crystals. Photonics 2018, 5, 47. [Google Scholar] [CrossRef]
- Xu, K.; Yuan, C. A Fault Location Analysis of Optical Fiber Communication Links in High Altitude Areas. Electronics 2023, 12, 3728. [Google Scholar] [CrossRef]
- Shen, C.; Xie, Z.; Huang, Z.; Yan, S.; Sui, W.; Zhou, J.; Wang, Z.; Han, W.; Zeng, X. Review of the Status and Prospects of Fiber Optic Hydrogen Sensing Technology. Chemosensors 2023, 11, 473. [Google Scholar] [CrossRef]
- Peng, J.; Zhou, J.; Sun, C.; Liu, Q. Optical Fiber Temperature and Humidity Dual Parameter Sensing Based on Fiber Bragg Gratings and Porous Film. Sensors 2023, 23, 7587. [Google Scholar] [CrossRef] [PubMed]
- Bilal, M.M.; Lopez-Aguayo, S.; Thottoli, A. Numerical Analysis of Solid-Core Photonic Crystal Fiber Based on Plasmonic Materials for Analyte Refractive Index Sensing. Photonics 2023, 10, 1070. [Google Scholar] [CrossRef]
- Suhir, E. Effect of initial curvature on low temperature microbending in optical fibers. J. Light. Technol. 1899, 6, 1321–1327. [Google Scholar] [CrossRef]
- Shiue, S.-T. The effects of polymeric coatings on the low-temperature microbending losses in initially curved double-coated optical fibers. J. Appl. Phys. 1995, 78, 6384–6388. [Google Scholar] [CrossRef]
- Novikova, A.; Katiyi, A.; Halstuch, A.; Karabchevsky, A. Green-Graphene Protective Overlayer on Optical Microfibers: Prolongs the Device Lifetime. Nanomaterials 2022, 12, 2915. [Google Scholar] [CrossRef]
- Wang, K.; Liu, Q.-D.; Song, Y.-F.; Zhang, B.; Zeng, Q.-D.; Zhang, Y.-Y.; Wang, Z.-H. TiN/Ti3C2 Heterojunction Microfiber-Enhanced Four-Wave Mixing-Based All-Optical Wavelength Converter. Photonics 2023, 10, 1066. [Google Scholar] [CrossRef]
- Bourdine, A.V.; Demidov, V.V.; Ter-Nersesyants, E.V.; Pchelkin, G.A.; Shurupov, D.N.; Khokhlov, A.V.; Matrosova, A.S.; Kashin, A.I.; Bureev, S.V.; Dashkov, M.V.; et al. Twisted Silica Few-Mode Hollow GeO2-Doped Ring-Core Microstructured Optical Fiber. Photonics 2023, 10, 846. [Google Scholar] [CrossRef]
- Chand, M.; Kumar, A.; Sharma, M.K. A dual hesitant approach to evaluate fuzzy reliability of optical fiber communication (OFC) system. Life Cycle Reliab. Saf. Eng. 2023, 12, 163–174. [Google Scholar] [CrossRef]
- Zhang, X.F.; Qian, Z.D.; Zhang, M.; Chen, L. Numerical Simulation for Synergetic Deformation of Optical Fiber Sensor and Asphalt Mixture. KSCE J. Civ. Eng. 2019, 23, 3075–3087. [Google Scholar] [CrossRef]
- Shardakov, I.N.; Trufanov, A.N. Identification of the Temperature Dependence of the Thermal Expansion Coefficient of Polymers. Polymers 2021, 13, 3035. [Google Scholar] [CrossRef]
- Bergström, J. Mechanics of Solid Polymers; Elsevier Inc.: New York, NY, USA, 2015. [Google Scholar] [CrossRef]
- Lesnikova, Y.I.; Trufanov, A.N.; Kamenskikh, A.A. Analysis of the Polymer Two-Layer Protective Covering Impact on Panda-Type Optical Fiber under Bending. Polymers 2022, 14, 3840. [Google Scholar] [CrossRef] [PubMed]
- Shelby, J.E. Introduction to Glass Science and Technology; The Royal Society of Chemistry: Cambridge, UK, 2005. [Google Scholar] [CrossRef]
- Trufanov, A.N.; Trufanov, N.A. Models of the formation of the stress state in pm optical fiber. Appl. Photonics 2014, 1, 97–111. (In Russian) [Google Scholar] [CrossRef]
- Brown, S.B.; Kim, K.H.; Anand, L. An internal variable constitutive model for hot working of metals. Int. J. Plast. 1989, 5, 95–130. [Google Scholar] [CrossRef]
- Trufanov, A.N. Thermomechanical Processes in Special Optical Fibers during Their Production and Operation. Ph.D. Thesis, Tula State University, Tula, Russia, 17 October 2023. (In Russian). [Google Scholar]
- Smetannikov, O.Y. Models of Mechanical Behavior of Materials and Structures in Technological Processes with Thermorelaxation Transition. Ph.D. Thesis, Institute of Applied Mechanics, Izhevsk, Russia, 18 March 2011. (In Russian). [Google Scholar]
- Williams, M.L.; Landel, R.F.; Ferry, J.D. The temperature dependence of relaxation mechanisms in amorphous polymers and other glass-forming liquids. J. Am. Chem. Soc. 1955, 14, 3701–3707. [Google Scholar] [CrossRef]
- Lesnikova, Y.I. Mathematical Modeling of Thermoviscoelastic Behavior of Panda Type Optical Fibers and Its Structural Elements. Ph.D. Thesis, Perm National Research Polytechnic University, Perm, Russia, 21 February 2023. (In Russian). [Google Scholar]
- Lancry, M.; Régnier, E.; Poumellec, B. Fictive temperature in silica-based glasses and its application to optical fiber manufacturing. Prog. Mater. Sci. 2012, 57, 63–94. [Google Scholar] [CrossRef]
- Anand, L. Constitutive Equations for Hot-Working of Metals. Int. J. Plast. 1985, 3, 213–231. [Google Scholar] [CrossRef]
- Puchi-Cabrera, E.S.; Guérin, J.D.; Barbera-Sosa, J.G.; Dubar, M.; Dubar, L. Plausible Extension of Anand’s Model to Metals Exhibiting Dynamic Recrystallization and its Experimental Validation. Int. J. Plast. 2018, 108, 70–87. [Google Scholar] [CrossRef]
- Liu, J.; Liu, Y.; Xu, T. Analytical Estimation of Stress-Induced Birefringence in Panda-Type Polarization-Maintaining Fibers. IEEE Photonics Technol. Lett. 2020, 32, 1507–1510. [Google Scholar] [CrossRef]
- Guan, R.; Zhu, F.; Gan, Z.; Huang, D.; Liu, S. Stress birefringence analysis of polarization maintaining optical fibers. Opt. Fiber Technol. 2005, 11, 240–254. [Google Scholar] [CrossRef]
- Li, H.; Li, X.; Zhang, Y.; Liu, P.; Yang, H. Design of high birefringence stress-induced polarization-maintaining fiber based on utilizing geometrical birefringence. Opt. Fiber Technol. 2019, 53, 102065. [Google Scholar] [CrossRef]
- Cui, Z.; Shao, G.; Zhang, M.; Tian, Y.; Chai, Q.; Chu, Y.; Zhang, J. Size-dependent viscosity of silica optical fiber under high temperature. Opt. Mater. Express 2023, 13, 2302–2315. [Google Scholar] [CrossRef]
- Edwards, H.G.M.; Vandenabeele, P.; Colomban, P. Glass, Pottery and Enamelled Artefacts. In Raman Spectroscopy in Cultural Heritage Preservation; Edwards, H.G.M., Vandenabeele, P., Colomban, P., Eds.; Springer: Cham, Switzerland, 2023; pp. 251–288. [Google Scholar] [CrossRef]
- Moore, L.; Smith, C. Fused silica as an optical material [Invited]. Opt. Mater. Express 2022, 12, 3043–3059. [Google Scholar] [CrossRef]
- Yablon, A.D. Optical and mechanical effects of frozen-in stresses and strains in optical fibers. IEEE J. Sel. Top. Quantum Electron. 2004, 10, 300–311. [Google Scholar] [CrossRef]
- Li, M.; Li, X.; Li, H. Design of ultrahigh birefringent stress-induced polarization-maintaining fiber with hole-assistance. Opt. Fiber Technol. 2021, 67, 102707. [Google Scholar] [CrossRef]
- Varnham, M.; Payne, D.; Barlow, A.; Birch, R. Analytic solution for the birefringence produced by thermal stress in polarization-maintaining optical fibers. J. Light. Technol. 1983, 1, 332–339. [Google Scholar] [CrossRef]
- Ghanbarzadeh-Dagheyan, A.; Jalili, N.; Ahmadian, M.T. A holistic survey on mechatronic Systems in Micro/Nano scale with challenges and applications. J. Micro-Bio Robot. 2021, 17, 1–22. [Google Scholar] [CrossRef]
- Ji, Y.; Yang, W.; Wang, Y.; Li, Z. Overview of Foreign Inertial Technology Development. In Proceedings of the 2021 International Conference on Autonomous Unmanned Systems (ICAUS 2021); Changsha, China, 24–26 September 2021, Lecture Notes in Electrical Engineering; Springer: Singapore, 2022; pp. 975–983. [Google Scholar] [CrossRef]
- Jin, J.; He, J.; Ma, K.; Kong, L. Digital Closed-loop Fiber Optic Gyroscopes—A Choice for Micro/Nano-Satellites Application. In Proceedings of the 2019 IEEE International Symposium on Inertial Sensors and Systems, Naples, FL, USA, 1–5 April 2019. [Google Scholar] [CrossRef]
- Singh, B.; Rana, H.; Kumar, S.; Bhulania, P.; Minocha, G. A novel design of fiber optic gyroscope based INS system for U AS applications. Procedia Comput. Sci. 2015, 57, 1317–1323. [Google Scholar] [CrossRef]
- Lezzi, P.J.; Evke, E.E.; Aaldenberg, E.M.; Tomozawa, M. Surface Crystallization and Water Diffusion of Silica Glass Fibers: Causes of Mechanical Strength Degradation. J. Am. Ceram. Soc. 2015, 98, 2411–2421. [Google Scholar] [CrossRef]
- El Abdi, R.; Leite Pinto, R.; Guérard, G.; Capena, C. Influence of environment atmosphere on optical fiber strength. Int. J. Mechatron. Appl. Mech. 2022, 11, 41–43. [Google Scholar] [CrossRef]
- Wong, D. Effect of fiber coating on temperature sensitivity in polarimetric sensors. J. Light. Technol. 1992, 10, 842–846. [Google Scholar] [CrossRef]
- Bulatov, M.I.; Shatsov, A.A. Strength and fracture resistance of quartz fibers with polyimide coatings. Russ. J. Non-Ferr. Met. 2021, 62, 756–762. [Google Scholar] [CrossRef]
- Goicoechea, J.; Hernaez, M.; Zamarreño, C.; Arregui, F. Coatings for Optical Fiber Sensors. Compr. Mater. Process. 2014, 13, 103–119. [Google Scholar] [CrossRef]
- Hopf, B.A.; Fischer, B.; Lindner, M.; Koch, A.W.; Roths, J. Three-Dimensional-FEM Model with Experimentally Determined Material Parameters of an FBG Sensor Element in a Panda-Type Fiber. J. Light. Technol. 2018, 36, 1076–1083. [Google Scholar] [CrossRef]
- Zhang, Y.; Li, X.; Liu, C.; Li, H.; Du, S. Investigation of heat source position and fiber coil size for decreasing the FOG scale factor temperature error. Optik 2020, 204, 164203. [Google Scholar] [CrossRef]
- Gillooly, A.; Hill, M.; Read, T.; Maton, P. Next generation optical fibers for small diameter fiber optic gyroscope (FOG) coils. In Proceedings of the 2017 DGON Inertial Sensors and Systems (ISS), Karlsruhe, Germany, 19–20 September 2017. [Google Scholar] [CrossRef]


| Parameter | Value | Parameter | Value |
|---|---|---|---|
| 40 μm | 7.5 μm | ||
| 65 μm | 3.5 μm | ||
| 83.5 μm | 4 μm | ||
| 3 μm | 167 μm | ||
| 15 μm | 83.5 μm |
| Parameter | Mat. 1 | Mat. 2 | Mat. 3 | Mat. 4 | Mat. 5 | Mat. 6 | Mat. 7 |
|---|---|---|---|---|---|---|---|
| , MPa | 72,000 | 67,939 | 49,107 | 65,370 | 2.26 | 2467 | 68,600 |
| 0.170 | 0.168 | 0.203 | 0.181 | 0.498 | 0.350 | 0.340 | |
| , K−1 | 0.500 | 1.055 | 2.675 | 2.886 | 200 | 50 | 23 |
| No. Design Case | , MPa | , % | ||
|---|---|---|---|---|
| Material PC1 | Material PC2 | Material PC1 | Material PC2 | |
| dc. 1 | 0.378 | 26.731 | 16.727 | 1.084 |
| dc. 2 | 0.379 | 26.615 | 16.750 | 1.079 |
| dc. 3 | 0.650 | 4.223 | 35.961 | 17.657 |
| dc. 4 | 0.654 | 4.242 | 36.189 | 17.736 |
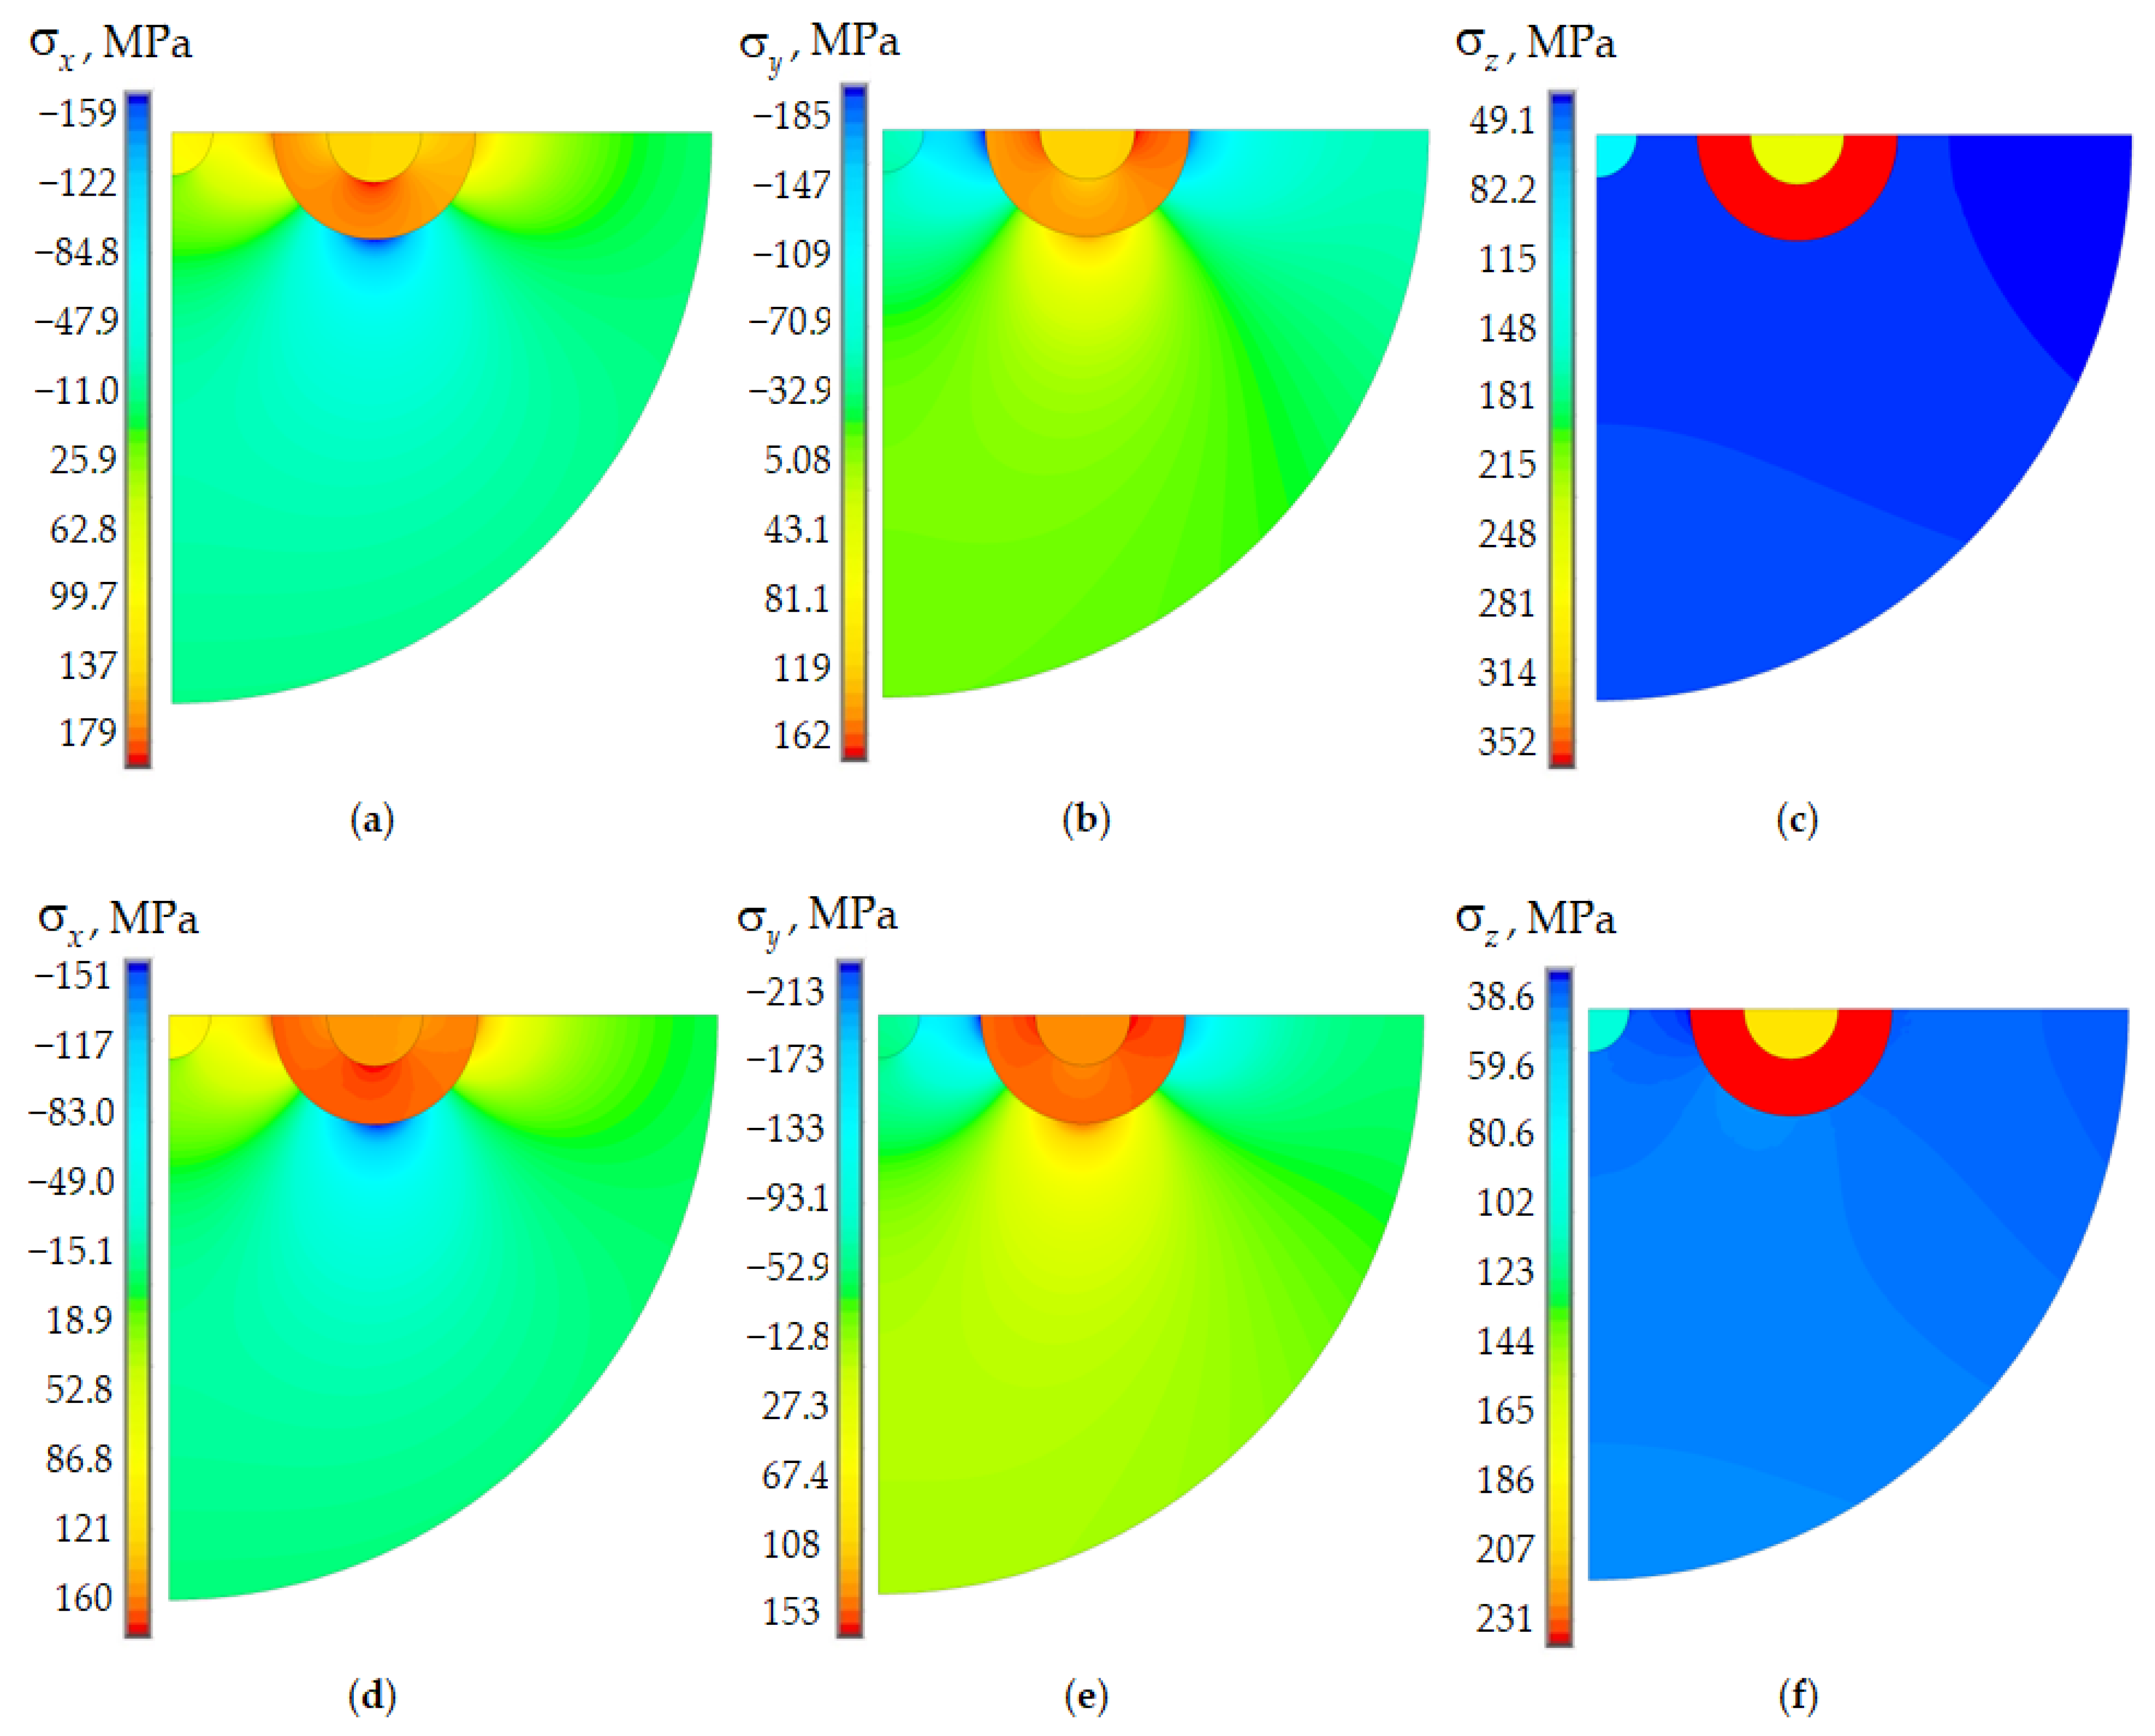
| No. Design Case | Two-Layer PC | Single-Layer PC | ||||
|---|---|---|---|---|---|---|
| , MPa | , MPa | , MPa | , MPa | , MPa | , MPa | |
| dc. 1 | 179.253 | 161.739 | 351.728 | 181.419 | 162.548 | 352.248 |
| dc. 2 | 224.681 | 203.044 | 440.976 | 227.356 | 204.175 | 441.639 |
| dc. 3 | 179.315 | 160.151 | 351.547 | 179.340 | 161.057 | 351.662 |
| dc. 4 | 224.708 | 201.437 | 440.786 | 224.734 | 202.295 | 440.899 |
| No. Design Case | Two-Layer PC | Single-Layer PC | ||||
|---|---|---|---|---|---|---|
| Material PC2 | Material PC2 | |||||
| , MPa | , % | , MPa | , % | |||
| dc. 1 | 26.731 | 1.084 | 4.929 | 17.434 | 0.707 | 4.976 |
| dc. 2 | 26.615 | 1.079 | 6.167 | 17.252 | 0.699 | 6.219 |
| dc. 3 | 4.223 | 17.657 | 4.932 | 2.678 | 11.188 | 4.952 |
| dc. 4 | 4.242 | 17.736 | 6.169 | 2.673 | 11.166 | 6.189 |
Disclaimer/Publisher’s Note: The statements, opinions and data contained in all publications are solely those of the individual author(s) and contributor(s) and not of MDPI and/or the editor(s). MDPI and/or the editor(s) disclaim responsibility for any injury to people or property resulting from any ideas, methods, instructions or products referred to in the content. |
© 2023 by the authors. Licensee MDPI, Basel, Switzerland. This article is an open access article distributed under the terms and conditions of the Creative Commons Attribution (CC BY) license (https://creativecommons.org/licenses/by/4.0/).
Share and Cite
Kamenskikh, A.A.; Sakhabutdinova, L.; Strazhec, Y.A.; Bogdanova, A.P. Assessment of the Influence of Protective Polymer Coating on Panda Fiber Performance Based on the Results of Multivariant Numerical Simulation. Polymers 2023, 15, 4610. https://doi.org/10.3390/polym15234610
Kamenskikh AA, Sakhabutdinova L, Strazhec YA, Bogdanova AP. Assessment of the Influence of Protective Polymer Coating on Panda Fiber Performance Based on the Results of Multivariant Numerical Simulation. Polymers. 2023; 15(23):4610. https://doi.org/10.3390/polym15234610
Chicago/Turabian StyleKamenskikh, Anna A., Lyaysan Sakhabutdinova, Yulija A. Strazhec, and Anastasia P. Bogdanova. 2023. "Assessment of the Influence of Protective Polymer Coating on Panda Fiber Performance Based on the Results of Multivariant Numerical Simulation" Polymers 15, no. 23: 4610. https://doi.org/10.3390/polym15234610