
Different Responses to Water Deficit of Two Common Winter Wheat Varieties: Physiological and Biochemical Characteristics

 , , , and
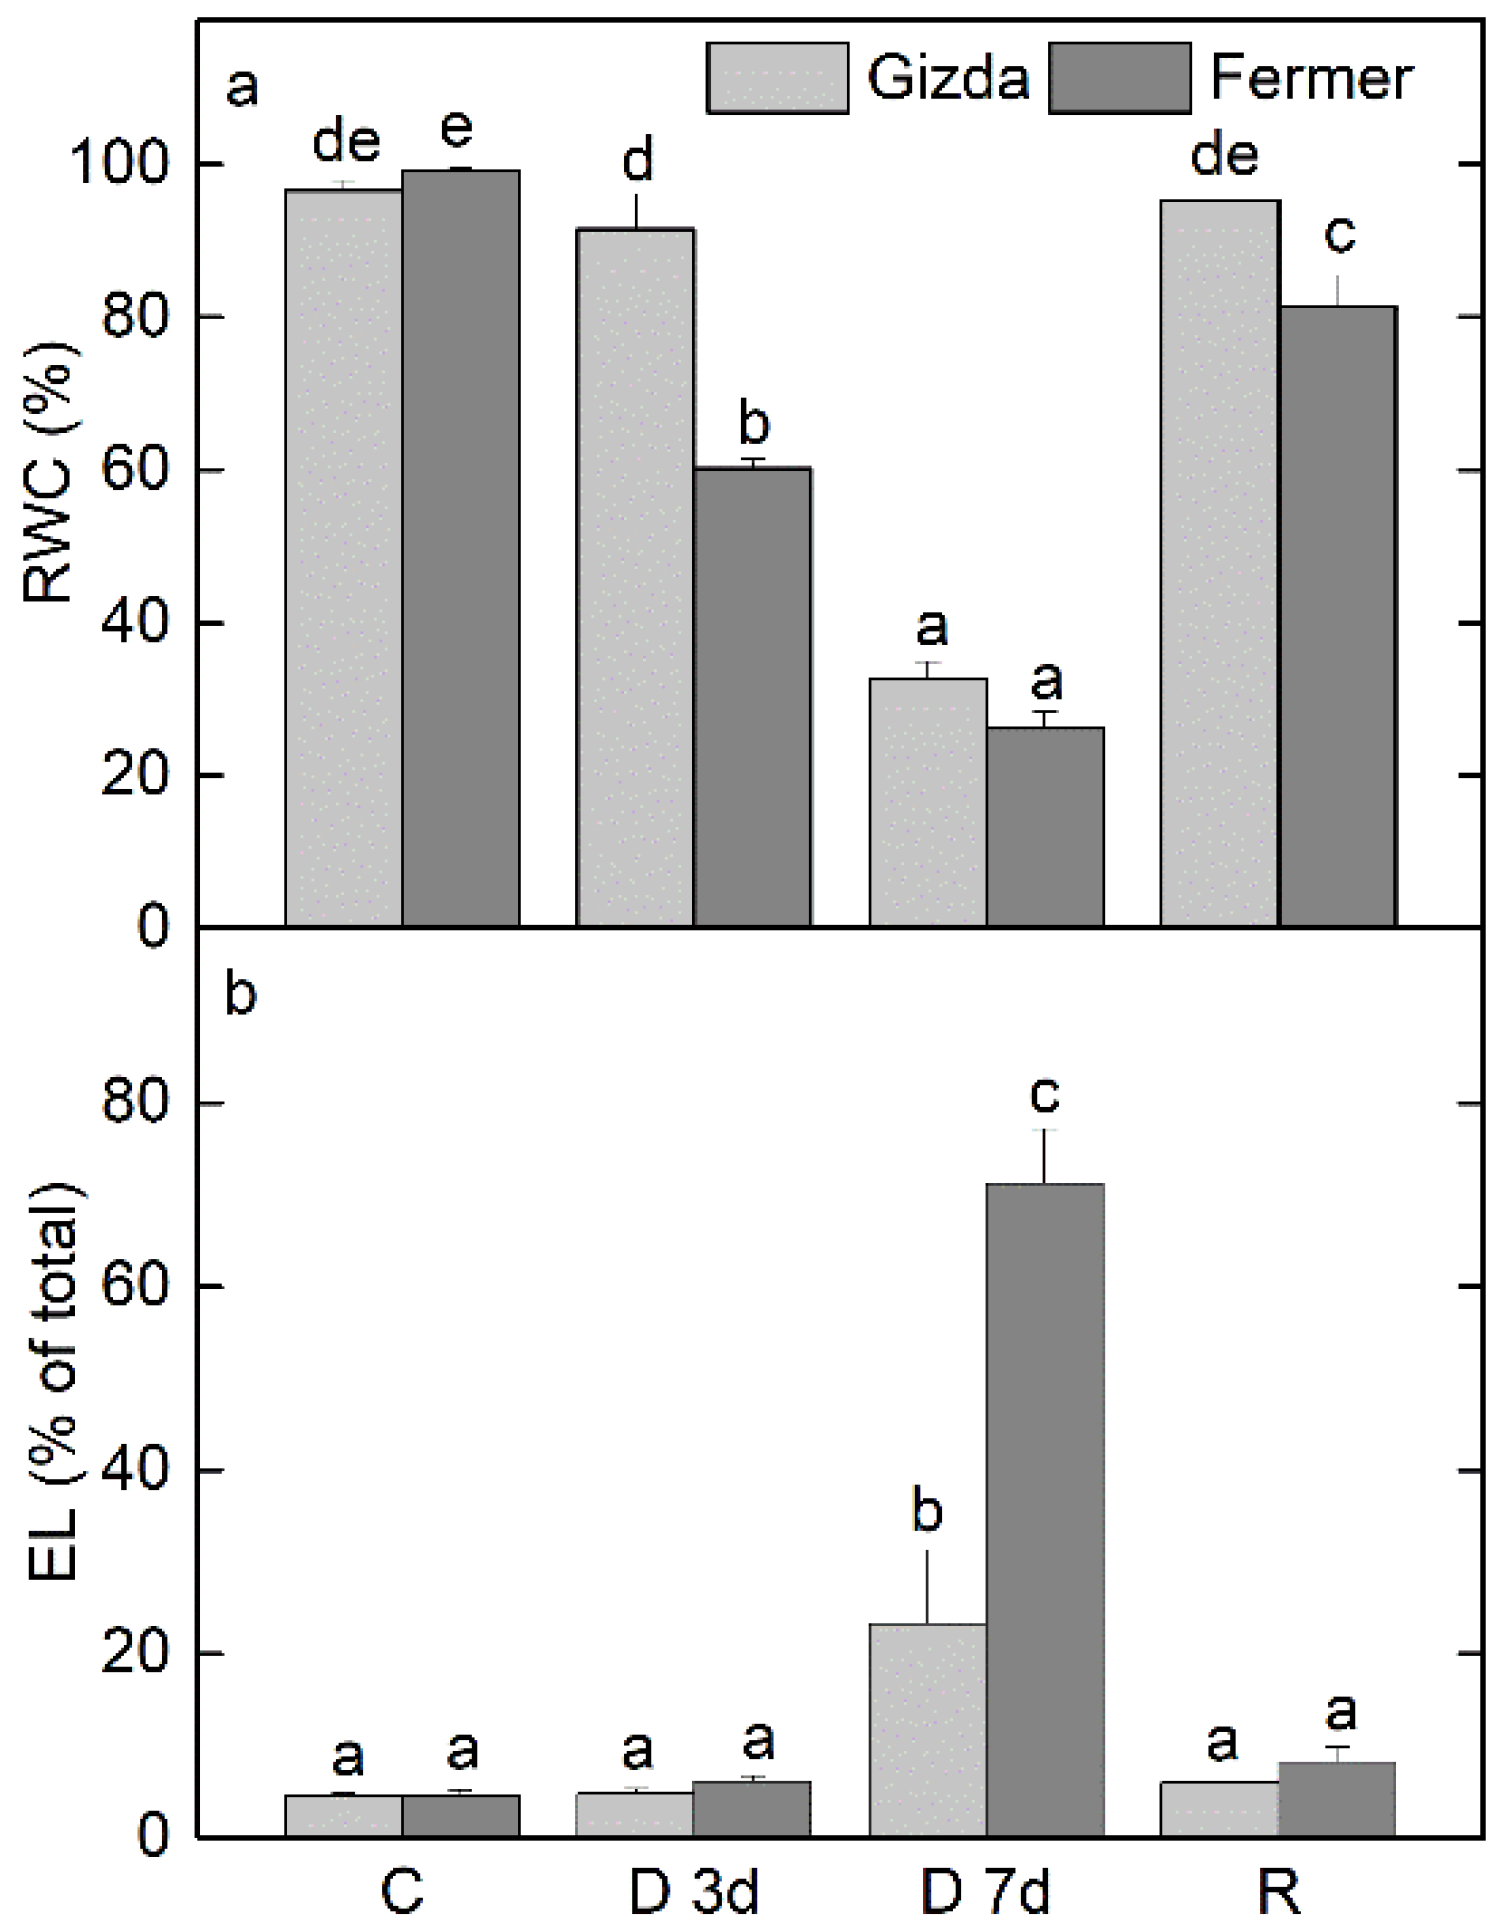
Abstract
:1. Introduction
2. Results
2.1. Relative Water Content (RWC) and Electrolyte Leakage (EL)
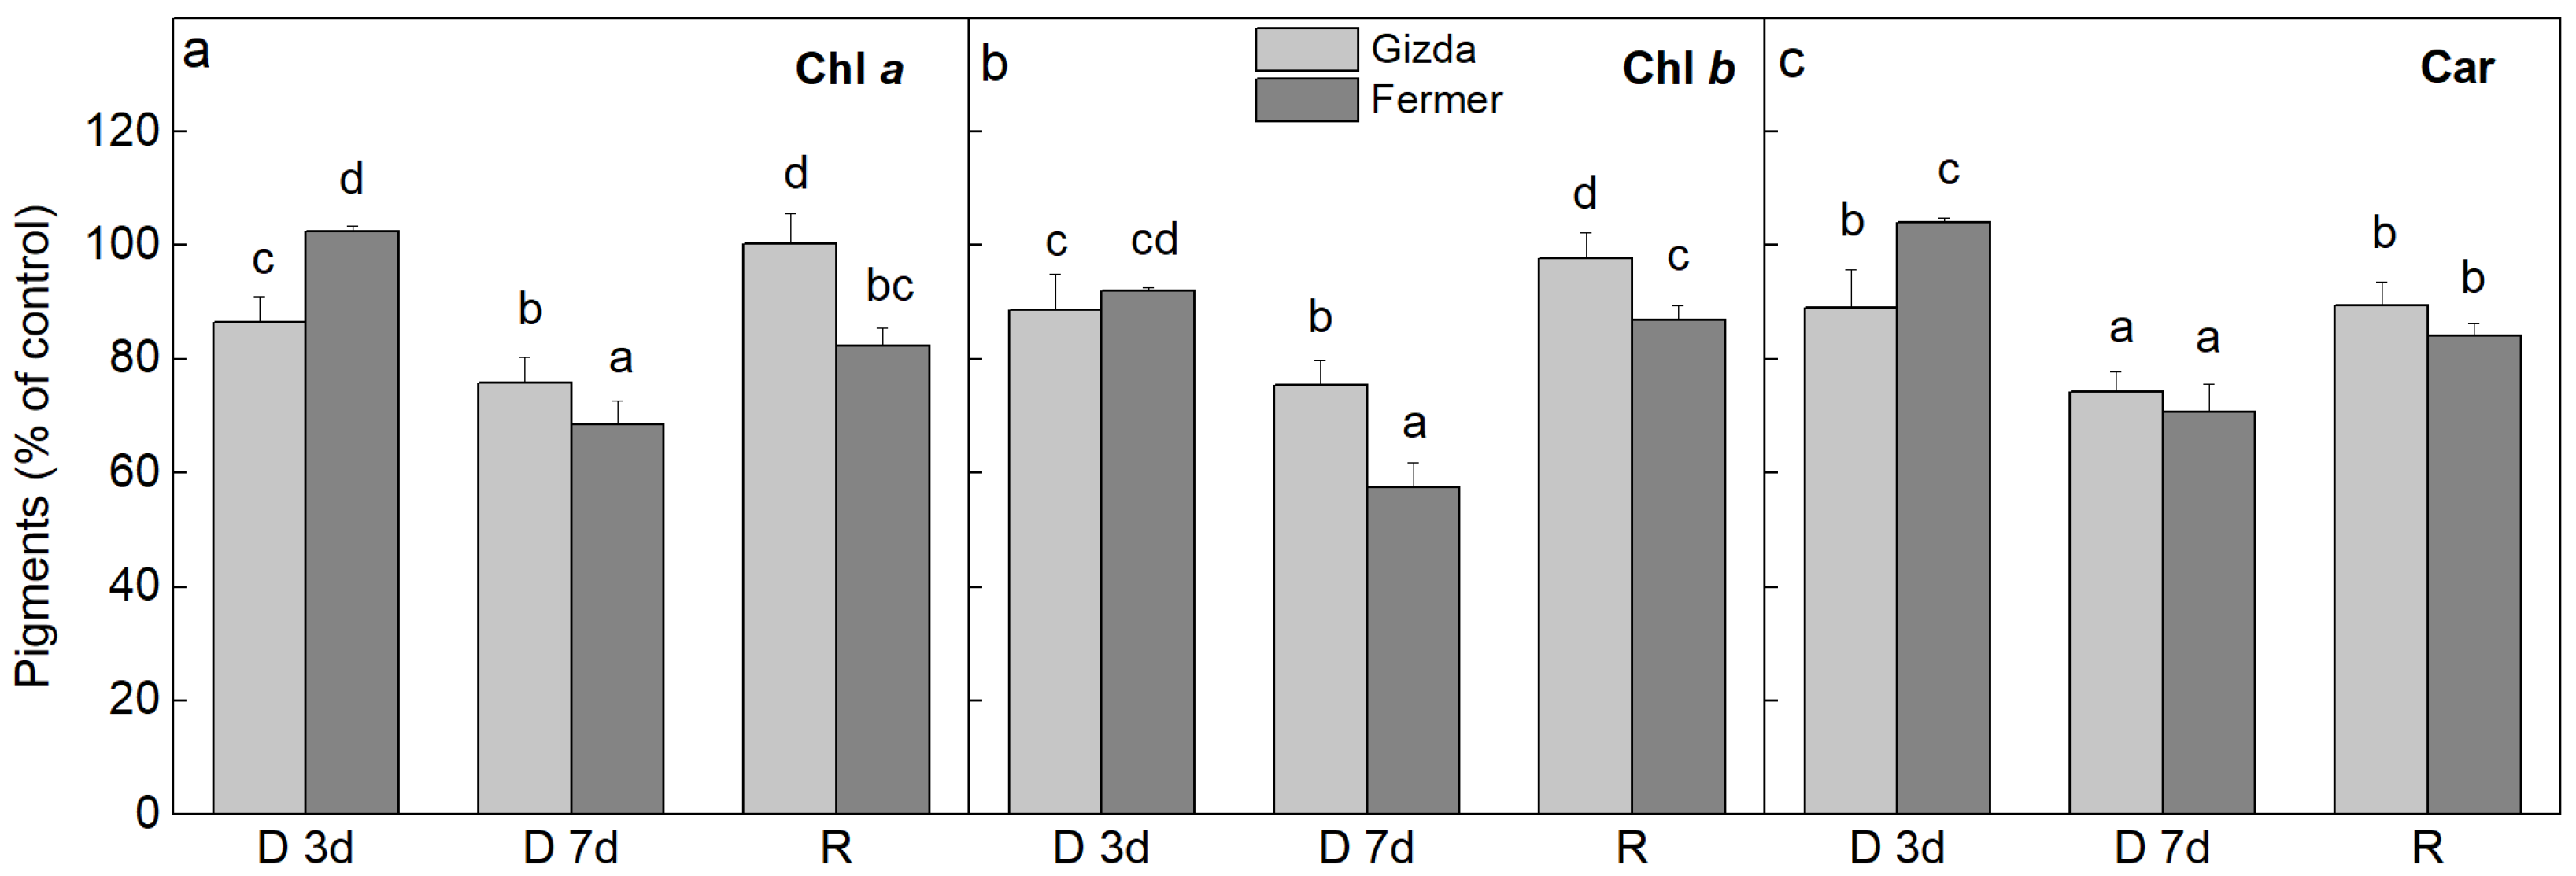
2.2. Alterations in the Photosynthetic Pigment Content
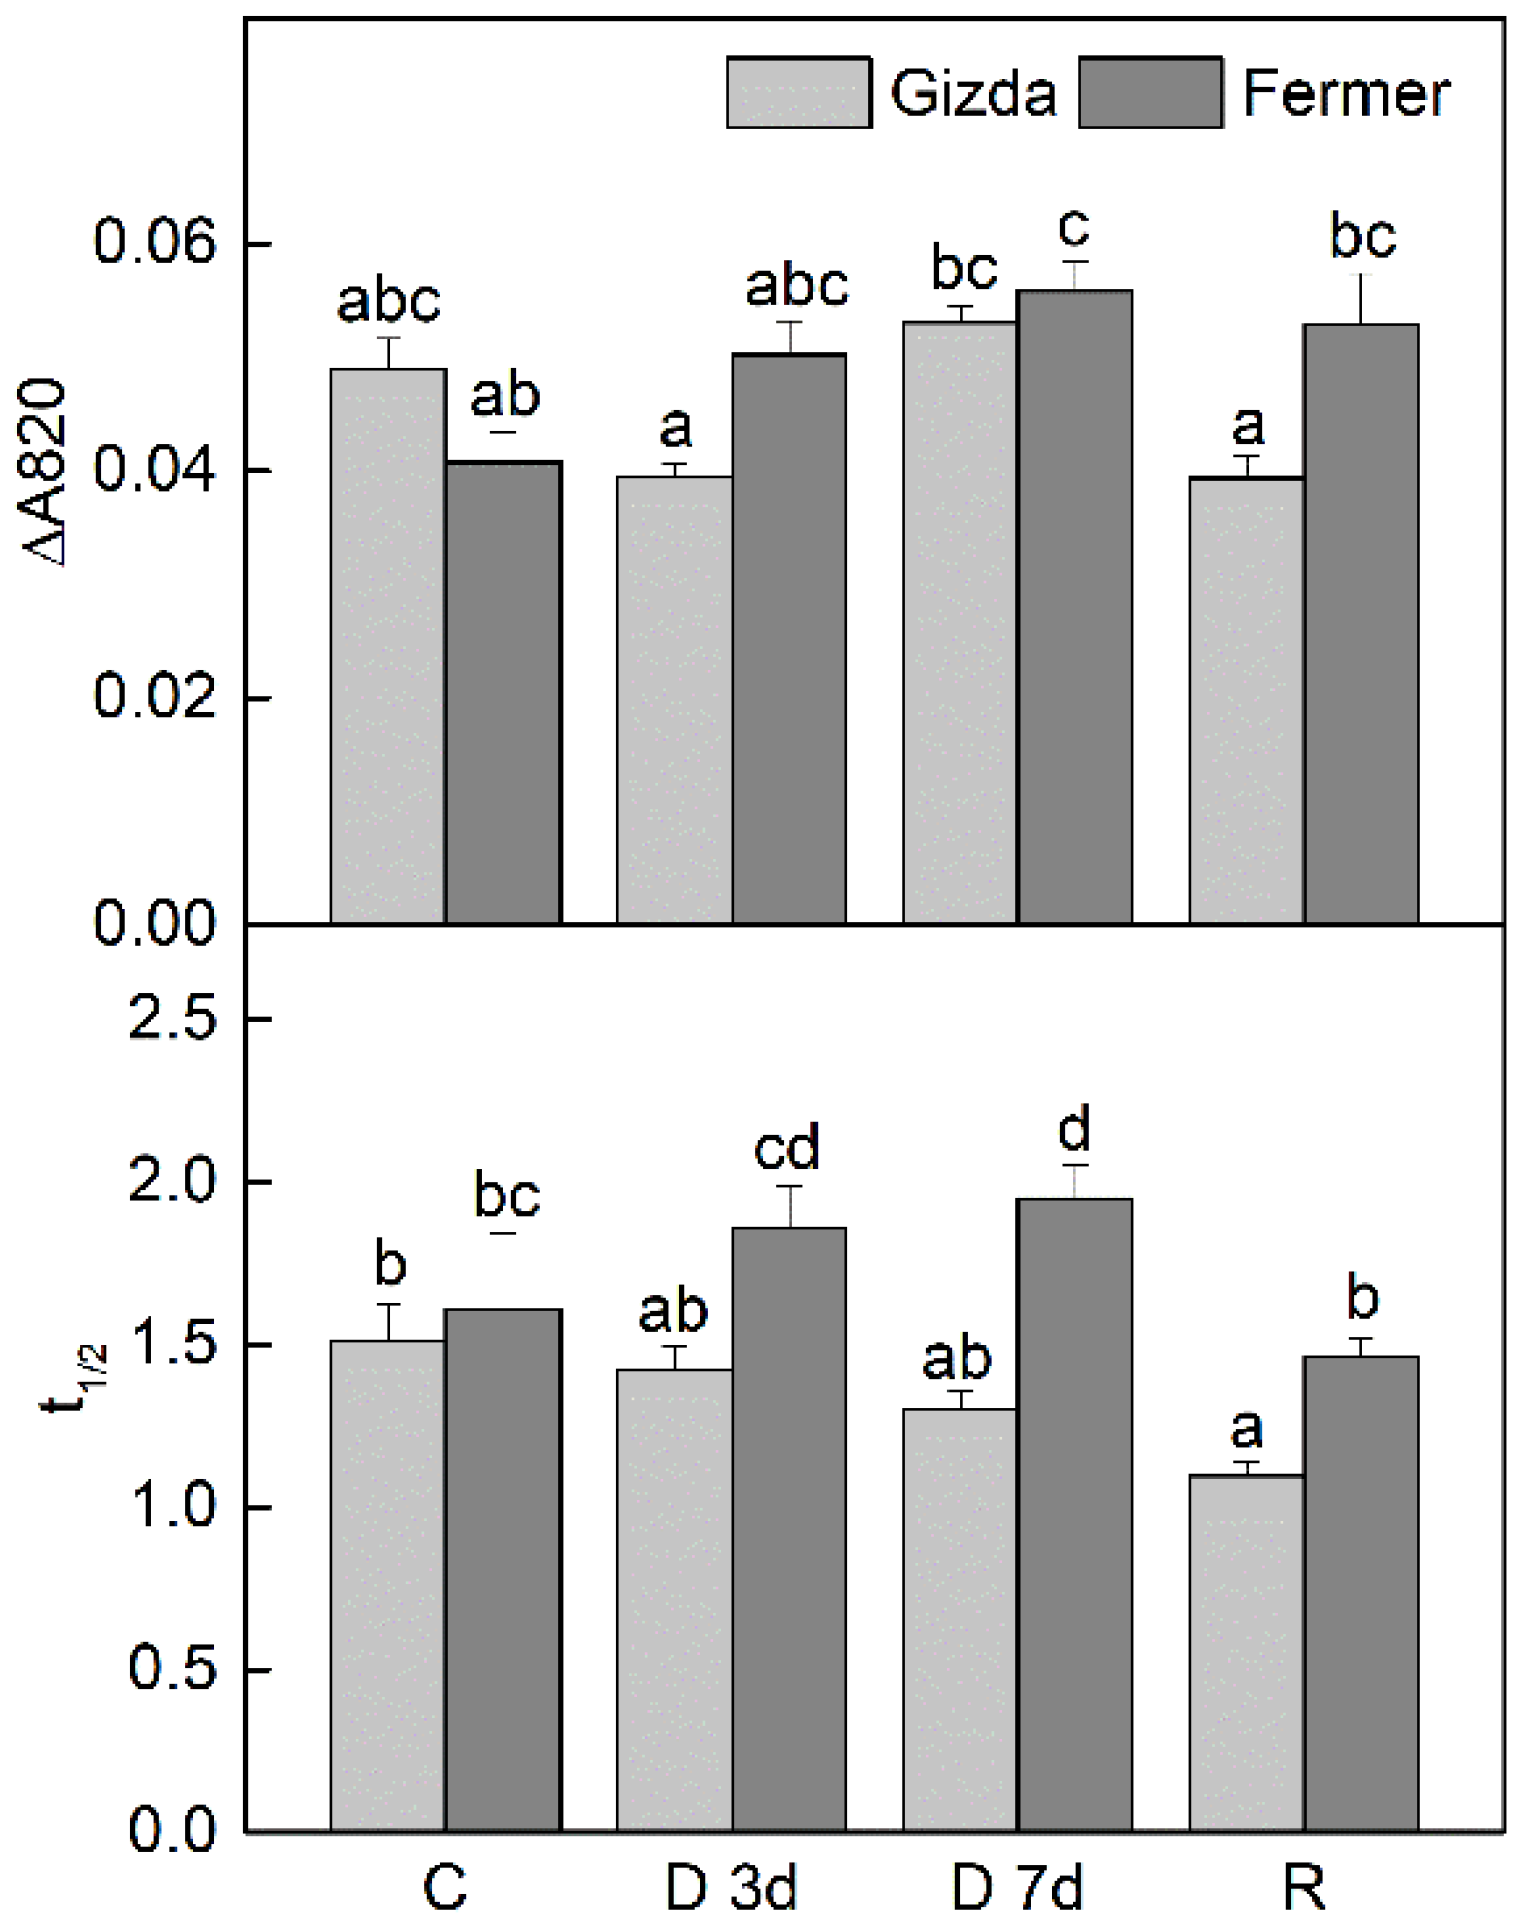
2.3. Photochemical Activity of PSII and PSI during Dehydration and after Rehydration
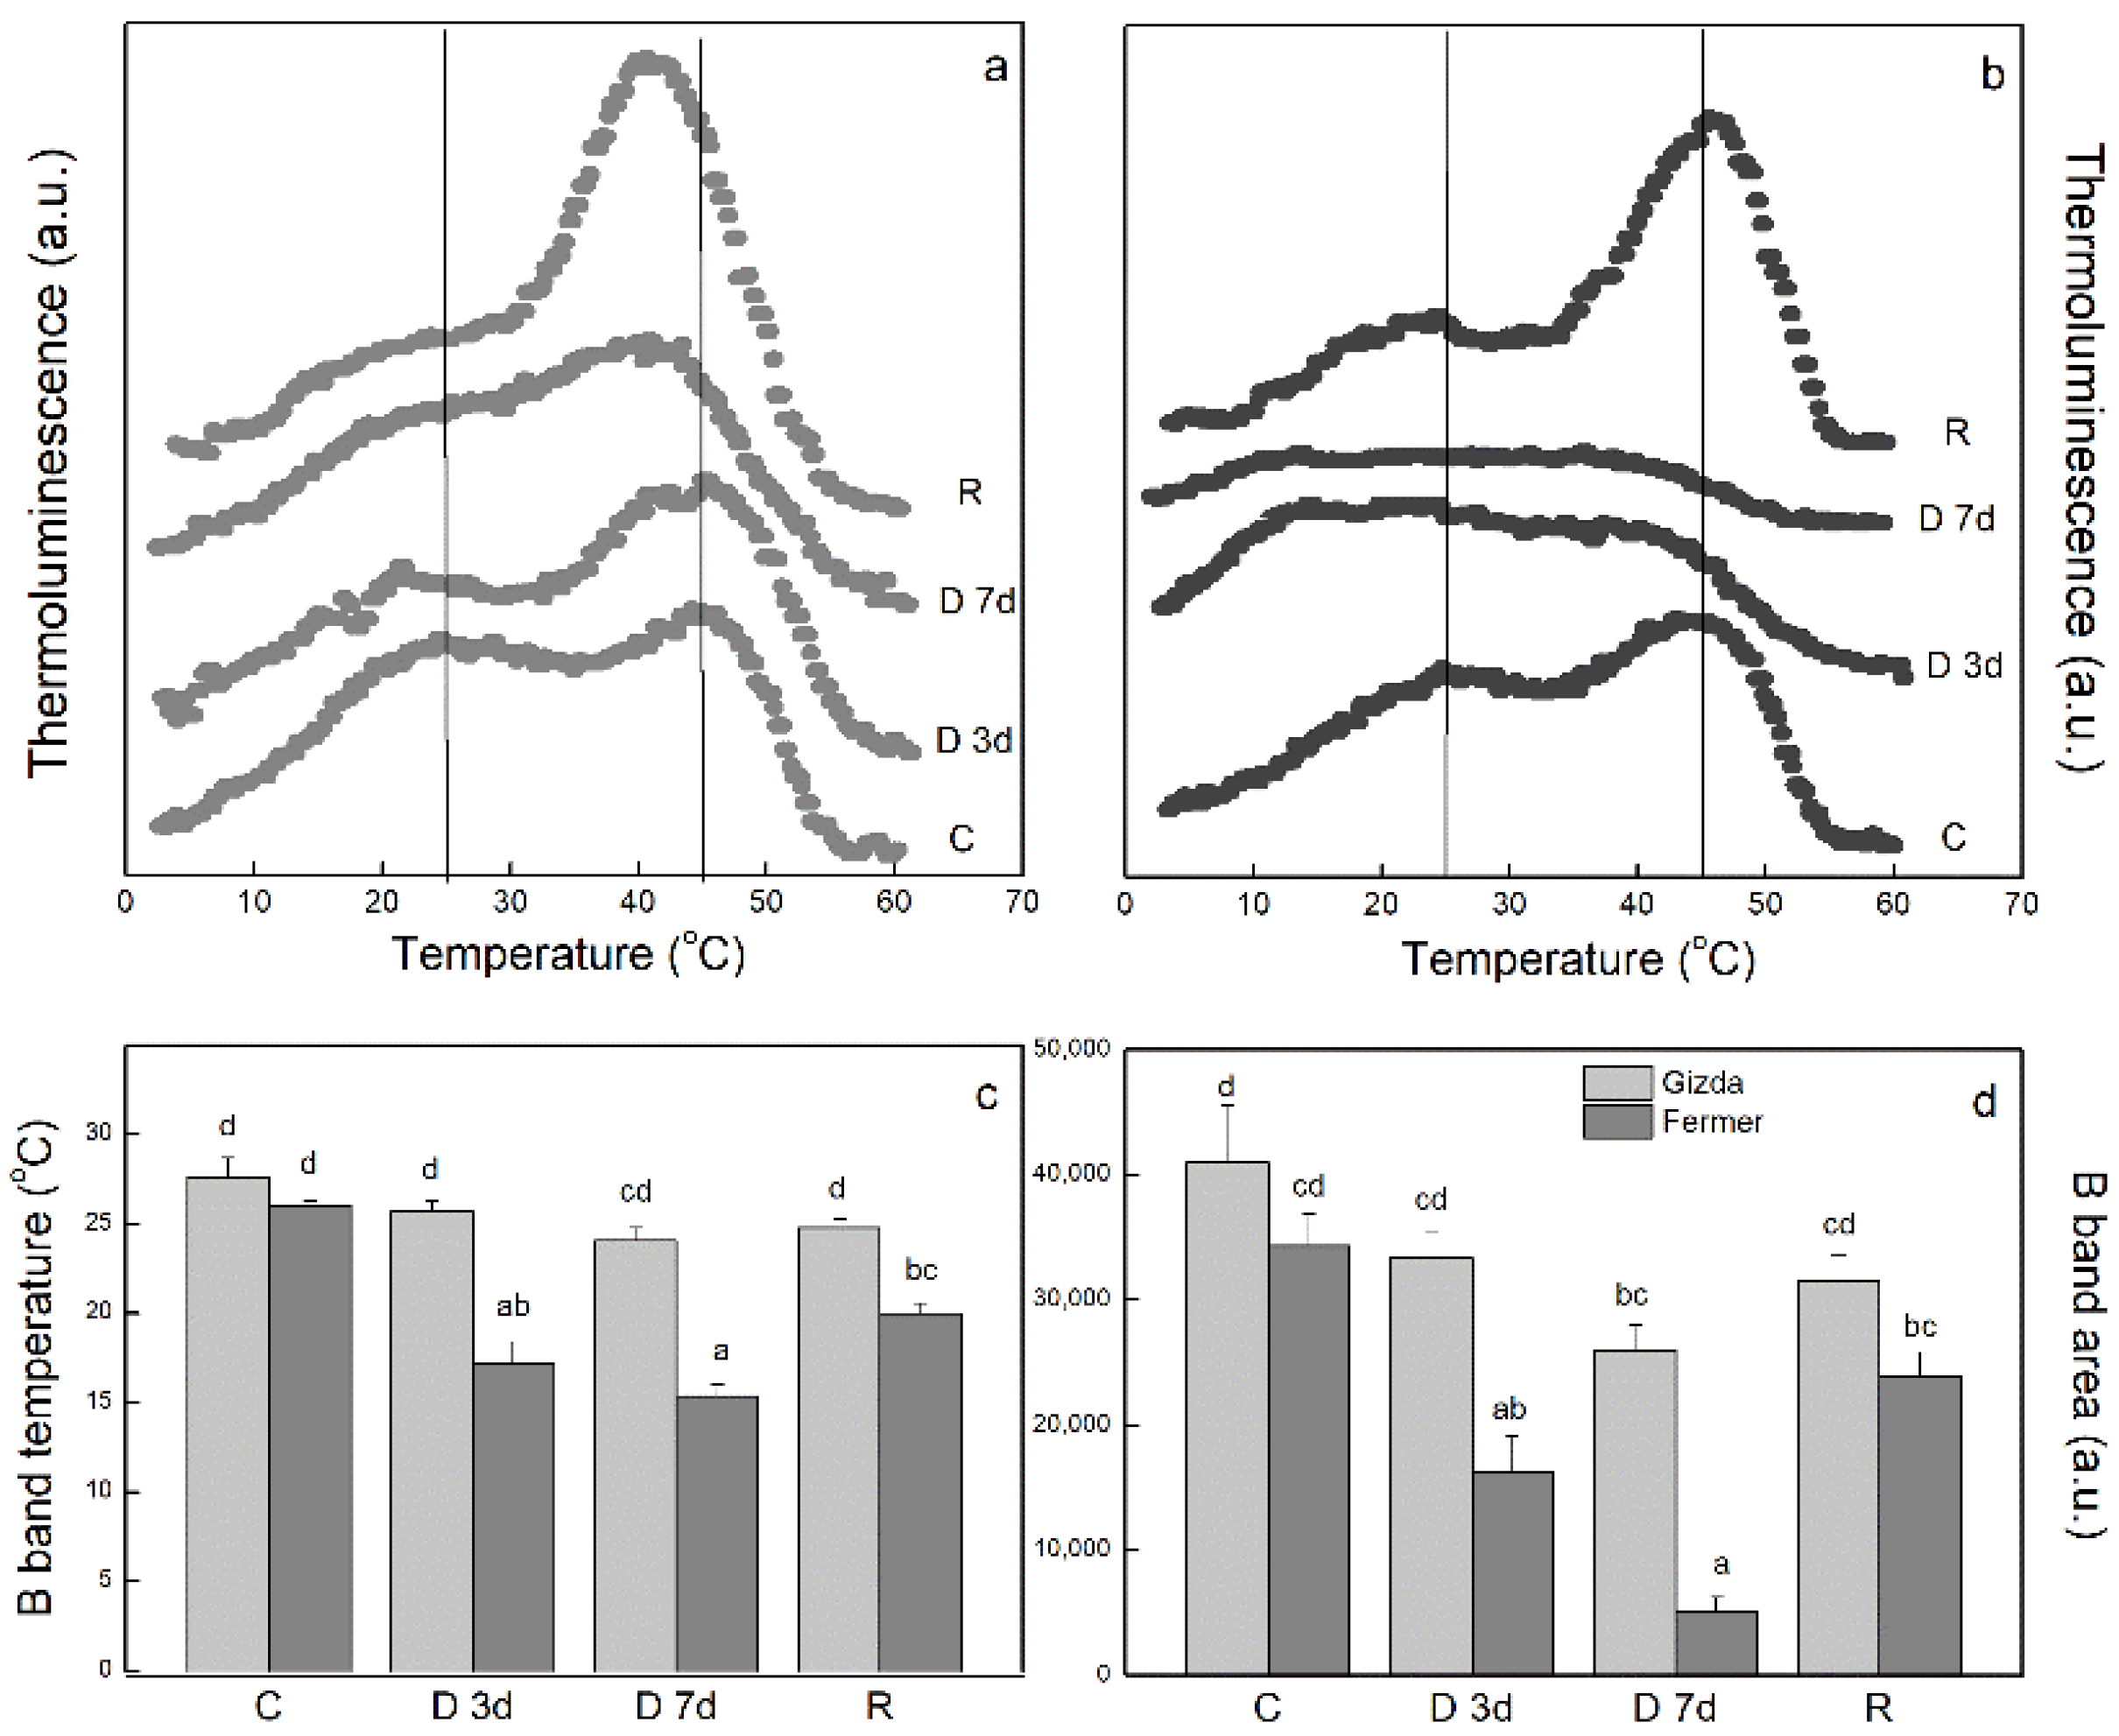
2.4. Thermoluminescence
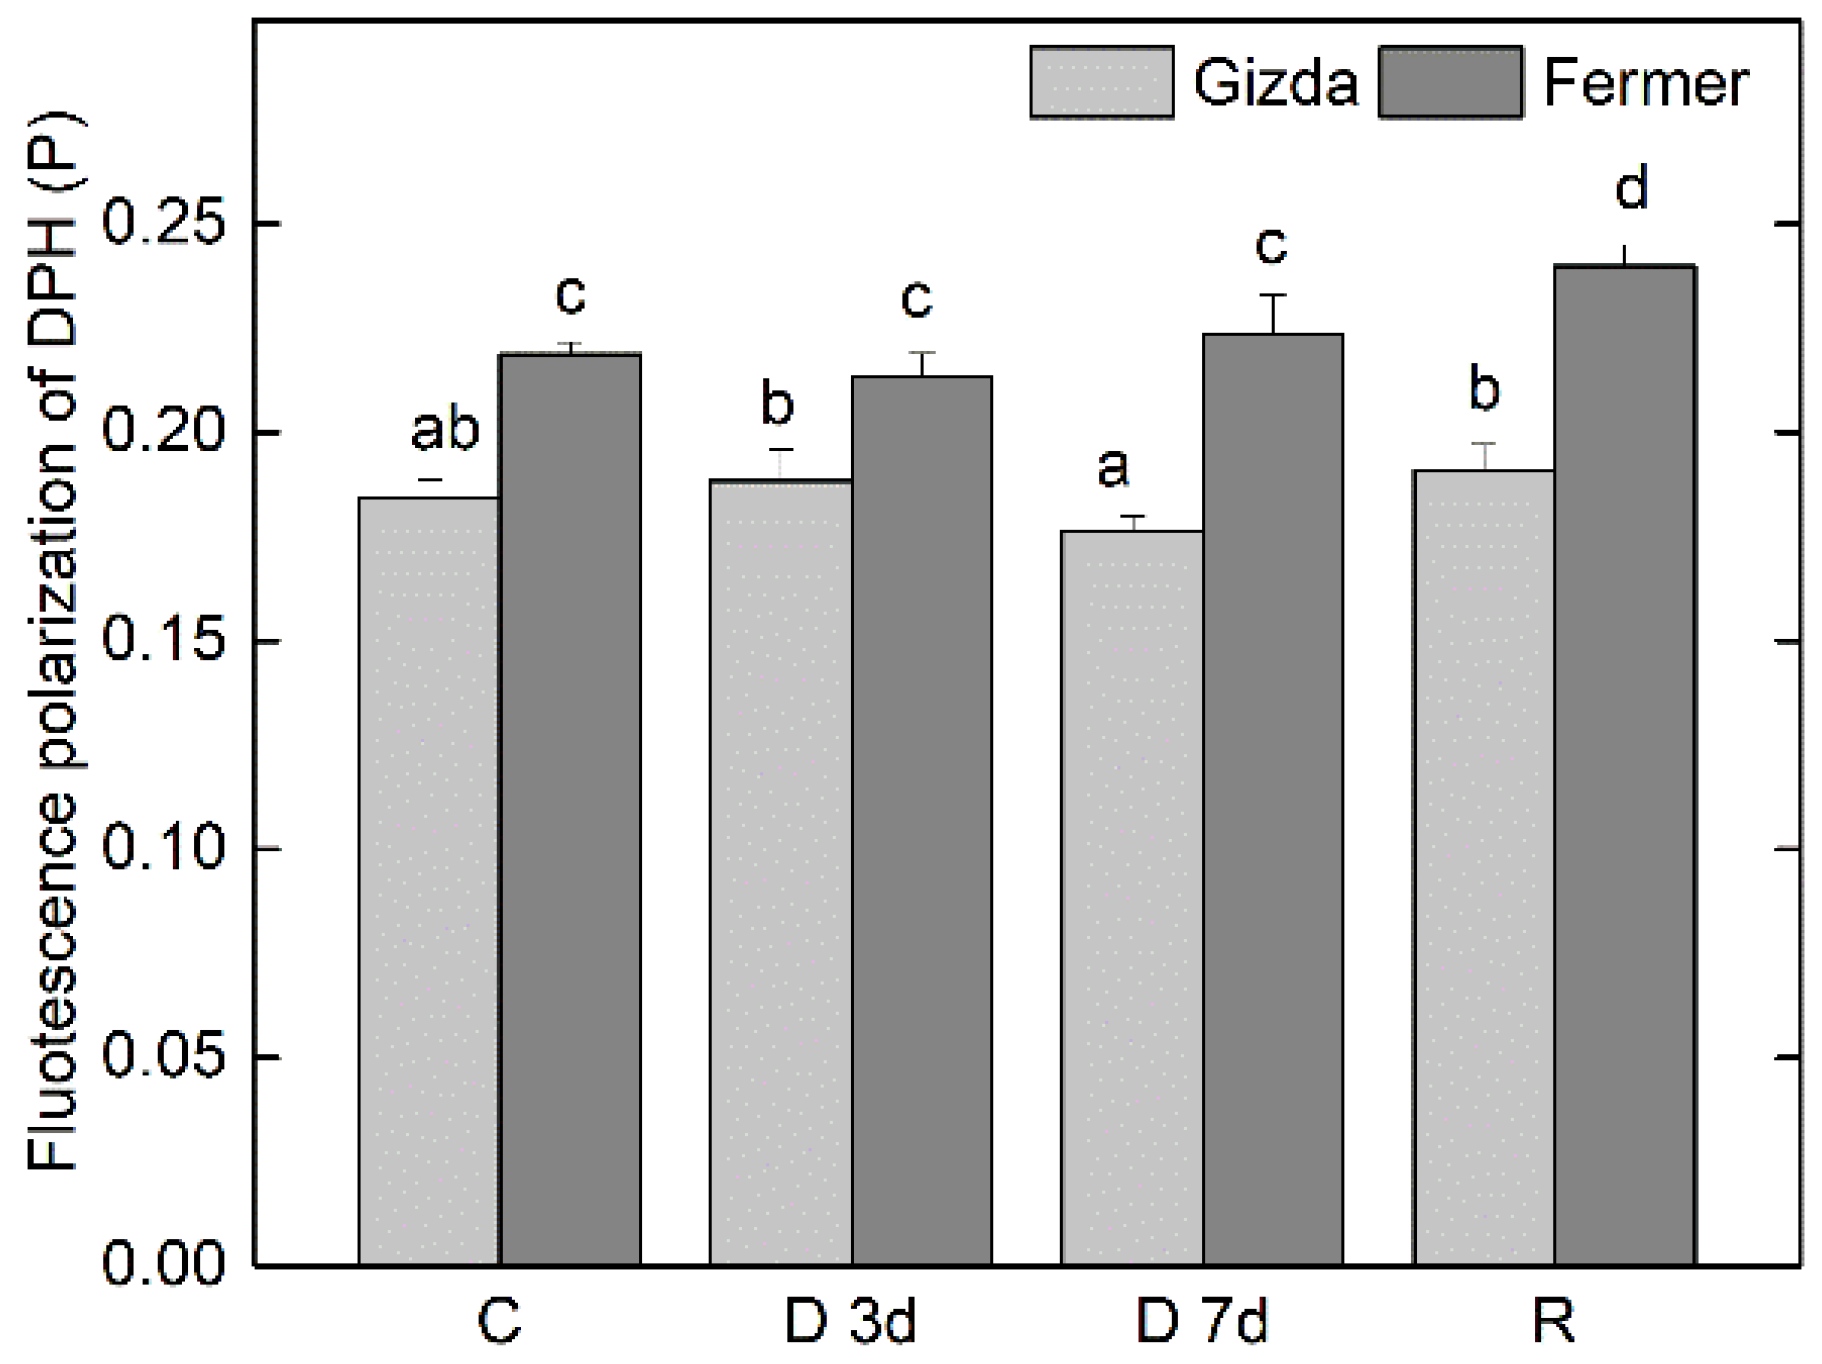
2.5. Fluidity of Lipid Phase of Thylakoid Membranes as Affected by Water Deficit
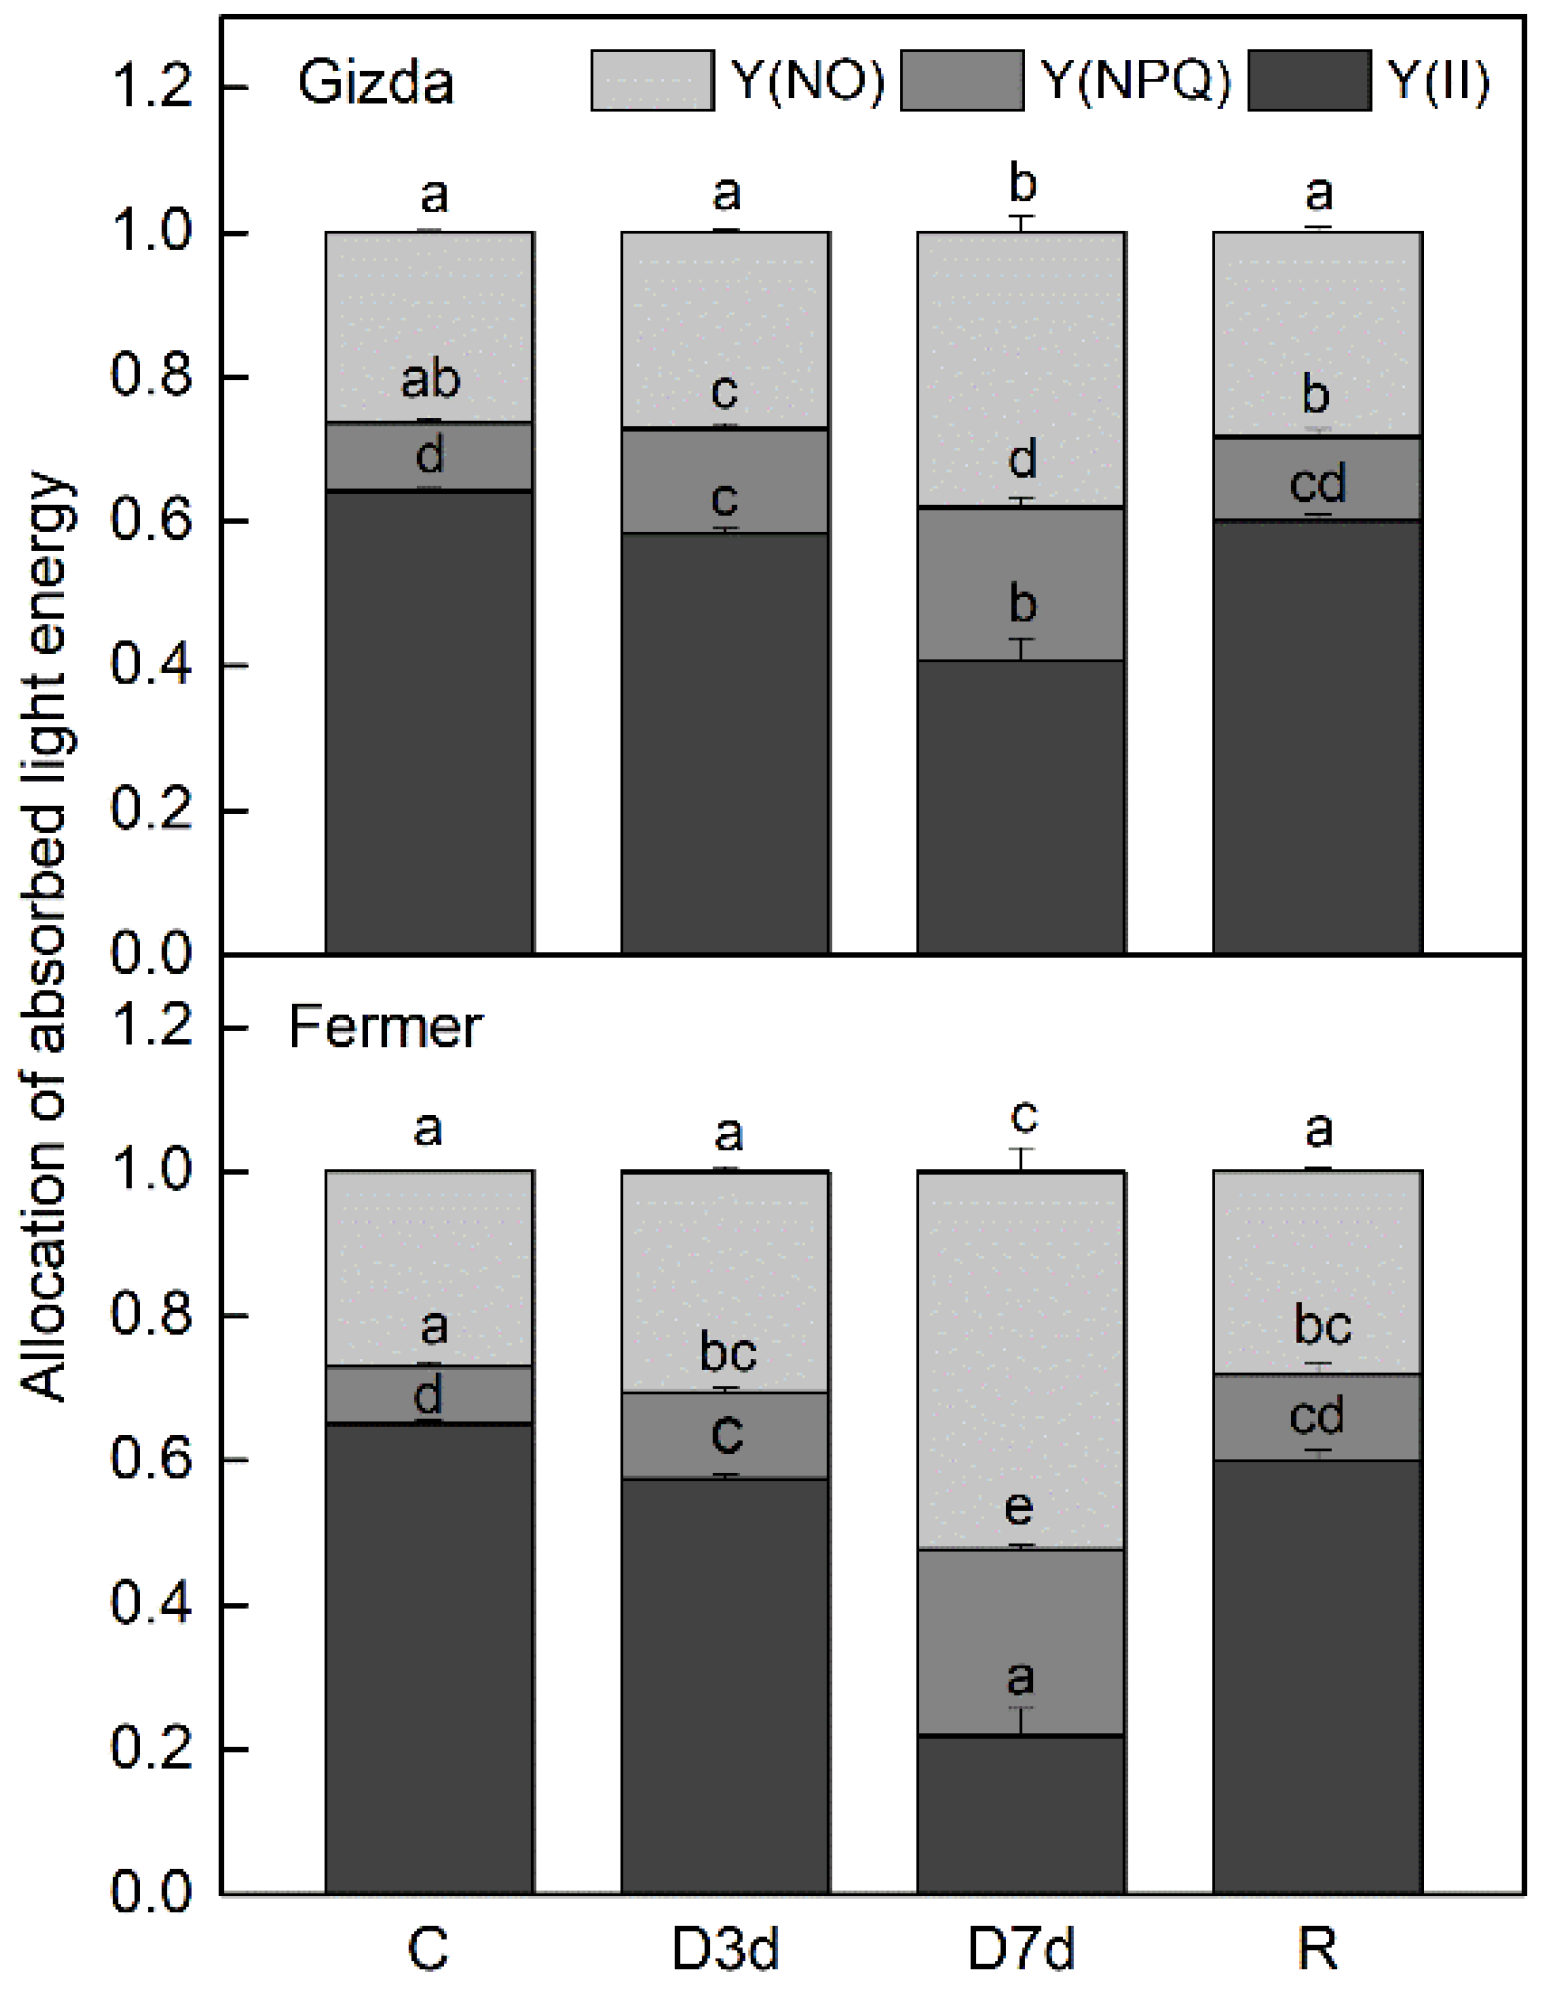
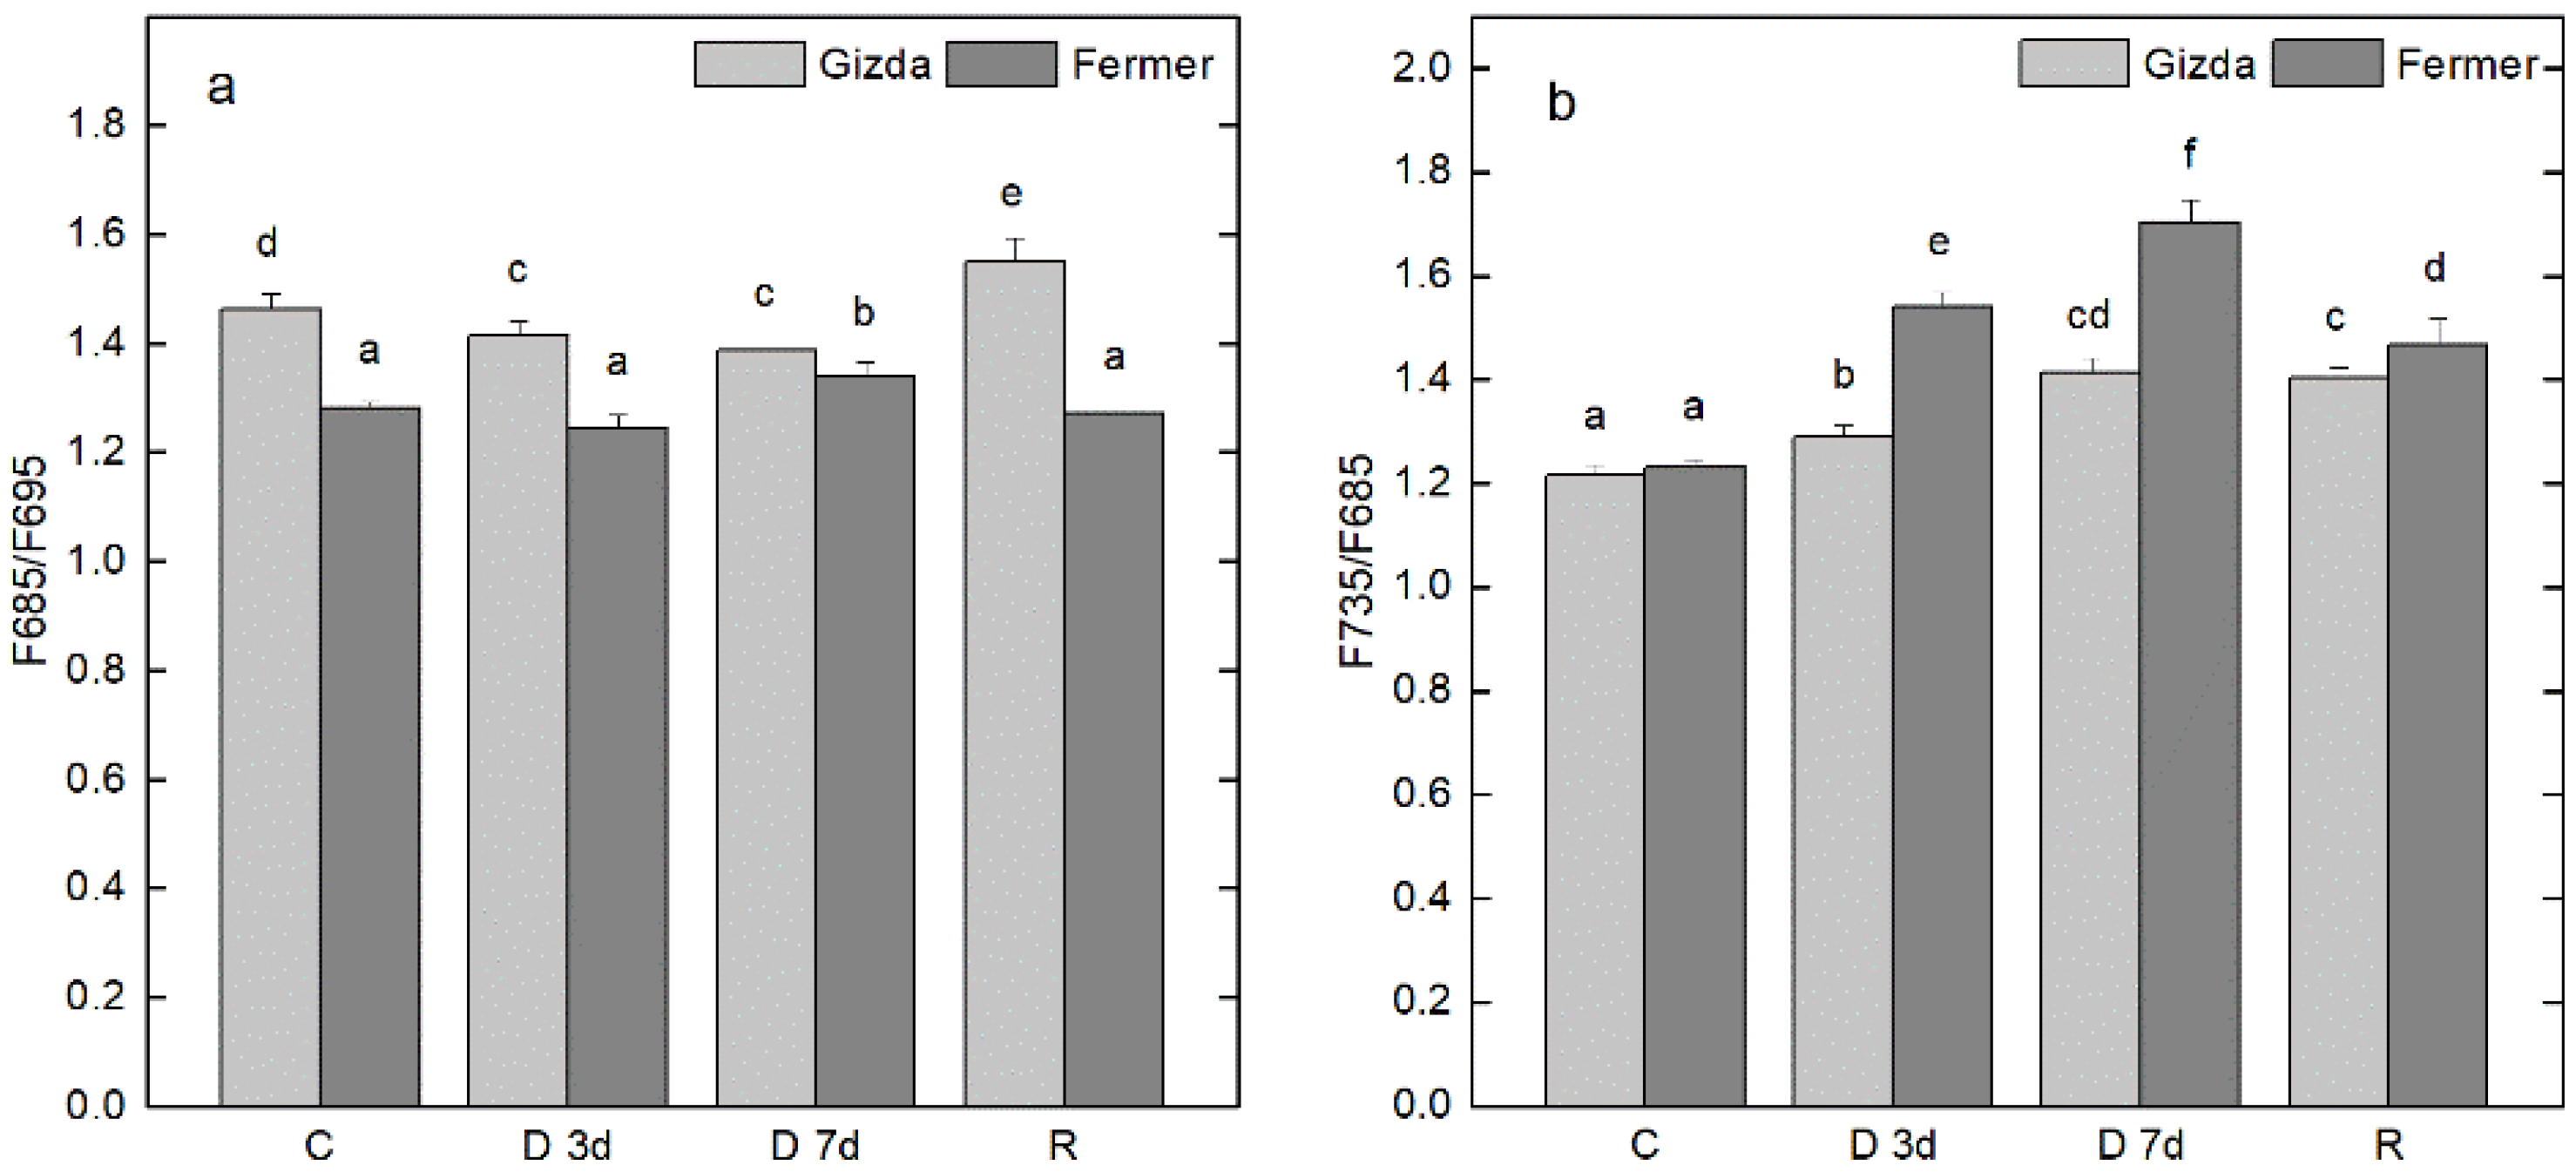
2.6. Alterations in Energy Interaction between Pigment-Protein Complexes after Dehydration and Following Recovery
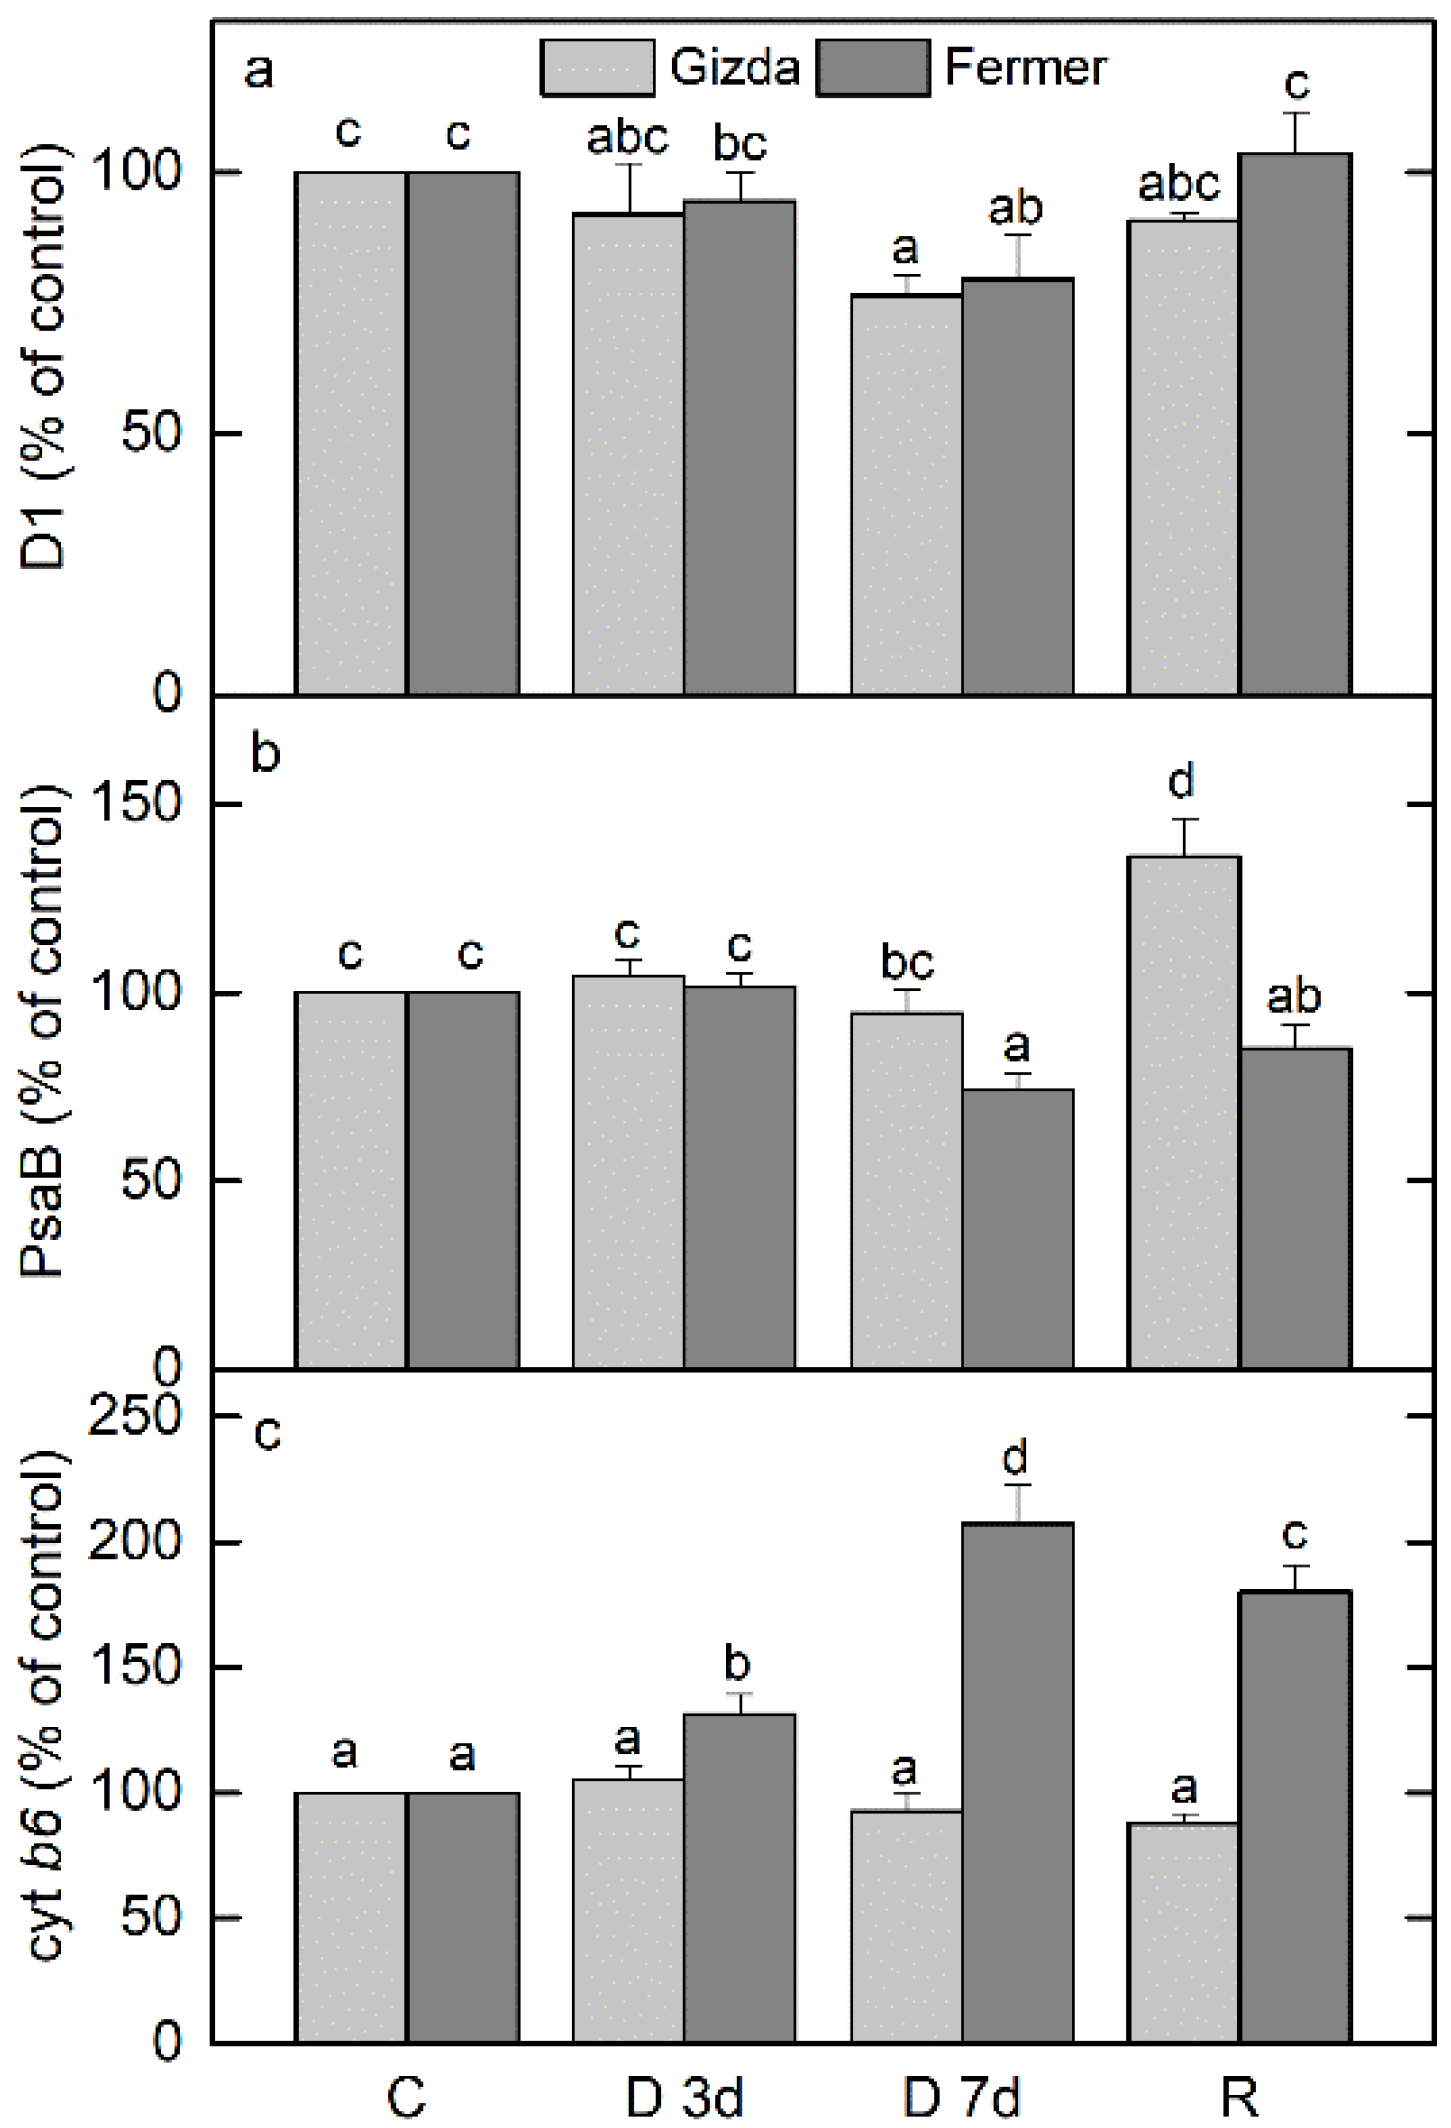
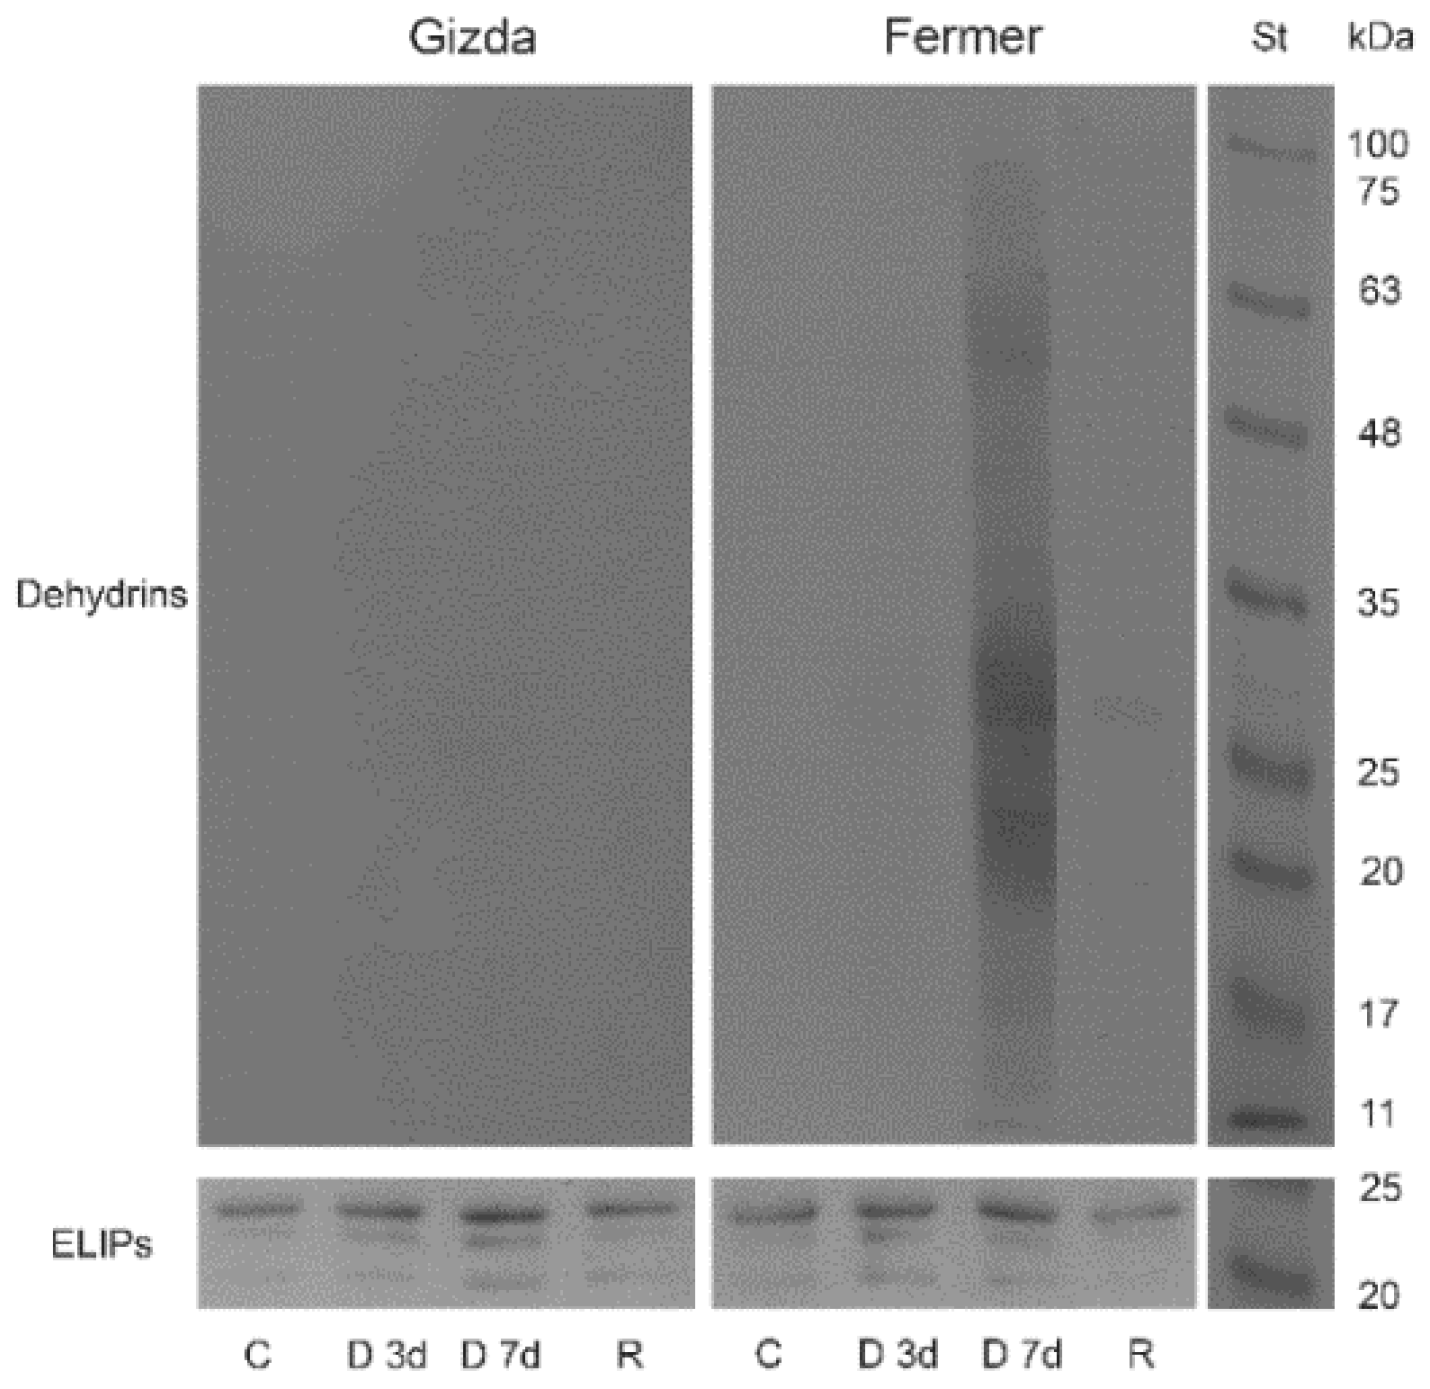
2.7. Protein Abundance during Dehydration and after Rehydration
2.7.1. Photosynthetic Proteins

2.7.2. Protective Proteins
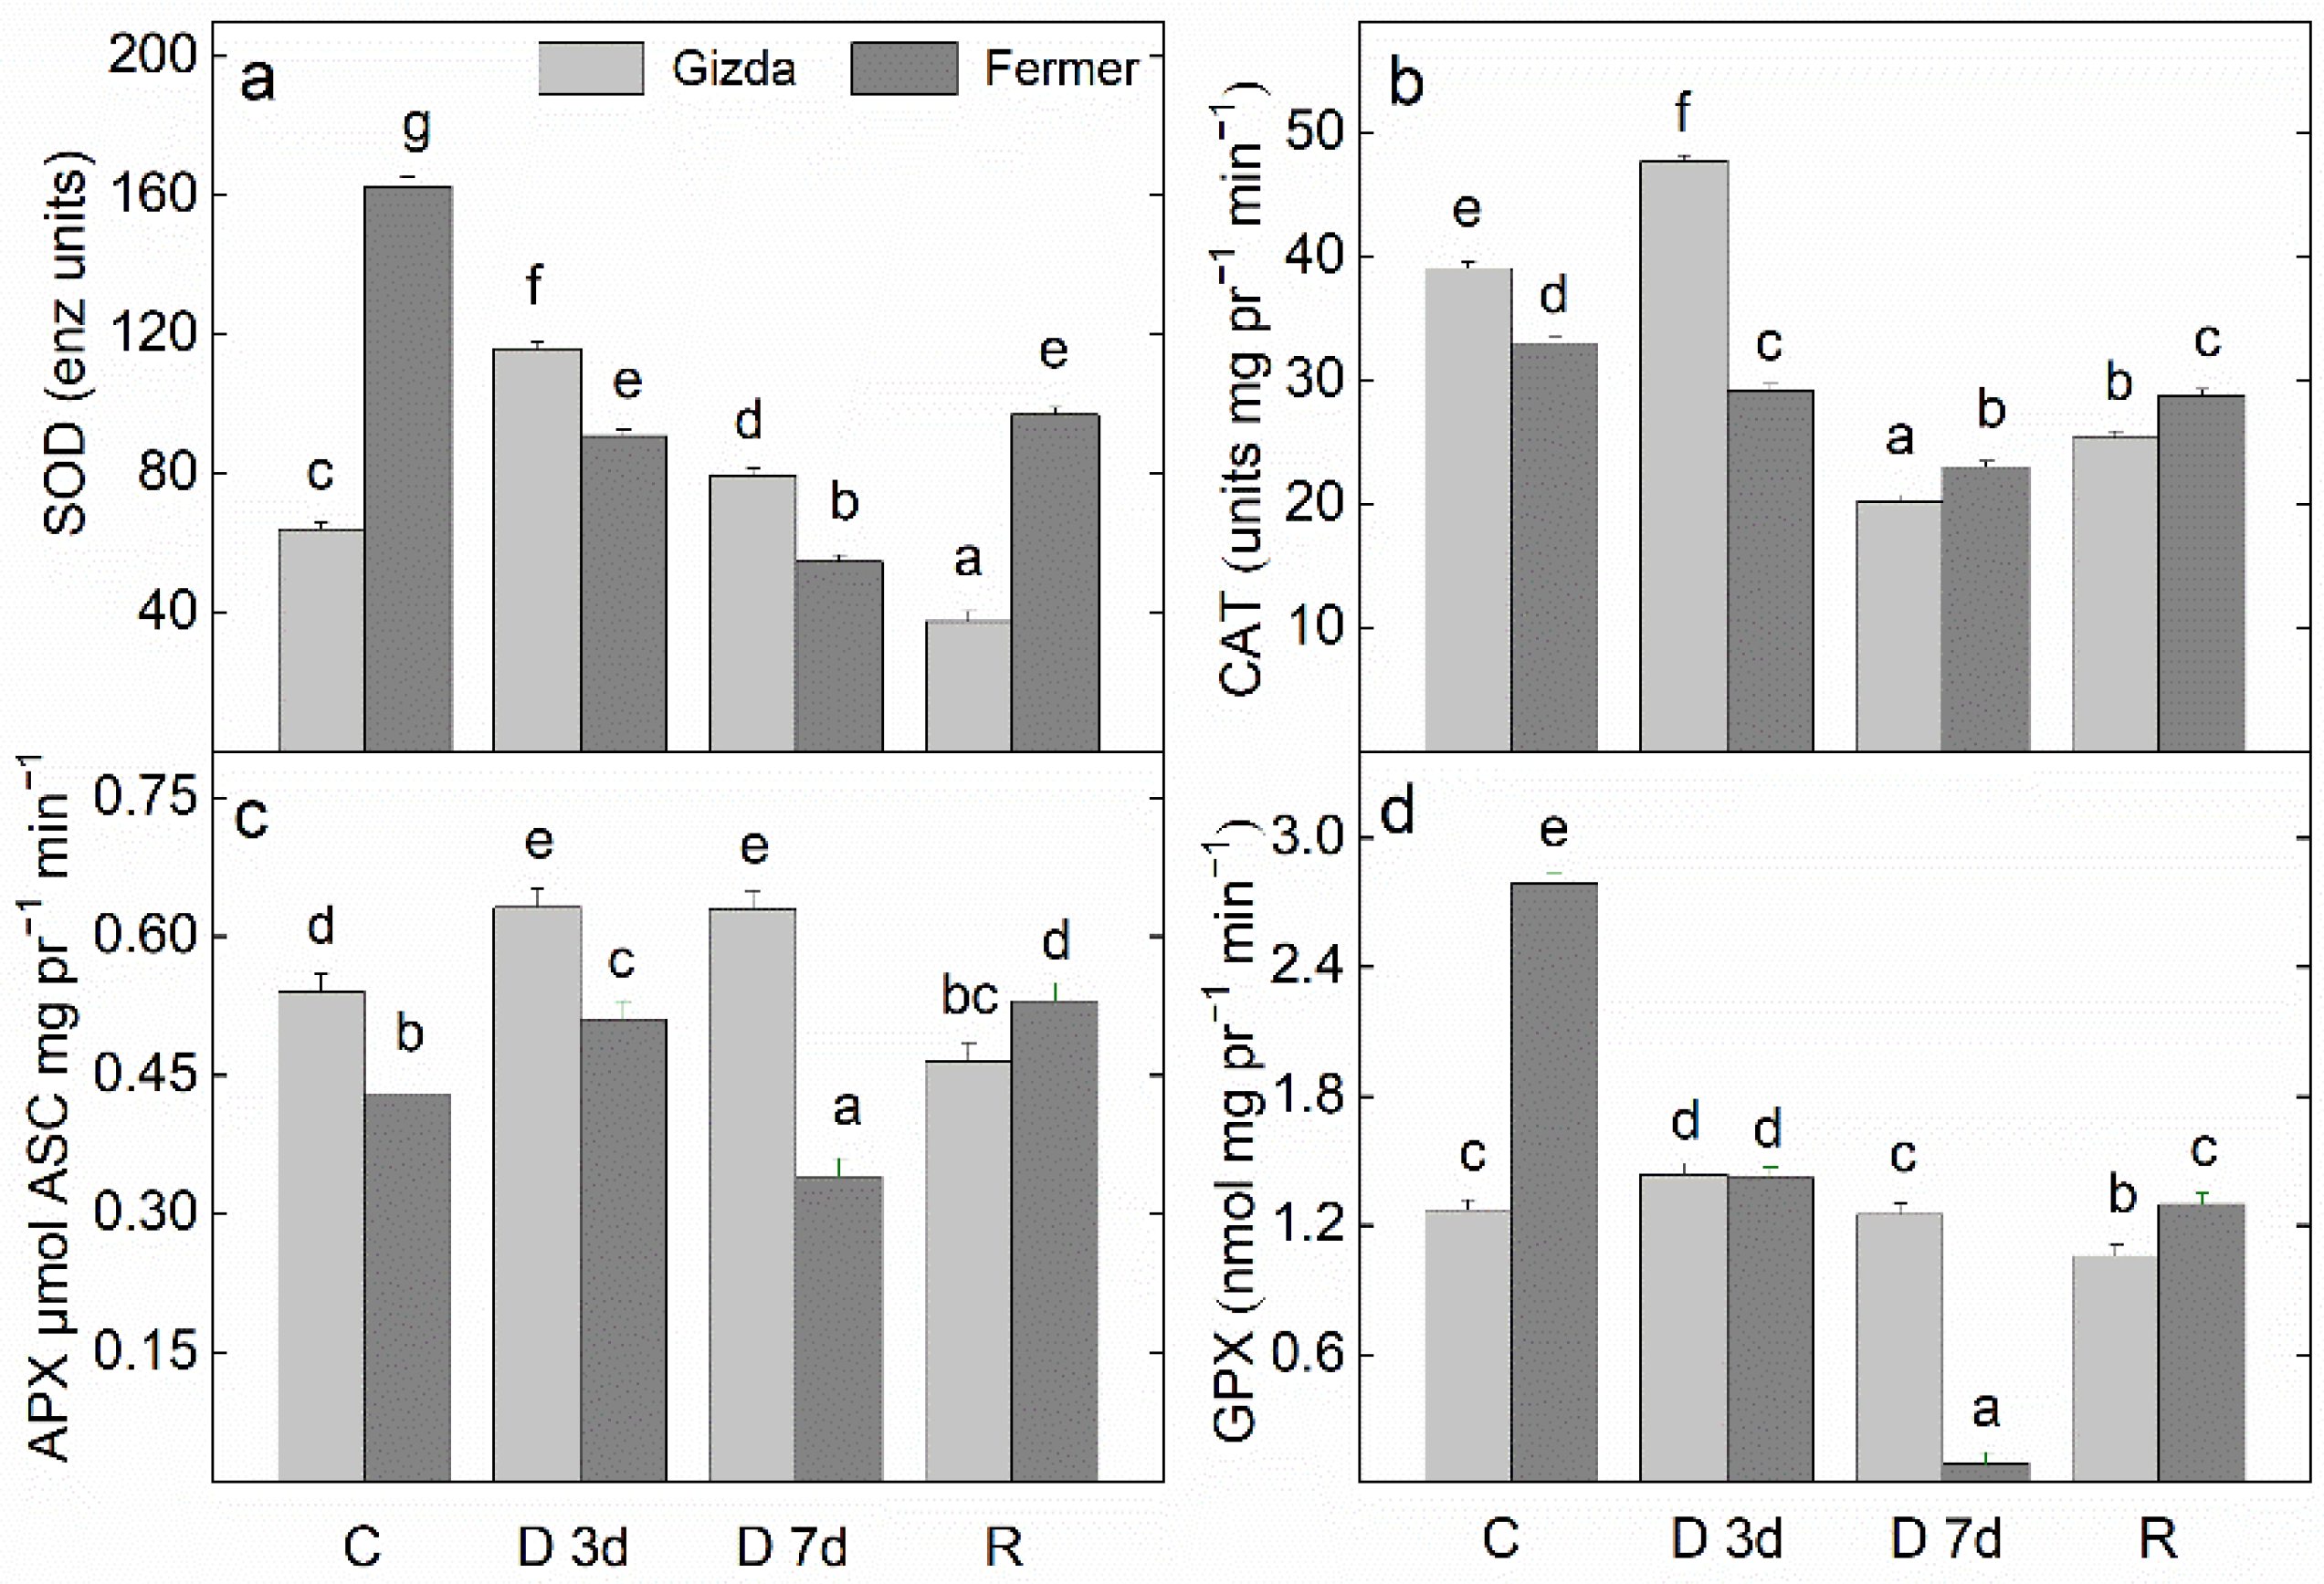
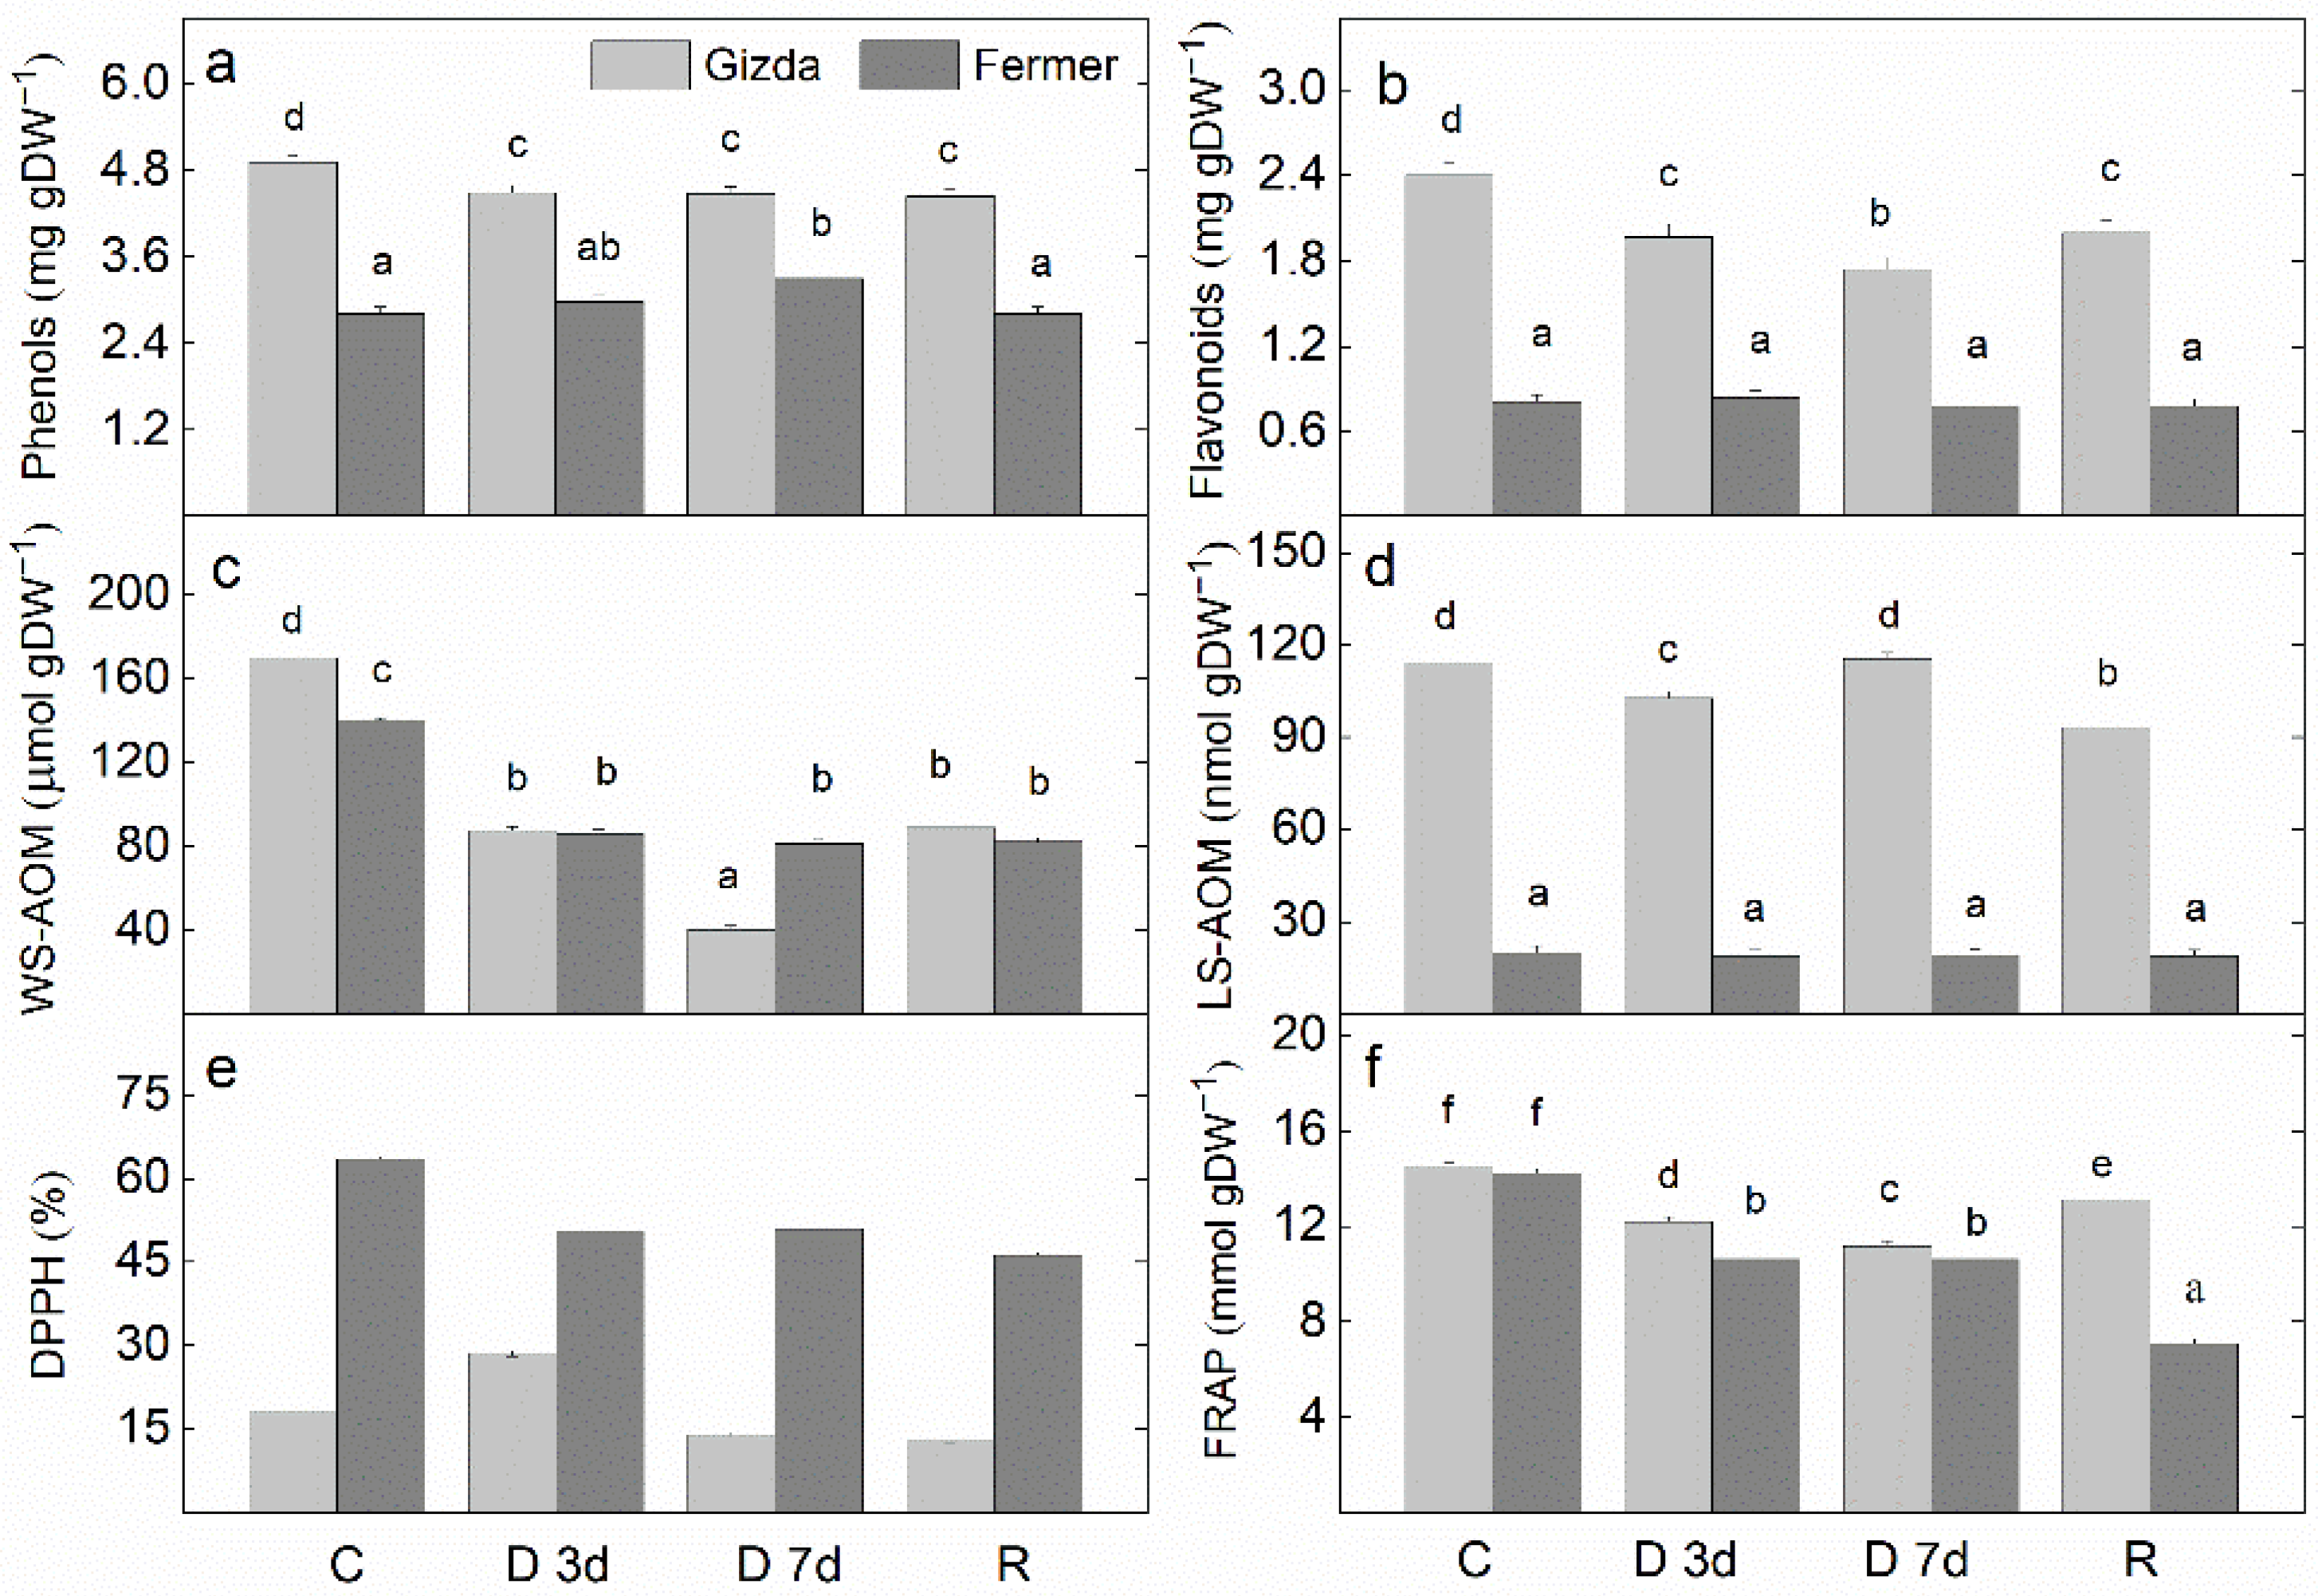
2.8. Antioxidant Power
3. Discussion
3.1. Drought-Induced Changes in RWC and EL
3.2. Drought-Induced Changes in Photosynthetic Apparatus
3.2.1. Pigments
3.2.2. Photochemical Activity of PSII and PSI
3.2.3. Thermoluminescence
3.2.4. Fluidity of Lipid Phase of Thylakoid Membranes
3.2.5. Energy Interaction between the Main Pigment–Protein Complexes
3.2.6. Stress-Induced Proteins
3.3. Effect of Water Stress Deficits on the Antioxidant Power
4. Materials and Methods
4.1. Plant Material and Drought Conditions
4.2. Determination of RWC
4.3. Electrolyte Leakage
4.4. Photosynthetic Pigments’ Content
4.5. Chlorophyll a Fluorescence Induction
4.6. P700 Measurements
4.7. Thermoluminescence Measurements
4.8. Isolation of Thylakoid Membranes
4.9. 77 K Chlorophyll Fluorescence Measurements
4.10. Steady-State Fluorescence Polarization of DPH
4.11. Protein Isolation, SDS-PAGE, and Western Blot
4.12. Antioxidant Activity Analysis
4.13. Statistics
5. Conclusions
Supplementary Materials
Author Contributions
Funding
Data Availability Statement
Acknowledgments
Conflicts of Interest
References
- Hanjra, M.A.; Qureshi, M.E. Global water crisis and future food security in an era of climate change. Food Pol. 2010, 35, 365–377. [Google Scholar] [CrossRef]
- Zhao, T.; Dai, A. The magnitude and causes of global drought changes in the twenty-first century under a low–severe emissions scenario. J. Clim. 2015, 28, 4490–4512. [Google Scholar] [CrossRef]
- Leng, G.; Hall, J. Crop yield sensitivity of global major agricultural countries to droughts and the projected changes in the future. Sci. Total Environ. 2019, 654, 811–821. [Google Scholar] [CrossRef] [PubMed]
- Hussain, M.; Farooq, S.; Hasan, W.; Ul-Allah, S.; Tanveer, M.; Farooq, M.; Nawaz, A. Drought stress in sunflower: Physiological effects and its management through breeding and agronomic alternatives. Agric. Water Manag. 2018, 201, 152–166. [Google Scholar] [CrossRef]
- Hammer, G.L.; Cooper, M.; Reynolds, M.P. Plant production in water-limited environments. J. Exp. Bot. 2021, 72, 5097–5101. [Google Scholar] [CrossRef]
- Abdelkader, M.A.; El-Gabry, Y.A.G.; Sayed, A.N.; Shahin, M.G.; Darwish, H.A.; Aboukota, M.E.; Hashem, F.A.E.; Abd-Elrahman, S.H. Evaluation of physio-biochemical criteria in maize inbred lines and their F1 hybrids grown under water-deficit conditions. Ann. Agric. Sci. 2022, 67, 220–231. [Google Scholar] [CrossRef]
- Chairi, F.; Aparicio, N.; Serret, M.D.; Araus, J.L. Breeding effects on the genotype x environment interaction for yield of durum wheat grown after the Green Revolution: The case of Spain. Crops J. 2020, 8, 623–634. [Google Scholar] [CrossRef]
- Erenstein, O.; Jaleta, M.; Mottaleb, K.A.; Sonder, K.; Donovan, J.; Braun, H.J. Global trends in wheat production, consumption and trade. In Wheat Improvement; Reynolds, M.P., Braun, H.J., Eds.; Springer: Cham, Switzerland, 2022; pp. 47–66. [Google Scholar] [CrossRef]
- Trethowan, R.M. Abiotic stresses. In Wheat Improvement; Reynolds, M.P., Braun, H.J., Eds.; Springer: Cham, Switzerland, 2022; pp. 159–175. [Google Scholar] [CrossRef]
- Zhu, J.-K. Abiotic stress signaling and responses in plants. Cell 2016, 167, 313–324. [Google Scholar] [CrossRef] [Green Version]
- Rampino, P.; Pataleo, S.; Gerardi, C.; Mita, G.; Perrotta, C. Drought stress response in wheat: Physiological and molecular analysis of resistant and sensitive genotypes. Plant Cell Environ. 2006, 29, 2143–2152. [Google Scholar] [CrossRef]
- Petrov, P.; Kartseva, T.; Milanov, H.; Tashev, T.; Misheva, S. Why do wheat seedlings respond differently to drought simulated by polyethylene glycol 6000 osmotic stress or soil drying? Genet. Plant Physiol. 2019, 9, 11–21. [Google Scholar]
- Cruz de Carvalho, M.H. Drought stress and reactive oxygen species. Plant Signal Behav. 2008, 3, 156–165. [Google Scholar] [CrossRef] [PubMed] [Green Version]
- Pospíšil, P.; Yamamoto, Y. Damage to photosystem II by lipid peroxidation products. Biochim. Biophys. Acta 2017, 1861, 457–466. [Google Scholar] [CrossRef] [PubMed]
- Moustakas, M.; Sperdouli, I.; Moustaka, J. Early drought stress warning in plants: Color pictures of photosystem II photochemistry. Rev. Clim. 2022, 10, 179. [Google Scholar] [CrossRef]
- Miller, G.; Suzuki, N.; Ciftci-Yilmaz, S.; Mittler, R. Reactive oxygen species homeostasis and signaling during drought and salinity stresses. Plant Cell Environ. 2010, 33, 453–467. [Google Scholar] [CrossRef] [PubMed]
- Pyngrope, S.; Bhoomika, K.; Dubey, R.S. Reactive oxygen species, ascorbate–glutathione pool, and enzymes of their metabolism in drought-sensitive and tolerant indica rice (Oryza sativa L.) seedlings subjected to progressing levels of water deficit. Protoplasma 2013, 250, 585–600. [Google Scholar] [CrossRef]
- Rangani, J.; Panda, A.; Patel, M.; Parida, A.K. Regulation of ROS through proficient modulations of antioxidative defense system maintains the structural and functional integrity of photosynthetic apparatus and confers drought tolerance in the facultative halophyte Salvadora persica L. J. Photochem. Photobiol. B 2018, 189, 214–233. [Google Scholar] [CrossRef]
- Farooq, M.; Wahid, A.; Kobayashi, N.; Fujita, D.; Basra, S.M.A. Plant drought stress: Effects, mechanisms and management. Agron. Sustain. Dev. 2009, 29, 185–212. [Google Scholar] [CrossRef] [Green Version]
- Maghsoudi, K.; Emam, Y.; Pessarakli, M. Effect of silicon on photosynthetic gas exchange, photosynthetic pigments, cell membrane stability and relative water content of different wheat cultivars under drought stress conditions. J. Plant Nutr. 2016, 39, 1001–1015. [Google Scholar] [CrossRef]
- Liu, C.; Liu, Y.; Guo, K.; Fan, D.; Li, G.; Zheng, Y.; Yu, L.; Yang, R. Effect of drought on pigments, osmotic adjustment and antioxidant enzymes in six woody plant species in karst habitats of southwestern China. Environ. Exp. Bot. 2011, 71, 174–183. [Google Scholar] [CrossRef]
- Saad-Allah, K.M.; Nessem, A.A.; Ebrahim, M.K.H.; Gad, D. Evaluation of drought tolerance of five maize genotypes by virtue of physiological and molecular responses. Agronomy 2022, 12, 59. [Google Scholar] [CrossRef]
- Zahedi, S.M.; Hosseini, M.S.; Fahadi Hoveizeh, N.; Kadkhodaei, S.; Vaculík, M. Physiological and biochemical responses of commercial strawberry cultivars under optimal and drought stress conditions. Plants 2023, 12, 496. [Google Scholar] [CrossRef] [PubMed]
- Gao, J.; Luo, Q.; Sun, C.; Hu, H.; Wang, F.; Tian, Z.; Jiang, D.; Cao, W.; Dai, T. Low Nitrogen priming enhances photosynthesis adaptation to water deficit stress in winter wheat (Triticum aestivum L.) seedlings. Front. Plant Sci. 2019, 10, 818. [Google Scholar] [CrossRef] [PubMed] [Green Version]
- Kartseva, T.; Dobrikova, A.; Kocheva, K.; Alexandrov, V.; Georgiev, G.; Brestič, M.; Misheva, S. Optimal nitrogen supply ameliorates the performance of wheat seedlings under osmotic stress in genotype-specific manner. Plants 2021, 10, 493. [Google Scholar] [CrossRef] [PubMed]
- Charuvi, D.; Nevo, R.; Shimoni, E.; Naveh, L.; Zia, A.; Zach, A.; Farrant, J.M.; Kirchhoffd, H.; Reich, Z. Photoprotection conferred by changes in photosynthetic protein levels and organization during dehydration of a homoiochlorophyllous resurrection plant. Plant Physiol. 2015, 167, 1554–1565. [Google Scholar] [CrossRef] [Green Version]
- Mihailova, G.; Christov, N.; Sárvári, E.; Solti, A.; Hembrom, R.; Solymosi, K.; Keresztes, A.; Velitchkova, M.; Popova, A.V.; Simova-Stoilova, L.; et al. Reactivation of the photosynthetic apparatus of resurrection plant Haberlea rhodopensis during the early phase of recovery from drought- and freezing-induced desiccation. Plants 2022, 11, 2185. [Google Scholar] [CrossRef]
- Dulai, S.; Tarnai, R.; Salamon, D.; Molnár, I.; Vojtkó, A.; Táborská, J.; Ammar, A.; Molnár-Láng, M.; Szopkó, D. Effects of water deficit and salt stress on some photosynthesis parameters in wheat and Aegilops comosa lines. Acta Biol. Plant. Agriensis 2019, 7, 55–67. [Google Scholar] [CrossRef]
- Lotfi, R.; Abbasi, A.; Kalaji, H.M.; Ieskandari, I.; Sedghieh, V.; Khorsandi, H.; Sadeghian, N.; Yadav, S.; Rastogi, A. The role of potassium on drought resistance of winter wheat cultivars under cold dryland conditions: Probed by chlorophyll a fluorescence. Plant Physiol. Biochem. 2022, 182, 45–54. [Google Scholar] [CrossRef]
- Furbank, R.T.; Sharwood, R.; Estavillo, G.M.; Silva-Perez, V.; Condon, A.G. Photons to food: Genetic improvement of cereal crop photosynthesis. J. Exp. Bot. 2020, 71, 2226–2238. [Google Scholar] [CrossRef] [Green Version]
- Dhanda, S.S.; Sethi, G.S.; Behl, R.K. Indices of drought tolerance in wheat genotypes at early stages of plant growth. J. Agron. Crop Sci. 2004, 190, 6–12. [Google Scholar] [CrossRef]
- Hameed, A.; Goher, M.; Iqbal, N. Evaluation of seedling survivability and growth response as selection criteria for breeding drought tolerance in wheat. Cereal Res. Commun. 2010, 38, 193–202. [Google Scholar] [CrossRef]
- Baker, N.R.; Rosenqvist, E. Applications of chlorophyll fluorescence can improve crop production strategies: An examination of future possibilities. J. Exp. Bot. 2004, 55, 1607–1621. [Google Scholar] [CrossRef] [PubMed] [Green Version]
- Baker, N.R. Chlorophyll fluorescence: A probe of photosynthesis in vivo. Ann. Rev. Plant Biol. 2008, 59, 89–113. [Google Scholar] [CrossRef] [Green Version]
- Kalaji, H.M.; Jajoo, A.; Oukarroum, A.; Brestič, M.; Živčák, M.; Samborska, I.A.; Cetner, M.D.; Lukasik, I.; Goltsev, V.; Ladle, R.J. Chlorophyll a fluorescence as a tool to monitor physiological status of plants under abiotic stress conditions. Acta Physiol. Plant. 2016, 38, 102. [Google Scholar] [CrossRef] [Green Version]
- Kalaji, H.M.; Goltsev, V.N.; Żuk-Gołaszewska, K.; Zivcak, M.; Brestic, M. Chlorophyll Fluorescence: Understanding Crop Performance—Basics and Applications; CRC Press: Boca Raton, FL, USA, 2017; p. 222. [Google Scholar] [CrossRef]
- Fang, L.; Martre, P.; Jin, K.; Du, X.; van der Putten, P.E.L.; Yin, X.; Struik, P.C. Neglecting acclimation of photosynthesis under drought can cause significant errors in predicting leaf photosynthesis in wheat. Glob. Chang. Biol. 2023, 29, 505–521. [Google Scholar] [CrossRef] [PubMed]
- Sperdouli, I.; Mellidou, I.; Moustakas, M. Harnessing Chlorophyll fluorescence for phenotyping analysis of wild and cultivated tomato for high photochemical efficiency under water deficit for climate change resilience. Climate 2021, 9, 154. [Google Scholar] [CrossRef]
- Sommer, S.G.; Han, E.; Li, X.; Rosenqvist, E.; Liu, F. The Chlorophyll fluorescence parameter Fv/Fm correlates with loss of grain yield after severe drought in three wheat genotypes grown at two CO2 concentrations. Plants 2023, 12, 436. [Google Scholar] [CrossRef]
- Lu, C.; Zhang, J. Effects of water stress on photosystem II photochemistry and its thermostability in wheat plants. J. Exp. Bot. 1999, 50, 1199–1206. [Google Scholar] [CrossRef]
- Close, T.J. Dehydrins: Emergence of a biochemical role of a family of plant dehydration proteins. Physiol. Plant. 1996, 97, 795–803. [Google Scholar] [CrossRef]
- Montané, M.H.; Kloppstech, K. The family of light-harvesting-related proteins (LHCs, ELIPs, HLIPs): Was the harvesting of light their primary function? Gene 2000, 258, 1–8. [Google Scholar] [CrossRef]
- Waters, E.R.; Vierling, E. Plant small heat shock proteins–evolutionary and functional diversity. New Phytol. 2020, 227, 24–37. [Google Scholar] [CrossRef] [Green Version]
- Kosová, K.; Vítámvás, P.; Prášil, I.T. Wheat and barley dehydrins under cold, drought, and salinity–what can LEA-II proteins tell us about plant stress response? Front. Plant Sci. 2014, 5, 343. [Google Scholar] [CrossRef] [PubMed] [Green Version]
- Adamska, I. The Elip family of stress proteins in the thylakoid membranes of pro- and eukaryota. In Regulation of Photosynthesis. Advances in Photosynthesis and Respiration; Aro, E.M., Andersson, B., Eds.; Springer: Dordrecht, The Netherlands, 2001; Volume 11, pp. 487–505. [Google Scholar] [CrossRef]
- Dobrikova, A.; Borisova, P.; Yotsova, E.; Chipilski, R.; Dimitrov, E.; Uhr, Z.; Todorovska, E.; Popova, A.V. Application of fast biochemical stress markers for evaluation of drought tolerance of four common winter wheat varieties. Comptes Rendus Acad. Bulg. Sci. 2022, 75, 773–782. [Google Scholar] [CrossRef]
- Maxwell, P.C.; Biggins, J. Role of cyclic electron transport in photosynthesis as measured by the photoinduced turnover of P700 in vivo. Biochemistry 1976, 15, 3975–3981. [Google Scholar] [CrossRef] [PubMed]
- Ravenel, J.; Peltier, G.; Havaux, M. The cyclic electron pathways around photosystem I in Chlamydomonas reinhardtii as determined in vivo by photoacoustic measurements of energy storage. Planta 1994, 193, 251–259. [Google Scholar] [CrossRef]
- Krause, G.H.; Weis, E. Chlorophyll fluorescence and photosynthesis: The basis. Annu. Rev. Plant Physiol. Plant Mol. Biol. 1991, 42, 313–349. [Google Scholar] [CrossRef]
- Andrizhiyevskaya, E.G.; Chojnicka, A.; Bautista, J.A.; Diner, B.A.; van Grondelle, R.; Dekker, J.P. Origin of the F685 and F695 fluorescence in photosystem II. Photosynth. Res. 2005, 84, 173–180. [Google Scholar] [CrossRef]
- Tian, H.; Zhou, Q.; Liu, W.; Zhang, J.; Chen, Y.; Jia, Z.; Shao, Y.; Wang, H. Responses of photosynthetic characteristics of oat flag leaf and spike to drought stress. Front. Plant Sci. 2022, 13, 917528. [Google Scholar] [CrossRef]
- Sallam, A.; Alqudah, A.M.; Dawood, M.F.A.; Baenziger, P.S.; Börner, A. Drought stress tolerance in wheat and barley: Advances in physiology, breeding and genetics research. Int. J. Mol. Sci. 2019, 20, 3137. [Google Scholar] [CrossRef] [Green Version]
- Wang, J.; Possw, A.; Donovanw, T.J.; Shannonz, M.C.; Leschw, S.M. Biophysical properties and biomass production of elephant grass under saline conditions. J. Arid Environ. 2002, 52, 447–456. [Google Scholar] [CrossRef]
- Liguori, N.; Xu, P.; van Stokkum, I.H.; van Oort, B.; Lu, Y.; Karcher, D.; Bock, R.; Croce, R. Different carotenoid conformations have distinct functions in light-harvesting regulation in plants. Nat. Commun. 2017, 8, 1994. [Google Scholar] [CrossRef] [Green Version]
- Han, H.; Li, Y.; Zhou, S. Overexpression of phytoene synthase gene from Salicornia europaea alters response to reactive oxygen species under salt stress in transgenic Arabidopsis. Biotechnol. Lett. 2008, 30, 1501–1507. [Google Scholar] [CrossRef] [PubMed]
- Rivas, R.; Frosi, G.; Ramos, D.G.; Pereira, S.; Benko-Iseppon, A.M.; Santos, M.G. Photosynthetic limitation and mechanisms of photoprotection under drought and recovery of Calotropis procera, an evergreen C3 from arid regions. Plant Physiol. Biochem. 2017, 118, 589–599. [Google Scholar] [CrossRef] [PubMed]
- Anderson, J.M. Photoregulation of the composition, function and structure of thylakoid membranes. Annu. Rev. Plant Physiol. Plant Mol. Biol. 1986, 37, 93–136. [Google Scholar] [CrossRef]
- Wang, G.; Zeng, F.; Song, P.; Sun, B.; Wang, Q.; Wang, J. Effects of reduced chlorophyll content on photosystem functions and photosynthetic electron transport rate in rice leaves. J. Plant Physiol. 2022, 272, 153669. [Google Scholar] [CrossRef]
- Maxwell, K.; Johnson, G.N. Chlorophyll fluorescence—A practical guide. J. Exp. Bot. 2000, 51, 659–668. [Google Scholar] [CrossRef]
- Govindjee, G. Sixty-three years since Kautsky: Chlorophyll a fluorescence. Aust. J. Plant Physiol. 1995, 22, 131–160. [Google Scholar] [CrossRef]
- Smirnov, O.; Svietlova, N.; Topchiy, N.; Storozhenko, V.; Smirnov, O.; Kovalenko, M.; Batsmanova, L.; Taran, N. Photosynthetic response of some Triticum cultivars to the combined influence of nanofertilizers and water deficit. J. Cent. Eur. Agric. 2021, 22, 539–545. [Google Scholar] [CrossRef]
- Radzikowska, D.; Sulewska, H.; Bandurska, H.; Ratajczak, K.; Szymanska, G.; Kowalczewski, P.Ł.; Głowicka-Wołoszyn, R. Analysis of physiological status in response to water deficit of spelt (Triticum aestivum ssp. spelta) cultivars in reference to common wheat (Triticum aestivum ssp. vulgare). Agronomy 2022, 12, 1822. [Google Scholar] [CrossRef]
- Yuan, S.; Liu, W.J.; Zhang, N.H.; Wang, M.B.; Liang, H.G.; Lin, H.H. Effects of water stress on major PSII gene expression and protein metabolism in barley leaves. Physiol. Plant. 2005, 125, 464–473. [Google Scholar] [CrossRef]
- Liu, J.; Guo, Y.Y.; Bai, Y.W.; Li, H.J.; Xue, J.Q.; Zhang, R.H. Response of photosynthesis in maize to drought and re-watering. Russ. J. Plant Physiol. 2019, 66, 424–432. [Google Scholar] [CrossRef]
- Demeter, S.; Vass, I. Charge accumulation and recombination in photosystem II studied by thermoluminescence. I. Participation of the primary acceptor Q and secondary acceptor B in the generation of thermoluminescence of chloroplasts. Biochim. Biophys. Acta 1984, 764, 24–32. [Google Scholar] [CrossRef]
- Miranda, T.; Ducruet, J.M. Characterization of the chlorophyll thermoluminescence afterglow in dark-adapted or far-red-illuminated plant leaves. Plant Physiol. Biochem. 1995, 33, 689–699. Available online: http://hdl.handle.net/10261/294191 (accessed on 27 April 2023).
- Peeva, V.N.; Tóth, S.Z.; Cornic, G.; Ducruet, J.-M. Thermoluminescence and P700 redox kinetics as complementary tools to investigate the cyclic/chlororespiratory electron pathways in stress conditions in barley leaves. Physiol. Plant. 2012, 144, 83–97. [Google Scholar] [CrossRef] [PubMed]
- Bürling, K.; Ducruet, J.M.; Cornic, G.; Hunsche, M.; Cerovic, Z.G. Assessment of photosystem II thermoluminescence as a tool to investigate the effects of dehydration and rehydration on the cyclic/chlororespiratory electron pathways in wheat and barley leaves. Plant Sci. 2014, 223, 116–123. [Google Scholar] [CrossRef] [PubMed]
- Bashir, N.; Athar, H.-R.; Kalaji, H.M.; Wróbel, J.; Mahmood, S.; Zafar, Z.U.; Ashraf, M. Is photoprotection of PSII one of the key mechanisms for drought tolerance in maize? Int. J. Mol. Sci. 2021, 22, 13490. [Google Scholar] [CrossRef]
- Los, D.A.; Mironov, K.S.; Allakhverdiev, S.I. Regulatory role of membrane fluidity in gene expression and physiological functions. Photosynth. Res. 2013, 116, 489–509. [Google Scholar] [CrossRef]
- Kovacs, T.; Szalontai, B.; Kłodawska, K.; Vladkova, R.; Malec, P.; Gombos, Z.; Laczko-Dobos, H. Photosystem I oligomerization affects lipid composition in Synechocystis sp. PCC 6803. Biochim. Biophys. Acta Mol. Cell Biol. Lipids 1864, 10, 1384–1395. [Google Scholar] [CrossRef]
- Raju, S.K.K.; Barnes, A.C.; Schnable, J.C.; Roston, R.L. Low temperature tolerance in land plants: Are transcript and membrane responses conserved? Plant Sci. 2018, 276, 73–86. [Google Scholar] [CrossRef]
- Popova, A.V.; Dobrev, K.; Velitchkova, M.; Ivanov, A.G. Differential temperature effects on dissipation of excess light energy and energy partitioning in lut2 mutant of Arabidopsis thaliana under photoinhibitory conditions. Photosynth. Res. 2019, 139, 367–385. [Google Scholar] [CrossRef]
- Velitchkova, M.; Borisova, P.; Vasilev, D.; Popova, A.V. Different impact of high light on the response and recovery of wild type and lut2 mutant of Arabidopsis thaliana at low temperature. Theor. Exp. Plant Physiol. 2021, 33, 95–111. [Google Scholar] [CrossRef]
- Graether, S.P.; Boddington, K.F. Disorder and function: A review of the dehydrin protein family. Front. Plant Sci. 2014, 5, 576. [Google Scholar] [CrossRef] [PubMed] [Green Version]
- Vítámvás, P.; Kosová, K.; Musilová, J.; Holková, L.; Mařík, P.; Smutná, P.; Klíma, M.; Prášil, I.T. Relationship between dehydrin accumulation and winter survival in winter wheat and barley grown in the field. Front. Plant Sci. 2019, 10, 7. [Google Scholar] [CrossRef] [Green Version]
- Vuković, R.; Čamagajevac, I.Š.; Vuković, A.; Šunić, K.; Begović, L.; Mlinarić, S.; Sekulić, R.; Sabo, N.; Španić, V. Physiological, biochemical and molecular response of different winter wheat varieties under drought stress at germination and seedling growth stage. Antioxidants 2022, 11, 693. [Google Scholar] [CrossRef] [PubMed]
- Havrlentová, M.; Kraic, J.; Gregusová, V.; Kovácsová, B. Drought stress in cereals–a review. Agriculture (Pol’nohospodárstvo) 2021, 67, 47–60. [Google Scholar] [CrossRef]
- Chaves, M.M.; Flexas, J.; Pinheiro, C. Photosynthesis under drought and salt stress: Regulation mechanisms from whole plant to cell. Ann. Bot. 2009, 103, 551–560. [Google Scholar] [CrossRef] [PubMed] [Green Version]
- Król, M.; Ivanov, M.G.; Jansson, S.; Kloppstech, K.; Huner, N.P.A. Greening under high light or cold temperature affects the level of xanthophyll cycle pigments, early light-inducible proteins, and light-harvesting polypeptides in wild-type barley and the chlorina f2 mutant. Plant Physiol. 1999, 120, 193–203. [Google Scholar] [CrossRef] [Green Version]
- Hutin, C.; Nussaume, L.; Moise, N.; Moya, I.; Kloppstech, K.; Havaux, M. Early light-induced proteins protect Arabidopsis from photooxidative stress. Proc. Natl. Acad. Sci. USA 2003, 100, 4921–4926. [Google Scholar] [CrossRef] [Green Version]
- Shimosaka, E.; Sasanuma, T.; Handa, H. A wheat cold-regulated cDNA encoding an early light-inducible protein (ELIP): Its structure, expression and chromosomal location. Plant Cell Physiol. 1999, 40, 319–325. [Google Scholar] [CrossRef] [Green Version]
- Adamska, I.; Kloppstech, K.; Ohad, I. Early light-inducible protein in pea is stable during light stress but is degraded during recovery at low light intensity. J. Biol. Chem. 1993, 268, 5438–5444. [Google Scholar] [CrossRef]
- Abid, M.; Ali, S.; Qi, L.K.; Zahoor, R.; Tian, Z.; Jiang, D.; Snider, J.L.; Dai, T. Physiological and biochemical changes during drought and recovery periods at tillering and jointing stages in wheat (Triticum aestivum L.). Sci. Rep. 2018, 8, 4615. [Google Scholar] [CrossRef] [Green Version]
- Bano, A.; Ullah, F.; Nosheen, A. Role of abscisic acid and drought stress on the activities of antioxidant enzymes in wheat. Plant Soil Environ. 2012, 58, 181–185. [Google Scholar] [CrossRef] [Green Version]
- Devi, R.; Kaur, N.; Gupta, K. Potential of antioxidant enzymes in depicting drought tolerance of wheat (Triticum aestivum L.). Ind. J. Biochem. Biophys. 2011, 49, 257–265. Available online: https://pubmed.ncbi.nlm.nih.gov/23077787/ (accessed on 28 April 2023).
- Contreras-Guzman, E.S.; Strong, F.C. Determination of tocopherols (Vitamin E) by reduction of cupric ion. JAOAC J. Assoc. Off. Anal. Chem. 1982, 65, 1215. [Google Scholar] [CrossRef]
- Kedare, S.B.; Singh, R.P. Genesis and development of DPPH method of antioxidant assay. J. Food Sci. Technol. 2011, 48, 412–422. [Google Scholar] [CrossRef] [PubMed] [Green Version]
- Gerganova, M.; Popova, A.V.; Stanoeva, D.; Velitchkova, M. Tomato plants acclimate better to elevated temperature and high light than to treatment with each factor sep arately. Plant Physiol. Biochem. 2016, 104, 234–241. [Google Scholar] [CrossRef]
- Lichtenthaler, H.K. Chlorophylls and carotenoids–pigments of photosynthetic biomembranes. Method Enzymol. 1987, 148, 350–382. [Google Scholar] [CrossRef]
- Genty, B.; Briantais, J.-M.; Baker, N.R. The relationship between the quantum yield of photosynthetic electron transport and quenching of chlorophyll fluorescence. Biochim. Biophys. Acta 1989, 990, 87–92. [Google Scholar] [CrossRef]
- Genty, B.; Harbinson, J.; Cailly, A.L.; Rizza, F. Fate of excitation at PS II in leaves: The non-photochemical side. In Proceedings of the Third BBSRC Robert Hill Symposium on Photosynthesis, Sheffield, UK, 31 March–3 April 1996. [Google Scholar]
- Zeinalov, Y.; Maslenkova, L. A computerised equipment for thermoluminescence investigations. Bulg. J. Plant Physiol. 1996, 22, 88–94. [Google Scholar]
- Harrison, M.A.; Melis, A. Organization and stability of polypeptides associated with the chlorophyll aeb light-harvesting complex of photosystem-II. Plant Cell Physiol. 1992, 33, 627–637. [Google Scholar] [CrossRef]
- Popova, A.V.; Velitchkova, M.; Zanev, Y. Effect of membrane fluidity on photosynthetic oxygen production reactionsEffect of membrane fluidity on photosynthetic oxygen production reactions. Z. Naturforsch. C J. Biosci. 2007, 62, 253–260. [Google Scholar] [CrossRef]
- Laemmli, U.K. Cleavage of structural proteins during the assembly of the head of bacteriophage T4. Nature 1970, 227, 680–685. [Google Scholar] [CrossRef] [PubMed]
- Hristozkova, M.; Geneva, M.; Stancheva, I.; Iliev, I.; Azcon-Aguilar, C. Symbiotic association between golden berry (Physalis peruviana) and arbuscular mycorrhizal fungi in heavy metal-contaminated soil. J. Plant Prot. Res. 2017, 57, 173–184. [Google Scholar] [CrossRef]
- Giannopolitis, C.N.; Ries, S.K. Superoxide dismutases I. Occurrence in higher plants. Plant Physiol. 1977, 59, 309–314. [Google Scholar] [CrossRef]
- Beers, F.; Sizer, I.F. A spectrophotometric method for measuring breakdown of hydrogen peroxide by catalase. J. Biol. Chem. 1952, 195, 133–140. [Google Scholar] [CrossRef]
- Nakano, Y.; Asada, K. Purification of ascorbate peroxidase in spinach chloroplasts, its inactivation in ascorbate-depleted medium and reactivation by monodehydroascorbate radical. Plant Cell Physiol. 1987, 28, 131–140. [Google Scholar] [CrossRef]
- Urbanek, H.; Kuzniak-Gebarowska, E.; Herka, K. Elicitation of defence responses in bean leaves by Botrytis cinerea polygalacturonase. Acta Physiol. Plant. 1991, 13, 43–50. [Google Scholar]
- Bradford, M.M. A rapid and sensitive method for the estimation of microgram quantities of protein utilizing the principle of protein-dye binding. Anal. Biochem. 1976, 72, 248–254. [Google Scholar] [CrossRef]
- Pfeffer, H.; Dannel, F.; Römheld, V. Are there connection between phenol metabolism, ascorbate metabolism and membrane integrity in leaves of boron-deficient sunflower plants? Physiol. Plant. 1998, 104, 479–485. [Google Scholar] [CrossRef]
- Zhishen, J.; Mengcheng, T.; Jianming, W. The determination of flavonoid contents in mulberry and their scavenging effects on superoxide radicals. Food Chem. J. 1999, 64, 555–559. [Google Scholar] [CrossRef]
- Tepe, B.; Sokmen, M.; Akpulat, H.A.; Sokmen, A. Screening of the antioxidant potentials of six Salvia species from Turkey. Food Chem. 2006, 95, 200–204. [Google Scholar] [CrossRef]
- Benzie, I.; Strain, J. The ferric reducing ability of plasma (FRAP) as a measure of “antioxidant power”: The FRAP assay. Anal. Biochem. 1996, 239, 70–76. [Google Scholar] [CrossRef] [PubMed] [Green Version]
- Prieto, P.; Pineda, M.; Aguilar, M. Spectrophotometric quantitation of antioxidant capacity through the formation of a phosphomolybdenum complex: Specific application to the determination of vitamin E. Anal. Biochem. 1999, 269, 337–341. [Google Scholar] [CrossRef] [PubMed]


Disclaimer/Publisher’s Note: The statements, opinions and data contained in all publications are solely those of the individual author(s) and contributor(s) and not of MDPI and/or the editor(s). MDPI and/or the editor(s) disclaim responsibility for any injury to people or property resulting from any ideas, methods, instructions or products referred to in the content. |
© 2023 by the authors. Licensee MDPI, Basel, Switzerland. This article is an open access article distributed under the terms and conditions of the Creative Commons Attribution (CC BY) license (https://creativecommons.org/licenses/by/4.0/).
Share and Cite
Popova, A.V.; Mihailova, G.; Geneva, M.; Peeva, V.; Kirova, E.; Sichanova, M.; Dobrikova, A.; Georgieva, K. Different Responses to Water Deficit of Two Common Winter Wheat Varieties: Physiological and Biochemical Characteristics. Plants 2023, 12, 2239. https://doi.org/10.3390/plants12122239
Popova AV, Mihailova G, Geneva M, Peeva V, Kirova E, Sichanova M, Dobrikova A, Georgieva K. Different Responses to Water Deficit of Two Common Winter Wheat Varieties: Physiological and Biochemical Characteristics. Plants. 2023; 12(12):2239. https://doi.org/10.3390/plants12122239
Chicago/Turabian StylePopova, Antoaneta V., Gergana Mihailova, Maria Geneva, Violeta Peeva, Elisaveta Kirova, Mariyana Sichanova, Anelia Dobrikova, and Katya Georgieva. 2023. "Different Responses to Water Deficit of Two Common Winter Wheat Varieties: Physiological and Biochemical Characteristics" Plants 12, no. 12: 2239. https://doi.org/10.3390/plants12122239