
Lipidome Profiling of Phosphorus Deficiency-Tolerant Rice Cultivars Reveals Remodeling of Membrane Lipids as a Mechanism of Low P Tolerance
 , ,
, ,
Abstract
:1. Introduction
2. Results
2.1. Growth of 42 Rice Cultivars in Soil Culture
2.2. Shoot P Concentration and Shoot Dry Weight of Rice
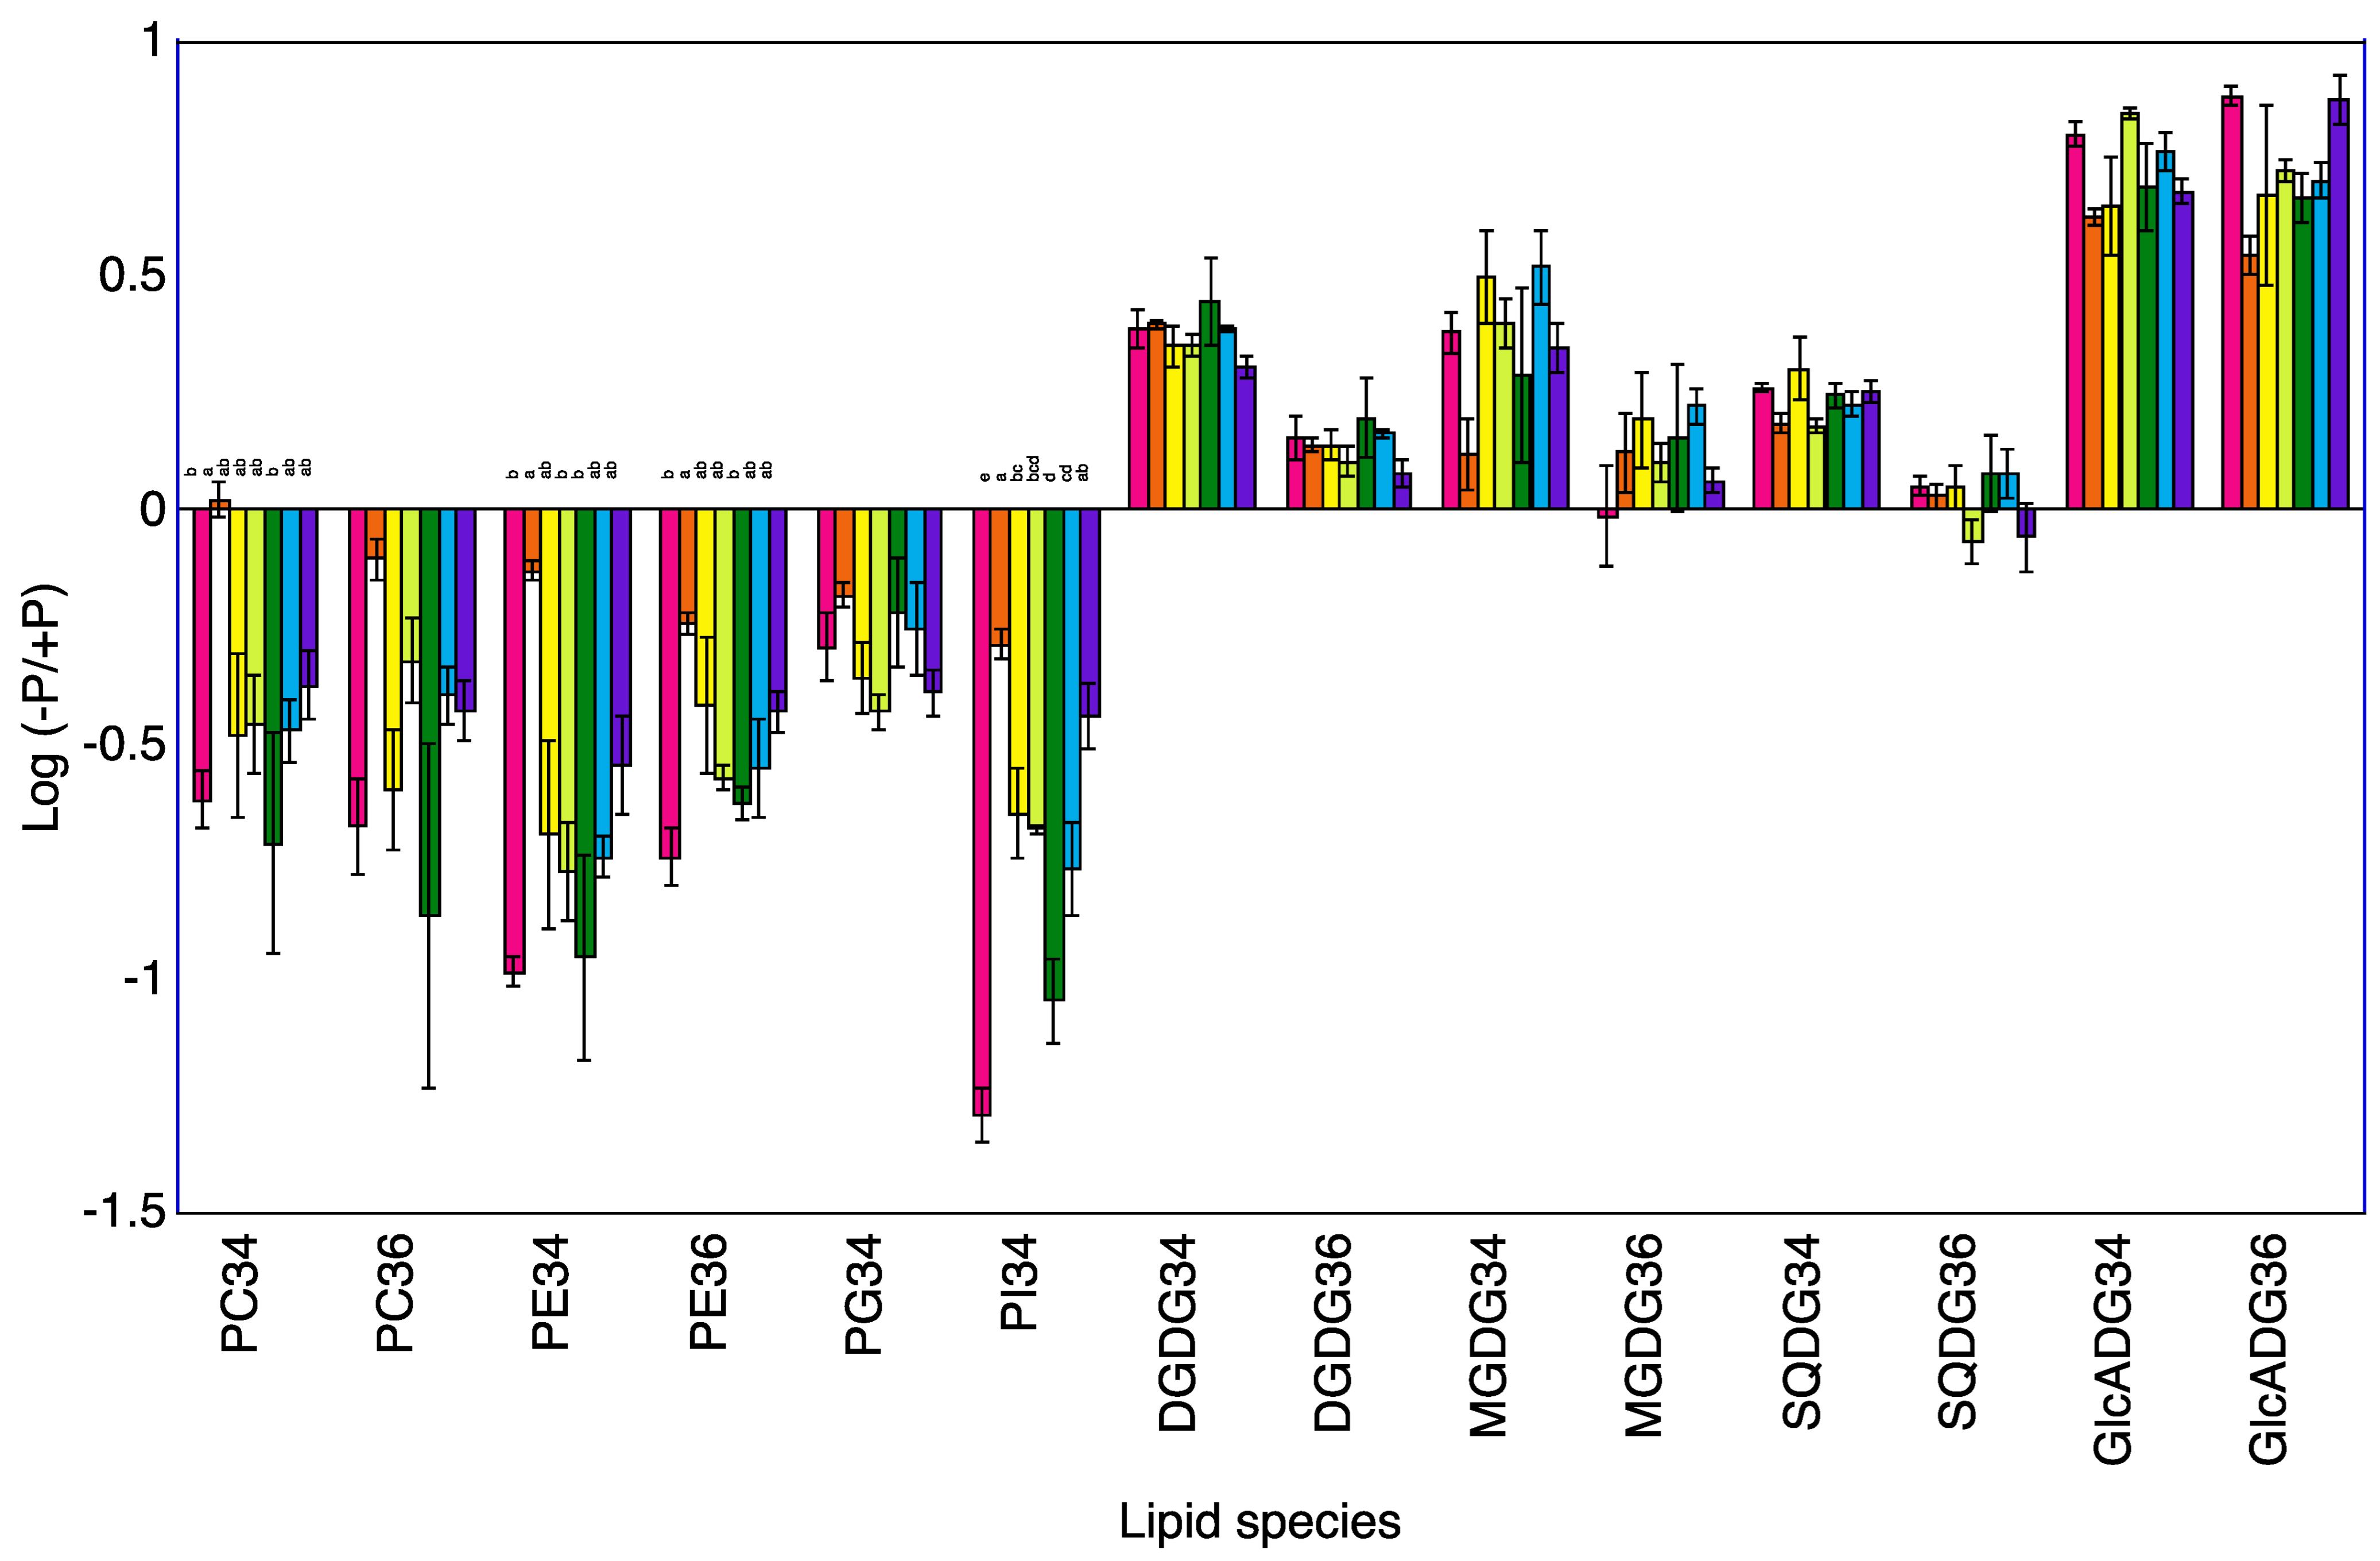
2.3. Lipid Profiles in Shoots of Seven Rice Cultivars
2.4. Lipid Profiles in Roots of Seven Rice Cultivars
3. Discussion
3.1. P Deficiency Increases Phospholipids Decomposition
3.2. P Deficiency Increases Non-Phospholipid Synthesis
3.3. Relationship between Lipid Remodeling and Low P Tolerance
4. Materials and Methods
4.1. Screening of P-Tolerant and P-Sensitive Rice Cultivars Grown in Soil Culture
4.2. Lipidome Profiling for Seven Rice Cultivars Grown in Solution Culture
4.3. Lipidomic Analysis
4.4. Statistical Analyses
5. Conclusions
Supplementary Materials
Author Contributions
Funding
Data Availability Statement
Acknowledgments
Conflicts of Interest
References
- Abel, S.; Ticconi, C.A.; Delatorre, C.A. Phosphate sensing in higher plants. Physiol. Plant. 2002, 115, 1–8. [Google Scholar] [CrossRef]
- Cordell, D.; Drangert, J.O.; White, S. The story of phosphorus: Global food security and food for thought. Glob. Environ. Chang. Hum. Policy Dimens. 2009, 19, 292–305. [Google Scholar] [CrossRef]
- Padalia, K.; Bargali, S.S.; Bargali, K.; Manral, V. Soil microbial biomass phosphorus under different land use systems of Central Himalaya. Trop. Ecol. 2022, 63, 30–48. [Google Scholar] [CrossRef]
- Wang, X.R.; Shen, J.B.; Liao, H. Acquisition or utilization, which is more critical for enhancing phosphorus efficiency in modern crops? Plant Sci. 2010, 179, 302–306. [Google Scholar] [CrossRef]
- Hartel, H.; Dormann, P.; Benning, C. DGD1-independent biosynthesis of extraplastidic galactolipids after phosphate deprivation in Arabidopsis. Proc. Natl. Acad. Sci USA 2000, 97, 10649–10654. [Google Scholar] [CrossRef] [PubMed] [Green Version]
- Andersson, M.X.; Stridh, M.H.; Larsson, K.E.; Lijenberg, C.; Sandelius, A.S. Phosphate-deficient oat replaces a major portion of the plasma membrane phospholipids with the galactolipid digalactosyldiacylglycerol. FEBS Lett. 2003, 537, 128–132. [Google Scholar] [CrossRef] [Green Version]
- Nakamura, Y. Phosphate starvation and membrane lipid remodeling in seed plants. Prog. Lipid Res. 2013, 52, 43–50. [Google Scholar] [CrossRef]
- Okazaki, Y.; Kamide, Y.; Hirai, M.Y.; Saito, K. Plant lipidomics based on hydrophilic interaction chromatography coupled to ion trap time-of-flight mass spectrometry. Metabolomics 2013, 9, S121–S131. [Google Scholar] [CrossRef] [Green Version]
- Vibhuti; Shahi, C.; Bargali, K.; Bargali, S.S. Seed germination and seedling growth parameters of rice (Oryza sativa) varieties as affected by salt and water stress. Indian J. Agric. Sci. 2015, 85, 102–108. [Google Scholar]
- Fageria, N.K.; Santos, A.B.; Heinemann, A.B. Lowland Rice Genotypes Evaluation for Phosphorus Use Efficiency in Tropical Lowland. J. Plant Nutr. 2011, 34, 1087–1095. [Google Scholar] [CrossRef]
- Kumar, S.; Pallavi; Chugh, C.; Seem, K.; Kumar, S.; Vinod, K.K.; Mohapatra, T. Characterization of contrasting rice (Oryza sativa L.) genotypes reveals the Pi-efficient schema for phosphate starvation tolerance. BMC Plant Biol. 2021, 21, 282. [Google Scholar] [CrossRef]
- Kumar, S.; Agrawal, A.; Seem, K.; Kumar, S.; Vinod, K.K.; Mohapatra, T. Transcriptome analysis of a near-isogenic line and its recurrent parent reveals the role of Pup1 QTL in phosphorus deficiency tolerance of rice at tillering stage. Plant Mol. Biol. 2022, 109, 29–50. [Google Scholar] [CrossRef] [PubMed]
- Nakamura, Y.; Awai, K.; Masuda, T.; Yoshioka, Y.; Takamiya, K.; Ohta, H. A novel phosphatidylcholine-hydrolyzing phospholipase C induced by phosphate starvation in Arabidopsis. J. Biol. Chem. 2005, 280, 7469–7476. [Google Scholar] [CrossRef] [Green Version]
- Shemi, A.; Schatz, D.; Fredricks, H.F.; Van Mooy, B.A.S.; Porat, Z.; Vardi, A. Phosphorus starvation induces membrane remodeling and recycling in Emiliania huxleyi. New Phytol. 2016, 211, 886–898. [Google Scholar] [CrossRef] [PubMed] [Green Version]
- Canavate, J.P.; Armada, I.; Hachero-Cruzado, I. Interspecific variability in phosphorus-induced lipid remodelling among marine eukaryotic phytoplankton. New Phytol. 2017, 213, 700–713. [Google Scholar] [CrossRef] [PubMed] [Green Version]
- Russo, M.A.; Quartacci, M.F.; Izzo, R.; Belligno, A.; Navari-Izzo, F. Long- and short-term phosphate deprivation in bean roots: Plasma membrane lipid alterations and transient stimulation of phospholipases. Phytochemistry 2007, 68, 1564–1571. [Google Scholar] [CrossRef]
- Lambers, H.; Cawthray, G.R.; Giavalisco, P.; Kuo, J.; Laliberte, E.; Pearse, S.J.; Scheible, W.R.; Stitt, M.; Teste, F.; Turner, B.L. Proteaceae from severely phosphorus-impoverished soils extensively replace phospholipids with galactolipids and sulfolipids during leaf development to achieve a high photosynthetic phosphorus-use-efficiency. New Phytol. 2012, 196, 1098–1108. [Google Scholar] [CrossRef]
- Kuppusamy, T.; Giavalisco, P.; Arvidsson, S.; Sulpice, R.; Stitt, M.; Finnegan, P.M.; Scheible, W.R.; Lambers, H.; Jost, R. Lipid Biosynthesis and Protein Concentration Respond Uniquely to Phosphate Supply during Leaf Development in Highly Phosphorus-Efficient Hakea prostrata. Plant Physiol. 2014, 166, 1891–1911. [Google Scholar] [CrossRef] [Green Version]
- Tawaraya, K.; Honda, S.; Cheng, W.; Chuba, M.; Okazaki, Y.; Saito, K.; Oikawa, A.; Maruyama, H.; Wasaki, J.; Wagatsuma, T. Ancient rice cultivar extensively replaces phospholipids with non-phosphorus glycolipid under phosphorus deficiency. Physiol. Plant. 2018, 163, 297–305. [Google Scholar] [CrossRef] [Green Version]
- Shimojima, M.; Watanabe, T.; Madoka, Y.; Koizumi, R.; Yamamoto, M.P.; Masuda, K.; Yamada, K.; Masuda, S.; Ohta, H. Differential regulation of two types of monogalactosyldiacylglycerol synthase in membrane lipid remodeling under phosphate-limited conditions in sesame plants. Front. Plant Sci. 2013, 4, 469. [Google Scholar] [CrossRef] [Green Version]
- Okazaki, Y.; Nishizawa, T.; Takano, K.; Ohnishi, M.; Mimura, T.; Saito, K. Induced accumulation of glucuronosyldiacylglycerol in tomato and soybean under phosphorus deprivation. Physiol. Plantarum 2015, 155, 33–42. [Google Scholar] [CrossRef] [PubMed]
- Tjellstrom, H.; Andersson, M.X.; Larsson, K.E.; Sandelius, A.S. Membrane phospholipids as a phosphate reserve: The dynamic nature of phospholipid-to-digalactosyl diacylglycerol exchange in higher plants. Plant Cell Environ. 2008, 31, 1388–1398. [Google Scholar] [CrossRef] [PubMed] [Green Version]
- Verma, L.; Kohli, P.S.; Maurya, K.; Abhijith, K.; Thakur, J.K.; Giri, J. Specific galactolipids species correlate with rice genotypic variability for phosphate utilization efficiency. Plant Physiol. Bioch. 2021, 168, 105–115. [Google Scholar] [CrossRef] [PubMed]
- Okazaki, Y.; Saito, K. Plant Lipidomics Using UPLC-QTOF-MS. In Plant Metabolomics: Methods and Protocols, Methods in Molecular Biology; Antonio, C., Ed.; Springer-Nature: Berlin/Heidelberg, Germany, 2018; Volume 1778, pp. 157–169. [Google Scholar]


| Cultivars | Treatment | Shoot P Concentration | Shoot Dry Weight | |||
|---|---|---|---|---|---|---|
| (mg P g−1) | (mg plant−1) | |||||
| 5 DAT | 10 DAT | 5 DAT | 10 DAT | |||
| Akamai | −P | 2.54 ± 0.10 a | 0.98 ± 0.04 a | 136.0 ± 3.0 a | 363.0 ± 11.0 a | |
| +P | 9.90 ± 0.11 b | 7.14 ± 0.37 b | 149.0 ± 4.0 b | 706.0 ± 1.0 b | ||
| Kiyonishiki | −P | 3.63 ± 0.44 a | 2.19 ± 0.16 a | 7.7 ± 1.0 a | 21.5 ± 1.0 a | |
| +P | 9.75 ± 0.66 b | 9.07 ± 0.31 b | 8.4 ± 0.0 a | 22.4 ± 2.0 a | ||
| Akitakomachi | −P | 2.97 ± 0.11 a | 0.97 ± 0.03 a | 7.1 ± 1.0 a | 17.3 ± 0.0 a | |
| +P | 10.22 ± 0.27 b | 6.96 ± 0.36 b | 7.6 ± 0.0 a | 30.4 ± 5.0 b | ||
| Norin No.1 | −P | 2.53 ± 0.05 a | 0.86 ± 0.01 a | 95.0 ± 3.0 a | 180.0 ± 3.0 a | |
| +P | 9.27 ± 0.69 b | 6.64 ± 0.56 b | 108.0 ± 3.0 b | 342.0 ± 26.0 b | ||
| Hiyadateine | −P | 3.19 ± 0.20 a | 1.05 ± 0.02 a | 8.9 ± 0.0 a | 22.0 ± 1.0 a | |
| +P | 11.07 ± 0.34 b | 8.05 ± 0.12 b | 9.6 ± 1.0 a | 34.5 ± 1.0 b | ||
| Koshihikari | −P | 2.72 ± 0.07 a | 1.01 ± 0.12 a | 72.0 ± 6.0 a | 147.0 ± 21.0 a | |
| +P | 8.67 ± 0.44 b | 6.26 ± 0.43 b | 74.0 ± 3.0 b | 263.0 ± 37.0 b | ||
| Netaro | −P | 3.49 ± 0.15 a | 1.47 ± 0.03 a | 7.4 ± 0.0 a | 17.2 ± 1.0 a | |
| +P | 10.40 ± 0.21 b | 6.90 ± 0.20 b | 8.4 ± 0.0 a | 29.4 ± 1.0 b | ||
| Lipid Species | Koshihikari | Norin No.1 | Akamai | Hiyadateine | Netaro | Akitakomachi | Kiyonishiki | |||||||||||||||||||||||||||||||||||||||||||||||||
|---|---|---|---|---|---|---|---|---|---|---|---|---|---|---|---|---|---|---|---|---|---|---|---|---|---|---|---|---|---|---|---|---|---|---|---|---|---|---|---|---|---|---|---|---|---|---|---|---|---|---|---|---|---|---|---|---|
| 5 DAT | 10 DAT | 5 DAT | 10 DAT | 5 DAT | 10 DAT | 5 DAT | 10 DAT | 5 DAT | 10 DAT | 5 DAT | 10 DAT | 5 DAT | 10 DAT | |||||||||||||||||||||||||||||||||||||||||||
| −P | +P | −P | +P | −P | +P | −P | +P | −P | +P | −P | +P | −P | +P | −P | +P | −P | +P | −P | +P | −P | +P | −P | +P | −P | +P | |||||||||||||||||||||||||||||||
| DGDG_34 | 5.3616 | a | 3.1267 | b | 10.9152 | a | 4.4578 | b | 7.8770 | a | 3.2909 | b | 11.4592 | a | 4.9968 | b | 8.0599 | a | 3.1104 | b | 9.8775 | a | 3.9650 | b | 4.7858 | a | 2.3152 | b | 8.3167 | a | 2.5239 | b | 7.9142 | a | 5.0111 | b | 9.7454 | a | 4.8061 | b | 9.1287 | a | 4.6217 | b | 11.0602 | a | 4.6388 | b | 8.4620 | a | 5.0525 | b | 13.2061 | a | 7.5372 | b |
| DGDG_36 | 7.6882 | a | 6.9466 | a | 14.3118 | a | 9.8575 | b | 11.5013 | a | 8.3420 | b | 15.2931 | a | 11.9604 | a | 12.4606 | a | 8.2258 | b | 14.1992 | a | 9.7847 | b | 8.8747 | a | 6.3478 | b | 12.2270 | a | 6.8134 | b | 13.5905 | a | 12.1261 | b | 14.7189 | a | 12.2135 | b | 13.9443 | a | 11.4374 | b | 15.1426 | a | 10.9655 | b | 13.1541 | a | 11.3376 | b | 11.9844 | a | 8.6851 | b |
| GlcADG_343 | 0.4106 | a | 0.1195 | b | 0.6119 | a | 0.1458 | b | 0.5564 | a | 0.1271 | b | 0.6772 | a | 0.1357 | b | 0.5613 | a | 0.1433 | b | 0.8470 | a | 0.1890 | b | 0.4532 | a | 0.1655 | b | 1.1200 | a | 0.1967 | b | 0.6546 | a | 0.1830 | b | 1.0884 | a | 0.2266 | b | 0.8383 | a | 0.2113 | b | 1.3073 | a | 0.2438 | b | 0.4814 | a | 0.2651 | b | 0.9776 | a | 0.2250 | b |
| GlcADG_36 | 0.3994 | a | 0.0996 | b | 0.4446 | a | 0.0875 | b | 0.3504 | a | 0.1004 | b | 0.4431 | a | 0.0833 | b | 0.3832 | a | 0.1239 | b | 0.8106 | a | 0.1058 | b | 0.2251 | a | 0.0682 | b | 0.5165 | a | 0.0735 | b | 0.1581 | a | 0.0352 | b | 0.3907 | a | 0.0363 | b | 0.2387 | a | 0.0318 | b | 0.5218 | a | 0.0600 | b | 0.1269 | a | 0.0619 | b | 0.4416 | a | 0.1094 | b |
| MGDG_34 | 0.7984 | a | 0.3207 | b | 1.8279 | a | 0.5317 | b | 0.9193 | a | 0.3167 | b | 2.6777 | a | 1.0501 | b | 0.8749 | a | 0.4065 | b | 0.8236 | a | 0.3392 | b | 0.5259 | a | 0.5583 | a | 1.5062 | a | 0.5691 | b | 3.6475 | a | 1.9410 | b | 4.2732 | a | 1.8870 | b | 4.1173 | a | 1.8295 | b | 3.7471 | a | 1.4233 | b | 2.3695 | a | 1.3675 | b | 0.5551 | a | 0.4065 | a |
| MGDG_36 | 4.8094 | a | 5.3192 | a | 17.1815 | a | 10.2331 | b | 9.9968 | a | 7.4017 | a | 20.7257 | a | 16.2440 | a | 12.0847 | a | 5.8848 | a | 11.0500 | a | 10.5372 | a | 7.5537 | a | 6.7931 | a | 14.7230 | a | 8.1712 | b | 26.4800 | a | 23.3615 | b | 26.5992 | a | 22.9215 | b | 26.6611 | a | 22.3083 | b | 25.4037 | a | 19.6906 | b | 23.9469 | a | 20.8229 | b | 9.2537 | a | 6.6118 | a |
| PC_34 | 0.5774 | b | 0.9145 | a | 0.4843 | b | 1.3865 | a | 0.7501 | a | 0.8520 | a | 0.7709 | b | 2.0325 | b | 0.8634 | b | 1.2749 | a | 0.3161 | b | 1.2872 | a | 0.4471 | a | 0.4321 | a | 0.1639 | b | 0.5655 | a | 6.0609 | a | 6.4913 | a | 3.5015 | b | 7.9569 | a | 5.4276 | b | 8.3458 | a | 1.0718 | b | 4.1896 | a | 4.0372 | a | 2.9329 | a | 1.0390 | b | 0.9798 | a |
| PC_36 | 0.2180 | b | 0.3976 | a | 0.2160 | b | 0.5257 | a | 0.3044 | a | 0.3845 | a | 0.4035 | b | 0.8042 | b | 0.3718 | b | 0.7397 | a | 0.1287 | b | 0.5664 | a | 0.1030 | a | 0.1137 | a | 0.0387 | b | 0.1105 | a | 1.5022 | b | 2.2044 | a | 0.9587 | b | 2.4878 | a | 1.5039 | b | 2.9702 | a | 0.2502 | b | 1.2075 | a | 1.3627 | b | 1.0164 | a | 0.2420 | b | 0.3029 | a |
| PE_34 | 0.1676 | b | 0.4464 | a | 0.1009 | b | 0.5477 | a | 0.2082 | a | 0.3027 | a | 0.1196 | b | 0.6479 | b | 0.2310 | b | 0.4773 | a | 0.0513 | b | 0.4949 | a | 0.1750 | a | 0.2363 | a | 0.0422 | b | 0.2685 | a | 1.2859 | b | 1.7725 | a | 0.6035 | b | 1.8971 | a | 1.0610 | b | 2.1695 | a | 0.2222 | b | 1.4252 | a | 1.1224 | a | 1.0473 | a | 0.3200 | a | 0.4323 | a |
| PE_36 | 0.1618 | b | 0.3482 | a | 0.1173 | b | 0.3881 | a | 0.1738 | b | 0.3363 | a | 0.0894 | b | 0.3332 | b | 0.1863 | b | 0.3011 | a | 0.0500 | b | 0.2688 | a | 0.4523 | a | 0.5594 | a | 0.1598 | b | 0.6344 | a | 0.8896 | b | 1.2646 | a | 0.4723 | b | 1.3025 | a | 0.7694 | b | 1.4488 | a | 0.2905 | b | 1.0533 | a | 0.7349 | a | 0.7830 | a | 0.2323 | a | 0.4056 | a |
| PG_34 | 0.2863 | a | 0.3472 | a | 0.2789 | b | 0.4676 | a | 0.3386 | a | 0.4541 | a | 0.2954 | b | 0.7915 | b | 0.4993 | a | 0.6133 | a | 0.3333 | b | 0.6305 | a | 0.3214 | a | 0.2901 | a | 0.2099 | a | 0.2861 | a | 1.0031 | a | 1.2126 | a | 0.5228 | b | 1.2552 | a | 0.8392 | b | 1.4246 | a | 0.3211 | b | 0.8327 | a | 0.6302 | a | 0.4654 | a | 0.2533 | b | 0.3851 | a |
| PI_34 | 0.1212 | b | 0.2589 | a | 0.0463 | b | 0.2542 | a | 0.1292 | b | 0.2146 | a | 0.0486 | b | 0.2339 | b | 0.1647 | b | 0.3251 | a | 0.0129 | b | 0.2476 | a | 0.1363 | b | 0.2388 | a | 0.0154 | b | 0.1490 | a | 0.2511 | b | 0.3604 | a | 0.1053 | b | 0.2893 | a | 0.2096 | b | 0.3550 | a | 0.0545 | b | 0.2827 | a | 0.2796 | b | 0.3707 | a | 0.1006 | b | 0.2026 | a |
| SQDG_34 | 2.1202 | a | 1.2953 | b | 2.4285 | a | 1.4403 | b | 2.1416 | a | 1.4351 | a | 2.1120 | a | 1.4000 | b | 2.2988 | a | 1.6146 | b | 2.4740 | a | 1.3576 | b | 1.8724 | a | 1.1112 | b | 2.1319 | a | 1.2299 | b | 1.4969 | a | 0.9251 | b | 1.7847 | a | 0.9928 | b | 1.7025 | a | 0.8827 | b | 2.4321 | a | 1.0891 | b | 1.0839 | a | 0.8188 | b | 1.7256 | a | 1.1263 | b |
| SQDG_36 | 1.4513 | a | 1.0888 | a | 1.7041 | a | 1.4038 | a | 1.5798 | a | 1.5102 | b | 1.5247 | a | 1.7620 | a | 2.1438 | a | 1.8306 | a | 1.7439 | a | 1.5504 | a | 2.1151 | a | 1.4527 | b | 2.0272 | a | 1.5021 | b | 2.3732 | a | 2.1987 | a | 2.2388 | a | 2.4521 | a | 2.2513 | a | 2.0198 | a | 2.2181 | a | 2.0028 | a | 2.2257 | a | 1.7331 | a | 2.0217 | a | 1.9173 | a |
| Lipid Species | Koshihikari | Norin No.1 | Akamai | Hiyadateine | Netaro | Akitakomachi | Kiyonishiki | −P | ||||||||||||||||||||||||||||||||||||||||||||||||
|---|---|---|---|---|---|---|---|---|---|---|---|---|---|---|---|---|---|---|---|---|---|---|---|---|---|---|---|---|---|---|---|---|---|---|---|---|---|---|---|---|---|---|---|---|---|---|---|---|---|---|---|---|---|---|---|---|
| 5 DAT | 10 DAT | 5 DAT | 10 DAT | 5 DAT | 10 DAT | 5 DAT | 10 DAT | 5 DAT | 10 DAT | 5 DAT | 10 DAT | 5 DAT | 10 DAT | |||||||||||||||||||||||||||||||||||||||||||
| −P | +P | −P | +P | −P | +P | −P | +P | −P | +P | −P | +P | −P | +P | −P | +P | −P | +P | −P | +P | −P | +P | −P | +P | −P | +P | |||||||||||||||||||||||||||||||
| DGDG_34 | 2.5461 | a | 0.6081 | b | 3.7276 | a | 1.1494 | b | 3.2980 | a | 0.6880 | b | 4.0855 | a | 0.9496 | b | 3.5617 | a | 0.9287 | b | 5.0312 | a | 0.8796 | b | 1.1670 | a | 0.3672 | b | 2.2844 | a | 0.6136 | b | 2.5635 | a | 0.7854 | b | 3.3035 | a | 0.7487 | b | 2.8166 | a | 0.6945 | b | 3.1561 | a | 0.8893 | b | 3.7333 | a | 1.9439 | b | 4.2200 | a | 1.2870 | b |
| DGDG_36 | 0.7269 | a | 0.2053 | b | 1.3244 | a | 0.3358 | b | 0.9371 | a | 0.2777 | b | 1.5299 | a | 0.3806 | b | 1.1818 | a | 0.3322 | b | 2.1628 | a | 0.3855 | b | 0.2329 | a | 0.1072 | b | 0.7394 | a | 0.1702 | b | 0.8680 | a | 0.3745 | b | 1.1587 | a | 0.4197 | b | 0.9629 | a | 0.3560 | b | 1.2586 | a | 0.4309 | b | 1.6001 | a | 0.8916 | b | 1.4470 | a | 0.4171 | b |
| GlcADG_343 | 0.4106 | a | 0.1195 | b | 0.6119 | a | 0.1458 | b | 0.5564 | a | 0.1271 | b | 0.6772 | a | 0.1357 | b | 0.5613 | a | 0.1433 | b | 0.8470 | a | 0.1890 | b | 0.3456 | a | 0.1315 | b | 0.6106 | a | 0.1574 | b | 0.6532 | a | 0.2023 | b | 0.8150 | a | 0.2485 | b | 0.7569 | a | 0.1769 | b | 0.8133 | a | 0.2466 | b | 0.6255 | a | 0.3071 | b | 0.8517 | a | 0.2211 | b |
| GlcADG_36 | 0.0880 | a | 0.0204 | b | 0.1414 | a | 0.0272 | b | 0.1276 | a | 0.0216 | b | 0.1705 | a | 0.0268 | b | 0.1356 | a | 0.0276 | b | 0.2285 | a | 0.0386 | b | 0.0138 | a | 0.0076 | a | 0.0779 | a | 0.0111 | b | 0.1812 | a | 0.0250 | b | 0.1381 | a | 0.0303 | b | 0.1911 | a | 0.0181 | b | 0.1408 | a | 0.0249 | b | 0.3054 | a | 0.0667 | b | 0.3161 | a | 0.0360 | b |
| MGDG_34 | 0.5489 | a | 0.1553 | b | 0.6651 | a | 0.4015 | b | 0.5732 | a | 0.2018 | b | 0.6701 | a | 0.2122 | b | 0.6598 | a | 0.2746 | b | 0.9403 | a | 0.1350 | b | 0.3639 | a | 0.1799 | b | 0.7719 | a | 0.3747 | b | 0.8789 | a | 0.4104 | b | 0.9220 | a | 0.2726 | b | 0.9975 | a | 0.2981 | b | 0.9070 | a | 0.3996 | b | 0.9165 | a | 0.4754 | b | 0.4695 | a | 0.1738 | b |
| MGDG_36 | 0.3212 | a | 0.2969 | a | 0.5822 | a | 0.3555 | b | 0.3458 | a | 0.3945 | a | 0.6109 | a | 0.3572 | b | 0.4239 | a | 0.4713 | a | 0.9095 | a | 0.2774 | b | 0.0823 | a | 0.1240 | b | 0.3586 | a | 0.2272 | b | 0.5590 | a | 0.6593 | a | 0.7228 | a | 0.6979 | a | 0.6187 | a | 0.5673 | a | 0.6641 | a | 0.5624 | a | 1.1418 | a | 1.4052 | a | 0.4763 | a | 0.3417 | a |
| PC_34 | 0.2117 | b | 0.4913 | a | 0.1854 | b | 0.6143 | a | 0.2462 | b | 0.3686 | a | 0.2788 | b | 1.2806 | a | 0.1719 | b | 0.6580 | a | 0.1315 | b | 1.1979 | a | 0.1368 | b | 0.2985 | a | 0.1323 | a | 0.3055 | a | 2.5237 | b | 3.3479 | a | 2.6537 | a | 3.4487 | a | 1.9142 | b | 2.7873 | a | 0.7333 | b | 1.1837 | a | 1.1934 | a | 1.6091 | a | 0.2022 | b | 0.5490 | a |
| PC_36 | 0.1303 | a | 0.2518 | a | 0.1168 | a | 0.1324 | a | 0.1715 | a | 0.1984 | a | 0.1954 | a | 0.2847 | a | 0.0889 | b | 0.3044 | a | 0.0651 | b | 0.2963 | a | 0.0545 | b | 0.1299 | a | 0.0249 | b | 0.0227 | a | 0.5878 | a | 0.7231 | a | 0.6793 | a | 0.5593 | a | 0.4723 | a | 0.5195 | a | 0.1789 | a | 0.2214 | a | 0.7883 | a | 0.8056 | a | 0.0728 | b | 0.2472 | a |
| PE_34 | 0.1163 | b | 0.3740 | a | 0.0791 | b | 0.2730 | a | 0.1263 | b | 0.2325 | a | 0.1197 | b | 0.6153 | a | 0.0985 | b | 0.4898 | a | 0.0434 | b | 0.4934 | a | 0.1027 | b | 0.3089 | a | 0.0683 | a | 0.2074 | a | 1.3741 | b | 2.2589 | a | 1.0417 | b | 2.4083 | a | 1.2522 | b | 2.1380 | a | 0.4045 | b | 1.0958 | a | 0.8298 | a | 1.1042 | a | 0.1353 | b | 0.4246 | a |
| PE_36 | 0.0144 | a | 0.0313 | a | 0.0081 | a | 0.0167 | a | 0.0105 | b | 0.0257 | a | 0.0099 | b | 0.0499 | a | 0.0085 | b | 0.0632 | a | 0.0055 | b | 0.0570 | a | 0.0027 | b | 0.0159 | a | 0.0025 | b | 0.0021 | a | 0.1191 | b | 0.2708 | a | 0.1006 | a | 0.1557 | a | 0.0958 | b | 0.1888 | a | 0.0194 | b | 0.0528 | a | 0.2093 | a | 0.2604 | a | 0.0042 | b | 0.0662 | a |
| PG_34 | 0.0012 | b | 0.0031 | a | 0.0011 | a | 0.0047 | a | 0.0014 | b | 0.0029 | a | 0.0010 | b | 0.0091 | a | 0.0015 | b | 0.0094 | a | 0.0016 | a | 0.0096 | a | 0.0018 | a | 0.0068 | a | 0.0014 | b | 0.0145 | a | 0.0486 | a | 0.0764 | a | 0.0287 | b | 0.1277 | a | 0.0402 | b | 0.0848 | a | 0.0088 | b | 0.0350 | a | 0.0313 | a | 0.0418 | a | 0.0024 | b | 0.0103 | a |
| PI_34 | 0.0080 | b | 0.0250 | a | 0.0056 | b | 0.0359 | a | 0.0141 | b | 0.0286 | a | 0.0093 | b | 0.0550 | a | 0.0094 | b | 0.0487 | a | 0.0019 | b | 0.0824 | a | 0.0032 | b | 0.0120 | a | 0.0024 | a | 0.0069 | a | 0.0755 | b | 0.1454 | a | 0.0375 | b | 0.1668 | a | 0.0622 | b | 0.1268 | a | 0.0150 | b | 0.1060 | a | 0.0980 | a | 0.1744 | a | 0.0065 | b | 0.0319 | a |
| SQDG_34 | 0.0345 | a | 0.0156 | b | 0.0577 | a | 0.1157 | b | 0.0434 | a | 0.0115 | b | 0.0584 | a | 0.0685 | a | 0.0483 | a | 0.0147 | b | 0.0741 | a | 0.0218 | b | 0.0225 | a | 0.0165 | a | 0.0450 | a | 0.0765 | a | 0.0651 | a | 0.0175 | b | 0.0927 | a | 0.0407 | b | 0.0681 | a | 0.0106 | b | 0.0833 | a | 0.0597 | a | 0.0708 | a | 0.0202 | b | 0.0791 | a | 0.0133 | b |
| SQDG_36 | 0.0102 | a | 0.0031 | b | 0.0139 | a | 0.0041 | b | 0.0121 | a | 0.0044 | b | 0.0162 | a | 0.0061 | b | 0.0134 | a | 0.0067 | b | 0.0181 | a | 0.0053 | b | 0.0032 | a | 0.0014 | b | 0.0064 | a | 0.0024 | a | 0.0171 | a | 0.0068 | b | 0.0210 | a | 0.0055 | b | 0.0151 | a | 0.0058 | b | 0.0149 | a | 0.0062 | b | 0.0283 | a | 0.0095 | b | 0.0243 | a | 0.0054 | b |
Disclaimer/Publisher’s Note: The statements, opinions and data contained in all publications are solely those of the individual author(s) and contributor(s) and not of MDPI and/or the editor(s). MDPI and/or the editor(s) disclaim responsibility for any injury to people or property resulting from any ideas, methods, instructions or products referred to in the content. |
© 2023 by the authors. Licensee MDPI, Basel, Switzerland. This article is an open access article distributed under the terms and conditions of the Creative Commons Attribution (CC BY) license (https://creativecommons.org/licenses/by/4.0/).
Share and Cite
Honda, S.; Yamazaki, Y.; Mukada, T.; Cheng, W.; Chuba, M.; Okazaki, Y.; Saito, K.; Oikawa, A.; Maruyama, H.; Wasaki, J.; et al. Lipidome Profiling of Phosphorus Deficiency-Tolerant Rice Cultivars Reveals Remodeling of Membrane Lipids as a Mechanism of Low P Tolerance. Plants 2023, 12, 1365. https://doi.org/10.3390/plants12061365
Honda S, Yamazaki Y, Mukada T, Cheng W, Chuba M, Okazaki Y, Saito K, Oikawa A, Maruyama H, Wasaki J, et al. Lipidome Profiling of Phosphorus Deficiency-Tolerant Rice Cultivars Reveals Remodeling of Membrane Lipids as a Mechanism of Low P Tolerance. Plants. 2023; 12(6):1365. https://doi.org/10.3390/plants12061365
Chicago/Turabian StyleHonda, Soichiro, Yumiko Yamazaki, Takumi Mukada, Weiguo Cheng, Masaru Chuba, Yozo Okazaki, Kazuki Saito, Akira Oikawa, Hayato Maruyama, Jun Wasaki, and et al. 2023. "Lipidome Profiling of Phosphorus Deficiency-Tolerant Rice Cultivars Reveals Remodeling of Membrane Lipids as a Mechanism of Low P Tolerance" Plants 12, no. 6: 1365. https://doi.org/10.3390/plants12061365