

Effects of NaCl Stress on the Growth, Physiological Characteristics and Anatomical Structures of Populus talassica × Populus euphratica Seedlings


1
College of Life Science and Technology, Tarim University, Alar 843300, China
2
Xinjiang Production and Construction Corps Key Laboratory of Protection and Utilization of Biological Resources in Tarim Basin, Alar 843300, China
*
Author to whom correspondence should be addressed.
Plants 2022, 11(22), 3025; https://doi.org/10.3390/plants11223025
Submission received: 31 August 2022
/
Revised: 28 September 2022
/
Accepted: 2 November 2022
/
Published: 9 November 2022
(This article belongs to the Special Issue Plant Physiology and Environmental Stresses)
Abstract
:In order to elucidate the salt tolerance mechanism of Populus talassica × Populus euphratica, the growth, physiology and anatomical characteristics of P. talassica × P. euphratica were studied under different concentrations of NaCl-stress treatments. In this study, the annual seedlings of Populus talassica × Populus euphratica were used as the test material in a field potted control experiment. The basic salt content of the culture soil was the control (CK), and two NaCl treatments of 200 mmol/L and 400 mmol/L were established. The pot experiment showed that: (1) Compared with CK, the 200 mmol/L NaCl-stress treatment significantly increased the growth parameters of P. talassica × P. euphratica, such as leaf area, plant height, ground diameter, biomass, root length, root surface area, root fork number and root-shoot ratio. However, compared with CK, the 400 mmol/L NaCl-stress treatment significantly reduced most growth parameters. (2) The 200 and 400 mmol/L NaCl-stress treatments significantly decreased various physiological parameters such as relative water content (RWC), chlorophyll content, water potential, stomatal opening and photosynthetic parameters and increased the accumulation of MDA and Pro compared with CK. The 200 mmol/L NaCl-stress treatment significantly increased the activity of antioxidant enzymes, and the 400 mmol/L NaCl-stress treatment significantly decreased the activity of antioxidant enzymes. (3) Compared with CK, 200 and 400 mmol/L NaCl-stress treatments significantly improved the leaf palisade tissue thickness and palisade-to-sea ratio, as well as the stem xylem and stem phloem thickness and pith diameter, and significantly increased the root xylem thickness, root phloem thickness, and root cross-cutting diameter of P. talassica × P. euphratica. The growth, physiological characteristics and anatomical characteristics of P. talassica × P. euphratica under NaCl-stress treatments showed that it had good salt tolerance and adaptability, and the 200 mmol/L NaCl-stress treatment promoted the growth of P. talassica × P. euphratica to a certain extent. This study provided a theoretical basis for the study of the salt-tolerant mechanism of P. talassica × P. euphratica.
1. Introduction
Soil salinization seriously affects China’s agricultural production and ecological environment [1]. Xinjiang is located in an arid and semi-arid area with little precipitation, abundant sunshine and strong evaporation. Soil salinization is particularly evident in Xinjiang. The total area of salinized soil in Xinjiang is approximately 14.6 million hectares, accounting for 40.7% of the national salinized soil area [2,3]. It is the largest distribution area of salinized soil in China. Saline soils, containing predominantly Na+ and Cl−, are widespread globally and affect major crop production [4]. Salinity in soil or water represents a significant abiotic stress that alters multiple processes in plants [5]. Abiotic stresses negatively affect the physiology and biochemistry of plants, consequently altering plant growth and development [6].
Depending on the ability of plants to grow in saline environments, they are classified as either glycophytes or euhalophytes and their response to salt stress differs [7,8]. Halophytes, naturally grow in, or even depend on, elevated or high NaCl environments. They can survive and complete their life cycles in media containing more than 200 mmol/L NaCl [9,10,11,12,13,14,15]. Halophytes are remarkable in their abilities to regulate their physiology to adapt to changes in saline conditions [16]. However, glycophytes are defined as species that cannot survive in a saline environment [17]. Glycophytes, which include most crops, cannot grow in the presence of high salt levels; their growth is inhibited or even completely prevented by NaCl concentrations of 100–200 mmol/L, resulting in plant death [18].
Nevertheless, some studies on the salt tolerance of poplar species have used young rooted cuttings for experimental material [19,20,21,22,23,24,25,26]. The choice of younger plants is required by the fast growth rate of most poplars: trees more than 1 or 2 years old become too large for easy handling in the laboratory or greenhouse [27]. P. talassica has been widely considered as a model species for elucidating abiotic resistance mechanisms of trees, e.g., responses to salinity or drought stress [28,29,30].
The genus Populus is a member of the Salicaceae family and dominant tree species in arid areas, adapted to a variety of conditions, resulting in a rich source of variation in tree morphology, anatomy, physiology and respond to abiotic and biotic stress [31]. Populus talassica × Populus euphratica is a new cultivar obtained by cross breeding P. euphratica as the male parent and P. talassica as the female parent. The seedling population has excellent characteristics, such as drought resistance and saline-alkali tolerance, and a fast growth rate. Compared with P. euphratica, its asexual reproductive ability is significantly improved. It has certain promotive and planting values in saline-alkali areas with dry and barren soils [32].
The adverse effects of salinity on Populus have been investigated in a wide variety of economically important species and ecotypes [33]. The tolerance mechanisms of plants to salinity have been intensively studied in the last decades [34,35,36,37,38]. Plant responses to salinity include a complex set of traits that involve morphological, physiological and cellular processes [39]. However, the current research on the growth, physiology and anatomical characteristics of P. talassica × P. euphratica is not sufficient. Therefore, there is an urgent need to fully understand the response mechanism of P. talassica × P. euphratica to salt stress and apply relevant knowledge to improve the salt tolerance of P. talassica × P. euphratica.
In this experiment, annual potted P. talassica × P. euphratica seedlings served as experimental materials, and the phenotypic and physiological responses of P. talassica × P. euphratica to NaCl-stress were studied using the potted method under controlled conditions. Three NaCl concentrations were chosen for treatments in this experiment, being control (CK), 200 and 400 mmol/L NaCl. Growth, physiological characteristics and anatomical structures of P. talassica × P. euphratica were investigated under the three treatment conditions in this study. The adaptive mechanisms of P. talassica × P. euphratica to NaCl-stress were explored. The purpose of this study was to provide reliable growth, physiological and structural indicators for the identification of the salt-tolerance mechanisms of P. talassica × P. euphratica germplasm materials.
2. Results
2.1. Effects of Salinity on P. talassica × P. euphratica Growth
2.1.1. Effects of Different Concentrations of NaCl-Stress Treatments on Leaf Length, Leaf Width, Leaf Area, Leaf Number and the Survival Rate of P. talassica × P. euphratica
After 45 d of NaCl-stress treatments, the results showed that under the conditions of 200 mmol/L NaCl-stress treatment, leaf length, leaf width and leaf area of the P. talassica × P. euphratica seedlings all reached maximum values compared with CK, and the number of leaves increased. When the NaCl concentration increased to 400 mmol/L, the growth indexes of the P. talassica × P. euphratica seedlings decreased significantly compared with CK, and individual plant deaths occurred, decreasing the survival rate (Table 1).
2.1.2. Effects of Different Concentrations of NaCl-Stress Treatments on P. talassica × P. euphratica Biomass
After 45 d of NaCl-stress treatments, the results showed that under the conditions of 200 mmol/L NaCl-stress treatment, the aboveground, underground and whole plant biomasses (dry weight) of the P. talassica × P. euphratica seedlings all reached their maximum values compared with CK. When the NaCl increased to 400 mmol/L, the biomass decreased significantly. In addition, as the NaCl concentration gradually increased, the root/shoot ratio increased (Table 2).
2.1.3. Effects of Different Concentrations of NaCl-Stress Treatments on P. talassica × P. euphratica Root Vitality
After 45 d of treatments with NaCl-stress, as shown in Table 3, the root length, root surface area, volume, average diameter and number of forks all reached maximum values under the 200 mmol/L NaCl-stress treatment conditions compared with CK. When the NaCl concentration was increased to 400 mmol/L, the root correlation index of P. talassica × P. euphratica was significantly decreased and growth was inhibited (Table 3).
2.1.4. Effects of Different Concentrations of NaCl-Stress Treatments on the Plant Height, Ground Diameter and Crown Width of P. talassica × P. euphratica
The measured values are shown in Table 4. After 45 d of NaCl-stress treatments, there were no significant differences in growth indexes of the P. talassica × P. euphratica seedlings in the control group and the treatment group before the NaCl-stress treatments. The plant height, ground diameter, crown width and relative growth reached maximum values under the 200 mmol/L NaCl-stress treatment conditions compared with CK. The growth indexes decreased significantly under the 400 mmol/L NaCl-stress treatment (Table 4).
2.2. Effects of Different Concentrations of NaCl-Stress Treatments on P. talassica × P. euphratica Physiological Properties
2.2.1. Effects of Different Concentrations of NaCl-Stress Treatments on Leaf Surface Salt Secretion of P. talassica × P. euphratica
After 45 d of NaCl-stress treatments, the leaf surface of P. talassica × P. euphratica is observed with a microscope. It was found that the P. talassica × P. euphratica leaves have microhairs on their adaxial surface furrows that secrete salt. As shown in Figure 1, compared with CK, under the 200 and 400 mmol/L NaCl-stress treatments, the main veins of P. talassica × P. euphratica leaves and the adjacent leaf surfaces secreted large volumes of salt crystals, and more salt crystals were secreted on the leaf surface the 400 mmol/L NaCl-stress treatment group (Figure 1).
2.2.2. Effects of Different Concentrations of NaCl-Stress Treatments on the Diurnal Variation in the P. talassica × P. euphratica Leaf Water Potential
After 45 d of NaCl-stress treatments, the leaf water potential of P. talassica × P. euphratica was determined, and the diurnal variation curve of water potential was shown in Figure 2. From 8:00 to 20:00, the leaf water potential showed regular changes. The variation trends in the three treatments were basically the same, with the water potential being low at 8:00 in the morning and increased at 11:00 a.m. The water potential reached its lowest value at 14:00, then gradually increased, reaching a maximum value at 17:00, and then, it gradually decreased. As the NaCl concentration increased, compared with CK, the water potential of P. talassica × P. euphratica leaves gradually decreased, reaching its lowest value of approximately −3.80 under the 400 mmol/L NaCl-stress treatment. The water potential of the CK group was the largest, with a maximum value of approximately −0.75 (Figure 2).
2.2.3. Effects of Different Concentrations of NaCl-Stress Treatments on the Relative Water Contents and Water Saturation Deficits of P. talassica × P. euphratica Leaves
After 45 d of NaCl-stress treatments, the RWC of the leaves of P. talassica × P. euphratica was determined and the WSD was calculated. The RWC gradually decreased as the NaCl concentration increased (Figure 3). Compared with CK, when the NaCl concentration reached 400 mmol/L, the RWC of the leaves decreased sharply. The differences between the RWC of CK and those that were treated were more significant. During the treatment period, the WSD was between 14.0% and 19.4%. The higher the NaCl concentration, the more serious the leaf water loss, which further decreased the RWC of the leaves (Figure 3).
2.2.4. Effects of Different Concentrations of NaCl-Stress Treatments on the P. talassica × P. euphratica Leaf Chlorophyll Content
As shown in Table 5, compared with CK, as the NaCl concentration increased, the chlorophyll content gradually decreased. The chlorophyll content of the 400 mmol/L NaCl treatment group was significantly lower than that of the CK group, and the chlorophyll a/b also significantly decreased (Table 5). The total chlorophyll content of the 400 mmol/L NaCl-stress treatment group was less than 50% that of the CK, and the difference was significant (p < 0.05). At the higher NaCl concentration, the chlorosis of plant leaves was more severe, which further led to a decrease in leaf chlorophyll content.
2.2.5. Effects of Different Concentrations of NaCl-Stress Treatments on the Size, and the Opening and Closing, of P. talassica × P. euphratica Leaf Stomata
After 45 d of NaCl-stress treatments, the changes in P. talassica × P. euphratica leaf stomata in the three groups, CK, 200 mmol/L NaCl and 400 mmol/L NaCl, were observed using a microscope. Figure 4A–C show the leaf stomatal morphology of the three treatment groups, CK, 200 mmol/L NaCl and 400 mmol/L NaCl, respectively, under a microscope at a 10× magnification. As shown in Figure 4A–C, the number of stomata in the CK group leaves was relatively high, whereas the number of stomata in the 400 mmol/L NaCl-stress treatment group leaves decreased sharply. Figure 4D–F shows the leaf stomatal morphology of the CK, 200 mmol/L NaCl and 400 mmol/L NaCl-stress treatment groups, respectively, at a 40× magnification. As shown in Figure 4D–F, the proportion of open stomata in the CK group leaves was larger, and the proportions of open stomata in the 200 and 400 mmol/L NaCl-stress treatment groups leaves decreased sharply compared with the CK group.
After 45 d of NaCl-stress treatments, the stomata of the leaves of P. talassica × P. euphratica were observed and measured, and the effects of different concentrations of NaCl on the size, and the opening and closing, of P. talassica × P. euphratica leaf stomata are shown in Table 6. Compared with CK, the stomatal lengths in the 200 mmol/L NaCl-stress treatment group leaves did not change significantly, whereas the stomatal length in the 400 mmol/L NaCl-stress treatment group leaves significantly decreased. As the NaCl concentration increased, the stomatal width, stomatal area, stomatal density, stomatal area index and the proportion of open stomata in P. talassica × P. euphratica leaves significantly decreased. Different NaCl-stress treatments closed the stomata to different degrees, and they significantly affected the number of stomata, which were significantly different from the number in the CK group. This indicated that plants could rapidly self-regulate, make adaptive changes, and show increased salt resistance under a certain level of NaCl-stress.
2.2.6. Effects of Different Concentrations of NaCl-Stress Treatments on the Photosynthetic Characteristics of P. talassica × P. euphratica Leaves
After 45 d of NaCl-stress treatments, the photosynthetic index of the leaves of P. talassica × P. euphratica was determined, and the effects of different concentrations of NaCl treatment on the photosynthetic characteristics of P. talassica × P. euphratica were shown in Figure 5. The effects of NaCl-stress on the Pn, Gs, Tr, and Ls values of P. talassica × P. euphratica seedlings were significantly different (p < 0.05). Compared with CK, 200 and 400 mmol/L NaCl-stress treatments significantly reduced Pn, Gs, Tr and Ls values in P. talassica × P. euphratica leaves, but increased Ci values significantly. NaCl-stress treatments had no significant effect on the WUE value of P. talassica × P. euphratica, but the average value was slightly greater than that of the CK, indicating an upward trend (Figure 5).
2.2.7. Effects of Different Concentrations of NaCl-Stress Treatments on the Contents of MDA, Pro, Soluble Sugar and Soluble Protein in P. talassica × P. euphratica Leaves
After 45 d of NaCl-stress treatments, the content of MDA, Pro, soluble sugar and soluble protein content in the leaves of P. talassica × P. euphratica under different concentrations of NaCl-stress treatments was determined, and the measurement results were shown in Figure 6. As shown in Figure 6A, compared with CK, the 200 and 400 mmol/L NaCl-stress treatments significantly increased the MDA content and reached a maximum at 400 mmol/L NaCl-stress treatment, and the difference was extremely significant (p < 0.05). As shown in Figure 6B, compared with CK, the 200 and 400 mmol/L NaCl-stress treatments significantly increased the Pro content and reached a maximum at 400 mmol/L NaCl-stress treatment, and the difference was extremely significant (p < 0.05).
As shown in Figure 6C, when the NaCl concentration reached 200 mmol/L, the soluble sugar content decreased significantly compared with CK, and when the NaCl concentration reached 400 mmol/L, the soluble sugar content reached its highest value (Figure 6C). As shown in Figure 6D, compared with CK, when the NaCl concentration was 200 mmol/L, the soluble protein content decreased significantly compared with CK, and when the NaCl concentration reached 400 mmol/L, the soluble protein content reached maximum values, which was greater than that of the CK (Figure 6D).
2.2.8. Effects of Different Concentrations of NaCl-Stress Treatments on the Activities of Three Antioxidant Enzymes and the Relative Conductivity in P. talassica × P. euphratica Leaves
As shown in Figure 7A, compared with CK, when the NaCl concentration was at 200 mmol/L, the SOD activity reached maximum values. When the concentration of NaCl increased to 400 mmol/L, the SOD activity decreased significantly. As shown in Figure 7B, compared with the CK group, at 200 mmol/L, the POD activity was highest. When the NaCl concentration increased to 400 mmol/L, the POD activity decreased significantly. As shown in Figure 7C, compared with CK, when the NaCl concentration was 200 mmol/L, the CAT activity reached its maximum. When the NaCl concentration increased to 400 mmol/L, the CAT activity decreased significantly. Conductivity is a measure of the ease with which electrical current will pass through water; the greater the salinity, the greater the conductivity [37]. The relative conductivity measurements are shown in Figure 7D. Compared with CK, the 200 and 400 mmol/L NaCl-stress treatments significantly increased the relative conductivity content of the blades, and when the NaCl concentration was 400 mmol/L, the relative electrical conductivity of leaves reached maximum values.
2.3. Effects of Different Concentrations of NaCl-Stress Treatments on the Root, Stem and Leaf Anatomy of P. talassica × P. euphratica
2.3.1. Effects of Different Concentrations of NaCl-Stress Treatments on the Leaf Anatomy of P. talassica × P. euphratica
The P. talassica × P. euphratica mesophyll cells were composed of upper and lower epidermal cuticle, upper and lower epidermis, palisade tissue, spongy tissue, xylem, phloem, cambium, parenchyma and stomata (Figure 8).
The leaf vascular bundle structure of P. talassica × P. euphratica was well developed, and it was approximately oval, consisting of xylem, phloem and the vascular cambium between the xylem and phloem. The xylem and phloem were connected by a vascular cambium (Figure 9A–C). The palisade tissue was composed of two to three layers of parenchymal cells, which were closely arranged, and the cells were long cylindrical in shape and contained many chloroplasts (Figure 9D–F). The spongy tissue was irregular in shape, loosely arranged and had obvious intercellular spaces between the tissues. It was composed of five to six layers of loosely arranged cells of approximately circular size, with more crystals distributed (Figure 9G–I).
The effects of NaCl-stress on leaves were mainly reflected in the thickness of palisade and spongy tissues. As shown in Table 7, compared with CK, the thickness of palisade tissues in 200 mmol/L and 400 mmol/L NaCl-stress treatment groups increased by 33.30% and 64.62%, respectively, the thickness of sponge tissue in 200 mmol/L and 400 mmol/L NaCl-stress treatment groups decreased by 10.84% and 24.43%, respectively, and the differences were significant (p < 0.05). Moreover, the 200 and 400 mmo/L NaCl-stress treatments significantly increased the leaf thickness, CP and the tightness of the blade structure of P. talassica × P. euphratica.
2.3.2. Effects of Different Concentrations of NaCl-Stress Treatments on the Stem Anatomy of P. talassica × P. euphratica
The cross-section of a P. talassica × P. euphratica stem is approximately circular, consisting of epidermis, pericyte, cortical parenchyma, xylem, phloem and pith in the center (Figure 10).
The stem vascular cambium was obvious, the xylem was arranged radially and the number of xylem vessels was large (Figure 11A–C). The phloem was relatively narrow and contained bast fibers inside (Figure 11D–F). The central medulla was well developed and consisted of large water-storing parenchymal cells, and there were discrete individual crystal-containing cells in the medulla and medullary rays (Figure 11G–I). The phloem contained many phloem fibers, which were embedded in the phloem and consisted of many granular cells (Figure 11J–L).
The measurements of stem anatomy are shown in Table 8. As shown in Table 8, the 200 and 400 mmol/L NaCl-stress treatments significantly increased the thickness of the epidermis and cortex of stem, the thickness of the phloem and xylem and the diameter of the pith. Under the treatment of 400 mmol/L NaCl-stress, the stem indicators reached maximum values, and the differences were significant (p < 0.05).
2.3.3. Effects of Different Concentrations of NaCl-Stress Treatments on the Root Anatomy of P. talassica × P. euphratica
The secondary structures of P. talassica × P. euphratica roots, from outside to inside, consisted of pericytes, secondary phloem, vascular cambium and secondary xylem (Figure 12).
Due to the thickening of the root, the epidermis and cortex break, and the cork cambium formed a new protective tissue, the pericyte. The pericyte cells were oblong, neatly and tightly arranged and shed (Figure 13A–C). The xylem contained a large number of vessels that transport water, and wood rays were also arranged in the xylem (Figure 13D–F). The secondary phloem was located in the cortex and was composed of phloem parenchymal cells. The cells were irregular in shape and tightly arranged. There was a large number of storage cells and secretory cells distributed among the phloem cells (Figure 13G–I). The phloem was also inlaid with a small amount of bast fibers. The bast fibers were composed of many round cake-like particles embedded in the phloem, and all the bast fibers together formed a ring (Figure 13J–L).
Under NaCl-stress, plant roots adopted their own adaptive strategies. The measurements of root secondary structures are shown in Table 9. Compared with CK, the 200 and 400 mmol/L NaCl-stress treatments significantly increased the root xylem thickness, phloem thickness, xylem vessel diameter and root cross section diameter of P. talassica × P. euphratica. All of the above indicators reached maximum values under 400 mmol/L NaCl-stress treatment (Table 9).
3. Materials and Methods
3.1. Overview of the Study Area
The study area is located in the seedlings base of the 10th Regiment of the 1st Division of the Xinjiang Production and Construction Corps (40°34′6.14″ N; 81°15′32.64″ E and altitude of 1014 m). It belongs to an extreme continental arid desert climate in the warm temperate zone. The extreme high temperature reaches 35 °C, the extreme minimum temperature is −28 °C and the annual average sunshine is 2556.3–2991.8 h. There is very little rainfall, little snow in winter and strong surface evaporation. The average annual precipitation is 40.1–82.55 mm, and the average annual evaporation is 1876.6–2558.9 mm. The soil type is mainly sandy.
3.2. Plant Material and Imposition of Salt Stress
Annual potted P. talassica × P. euphratica seedlings served as experimental materials, and the seedlings were treated with different concentrations of NaCl using the open-air potted soil cultivation method. The potted seedling had plant heights of 61–81 cm, ground diameters of 0.8–1.2 mm and crown widths of 16–34 cm. The 16 cm high plastic pot had an upper diameter of 24 cm and bottom diameter of 12 cm. The pots contained 9.82 kg of nursery mellow soil: pH 7.9; soil salinity, 0.49 g/kg; soil density, 1.36 g/cm3; soil conductivity, 852.6 µs/cm; soil organic matter content, 21.04 g/kg; and available potassium content, 148.96 mg/kg. The contents of available phosphorus and alkali-hydrolyzed nitrogen were 7.49 mg/kg and 139.58 mg/kg, respectively.
The experiment was conducted in a completely randomized design. The selected 1-year-old potted P. talassica × P. euphratica seedlings showed consistent growth, good growth and no pests and diseases. They were divided into three groups, with 20 plants in each group, totaling 60 plants that were then subjected to NaCl-stress treatments. The salt content of the soil itself (4.8 g/pot; CK) was used as a control, and two other concentration gradients were set as 200 mmol/L and 400 mmol/L. To avoid salinity shock and to acclimatize seedlings to high NaCl concentrations, P. talassica × P. euphratica was treated with increasing NaCl concentrations progressively until the predetermined concentrations were reached, and the NaCl concentration in the basin was kept constant [40]. The 200 and 400 mmol/L NaCl-stress treatment groups were watered with 1 L of the prepared NaCl solution per pot each time, and the CK group was irrigated with 1 L of deionized water per pot each time. Treatments were performed every 3 d for a total of five treatments, eventually reaching the preset NaCl concentration. After maintaining the same growth conditions for 45 d, the growth, physiological indicators, photosynthetic parameters and anatomical structures of roots, stems and leaves were observed and measured.
3.3. Growth Index Measurement Methods
Growth indexes were measured before and after NaCl-stress treatments for 45 d. Plant height was measured using a tape measure to an accuracy of 0.1 cm [41]. The ground diameter was measured with an electronic digital Vernier caliper with an accuracy of 0.02 mm [25]. The plant heights, ground diameters and crown widths of seedlings in the three treatment groups before and after 45 d of NaCl-stress treatments were counted, as were any differences.
After 45 d of NaCl-stress treatments, 10 leaves with good growth and no disease and insect pests were taken from each plant in the CK group and the treatment groups. Using a leaf area meter to acquire data such as leaf length, leaf width, and leaf area. Simultaneously, the number of leaves per seedling in the three treatment groups was counted, and the final calculations were averaged [27].
Five seedlings of P. talassica × P. euphratica were selected from the treatment group and the CK group, totaling 15 seedlings, and they were dug out with the root systems. After excavating whole plants, they were taken to the laboratory and washed with deionized water. The above- and the underground parts were separated, placed in labeled envelopes, fixed in an oven at 110 °C for 20 min and then placed in an oven at 80 °C to dry to constant weights. The dry masses of the above- and the underground parts of each plant were weighed [26]. The sum of the dry masses of the two parts of each plant represented the dry mass of the whole plant. The ratio of the dry mass of the underground part (dry mass of roots) to the dry mass of the aerial part (dry mass of stems and leaves) of each plant represented the root/shoot ratio.
Additionally, whole P. talassica × P. euphratica seedlings were taken out of the flowerpots, rinsed with deionized water and scanned using a Microtek i800 Plus scanner to obtain root images. Then, the root system configuration parameters, such as root length, root surface area, root volume, root average diameter and number of forks, were measured using an LA-S series plant image analyzer system. The measurements of all the growth indicators were repeated three times, and the statistical results were averaged.
3.4. Physiological Index Measurement Methods
The salt secretion on the leaf surfaces of P. talassica × P. euphratica in different NaCl-stress treatment groups were observed and imaged using a microscope (Nikon SMZ1500), and the salt crystals secreted on the leaf main vein and the adjacent leaf surfaces were observed and imaged. After 45 d of NaCl-stress treatments, five plants were taken from each treatment group, three leaves were cut from the same part of each seedling and the chlorophyll contents of the leaves were determined by ethanol extraction [41]. At the same time, three plants were taken from each treatment group and five leaves were cut from the same part of each seedling. The relative water contents (RWC) of the leaves were measured using the weighing method [41]. First, the fresh weight Wf of the leaves were found, and then the leaves were immersed in distilled water for several hours to make the leaves absorb water into a saturated state. The leaves were taken out and the water absorbed on the surface with absorbent paper, immediately put into a weighing bottle of known weight then put in distilled water for a period of time to absorb the moisture on the outside and finally weighed again until the weight no longer increased. At this time, Wt is the weight when the leaf is saturated with water, after which the sample is dried to obtain the tissue dry weight Wd and the RWC of the leaf is calculated. At the same time, the percentage of WSD is calculated:
RWC = (Wf − Wd)/(Wt − Wd) × 100%
WSD = (1 − RWC) × 100%
In total, 10 leaves from each treatment were picked and leaf imprints from the backs of the leaves were lifted using nail polish (three separate regions per leaf). Stomatal density was assessed using an optical Leitz microscope (Leitz DIA LUX 22EB) equipped with a digital camera (Hitachi KP-D 40 Color Digital). Stomata were counted using the analysis software program for image analysis (Delta-T Devices Ltd., Cambridge, UK).
Plant leaves of the same size were selected and washed them with distilled water three times. Filter paper was used to absorb the surface moisture, and the leaves were cut into strips of suitable length (avoiding opening the main vein). For each treatment group, 0.1 g of three fresh samples were weighed, placed into 10 mL deionized water in graduated test tubes, covered with glass stoppers and soaked at room temperature for 12 h. A conductivity meter was used to measure the conductance (R1) of the leaching solution. Samples were then heated in a boiling water bath for 30 min, cooled to room temperature, shaken and the conductance (R2) of the leaching solution was remeasured. Relative conductivity = R1/R2 × 100%.
After a 45 d NaCl-stress treatments, on a sunny day, the leaf water potential was measured every 3 h from 08:00 to 20:00, using a pressure chamber water potential meter (PMS Instrument Company, Albany, OR, USA) to determine the diurnal variation. Three seedlings were measured for each treatment, and three leaves were measured per young tree. The leaves selected were in the same position, with uniform illumination, and showed healthy consistent growth (mature leaf samples were all from in the middles of peripheral branches). The average value of three leaves, with nine replicates, was taken to represent the average leaf water potential of P. talassica × P. euphratica.
The malondialdehyde (MDA) content was determined using the thiobarbituric acid method. The Pro content was determined by ninhydrin colorimetry [41], and superoxide dismutase (SOD) activity was measured using the nitroblue tetrazolium method [42]. Peroxidase (POD) activity was determined using the guaiacol method [41], and catalase (CAT) activity was determined using the UV absorption method [42]. The soluble sugar content was determined using the anthrone colorimetric method [41], and the soluble protein content was determined using the Coomassie brilliant blue method [43]. Physiological and biochemical indicator kits were purchased from Suzhou Keming Biotechnology Co, Ltd., Suzhou, China. All the physiological index measurements were repeated three times, and the statistical results were averaged.
Photosynthetic indicators were determined using a LI-6400 portable photosynthesis system when the weather was sunny and sky was cloudless. The measurement period was 9:00–11:00. The middle leaves of the plants were used to measure net photosynthetic rate (Pn), transpiration rate (Tr), intercellular CO2 concentration (Ci) and stomatal conductance (Gs). The stomatal limitation (Ls) and leaf water-use efficiency (WUE) were calculated. The measured light intensity was 1100 μmol·m−2.s−1, the temperature was approximately 25 °C, and the atmospheric CO2 concentration (Ca) was approximately 400 μmol·mol−1. In total, 10 plants were measured per treatment and 3 leaves from the same part of each plant were selected for measurements, which were averaged. The formulae for calculations were as follows:
Ls = 1 − Ci/Ca
WUE = Pn/Tr
3.5. Determination of the Anatomical Structural Index of Roots, Stems, and Leaves
After 45 d of NaCl-stress treatments, five plants were taken from each treatment group, and the roots, stems and leaves of each P. talassica × P. euphratica seedling were taken, fixed and preserved in FAA solution. These were transformed into permanent film using the paraffin section method [44]. For leaves, the palisade tissue thickness, spongy tissue thickness and leaf thickness were measured with an industrial digital camera (OPLENIC CORP, Zhejiang, China). For roots, the periderm, phloem and xylem thicknesses, vessel diameter and root diameter were measured under a Leica microscope. For stems, the stem epidermis, cortex, phloem, xylem and pith thickness were measured with an industrial digital camera (OPLENIC CORP) [45]. Five fields of view were observed for each root, stem and leaf section, and 10 structures were observed in each field of view. The average values of the anatomical structural parameters of the rhizomes and leaves from five fields of view were used as the values for P. talassica × P. euphratica. The CP and tightness of leaf tissue structure were calculated suing the following formulae:
CP = Palisade tissue thickness/Spongy tissue thickness
Tightness of leaf tissue structure = (Palisade tissue thickness/Blade thickness) × 100%
3.6. Data Processing and Analyses
The experimental data were analyzed, processed and plotted using Microsoft Excel 2010 software. Statistical analyses were performed using SPSS 25.0 software. Significant differences between means were determined using the least significant difference test at p < 0.05.
4. Discussion
4.1. Growth Characteristics of P. talassica × P. euphratica
Plant responses to salinity vary with the degree and duration of stress and the developmental stage at time of exposure [46]. Many halophytes require a quite high concentration of NaCl (100–200 mmol/L) for optimum growth [12]. Saline-alkali stress has serious effects on plant growth rate [4,14], biomass, plant height, leaf area and root length [47,48,49,50]. Traits such as survival and leaf damage have been the most common criteria for identifying salinity tolerance [51,52].
Some reports have showed clearly that salt stress inhibits the growth of poplar [53,54,55]. In this study, compared with CK, the 200 mmol/L NaCl-stress treatment significantly increased the leaf length, leaf width, leaf area and leaf numbers of P. talassica × P. euphratica, and it promoted the growth of P. talassica × P. euphratica. The 400 mmol/L NaCl-stress treatment inhibited the growth of P. talassica × P. euphratica and decreased the survival rate, but it caused no obvious damage to the leaves of P. talassica × P. euphratica. Under the 400 mmol/L NaCl-stress treatment conditions, the leaves of P. talassica × P. euphratica became smaller, which decreased the water use by the plant, thereby allowing it to conserve soil moisture and prevent an escalation in the salt concentration [56]. This is similar to a study by Z Zhu et al. (2012), in which the control, moderate NaCl conditions (200 mmol/L NaCl) significantly increased the leaf dry weight, leaf area and leaf numbers of Bruguiera gymnorrhiza, whereas the severe NaCl-stress treatment (500 mmol/L NaCl) significantly decreased each growth parameters [39]. In addition, S Chen et al. (2001) observed that leaf abscission of the P. euphratica and the hybrid P. talassica × (P. euphratica + Salix alba) tended to increase with increasing NaCl in the soil [23]. This is also similar to our study.
Under 200 mmol/L NaCl-stress treatment, the survival rate of P. talassica × P. euphratica remained unchanged, while under 400 mmol/L NaCl-stress treatment, the survival rate of P. talassica × P. euphratica was 91.6%, which was significantly lower than the CK. Similar to our findings, Shin Watanabe et al. (2000) observed the survival ratio of Pyramidalis × P. tomentosa was 78% at 150 mmol/L NaCl-stress treatment and 0% at 250 mmol/L NaCl-stress treatment [57]. Moreover, salt stress affects plant growth and development by influencing fresh and dry weights of roots and shoots, as well as shoot length [58]. In general, plant height and fresh and dry biomasses are inhibited by high levels of salt stress [59,60,61]. In this study, the 200 mmol/L NaCl-stress treatment significantly increased the aboveground, belowground, and whole plant biomasses and promoted the dry matter accumulation of P. talassica × P. euphratica. Furthermore, the 200 mmol/L NaCl-stress treatment significantly increased root length, root surface area, root volume and average root diameter of P. talassica × P. euphratica, whereas the 400 mmol/L NaCl-stress treatment decreased the biomasses, and the root-related indexes decreased significantly. However, the root/shoot ratio increased gradually along with the NaCl concentration. Similar to our findings, E Bijanzadeh et al. (1997) reported that salt stress increased root/shoot ratios in Afzal and Karoon cultivars [62].
Root development and activity were inhibited when P. talassica × P. euphratica was grown in a saline environment (such as 400 mmol/L NaCl), which caused a series of depressive effects on the physiological functions of the aerial plant parts [63,64]. This further decreased the dry matter mass of the aboveground parts [63,64]. In addition, here, the reduction in the shoot dry weight of P. talassica × P. euphratica under the high salt stress (400 mmol/L NaCl) treatment may also be due to the reductions in plant height and leaf number. This is similar to a study by WH Bolu et al. (2004) observed low salinity stimulated root and shoot biomass formation of Populus canescens, resulting in increased biomass as compared to controls over the whole experimental period. The reduction in root length and number reflects the sensitivity of this organ to salt stress [55]. In this study, the 200 mmol/L NaCl-stress treatment significantly promoted the growth of the aerial and underground parts of the roots of P. talassica × P. euphratica, indicating that the cultivar has a certain salt tolerance [65]. The 200 mmol/L NaCl-stress treatment significantly increased the plant height, ground diameter and crown width of P. talassica × P. euphratica, whereas the 400 mmol/L NaCl-stress treatment significantly decreased these growth parameters. Similar to our findings, N Orcen et al. (2016) reported that a 200 mmol/L NaCl treatment group had the tallest Salicornia plants, whereas the 500 mmol/L NaCl treatment group had the shortest Salicornia plants [42]. Here, the moderate salinity (200 mmol/L NaCl) had a positive effect on the growth of P. talassica × P. euphratica. In addition, WH Boluet al. (2004) observed immediate inhibition of root length growth of Populus canescens after exposure to high salinity [66].
4.2. Physiological Characteristics of P. talassica × P. euphratica
The trees allocated large proportions of NaCl into the leaves, which served as a salt elimination mechanism [29]. A large number of halophytes show the presence of specialized salt secretory structures in their leaves that are epidermal in origin and essentially modified trichomes [67,68]. In this study, the main vein of leaves in the NaCl-stress treatment group, and the surfaces of adjacent leaves, secrete large amounts of salt crystals. Compared with the CK, the 400 mmol/L NaCl-stress treatment group secreted more salt crystals on the P. talassica × P. euphratica leaf surfaces. This is because P. talassica × P. euphratica transfers excess salt absorbed by the root system to the leaves in response to salt stress [69].
Under salt stress, leaf water physiology also changed adaptively [55]. Water potential is an important indicator for the estimation of the water status of a plant [70,71]. High salt stress disrupts homeostasis in water potential and ion distribution. Drastic changes in ion and water homeostasis lead to molecular damage, growth arrest and even death [72]. In this study, the diurnal variations in the water potential of P. talassica × P. euphratica at all the observed time points showed the same trend. The treatment with the highest NaCl concentration had the most negative water potential during the day and the lowest water potential at noon. Trends in the control and treatment groups were consistent throughout the experiment. The greater the negative water potential of P. talassica × P. euphratica seedlings under NaCl-stress, the greater the effect of NaCl-stress on the water supply of P. talassica × P. euphratica seedlings. The higher the concentration of osmotically active Na+ and Cl− ions, the lower the water potential of the soil and the greater the negative water potential of the plant, which is an adaptation that enables the plant to absorb water from the soil [73].
Salinity changes the RWC of the leaves [74]. In this study, compared with the CK, the RWC of the leaves and chlorophyll content of P. talassica × P. euphratica leaves significantly decreased under different levels of NaCl-stress treatments. This decrease in leaf relative water content (RWC) could be caused by a lower water availability under stress conditions or by root systems that are not able to compensate for water lost by transpiration through a reduction in the absorbing surface [75,76]. In addition, the total chlorophyll concentration significantly decreased after exposing plants to higher salinity, which may result in the destruction of chloroplast structures, eventually leading to a decrease in the chlorophyll content [77]. Likewise, M Gorai et al. (2011) observed that the parameters of all leaf water relations in Phragmites decreased as the NaCl concentration increased [78]. Furthermore, S Cha-Um et al. (2009) also showed that the chlorophyll a and b, total chlorophyll and total carotenoid contents of sugarcane shoots are reduced due to decreases in salt stress, which is also similar to our study results [79].
Studies have confirmed that the inhibitory effect of salt stress on physiological and biochemical processes, which inhibits photosynthesis and destroys cell membranes [80]. Photosynthesis is the most important process for forming organic matter in plants, and the effects of water and salinity on photosynthesis determine the growth and survival of the plants [81]. In this study, compared with the CK, the Pn, Gs, Tr and Ls values of P. talassica × P. euphratica leaves gradually decreased as the NaCl concentration increased, whereas the Ci value increased gradually. This resulted from the photosynthetic capacity of the mesophyll cells of P. talassica × P. euphratica seedlings being further reduced, along with the utilization of CO2, resulting in excess CO2 and a corresponding reduction in photosynthetic products. Similar to our findings, HC Ma et al. (1997) observed that when the high salt (200 mmol/L NaCI) treatments, photosynthesis of both P. euphratica and hybrids decreased 1 day after irrigation with a high salinity solution. There was a significant reduction by day 5 for the hybrids and by day 10 for P. euphrutica [21]. In general, Pn reduction as response to an initial osmotic shock, caused by moderate drought or salinity stress, resulted from a stomatal closure [82].
The researchers found that salinity caused physiological modifications in plants such as stomatal density, shape and size [83]. NaCl-stress caused different degrees of stomatal closure and decreased stomatal density. Under salt stress, plant leaves close through stomata or reduce leaf stomatal density to reduce the transpiration rate [84]. In this study, the stomatal length, stomatal width, stomatal area, stomatal density and stomatal opening rate of P. talassica × P. euphratica leaves were decreased to varying degrees by salt stress. Similar to our findings, V. D. Rajput et al. (2015) observed three months of enhanced salinity resulted in increased stomatal density of one year old P. euphratica seedlings at 50, 100 and 150 mmol/L NaCl, whereas at 200 mmol/L salt concentration, it decreased in comparison with other salt treatments, and the area of stomata was declined as well. Salinity also affected the length of stomata openings; it decreased in salt-treated plants to reduce evaporation [85]. Improving stomatal regulation has been regarded as the most effective approach to alleviate salt stress in plants [86,87].
In this study, 200 mmol/L and 400 mmol/L NaCl-stress treatments significantly increased Pro and MDA contents in P. talassica × P. euphratica leaves. In the study of Zhang Min et al., under the 50–200 mmol/L NaCl-stress treatments, compared with the control, the MDA content of P. talassica × P. euphratica seedlings treated with 50–150 mmol/L NaCl solution had no significant change, and tended to normal physiological indicators. This indicated that P. talassica × P. euphratica seedlings were weakly affected by NaCl solution at the concentration of 50–150 mmol/L, and when the NaCl concentration reached 200 mmol/L, the MDA content of P. talassica × P. euphratica seedlings increased significantly [2]. This was because 200 mmol/L NaCl-stress treatment aggravated the lipid peroxidation of P. talassica × P. euphratica seedlings and damaged the cell membrane.
In addition, the relationship between the concentration of proline and the reaction to salt stress has been confirmed for many species of plant organisms, including poplar and aspen [18]. Similar to our findings, Shin Watanabe et al. (2000) observed that a high proline content in P. euphratica grown under both mannitol and NaCl-stress [57]. The soluble sugar and soluble protein contents significantly increased under the 400 mmoll/L NaCl-stress treatment, which may be involved in the salt-stress resistance of P. talassica × P. euphratica.
In this study, 200 and 400 mmol/L NaCl-stress treatments significantly increased the relative electrical conductivity (REC) of P. talassica × P. euphratica leaves. In the study of Zhang Min et al., under the 50–200 mmol/L NaCl-stress treatments, the relative conductivity (REC) of leaves of P. talassica × P. euphratica seedlings did not change significantly. This is because 50–200 mmol/L NaCl-stress treatments did not change the cell membrane permeability of P. talassica × P. euphratica seedlings [2].
Under normal conditions, ROS production and scavenging is well regulated. The enzymatic ROS scavenging mechanisms in plant included production of superoxide dismutase (SOD), peroxidase (POD), catalase (CAT) and so on, which can minimize the cellular damage caused by ROS [88]. In this study, compared with the CK, the low salt concentration increased the activities of the three antioxidant enzymes, whereas their activities decreased significantly at the high salt concentration. SOD, POD and CAT decreased significantly in plants under higher salinity conditions, suggesting that the excess H2O2 was not effectively scavenged, thereby causing more serious oxidative stress. This may lead to decreases in the activity levels of the three antioxidant enzymes. Similar to our findings, V. D. Rajput et al. (2015) observed anti-oxidative activity after three months of salt stress in one-year-old P. euphratica seedlings, and results showed POD activity increased with increasing rate of salt concentrations at all level of salt treatments (50, 100, 150, 200 mmol/L NaCl) [85]. A high POD activity may play an important defensive role against salt stress [89].
4.3. Anatomical Characteristics of P. talassica × P. euphratica Roots, Stems and Leaves
4.3.1. Anatomical Features of P. talassica × P. euphratica Leaves
Salinity affected anatomical and morphological characters along with physiological parameters [85]. Plants generally develop salt-resistance mechanisms and unique structures to survive under high saline stress conditions [90,91]. The studying of changes in leaf anatomy is an appropriate way to research into abiotic stress situations, including salt stress [18]. In this study, compared with the CK, NaCl-stress treatments significantly increased the palisade tissue thickness and leaf thickness, but significantly decreased spongy tissue thickness, of P. talassica × P. euphratica leaves. Increases in leaf thickness can be induced by the exposure of roots to high concentrations of NaCl [80,86]. Increasing the palisade tissue thickness and leaf thickness of P. talassica × P. euphratica may be structural changes that help to resist salt stress. Similar to our findings, Mohsen et al., on guava, Salem et al., on apple seedling, and Sherin and Pfeiffer et al., on olive, found that increasing salinity levels were accompanied by increases in the thicknesses of leaf blades [92,93,94,95].
Interestingly, contrary to our findings, E Karimi et al. (2012) observed an increase in spongy mesophyll thickness due to salt stress, along with a slight reduction in palisade mesophyll thickness [96]. Therefore, the response of P. talassica × P. euphratica to external adversity stress can be significantly reflected in the structures of leaves first, which then affects their physiological and biochemical responses.
4.3.2. Anatomical Features of P. talassica × P. euphratica Stems
In the stem, adaptive features include a thickening epidermis and increasing phloem area [97]. In our current research, compared with the CK, the anatomical characteristics of P. talassica × P. euphratica seedling stems changed significantly under different concentrations of NaCl. The NaCl-stress increased stem epidermal thickness, cortex thickness, phloem and xylem thickness and pith diameter. Both the cortical and pith increased in the salt range population. These tissues can enhance the storage capacity, which is crucial under unfavorable moisture conditions [98]. Similar to our findings, the stem cortex thickness of the Palestinian tomato (Solanum lycopersicon) increases significantly at 100 mmol/L NaCl compared with the control [84]. Moreover, Younis et al. observed that the phloem cell areas and pith cell areas of stems increase under salt stress [99], which was similar to our findings. This increased succulence in stems may aid to store additional water, and hence, increase survival, under harsh environmental conditions [100]. Furthermore, epidermal thickness greatly increased, indicating increased adaptability because a thick epidermis is a characteristic feature of salt-tolerant species. This characteristic is critical when moisture availability is limited because a thick epidermis is capable of checking water loss through stems [101,102,103,104].
4.3.3. Anatomical Features of P. talassica × P. euphratica Roots
The effects of salinity on the root anatomy of plants have been reported previously [105,106,107]. In this study, root xylem thickness, phloem thickness, xylem vessel number, xylem vessel diameter and root cross-sectional diameter all showed a significant upward trend as the NaCl concentration increased. In addition, the variation in the diameter of the xylem vessels influenced the salinity tolerance. The diameter of the xylem is considerably larger in salt-treated plants [108]. Contrary to our findings, Maryani et al. showed that increases in NaCl concentrations caused decreases in root diameters and xylem tissue thickness. However, in their findings, similar to our results, high concentrations of NaCl tended to increase the diameters of xylem vessels in roots [109]. The diameters of the xylem vessels affect the water transport capacity [110]: the larger the diameters of the xylem vessels, the stronger the water transport capacity.
5. Conclusions
The growth, physiological and photosynthetic characteristics of P. talassica × P. euphratica seedlings, as well as root, stem and leaf anatomy are highly dependent on soil moisture and salinity conditions. Under low-salt stress (200 mmol/L NaCl), these indicators were limited, but P. talassica × P. euphratica could adapt to the low-salt stress by changeing the leaf area, leaf thickness, root length, root branch number, plant height, ground diameter, crown width and biomass allocation, improving water use efficiency, changing stomatal density and size, increasing the content of Pro, MDA, soluble sugar and soluble protein, increasing the activities of three antioxidant enzymes (SOD, POD and CAT), and changing the anatomical structure of P. talassica × P. euphratica, etc. A series of strategies are used to adapt to the salt environment, so that they can grow normally, and to a certain extent promote their growth. P. talassica × P. euphratica can survive and reproduce at a concentration of more than 200 mmol/L NaCl, which proves that it has salt [11,69,111]. However, under high salt stress (400 mmol/L NaCl), various growth parameters of P. talassica × P. euphratica seedlings decreased, biomass accumulation decreased, photosynthesis decreased significantly, WUE decreased and antioxidant enzyme activities decreased, indicating that the above mechanisms cannot offset the salt coercion effect.
In accordance with the related growth, physiological and photosynthetic characteristics of P. talassica × P. euphratica in response to salt stress, as well as the anatomical structural characteristics of roots, stems and leaves, P. talassica × P. euphratica appeared to have a certain salt tolerance, and moderate salt stress was beneficial to its growth. The growth and physiological characteristics of P. talassica × P. euphratica in response to salt stress, as well as changes in its structures, were adaptive mechanisms to cope with salt stress. This study provides reliable physiological, biochemical and structural indicators for exploring the salt tolerance mechanism of P. talassica × P. euphratica, and provides a certain reference for the improvement and sustainable development of soil saline-alkali land in Xinjiang in the future.
Author Contributions
Z.H. conceived and directed the project; Y.L. performed all the experiments and the statistical analyses and wrote the paper; M.S. participated in part of the experiments. All authors have read and agreed to the published version of the manuscript.
Funding
This work was funded by the Open Project of Xinjiang Production and Construction Corps Key Laboratory of Protection and Utilization of Biological Resources in Tarim Basin (Funding number: BRZD1902, Funder: Corps Key Laboratory). This work was also funded by the Selection and Cultivation Project of “Talents of Xinjiang Production and Construction Corps” (Funding number: 38000020924, Funder: Xinjiang Production and Construction Corps).
Institutional Review Board Statement
Not applicable.
Informed Consent Statement
Not applicable.
Data Availability Statement
Not applicable.
Conflicts of Interest
The authors declare that they have no known competing financial interest or personal relationship that could have appeared to influence the work reported in this paper.
Abbreviations
| RWC | Relative water content |
| WSD | Water saturation deficit |
| POD | Peroxidase |
| SOD | Superoxide dismutase |
| CAT | Catalase |
| MDA | Malondialdehyde |
| Pro | Proline |
| Pn | Net photosynthetic rate |
| Tr | Transpiration rate |
| Ci | Intercellular CO2 concentration |
| Gs | Stomatal conductance |
| Ls | Stomatal limitation |
| WUE | Water Use Efficiency |
| CP | Palisade tissue thickness/Spongy tissue thickness |
References
- Liang, Y.; Yang, C.; Shi, H. Effects of silicon on growth and mineral composition of barley grown under toxic levels of aluminum. J. Plant Nutr. 2001, 24, 229–243. [Google Scholar] [CrossRef]
- Min, Z.; Juntuan, Z.; Zhanjiang, H.; Jianyin, S.; Yang, S. Effect of NaCl on survival rate and physiological characteristics of Populus talassica × P. euphratica. J. Tarim Univ. 2021, 33, 15–22. [Google Scholar]
- Hongyou, T.; Jianyin, S.; Zhanjiang, H.; Menghan, B.; Yang, S.; Min, Z. Physiological Response of Populus talassica × P. euphratica to Na2SO4 Environment. Chin. Agric. Sci. Bull. 2021, 37, 38–42. [Google Scholar]
- Pitman, M.G.; Luchli, A. Global Impact of Salinity and Agricultural Ecosystems; Springer: Amsterdam, The Netherlands, 2004; pp. 3–20. [Google Scholar]
- Golldack, D.; Li, C.; Mohan, H.; Nina, P. Tolerance to drought and salt stress in plants: Unraveling the signaling networks. Front. Plant 2014, 5, 151. [Google Scholar] [CrossRef] [Green Version]
- Yamaguchi, T.; Blumwald, E. Developing salt-tolerant crop plants: Challenges and opportunities. Trends Plant Sci. 2005, 10, 615–620. [Google Scholar] [CrossRef]
- Tang, X.; Mu, X.; Shao, H.; Wang, H.; Brestic, M. Global plant-responding mechanisms to salt stress: Physiological and molecular levels and implications in biotechnology. Crit. Rev. Biotechnol. 2015, 35, 425–437. [Google Scholar] [CrossRef]
- Stepien, P.; Johnson, G.N. Contrasting responses of photosynthesis to salt stress in the glycophyte Arabidopsis and the halophyte Thellungiella: Role of the plastid terminal oxidase as an alternative electron sink. Plant Physiol. 2009, 149, 1154–1165. [Google Scholar] [CrossRef] [Green Version]
- Bohnert, H.J.; Cushman, J.C. The ice plant cometh: Lessons in abiotic stress tolerance. J. Plant Growth Regul. 2000, 19, 334–346. [Google Scholar] [CrossRef]
- Bohnert, H.J.; Nelson, D.E.; Jensen, R.G. Adaptations to Environmental Stresses. Plant Cell 1995, 7, 1099–1111. [Google Scholar] [CrossRef]
- Flowers, T.J.; Colmer, T.D. Salinity Tolerance in Halophytes—Flowers; New Phytologist; Wiley Online Library: Hoboken, NJ, USA, 2008; pp. 945–963. [Google Scholar]
- Flowers, T.J.; Troke, P.F.; Yeo, A.R. The mechanism of salt tolerance in halophytes. Annu. Rev. Plant Physiol. 1977, 28, 89–121. [Google Scholar] [CrossRef]
- Flowers, T.J.; Galal, H.K.; Bromham, L. Evolution of halophytes: Multiple origins of salt tolerance in land plants. Funct. Plant Biol. 2010, 37, 604–612. [Google Scholar] [CrossRef]
- Flowers, T.J.; Hajibagheri, M.A.; Clipson, N.J.W. Halophytes: Sussex research online. Q. Rev. Biol. 1986, 61, 313–337. [Google Scholar] [CrossRef]
- Santos, J.; Al-Azzawi, M.; Aronson, J.; Flowers, T.J. eHALOPH a database of salt-tolerant plants: Helping put halophytes to work. Plant Cell Physiol. 2015, 57, e10. [Google Scholar] [CrossRef] [PubMed] [Green Version]
- Sun, X.; Gao, Y.; Wang, D.; Chen, J.; Zhang, F.; Zhou, J.; Yan, X.; Li, Y.; Luo, Z.-B. Stoichiometric variation of halophytes in response to changes in soil salinity. Plant Biology. 2017, 19, 360–367. [Google Scholar] [CrossRef]
- Duarte, B.; Santos, D.; Marques, J.C.; Caçador, I. Ecophysiological constraints of two invasive plant species under a saline gradient: Halophytes versus glycophytes. Estuar. Coast. Shelf Sci. 2015, 167, 154–165. [Google Scholar] [CrossRef]
- Evlakov, P.M.; Zapletin, V.Y.; Rzhevsky, S.G. Salt stress effect on morphometrical and anatomical leaf traits of promising poplar biotypes. IOP Conf. Ser. Earth Environ. Sci. 2019, 392, 012041. [Google Scholar] [CrossRef]
- Sixto, H.; Grau, J.M.; Alba, N.; ALÍA, R. Response to sodium chloride in different species and clones of genus Populus L. Forestry 2005, 78, 93–104. [Google Scholar] [CrossRef] [Green Version]
- Sixto, H.; Aranda, I.; Grau, J.M. Assessment of salt tolerance in Populus alba clones using chlorophyll flfluorescence. Photosynthetica 2006, 44, 169–173. [Google Scholar] [CrossRef]
- Ma, H.C.; Fung, L.; Wang, S.S.; Altman, A.; Hüttermann, A. Photosynthetic response of Populus euphratica to salt stress. For. Ecol. Manag. 1997, 93, 55–61. [Google Scholar] [CrossRef]
- Fung, L.E.; Wang, S.S.; Altman, A.; Hütterman, A. Effect of NaCl on growth, photosynthesis, ion and water relations of four poplar genotypes—ScienceDirect. For. Ecol. Manag. 1998, 107, 135–146. [Google Scholar] [CrossRef]
- Chen, S.; Li, J.; Wang, S.; Altman, A.; Hüttermann, A. Salt, nutrient uptake and transport, and ABA of Populus euphratica; A hybrid in response to increasing soil NaCl. Trees Struct. Funct. 2001, 15, 186–194. [Google Scholar] [CrossRef]
- Chen, S.; Li, J.; Wang, S.; Altman, A.; Hüttermann, A. Sodium and chloride distribution in roots and transport in three poplar genotypes under increasing NaCl stress. For. Ecol. Manag. 2002, 168, 217–230. [Google Scholar] [CrossRef]
- Chen, S.; Li, J.; Wang, S.; Fritz, E.; Hüttermann, A.; Altman, A. Effects of NaCl on shoot growth, transpiration, ion compartmentation, and transport in regenerated plants of Populus euphratica and Populus tomentosa. Can. J. For. Res. 2003, 33, 967–975. [Google Scholar] [CrossRef]
- Beritognolo, I.; Piazzai, M.; Benucci, S.; Kuzminsky, E.; Sabatti, M.; Mugnozza, G.S.; Muleo, R. Functional characterisation of three Italian Populus alba L. genotypes under salinity stress. Trees 2007, 21, 465–477. [Google Scholar] [CrossRef]
- Imada, S.; Yamanaka, N.; Tamai, S. Effects of salinity on the growth, Na partitioning, and Na dynamics of a salt-tolerant tree, Populus alba L. J. Arid. Environ. 2009, 73, 245–251. [Google Scholar] [CrossRef]
- Gu, R.; Fonseca, S.; Puskas, L.G.; Hackler, L.; Zvara, A.; Dudits, D.; Pais, M.S. Transcript identification and profiling during salt stress and recovery of Populus euphratica. Tree Physiol. 2004, 24, 265–276. [Google Scholar] [CrossRef]
- Chen, S.; Wang, S.; Arie, A.; Huttermann, A. Genotypic variation in drought tolerance of poplar in relation to abscisic acid. Tree Physiol. 1997, 17, 797–803. [Google Scholar] [CrossRef] [Green Version]
- Chen, J.; Xia, X.; Yin, W. Expression profiling and functional characterization of a DREB2-type gene from Populus euphratica. Biochem. Biophys. Res. Commun. 2009, 378, 483–487. [Google Scholar] [CrossRef]
- Bradshaw, H.D.; Ceulemans, R.; Davis, J.; Stettler, R. Emerging model systems in plant biology: Poplar (Populus) as a model forest tree. J. Plant Growth Regul. 2000, 19, 306–313. [Google Scholar] [CrossRef]
- Liu, Y.; Han, Z.J.; Su, M.X.; Zhang, M. Transcriptomic profile analysis of P. talassica × P. euphratica response and tolerance under salt stress conditions. Genes 2022, 13, 1032. [Google Scholar] [CrossRef]
- Chen, S.; Polle, A. Salinity tolerance of Populus. Plant Biol. 2010, 12, 317–333. [Google Scholar] [CrossRef]
- Munns, R. Physiological processes limiting plant growth in saline soils: Some dogmas and hypotheses. Plant Cell Environ. 1993, 16, 15–24. [Google Scholar] [CrossRef]
- Mehari, A.; Ericsson, T.; Weih, M. Effects of NaCl on seedling growth, biomass production and water status of Acacia nilotica and A. tortilis. J. Arid. Environ. 2005, 62, 343–349. [Google Scholar] [CrossRef]
- Shu, G. The possible mechanisms of NaCl inhibit photosythesis of maize seedlings. Acta Photophysiol. Sin. 2001, 27, 461–466. [Google Scholar]
- Kylin, A.; Quatrano, R.S. Plants in Saline environments. In Ecologicol Studies, Analysis and Synthesis; Springer: Berlin/Heidelberg, Germany, 1975; pp. 147–167. [Google Scholar]
- Parida, A.K.; Das, A.B. Salt tolerance and salinity effects on plants: A review. Ecotoxicol. Environ. Saf. 2005, 60, 324–349. [Google Scholar] [CrossRef]
- Zhu, Z.; Chen, J.; Zheng, H.L. Physiological and proteomic characterization of salt tolerance in a mangrove plant Bruguiera gymnorrhiza (L.). Lam. Tree Physiol. 2012, 32, 1378–1388. [Google Scholar] [CrossRef] [Green Version]
- Al-Khaliel, A.S. Effect of salinity stress on mycorrhizal association and growth response of peanut infected by Glomus mosseae. Plant Soil Environ. 2010, 56, 318–324. [Google Scholar] [CrossRef] [Green Version]
- Hassan, F.; Ali, E. Effects of salt stress on growth, antioxidant enzyme activity and some other physiological parameters in jojoba [Simmondsia chinensis (Link) Schneider] plant. Aust. J. Crop Sci. 2014, 8, 1615–1624. [Google Scholar]
- Orcen, N. Effect of salt stress on plant growth and physiological parameters of common glasswort (Salicornia europaea). Int. J. Biosci. Law 2016, 8, 218–227. [Google Scholar]
- Chen, M.; Chen, Y.; Zhang, Y.; Song, B. Determination of soluble protein in potato by attenvated total reflection mid-infrared spectroscopy. J. Chin. Cereals Oils Assoc. 2018, 33, 118–126. [Google Scholar]
- Fayek, M.A.; Fayed, T.A.; El-Sayed, E.H.; Ebtesam, E. Comparative impacts of salt stress on survival and leaf anatomy traits in olive genotypes. Biosci. Res. 2018, 15, 565–574. [Google Scholar]
- Zhuang, L.; Li, W.H.; Yuan, F.; Gong, W.; Tian, Z. Ecological adaptation characteristics of Populus euphratica and Tamarix ramosissima leaf microstructures in the lower reaches of Tarim River. Acta Ecol. Sin. 2010, 30, 62–66. [Google Scholar] [CrossRef]
- Bui, E.N. Soil salinity: A neglected factor in plant ecology and biogeography. J. Arid. Environ. 2013, 92, 14–25. [Google Scholar] [CrossRef]
- Shi, D.; Sheng, Y. Effect of various salt-alkaline mixed stress conditions on sunflower seedlings and analysis of their stress factors. Environ. Exp. Bot. 2005, 54, 8–21. [Google Scholar] [CrossRef]
- Li, R.; Shi, F.; Fukuda, K. Interactive effects of various salt and alkali stresses on growth, organic solutes, and cation accumulation in a halophyte Spartina alterniflora (Poaceae). Environ. Exp. Bot. 2010, 68, 66–74. [Google Scholar] [CrossRef]
- Ramoliya, P.J.; Pandey, A.N. Effect of salinization of soil on emergence, growth and survival of seedlings of Cordia rothii. For. Ecol. Manag. 2003, 176, 185–194. [Google Scholar] [CrossRef]
- Lacerda, C.; Cambraia, J.; Oliva, M.A.; Ruiz, H.A. Changes in growth and in solute concentrations in sorghum leaves and roots during salt stress recovery. Environ. Exp. Bot. 2005, 54, 69–76. [Google Scholar] [CrossRef]
- Nobel, L. Salinity effects on leaf anatomy. Plant Physiol. 1979, 63, 700–703. [Google Scholar]
- Maas, E.V. Crop salt tolerance–current assessment. J. Irrig. Drain. Div. 1977, 103, 115–134. [Google Scholar] [CrossRef]
- Ruigang, W.; Shaoliang, C.; Xiaoyang, Z.; Shen, X.; Deng, L.; Zhu, H.; Shao, J.; Shi, Y.; Dai, S.; Fritz, E.; et al. lonic homeostasis and reactive oxygen species control in leaves and xylem sap of two poplars subjected to NaCl stress. Tree Physiol. 2008, 28, 947–957. [Google Scholar]
- Chang, Y.; Chen, S.; Yin, W.; Wang, R.; Liu, Y.; Shi, Y.; Shen, Y.; Li, Y.; Jiang, J.; Liu, Y. Growth, gas exchange, abscisic acid, and calmodulin response to salt stress in three poplars. J. Integr. Plant Biol. 2006, 48, 8. [Google Scholar] [CrossRef]
- Evers, D.; Schmit, C.; Mailliet, Y.; Hausman, J.F. Growth characteristics and biochemical changes of poplar shoots in vitro under sodium chloride stress. J. Plant Physiol. 1997, 151, 748–753. [Google Scholar] [CrossRef]
- Munns, R.; Tester, M. Mechanisms of salinity tolerance. Annu. Rev. Plant Biol. 2008, 59, 651–681. [Google Scholar] [CrossRef] [Green Version]
- Watanabe, S.; Kojima, K.; Ide, Y.; Sasaki, S. Effects of saline and osmotic stress on proline and sugar accumulation in Populus euphratica in vitro. Plant Cell Tissue Organ Cult. 2000, 63, 199–206. [Google Scholar] [CrossRef]
- Ashraf, M.; Arfan, M.; Ahmad, A. Salt tolerance in Okra: Ion relations and gas exchange characteristics. J. Plant Nutr. 2003, 26, 63–79. [Google Scholar] [CrossRef]
- Liu, J.; Guo, W.Q.; Shi, D.C. Seed germination, seedling survival, and physiological response of sunflowers under saline and alkaline conditions. Photosynthetica 2010, 48, 278–286. [Google Scholar] [CrossRef]
- Wei, Y.; Xu, X.; Tao, H.; Wang, P. Growth performance and physiological response in the halophyte Lycium barbarum grown at salt-affected soil. Ann. Appl. Biol. 2010, 149, 263–269. [Google Scholar] [CrossRef]
- Shams, M.; Yildirim, E.; Ekinci, M.; Metin, T.; Atilla, D.; Fazilet, P.; Raziye, K. Exogenously applied glycine betaine regulates some chemical characteristics and antioxidative defence systems in lettuce under salt stress. Hortic. Environ. Biotechnol. 2016, 57, 225–231. [Google Scholar] [CrossRef]
- Bijanzadeh, E.; Emam, Y. Effects of salt stress on root anatomy and hydraulic conductivity of barley cultivars. Iran Agric. Res. 2015, 34, 71–79. [Google Scholar]
- Cavalcanti, F.R.; Lima, J.; Ferreira-Silva, S.L.; Metin, T.; Atilla, D.; Fazilet, P.; Raziye, K. Roots and leaves display contrasting oxidative response during salt stress and recovery in cowpea. J. Plant Physiol. 2007, 164, 591–600. [Google Scholar] [CrossRef]
- Zhang, L.; Chen, B.; Zhang, G.; Li, J.; Wang, Y.; Meng, Y.; Zhou, Z. Effect of soil salinity, soil drought, and their combined action on the biochemical characteristics of cotton roots. Acta Physiol. Plant. 2013, 35, 3167–3179. [Google Scholar] [CrossRef]
- Saied, A.S.; Keutgen, A.J.; Noga, G. The influence of NaCl salinity on growth, yield and fruit quality of strawberry cvs. ‘Elsanta’ and ‘Korona’. Sci. Hortic. 2005, 103, 289–303. [Google Scholar] [CrossRef]
- Bolu, W.H.; Polle, A. Growth and stress reactions in roots and shoots of a salt-sensitive poplar species (Populus x canescens). Trop. Ecol. 2004, 45, 997–1005. [Google Scholar]
- Shabala, S.; Bose, J.; Hedrich, R. Salt bladders: Do they matter? Trends Plant Sci. 2014, 19, 687–691. [Google Scholar] [CrossRef] [PubMed]
- Esau, K. Plant Anatomy, 2nd ed.; John Wiley: New York, NY, USA, 1965. [Google Scholar]
- Yuan, F.; Leng, B.; Wang, B. Progress in studying salt secretion from the salt glands in recretohalophytes: How do plants secrete salt? Front. Plant Sci. 2016, 7, 977. [Google Scholar] [CrossRef] [Green Version]
- Fanjiang, C.; Ximing, Z.; Xiangyi, L.; Foetzki, A.; Runge, M. Seasonal variation of Tamarix ramosissima and Populus euphratica water potentials in southern fringe of Taklamakan Desert. Chin. J. Appl. Ecol. 2005, 16, 1389–1393. [Google Scholar]
- Romero-Aranda, R.; Soria, T.; Cuartero, J. Tomato plant-water uptake and plant-water relationships under saline growth conditions. Plant Science. 2001, 160, 265–272. [Google Scholar] [CrossRef]
- Zhu, J.K. Plant salt tolerance. Trends Plant Sci. 2001, 6, 66–71. [Google Scholar] [CrossRef]
- Arndt, S.K. Growth, physiological characteristics and ion distribution of NaCl stressed Alhagi sparsifolia seedlings. Chin. Sci. Bull. 2008, 53, 169–176. [Google Scholar]
- Lee, G.; Carrow, R.N.; Duncan, R.R. Growth and water relation responses to salinity stress in halophytic seashore paspalum ecotypes. Sci. Hortic. 2005, 104, 221–236. [Google Scholar] [CrossRef]
- Gadallah, M.A.A. Effects of indole-3-acetic acid and zinc on the growth, osmotic potential and soluble carbon and nitrogen components of soybean plants growing under water deficit. J. Arid. Environ. 2000, 44, 451–467. [Google Scholar] [CrossRef]
- Shalhevet, J. Plants under salt and water stress. In Plant Adaptation to Environmental Stress; Fowden, L., Mansfield, T., Stoddart, J., Eds.; Chapman and Hall: London, UK, 1993; pp. 133–154. [Google Scholar]
- Jing, C.; Lv, X.Y.; Chen, L.; Xing, J.; Lan, H. Effects of salinity on the growth, physiology and relevant gene expression of an annual halophyte grown from heteromorphic seeds. AoB PLANTS 2015, 7, 2016. [Google Scholar]
- Gorai, M.; Ennajeh, M.; Khemira, H.; Neffati, M. Influence of NaCl-salinity on growth, photosynthesis, water relations and solute accumulation in Phragmites australis. Acta Physiol. Plant. 2011, 33, 963–971. [Google Scholar] [CrossRef]
- Chalermpol, S.K. Proline accumulation, photosynthetic abilities and growth characters of Sugarcane (Saccharum officinarum L.) plantlets in response to iso-osmotic salt and water-deficit stress. Agric. Sci. China 2009, 8, 51–58. [Google Scholar]
- Rao, S.; Du, C.; Li, A.; Xia, X.; Yin, W.; Chen, J. Salicylic acid alleviated salt damage of Populus euphratica: A physiological and transcriptomic analysis. Forests 2019, 10, 423. [Google Scholar] [CrossRef]
- Li, J.Y.; Zhao, C.Y.; Li, J.; Yan, Y.Y.; Yu, B.; Han, M. Growth and leaf gas exchange in Populus euphratica across soil water and salinity gradients. Photosynth. Int. J. Photosynth. Res. 2013, 51, 321–329. [Google Scholar] [CrossRef]
- Sharkey, T.D.; Sharkey, T. Water stress effect on photosynthesis. Photosynthetica 1990, 24, 651–656. [Google Scholar]
- Rosario, M.; Maurizio, S.; Grazia, A.; Moica, P.; Isacco, B. Leaf morphological plasticity and stomatal conductance in three Populus alba L. genotypes subjected to salt stress. Environ. Exp. Bot. 2009, 66, 381–388. [Google Scholar]
- Alkan, N.; Sözen, M.Ş.; Kurtaş, Ö. Morphological and anatomical responses of two Palestinian tomato (Solanum lycopersicon L.) cultivars to salinity during seed germination and early growth stages. Acad. J. 2013, 12, 4789–4797. [Google Scholar]
- Rajput, V.D.; Chen, Y.; Ayup, M. Effects of high salinity on physiological and anatomical indices in the early stages of Populus euphratica growth. Russ. J. Plant Physiol. 2015, 62, 229–236. [Google Scholar] [CrossRef]
- Qiu, R.; Katul, G.G. Maximizing leaf carbon gain in varying saline conditions: An optimization model with dynamic mesophyll conductance. Plant J. 2019, 101, 543–554. [Google Scholar] [CrossRef] [PubMed]
- Chen, T.W.; Kahlen, K.; Stützel, H. Disentangling the contributions of osmotic and ionic effects of salinity on stomatal, mesophyll, biochemical and light limitations to photosynthesis. Plant Cell Env. 2015, 38, 1528–1542. [Google Scholar] [CrossRef] [PubMed]
- Sun, J.; Li, L.; Liu, M.; Wang, M.; Ding, M.; Deng, S.; Lu, C.; Zhou, X.; Shen, X.; Zheng, X.; et al. Hydrogen peroxide and nitric oxide mediate K+/Na+ homeostasis and antioxidant defense in NaCl-stressed callus cells of two contrasting poplars. Plant Cell Tissue Organ Cult. 2010, 103, 205–215. [Google Scholar] [CrossRef]
- Agarwal, S.; Pandey, V. Antioxidant enzyme responses to NaCl stress in Cassia angustifolia. Biol. Plant. 2004, 48, 555–560. [Google Scholar] [CrossRef]
- Roy, S.J.; Negrão, S.; Tester, M. Salt resistant crop plants. Curr. Opin. Biotechnol. 2014, 26, 115–124. [Google Scholar] [CrossRef] [PubMed]
- Eltarawy, M.O. Physiological Studies on Olive Transplants; Faculty of Agriculture, Benha University: Benha, Egypt, 2017. [Google Scholar]
- Mohsen, A.M.; El-Mosallamy, H.M.; El-Hefnawy, S.M. Some anatomical features of guava seedlings in response to soil moisture and soil salinity. 1.-leaf structure [Egypt]. Zagazig J. Agric. Res. 1987, 14, 1–22. [Google Scholar]
- Salem, S.E.; Moustafa, S.S. Effect of some citrus rootstocks on the growth and mineral content of Washington navel orange seedlings. Adv. Space Res. 1990, 37, 1932–1937. [Google Scholar]
- Sherin, A.S. Studies on Growth of Olive Plants under Salt Stress; Department of Pomology, Faculty of Agriculture, Cairo University: Cairo, Egypt, 2002. [Google Scholar]
- Pfeiffer, T.U.; Ivna, T.; Marina, H.; Zanic, M.; Pavicic, N.; Cesar, V.; Lepedus, H. Comparative study of leaf anatomy and certain biochemical traits in two Olive cultivars. Agric. Conspec. Sci. 2010, 75, 91–97. [Google Scholar]
- Karimi, E.; Abdolzadeh, A.; Sadeghipour, H.R. Increasing salt tolerance in Olive, Olea europaea L. plants by supplemental potassium nutrition involves changes in ion accumulation and anatomical attributes. Int. J. Plant Prod. 2012, 3, 1735–6814. [Google Scholar]
- Rashid, P.; Ahmed, A. Anatomical adaptations of Myriostachya wightiana Hook. F. to salt stress. Dhaka Univ. J. Biol. Sci. 2011, 20, 205–208. [Google Scholar] [CrossRef]
- Baloch, A.H.; Gates, P.J.; Baloch, G.M. Anatomical changes brought about by salinity in stem, leaf and root of Arabidopsis thaliana (L.) Heynh (thale cress). Sarhad J. Agric. 1998, 14, 131–142. [Google Scholar]
- Younis, A.; Riaz, A.; Ikram, S.; Nawaz, T.; Hameed, M.; Fatima, S.; Batool, R.; Ahmad, F. Salinity-induced structural and functional changes in 3 cultivars of Alternanthera bettzickiana (Regel) G. Nicholson. Turk. J. Agric. For. 2013, 37, 674–687. [Google Scholar] [CrossRef]
- Hameed, M.; Ashraf, M.; Naz, N.; Al-Qurainy, F. Anatomical adaptations of Cynodon dactylon (L.) Pers. from the salt range (Pakistan) to salinity stress. II. Leaf anatomy. Pak. J. Bot. 2013, 45, 133–142. [Google Scholar]
- Awasthi, O.P.; Pathak, R.K. Effect of salinity levels on survival and anatomy of four scion cultivars budded on Indian jujuba. Hort. J. 1999, 12, 53–59. [Google Scholar]
- Hameed, M.; Chaudhry, A.A.; Maan, M.A.; Anwar, H.G. Diversity of plant species in Lal Suhanra National Park, Bahawalpur, Pakistan. J. Biol. Sci. 2002, 2, 267–274. [Google Scholar]
- Mansoor, U.; Hameed, M.; Wahid, A.; Rao, A.R. Ecotypic variability for drought resistance in Cenchrus ciliaris L. Germplasm from cholistan desert in Pakistan. Int. J. Agric. Biol. 2002, 4, 392–397. [Google Scholar]
- Nawazish, S.; Hameed, M.; Naurin, S. Leaf anatomical adaptations of Cenchrus ciliaris L. from the Salt Range, Pakistan against drought stress. Pak. J. Bot. 2006, 38, 1723–1730. [Google Scholar]
- Ping, A.; Shinobu, I.; Li, X.; Hideyuki, S.; Eiichi, T. Root characteristics in salt tolerance. Root Res. 2009, 12, 125–132. [Google Scholar]
- Reinhardt, D.H.; Rost, T.L. On the correlation of primary root growth and tracheary element size and distance from the tip in cotton seedlings grown under salinity. Environ. Exp. Bot. 1995, 35, 575–588. [Google Scholar] [CrossRef]
- Serrato, V.G.; Melone, L.; Orsi, O.; Riveros, F. Anatomical changes in Prosopis cineraria (L.) Druce seedlings growing at different levels of NaCl salinity. Ann. Bot. 1992, 70, 399–404. [Google Scholar]
- Miloud, T.; Rabah, C.; Khadidja, B.; Abdelkarim, F. Search for physiological and anatomical parameters of salt tolerance in beans (Phaseolus vulgaris L.). Int. J. Biosci. 2017, 11, 184–197. [Google Scholar]
- Abdelkarim, F. Root anatomy and growth responses of soybean (Glycine max (L.) Merr.) ‘Wilis’ to NaCl stress. Trop. Agric. 2017, 209–218. [Google Scholar] [CrossRef]
- Hacke, U.G.; Sperry, J.S.; Wheeler, J.K. Scaling of angiosperm xylem structure with safety and efficiency. Tree Physiol. 2006, 26, 689–701. [Google Scholar] [CrossRef]
- Flowers, T.J.; Rana, M.; Colmer, T.D. Sodium chloride toxicity and the cellular basis of salt tolerance in halophytes. Ann. Bot. 2015, 115, 419–431. [Google Scholar] [CrossRef]
Figure 1.
Effects of different concentrations of NaCl-stress treatments on salt secretion of P. talassica × P. euphratica leaf surfaces. (A) CK (1×); (B) 200 mmol/L NaCl (1×); (C) 400 mmol/L NaCl (1×).
Figure 1.
Effects of different concentrations of NaCl-stress treatments on salt secretion of P. talassica × P. euphratica leaf surfaces. (A) CK (1×); (B) 200 mmol/L NaCl (1×); (C) 400 mmol/L NaCl (1×).

Figure 2.
Diurnal variation curve of the P. talassica × P. euphratica leaf water potential.

Figure 3.
Effects of different concentrations of NaCl-stress treatments on the relative water contents and water saturation deficits of P. talassica × P. euphratica leaves. (A) Effects of different concentrations of NaCl-stress treatments on the relative water contents in leaves of P. talassica × P. euphratica; (B) Effects of different concentrations of NaCl-stress treatments on the water saturation deficits in leaves of P. talassica × P. euphratica. Bars represent means and standard deviations of biological replicates. Letters above bars indicate statistical signifcance by one-way ANOVA, different lowercase letters indicate significant differences, p < 0.05.

Figure 4.
Effects of different concentrations of NaCl-stress treatments on the size, and the opening and closing, of P. talassica × P. euphratica leaf stomata. (A–E) Microstructures of leaf stomata in leaves: (A) in their natural state (×10); (B) treated with 200 mmol/L NaCl (×10); (C) treated with 400 mmol/L NaCl (×10); (D) in their natural state (×40); (E) treated with 200 mmol/L NaCl (×40); (F) treated with 400 mmol/L NaCl (×40).

Figure 5.
Effects of different concentrations of NaCl-stress treatments on the photosynthetic physiology of P. talassica × P. euphratica. (A) Effects of different concentrations of NaCl-stress treatments on the net photosynthetic rate in leaves of P. talassica × P. euphratica; (B) Effects of different concentrations of NaCl-stress treatments on the stomatal conductance in leaves of P. talassica × P. euphratica; (C) Effects of different concentrations of NaCl-stress treatments on the intercellular CO2 concentration in leaves of P. talassica × P. euphratica; (D) Effects of different concentrations of NaCl-stress treatments on the transpiration rate in leaves of P. talassica × P. euphratica; (E) Effects of different concentrations of NaCl-stress treatments on the stomatal limitation in leaves of P. talassica × P. euphratica; (F) Effects of different concentrations of NaCl-stress treatments on the the water use efficiency in leaves of P. talassica × P. euphratica. Bars represent means and standard deviations of biological replicates. Letters above bars indicate statistical signifcance by one-way ANOVA, different lowercase letters indicate significant differences, p < 0.05.

Figure 6.
Effects of different concentrations of NaCl-stress treatments on the contents of MDA, Pro, soluble sugar and soluble protein in P. talassica × P. euphratica leaves. (A) Effects of different concentrations of NaCl-stress treatments on the malondialdehyde content in leaves of P. talassica × P. euphratica; (B) Effects of different concentrations of NaCl-stress treatments on the proline content in leaves of P. talassica × P. euphratica; (C) Effects of different concentrations of NaCl-stress treatments on the soluble sugar content in leaves of P. talassica × P. euphratica; (D) Effects of different concentrations of NaCl-stress treatments on the soluble protein content in leaves of P. talassica × P. euphratica. Bars represent means and standard deviations of biological replicates. Letters above bars indicate statistical signifcance by one-way ANOVA, different lowercase letters indicate significant differences, p < 0.05.

Figure 7.
Effects of different concentrations of NaCl-stress treatments on antioxidant enzyme (SOD, POD and CAT) activities and the relative electrical conductivity in leaves. (A) Effects of different concentrations of NaCl-stress treatments on the activity of superoxide dismutase in P. talassica × P. euphratica leaves; (B) Effects of different concentrations of NaCl-stress treatments on the activity of peroxidase in P. talassica × P. euphratica leaves; (C) Effects of different concentrations of NaCl-stress treatments on the activity of catalase in P. talassica × P. euphratica leaves; (D) Effects of different concentrations of NaCl-stress treatments on the relative conductivity in P. talassica × P. euphratica leaves. Bars represent means and standard deviations of biological replicates. Letters above bars indicate statistical signifcance by one-way ANOVA, different lowercase letters indicate significant differences, p < 0.05.

Figure 8.
Microstructures of leaves treated with different concentrations of NaCl-stress treatments (20×). (A) CK (20×); (B) 200 mmol/L NaCl (20×); (C) 400 mmol/L NaCl (20×).
Figure 8.
Microstructures of leaves treated with different concentrations of NaCl-stress treatments (20×). (A) CK (20×); (B) 200 mmol/L NaCl (20×); (C) 400 mmol/L NaCl (20×).

Figure 9.
Local microstructure of leaves treated with different concentrations of NaCl-stress treatments (40×). (A–C) Microstructures of leaf vascular bundles: (A) under natural condition (40×); (B) in leaves treated with 200 mmol/L NaCl (40×); (C) in leaves treated with 400 mmol/L NaCl (40×). (D–F) Microstructures of leaf palisade tissues: (D) under natural condition (40×); (E) in leaves treated with 200 mmol/L NaCl (40×); (F) in leaves treated with 400 mmol/L NaCl (40×). (G–I) Microstructures of leaf sponges: (G) under natural conditions (40×); (H) treated with 200 mmol/L NaCl (40×); (I) treated with 400 mmol/L NaCl (40×).

Figure 10.
Microstructures of stems treated with different concentrations of NaCl-stress treatments. (A) CK (4×); (B) 200 mmol/L NaCl (4×); (C) 400 mmol/L NaCl (4×).
Figure 10.
Microstructures of stems treated with different concentrations of NaCl-stress treatments. (A) CK (4×); (B) 200 mmol/L NaCl (4×); (C) 400 mmol/L NaCl (4×).

Figure 11.
Local microstructures of P. talassica × P. euphratica stems treated with different concentrations of NaCl-stress treatments. (A) Microscopic local structure of natural stems (×10); (B) Microscopic local structure of the stems under 200 mmol/L NaCl-stress treatment (×10); (C) Microscopic local structure of the stem under 400 mmol/L NaCl-stress treatment (×10); (D) Microstructure of the phloem of the stems in the natural state (×20); (E) Microstructure of the phloem of the stems under 200 mmol/L NaCl-stress treatment (×20); (F) Microstructure of the phloem of the stems under 400 mmol/L NaCl-stress treatment (×20); (G) Natural stem pith microstructure (×10); (H) Stem pith microstructure under 200 mmol/L NaCl-stress treatment (×10); (I) Stem pith microstructure under 400 mmol/L NaCl-stress treatment (×10); (J) Microstructure of natural stems phloem fibers (×40); (K) Microstructure of stems phloem fibres under 200 mmol/L NaCl-stress treatment (×40); (L) Microstructure of stem phloem fibres under 400 mmol/L NaCl-stress treatment (×40).

Figure 12.
Microstructural characteristics of P. talassica × P. euphratica secondary root structures under different concentrations of NaCl-stress treatments. (A) CK (4×); (B) 200 mmol/L NaCl (4×); (C) 400 mmol/L NaCl (4×).
Figure 12.
Microstructural characteristics of P. talassica × P. euphratica secondary root structures under different concentrations of NaCl-stress treatments. (A) CK (4×); (B) 200 mmol/L NaCl (4×); (C) 400 mmol/L NaCl (4×).

Figure 13.
Microstructural characteristics of P. talassica × P. euphratica secondary root structures under different concentrations of NaCl-stress treatments. (A) Local microstructure of natural roots (×10); (B) Local root microstructure under 200 mmol/L NaCl-stress treatment (×10); (C) Local root microstructure under 400 mmol/L NaCl-stress treatment (×10); (D) Microstructure of natural root xylem (×10); (E) Root xylem microstructure under 200 mmol/L NaCl-stress treatment (×10); (F) Root xylem microstructure under 400 mmol/L NaCl-stress treatment (×10); (G) Natural root phloem microstructure (×40); (H) Microscopic structure of root phloem under 200 mmol/L NaCl-stress treatment (×40); (I) Microscopic structure of root phloem under 400 mmol/L NaCl-stress treatment (×40); (J) Natural root phloem fibers microstructure (×40); (K) Root phloem fibers microstructure under 200 mmol/L NaCl-stress treatment (×40); (L) Root phloem fibers microstructure under 400 mmol/L NaCl-stress treatment (×40).


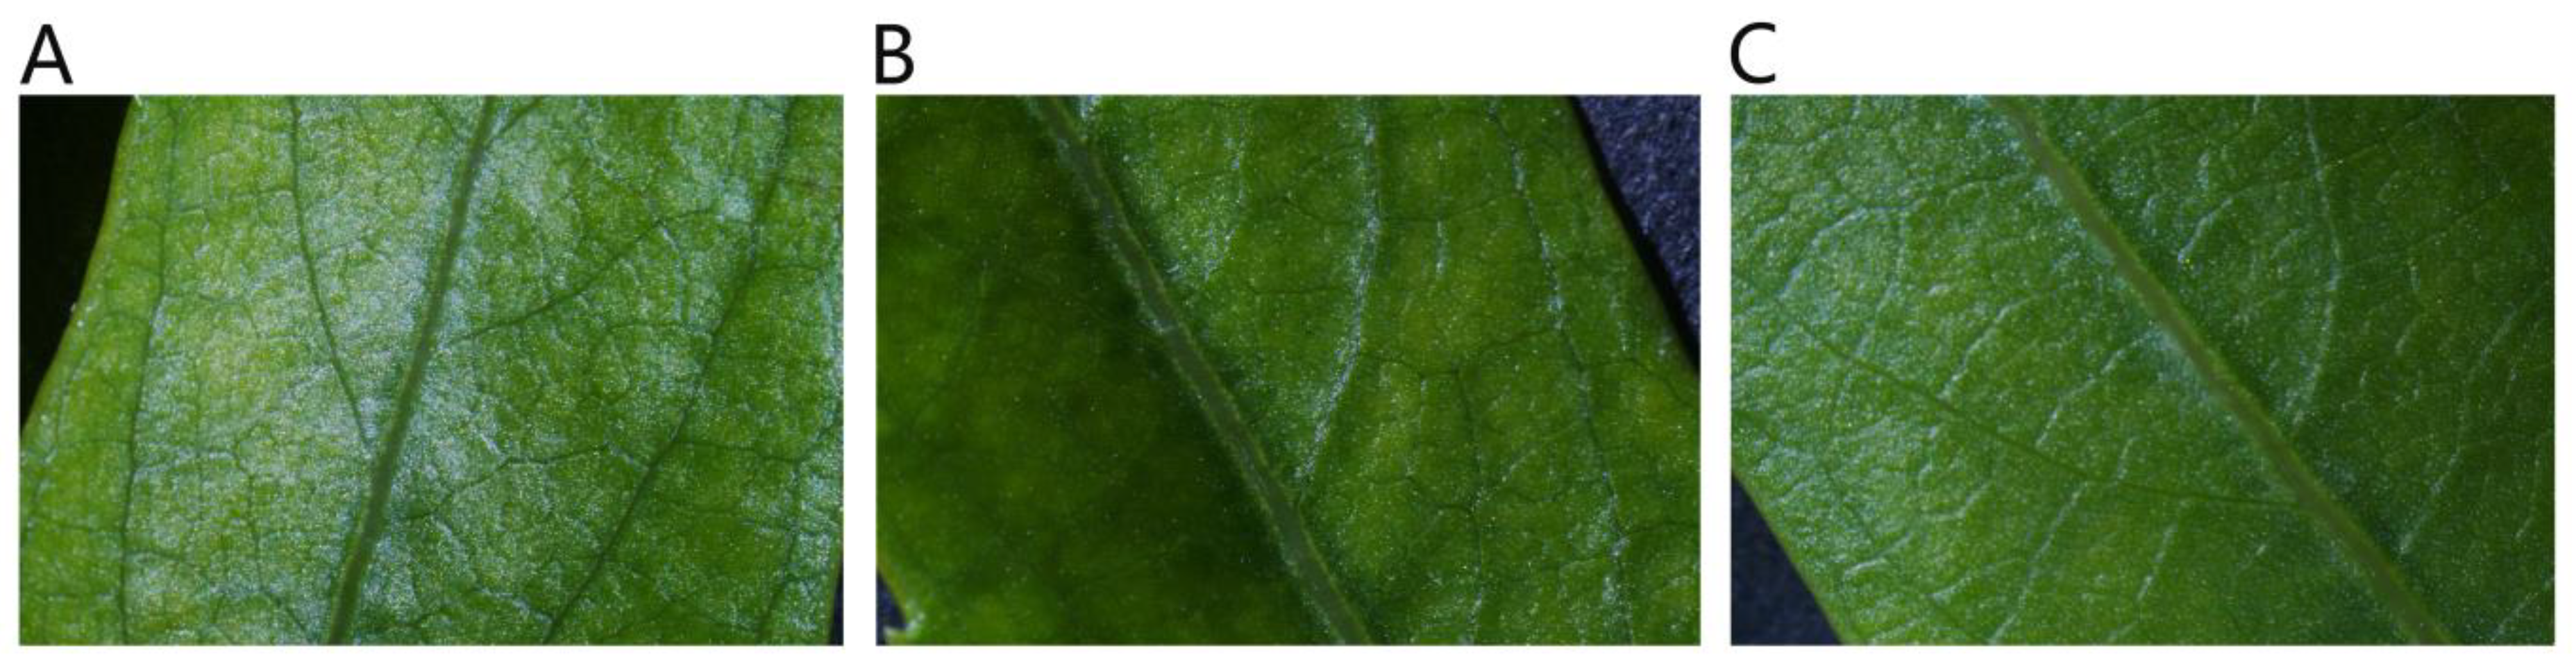
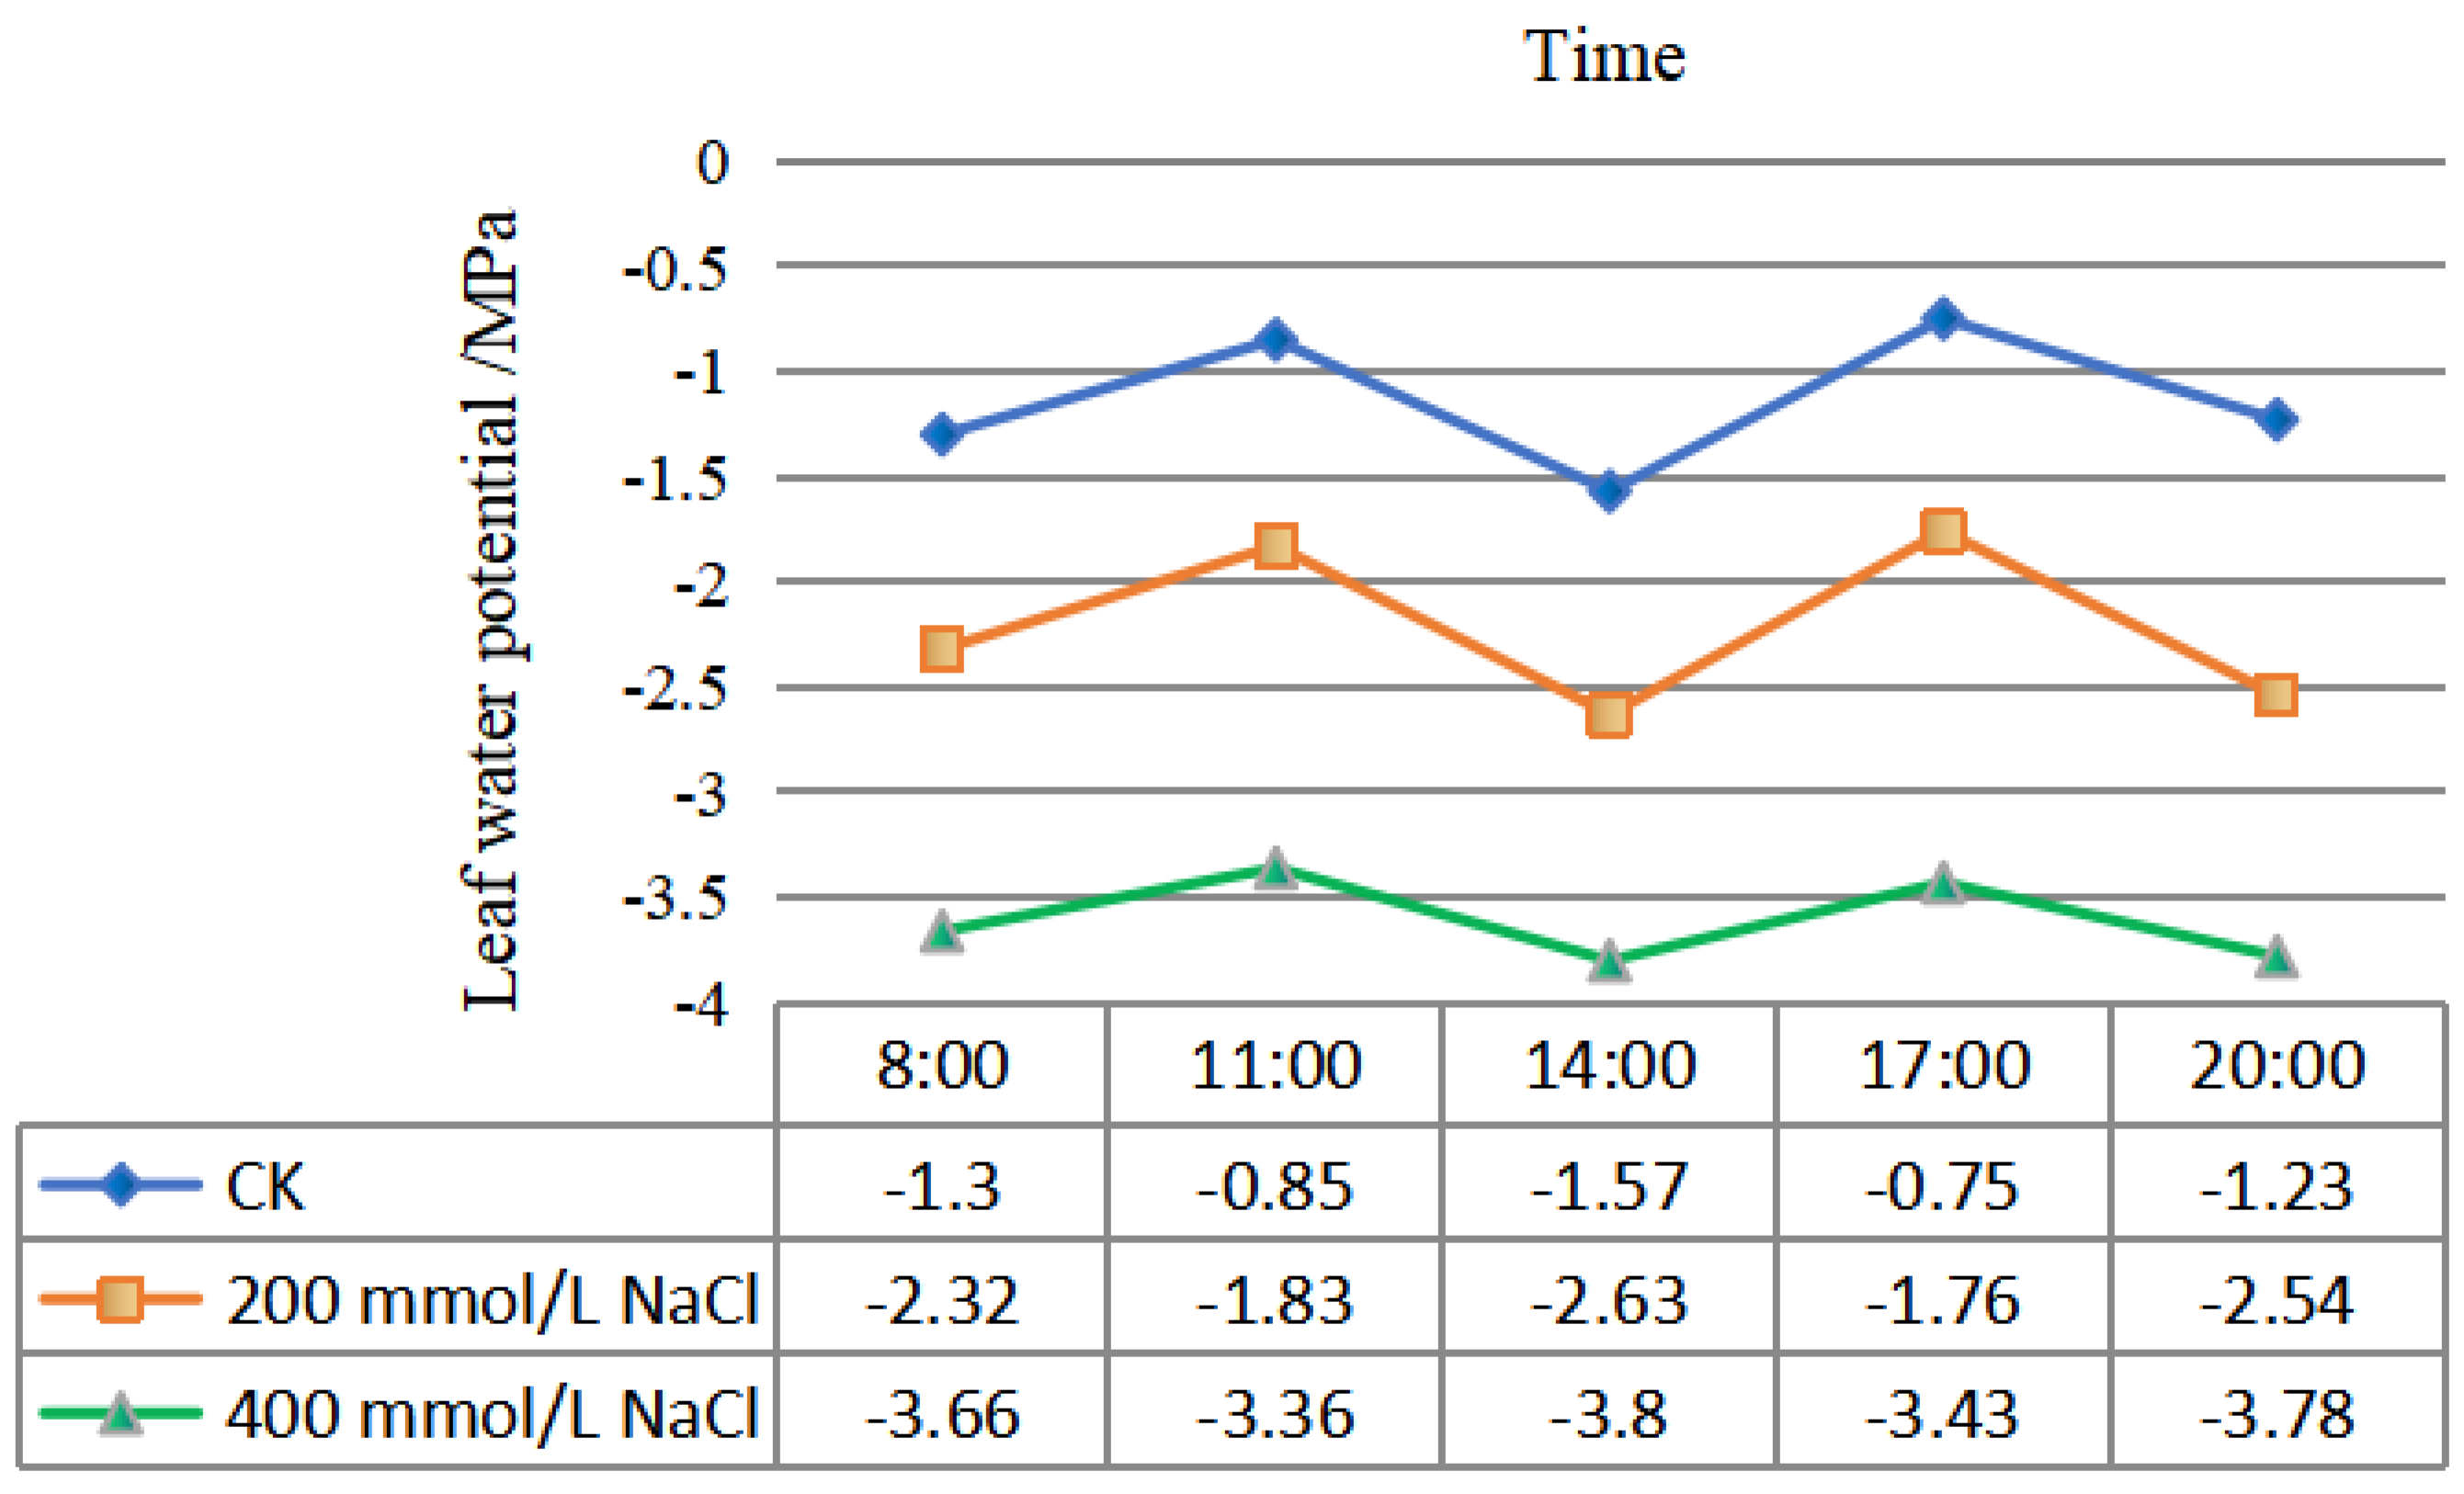
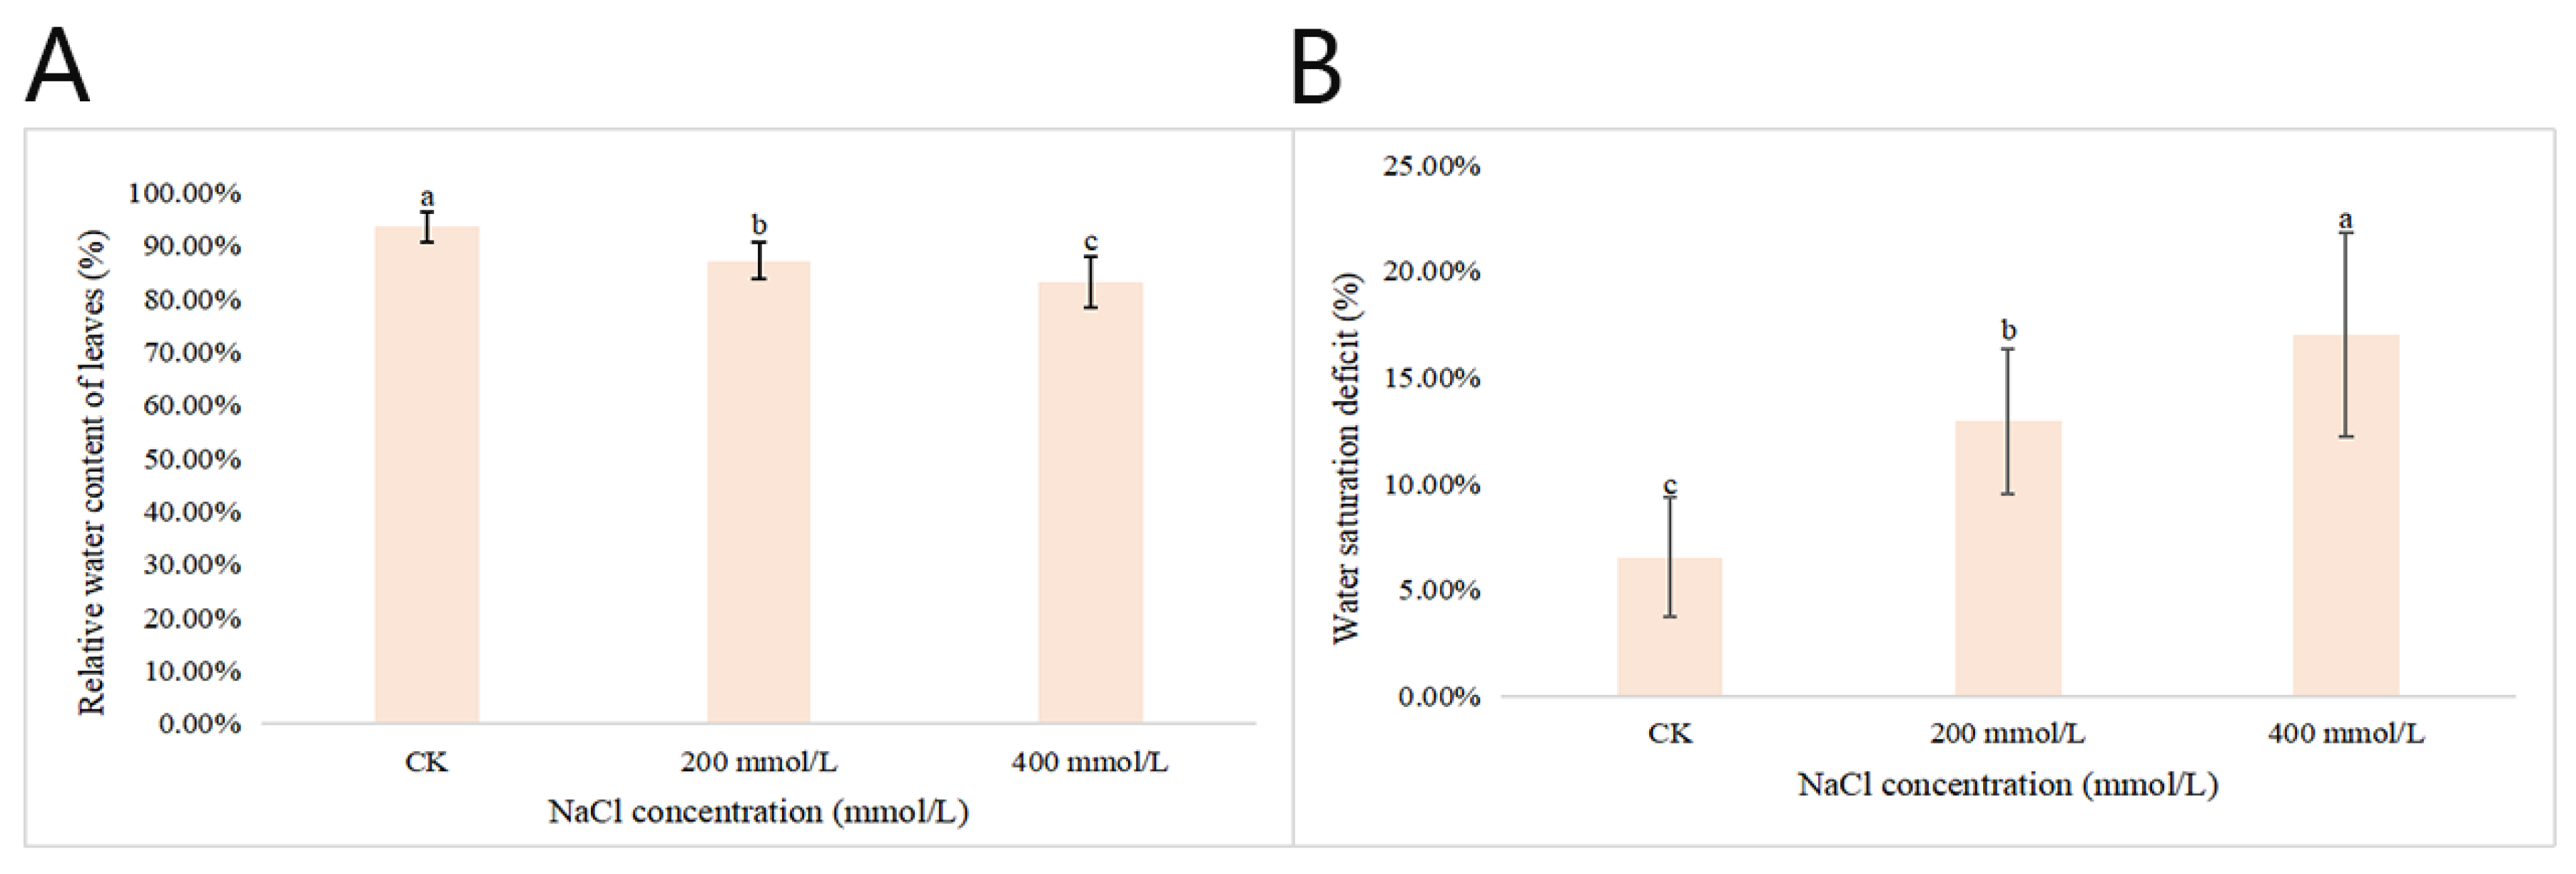
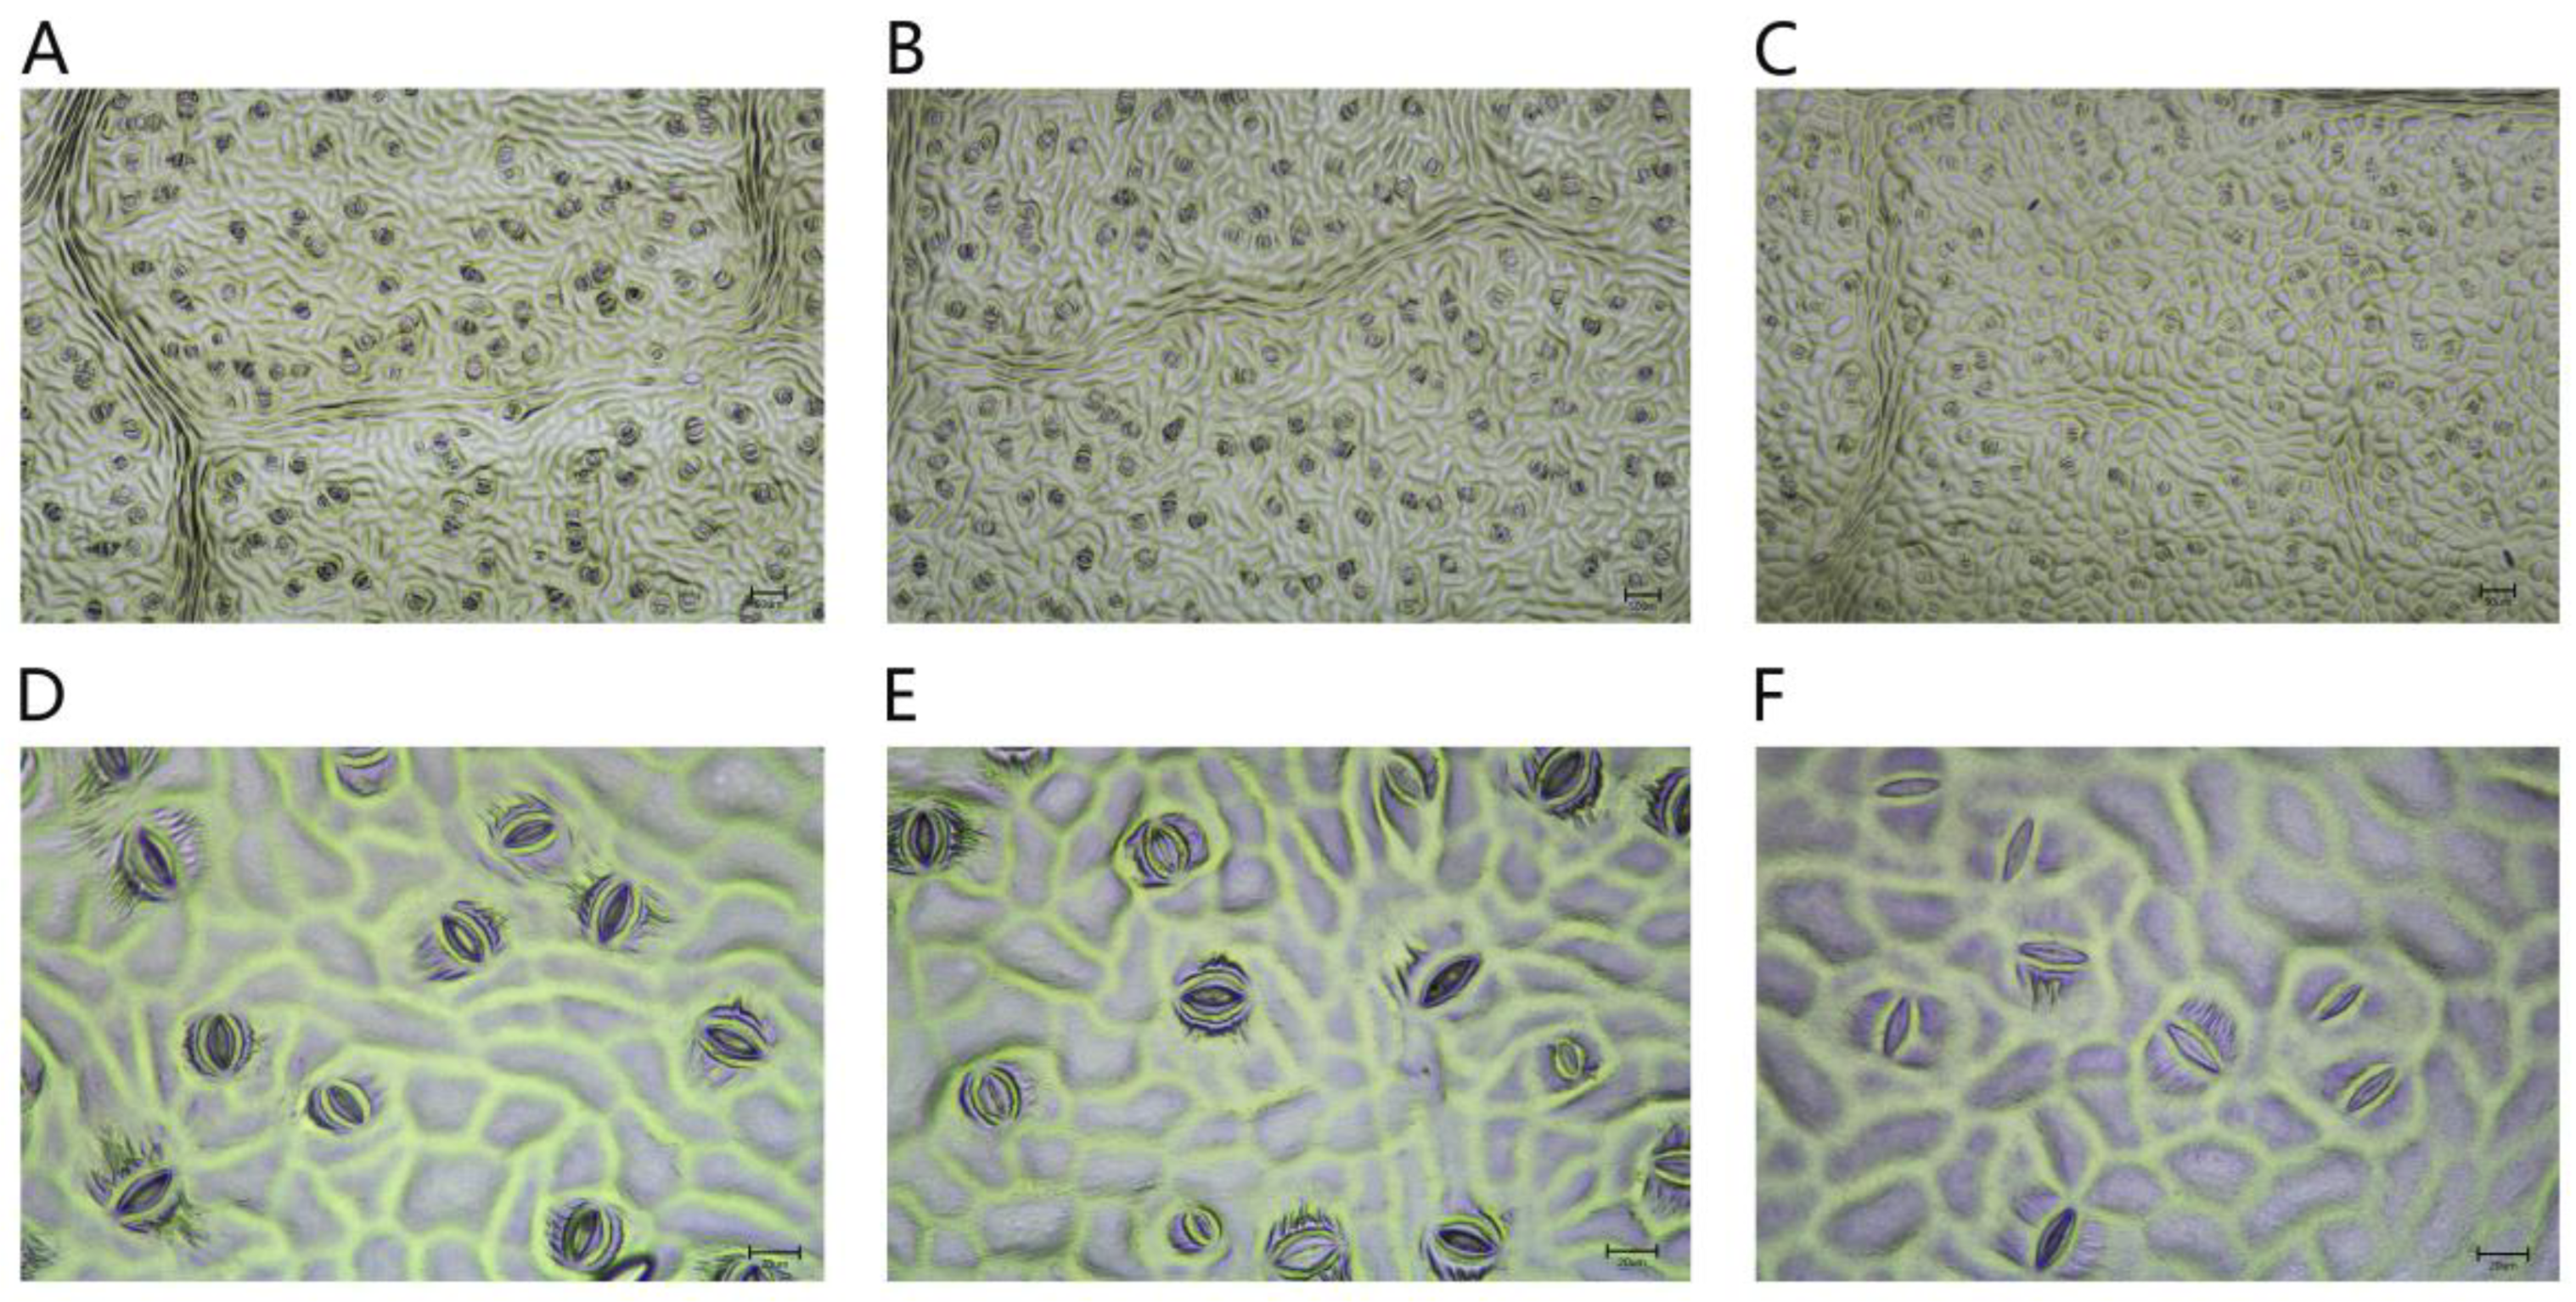
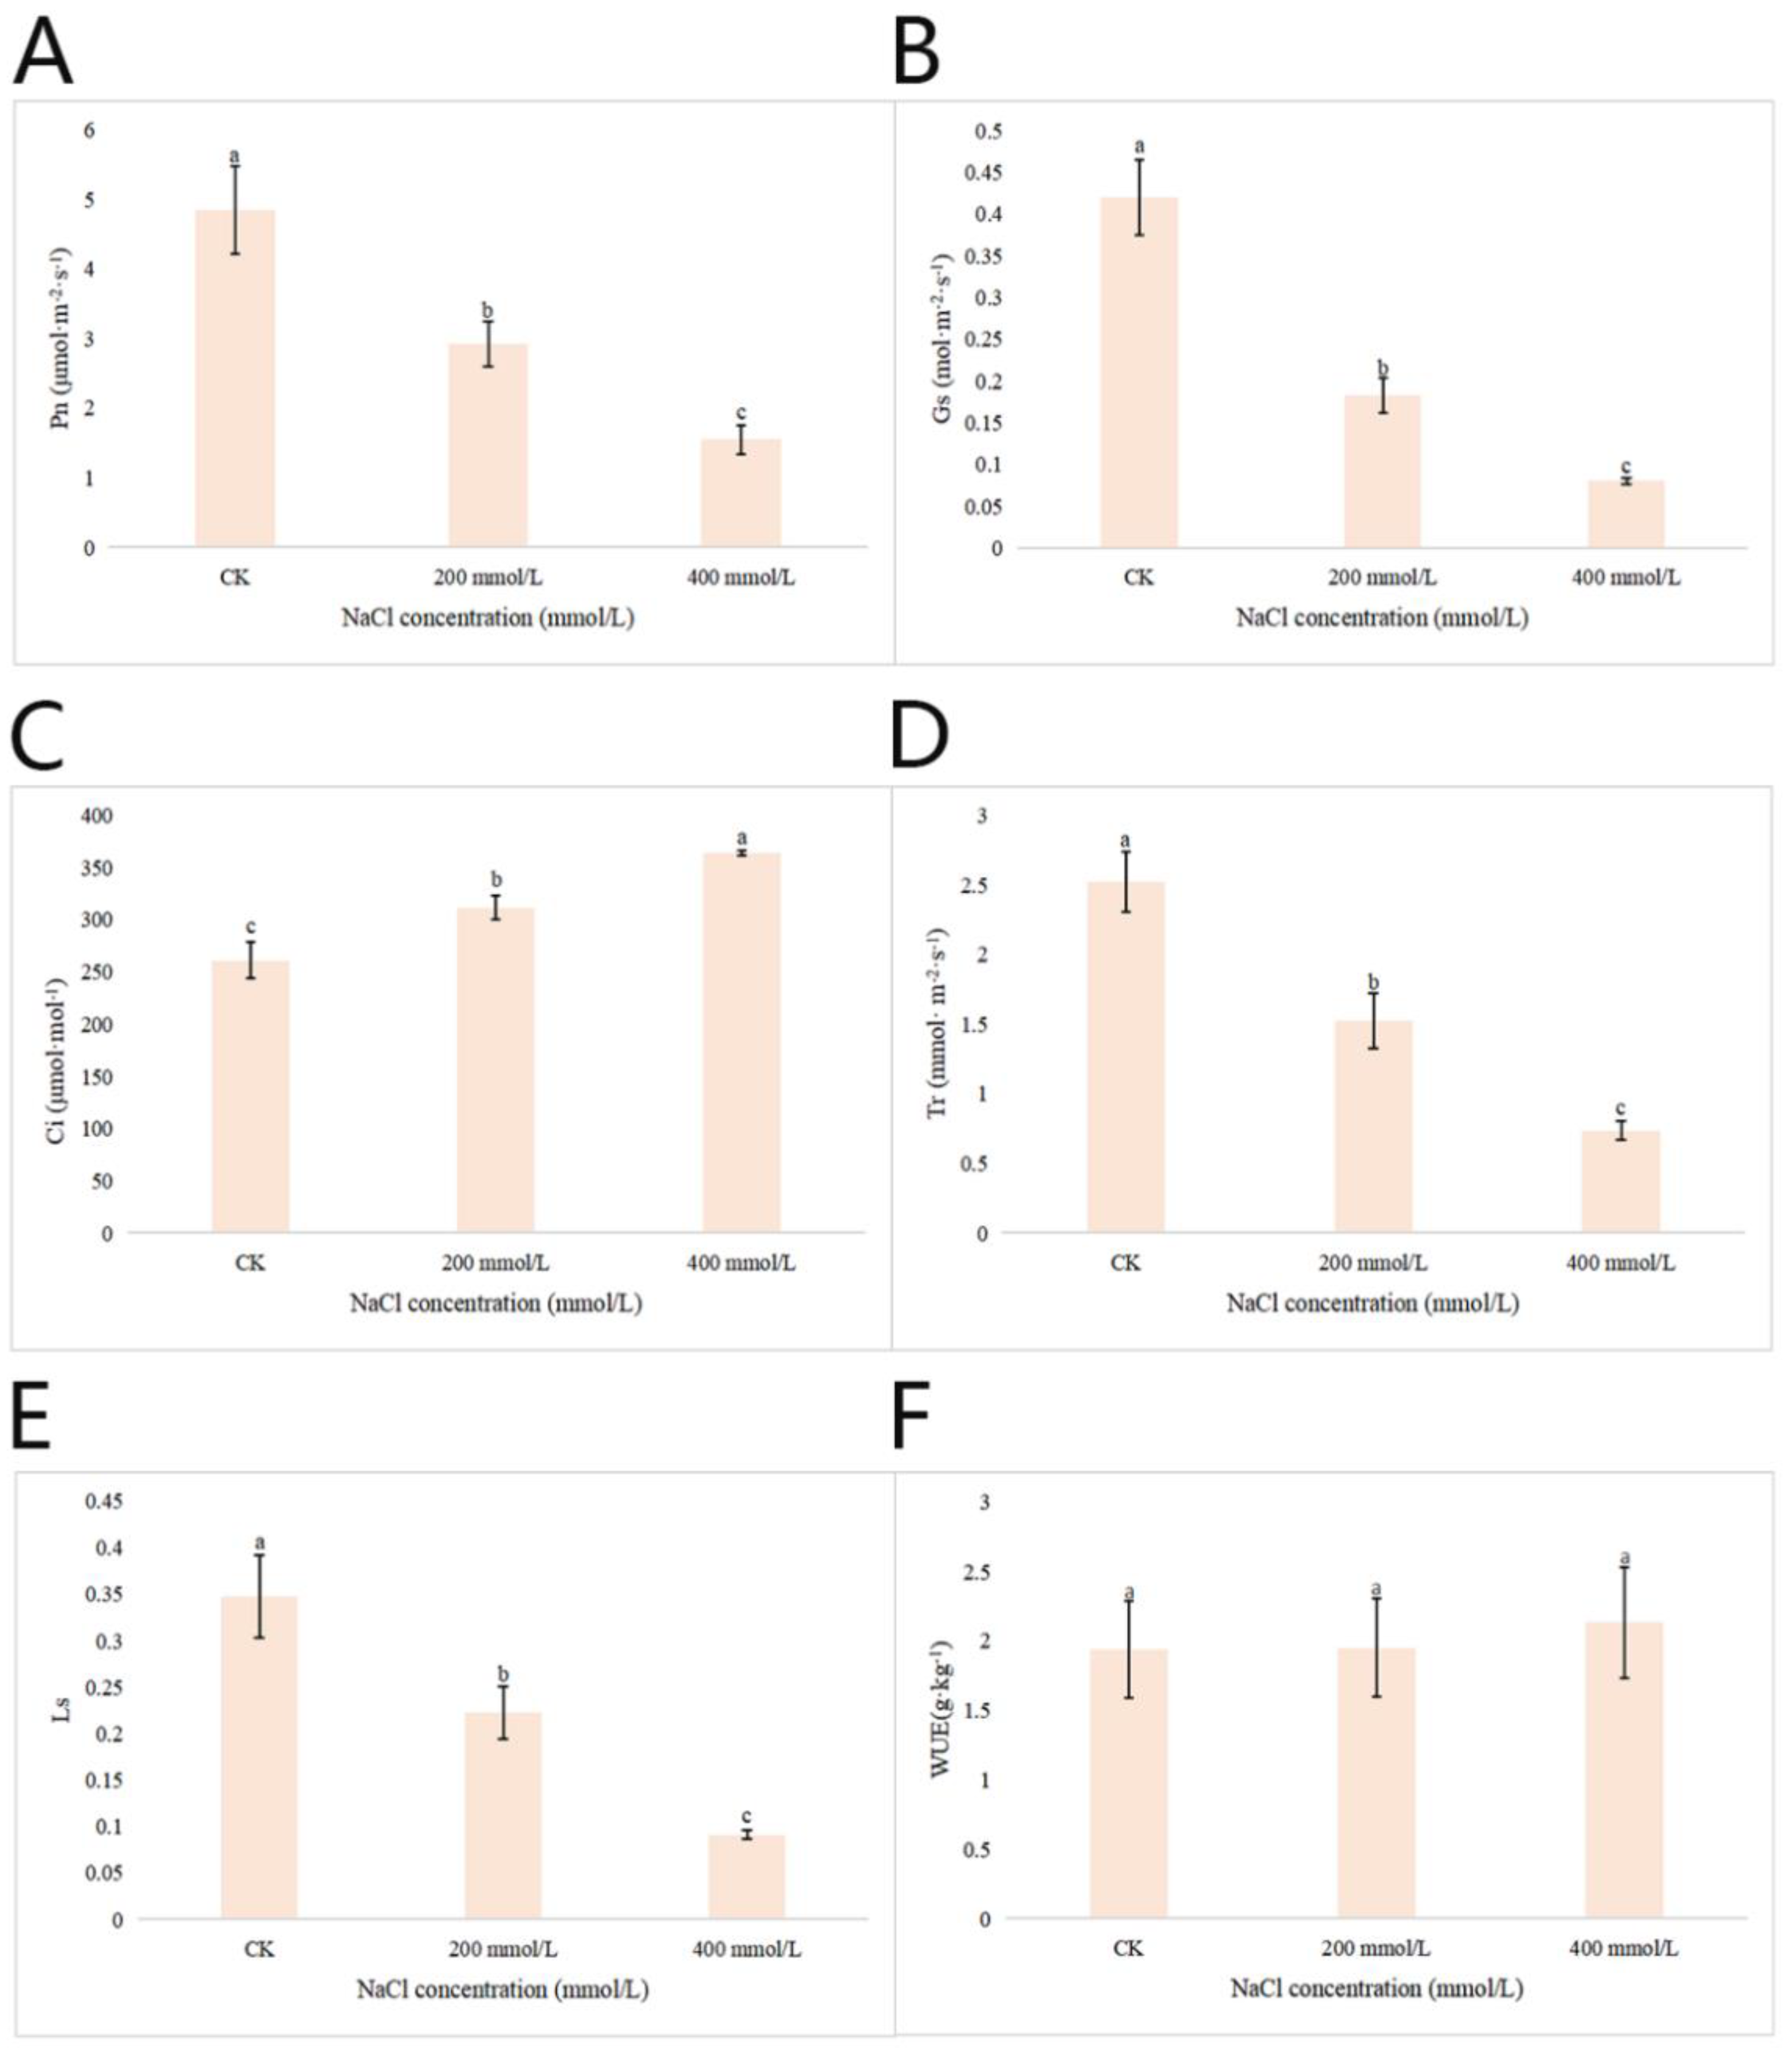
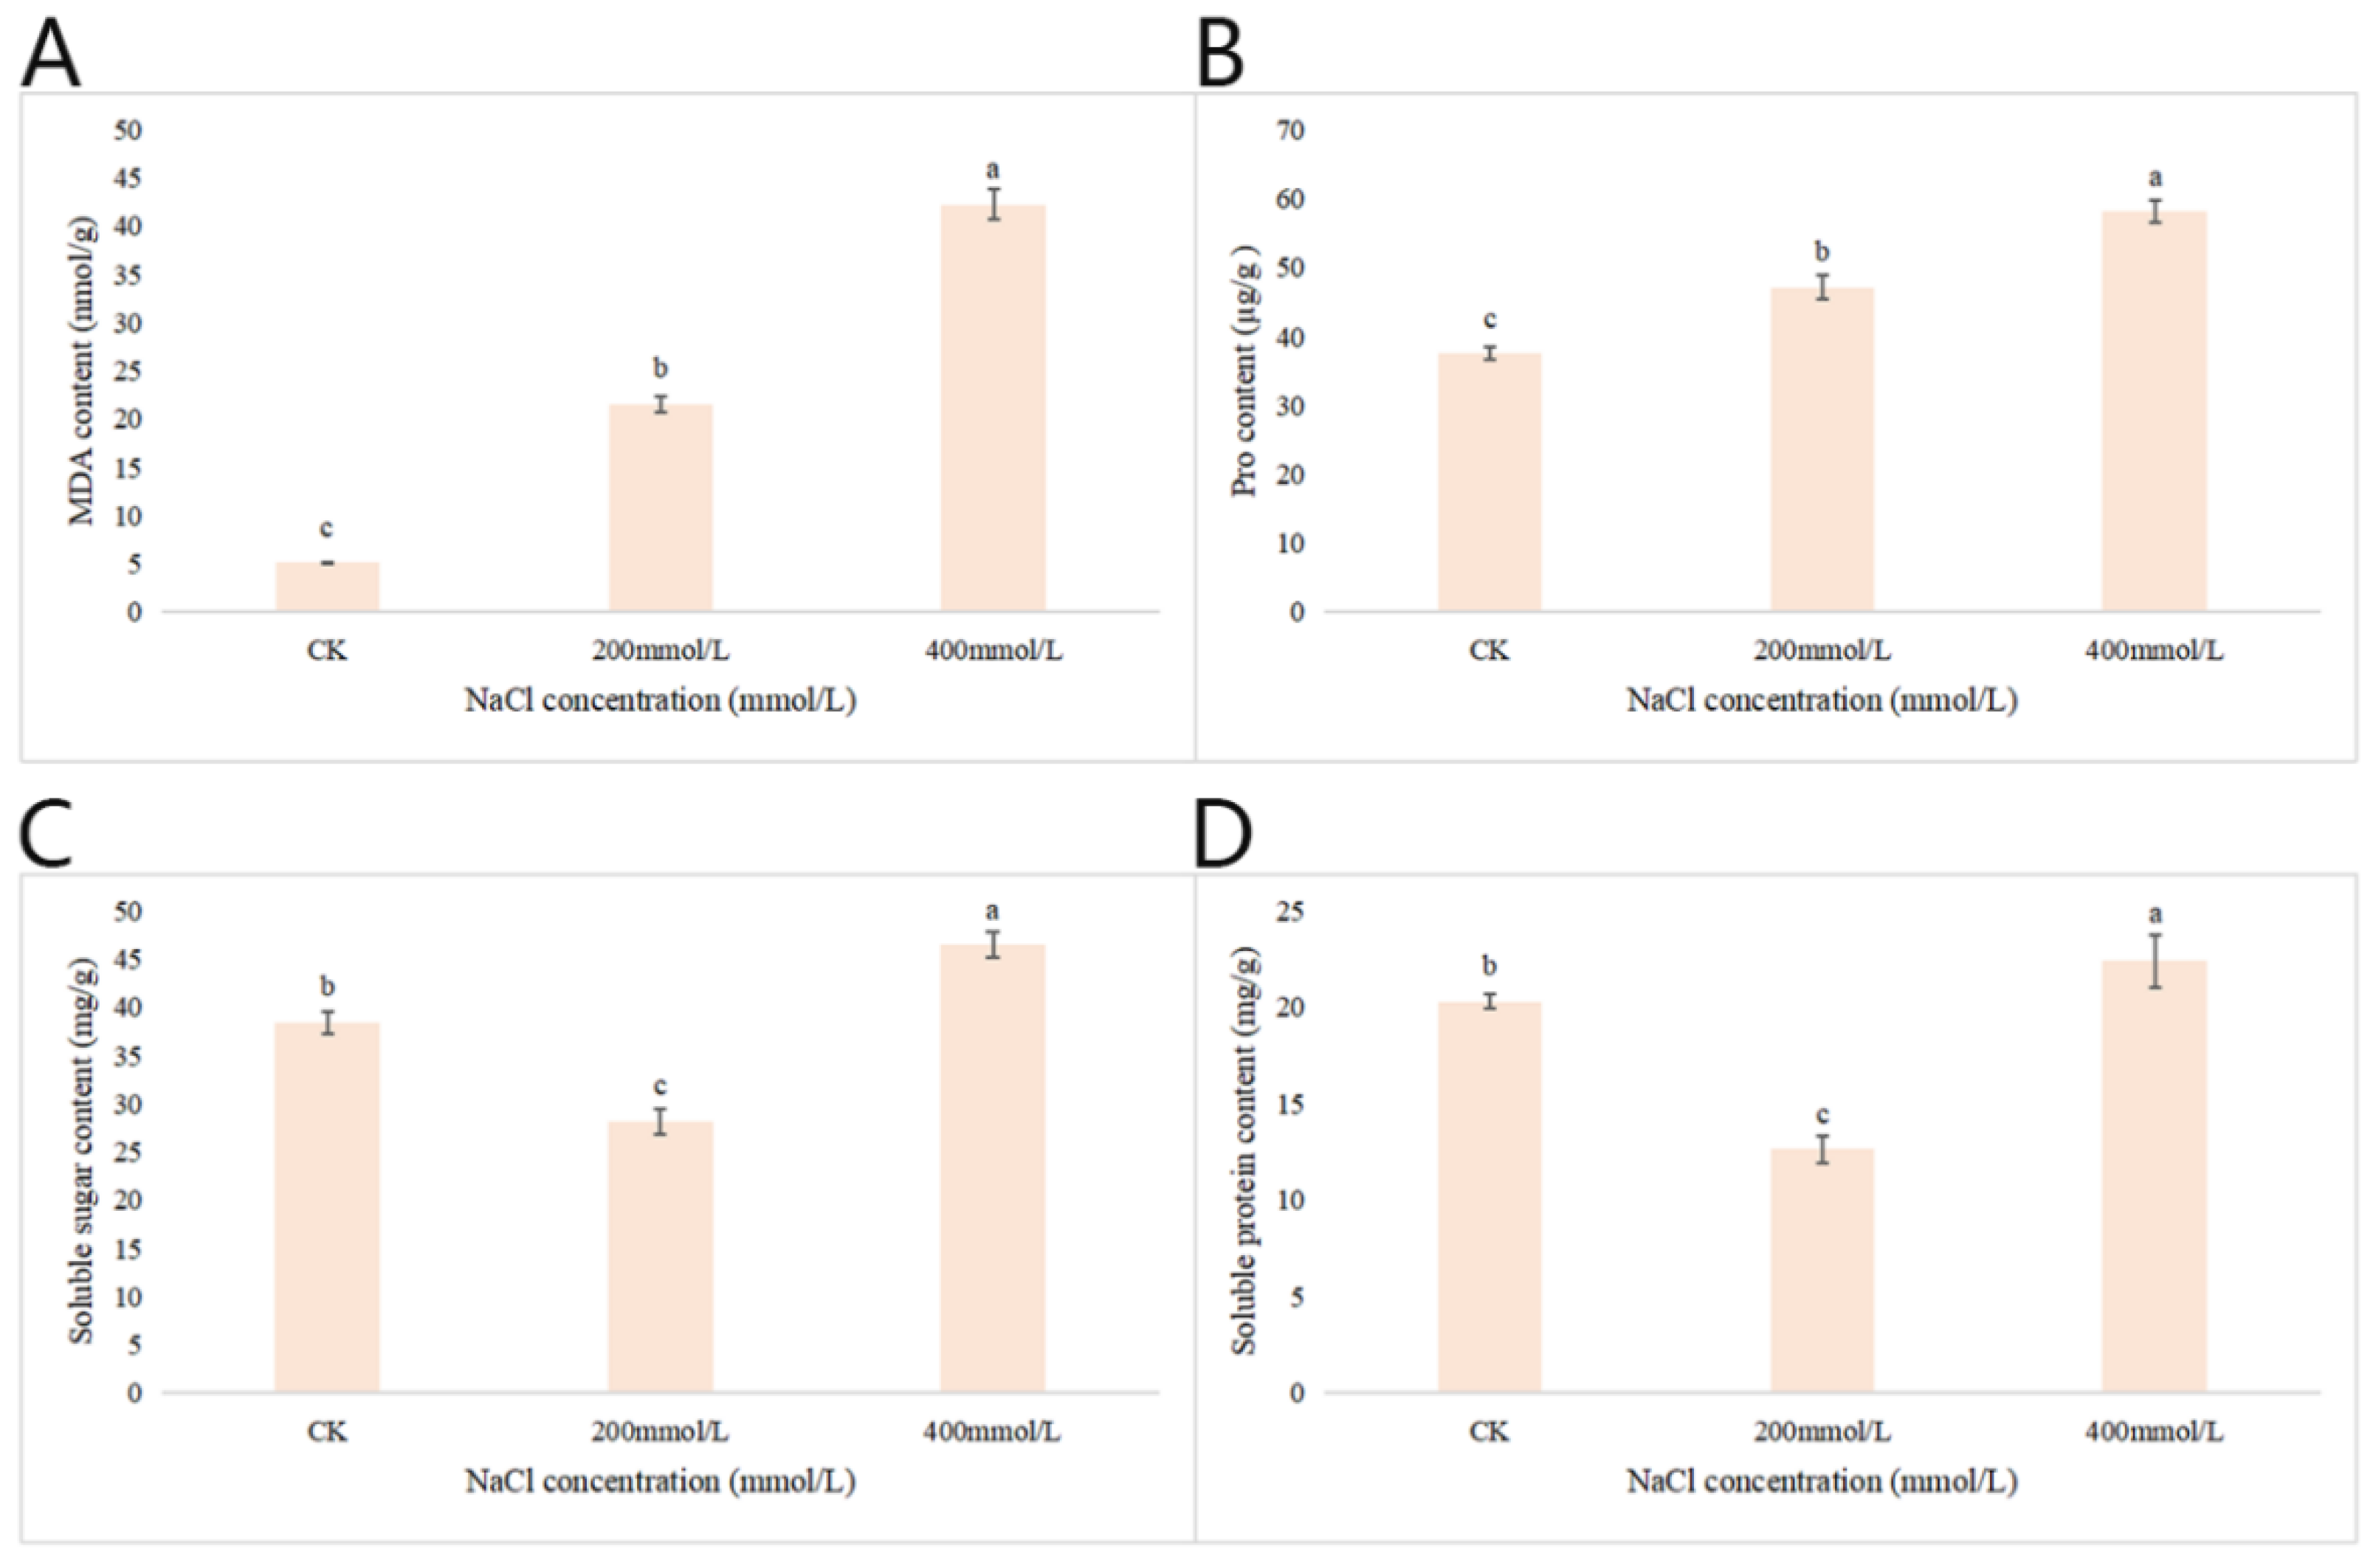
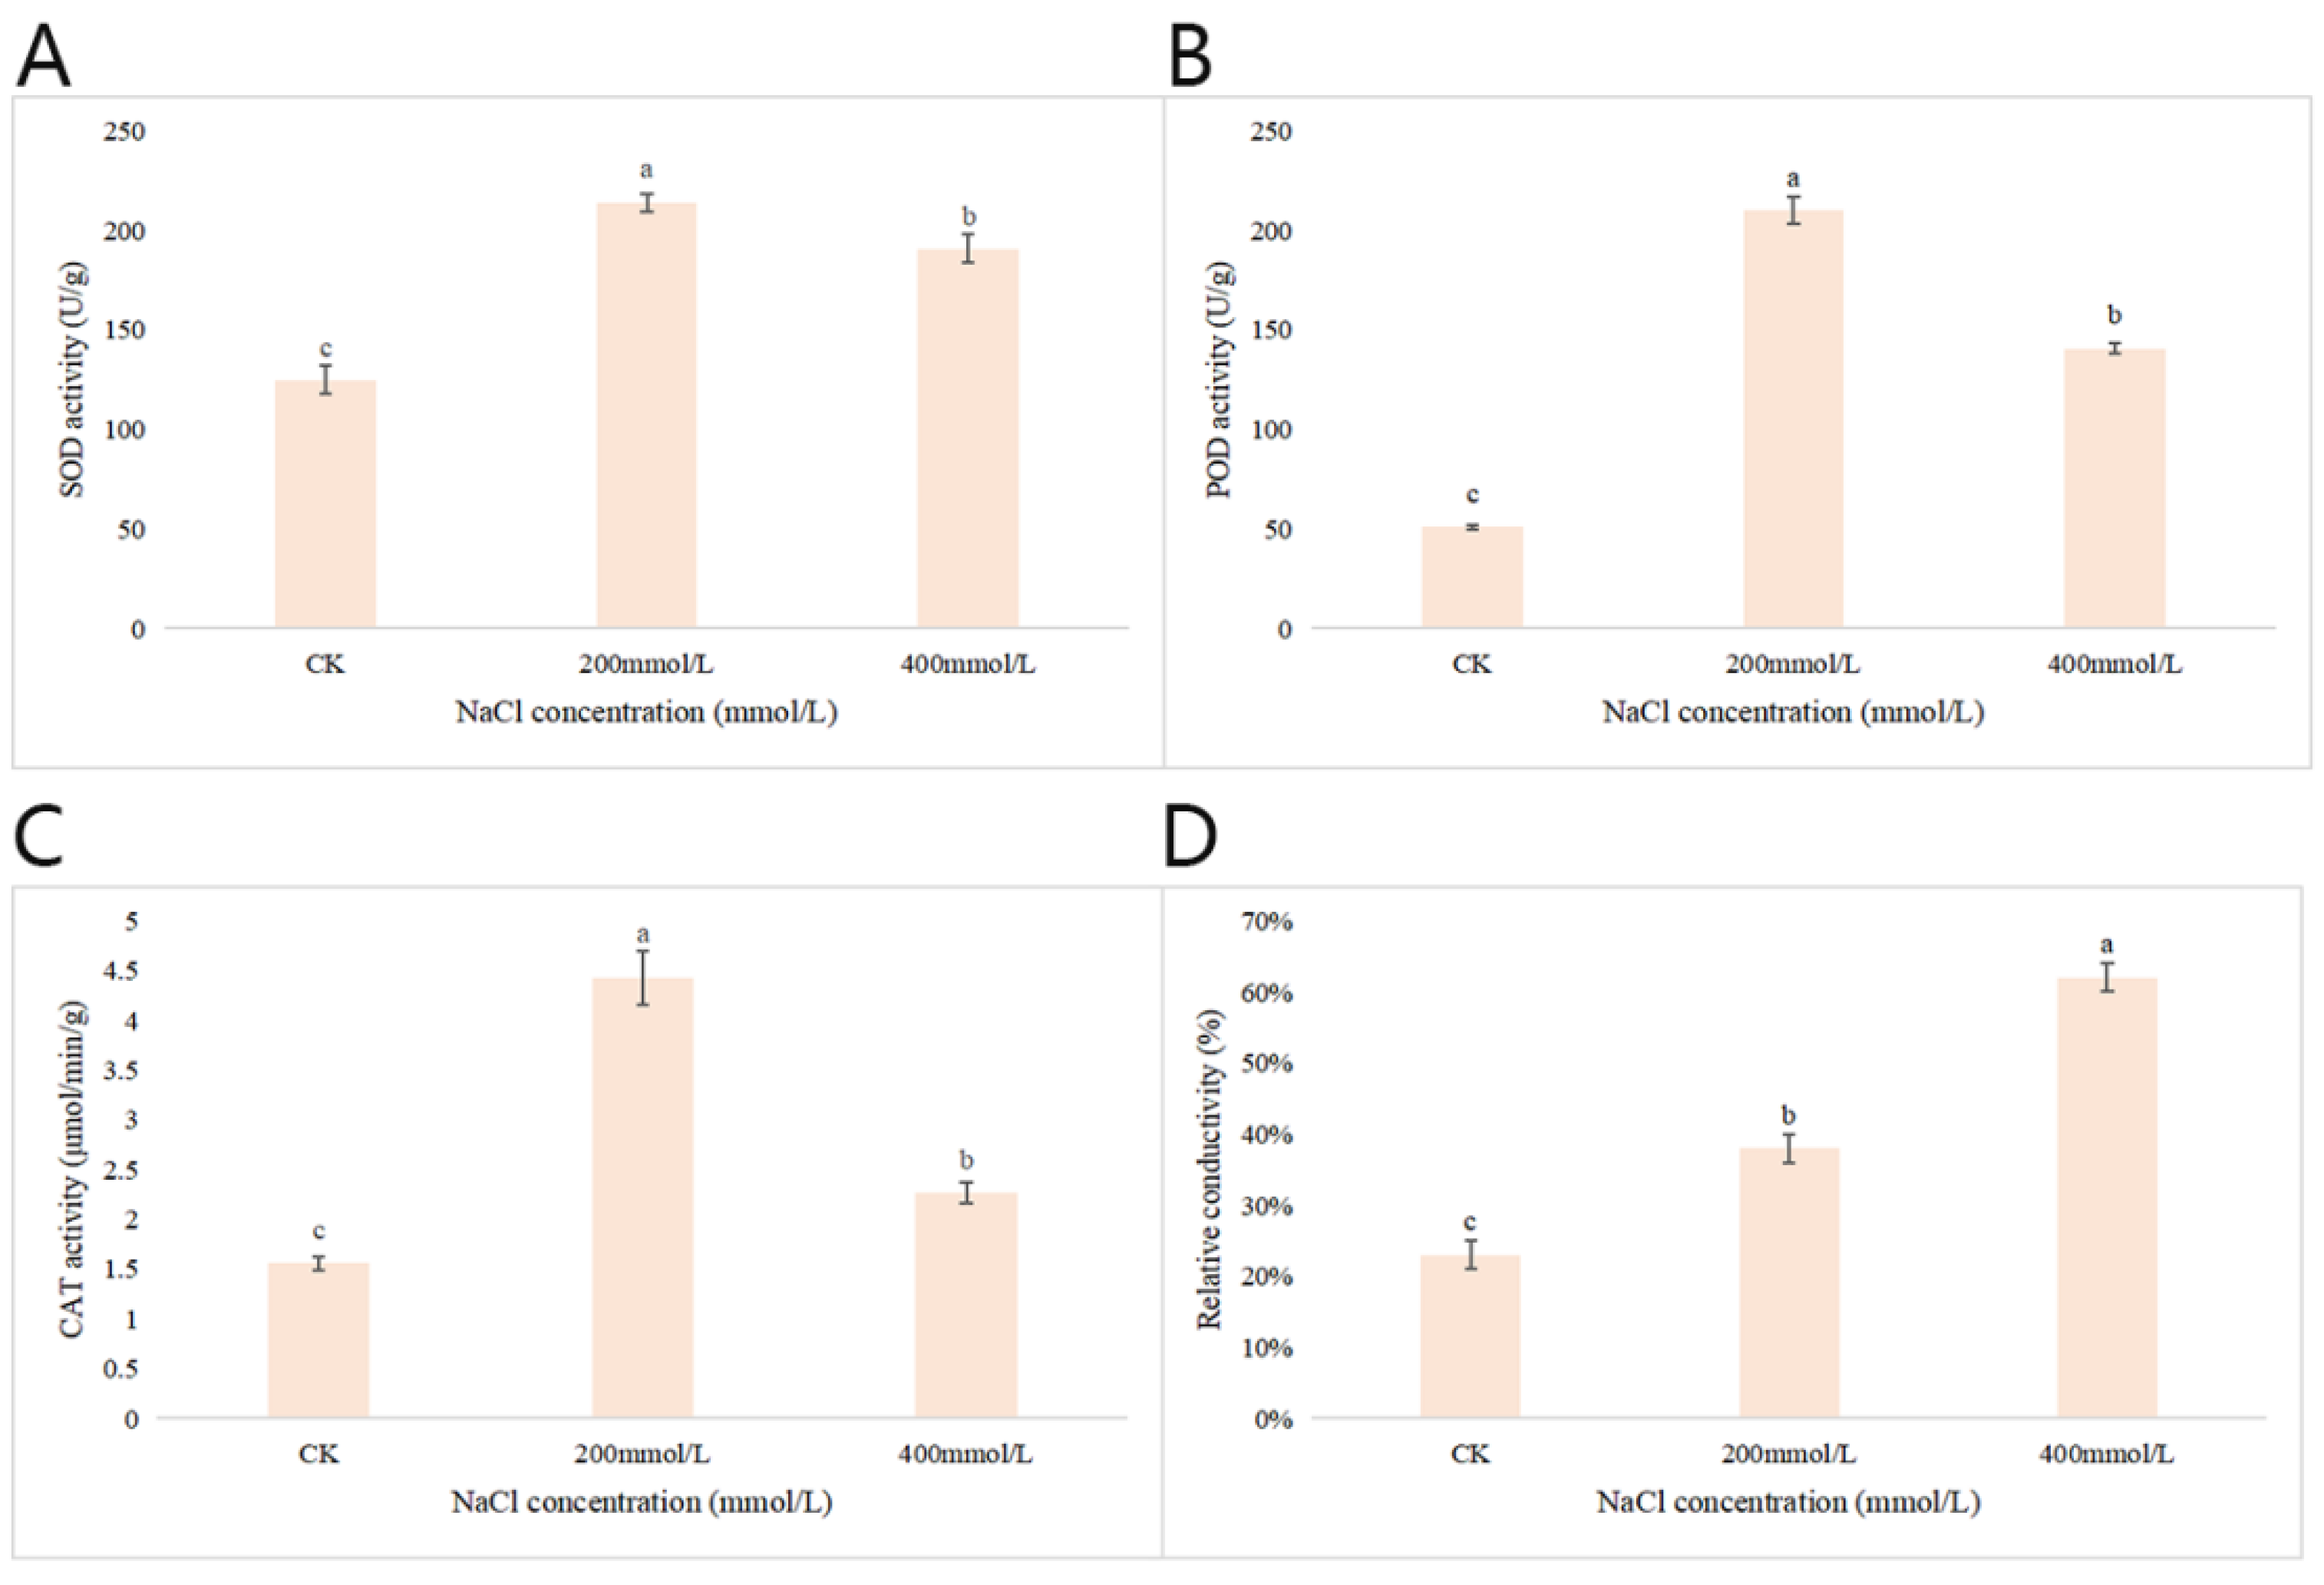
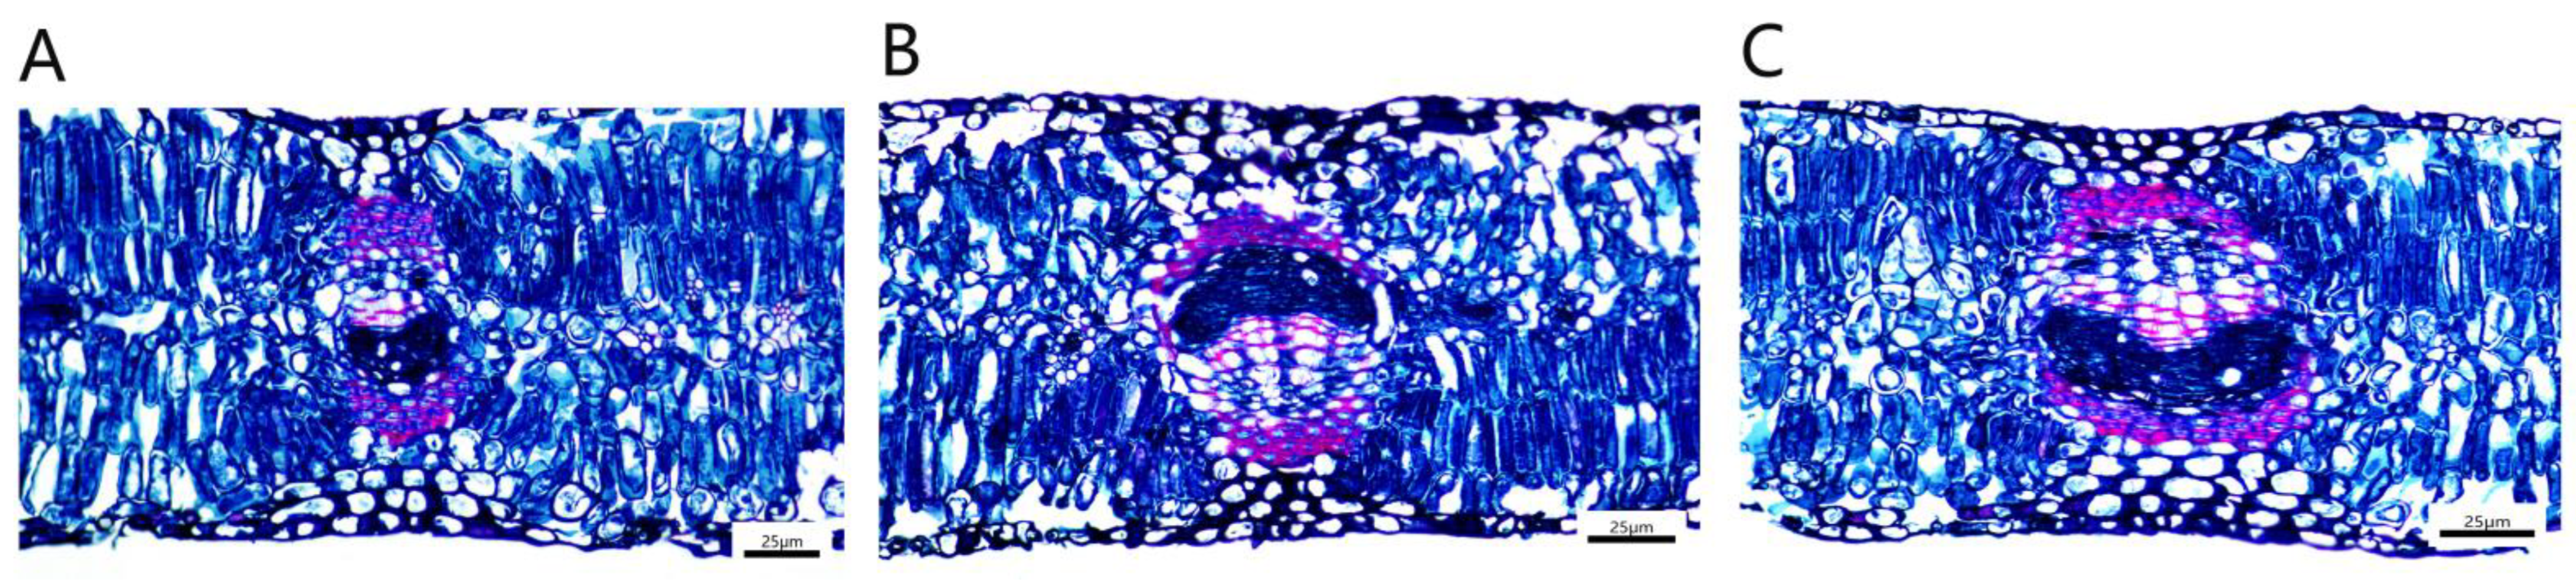
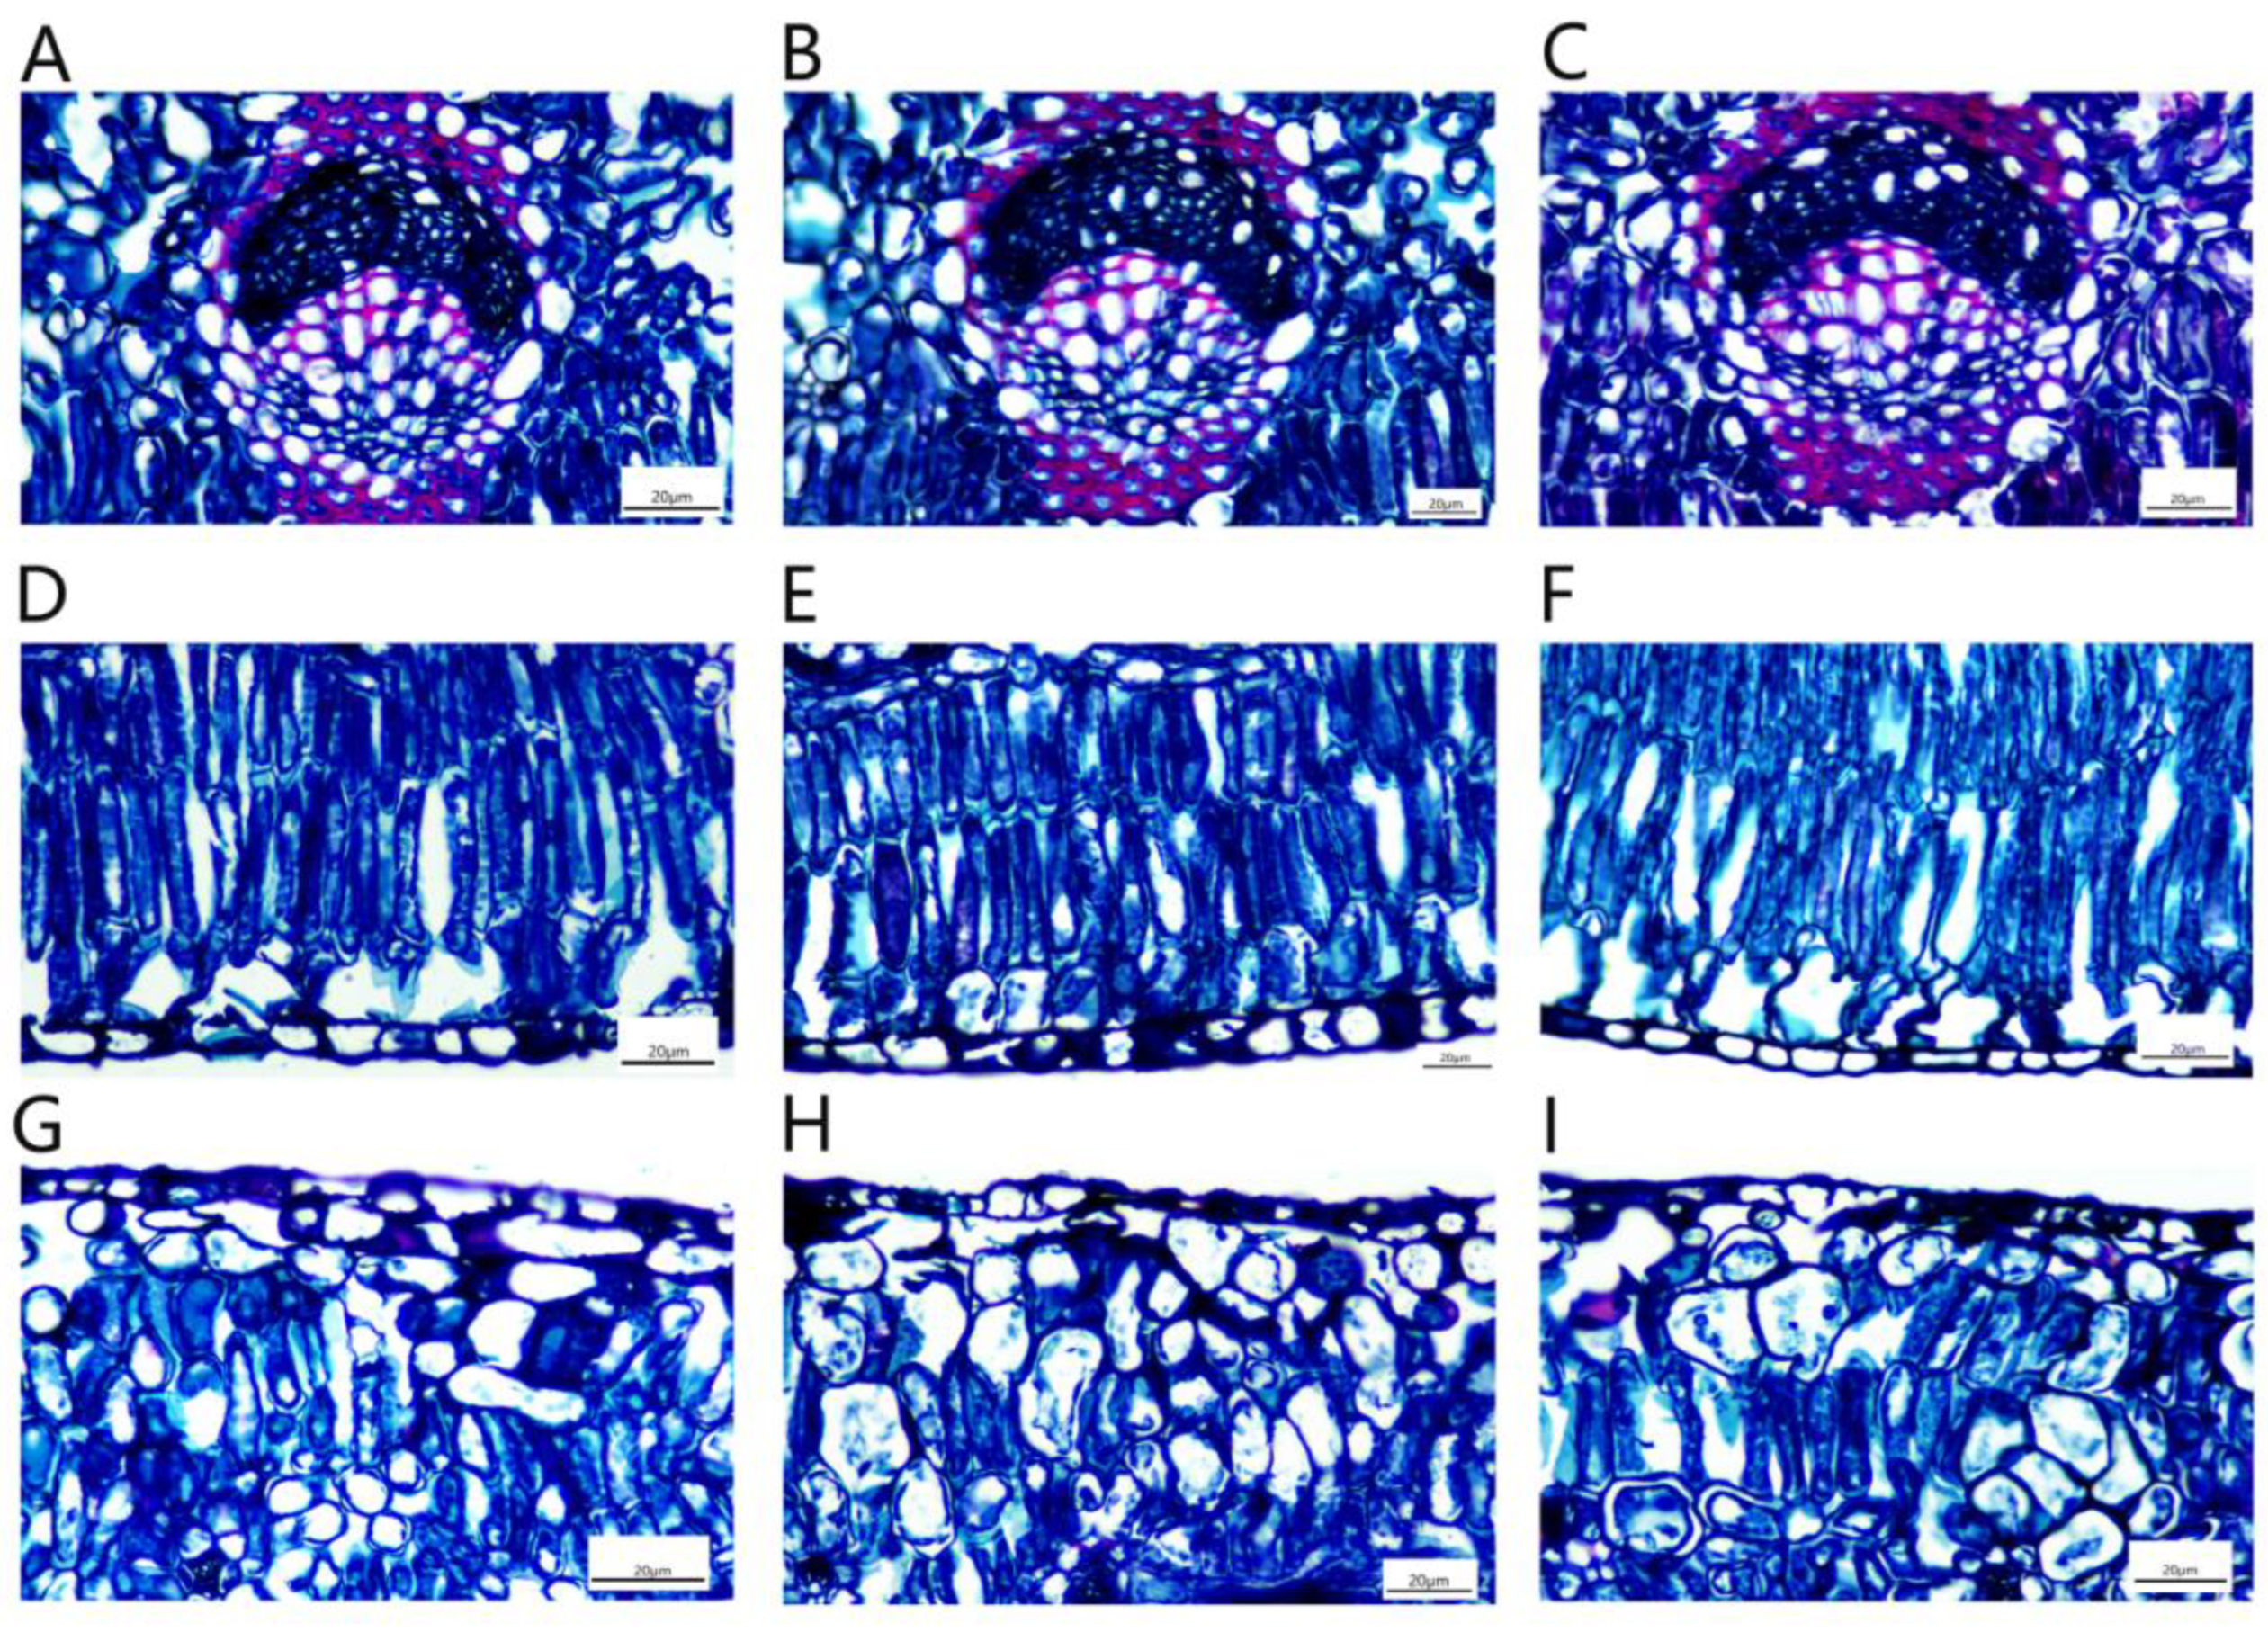
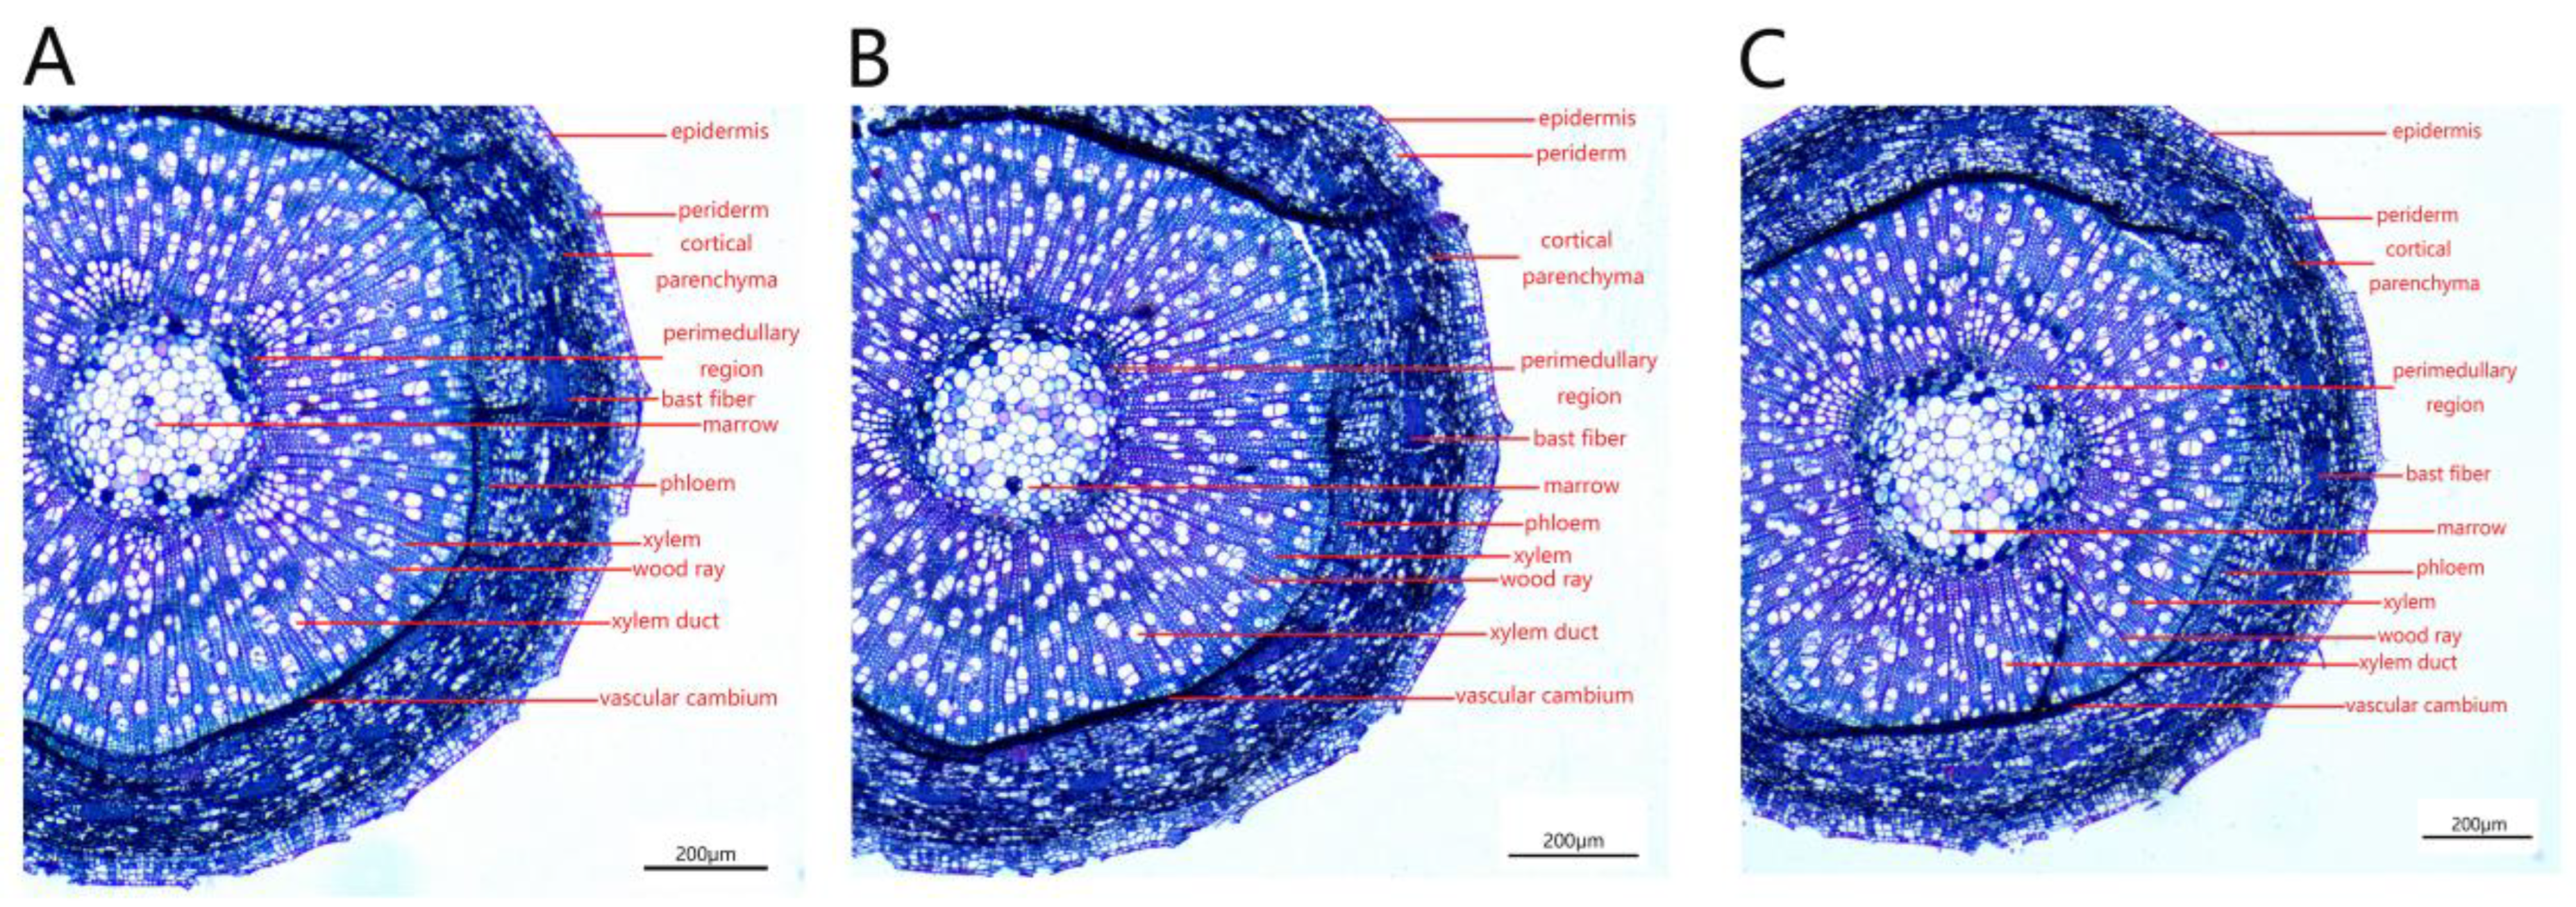
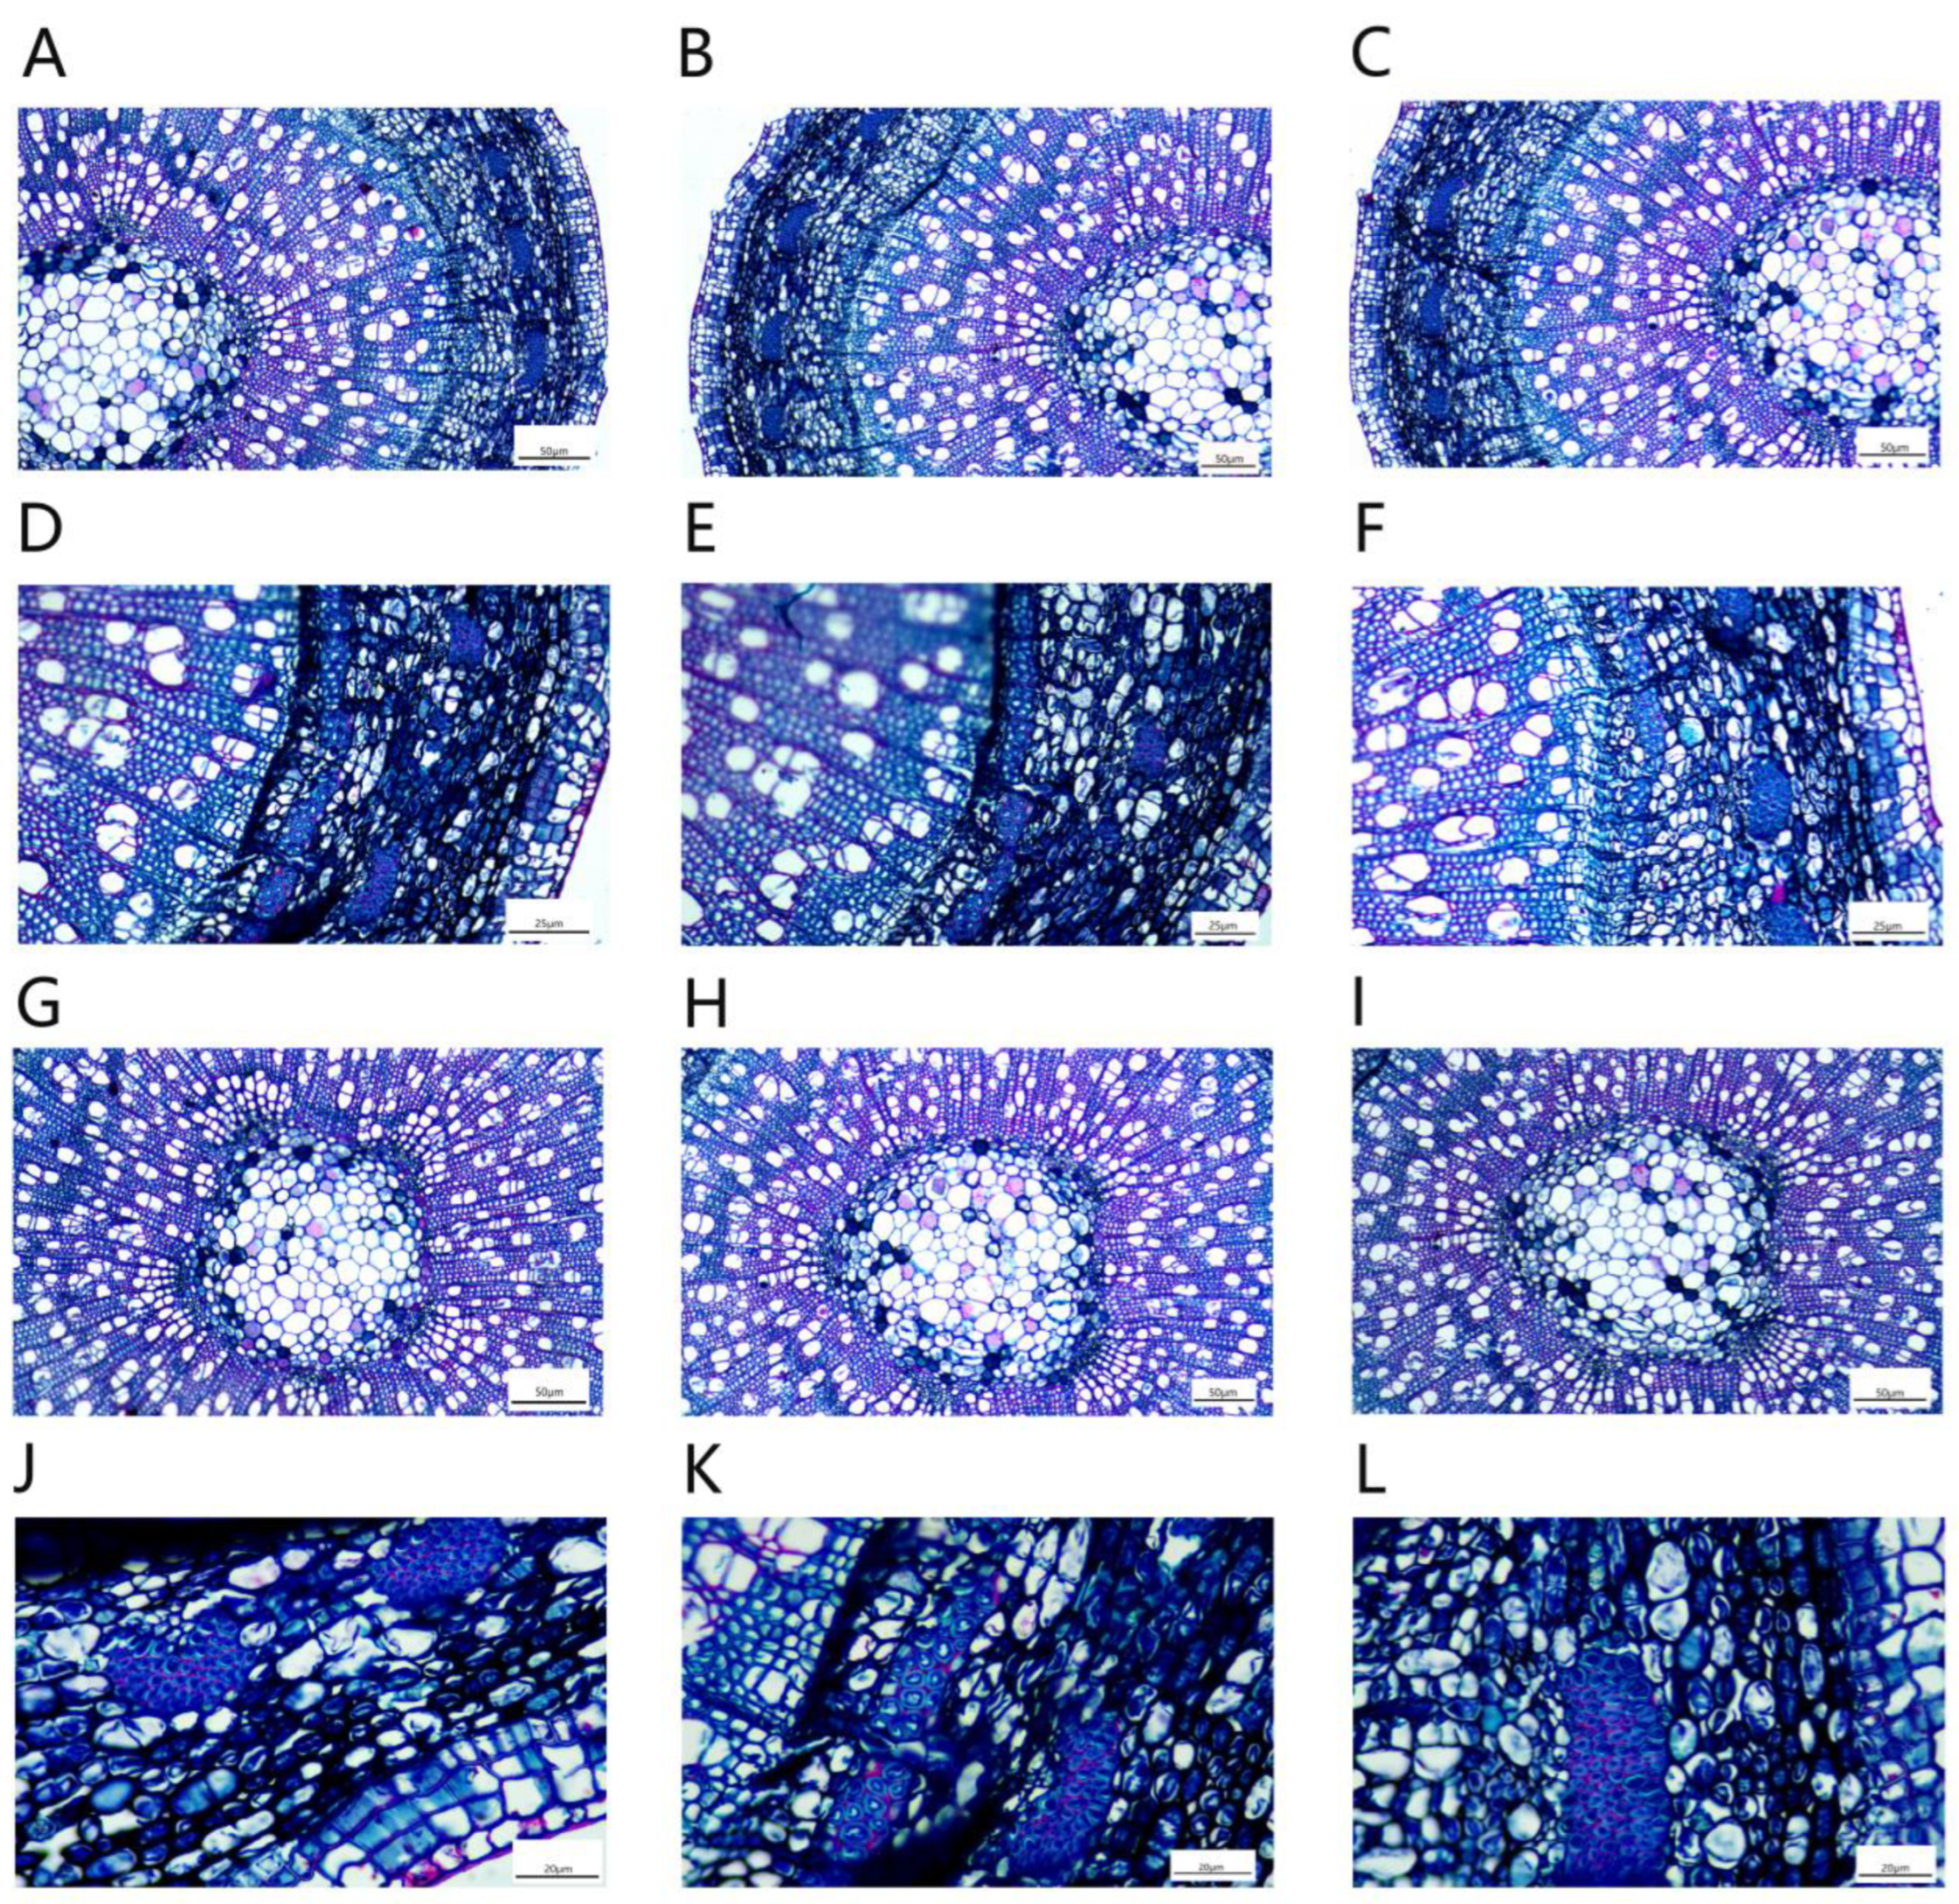
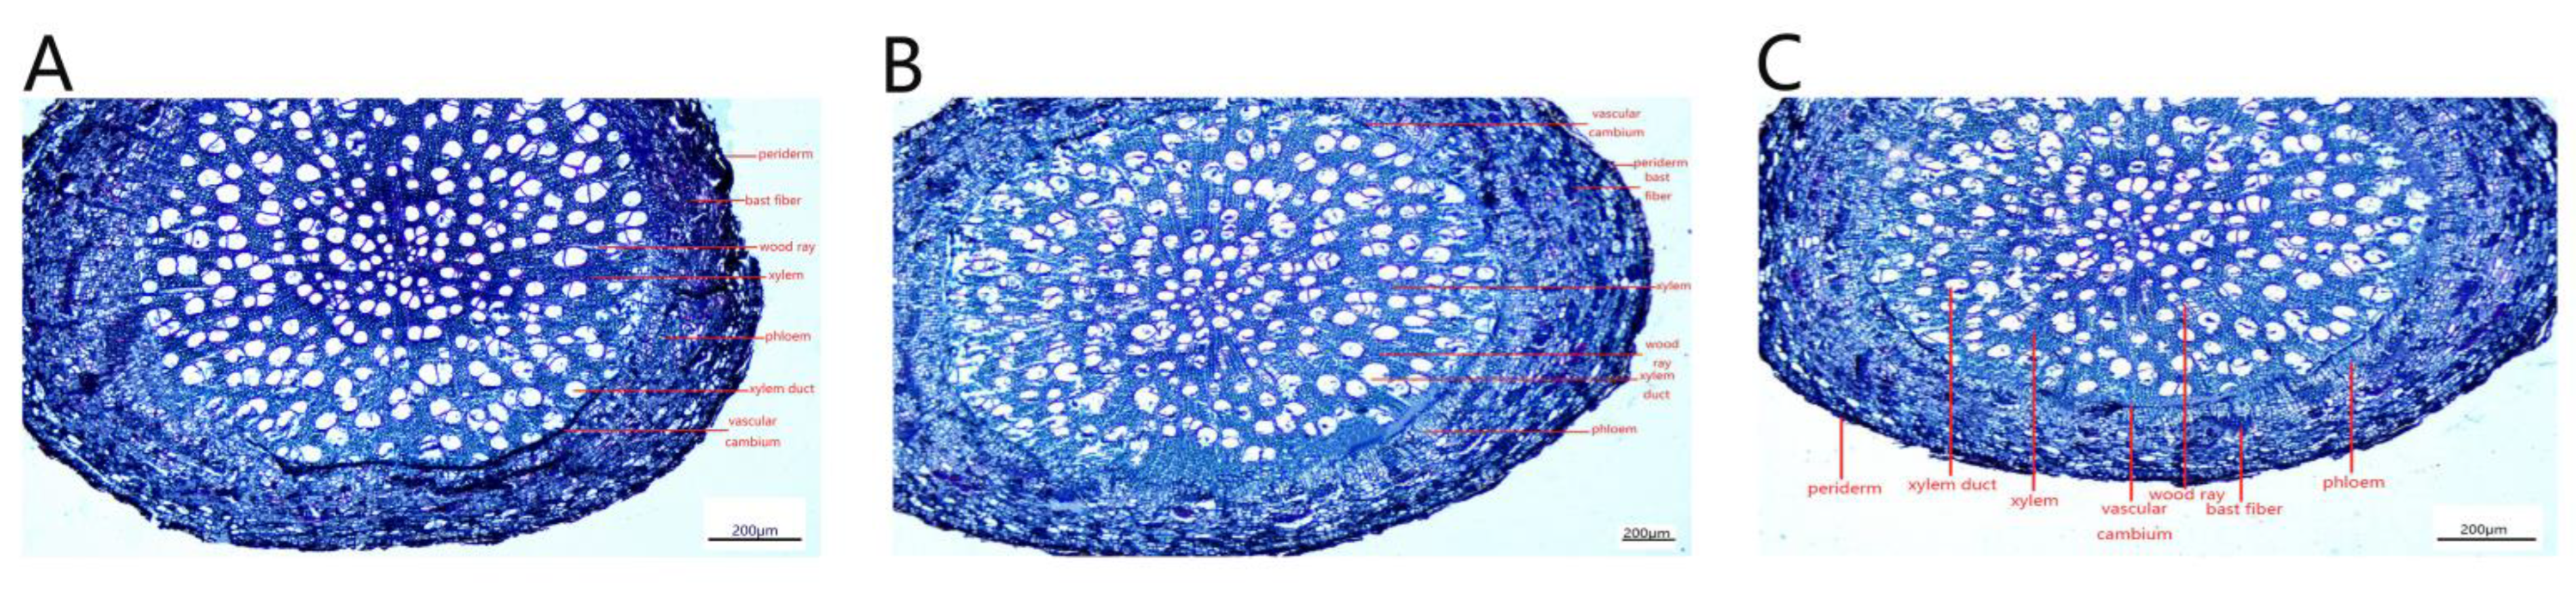
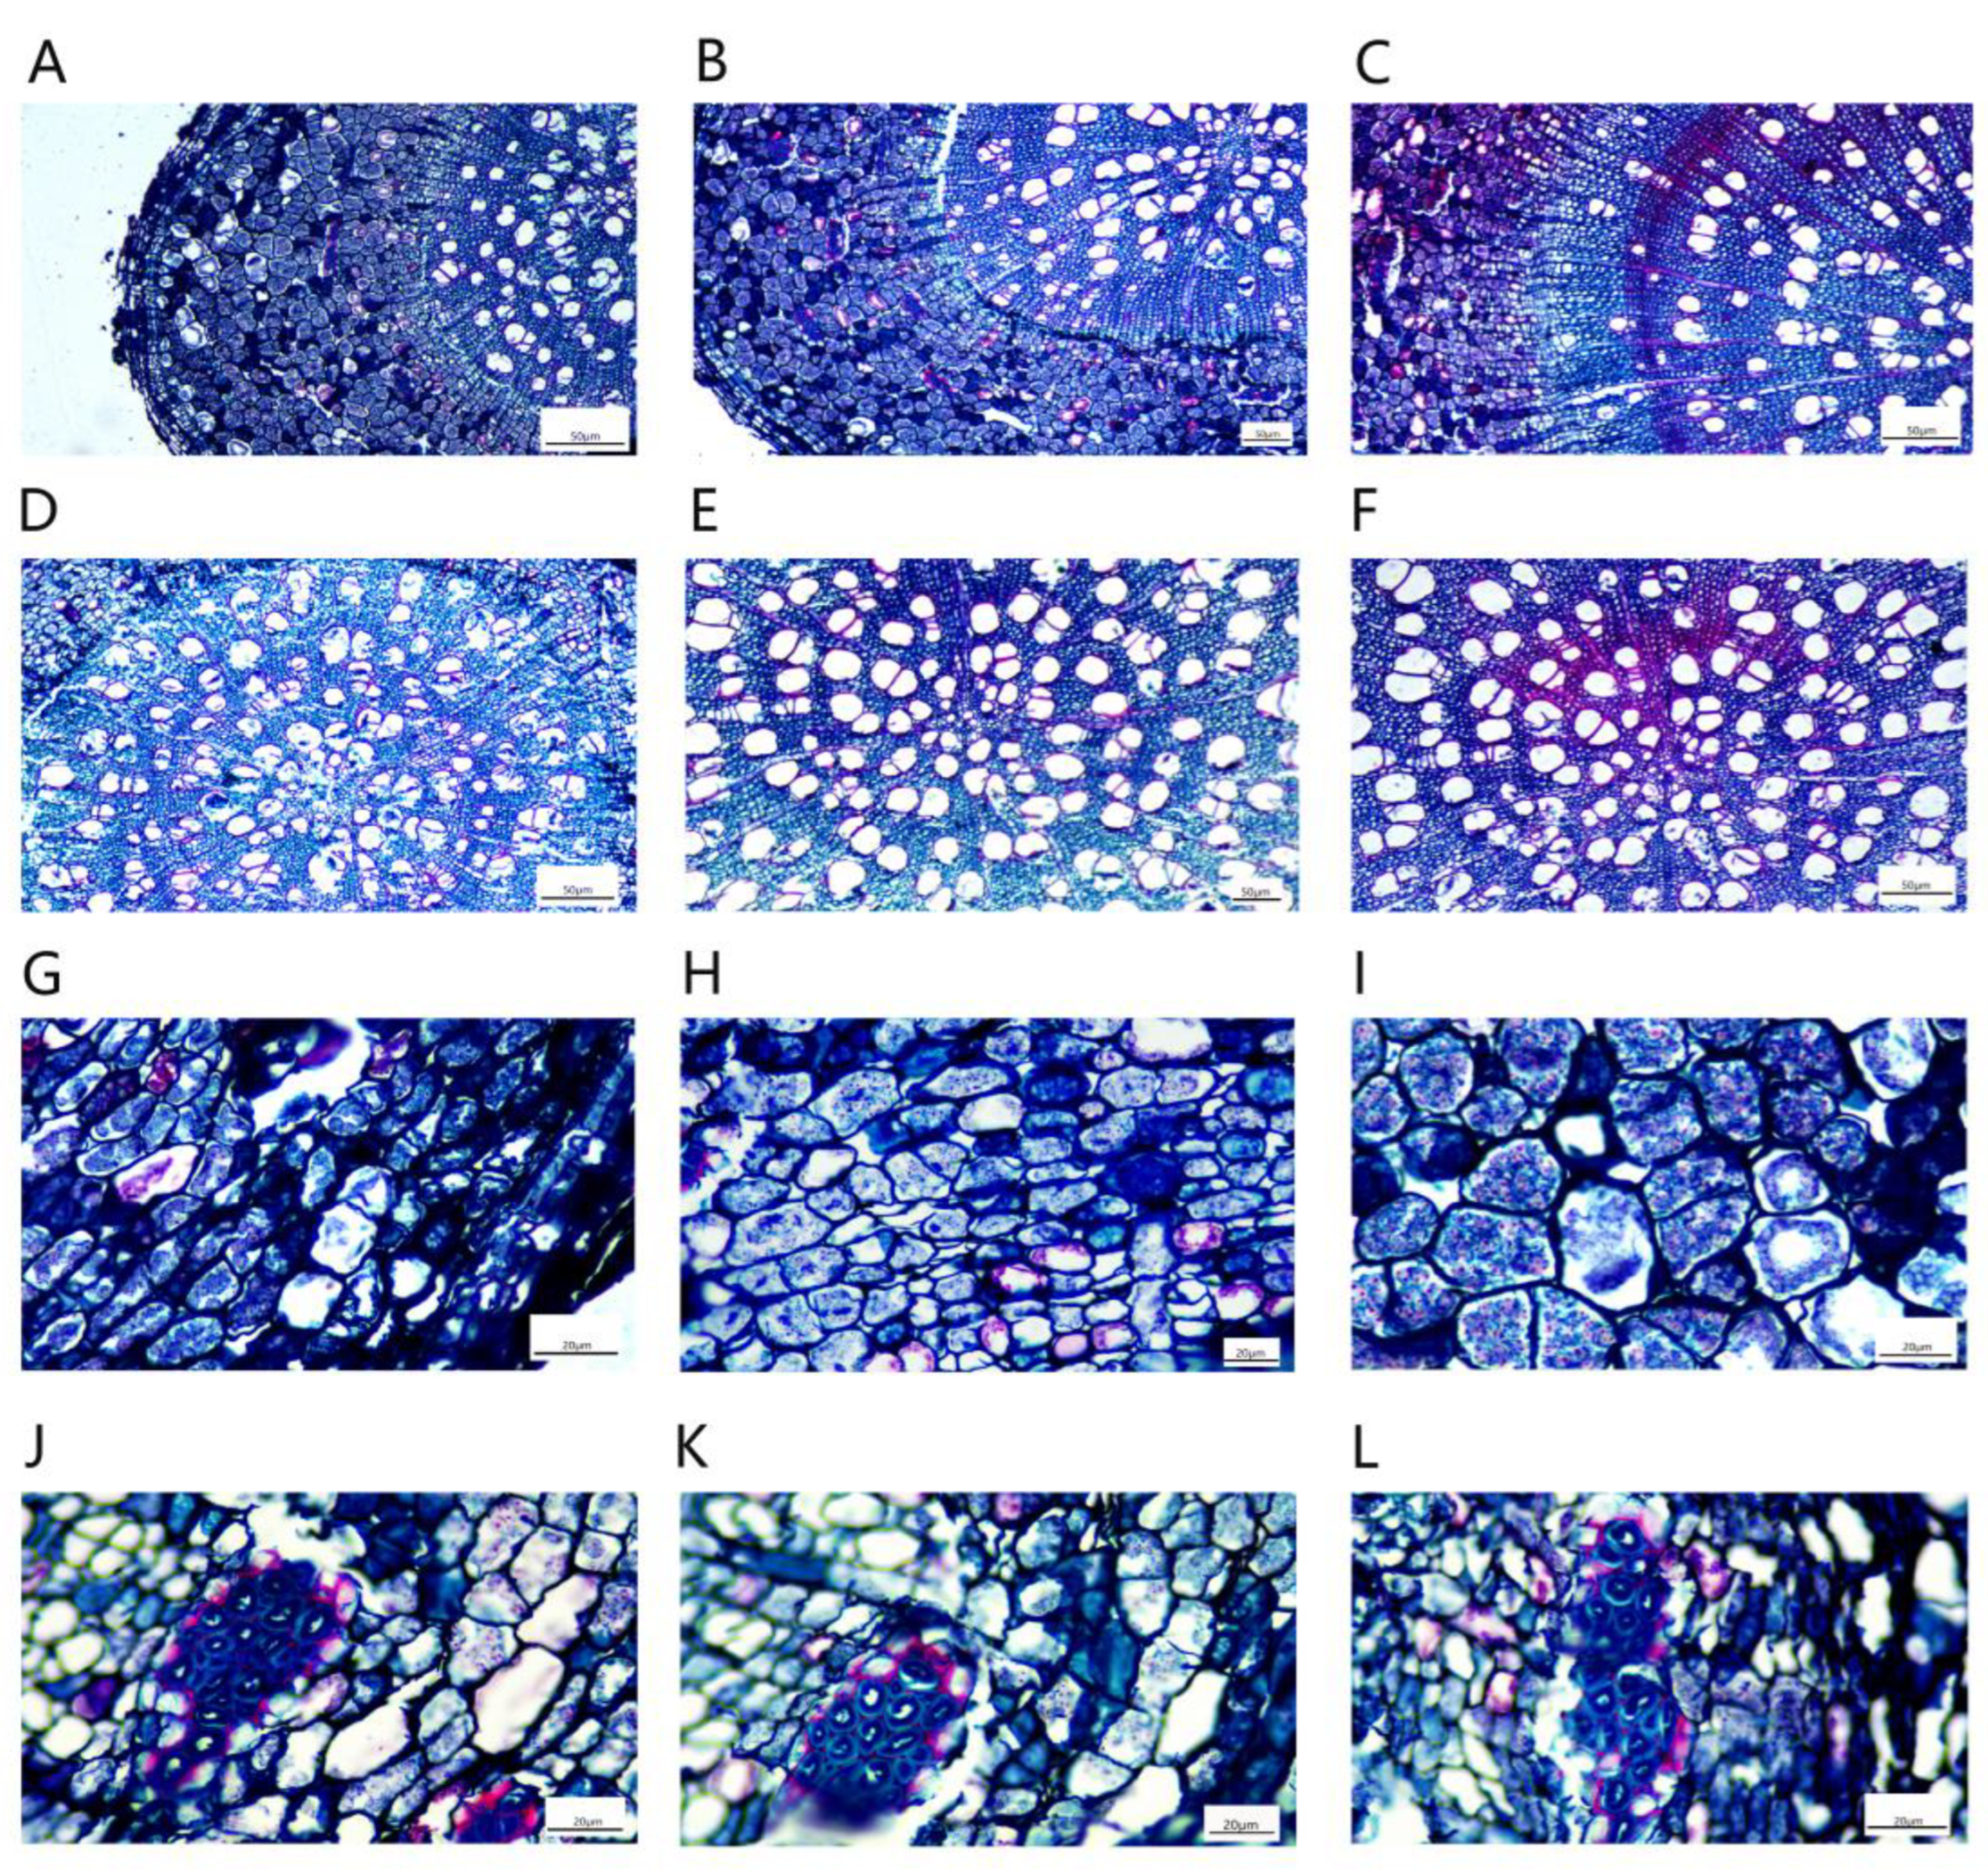
Table 1.
Effects of different concentrations of NaCl-stress treatments on leaf length, leaf width, leaf area, leaf number and the survival rate of P. talassica × P. euphratica.
Table 1.
Effects of different concentrations of NaCl-stress treatments on leaf length, leaf width, leaf area, leaf number and the survival rate of P. talassica × P. euphratica.
| NaCl | Leaf Area | Leaf Length | Average Leaf Width | Number of Leaves | Survival Rate |
|---|---|---|---|---|---|
| (mmol/L) | (cm2) | (cm) | (cm) | (Pieces) | (%) |
| CK | 10.07 ± 0.18 b | 10.24 ± 0.22 b | 0.90 ± 0.07 a | 17.60 ± 1.14 b | 100.00 ± 0.00 a |
| 200 | 10.60 ± 0.35 a | 11.04 ± 0.24 a | 0.98 ± 0.16 a | 19.80 ± 0.84 a | 100.00 ± 0.00 a |
| 400 | 8.56 ± 0.23 c | 7.10 ± 0.16 c | 0.67 ± 0.04 b | 15.20 ± 0.84 c | 91.60 ± 1.14 b |
Note: The data in the table represent means ± standard errors, and different lowercase letters indicate significant differences (p < 0.05).
Table 2.
Effects of different concentrations of NaCl-stress treatments on P. talassica × P. euphratica biomass.
Table 2.
Effects of different concentrations of NaCl-stress treatments on P. talassica × P. euphratica biomass.
| NaCl | Aboveground Biomass | Underground Biomass | Whole Plant Biomass | Root to Shoot Ratio |
|---|---|---|---|---|
| (mmol/L) | (g) | (g) | (g) | |
| CK | 7.49 ± 0.53 a | 4.33 ± 0.30 b | 11.82 ± 0.70 a,b | 0.58 ± 0.04 b |
| 200 | 7.91 ± 0.30 a | 5.41 ± 0.51 a | 13.32 ± 0.58 a | 0.68 ± 0.07 a |
| 400 | 6.12 ± 0.47 b | 4.49 ± 0.46 b | 10.61 ± 0.93 b | 0.73 ± 0.02 a |
Note: The data in the table represent means ± standard errors, and different lowercase letters indicate significant differences (p < 0.05).
Table 3.
Effects of different concentrations of NaCl-stress treatments on P. talassica × P. euphratica root vitality.
Table 3.
Effects of different concentrations of NaCl-stress treatments on P. talassica × P. euphratica root vitality.
| NaCl | Length | Surface Area | Volume | Average Diameter | Number of Forks |
|---|---|---|---|---|---|
| (mmol/L) | (cm) | (cm2) | (cm3) | (mm) | |
| CK | 1080.35 ± 81.94 b | 459.76 ± 58.56 b | 39.54 ± 2.79 b | 0.99 ± 0.03 b,c | 3475.80 ± 328.77 b |
| 200 | 1703.38 ± 144.41 a | 620.01 ± 57.51 a | 51.06 ± 4.17 a | 1.22 ± 0.31 a,b | 6068.40 ± 652.26 a |
| 400 | 769.91 ± 171.04 c | 330.47 ± 51.10 c | 29.82 ± 1.37 c | 0.87 ± 0.08 b,c | 2574.40 ± 572.54 c |
Note: The data in the table represent means ± standard errors, and different lowercase letters indicate significant differences (p < 0.05).
Table 4.
Effects of different concentrations of NaCl-stress treatments on the plant height, ground diameter and crown width of P. talassica × P. euphratica.
Table 4.
Effects of different concentrations of NaCl-stress treatments on the plant height, ground diameter and crown width of P. talassica × P. euphratica.
| Growth Indexes (cm) | NaCl (mmol/L) | ||
|---|---|---|---|
| CK | 200 mmol/L | 400 mmol/L | |
| Crown width before NaCl treatment (cm) | 12.88 ± 0.18 a | 12.84 ± 0.24 a | 12.87 ± 0.19 a |
| Crown width 45 d after NaCl treatment (cm) | 15.77 ± 0.25 b | 16.97 ± 0.29 a | 14.92 ± 0.30 c |
| Relative crown growth (cm) | 2.89 ± 0.17 b | 4.13 ± 0.25 a | 2.05 ± 0.16 c |
| Plant height before NaCl treatment (cm) | 9.97 ± 0.32 a | 10.02 ± 0.32 a | 10.04 ± 0.27 a |
| Plant height 45 d after NaCl treatment (cm) | 10.68 ± 0.32 b | 11.06 ± 0.32 a | 10.45 ± 0.23 b |
| Relative plant height growth (cm) | 0.71 ± 0.07 b | 1.04 ± 0.07 a | 0.41 ± 0.10 c |
| Ground diameter before NaCl treatment (cm) | 0.71 ± 0.02 a | 0.71 ± 0.02 a | 0.70 ± 0.02 a |
| Ground diameter 45 d after NaCl treatment (cm) | 1.20 ± 0.03 b | 1.35 ± 0.07 a | 1.08 ± 0.04 c |
| Relative ground diameter growth (cm) | 0.49 ± 0.01 b | 0.65 ± 0.05 a | 0.39 ± 0.02 c |
Note: The data in the table represent means ± standard errors, and different lowercase letters indicate significant differences (p < 0.05).
Table 5.
Effects of different concentrations of NaCl-stress treatments on the P. talassica × P. euphratica leaf chlorophyll content.
Table 5.
Effects of different concentrations of NaCl-stress treatments on the P. talassica × P. euphratica leaf chlorophyll content.
| NaCl | Chlorophyll a Content | Chlorophyll b Content | Chlorophyll a/b | Total Chlorophyll Content | Carotene Content |
|---|---|---|---|---|---|
| (mmol/L) | (mg/g) | (mg/g) | (mg/g) | (mg/g) | |
| CK | 13.80 ± 1.37 a | 4.40 ± 0.47 a | 3.14 ± 0.07 a | 18.20 ± 1.84 a | 3.26 ± 0.30 a |
| 200 | 9.19 ± 0.82 b | 2.93 ± 0.31 b | 3.14 ± 0.14 a | 12.13 ± 1.10 b | 2.13 ± 0.16 b |
| 400 | 4.48 ± 0.72 c | 1.49 ± 0.25 c | 3.01 ± 0.15 b | 5.98 ± 0.97 c | 1.18 ± 0.11 c |
Note: The data in the table represent means ± standard errors, and different lowercase letters indicate significant differences (p < 0.05).
Table 6.
Effects of different concentrations of NaCl-stress treatments on the size, and the opening and closing, of stomata in P. talassica × P. euphratica leaves.
Table 6.
Effects of different concentrations of NaCl-stress treatments on the size, and the opening and closing, of stomata in P. talassica × P. euphratica leaves.
| NaCl | Stomatal Length | Stomatal Width | Stomatal Area | Stomatal Density | Stomatal Area Index | Proportion of Opened Stomata |
|---|---|---|---|---|---|---|
| (mmol/L) | (μm) | (μm) | (μm2) | (number mm−2) | (%) | (%) |
| CK | 32.98 ± 0.69 a | 14.92 ± 1.15 a | 328.23 ± 5.41 a | 573.12 ± 14.52 a | 0.18 ± 0.01 a | 0.44 ± 0.02 a |
| 200 | 31.20 ± 0.82 a | 12.08 ± 0.49 b | 283.87 ± 6.63 b | 474.31 ± 23.88 b | 0.14 ± 0.01 b | 0.32 ± 0.02 b |
| 400 | 22.65 ± 2.10 b | 8.22 ± 0.98 c | 123.34 ± 8.68 c | 350.99 ± 12.31 c | 0.04 ± 0.01 c | 0.15 ± 0.03 c |
Note: The data in the table represent means ± standard errors, and different lowercase letters indicate significant differences (p < 0.05).
Table 7.
Effects of different concentrations of NaCl-stress treatments on the anatomical structures of P. talassica × P. euphratica leaves.
Table 7.
Effects of different concentrations of NaCl-stress treatments on the anatomical structures of P. talassica × P. euphratica leaves.
| NaCl | Palisade Tissue Thickness | Spongy Tissue Thickness | Blade Thickness | CP | The Tightness of the Blade Structure |
|---|---|---|---|---|---|
| (mmol/L) | (μm) | (μm) | (μm) | ||
| CK | 274.12 ± 12.42 c | 423.31 ± 12.06 a | 762.85 ± 17.90 a | 0.66 ± 0.04 c | 0.36 ± 0.01 c |
| 200 | 365.40 ± 17.77 b | 377.43 ± 13.68 b | 790.79 ± 16.36 b | 0.83 ± 0.03 b | 0.46 ± 0.02 b |
| 400 | 451.25 ± 10.45 a | 319.91 ± 14.45 c | 812.78 ± 20.25 c | 1.30 ± 0.04 a | 0.56 ± 0.01 a |
Note: The data in the table represent means ± standard errors, and different lowercase letters indicate significant differences (p < 0.05).
Table 8.
Effects of different concentrations of NaCl-stress treatments on the anatomical structures of P. talassica × P. euphratica stems.
Table 8.
Effects of different concentrations of NaCl-stress treatments on the anatomical structures of P. talassica × P. euphratica stems.
| NaCl | Epidermal Thickness | Cortical Thickness | Phloem Thickness | Xylem Thickness | Pith Diameter |
|---|---|---|---|---|---|
| (mmol/L) | (μm) | (μm) | (μm) | (μm) | (μm) |
| CK | 20.58 ± 1.75 c | 59.90 ± 4.05 c | 325.85 ± 8.14 c | 761.71 ± 24.96 c | 921.67 ± 13.22 c |
| 200 | 26.13 ± 1.17 b | 74.94 ± 3.82 b | 402.36 ± 9.81 b | 819.33 ± 6.30 b | 1026.27 ± 28.47 b |
| 400 | 29.66 ± 0.84 a | 92.32 ± 1.98 a | 479.27 ± 22.23 a | 859.22 ± 17.34 a | 1169.68 ± 48.38 a |
Note: The data in the table represent means ± standard errors, and different lowercase letters indicate significant differences (p < 0.05).
Table 9.
Effects of different concentrations of NaCl-stress treatments on the root secondary structures of P. talassica × P. euphratica.
Table 9.
Effects of different concentrations of NaCl-stress treatments on the root secondary structures of P. talassica × P. euphratica.
| NaCl | Peripheral Thickness | Phloem Thickness | Xylem Thickness | Xylem Vessel Diameter | Root Cross Section Diameter |
|---|---|---|---|---|---|
| (mmol/L) | (μm) | (μm) | (μm) | (μm) | (μm) |
| CK | 19.95 ± 1.32 a,b | 629.44 ± 52.66 c | 1739.67 ± 88.77 c | 121.26 ± 8.09 c | 2510.32 ± 106.45 c |
| 200 | 19.42 ± 1.14 b | 786.87 ± 37.04 b | 2140.24 ± 112.59 b | 167.14 ± 6.28 b | 3113.67 ± 132.22 b |
| 400 | 21.19 ± 1.75 a | 960.38 ± 49.10 a | 3405.23 ± 214.93 a | 234.69 ± 12.66 a | 4621.50 ± 231.73 a |
Note: The data in the table represent means ± standard errors, and different lowercase letters indicate significant differences (p < 0.05).
Publisher’s Note: MDPI stays neutral with regard to jurisdictional claims in published maps and institutional affiliations. |
© 2022 by the authors. Licensee MDPI, Basel, Switzerland. This article is an open access article distributed under the terms and conditions of the Creative Commons Attribution (CC BY) license (https://creativecommons.org/licenses/by/4.0/).
Share and Cite
MDPI and ACS Style
Liu, Y.; Su, M.; Han, Z. Effects of NaCl Stress on the Growth, Physiological Characteristics and Anatomical Structures of Populus talassica × Populus euphratica Seedlings. Plants 2022, 11, 3025. https://doi.org/10.3390/plants11223025
AMA Style
Liu Y, Su M, Han Z. Effects of NaCl Stress on the Growth, Physiological Characteristics and Anatomical Structures of Populus talassica × Populus euphratica Seedlings. Plants. 2022; 11(22):3025. https://doi.org/10.3390/plants11223025
Chicago/Turabian StyleLiu, Ying, Mengxu Su, and Zhanjiang Han. 2022. "Effects of NaCl Stress on the Growth, Physiological Characteristics and Anatomical Structures of Populus talassica × Populus euphratica Seedlings" Plants 11, no. 22: 3025. https://doi.org/10.3390/plants11223025
Note that from the first issue of 2016, this journal uses article numbers instead of page numbers. See further details here.