
Biological Response of Lallemantia iberica to Brassinolide Treatment under Different Watering Conditions
by
 ,
,
Saeid Naservafaei
1, 
Yousef Sohrabi
1,*, 
Parviz Moradi
2,†,
Eileen Mac Sweeney
3 and
Andrea Mastinu
3,*,†
1
Department of Agronomy and Plant Breeding, Faculty of Agriculture, University of Kurdistan, Sanandaj 66314, Iran
2
Research of Agricultural and Natural Resources Research Center, Zanjan 45617, Iran
3
Department of Molecular and Translational Medicine, University of Brescia, 25123 Brescia, Italy
*
Authors to whom correspondence should be addressed.
†
These authors contributed equally.
Plants 2021, 10(3), 496; https://doi.org/10.3390/plants10030496
Submission received: 27 January 2021
/
Revised: 27 February 2021
/
Accepted: 1 March 2021
/
Published: 5 March 2021
(This article belongs to the Special Issue Brassinosteroids – Biosynthesis, Signaling and Regulatory Functions in Plant Biology and Stress Responses)
Abstract
:Lallemantia iberica (L. iberica) is an important dry season medicinal plant. Drought, an important abiotic stress, adversely affects the plant’s metabolism, which can be alleviated by plant growth regulators like brassinolides. A two-year field experiment was conducted in 2017–2018 to determine the effects of three different irrigation regimes and four brassinolide concentrations on the L. iberica biochemical properties. A split-plot based on a completely randomized block design in three replicates was used as an experimental design with the following irrigation regimes: full watering, watering until flowering and watering until branching. These were the main plots, and 0, 0.5, 1 and 1.5 μM brassinolide concentrations were applied as the subplots. The results showed that many antioxidant enzymes and some biochemical parameters were affected by brassinolide treatment. Furthermore, the highest membrane stability and grain yield were produced in full watering treatment in the second year, and these treatments were not affected by brassinolide application. Several concentrations of brassinolide differently affected the studied treatments, and our study suggests that the amelioration of the effects of the drought stress on L. iberica could possibly be achieved through brassinolide-induced elevation of reactive oxygen species (ROS) scavenging defense systems. There is a need for complementary research to prove the effectiveness of foliar application of this growth regulator to improve the growth and yield of L. iberica under water shortage conditions.
1. Introduction
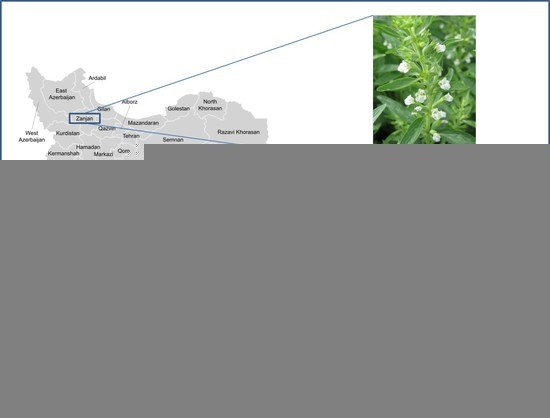
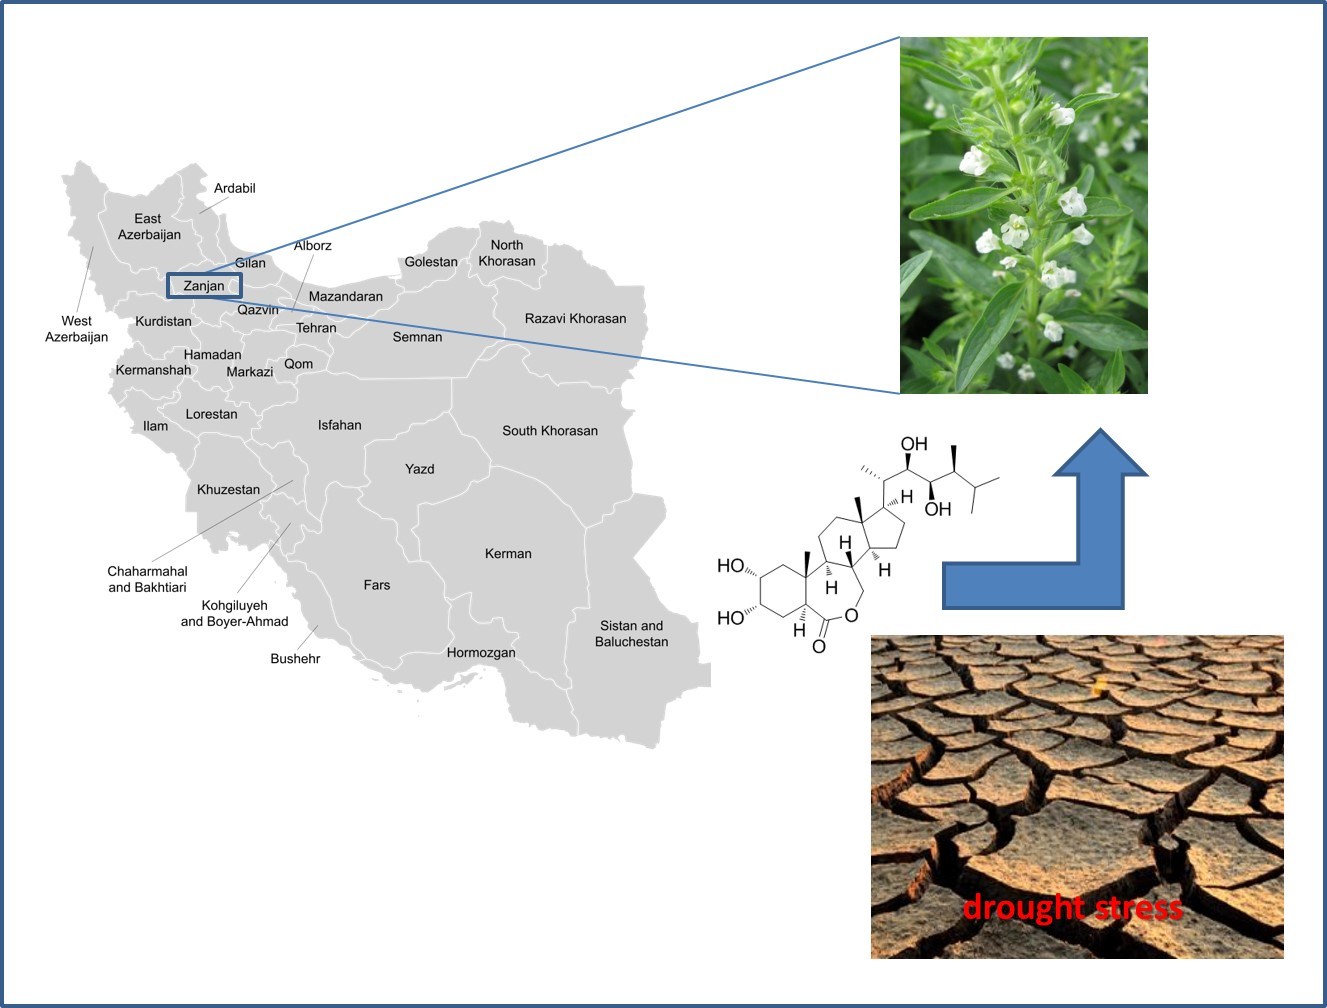
Lallemantia iberica (L. iberica) (Figure 1), which belongs to the Lamiaceae family [1], is a source of secondary metabolites, and its seeds contain mucilage, polysaccharide, fiber, oil and protein [2]. L. iberica grows well in dry regions [1], and water shortage is one of the main problems for plants grown in these areas [3,4,5]. Drought is an important abiotic environmental stressor of plants [6] which often causes molecular, biochemical and physiological modifications that affect plant metabolism [7]. It has been proven that stressful conditions, along with the production of reactive oxygen species (ROS) such as superoxide anion (O2−), hydrogen peroxide (H2O2) and other free radicals, are harmful to plants and cause cell damage and cell death [8].
Antioxidant products like ascorbate, α-tocopherol and carotenoids, as well as antioxidant enzymes like catalase (CAT), ascorbate peroxidase (APX), superoxide dismutase (SOD) and glutathione reductase exist in cell organelles and the cytoplasm. They play a critical role in the detoxification of ROS [9]. It was reported that the application of certain plant growth regulators (PGRs) can improve the tolerance of different abiotic stresses like drought, heavy metal stress and salt stress [10,11,12]. Foliar application of gibberellins, citokinins, abscisic acid, brassinosteroids, salicylic acid, polyamines and proline as plant hormones and osmoprotectant have proven valuable to ameliorate stress impacts, with improved osmotic adjustment to maintain turgor and antioxidant accumulation to detoxify ROS and maintain the stability of membrane structures, enzymes and other macromolecules under drought stress [13]. Brassinolide (BR), a phytohormone belonging to the brassinosteroids family, is involved in different plant physiological processes, including adaptation to various abiotic and biotic stresses [14]. BR leads to stress tolerance by improving the plant’s defense system, which includes enhancing the activities of antioxidant enzymes (APX, SOD, peroxidase (POD), CAT and GR) [15]. Elevated activities of CAT, APX and SOD through the application of BR reduce the H2O2 content [13] and the peroxidation of membrane lipids, which is assessed by the levels of malondialdehyde (MDA) content [16].
Due to the negative effects of drought stress on herbs, a two-year field experiment was performed to investigate the effect of drought stress intensity on the membrane stability and yield of L. iberica. This experiment was also conducted to determine whether BR application could alleviate the degradation effects of drought stress on this plant and which concentration of BR had the best healing effect.
2. Results
The results of the ANOVA table showed that different concentrations of BR, as well as interaction of the year and irrigation regime, significantly affected the enzyme activity of APX (Table 1). The year and irrigation regime had significant effects on the MDA content and membrane stability. In addition, the interaction of the year, irrigation regime and BR had significant effects on the CAT, POD, SOD and PPO enzyme activity, as well as the H2O2 and proline content (Table 1).
2.1. Enzymes Activity
The highest activity of catalase (7.34 unit mg protein−1 min−1) was measured for year one and for the watering until branching treatment (sprayed with the solution containing 1.5 μM BR) (Table 2). The lowest activity of catalase (1.47 unit mg protein−1 min−1) was observed for year one and for full watering treatment (not treated with BR) (Table 2). In almost all irrigation regimes, BR application increased the catalase activity in L. iberica. For the second year, in all watering regimes, the catalase activity was augmented by increasing the BR from 0 to 1 μM, and then it decreased. Over the two years of experimentation, it was observed that the activity of catalase in plants under irrigation cut-off conditions was higher for the first year compared with the second year.
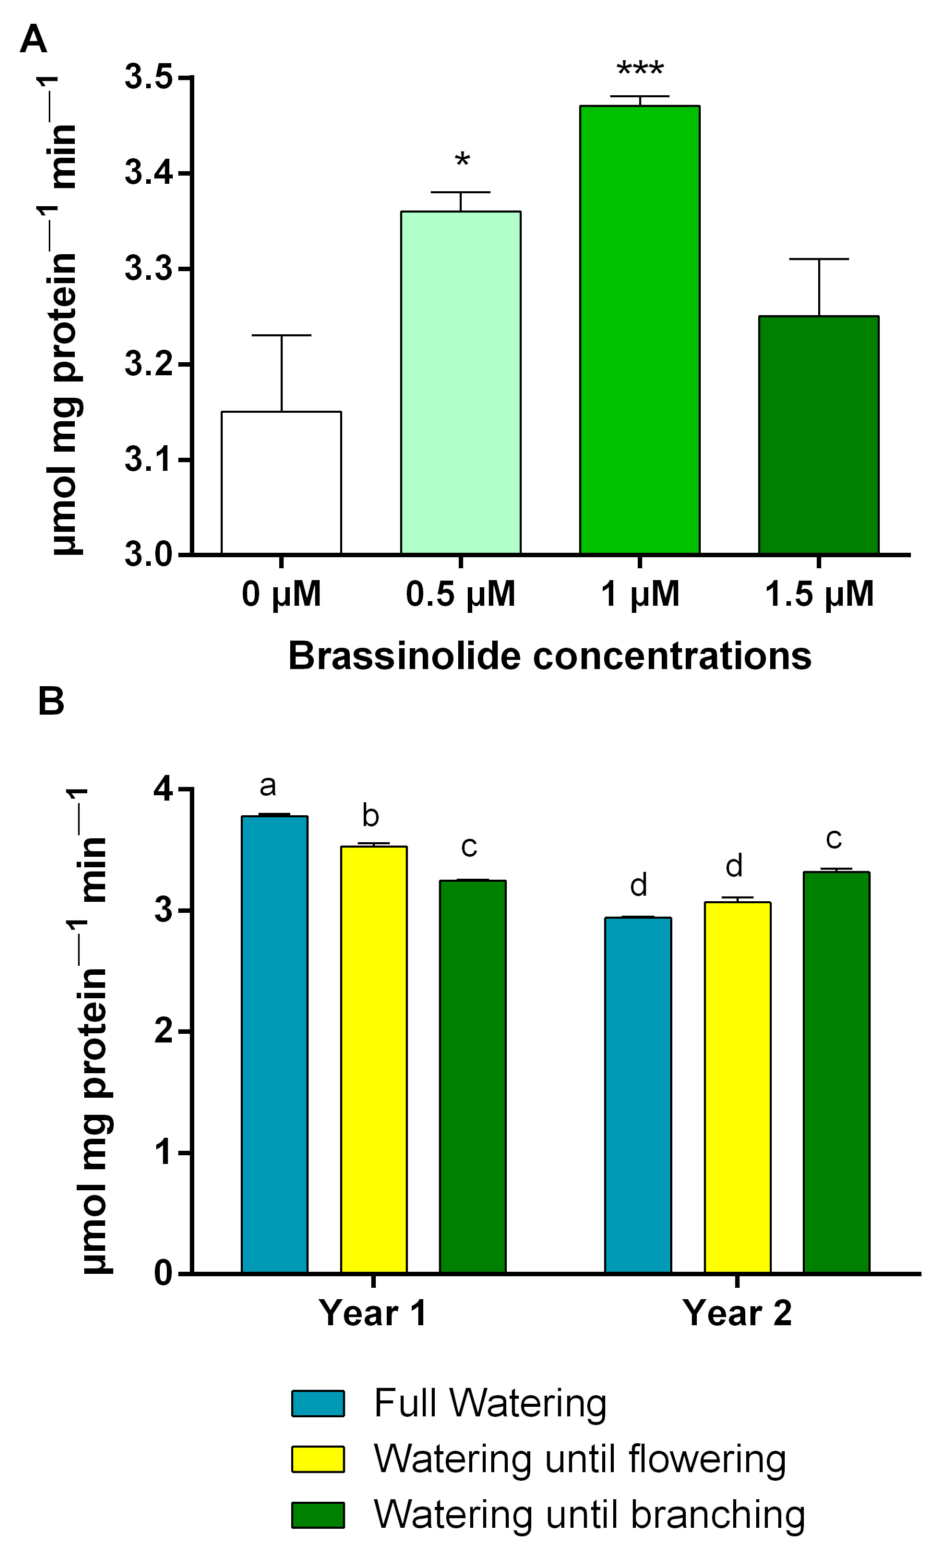
In year one, the activity of APX decreased with increases in the severity of water limitation, while in the second year, APX activity tended to increase (Figure 2B). The highest (3.78 μmol min−1) and the lowest (2.94 μmol min−1) amount of APX activity was observed in full watering-treated plants in year one and year two, respectively (Figure 2B). Application of 1 μM of BR also led to the highest activity of APX, which was significantly different only with the control treatment. Other treatments were placed in the same statistical group (Figure 2A).
The highest activity of peroxidase (7.32 unit mg protein−1 min−1) was obtained in year one in the watering until branching treatment (sprayed with the solution containing 0.5 μM brassinolide) (Table 2). The lowest activity of peroxidase (1.88 unit mg protein−1 min−1) was observed in year two in the full watering treatment (treated with 1.5 μM of brassinolide solution) (Table 2). In year two for all watering regimes, the activity of peroxidase was decreased by the application of increasing concentrations of brassinolide, while in year one, only the full watering regime exhibited such a trend. The results indicated that the activity of the POD enzyme in L. iberica plants for all irrigation regimes was higher in the first year compared with the second year (Table 2).
Like peroxidase activity, the highest activity of SOD (4.17 unit mg protein−1 min−1) was observed in year one in the watering until branching treatment (sprayed with the solution containing 0.5 μM brassinolide) (Table 2). The lowest activity of SOD (0.69 unit mg protein−1 min−1) was observed in year two in the watering until branching treatment (sprayed with 1.5 μM of brassinolide) (Table 2). In year two, all watering regimes showed a decrease in SOD activity with increasing concentrations of brassinolide (from 0 to 1.5 μM), while in year one, this trend was not observed (Table 2). The SOD activity in plants grown in the first year was significantly higher than those in the second year for all irrigation regimes and all regimes of application or non-application of brassinolide.
The results in year one showed that the PPO enzyme activity was highest (2.13 μmol min−1) in the watering until branching treatment regime (sprayed with 0.5 μM brassinolide) (Table 2). Its lowest activity (0.273 μmol min−1) was also observed in year two with the full watering treatment (treated with 1.5 μM brassinolide solution) (Table 2). The PPO enzyme activity for all irrigation treatments and all brassinolide concentration applications in the first year was higher than that in the second year.
2.2. Lipids Peroxidation and H2O2 Content
The highest level of MDA (34.9 mmol g−1 FW) was produced in year one (Figure 3A). The watering until branching regime produced the highest level of MDA (36 mmol g−1 FW), while the full watering treatment produced the lowest level of MDA (32.31 mmol g−1 FW). The plants under the full watering and watering until flowering treatments were in a statistical group (Figure 4A).
The highest amount of H2O2 (169.03 mmol g−1 FW) was recorded in year one in the watering until branching treatment (was not sprayed with brassinolide) (Table 2). The lowest H2O2 (116.03 mmol g−1 FW) was observed in year two in the full watering treatment (treated with 1 μM brassinolide solution) (Table 2). Both years showed that increasing the intensity of the drought stress increased H2O2 production in L. iberica plants. The H2O2 content in the plant was higher in the first year than in the second year for all treatments.
2.3. Proline Content
The highest proline content (7.37 μmol g−1 FWg−1 FW) was found in the watering until branching treatment from year one (sprayed with 0.5 μM of brassinolide solution) (Table 2). Its lowest amount (1.78 μmol g−1 FW) was found in the full watering treatment from year two (sprayed with any brassinolide) (Table 2). In both years and all watering regimes (except year one and watering until branching), the proline content increased with increasing brassinolide concentrations from 0 to 1 μM and decreased with any further increase in the brassinolide concentration (Table 2). In both years, increasing the drought stress intensity resulted in higher levels of proline production in L. iberica plants. The highest proline content was obtained in plants under watering until branching conditions. Overall, the proline content in the first year was higher than the second year, although in some cases these differences were not significant (Table 2).
2.4. Membrane Stability
The highest membrane stability (61.5%) was measured in year two. The difference between the first and second years was significant in terms of this characteristic (Figure 3B). The full watering regime produced the highest level of membrane stability (63.07%), while the watering until branching regime produced the lowest level of membrane stability (61.5%) (Figure 4B). There was a significant difference between the irrigation regimes.
2.5. Grain Yield
The second year of the experiment produced the highest yield of seed (732.6 kg/h) (Figure 5A). The full watering regime produced the highest amount of seed (1073.3 kg h−1), while watering until branching produced the lowest amount of seed (284.3 kg h−1) (Figure 5B). The grain yield increased by increasing the brassinolide concentration from 0 to 1 μM, and then it decreased with further increases in concentration, although these differences were not significant (Table 1 and Figure 5C).
3. Discussion
3.1. Enzymes Activity
In both years, the watering until branching treatment produced the highest activity of catalase. In year one, its activity continuously increased by increasing the concentration of brassinolide, while in year two, this increase was observed only until the concentration of brassinolide reached 1 μM (Table 2). Supposedly, with an increase in the severity of the drought, higher concentrations of brassinolide had more inducing effects on the catalase activity, so it could be concluded that drought stress (by enhancing the H2O2 content [17]) and brassinolide cooperatively induced catalase enzyme activity. It was observed in apples that, without considering the brassinolide concentration, plants that were under more severe drought stress produced higher catalase activity [18]. Other studies have also reported that the application of brassinolide led to an increase in catalase activity [7,10].
APX is recognized as the most important peroxidase in H2O2 detoxification [19]. The application of brassinolide at 1 μM concentration had the greatest impact on APX activity (Figure 2A). The results also indicated that the lowest H2O2 content was measured at a brassinolide concentration of 1 μM. However, there was not a significant correlation between APX activity and H2O2 production (0.08, p ≤ 0.48) (Table 3). Observation of the opposite trend for two different years of APX activity under different intensities of stress (Figure 2B) could be a possible reason for the lack of correlation between these two traits.
For only year one of the experiment, peroxidase and superoxide dismutase activity were increased by the application of brassinolide. However, the stress intensity and applied concentration of brassinolide were the two determinant factors for the activity of this enzyme (Table 2). Positive effects from brassinolide on the peroxidase activity in drought-stressed plants were previously observed in apples [18], cowpea [15] and Indian mustard [20]. Superoxide dismutase catalyzes the reaction in which superoxide anion free radicals are detoxified and H2O2 is produced. The induction of SOD activity has been revealed to coincide with an increase in peroxidase and catalase activity [21]. Correlation analysis indicated that there was a positive and significant correlation between superoxide dismutase and peroxidase, polyphenol oxidase and catalase (Table 3). In other words, correlation analysis results indicated that in the current study, the activity of SOD, POD, CAT and PPO enzymes decreased or increased simultaneously.
Polyphenol oxidase plays an important role in controlling oxidative processes [22,23,24,25]. Although it is not considered as a component of the antioxidant defense system, its activity improved under stressful conditions [26,27]. Either water limitation or the concentration of brassinolide led to the elevation of polyphenol oxidase activity, although the effect of water limitation was more severe (Table 2). The increased activity of polyphenol oxidase under water shortage conditions could be an indicator of increased ROS generation and an accumulation of defensive mechanisms to reduce oxidative damage [28]. The results of the data mean comparison showed that the activity of catalase, peroxidase, superoxide dismutase and polyphenol oxidase in L. iberica plants in the first year was significantly higher than in the second year (Table 2). This result indicated that the drought’s effect was more severe in year one than year two, since the activity of these enzymes upregulated by an increase in drought stress [29].
All the antioxidant enzymes studied in this work showed their highest activity at year one rather than year two. Considering that the severity of drought stress in year one was more than year two (Table 4), as well as the positive effects of a drought on the antioxidant enzyme activity [30,31], supposedly, the severity of drought stress was one of the main reasons for the observation of higher oxidant enzymes activity for year one rather than year two.
Lipid Peroxidation and H2O2 Content
The highest amount of MDA was produced in the first year of the experiment (Figure 3A). In this research, like other investigations done on bananas [32], wheat [19] and chickpea [33], the lipid peroxidation significantly increased by increasing the severity of water limitation (Figure 4A), which indicated that more oxidative damage occurred [19]. According to these assertations, the obtained results and the data represented in Table 4, the severity of drought stress was greater in year one than in year two. The application of brassinolide was not effective on the MDA content (Table 1), which is in contrast to a previous study done on bananas [32]. Supposedly, an applied concentration of brassinolide could not effectively enhance the activity of the antioxidant enzymes involved in the neutralization of O2− [7]. Therefore, the MDA content was not affected by the brassinolide application. Drought as an abiotic stress could affect plants via generating and accumulating reactive oxygen species (ROS) like H2O2, which is an inevitable by-product of normal cell metabolism [33]. Water limitation increased the H2O2 content, while the application of brassinolide ameliorated the effect of water limitation on the production of H2O2 (Table 2). This result suggests that brassinolide could possess an important role in inducing the tolerance of water limitation conditions. H2O2 can be eliminated by CAT, POD and APX [21]. According to correlation analysis, the H2O2 content significantly correlated with CAT POD, SOD and PPO (Table 3).
3.2. Proline
In both years, an increase in the severity of water limitation significantly enhanced the proline content (Table 2). The exogenous application of brassinolide also elevated the proline content (Table 2). Previous studies indicating that drought stress resulted in the increase of proline content in L. iberica [2], wheat [34], tomatoes [21] and Andean potatoes [35]. It has been suggested that the application of brassinolide upregulates the expression of proline biosynthetic genes [21]. It is proposed that proline, as a compatible solute, may assist in the drought tolerance of plants by improving osmotic adjustment, ROS detoxification, protein stabilization and cell membrane protection.
3.3. Cell Membrane Stability
The membrane stability in year two was higher than year one because of less rainfall, the relative humidity and increased evaporation and temperatures (drought conditions) in year one during the plant growing season (Table 4 and Figure 3B). Fully watered plants also had more membrane stability than other watering regimes (Figure 4B). Such negative effects of droughts on the membrane stability were previously observed by researchers [36,37]. Treatment with brassinolide had no significant effects on membrane stability (Table 1), which is in contrast with previous reports [15,38] which stated that brassinolide could help in maintaining the membrane integrity under drought stress.
3.4. Grain Yield
The lowest grain yield was obtained in year one, due to the severity of the drought stress (Figure 5A). As expected, the highest grain yield was obtained in the full watering treatment, while the lowest grain yield was obtained with the watering until branching treatment (Figure 5B). In this study, the grain yield was not affected by brassinolide application. Unfortunately, our data did not allow us to confirm the action of brassinolide that was previously observed in rice [14].
4. Materials and Methods
4.1. Plant Materials and Experimental Conditions
A two-year field experiment (2017–2018) was performed to investigate the effects of three irrigation regimes and four levels of BR treatments on the physiological and biochemical properties of L. iberica (Figure 1). The experiment was conducted in the Kheyr Abad site of the Agriculture and Natural Resources Research and Education Center of Zanjan, located at the northern latitude of 36° and 31′ and the eastern latitude of 48° and 45′, 1764 m above sea level. The annual average precipitation was 307 mm. Table 4 indicates the climatic properties of the field area over two years. The physical and chemical properties of the soil were analyzed using the standard methods [39] (Table 5). A split-plot on the basis of a completely randomized block design with three replicates was used as an experimental design, in which the irrigation regime, including full watering (normal or control irrigation meaning irrigation from sowing seeds (April) to the end of maturity), watering until flowering (irrigation cut-off from the beginning of flowering to the end of maturity) and watering until branching (irrigation cut-off from the emergence of the sixth pair of main stem leaves to physiological maturity), were considered as the main plots, and BR concentrations including 0, 0.5, 1, and 1.5 μM were considered as the subplots. BR was applied two times: at the six leaves stage (emergence of branches) (two L for each treatment) and at the flower initiation stage (four L for each treatment). To ensure the complete effectiveness of spraying, the treatment was done in the evening and in windless weather using a handy sprayer (FST-20DS, Fusite Co., China). The seeds of L. iberica were planted at a depth of 2 cm, 10 cm from one to the other and in 8 rows (25 cm apart). Plants were watered weekly until drought stress application. For the first year, irrigation cut-off occurred at the branching and flowering stages on 19 May 2017 and on 2 June 2017, respectively. For the second year, irrigation cut-off occurred at the branching and flowering stages on 23 May 2017 and on 6 June 2017, respectively. BR treatment always occurred in the afternoon and was applied with a back sprayer. Two weeks after the onset of the flowering stage, 10 plants were randomly selected, and the desired traits were measured after removing the marginal effects. The plots were 50 cm from one to the other, and there was 1.5 m between repeats. Two marginal rows, as well as 50 cm from the beginning and end of the plots, were considered as a margin.
4.2. Enzyme Assays
Fully expanded leaves from the middle of the main stem were sampled, immersed in liquid nitrogen and transferred to a lab. They were stored at −80 °C until enzyme extraction. Protein extraction was carried out with 500 mg of the leaf samples. The protein content was determined using the Bradford method and bovine serum albumin V (BSA V) was used as a standard [40].
4.2.1. Catalase
Catalase (CAT, EC 1.11.1.6) activity was measured using the modified Beer and Sizer method as described by Sohrabi et al. [33]. The enzymatic reaction was initiated by the addition of the protein extract. The reaction mixture contained a 100 mmol L−1 phosphate buffer (pH 7.0), 0.1 mmol L−1 EDTA, 20 mmol L−1 H2O2 and 20 μL of protein extract. After 1 min of reaction, a spectrophotometer at 240 nm monitored the decrease of H2O2 content. H2O2 was quantified using its molar extinction coefficient (36 mol L−1cm). The results were expressed in CAT unit mg protein−1 min−1.
4.2.2. Ascorbate Peroxidase
Ascorbate peroxidase activity (APX, EC 1.11.1.1) was determined using the method previously discussed [41]. The reaction mixture consisted of a 50 mM potassium phosphate buffer (pH 7.0), 0.5 mM ascorbic acid, 0.1 mM EDTA, 0.15 mM H2O2 and 50 µL protein extract. After 1 min of reaction, a spectrophotometer at 290 nm monitored the reduction in oxidation of ascorbic acid.
4.2.3. Peroxidase
Peroxidase (POD, EC 1.11.1.7) activity was measured using the method described by Hemeda and Klein [42]. The reaction mixture contained a 25 mmol L−1 phosphate buffer (pH 7.0), 0.05% guaiacol, 10 mmol L−1 H2O2 and protein extract. The reaction was started by the addition of 60 µL of protein extract at 25 °C. After 1 min of reaction, a spectrophotometer at 470 nm monitored the increase in guaiacol oxidation, and the results were expressed as POD units per min and mg of protein.
4.2.4. Polyphenol Oxidase
The Mohammadi [43] method was used to determine the polyphenol oxidase (PPO) (EC 1.10.3.1) activity. The reaction mixture consisted of 2 mL of a 0.1 M phosphate buffer (pH 6.0), 1 mL of 0.1 M catechol and 0.5 mL of protein extract. The reaction mixture was incubated for 5 min at 25 °C, and the reaction was then terminated by adding 1 mL of 2.5 N H2SO4. The increase in purpurogallin content was spectrophotometrically monitored at 495 nm. The addition of 2.5 N H2SO4 at zero time for the same assay mixture was used as the blank reaction. PPO activity was expressed in U/mg protein (U = change in 0.1 absorbance min−1 mg−1 protein).
4.2.5. Superoxide Dismutase
The activity of superoxide dismutase (SOD, EC 1.15.1.1) was determined using the method previously discussed [41]. The SOD reaction mixture consisted of 50 µM ρ-nitro blue tetrazolium chloride (NBT), 1.3 µM riboflavin, 13 mM methionine, 75 nM EDTA, a 50 mM phosphate buffer (pH 7.8) and 50 µL of protein extract. The reaction mixture was irradiated under light at 78 µmol m−2 s−1 for 15 min, and its absorbance was determined spectrophotometrically at 560 nm.
4.3. Lipid Peroxidation and H2O2 Content
Lipid peroxidation was determined by measuring the malondialdehyde (MDA, a product of unsaturated fatty acid peroxidation) content [19]. Leaf samples (100 mg) were homogenized with 1 mL of trichloroacetic acid (20%, w/v) and centrifuged at 15,000× g for 10 min at 4 °C. An equal volume of supernatant and thiobarbituric acid (TBA) (5%) were added to the TCA (20%). The mixture was heated at 96 °C for 30 min and then placed in an ice bath for 5 min. The absorbance at 532 nm (main absorbance) and 600 nm (for correction of non-specific turbidity by subtracting the absorbance) were recorded, and the MDA content was determined using the following formula:
where E is the specific extinction coefficient (155 mM cm−1), V is the volume of the crushed medium, W is the fresh weight of the leaf, A600 is the absorbance at 600 nm and A532 is the absorbance at 532 nm.
MDA nmol g−1 FM = ((A532 − A600) × V × 1000/E) × W
To determine the H2O2 content, 500 mg of fresh leaf was homogenized in 5 mL of 0.1% (w/v) TCA. The homogenate was centrifuged at 12,000× g for 20 min at 4 °C. The next step involved adding 0.5 mL of the supernatant to a 0.5 mL potassium phosphate buffer (pH 7.0, 10 mM) and 1 mL KI (1M). The absorbance of the supernatant was recorded at 390 nm. The H2O2 content was obtained using its standard curve [8].
4.4. Proline Content
The proline content of the leaves was determined using the method described by Bates et al. [44]. In brief, 500 mg of fresh leaf was homogenized in 10 mL of sulphosalycylic acid (3%). After centrifugation at 15,000× g for 10 min at 4 °C, 2 mL of the extract was transferred to a new tube, and 2 mL of glacial acetic acid and 2 mL of ninhydrin reagent were added. The tubes were boiled in a water bath at 100 °C for 30 min and then placed in an ice bath for 10 min. After cooling the reaction mixture, 6 mL of toluene was added and thoroughly mixed. The absorbance was recorded at 520 nm (toluene was used as the blank). The amount of proline (μmol/g FW) was determined using regression equations and the standard curves.
4.5. Membrane Stability
For the estimation of cell membrane stability, electrolyte leakage from the leaf cells was measured [45]. The method described by Ben Hamed et al. [46] was used to determine the electrolyte leakage. The first fully expanded leaves on the middle part of the main stem (two weeks after onset of the flowering stage) were excised and cut into 1 cm segments and then placed in the test tubes containing 10 mL of double-disuntiled water. The tubes were incubated in a water bath at 32 °C for 2 h, and the initial electrical conductivity of the samples (EC1) was measured by an EC meter (Metrohm, Filderstadt, Germany). The leaves were then sterilized in an autoclave at 121 °C for 20 min to release all the electrolytes—equilibrated to room temperature—and then the final conductivity (EC2) was measured. The electrolyte leakage (EL) was calculated using the following formula: EL = (EC1/EC2) × 100.4.6. Grain Yield
All the plants from the 2 m2 in the middle of the plot were harvested when they were ripe and dry, and the grain yield was measured.
4.6. Statistical Analysis
Before the data were analyzed, a normality test was performed using the Mini Tab software. A separate analysis of data variance for each year was performed on a split-plot in a randomized complete block design. Then, an error variance homogeneity test was performed for all studied traits over a two-year period using the Hartley F test. Considering that the variance of experimental errors over the two-year period was uniform for all studied traits, a combined analysis of variance of data over the two-year period was used. After ensuring the normality of the data, SAS 9.1 statistical software was used for analysis of the data variance and mean comparison. The mean of the studied traits was compared using Duncan’s test at the level of 5% probability. The Pearson correlation coefficient was also calculated for all parameters, but only the correlations between SOD, POX, PPO, CAT, APX, H2O2 and the grain yield were reported.
5. Conclusions
Drought stress and the increase of its intensity increased the H2O2 content, proline and lipid peroxidation of the membrane. The results of the present work suggest that brassinolide plays an important role in the reduction of the drought stress impact by enhancing the levels of osmoprotectants (proline), activities of ROS scavenging enzymes (CAT and APX) and membrane stability. The grain yield was not affected by the concentrations of brassinolide used. Since different concentrations of brassinolide did not similarly affect the studied treatments, a definite concentration of brassinolides could not be recommended. Our study suggests that the modulation of the effects of drought stress by brassinolide application on L. iberica can possibly be done through the stimulation of the ROS-scavenging defense systems. There is a need for complementary research to prove the effectiveness of foliar application of this growth regulator to improve the growth and yield of L. iberica under water shortage conditions.
Author Contributions
Conceptualization, S.N., Y.S. and P.M.; methodology, S.N., Y.S. and P.M.; validation, S.N., Y.S. and P.M.; formal analysis, S.N., Y.S. and P.M.; data curation, S.N., Y.S. and P.M.; writing—original draft preparation, S.N., and P.M.; writing—review and editing, E.M.S. and A.M.; visualization, A.M.; supervision, A.M.; funding acquisition, A.M. All authors have read and agreed to the published version of the manuscript.
Funding
This research received no external funding.
Institutional Review Board Statement
Not applicable.
Informed Consent Statement
Not applicable.
Data Availability Statement
The data presented in this study are available on request from the corresponding author.
Conflicts of Interest
The authors declare no conflict of interest.
References
- Mohammad Ghasemi, V.; Siavash Moghaddam, S.; Rahimi, A.; Pourakbar, L.; Popovic-Djordjevic, J. Winter Cultivation and Nano Fertilizers Improve Yield Components and Antioxidant Traits of Dragon’s Head (Lallemantia iberica (M.B.) Fischer & Meyer). Plants 2020, 9, 252. [Google Scholar] [CrossRef] [Green Version]
- Omidi, H.; Shams, H.; Seif Sahandi, M.; Rajabian, T. Balangu (Lallemantia sp.) growth and physiology under field drought conditions affecting plant medicinal content. Plant Physiol. Biochem. 2018, 130, 641–646. [Google Scholar] [CrossRef]
- Oweis, T.Y.; Hachum, A.Y. Improving water productivity in the dry areas of West Asia and North Africa. Water Product. Agric. Limits Oppor. Improv. 2009, 10, 179–198. [Google Scholar] [CrossRef] [Green Version]
- Rad, S.V.; Valadabadi, S.A.R.; Pouryousef, M.; Saifzadeh, S.; Zakrin, H.R.; Mastinu, A. Quantitative and Qualitative Evaluation of Sorghum bicolor L. under Intercropping with Legumes and Different Weed Control Methods. Horticulturae 2020, 6, 78. [Google Scholar] [CrossRef]
- Reza Yousefi, A.; Rashidi, S.; Moradi, P.; Mastinu, A. Germination and Seedling Growth Responses of Zygophyllum fabago, Salsola kali L. and Atriplex canescens to PEG-Induced Drought Stress. Environments 2020, 7, 107. [Google Scholar] [CrossRef]
- Mahdavi, A.; Moradi, P.; Mastinu, A. Variation in Terpene Profiles of Thymus vulgaris in Water Deficit Stress Response. Molecules 2020, 25, 1091. [Google Scholar] [CrossRef] [Green Version]
- Lima, J.V.; Lobato, A.K.S. Brassinosteroids improve photosystem II efficiency, gas exchange, antioxidant enzymes and growth of cowpea plants exposed to water deficit. Physiol. Mol. Biol. Plants 2017, 23, 59–72. [Google Scholar] [CrossRef] [PubMed]
- Wei, L.-J.; Deng, X.-G.; Zhu, T.; Zheng, T.; Li, P.-X.; Wu, J.-Q.; Zhang, D.-W.; Lin, H.-H. Ethylene is Involved in Brassinosteroids Induced Alternative Respiratory Pathway in Cucumber (Cucumis sativus L.) Seedlings Response to Abiotic Stress. Front. Plant Sci. 2015, 6, 982. [Google Scholar] [CrossRef] [PubMed] [Green Version]
- Bhargava, S.; Sawant, K.; Tuberosa, R. Drought stress adaptation: Metabolic adjustment and regulation of gene expression. Plant Breed. 2013, 132, 21–32. [Google Scholar] [CrossRef]
- Tanveer, M.; Shahzad, B.; Sharma, A.; Khan, E.A. 24-Epibrassinolide application in plants: An implication for improving drought stress tolerance in plants. Plant Physiol. Biochem. 2019, 135, 295–303. [Google Scholar] [CrossRef] [PubMed]
- Mastinu, A.; Kumar, A.; Maccarinelli, G.; Bonini, S.A.; Premoli, M.; Aria, F.; Gianoncelli, A.; Memo, M. Zeolite Clinoptilolite: Therapeutic Virtues of an Ancient Mineral. Molecules 2019, 24, 1517. [Google Scholar] [CrossRef] [Green Version]
- Gianoncelli, A.; Bonini, S.A.; Bertuzzi, M.; Guarienti, M.; Vezzoli, S.; Kumar, R.; Delbarba, A.; Mastinu, A.; Sigala, S.; Spano, P.; et al. An Integrated Approach for a Structural and Functional Evaluation of Biosimilars: Implications for Erythropoietin. Biodrugs Clin. Immunother. Biopharm. Gene Ther. 2015, 29, 285–300. [Google Scholar] [CrossRef] [PubMed] [Green Version]
- Farooq, M.; Hussain, M.; Wahid, A.; Siddique, K.H.M. Drought Stress in Plants: An Overview. Plant Responses Drought Stress 2012, 1–33. [Google Scholar] [CrossRef]
- Sharma, I.; Kaur, N.; Pati, P.K. Brassinosteroids: A Promising Option in Deciphering Remedial Strategies for Abiotic Stress Tolerance in Rice. Front. Plant Sci. 2017, 8. [Google Scholar] [CrossRef]
- Anwar, A.; Liu, Y.; Dong, R.; Bai, L.; Yu, X.; Li, Y. The physiological and molecular mechanism of brassinosteroid in response to stress: A review. Biol. Res. 2018, 51. [Google Scholar] [CrossRef] [Green Version]
- Niu, J.-h.; Ahmad Anjum, S.; Wang, R.; Li, J.-h.; Liu, M.-r.; Song, J.-x.; Zohaib, A.; Lv, J.; Wang, S.-g.; Zong, X.-f. Exogenous application of brassinolide can alter morphological and physiological traits of Leymus chinensis (Trin.) Tzvelev under room and high temperatures. Chil. J. Agric. Res. 2016, 76, 27–33. [Google Scholar] [CrossRef]
- Xia, X.-J.; Wang, Y.-J.; Zhou, Y.-H.; Tao, Y.; Mao, W.-H.; Shi, K.; Asami, T.; Chen, Z.; Yu, J.-Q. Reactive Oxygen Species Are Involved in Brassinosteroid-Induced Stress Tolerance in Cucumber. Plant Physiol. 2009, 150, 801–814. [Google Scholar] [CrossRef] [Green Version]
- Kumari, S.; Thakur, A. The Effects of Water Stress and Brassinosteroid on Apple Varieties. Int. J. Econ. Plants 2019, 6, 001–006. [Google Scholar] [CrossRef]
- Aghaee, P.; Rahmani, F. Biochemical and molecular responses of flax to 24-epibrassinosteroide seed priming under drought stress. J. Plant Interact. 2019, 14, 242–253. [Google Scholar] [CrossRef] [Green Version]
- Fariduddin, Q.; Khanam, S.; Hasan, S.A.; Ali, B.; Hayat, S.; Ahmad, A. Effect of 28-homobrassinolide on the drought stress-induced changes in photosynthesis and antioxidant system of Brassica juncea L. Acta Physiol. Plant. 2009, 31, 889–897. [Google Scholar] [CrossRef]
- Jangid, K.K.; Dwivedi, P. Physiological and biochemical changes by nitric oxide and brassinosteroid in tomato (Lycopersicon esculentum Mill.) under drought stress. Acta Physiol. Plant. 2017, 39. [Google Scholar] [CrossRef]
- Gupta, A.K.; Rather, M.A.; Kumar Jha, A.; Shashank, A.; Singhal, S.; Sharma, M.; Pathak, U.; Sharma, D.; Mastinu, A. Artocarpus lakoocha Roxb. and Artocarpus heterophyllus Lam. Flowers: New Sources of Bioactive Compounds. Plants 2020, 9, 1329. [Google Scholar] [CrossRef] [PubMed]
- Kumar, A.; Premoli, M.; Aria, F.; Bonini, S.A.; Maccarinelli, G.; Gianoncelli, A.; Memo, M.; Mastinu, A. Cannabimimetic plants: Are they new cannabinoidergic modulators? Planta 2019, 249, 1681–1694. [Google Scholar] [CrossRef] [PubMed]
- Mastinu, A.; Bonini, S.A.; Premoli, M.; Maccarinelli, G.; Mac Sweeney, E.; Zhang, L.; Lucini, L.; Memo, M. Protective Effects of Gynostemma pentaphyllum (var. Ginpent) against Lipopolysaccharide-Induced Inflammation and Motor Alteration in Mice. Molecules 2021, 26, 570. [Google Scholar] [CrossRef] [PubMed]
- Mastinu, A.; Bonini, S.A.; Rungratanawanich, W.; Aria, F.; Marziano, M.; Maccarinelli, G.; Abate, G.; Premoli, M.; Memo, M.; Uberti, D. Gamma-oryzanol Prevents LPS-induced Brain Inflammation and Cognitive Impairment in Adult Mice. Nutrients 2019, 11, 728. [Google Scholar] [CrossRef] [Green Version]
- Shamon Sad, M.; El-Sayed E, M.; Dawood, M.G.; Gad Ali El, K. Physiological Role of Brassinosteroids and Cauliflower Extract on Quinoa Plant Grown under Sandy Soil. Asian J. Appl. Sci. 2020, 13, 68–75. [Google Scholar] [CrossRef]
- Kumar, A.; Memo, M.; Mastinu, A. Plant behaviour: An evolutionary response to the environment? Plant Biol. 2020, 22, 961–970. [Google Scholar] [CrossRef] [PubMed]
- Zafari, M.; Ebadi, A.; Jahanbakhsh, S.; Sedghi, M. Safflower (Carthamus tinctorius) Biochemical Properties, Yield, and Oil Content Affected by 24-Epibrassinosteroid and Genotype under Drought Stress. J. Agric. Food Chem. 2020, 68, 6040–6047. [Google Scholar] [CrossRef] [PubMed]
- Chakhchar, A.; Wahbi, S.; Lamaoui, M.; Ferradous, A.; El Mousadik, A.; Ibnsouda-Koraichi, S.; Filali-Maltouf, A.; El Modafar, C. Physiological and biochemical traits of drought tolerance inArgania spinosa. J. Plant Interact. 2015, 10, 252–261. [Google Scholar] [CrossRef]
- Fazeli, F.; Ghorbanli, M.; Niknam, V. Effect of drought on biomass, protein content, lipid peroxidation and antioxidant enzymes in two sesame cultivars. Biol. Plant. 2007, 51, 98–103. [Google Scholar] [CrossRef]
- Sharma, P.; Dubey, R.S. Drought Induces Oxidative Stress and Enhances the Activities of Antioxidant Enzymes in Growing Rice Seedlings. Plant Growth Regul. 2005, 46, 209–221. [Google Scholar] [CrossRef]
- Mahmood, M.; Bidabadi, S.S.; Ghobadi, C.; Gray, D.J. Effect of methyl jasmonate treatments on alleviation of polyethylene glycol -mediated water stress in banana (Musa acuminata cv. ‘Berangan’, AAA) shoot tip cultures. Plant Growth Regul. 2012, 68, 161–169. [Google Scholar] [CrossRef]
- Sohrabi, Y.; Heidari, G.; Weisany, W.; Golezani, K.G.; Mohammadi, K. Changes of antioxidative enzymes, lipid peroxidation and chlorophyll content in chickpea types colonized by different Glomus species under drought stress. Symbiosis 2012, 56, 5–18. [Google Scholar] [CrossRef]
- Abid, S.; Mohanan, P.; Kaliraj, L.; Park, J.K.; Ahn, J.C.; Yang, D.C. Development of species-specific chloroplast markers for the authentication of Gynostemma pentaphyllum and their distribution in the Korean peninsula. Fitoterapia 2019, 138, 104295. [Google Scholar] [CrossRef]
- Vasquez-Robinet, C.; Mane, S.P.; Ulanov, A.V.; Watkinson, J.I.; Stromberg, V.K.; De Koeyer, D.; Schafleitner, R.; Willmot, D.B.; Bonierbale, M.; Bohnert, H.J.; et al. Physiological and molecular adaptations to drought in Andean potato genotypes. J. Exp. Bot. 2008, 59, 2109–2123. [Google Scholar] [CrossRef] [Green Version]
- Abid, M.; Ali, S.; Qi, L.K.; Zahoor, R.; Tian, Z.; Jiang, D.; Snider, J.L.; Dai, T. Physiological and biochemical changes during drought and recovery periods at tillering and jointing stages in wheat (Triticum aestivum L.). Sci. Rep. 2018, 8. [Google Scholar] [CrossRef] [PubMed]
- Ahmed, I.M.; Dai, H.; Zheng, W.; Cao, F.; Zhang, G.; Sun, D.; Wu, F. Genotypic differences in physiological characteristics in the tolerance to drought and salinity combined stress between Tibetan wild and cultivated barley. Plant Physiol. Biochem. 2013, 63, 49–60. [Google Scholar] [CrossRef]
- Yuan, G.-F.; Jia, C.-G.; Li, Z.; Sun, B.; Zhang, L.-P.; Liu, N.; Wang, Q.-M. Effect of brassinosteroids on drought resistance and abscisic acid concentration in tomato under water stress. Sci. Hortic. 2010, 126, 103–108. [Google Scholar] [CrossRef]
- Miransari, M.; Bahrami, H.A.; Rejali, F.; Malakouti, M.J. Using arbuscular mycorrhiza to alleviate the stress of soil compaction on wheat (Triticum aestivum L.) growth. Soil Biol. Biochem. 2008, 40, 1197–1206. [Google Scholar] [CrossRef]
- Bradford, M.M. A rapid and sensitive method for the quantitation of microgram quantities of protein utilizing the principle of protein-dye binding. Anal. Biochem. 1976, 72, 248–254. [Google Scholar] [CrossRef]
- Caverzan, A.; Passaia, G.; Rosa, S.B.; Ribeiro, C.W.; Lazzarotto, F.; Margis-Pinheiro, M. Plant responses to stresses: Role of ascorbate peroxidase in the antioxidant protection. Genet. Mol. Biol. 2012, 35, 1011–1019. [Google Scholar] [CrossRef] [Green Version]
- Hemeda, H.M.; Klein, B.P. Effects of Naturally Occurring Antioxidants on Peroxidase Activity of Vegetable Extracts. J. Food Sci. 1990, 55, 184–185. [Google Scholar] [CrossRef]
- Mohammadi, M.; Kazemi, H. Changes in peroxidase and polyphenol oxidase activities in susceptible and resistant wheat heads inoculated with Fusarium graminearum and induced resistance. Plant Sci. 2002, 162, 491–498. [Google Scholar] [CrossRef]
- Bates, L.S.; Waldren, R.P.; Teare, I.D. Rapid determination of free proline for water-stress studies. Plant Soil 1973, 39, 205–207. [Google Scholar] [CrossRef]
- Blum, A.; Ebercon, A. Cell Membrane Stability as a Measure of Drought and Heat Tolerance in Wheat. Crop Sci. 1981, 21, 43. [Google Scholar] [CrossRef]
- Ben Hamed, K.; Castagna, A.; Salem, E.; Ranieri, A.; Abdelly, C. Sea fennel (Crithmum maritimum L.) under salinity conditions: A comparison of leaf and root antioxidant responses. Plant Growth Regul. 2007, 53, 185–194. [Google Scholar] [CrossRef]
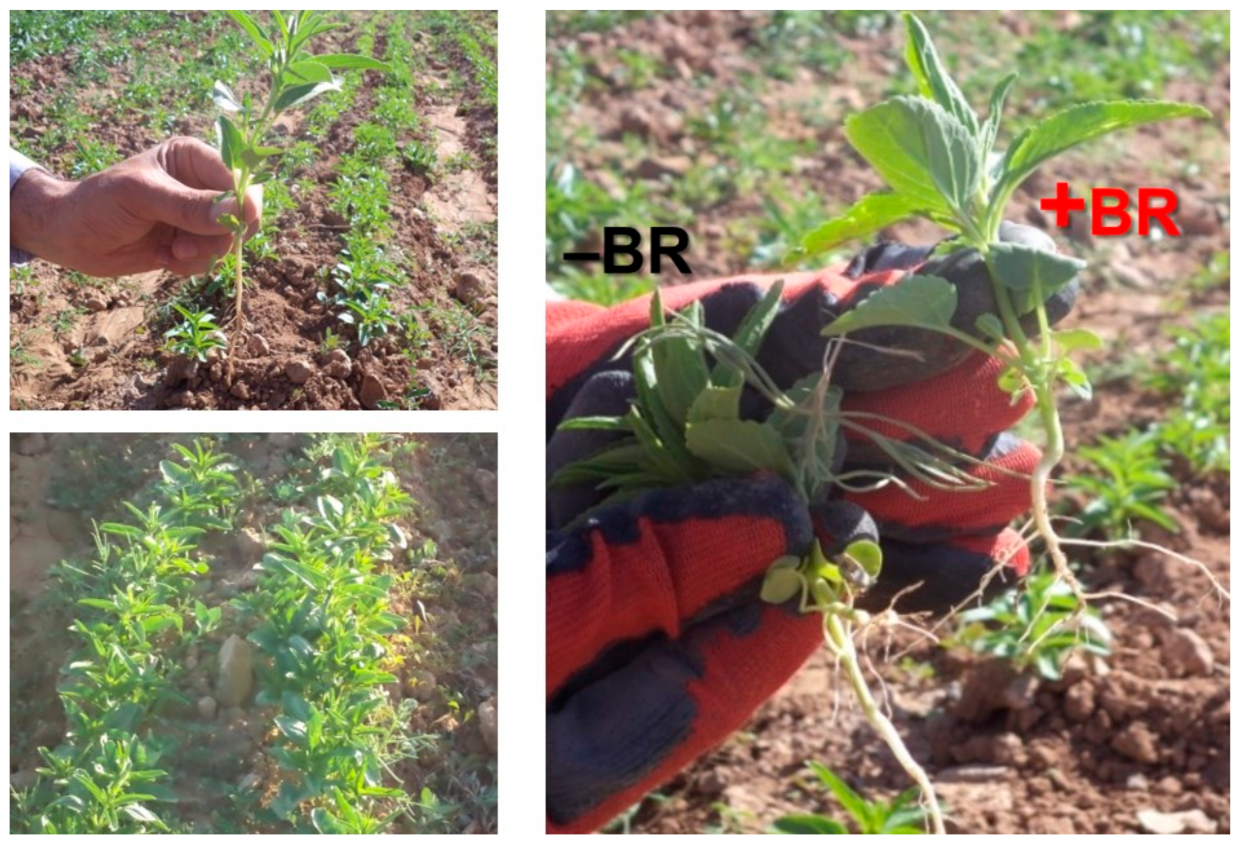
Figure 1.
Lallemantia iberica crops from the Kheyr Abad site of the Agriculture and Natural Resources Research and Education Center of Zanjan (Iran). On the right, an example is shown of plant phenotype pictures with brassinolide treatment (+BR) or without brassinolide treatment (−BR).
Figure 1.
Lallemantia iberica crops from the Kheyr Abad site of the Agriculture and Natural Resources Research and Education Center of Zanjan (Iran). On the right, an example is shown of plant phenotype pictures with brassinolide treatment (+BR) or without brassinolide treatment (−BR).

Figure 2.
Effects of (A) different concentrations of brassinolides and (B) irrigation regimes in each year on ascorbate proxidase. According to Duncan’s multiple ranges test, bars with the same letter are not significantly different at a 5% statistical level. * p < 0.05 and *** p < 0.001 vs. control (Brassinolide 0 μM).

Figure 3.
Effects of each year on (A) malonedialdehyde and (B) memberane stability. According to Duncan’s multiple ranges test, bars with the same letter are not significantly different at a 5% statistical level.
Figure 3.
Effects of each year on (A) malonedialdehyde and (B) memberane stability. According to Duncan’s multiple ranges test, bars with the same letter are not significantly different at a 5% statistical level.

Figure 4.
Effect of irrigation regimes on (A) malonedialdehyde and (B) memberane stability. According to Duncan’s multiple ranges test, bars with the same letter are not significantly different at a 5% statistical level.
Figure 4.
Effect of irrigation regimes on (A) malonedialdehyde and (B) memberane stability. According to Duncan’s multiple ranges test, bars with the same letter are not significantly different at a 5% statistical level.

Figure 5.
(A) Simple effects of the year. (B) Simple effects of watering regimes. (C) Simple effects of brassinolide concentration on grain yield of L. iberica.
Figure 5.
(A) Simple effects of the year. (B) Simple effects of watering regimes. (C) Simple effects of brassinolide concentration on grain yield of L. iberica.


Table 1.
Combined analysis of variance from 2017 to 2018 for catalase, ascorbate peroxidase, peroxidase, superoxide dismutase and polyphenol oxidase enzymes activity, as well as the H2O2, malondialdehyde and proline content, membrane stability and grain yield of L. iberica under different irrigation regimes and different concentrations of brassinolide (BR).
| S.O.V. | df | Mean Square | |||||||||
|---|---|---|---|---|---|---|---|---|---|---|---|
| CAT | APX | POD | SOD | PPO | H2O2 | MDA | PRO | MS | GY | ||
| Y | 1 | ** | ** | ** | ** | ** | ** | ** | ** | ** | ** |
| Y (error) | 4 | - | - | - | - | - | - | - | - | - | - |
| L.W | 2 | ns | ns | ns | ns | ns | * | * | ** | ** | ** |
| Y × L.W. | 2 | ** | ** | ** | ** | ** | ** | ns | ** | ns | ns |
| Error (a) | 8 | - | - | - | - | - | - | - | - | - | - |
| B | 3 | ns | * | ns | ns | ns | ** | ns | ns | ns | ns |
| L.W. × B | 6 | ns | ns | ns | ns | ns | ns | ns | ns | ns | ns |
| Y×B | 3 | ** | ns | ** | ** | ** | ns | ns | ns | ns | ns |
| Y × L.W. × B | 6 | ** | ns | ** | ** | ** | ** | ns | ** | ns | ns |
| Error (b) | 36 | - | - | - | - | - | - | - | - | - | - |
S.O.V. = source of variation; Y = year; L.W. = limited watering; B = brassinolide concentration; C.V. = coefficient of variation; df = degree of freedom; CAT = catalase; APX = ascorbate peroxidase; POD = peroxidase; SOD = superoxide dismutase; PPO = polyphenol oxidase; H2O2 = hydrogen peroxide content; MDA = malondialdehyde; PRO = proline; MS = membrane stability; and GY = grain yield. ns not significant; * significant at 5% probability level; and ** significant at 1% probability level.
Table 2.
Interaction of the year with the irrigation regime and the BR concentrations with the activity of catalase, peroxidase, superoxide dismutase and polyphenol oxidase enzymes and the content of hydrogen peroxide and proline.
Table 2.
Interaction of the year with the irrigation regime and the BR concentrations with the activity of catalase, peroxidase, superoxide dismutase and polyphenol oxidase enzymes and the content of hydrogen peroxide and proline.
| Year | Irrigation Regime | Brassinolides Concentration | CAT † Unit mg Protein−1 Min−1 | POD Unit mg Protein−1 Min−1 | SOD Unit mg Protein−1 Min−1 | PPO μmol Min−1 | H2O2 mmol g−1 FW | Pro μmol g−1 FW |
|---|---|---|---|---|---|---|---|---|
| Year 1 | Full watering | 0 | 1.47 o ‡ | 4.94 h | 1.76 i | 0.947 fg | 125.03 hi | 1.84 o |
| 0.5 | 3.21 i | 4.54 j | 1.99 h | 0.793 hi | 120.3 j | 2.89 l | ||
| 1 | 2.72 jk | 3.84 l | 2.23 g | 0.667 ij | 120.95 j | 2.84 l | ||
| 1.5 | 1.75 n | 3.73 lm | 1.83 i | 0.603 jk | 124.99 hi | 2.46 m | ||
| Watering until flowering | 0 | 3.63 h | 5.79 f | 2.92 e | 0.86 gh | 154.61 c | 3.48 jk | |
| 0.5 | 3.9 g | 6.44 d | 2.87 e | 1.54 c | 152.61 d | 3.85 i | ||
| 1 | 4.25 e | 6.19 e | 2.73 f | 1.25 d | 150.49 ef | 4.01 hi | ||
| 1.5 | 4.12 ef | 5.88 f | 2.7 f | 0.993 fg | 153.05 cd | 3.98 hi | ||
| Watering until branching | 0 | 5.48 d | 6.18 e | 3.4 d | 1.14 de | 169.03 a | 6.67 cd | |
| 0.5 | 5.87 c | 7.32 a | 4.17 a | 2.13 a | 168.17 a | 7.37 a | ||
| 1 | 6.58 b | 7.15 b | 3.83 b | 1.74 b | 167.47 a | 7.1 ab | ||
| 1.5 | 7.34 a | 6.86 c | 3.6 c | 1.57 c | 167.83 a | 6.47 de | ||
| Year 2 | Full watering | 0 | 2 m | 3.62 mn | 1.58 jk | 0.28 m | 120.55 j | 1.78 o |
| 0.5 | 2.38 l | 3.51 n | 1.33 l | 0.347 m | 117.74 k | 1.95 o | ||
| 1 | 2.41 l | 2.87 o | 0.93 no | 0.417 lm | 116.04 l | 2.21 mn | ||
| 1.5 | 2.35 l | 1.88 q | 0.89 no | 0.273 m | 120.6 j | 1.84 o | ||
| Watering until flowering | 0 | 2.77 jk | 4.88 h | 1.52 k | 0.58 jk | 126.64 gh | 3.24 k | |
| 0.5 | 2.91 j | 4.73 i | 1.09 m | 0.5 kl | 127.21 g | 3.74 ij | ||
| 1 | 2.78 jk | 4.26 k | 1 mno | 0.41 k−m | 124.62 i | 4.64 g | ||
| 1.5 | 2.7 k | 3.79 l | 0.88 no | 0.29 m | 125.93 g−i | 4.22 h | ||
| Watering until branching | 0 | 3.19 i | 5.64 g | 1.7 ij | 0.49 kl | 156.42 b | 5.8 f | |
| 0.5 | 3.45 h | 4.22 k | 1.03 mn | 0.68 ij | 149.33 f | 6.85 bc | ||
| 1 | 4.03 g | 3.59 n | 0.94 no | 0.79 hi | 151.91 de | 7.26 a | ||
| 1.5 | 3.89 g | 2.57 p | 0.69 p | 1.03 ef | 154.4 c | 6.33 e |
‡ According to Duncan’s multiple ranges test, values followed by the same letter within the columns are not significantly different at a 5% statistical level. † CAT = catalase; POD = peroxidase; SOD = superoxide dismutase; PPO = polyphenol oxidase; H2O2 = hydrogen peroxide; and Pro = proline.
Table 3.
Correlation between antioxidant enzymes, H2O2 and grain yield.
| SOD | POD | PPO | CAT | APX | H2O2 | GY | |
|---|---|---|---|---|---|---|---|
| SOD | 1 | 0.88147 ** | 0.83144 ** | 0.74785 ** | 0.22676 ns | 0.67906 ** | −0.3992 ns |
| POD | 0.88147 ** | 1 | 0.78694 ** | 0.71968 ** | 0.20204 ns | 0.72549 ** | −0.5287 ** |
| PPO | 0.83144 ** | 0.78694 ** | 1 | 0.80645 ** | 0.26597 * | 0.77561 ** | −0.5882 ** |
| CAT | 0.74785 ** | 0.71968 ** | 0.80645 ** | 1 | 0.04098 ns | 0.85996 ** | −0.7761 ** |
| APX | 0.22676 ns | 0.20204 ns | 0.26597 * | 0.04098 ns | 1 | 0.08424 ns | 0.03295 ns |
| H2O2 | 0.67906 ** | 0.72549 ** | 0.77561 ** | 0.85996 ** | 0.08424 ns | 1 | −0.8991 ** |
| GY | −0.3990 ** | −0.5287 ** | −0.5882 ** | −0.7761 ** | 0.03295 ns | −0.8991 ** | 1 |
CAT = catalase; APX = ascorbate peroxidase; POD = peroxidase; SOD = superoxide dismutase; PPO = polyphenol oxidase; H2O2 = hydrogen peroxide content; MDA = malondialdehyde; and GY = grain yield. ns Not significant. * Significant at a 5% probability level. ** Significant at a 1% probability level.
Table 4.
Climatic data of the experimental site during the L. iberica growing season.
| April | May | June | July | August | ||||||
|---|---|---|---|---|---|---|---|---|---|---|
| 2017 | 2018 | 2017 | 2018 | 2017 | 2018 | 2017 | 2018 | 2017 | 2018 | |
| Precipitation (mm) | 31.5 | 24.6 | 25.7 | 85.8 | 0 | 57 | 1.5 | 0 | 0.8 | 0 |
| Temperature (°C) | 8.3 | 9.8 | 14.4 | 11.8 | 17.8 | 17.7 | 22.5 | 24 | 23.3 | 24.6 |
| Evaporation (mm) | - | - | 178.7 | 130 | 264.9 | 204.8 | 324.8 | 311.4 | 318 | 308.9 |
| Relative humidity (%) | 59 | 49 | 52 | 65 | 30 | 55 | 32 | 33 | 33 | 40 |
Table 5.
The physical and chemical properties of the experimental site soil.
| Depth | Texture | Nitrogen Total (%) | Absorbable Phosphorus (ppm) | Absorbable Potassium (ppm) | EC (mmhos/cm) | pH | |
|---|---|---|---|---|---|---|---|
| 2017 | 0–30 | Loam/Clay | 0.51 | 12.1 | 463 | 3.13 | 7.4 |
| 2018 | 0–30 | Loam/Clay | 0.49 | 11.8 | 435 | 3.51 | 7.1 |
Publisher’s Note: MDPI stays neutral with regard to jurisdictional claims in published maps and institutional affiliations. |
© 2021 by the authors. Licensee MDPI, Basel, Switzerland. This article is an open access article distributed under the terms and conditions of the Creative Commons Attribution (CC BY) license (http://creativecommons.org/licenses/by/4.0/).
Share and Cite
MDPI and ACS Style
Naservafaei, S.; Sohrabi, Y.; Moradi, P.; Mac Sweeney, E.; Mastinu, A. Biological Response of Lallemantia iberica to Brassinolide Treatment under Different Watering Conditions. Plants 2021, 10, 496. https://doi.org/10.3390/plants10030496
AMA Style
Naservafaei S, Sohrabi Y, Moradi P, Mac Sweeney E, Mastinu A. Biological Response of Lallemantia iberica to Brassinolide Treatment under Different Watering Conditions. Plants. 2021; 10(3):496. https://doi.org/10.3390/plants10030496
Chicago/Turabian StyleNaservafaei, Saeid, Yousef Sohrabi, Parviz Moradi, Eileen Mac Sweeney, and Andrea Mastinu. 2021. "Biological Response of Lallemantia iberica to Brassinolide Treatment under Different Watering Conditions" Plants 10, no. 3: 496. https://doi.org/10.3390/plants10030496
Note that from the first issue of 2016, this journal uses article numbers instead of page numbers. See further details here.