Nitrogen Fertilization Modified the Responses of Schima superba Seedlings to Elevated CO2 in Subtropical China

Key Laboratory of Forest Ecology and Environment of National Forestry and Grassland Administration, Research Institute of Forest Ecology, Environment and Protection, Chinese Academy of Forestry, Beijing 100091, China
*
Author to whom correspondence should be addressed.
Plants 2021, 10(2), 383; https://doi.org/10.3390/plants10020383
Submission received: 23 December 2020
/
Revised: 2 February 2021
/
Accepted: 9 February 2021
/
Published: 17 February 2021
(This article belongs to the Section Plant Response to Abiotic Stress and Climate Change)
Abstract
:There are very few studies about the effects of relatively higher CO2 concentration (e.g., 1000 μmol·mol−1) or plus N fertilization on woody plants. In this study, Schima superba seedings were exposed to ambient or eCO2 (550, 750, and 1000 μmol·mol−1) and N fertilization (0 and 10 g·m−2·yr−1, hereafter: low N, high N, respectively) for one growth season to explore the potential responses in a subtropical site with low soil N availability. N fertilization strongly increased leaf mass-based N by 118.38%, 116.68%, 106.78%, and 138.95%, respectively, in different CO2 treatments and decreased starch, with a half reduction in leaf C:N ratio. Leaf N was significantly decreased by eCO2 in both low N and high N treatments, and N fertilization stimulated the decrease of leaf N and mitigated the increase of leaf C:N by eCO2. In low N treatments, photosynthetic rate (Pn) was maximized at 733 μmol·mol−1 CO2 in August and September, while, in high N treatments, Pn was continuously increased with elevation of CO2. N fertilization significantly increased plant biomass especially at highly elevated CO2, although no response of biomass to eCO2 alone. These findings indicated that N fertilization would modify the response of S. superba to eCO2.
1. Introduction
Elevated atmospheric CO2 concentration (eCO2) and N deposition are always important issues in the research of global change. Until today, amounts of previous studies reported the effects of eCO2 alone or eCO2 combined with N deposition on plants [1,2,3,4,5,6]. While, according to the IPCC (Intergovernmental Panel on Climate Change) Fifth Evaluation Report, the CO2 concentrations will be between 430–480, 580–720, 720–1000 μmol·mol−1, and more than 1000 μmol·mol−1 in 2100 without additional mitigation efforts, respectively, in the four levels of Representative Concentration Pathways (RCPs), RCP2.6, RCP4.5, RCP6.0, and RCP8.5 [7]. RCPs are used for making projections based on these factors, described four different 21st century pathways of greenhouse gas emissions and atmospheric concentrations, air pollutant emissions, and land use in this report [7]. N2O emission will also increase with increasing CO2 concentration, and will reach up to more than 20 T g·yr−1 until 2100 for scenario RCP8.5 [7]. And total reactive-N emissions were predicted to reach 83 and 114 Tg N yr−1 by 2100 under the RCP4.5 and RCP8.5, respectively [8]. A model analysis over the globe indicated that large increases have occurred for all soluble reactive N fractions and will continuously occur mainly in Asia in the future, and NOy deposition will be increased only in Asia [9]. Across all forms of deposition, rates of N deposition in Eastern Asia are among the highest in the world, in which China is a hotspot of N deposition with the greatest number of urban sites mentioned in 174 publications focusing on N deposition over the world [10].
Most of the previous experiments studied the effects of double ambient CO2 concentration (about 700 μmol·mol−1) on plants, which could not predict the potential responses of the plants to the future CO2 concentration based on RCP6.0 and RCP8.5. Although a few reports studied the effects of the higher CO2 concentration like 1000 μmol·mol−1 on the crops [11,12,13,14,15,16,17], to the best of our knowledge, there have been no studies on the effects of about 1000 μmol·mol−1 CO2 combined with N fertilization on woody plants.
This study aimed to explore the responses of native tree species to highly elevated CO2 and N fertilization. S. superba is a representative tree species of subtropical forests in China and widely used in urban landscaping. Previous studies showed that photosynthesis, N:P ratio, biomass accumulation and allocation, and soil respiration of S. superba were affected by eCO2 (about 700 μmol·mol−1) and N deposition [18,19,20]. Photosynthetic rate of S. superba seedlings was reduced, while height growth was enhanced by eCO2, after the exposure of 6 months [20]. Although eCO2 did not affect photosynthetic rate in high N treatment, S. superba grown in ambient N treatment had 23% and 47% greater photosynthate rate (Pn) in ambient CO2 than those in eCO2 after exposure of 20 and 31 months, and leaf N was also reduced by eCO2 in both low and high N treatment [21]. If this species similarly responds to high CO2 concentration as to about 700 μmol·mol−1 CO2 in previous studies, how would it respond to high CO2 and N fertilization? In this present study, we tried to explore the responses of gas exchange, carbohydrates and biomass to different levels of CO2 concentration and N fertilization. We hypothesized that: 1) Pn, leaf N would be reduced much more at 1000 μmol·mol−1 CO2 than at 700 μmol·mol−1 CO2; and 2) nitrogen fertilization would affect the response of S. superba to eCO2.
2. Results
2.1. Leaf N, C:N Ratio, and Carbohydrates
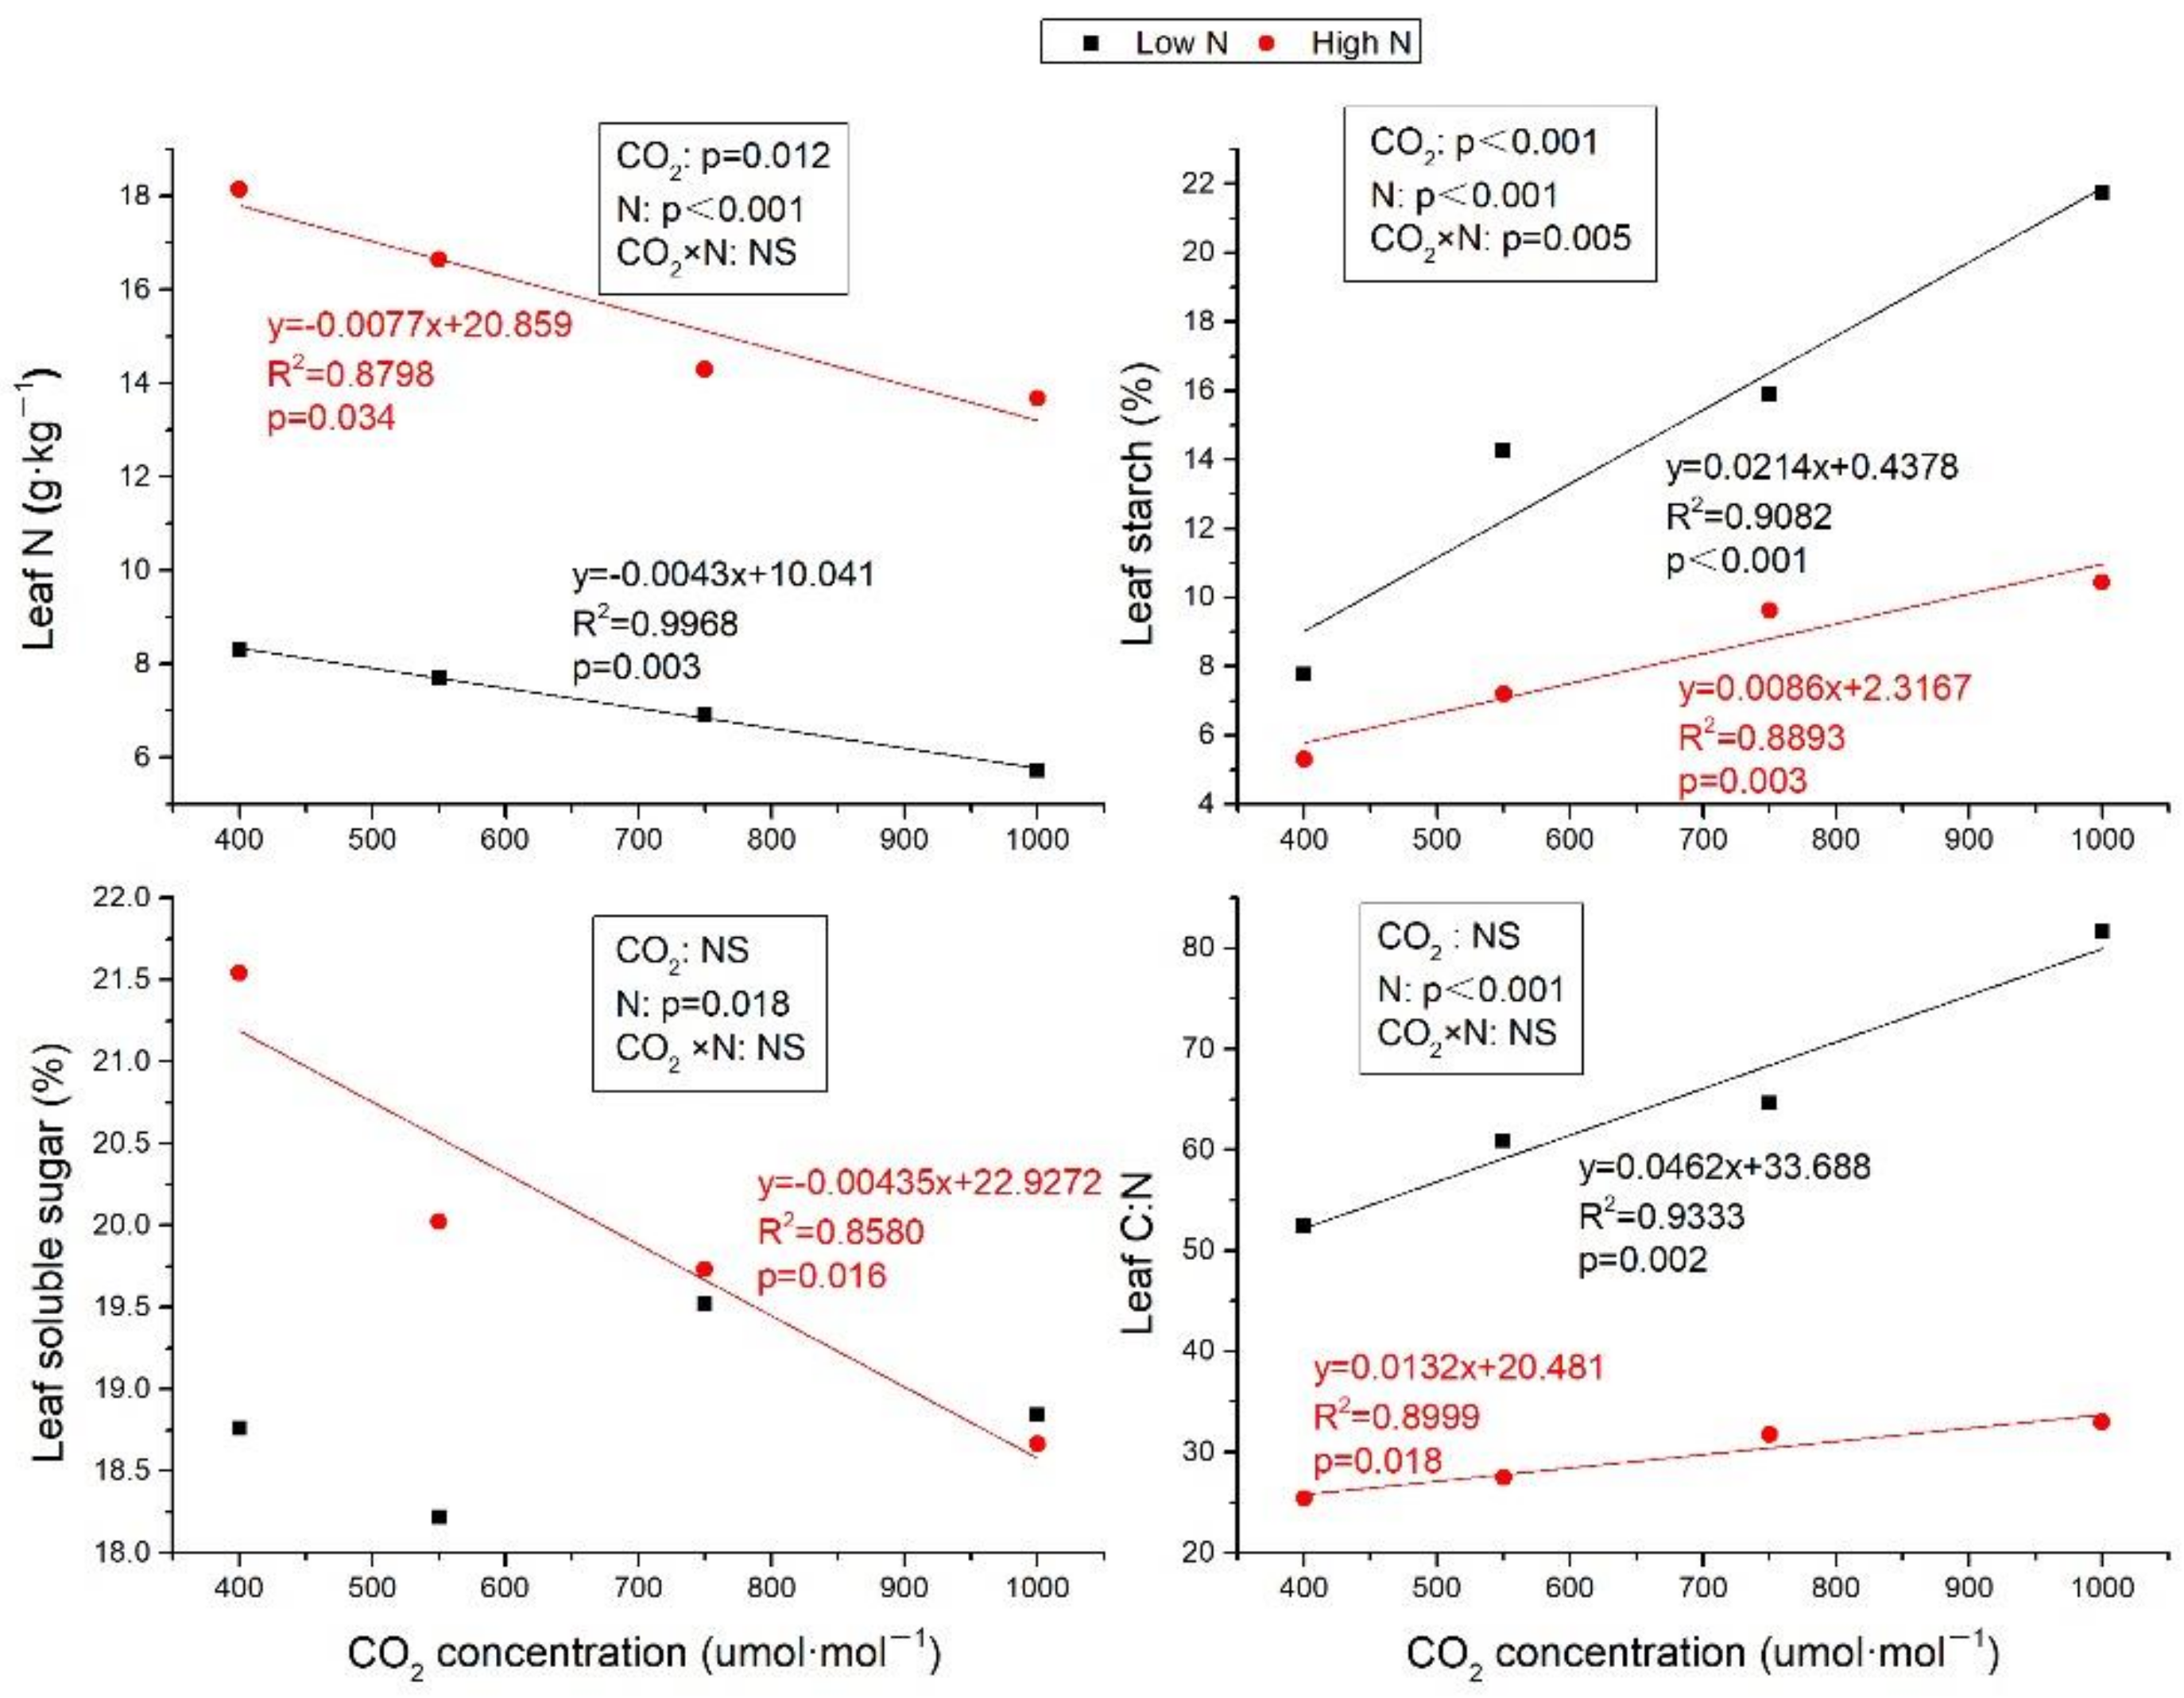
Leaf N was decreased with CO2 concentration increasing at both low N and high N treatments (Figure 1, R2 = 0.9968, p = 0.003 and R2 = 0.8798, p = 0.034, respectively). High N significantly improved leaf N (p ≤ 0.05) (Figure 1) by 118.38%, 116.68%, 106.78%, and 138.95% compared to low N, respectively, at ambient air, 550, 750, and 1000 μmol·mol−1 CO2. Although soluble sugar content was not significantly affected by elevated CO2 at low N, while it was linearly decreased with CO2 enrich at high N (Figure 1, R2 = 0.8580, p = 0.016). The starch content was linearly increased by eCO2 under both low N and high N, while the increment at high N was slower than that at low N (Figure 1). N fertilization decreased the starch contents by 31.52%, 49.36%, 39.32%, and 52.00%, respectively, at ambient, 550, 750, and 1000 μmol·mol−1 CO2. Simultaneously, the accumulation of leaf N and reduction of sugar and starch by high N leaded to reduction in plant C:N ratio by 51.64%, 54.79%, 50.92%, and 59.67%, respectively, at ambient and elevated CO2 concentration under N fertilization (Figure 1). Although leaf C:N was both increased with CO2 concentration increasing at low and high N, the slope of the regression equation at high N was lower than that at low N.
2.2. Gas Exchange
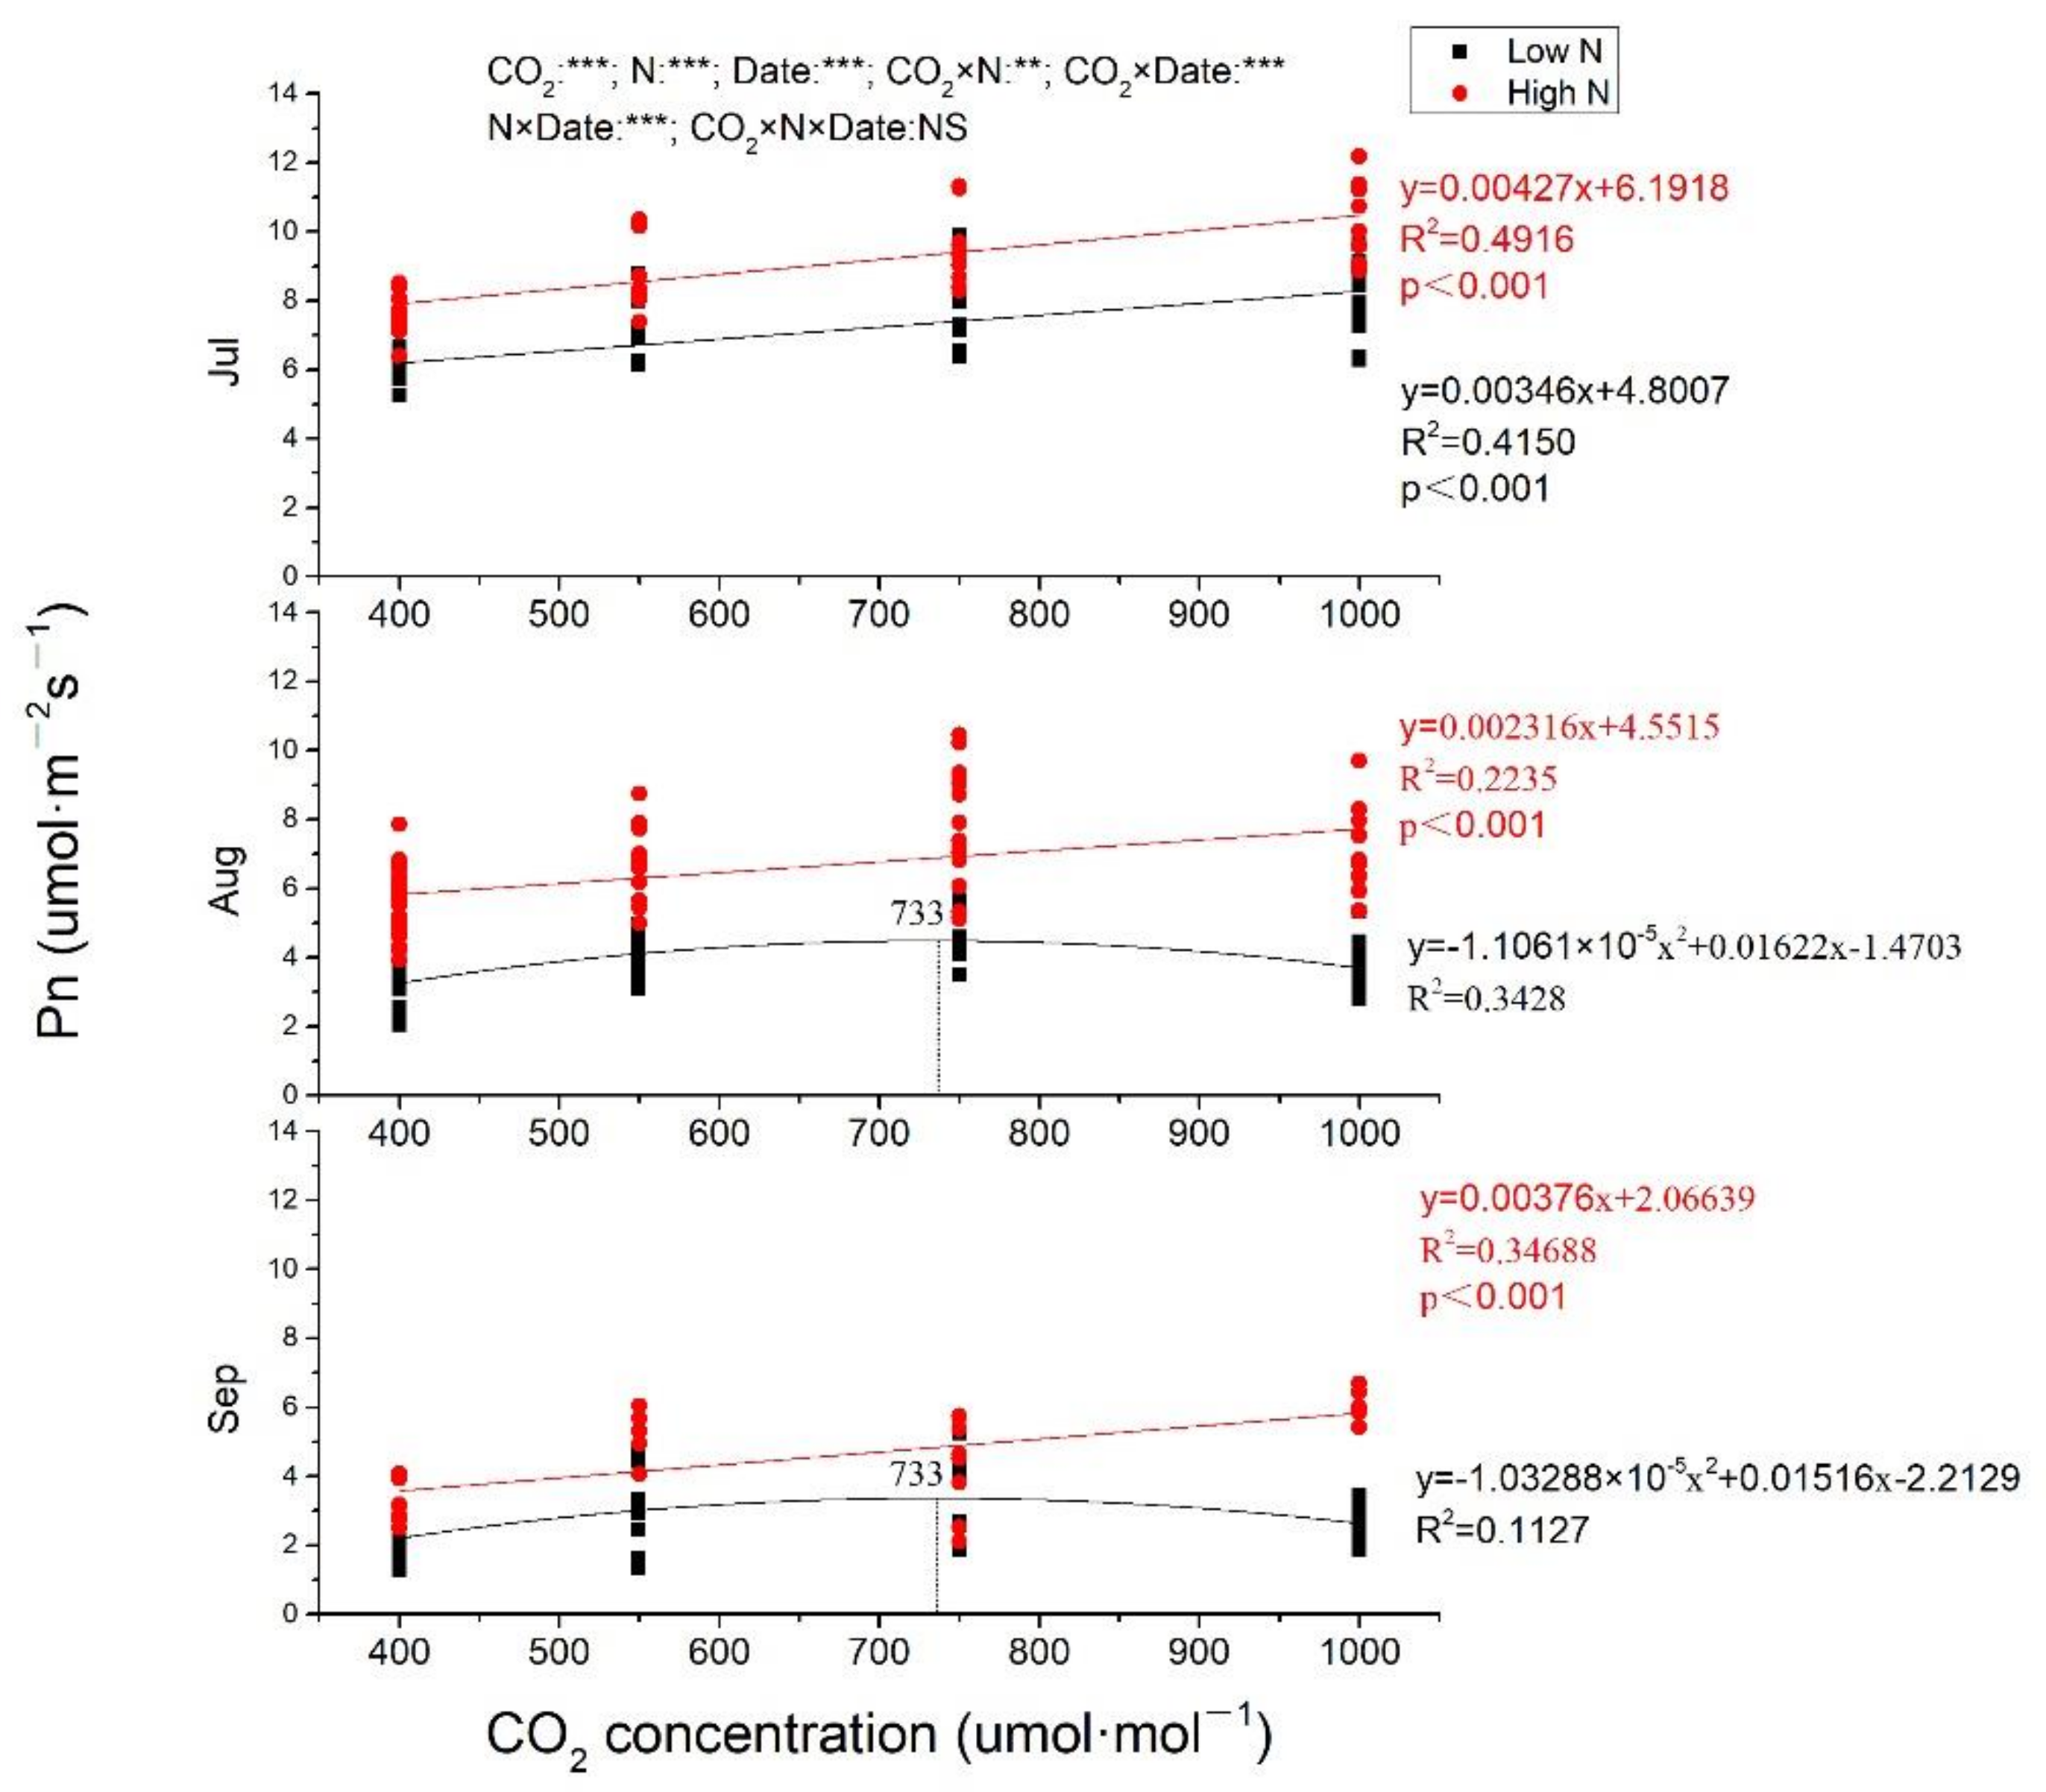
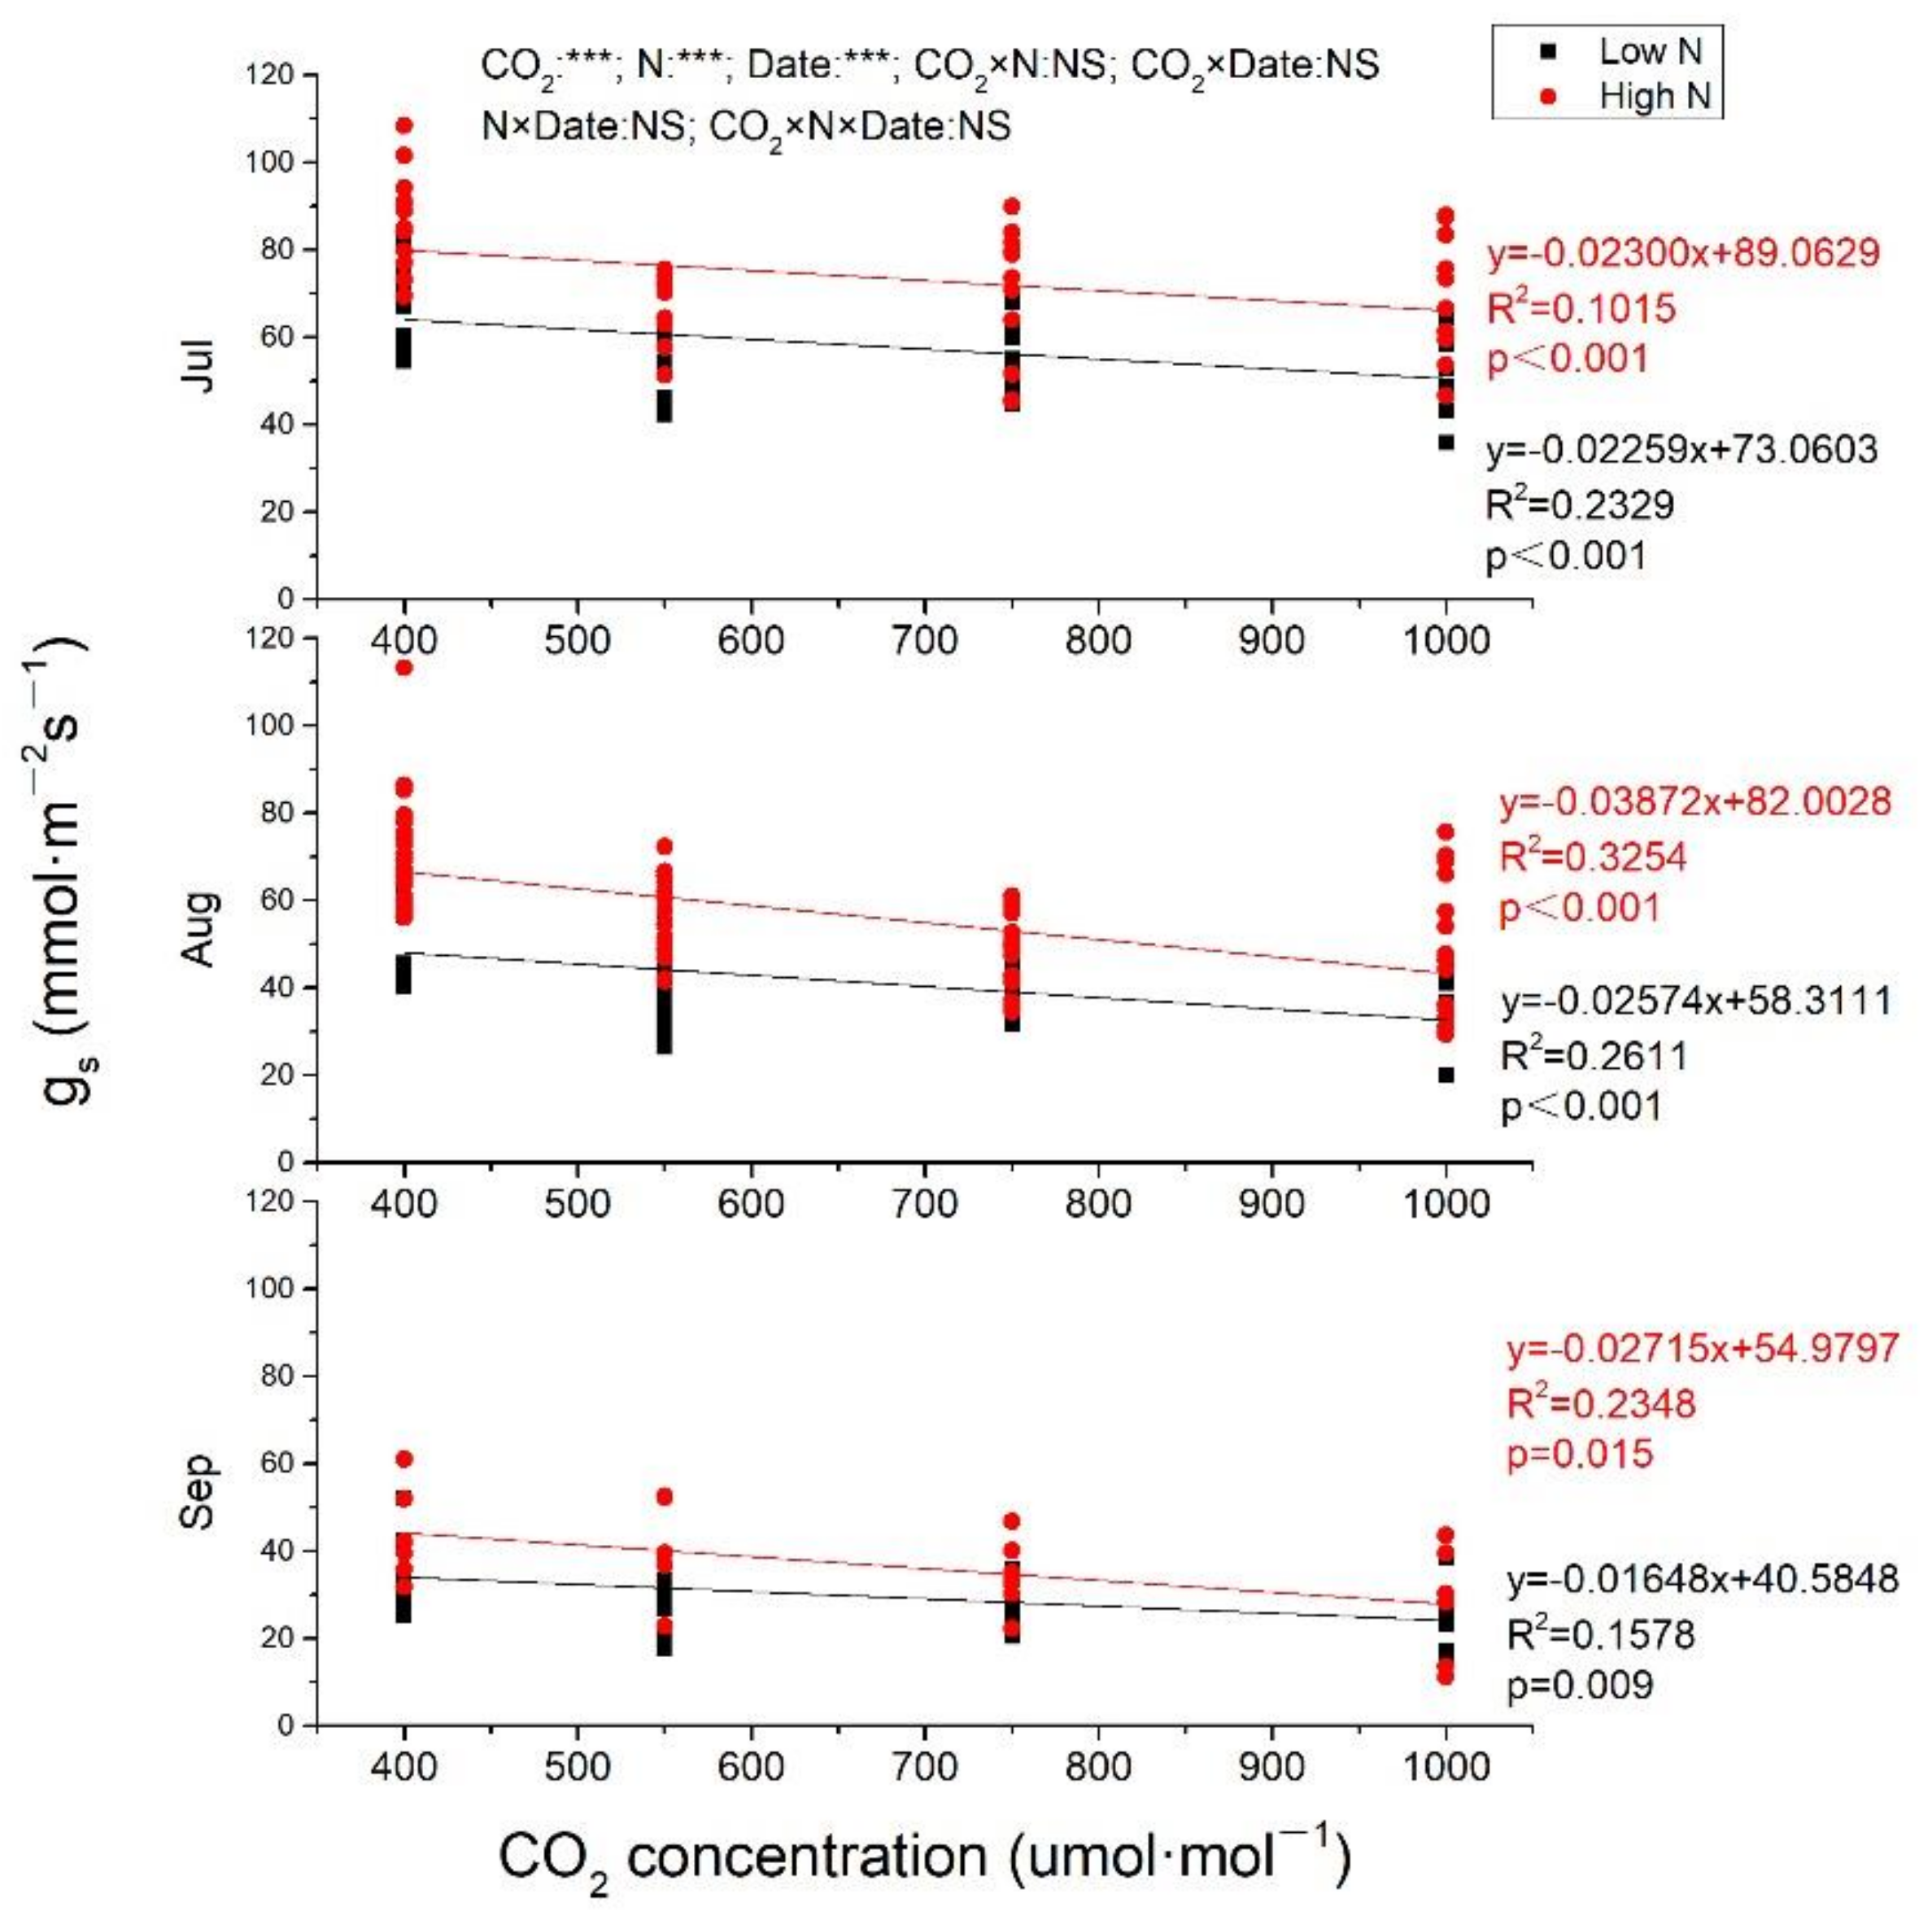
In general, Pn, and gs both decreased from July to September (Figure 2 and Figure 3). In July, Pn was increased with CO2 enrich at both low N and high N, with greater slope at high N (Figure 2). Pn was also linearly increased by eCO2 at high N in August and September (p < 0.001), while, at low N, Pn was increased to the maximum at 733 μmol·mol−1 CO2 and then decreased when CO2 concentration continuously increased (Figure 2). Pn from plants exposed to 1000 μmol·mol−1 CO2 at high N was increased of 73.68%, 119.90%, and 183.46%, respectively, measured in July, August, and September compared to ambient CO2 at low N. CO2 concentration, N fertilization and measuring time all had significant effects on Pn (p < 0.001), and there were significant interactions between CO2 and N, CO2 and measuring time, N and measuring time, while no significant impacts of CO2, N and measuring time on Pn. No matter under low N or high N, gs was significantly negatively correlated with eCO2 in all measuring time (p < 0.001 at both low N and high N in July and August; p = 0.009 and 0.015, respectively, at low N and high N in September. In July, the two lines were almost parallel at both low N and high N with almost equal slopes (0.02259 and 0.02300, respectively, at low N and high N), while, in August and September, gs decreased more quickly with CO2 concentration increasing at high N than that at low N, with steeper lines at high N. Whether it is CO2 concentration, N fertilization, or measuring time, all had significant impacts on gs, while there was no interaction among them (Figure 3).
2.3. Plant Biomass
Elevated CO2 alone even up to 1000 μmol·mol−1 had no effects on plant biomass, including different issue and total biomass, whether at low N or high N. While N fertilization impacted the biomass at eCO2. In ambient CO2 treatments, N fertilization had no effect on biomass. High N significantly increased leaf biomass and total biomass compared to plants in low N treatments at 550 μmol·mol−1 CO2. When plants exposed to 750 μmol·mol−1, N fertilization increased root and total biomass. Notably, N fertilization significantly increased the biomass of each issue and also the total biomass when plants exposed to 1000 μmol·mol−1. The results of two-way ANOVA indicated that eCO2 had not any significant effects on plant biomass, while N fertilization significantly affected biomass (p < 0.001), without interaction between CO2 and N fertilization (Table 1).
3. Discussion
Many studies have shown that eCO2 caused a reduced N concentration, a decrease in gs and an increase of starch accumulation [22,23], all of which were all confirmed by this present study. In this study, eCO2 had a significant negative effect on leaf N in both low and high N treatments, and high N markedly increased leaf N compared to low N in all CO2 treatments, which partially confirmed our first hypothesis that the reduction of leaf N would be much greater at 1000 μmol·mol−1 CO2 than at 700 μmol·mol−1 CO2. The reduction rate of leaf N induced by eCO2 under high N treatments was quicker and the slope was larger than that under low N treatments (Figure 1). The possible reasons for leaf N decline in low N treatments include less N available [24] and CO2 inhibition of nitrate assimilation [25]. While the rapid reduction of leaf N by eCO2 in high N treatments could be interpreted as a dilution effect [26,27], because high N highly stimulated plant biomass (Figure 4). The study conducted in tropical China showed that eCO2 increased leaf N of S. superba, while N fertilization had no effect leaf N [28], which was contrasted with our results that N fertilization affected the response of leaf N to eCO2. The different responses of S. superba to eCO2 and N fertilization between the two studies were attributed to N availability. At tropical site in China, N was not a limiting factor due to high ambient N deposition [28], while, in our experimental site, plants were constrained by N and P [29].
The reduction of leaf N caused by eCO2 led to imbalance of C and N, and the C:N ratio increased with the increase of CO2 concentration. While, it is pivotal to maintain the C:N ratio for various growth and development processes in plants productivity [22]. N fertilization alleviated the effects of eCO2 on imbalance of C and N. Although eCO2 could still increase leaf C:N under high N treatments, the slope of linear regression across CO2 concentration was much smaller than that under low N treatments (Figure 1). The increment of C:N ratio could increase a large accumulation of carbohydrates [30,31,32] that cannot be used for structural growth, which was also confirmed in this present study that starch content was significantly accumulated under higher CO2 concentration in both low N and high N treatments, and the slope of high N treatment was much lower than that of low N (Figure 1). Conversely, lower starch concentrations in high N seedlings than in low N seedlings imply that N fertilization mitigate the inhibition of growth by eCO2 because starch accumulation is a passive response to decreased rates of growth [33]. This was confirmed by the plant biomass in our study, which was not affected by eCO2, and the plant biomass was greatly increased when N was applied at high CO2 concentration (Figure 4).
Although there are exceptions to the general rule that gs declines under eCO2, in Free Air CO2 Enrichment experiments, gs was reduced by 22% on average at eCO2 without any significant change in stomatal density, indicating that the change in stomatal aperture rather than density determines the response of gs to eCO2 [34]. Our study also confirmed that gs was linearly decreased by eCO2 in both low N and high N treatments. Compared with low N, high N increased the slope and intercept of the relationship between gs and CO2 concentration relationship, indicating that the responses of gs of S. superba seedlings to eCO2 was modified by N fertilization as expected in hypothesis 2.
Photosynthetic stimulation was maintained despite stomatal conductance was decreased especially in high N treatments, which is consistent with the previous finding [35]. The first hypothesis that Pn would be reduced much more at 1000 μmol·mol−1 CO2 than at 700 μmol·mol−1 CO2 was well verified in high N treatments, while, in low N treatments, Pn would decrease when CO2 concentration exceeded 733 μmol·mol−1. Pn of S. superba showed downward trend in the whole measurement time, with September < August < July, which could be due to the change of environmental factors, such as the highest temperature in August and the lowest humidity in September in open top chambers (OTCs). Different from our findings that eCO2 increased Pn in most treatments, Pn of S. superba was decreased by eCO2 in both subtropical [20] and tropical sites [21]. The variation of Pn responses of the same species may be caused by the measurement conditions. In fact, in our experiment, Pn was measured in an OTC with the same CO2 concentration corresponding to the treatment, whereas, in the previous studies, Pn was measured in ambient air without considering experimentally set CO2 concentration [20,21]. When plants growing in eCO2 were measured in ambient air, the change of background CO2 concentration may lead to underestimation of Pn. In this study, Pn of low N treatments was linearly increased by eCO2 only in July, while Pn of high N treatments increased linearly throughout July, August, and September, indicating that N modified the response of Pn to eCO2, which confirmed our second hypothesis. This was different to the findings of the previous study [28]; that is, N fertilization did not affect the effects of eCO2 on photosynthesis of S. superba seedlings. This is due to N-limiting in our study site and not N-limiting in their study, which was clarified when discussing the different responses of leaf N of S. superba seedlings to eCO2 and N fertilization above. In August and September, Pn increased and then decreased with elevation of CO2 in low N treatments. Interestingly the maximum of Pn was both under 733 μmol·mol−1 CO2, although the regression relationship was different (Figure 3), which may indicate that 733 μmol·mol−1 CO2 was a certain threshold concentration for the growth of S. superba without N fertilization, while there was no threshold of CO2 concentration for the positive linear correlation between CO2 concentration and Pn when N was applied.
Although it is commonly reported that eCO2 increase the rate of photosynthesis, low N availability could limit the enhancement of biomass accumulation [36]. In this study site, the soil total N content was 0.5%, which was relatively low. It was confirmed in this study that low N availability limited biomass accumulation and even eCO2 reaching 1000 μmol·mol−1 could not increase each organ and total biomass. Compared with plants treated in low N, when plants exposed to eCO2, high N could alleviate low N availability and significantly increase total biomass. N fertilization also increased the biomass of root, stem and leaf when plants were exposed to 1000 μmol·mol−1 CO2. Other studies related to S. superba have also obtained similar results: eCO2 had no effect on biomass, N fertilization promoted the growth [21] and biomass accumulation, and eCO2 and N fertilization had a synergistic effect on biomass [37].
4. Materials and Methods
4.1. Experimental Site and Design
The experiments were carried out in open top chambers (OTCs) of 2 m in diameter and 2.2 m in height, which was used to study the effects of elevated O3 on plants in the past few years, and the details of the OTCs could be found in Chen et al. [38] and Yu et al. [39]. These field OTCs were set up in 2013, located in the Qianyanzhou ecological station of the Chinese Academy of Sciences (115°04′13″E, 26°44′48″N), with a subtropical monsoon climate. The mean annual temperature, mean annual precipitation, and mean relative humidity was 17.8 °C, 1471.2 mm, and 83%, respectively. Soil of the region, weathered from red sandstone and mudstone, is classified as Typic Dystrudepts Udepts Inceptisols using US soil taxonomy [40].
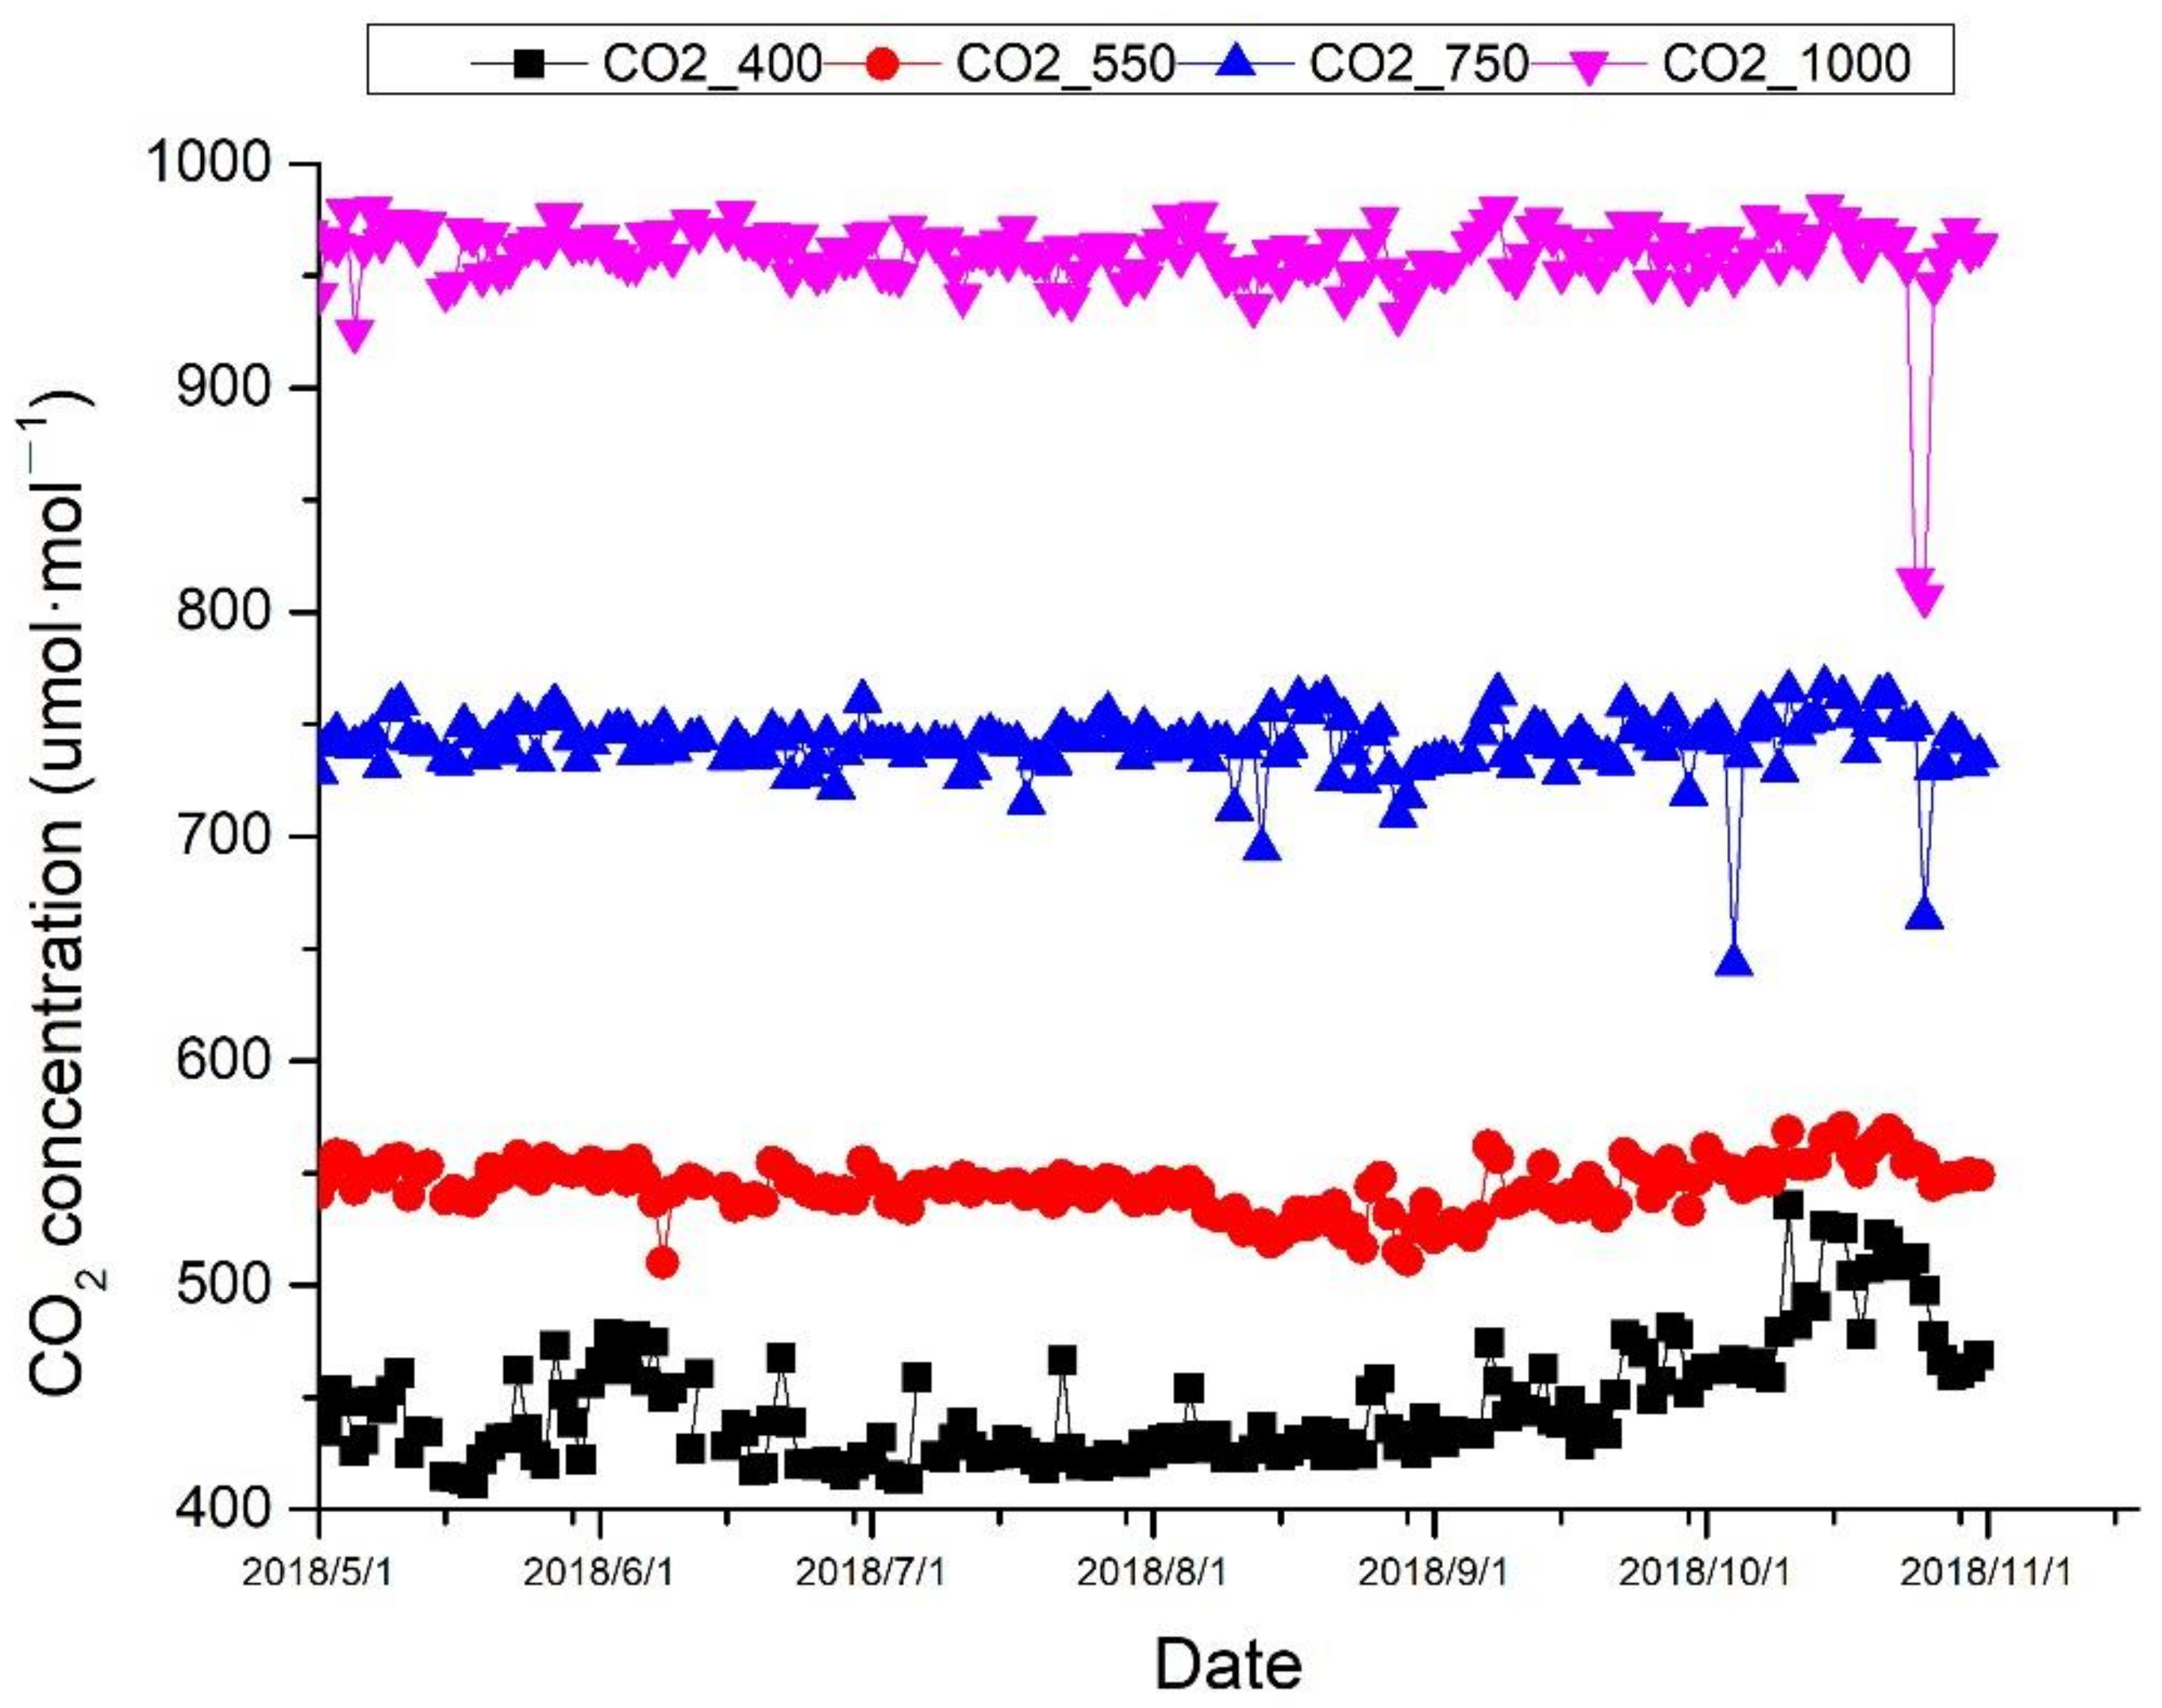
Four different CO2 treatments were set according to RCPs of IPCC, as ambient air (about 400 μmol·mol−1), 550 μmol·mol−1, 750 μmol·mol−1, and 1000 μmol·mol−1, with three respective OTCs for each, and in total 12 OTCs. The concentration of CO2 inside the OTCs was monitored with an CO2 analyzer (FGD2-C-CO2, Shenzhen Xin Hairui Science and Technology Development Co., Ltd., Shenzhen, China). The actual CO2 concentration was shown in Figure 4. In each OTC, there were two nitrogen fertilization treatments, no nitrogen fertilization (low N), and 10 g·m−2·yr−1 (high N). In total, there were eight treatments, and, for each treatment, there were five replicated seedlings and a total of ten seedling in each OTC. The mean light intensity in OTCs was 25,050 Lux, and the mean air temperature and humidity was 26.56 °C and 83.6% in OTCs, during the experiments.
4.2. Plant Growth
One-year-old seedlings of S. superba were transplanted to flower pots (diameter: 30 cm) containing local soil under ambient air condition in April 2018. The baseline soil nutrients were analyzed before the experiment, and the soils contained organic matter content of 8.63 g·kg−1, total nitrogen of 500 mg·kg−1, available p of 1.58 mg·kg−1, available K of 20.1 mg·kg−1, and soil pH was 4.70. In the end of April, the seedlings with similar height and basal stem diameter were selected and moved in to OTCs. And seven days later, the plants were fumigated with ambient or eCO2 air. In each OTC, five plants were selected to receive nitrogen fertilization, and, on June 15, July 20, August 24, and September 20, 2018, 150 mL of KNO3 solution (6.8 g·L−1) per pot was added. The same volume of tap water was applied to the control plants as low N treatment at each time. The seedlings were watered with tap water as needed during the experiment.
4.3. Sampling, Physiological and Biochemical Measurements
To investigate the responses of S. superba to eCO2 and N fertilization, two last years’ fully expanded leaves (third to fifth leaf position from the apex) of the main stem per seedling, and these two leaves were developed before treatments began. Two seedlings per treatment were randomly selected to measure gas exchange parameters. Gas exchange parameters were measured once a month from July to September. On 26 October 2018, about five last year’s fully expanded leaves (third to eighth leaf position from the apex) of the main stem per seedling and three seedlings per treatment in each OTC were randomly selected to determine plant nutrient. Finally, two seedlings without sampling leaves were harvested, and different tissues were dried at 70 °C to constant weight for dry biomass determination.
4.3.1. Plant C, N, and Carbohydrates
Oven-dried samples of different tissues were grounded to powder through a 2-mm sieve for C, N, and carbohydrates analyses. Plant N was decided by an automated Kjeldahl apparatus (KD310, Opsis, Sweden). To extract soluble sugars, powdered leaf (0.5 g, dry weight (dw)) was added to 50 mL distilled water, and then high-pressure steamed for 2 h. Starch was extracted with 0.1 g (dw) powdered material added 10 mL distilled water and 1 mL hydrochloric acid (2:1), and then incubated at 100 °C in a water bath for 8 h. After chilling to room temperature, the mixture was adjusted to neutral pH with 40% NaOH solution. Both of the mixtures were filtrated and diluted to a constant volume at a room temperature. Carbohydrates were represented by water-soluble sugar and starch. Carbohydrates were determined by injection of 10-uL sample volume into a high-performance liquid chromatography system using a Sugar-Pak 1 chromatographic column and a refractive index detector (Waters HPLC 2695, Milford, MA, USA). The column temperature was 70 °C, and distilled water was used as mobile phase (flow rate 0.6 mL/min).
4.3.2. Gas Exchange Measurement
Gas exchange was determined by a LI-6400 portable photosynthesis system (Li-Cor, Lincoln, NE, USA). The system controlled photosynthetically active radiation (PAR) at light-saturating 1000 μmol·m−2 s−1 using 6400-2B red/blue light-emitting diode (LED) light source. The block temperature was set to the ambient average (25–30 °C). Relative humidity was controlled at 50–65%. The parameters were measured in OTC with ambient or elevated CO2 between 9:00 a.m. and 11:30 a.m. The air temperature was 29.2, 32.6, and 31.1 °C, and relative humidity was 81.4%, 71.7%, and 66.2%, respectively, in July, August, and September in OTCs before gas-exchange data collection. The mean light intensity was 26533, 28333, and 30,033 Lux in July, August, and September in OTCs before data collection. The gas exchange parameters included photosynthate rate (Pn, μmol·m−2 s−1), stomatal conductance (gs, μmol·m−2 s−1).
4.4. Statistics
CO2 treatment means were statistically compared, respectively, at low N and high N using the statistical package SPSS (SPSS Inc., Chicago, IL, USA) for leaf nutrition. The relationship between CO2 concentration and means of leaf N, starch, soluble sugar, and C:N were analyzed using Pearson correlation, respectively, at low N and high N. Pearson correlation was also used to determine the relationship between CO2 concentration and Pn and gs. If there was significant correlation, the linear equation was generated by OriginPro 9.0. While, for Pn at low N in August and September, quadratic regression equation was used to explain the relationship between Pn and CO2 concentration, biomass was analyzed by using one-way ANOVA, Tukey’s HSD to determine the effects of CO2 treatments, respectively, at low N and high N, and the effects of N fertilization were determined by t-test at each CO2 level. The single and internal effects of eCO2 and N fertilization on leaf nutrition and biomass, and eCO2, N fertilization, and measuring date on Pn and gs were determined by a multi-way ANOVA. All the figures were produced by OriginPro 9.0.
5. Conclusions
The responses of S. superba to eCO2 are mediated by N fertilization. Although N fertilization increased leaf N of S. superba, leaf N was decreased by eCO2 in both low N and high N, and N fertilization accelerated this reduction with larger slope of eCO2 and leaf N relationship. High N decreased leaf C:N compared to low N, and the slope and intercept of leaf C:N and eCO2 relationship were both decreased, indicating N fertilization mitigated the negative effects of eCO2 on the imbalance of leaf C and N. N fertilization also modified the responses of Pn and gs to eCO2. In low N treatments, Pn was improved with CO2 concentration increasing in July, while, in August and September, Pn was increased and then decreased by eCO2 with a threshold of 733 μmol·mol−1 CO2, and, in high N treatments, Pn was consistently increased by eCO2 in all of July, August, and September. Through these ways, N fertilization application in this low N availability site significantly accumulated the biomass of the S. superba seedlings. Although this present study lasted only one growth season, the results indicated that global change with multi-factors, like both eCO2 and N deposition, could have stronger effects on growth of woody plants, which should be paid continuous attention.
Author Contributions
Conceptualization, H.S. and J.C.; methodology, Z.C. and S.Y.; software, Z.C.; Z.C.; investigation, Z. and S.Y.; data curation, Z.C., S.Y., and J.C.; writing—original draft preparation, Z.C.; writing—review and editing, Z.C. and H.S.; project administration, H.S.; funding acquisition, H.S. and J.C. All authors have read and agreed to the published version of the manuscript.
Funding
This research was funded by the National Key R&D Program of China (2016YFD0600202-3) and National Natural Science Foundation of China (31800526).
Institutional Review Board Statement
Not applicable.
Informed Consent Statement
Not applicable.
Data Availability Statement
The data presented in this study is available on request from the corresponding author.
Acknowledgments
Thanks are due to the Qianyanzhou Ecological Station of the Chinese Academy of Sciences for assistance of experimental base. The authors really appreciate the reviewers for the kind and careful comments.
Conflicts of Interest
The authors declare no conflict of interest.
References
- Maroco, J.P.; Breia, E.; Faria, T.; Pereira, J.S.; Chaves, M.M. Effects of long-term exposure to elevated CO2 and n fertilization on the development of photosynthetic capacity and biomass accumulation in Quercus suber L. Plant Cell Environ. 2002, 25, 105–113. [Google Scholar] [CrossRef]
- De Kauwe, M.G.; Medlyn, B.E.; Zaehle, S.; Walker, A.P.; Dietze, M.C.; Hickler, T.; Jain, A.K.; Luo, Y.; Parton, W.J.; Prentice, I.C.; et al. Forest water use and water use efficiency at elevated CO2: A model-data intercomparison at two contrasting temperate forest FACE sites. Glob. Chang. Biol. 2013, 19, 1759–1779. [Google Scholar] [CrossRef] [PubMed]
- Newingham, B.A.; Vanier, C.H.; Charlet, T.N.; Ogle, K.; Smith, S.D.; Nowak, R.S. No cumulative effect of 10 years of elevated [CO2] on perennial plant biomass components in the Mojave Desert. Glob. Chang. Biol. 2013, 19, 2168–2181. [Google Scholar] [CrossRef]
- Taylor, B.N.; Strand, A.E.; Cooper, E.R.; Beidler, K.V.; Schönholz, M.; Pritchard, S.G. Root length, biomass, tissue chemistry and mycorrhizal colonization following 14 years of CO2 enrichment and 6 years of N fertilization in a warm temperate forest. Tree Physiol. 2014, 34, 955–965. [Google Scholar] [CrossRef] [Green Version]
- Terrer, C.; Vicca, S.; Stocker, B.D.; Hungate, B.A.; Phillips, R.P.; Reich, P.B.; Finzi, A.C.; Prentice, I.C. Ecosystem responses to elevated CO2 governed by plant–soil interactions and the cost of nitrogen acquisition. New Phytol. 2018, 217, 507–522. [Google Scholar] [CrossRef] [Green Version]
- Xu, H.; Xie, H.; Wu, S.; Wang, Z.; He, K. Effects of elevated CO2 and increased N fertilization on plant secondary metabolites and chewing insect fitness. Front. Plant Sci. 2019, 10. [Google Scholar] [CrossRef] [Green Version]
- IPCC. Climate Change 2014: Synthesis Report. Contribution of Working Groups I, II and III to the Fifth Assessment Report of the Intergovernmental Panel on Climate Change; Core Writing Team, Pachauri, R.K., Meyer, L.A., Eds.; IPCC: Geneva, Switzerland, 2014; 151p. [Google Scholar]
- Wang, R.; Goll, D.; Balkanski, Y.; Hauglustaine, D.; Boucher, O.; Ciais, P.; Janssens, I.; Penuelas, J.; Guenet, B.; Sardans, J.; et al. Global forest carbon uptake due to nitrogen and phosphorus deposition from 1850 to 2100. Glob. Chang. Biol. 2017, 23, 4854–4872. [Google Scholar] [CrossRef]
- Kanakidou, M.; Myriokefalitakis, S.; Daskalakis, N.; Fanourgakis, G.; Nenes, A.; Baker, A.R.; Tsigaridis, K.; Mihalopoulos, N. Past, present, and future atmospheric nitrogen deposition. J. Atmos. Sci. 2016, 73, 2039–2047. [Google Scholar] [CrossRef] [Green Version]
- Decina, S.M.; Hutyra, L.R.; Templer, P.H. Hotspots of nitrogen deposition in the world’s urban areas: A global data synthesis. Front. Ecol. Environ. 2020, 18, 92–100. [Google Scholar] [CrossRef] [Green Version]
- Aranjuelo, I.; Cabrerizo, P.M.; Arrese-Igor, C.; Aparicio-Tejo, P.M. Pea plant responsiveness under elevated [CO2] is conditioned by the N source (N2 fixation versus NO3− fertilization). Environ. Exp. Bot. 2013, 95, 34–40. [Google Scholar] [CrossRef] [Green Version]
- Lambreva, M.; Christov, K.; Tsonev, T. Short-term effect of elevated CO2 concentration and high irradiance on the antioxidant enzymes in bean plants. Biol. Plant. 2006, 50, 617–623. [Google Scholar] [CrossRef]
- Ryan, G.D.; Rasmussen, S.; Xue, H.; Parsons, A.J.; Newman, J.A. Metabolite analysis of the effects of elevated CO2 and nitrogen fertilization on the association between tall fescue (Schedonorus arundinaceus) and its fungal symbiont Neotyphodium coenophialum. Plant Cell Environ. 2014, 37, 204–212. [Google Scholar] [CrossRef]
- Yoder, C.K.; Vivin, P.; Defalco, L.A.; Seemann, J.R.; Nowak, R.S. Root growth and function of three Mojave Desert grasses in response to elevated atmospheric CO2 concentration. New Phytol. 2000, 145, 245–256. [Google Scholar] [CrossRef] [Green Version]
- Polley, H.W.; Johnson, H.B.; Mayeux, H.S. Leaf physiology, production, water use, and nitrogen dynamics of the grassland invader Acacia smallii at elevated CO2 concentrations. Tree Physiol. 1997, 17, 89–96. [Google Scholar] [CrossRef] [PubMed] [Green Version]
- McDonald, E.P.; Erickson, J.E.; Kruger, E.L. Can decreased transpiration limit plant nitrogen acquisition in elevated CO2? Funct. Plant Biol. 2002, 29, 1115–1120. [Google Scholar] [CrossRef]
- Chang, Z.; Ma, Y.; Zhou, C. Effects of elevated CO2 concentration on water use efficiency of Tamarix ramosissima in an extremely arid region. Environ. Earth Sci. 2016, 75, 1409.1–1409.6. [Google Scholar] [CrossRef]
- Deng, Q.; Zhou, G.; Liu, J.; Liu, S.; Duan, H.; Zhang, D. Responses of soil respiration to elevated carbon dioxide and nitrogen addition in young subtropical forest ecosystems in China. Biogeosciences 2010, 7, 315–328. [Google Scholar] [CrossRef] [Green Version]
- Liu, J.; Huang, W.; Zhou, G.; Zhang, D.; Liu, S.; Li, Y. Nitrogen to phosphorus ratios of tree species in response to elevated carbon dioxide and nitrogen addition in subtropical forests. Glob. Chang. Biol. 2013, 19, 208–216. [Google Scholar] [CrossRef]
- Sheu, B.H.; Lin, C.K. Photosynthetic response of seedlings of the sub-tropical tree Schima superba with exposure to elevated carbon dioxide and temperature. Environ. Exp. Bot. 1999, 41, 57–65. [Google Scholar] [CrossRef]
- Liu, J.; Zhou, G.; Xu, Z.; Duan, H.; Li, Y.; Zhang, D. Photosynthesis acclimation, leaf nitrogen concentration, and growth of four tree species over 3 years in response to elevated carbon dioxide and nitrogen treatment in subtropical China. J. Soils Sediments 2011, 11, 1155–1164. [Google Scholar] [CrossRef]
- Kant, S.; Seneweera, S.; Rodin, J.; Materne, M.; Burch, D.; Rothstein, S.J.; Spangenberg, G. Improving yield potential in crops under elevated CO2: Integrating the photosynthetic and nitrogen utilization efficiencies. Front. Plant Sci. 2012, 3, 162. [Google Scholar] [CrossRef] [PubMed] [Green Version]
- Lotfiomran, N.; Köhl, M.; Fromm, J. Interaction effect between elevated CO2 and fertilization on biomass, gas exchange and C/N ratio of European beech (Fagus sylvatica L.). Plants 2016, 5, 38. [Google Scholar] [CrossRef] [Green Version]
- Taub, D.R.; Wang, X. Why are nitrogen concentrations in plant tissues lower under elevated CO2? A critical examination of the hypotheses. J. Integr. Plant Biol. 2008, 50, 1365–1374. [Google Scholar] [CrossRef]
- Bloom, A.J.; Burger, M.; Kimball, B.A.; Pinter, J.P., Jr. Nitrate assimilation is inhibited by elevated CO2 in field-grown wheat. Nat. Clim. Chang. 2014, 4, 477–480. [Google Scholar] [CrossRef]
- Li, L.; Manning, W.; Wang, X. Elevated CO2 increases root mass and leaf nitrogen resorption in red maple (Acer rubrum L.). Forests 2019, 10, 420. [Google Scholar] [CrossRef] [Green Version]
- Calfapietra, C.; Tulva, I.; Eensalu, E.; Perez, M.; De Angelis, P.; Scarascia-Mugnozza, G.; Kull, O. Canopy profiles of photosynthetic parameters under elevated CO2 and N fertilization in a poplar plantation. Environ. Pollut. 2005, 137, 525–535. [Google Scholar] [CrossRef] [PubMed]
- Liu, J.; Zhang, D.; Zhou, G.; Duan, H. Changes in leaf nutrient traits and photosynthesis of four tree species: Effects of elevated [CO2], N fertilization and canopy positions. J. Plant Ecol. 2012, 5, 376–390. [Google Scholar] [CrossRef] [Green Version]
- Kou, L.; Guo, D.; Yang, H.; Gao, W.; Li, S. Growth, morphological traits and mycorrhizal colonization of fine roots respond differently to nitrogen addition in a slash pine plantation in subtropical China. Plant Soil 2015, 391, 207–218. [Google Scholar] [CrossRef]
- Wingler, A.; Purdy, S.; MacLean, J.A.; Pourtau, N. The role of sugars in integrating environmental signals during the regulation of leaf senescence. J. Exp. Bot. 2006, 57, 391–399. [Google Scholar] [CrossRef] [Green Version]
- Reddy, A.R.; Rasineni, G.K.; Raghavendra, A.S. The impact of global elevated CO2 concentration on photosynthesis and plant productivity. Curr. Sci. 2010, 99, 46–57. [Google Scholar]
- Kimball, B.A. Crop responses to elevated CO2 and interactions with H2O, N, and temperature. Curr. Opin. Plant Biol. 2016, 31, 36–43. [Google Scholar] [CrossRef]
- Vizoso, S.; Gerant, D.; Guehl, J.M.; Joffre, R.; Chalot, M.; Gross, P.; Maillard, P. Do elevation of CO2 concentration and nitrogen fertilization alter storage and remobilization of carbon and nitrogen in pedunculate oak saplings? Tree Physiol. 2008, 28, 1729–1739. [Google Scholar] [CrossRef]
- Ainsworth, E.A.; Rogers, A. The response of photosynthesis and stomatal conductance to rising [CO2]: Mechanisms and environmental interactions. Plant Cell Environ. 2007, 30, 258–270. [Google Scholar] [CrossRef]
- Ainsworth, E.A.; Davey, P.A.; Hymus, G.J.; Osborne, C.P.; Rogers, A.; Blum, H.; Nösberger, J.; Long, S.P. Is stimulation of leaf photosynthesis by elevated carbon dioxide concentration maintained in the long term? A test with Lolium perenne grown for 10 years at two nitrogen fertilization levels under Free Air CO2 Enrichment (FACE). Plant Cell Environ. 2003, 26, 705–714. [Google Scholar] [CrossRef] [Green Version]
- Duval, B.D.; Blankinship, J.C.; Dijkstra, P.; Hungate, B.A. CO2 effects on plant nutrient concentration depend on plant functional group and available nitrogen: A meta-analysis. Plant Ecol. 2012, 213, 505–521. [Google Scholar] [CrossRef]
- Duan, H.L.; Liu, J.X.; Deng, Q.; Chen, X.M.; Zhang, D.Q. Effects of elevated CO2 and N deposition on plant biomass accumulation and allocation in subtropical forest ecosystems: A mesocosm study. Chin. J. Plant Ecol. 2009, 33, 570–579. [Google Scholar]
- Chen, Z.; Maltz, M.R.; Cao, J.; Yu, H.; Shang, H.; Aronson, E. Elevated O3 alters soil bacterial and fungal communities and the dynamics of carbon and nitrogen. Sci. Total Environ. 2019, 677, 272–280. [Google Scholar] [CrossRef]
- Yu, H.; Cao, J.; Chen, Z.; Shang, H. Effects of elevated O3 on physiological and biochemical responses in three kinds of trees native to subtropical forest in China during non-growing period. Environ. Pollut. 2018, 234, 716–725. [Google Scholar] [CrossRef]
- Wang, Y.; Wang, Z.L.; Wang, H.; Guo, C.; Bao, W. Rainfall pulse primarily drives litterfall respiration and its contribution to soil respiration in a young exotic pine plantation in subtropical China. Can. J. For. Res. 2012, 42, 657–666. [Google Scholar] [CrossRef]
Figure 1.
The different effects of elevated CO2 on leaf N, carbohydrates and leaf C:N between low N and high N treatments. The results of two-factor analysis were also shown. NS: not significant. Leaf N, soluble sugar, and starch were all calculated by dry mass. Values are means ± SE (n = 6).
Figure 1.
The different effects of elevated CO2 on leaf N, carbohydrates and leaf C:N between low N and high N treatments. The results of two-factor analysis were also shown. NS: not significant. Leaf N, soluble sugar, and starch were all calculated by dry mass. Values are means ± SE (n = 6).

Figure 2.
The different responses of photosynthate rate to elevated CO2 at low N and high N treatments. Pn, photosynthate rate. CO2: different CO2 concentrations; N: N fertilization; Date: measuring time; ***, **: significant at 0.001 and 0.01 level; NS: not significant; Jul: July; Aug: August; Sep: September.

Figure 3.
The effects of elevated CO2 and N fertilization on stomatal conductance. gs, stomatal conductance. CO2: different CO2 concentrations; N: N fertilization; Date: measuring date; ***: significant at 0.001 level; NS: not significant. Jul: July; Aug: August; Sep: September.
Figure 3.
The effects of elevated CO2 and N fertilization on stomatal conductance. gs, stomatal conductance. CO2: different CO2 concentrations; N: N fertilization; Date: measuring date; ***: significant at 0.001 level; NS: not significant. Jul: July; Aug: August; Sep: September.

Figure 4.
The actual CO2 concentration at different treatments during the growth season.


Table 1.
Effects of elevated CO2 and N fertilization on plant biomass. p-Values (in the brackets) indicate significant differences between mean values of low N and high N at the same CO2 concentration. For the main effect of either CO2 or N fertilization, and the interaction between CO2 and N fertilization, p-values indicate significant effects of that factor on these biomass variables; “NS” indicate no significant effects of a factor on biomass. dw, dry weight; Root, root biomass; Stem, stem biomass; Leaf, leaf biomass; Total, total biomass. CO2, different CO2 concentration treatments; N, different N fertilization treatments; CO2 × N, the interaction of CO2 concentration and N fertilization.
| CO2 (μmol·mol−1) | Biomass (g dw) | ||||
|---|---|---|---|---|---|
| Root | Stem | Leaf | Total | ||
| ambient | Low N | 6.77 ± 0.89 | 5.37 ± 0.87 | 6.17 ± 1.08 | 18.30 ±2.73 |
| High N | 7.55 ± 0.66 (0.519) | 8.63 ± 1.52 (0.135) | 9.55 ± 1.52 (0.144) | 25.73 ±3.60 (0.176) | |
| 550 | Low N | 5.50 ± 1.05 | 5.18 ± 0.45 | 5.30 ± 1.15 | 15.98 ±2.60 |
| High N | 9.38 ± 1.75 (0.130) | 7.10 ± 0.40 (0.063) | 10.13 ± 0.52 (0.019) | 26.62 ± 2.83 (0.05) | |
| 750 | Low N | 5.42 ± 0.83 | 5.85 ± 0.81 | 5.53 ± 0.49 | 16.80 ± 1.35 |
| High N | 11.70 ± 1.70 (0.30) | 12.42 ± 2.65 (0.077) | 12.17 ± 2.44 (0.056) | 36.28 ± 6.51 (0.043) | |
| 1000 | Low N | 6.98 ± 1.02 | 5.95 ± 1.2 | 6.12 ± 0.91 | 19.05 ± 2.96 |
| High N | 13.60 ± 1.94 (0.039) | 12.45 ± 0.60 (0.008) | 13.27 ± 0.15 (0.014) | 39.32 ± 1.32 (0.003) | |
| CO2 | NS | NS | NS | NS | |
| N | <0.001 | <0.001 | <0.0001 | <0.0001 | |
| CO2 × N | NS | NS | NS | NS | |
Publisher’s Note: MDPI stays neutral with regard to jurisdictional claims in published maps and institutional affiliations. |
© 2021 by the authors. Licensee MDPI, Basel, Switzerland. This article is an open access article distributed under the terms and conditions of the Creative Commons Attribution (CC BY) license (http://creativecommons.org/licenses/by/4.0/).
Share and Cite
MDPI and ACS Style
Chen, Z.; Ye, S.; Cao, J.; Shang, H. Nitrogen Fertilization Modified the Responses of Schima superba Seedlings to Elevated CO2 in Subtropical China. Plants 2021, 10, 383. https://doi.org/10.3390/plants10020383
AMA Style
Chen Z, Ye S, Cao J, Shang H. Nitrogen Fertilization Modified the Responses of Schima superba Seedlings to Elevated CO2 in Subtropical China. Plants. 2021; 10(2):383. https://doi.org/10.3390/plants10020383
Chicago/Turabian StyleChen, Zhan, Siyuan Ye, Jixin Cao, and He Shang. 2021. "Nitrogen Fertilization Modified the Responses of Schima superba Seedlings to Elevated CO2 in Subtropical China" Plants 10, no. 2: 383. https://doi.org/10.3390/plants10020383
Note that from the first issue of 2016, this journal uses article numbers instead of page numbers. See further details here.