
Near-Infrared Transitions from the Singlet Excited States to the Ground Triplet State of the S2 Molecule

1
Institute of Atomic and Molecular Physics, Jilin University, Changchun 130012, China
2
Department of Chemistry and Nanomaterials Science, Bohdan Khmelnytsky National University, 18031 Cherkasy, Ukraine
3
Department of Physics and Astronomy, Uppsala University, 752 36 Uppsala, Sweden
*
Author to whom correspondence should be addressed.
Physchem 2023, 3(1), 110-124; https://doi.org/10.3390/physchem3010009
Submission received: 18 November 2022
/
Revised: 4 February 2023
/
Accepted: 7 February 2023
/
Published: 10 February 2023
Abstract
:Intensity of transitions from the and a1Δg states to the ground state in the near IR emission spectrum of the S2 molecule has been calculated by the multireference configuration interaction method taking into account spin-orbit coupling (SOC). The intensity of the − transition is largely determined by the spin interaction with the electromagnetic wave, which comes from the zero-field splitting of the ground X multiplet and the SOC-induced mixing between b and states. The Einstein coefficients for the experimentally detected 0−0, 0−1, 1−1 bands of the emission system are calculated in good agreement with observations. The Einstein coefficient of the magnetic dipole transition is very low, being equal to 0.0014 s−1. Nonetheless, the weakest of all experimentally observed bands (the 0−0 band of the a-XMs=±1 transition) qualitatively corresponds to this calculation. Most importantly, we provide many other IR bands for magnetic dipole − and transitions, which could be experimentally observable in the S2 transparency windows from a theoretical point of view. We hope that these results will contribute to the further experimental exploration of the magnetic infrared bands in the S2 dimer.
1. Introduction
Diatomic sulfur as an important component of sulfur vapor has been widely studied by optical and microwave spectroscopy in laboratories at high temperatures near the sulfur melting point [1,2,3,4]. The dimer S2 radical was also found in combustion processes, volcanic activity, and electric discharges through the sulfur vapor and sulfur-containing compounds [1,2,3,5]. At the same time, the S2 molecule is one of the most important species in astrophysics. Compared with the research of O2, the importance of the experimental spectral observation of S2 cannot be ignored. For example, S2 was monitored regularly, and it could track the star’s apparent path in the sky through the images. It possesses a short lifetime due to ultraviolet (UV) photo-dissociation in space. Thus, the diatomic sulfur (S2) radical has been detected in comet spectra [6,7]. Particularly, its emission is seen in the impact site of the comet Shoemaker-Levy 9 on Jupiter. For the same reason, the S2 radical is an ideal monitor for behavior of a cometary nucleus. Moreover, the S gas was also found in the absorption spectrum of the lo’s Pele plume against Jupiter by the HubSpace Telescope in 1999 [8].
The quantum mechanical calculations of the spin-allowed electronic transitions in S2 molecular spectra [9] and photo-dissociation dynamics [10,11,12,13] have been quite successful. In the well-known analogy of the dioxygen Schumann-Rung bands [14], the system of S2 was studied by many authors [9,10,11,12,13].
Wieland et al. [15] have observed strong absorption bands of the S2 molecule in the far UV region 160–187 nm, which were later reinvestigated [3] and classified as C3IIu − and D3IIu − transitions. In 1962, Tanaka [2] detected four systems of emission bands, all of which are of the Σ-Σ type in the region 1760–2130 Å. They differ from the C3IIu − and D3IIu − strong bands [3] in the absorption of the S2 molecule. It is known that the high vibrational energy levels of the state are strongly predissociated by the crossing with the B″3IIu state [4,9]. The presence of the ← Schumann−Rung analogous bands system [10,11,12,13] and other optically allowed B″3IIu − transitions [11] in the UV and visible regions of S2 absorption spectra was investigated and interpreted [9]. In addition, there is one transient absorption in the far ultraviolet region that was assigned as the f1Δu−a1Δg transition from a metastable state a1Δg [13,16].
Four progressions of S2 in the visible and near-infrared regions were observed using the laser-induced emission technique [17]; they were assigned as the and a1Δg transitions. According to the above, we know that many transition bands of S2 have been observed; however, they are basically the transitions allowed by the electric dipole moment, and some weak transitions have not been mentioned. On the other hand, we find that the study of the transitions of S2 molecules is still insufficient.
Both O2 and S2 are important components of astrophysics [6,7]. The spectral assignments that are based mainly on the vibrational spacings of the lower states and the electronic energy separations sometimes become difficult. Therefore, it is necessary to calculate some low-energy transitions. Thus, it is important to know as much as possible about their magnetic and electro-quadrupole properties. The intensity of the transitions was predicted by quantum mechanics, which would be complicated from a theoretical point of view since such evaluation of the method needs to take into account spin-orbit coupling, which leads to the admixture of wave functions for the different multiplet states.
The group VI A diatomic species O2 and S2 have the ground state, the near-infrared a1Δg, and the red counterpart of the (…σg2πu2) configuration [18,19,20,21]. Transitions between these states are strictly forbidden by electric dipole selection rules. However, they acquire weak magnetic dipole and electro-quadrupole transition moments due to spin–orbit coupling induced mixing of various electronic states [18,21]. Thus, the transitions between these states are easily obtained in the absorption and emission spectra of O2 and S2 molecules [17,22,23,24,25]. The system is the analog of the atmospheric O2 bands; it has been observed in emission in the near infrared using a discharge flow system in which metastable O2 (1Δg) molecules sensitized the emission of the S2 molecules [22]. The study of transitions is helpful to compare the electronic structures of the two molecules.
This procedure involves the spin-orbit matrix elements between singlet and triplet states of the S2 molecule, which were obtained in a series of AO basis sets [20,21]. Transitions require accurate energy levels and transition moments to better reduce errors. The state of S2 could be efficiently quenched by collisions; it still produces the emission spectra of magnetic dipole (0−0,0−1,1−1) transitions of S2 which were measured by the Fourier-transform spectrometer at high resolution [22]. In addition, dating back to 1979, the weak emission spectra for the (v′ = 0, v″ = 0) band of the magnetic dipole transition was detected in the near-infrared region [23,24]. The intensity of the band for a chemically unstable S2 molecule is very low; its short radiative lifetime was calculated to be about 350 s (the Einstein coefficient A = 0.00286 s−1) [21]. At present, few studies have given a complete and accurate calculation of the electronic-state energy level and transition moment of the S2 molecule. The current work makes up for the lack of predecessors and provides theoretical support for future generations.
The primary purpose of the present work is to study the intensity of parity-forbidden singlet-triplet (S-T) transitions between and a1Δg, states in the S2 dimer using the MRCI+Q method, which could explain how to overcome the spin-forbidden transition of the electric-dipole approximation taking into account spin-orbit coupling. Previous studies of the S2 dimer have mainly focused on the UV and visible regions. In addition, the near-infrared (0−0, 0−1, 1−1) and (0−0) bands [22,25] have also been observed experimentally. The current work calculates the magnetic dipole moment of the and transitions of S2 for other vibronic bands in the microwave–infrared regions, which could be observed from a theoretical point of view. The transition properties of the and states with respect to the ground state have been evaluated by SOC perturbations from the 3Πg and 1Πg states of the S2 systems. We also note that the magnetic dipole transition moment is decided by the spin part due to the zero-field splitting of the state [18,19,20,21]. The calculated magnetic dipole transition only contains the orbital angular-momentum contribution [18]. In addition, the error source for the Einstein coefficient is discussed. It is most important that we successfully reproduce the experimentally observed magnetic dipole and vibronic bands in our efforts to obtain full predictions. The weak intensities of electro-quadrupole and bands are also investigated since they should exhibit a particular rovibronic structure. However, the results show that there is little hope that these quadrupole bands can be measured experimentally. Nevertheless, the present results may help further search for the magneto-infrared band in the S2 systems.
2. Method of Calculations
The electronic structure calculation of S2 has been carried out with the Molpro 2012 suite of the quantum chemical package [26]. The “aug−cc−pwCVTZ” basis set with diffuse s-type (0.018684493) and p-type (0.011220492) Gaussian functions is used for the S atom. There are two electrons (excluding the 1s2 electron of S) participating in the MRCI calculation of S2, and the corresponding active space is determined by eight molecular orbitals (MOs), including two σg, one πu, one πu, two σu, one πg, and one πg symmetry (3s23p4). The SOC is considered with the aid of the state-interacting approach utilizing the Breit–Pauli operator. After taking the eigenfunction of the unperturbed Ĥel Hamiltonian as the basis of diagonalization, the diagonalized Ĥel + Ĥso matrix can obtain the eigenfunction and eigenvalue of the electronic state (Ω presentation).
The magnetic dipole operator M consists of two terms, which are spin (S) and orbital angular momentum (L); it is determined by
where the electronic g-factor ge is equal to 2.0023. Then, after taking the SOC into account, the singlet and the triplet states are mixed, and the perturbed wave function Φ of the electronic state is expressed as
where
The mixing coefficient of the infrared band ( transition) is calculated as Cb,X = 0.05504i, which is derived from the SOC matrix element (426.53 cm−1) and energy difference ΔEb−X = 7749 cm−1; the former is determined by the multiplet splitting for the S(3P) state.
The spin contribution of magnetic operator Equation (1), taking into account Equation (4), becomes
Besides the spin contribution, the contribution of the orbital angular momentum L to the magnetic dipole transition moment is also essential. Taking the orbital section of the transition as an example, we obtain
The role of the intermediate 3Πg and 1Πg states is to establish a connection between the singlet (a1Δg and state and the triplet ground () state, allowing the S2 molecule to arise from these magnetic transitions in the near-IR region. In addition, the intensity of the quadrupole transition moment is determined by
Here, Q is the quadrupole part of the multipole expansion of radiation. For different transitions, the formulas of the Einstein coefficient A have different expressions, Equations (10) and (11), corresponding to the magnetic dipole moment and the electro-quadrupole moment, respectively.
A = 0.2706 × E3 × 10−10 × M2
A =1.1199 × 10⁻²² × Q2× E5
The unit of energy E is cm−1; the magnetic dipole moment M, electric quadrupole moment Q, and Einstein coefficient A are in units of the Bohr magneton, ea02, and s−1, respectively.
3. Results for the S2 Molecule
3.1. Energy Calculations in the S2 Spectrum
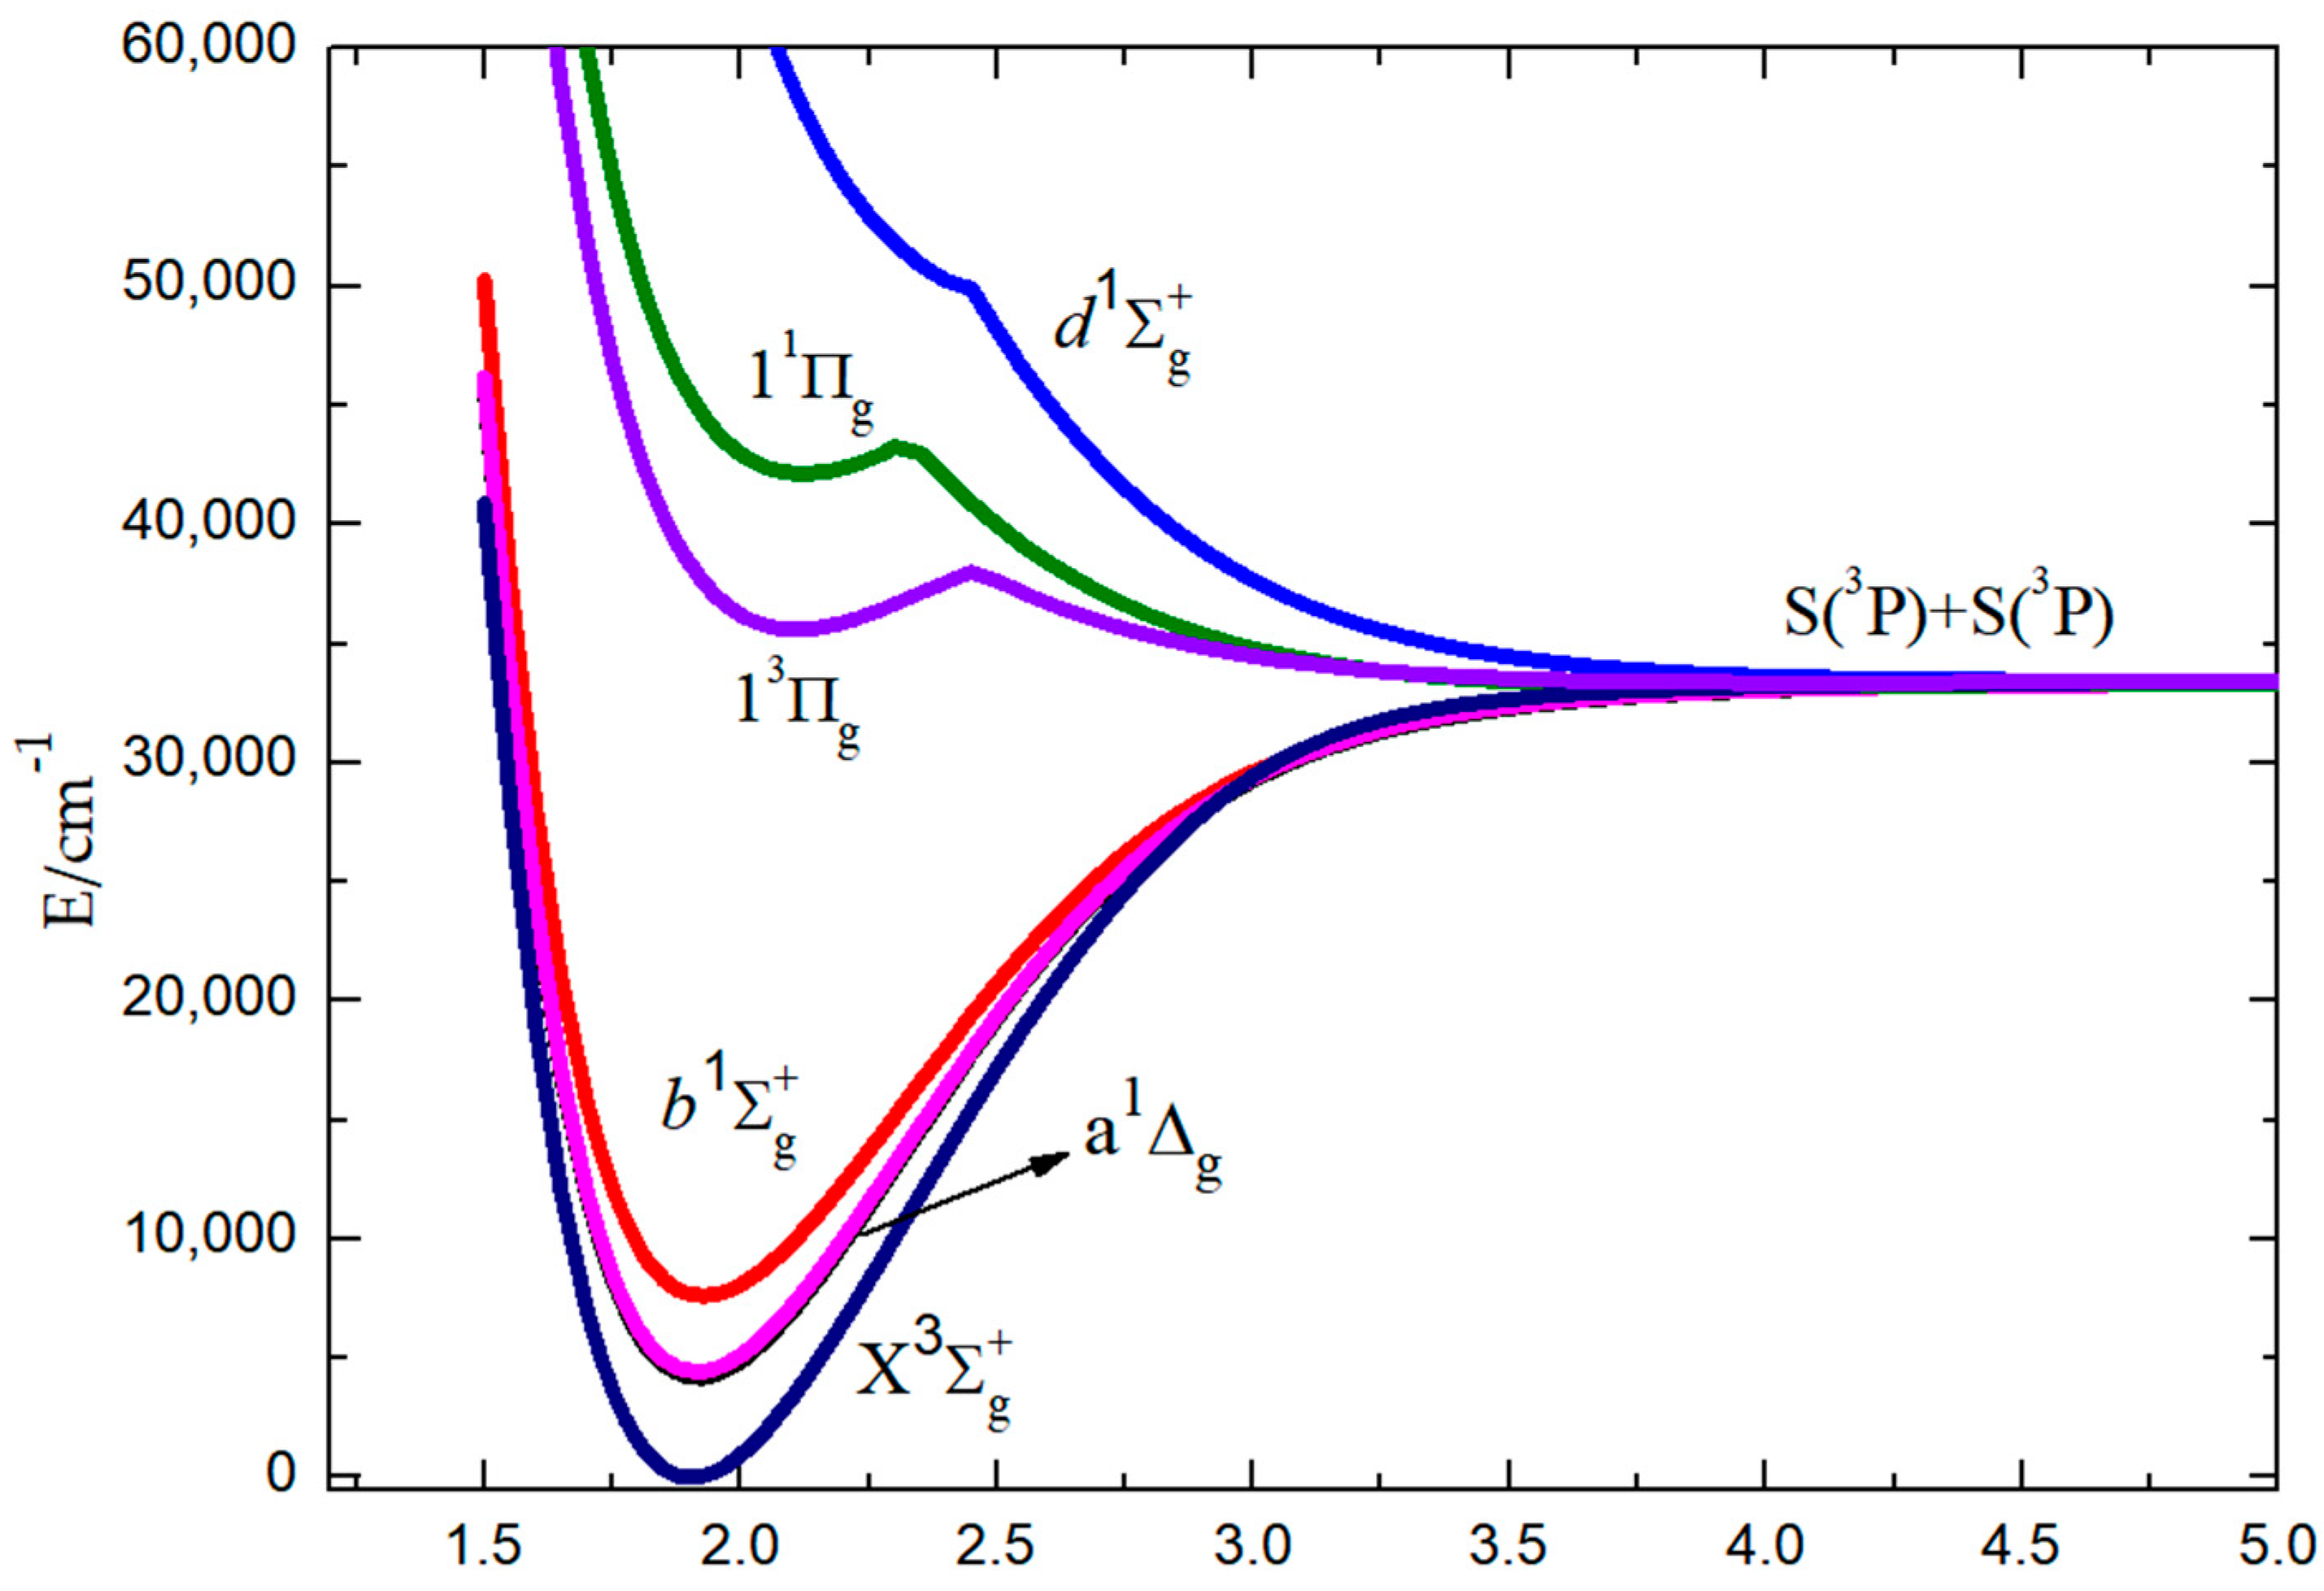
The potential energy curves (PECs) of the ground state (), the low-lying excited states (a1Δg and , and the upper states (, 13Πg, and 11Πg) of S2 have been calculated using the MRCI+Q method and are plotted in Figure 1. On the ground of these PECs, the spectroscopic constants of the bound Λ-S states—including adiabatic excitation energy Te, equilibrium internuclear distance Re, vibrational frequency ωe, anharmonic constant ωexe, and rotational constant Be—are also listed in Table 1. At present, many scholars have studied these constants [9,20,27,28,29,30,31,32,33,34,35,36,37,38], and we only list representative data for comparison.
It can be seen that the calculated Re values of the ground state and low-lying a1Δg excited state are in relatively good agreement with the corresponding previous experimental [37] and theoretical [9,38] data. Compared with the experimental ωe values for the , a1Δg, and PECs, our results are a bit lower, and the differences are 15.99 cm−1 (2.25%), 19.66 cm−1 (2.88%), and 18.84 cm−1 (2.89%), respectively [37].
In addition, the complete basis set (CBS) limit for vertical excitation energy was calculated with the following extrapolation schemes, which use two- or three-point extrapolation formulas. Three-point extrapolation generally underestimates the limit,
Two-point extrapolation typically overestimates it,
The reliability of vertical excitation energy in quantum chemistry is evidently dependent on the basis set. The optimized results are obtained from complete basis set calculations. We expect them to be more accurate than other results [21,38]. In Table S1, the influence of the AO basis is negligible for the vertical excitation energy, as can be seen from the results obtained by employing two- or three-point extrapolation formulas in different basises. The maximum difference of the vertical excitation energy from state to the ,,, states is only a few percent (1.10%, 2.96%, 0.51%, 0.16%).
The relative positions of the a and b levels are of crucial importance in our study. Experimental energy data for the gas phase T0 and Te values are 4394.2 and 4745.4 cm−1 for the a1Δg state [23]. The T0 value is close to other experimental data for Ne matrix (4395 cm−1), where the light Nobel gas environment provides negligible perturbaqtion for S2 molecule [5]. Our T0 value is a bit lower (4118 cm−1) but the ratio of the T0 energies of the a1Δg and states (0.562) is quite close to experimental data (0.551) [23] being also in accordance with the corresponding ratios 0.60, 0.56, and 0.54 observed for O2, SO, and Se2, respectively [39].
3.2. Magnetic Dipole Mechanisms for the Transitions in the S2 Spectrum
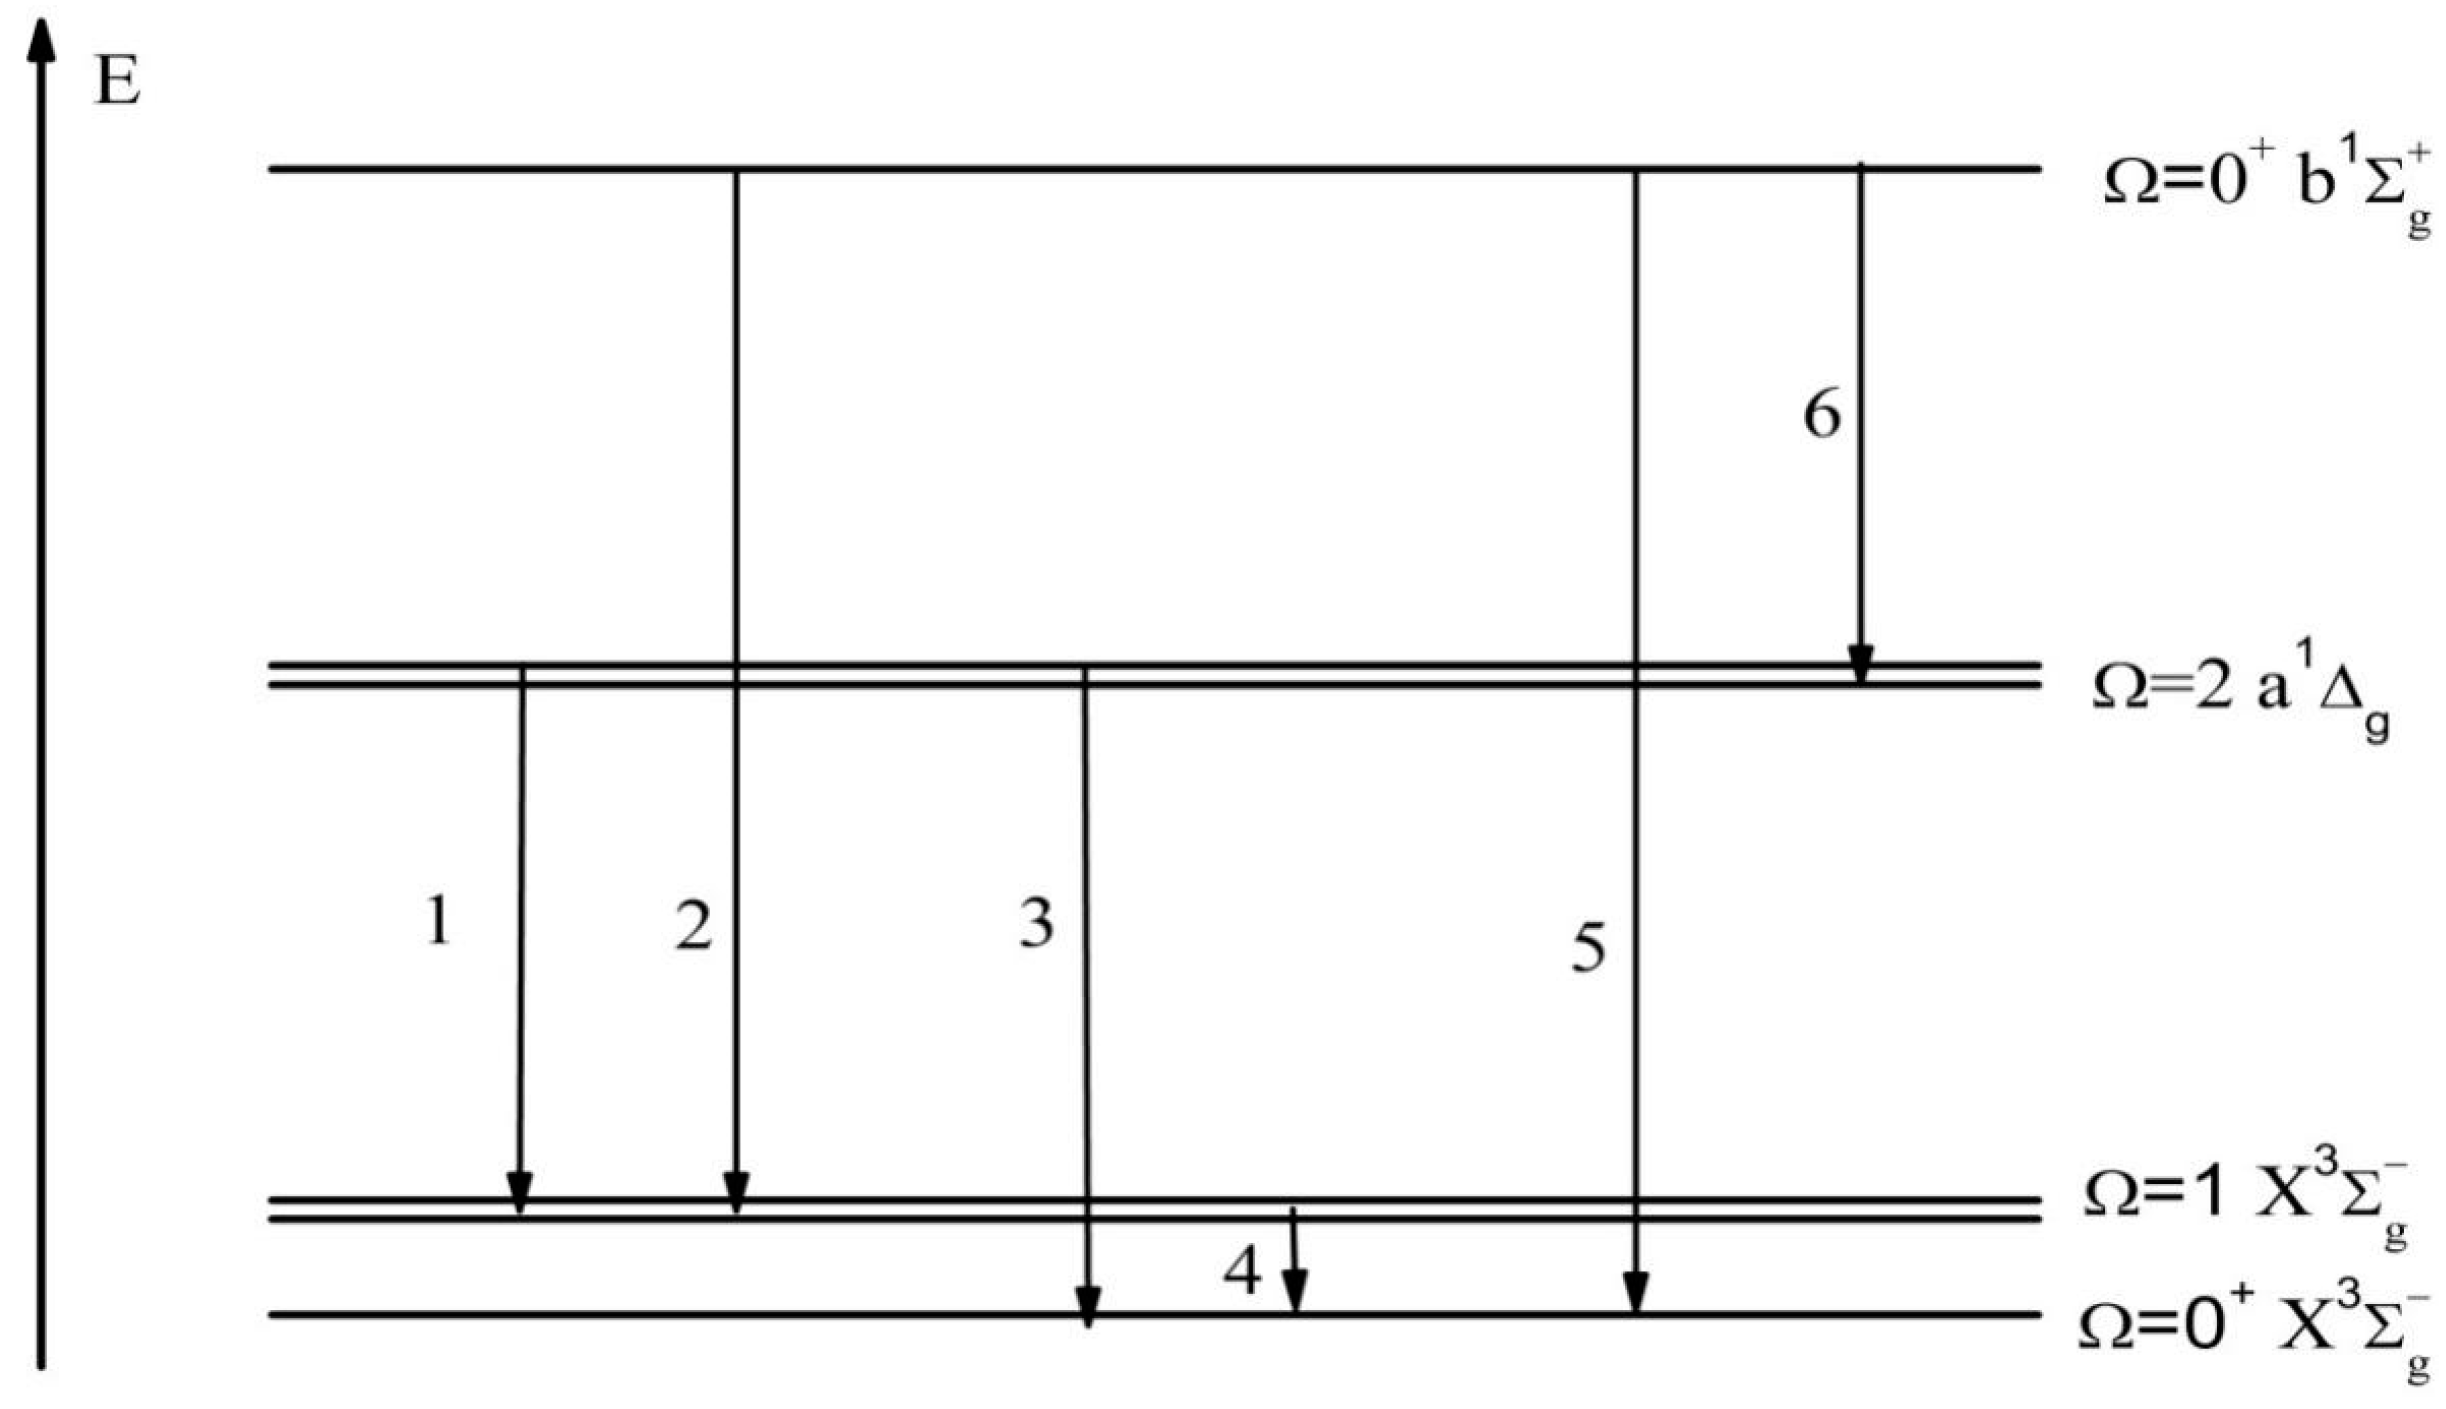
Transitions between the low-lying “gerade” states are forbidden by dipole selection rules (ΔΛ = 0, ±1, ΔS = 0, g−u), but SOC-induced mixing between electronic multiplets provides additional source of weak magnetic dipole transitions (which satisfy the selection ΔΛ = 0, ∓1, ΔS = 0, g−g, u−u) in the near-infrared region of the S2 spectrum.
The calculated {1}–{6} transitions between a1Δg, , and states are collected in Figure 2; these transitions can be detected as weak magnetic and quadrupole bands. What we want to stress is that the weak intensity of the vibrational near-IR band in the S2 spectra can be measured at the liquid-nitrogen-cooled germanium detector facilities [22]. Among them, the {3} transition can be expressed as the difference in the quadrupole moments between a and X states multiplied by the corresponding Ca,x coefficient. However, the actual calculation leads to neglected electro-quadrupole transition {3} intensity. The magnetic S-T transition moment number {2} “borrows” intensity from transition number {4} (); this is a typical EPR {4} transition moment equal to two Bohr magnetons (2 μB) in zero magnetic fields, which can be considered as the contribution of the spin magnetic dipole from nature. In addition, the orbital angular-momentum operator also contributes to the S-T transition {2} intensity. A similar orbital analysis is also applied to the transition number {1} intensity, which is dominated by the orbital magnetic interaction. According to perturbation theory, the SOC mixing of the electronic states is responsible for “intensity borrowing” of transition numbers {1} and {2}. Transition {5} is dominated by the contribution of the orbital magnetic dipole, and the intensity of magnetic dipole moment transition {5} is very weak, almost negligible.
In Table S2, three different sets, basis A (aug−cc−pwCVTZ), basis B (aug-cc-pwCVQZ), and basis C (aug-cc-pwCV5Z), have been employed in order to obtain more accurate spin-orbit matrix elements, which are responsible for the discussed intensity borrowing schemes. The difference between basis X (X = A, B, C) and basis X1 (X1 = A1, B1, C1) is that X1 correlates the 2s22p63s23p4 electrons of the S atom to account for the core-valence (CV) effect. Its result shows that the impact of the CV effect cannot be ignored in the calculation process. Basis A2 contains additional diffuse s-type (0.018684493) and p-type (0.011220492) Gaussian functions relative to basis A1 in order to better understand the influence of the CV effect and diffusion function on spin-orbit coupling matrix elements, which indicates that the effect of the diffusion function is tiny or even negligible.
In Table 2, it is obvious that the best CBS limit produces spin-orbit matrix elements with the and , , states which are slightly higher than the previous theoretically calculated values [20,40]. However, our values are within a reasonable error range. The best CBS limit results for spin-orbit matrix elements between the and , states are predicted to be close to the result of basis G; the differences are 5.90% and 6.39%, respectively.
The calculated spin-orbit matrix elements between the Ω-Ω states of the S2 system (Figure 3) show very interesting R dependence behavior. For example, the SOC integral <> is a rising function with R while the important matrix element <> declines with R > R0. The SOC integrals <> and <> are equal. The spin-orbit interaction operator subscript (LySy) and state superscript () are defined as y components of the SOC operator and x components of the degenerate irreducible representation , respectively. At the same time, it is clearly visible that the value of the SOC integral <> is the largest, which is one of the reasons why the magnetic dipole moment transition intensity is much stronger than other transitions.
The calculated orbital angular-momentum parts are necessary for the magnetic dipole transition intensity estimations, which are collected in Table 3, while the corresponding theoretically calculated values of the reference are also listed. They show that the difference in orbital transitions between states range from 0.26% to 3.72% at the equilibrium internuclear distance (Rs−s= 1.899 Å). Among them, the transition has the largest difference between our results and the calculated values of Ref. [21], which is about 3.72%.
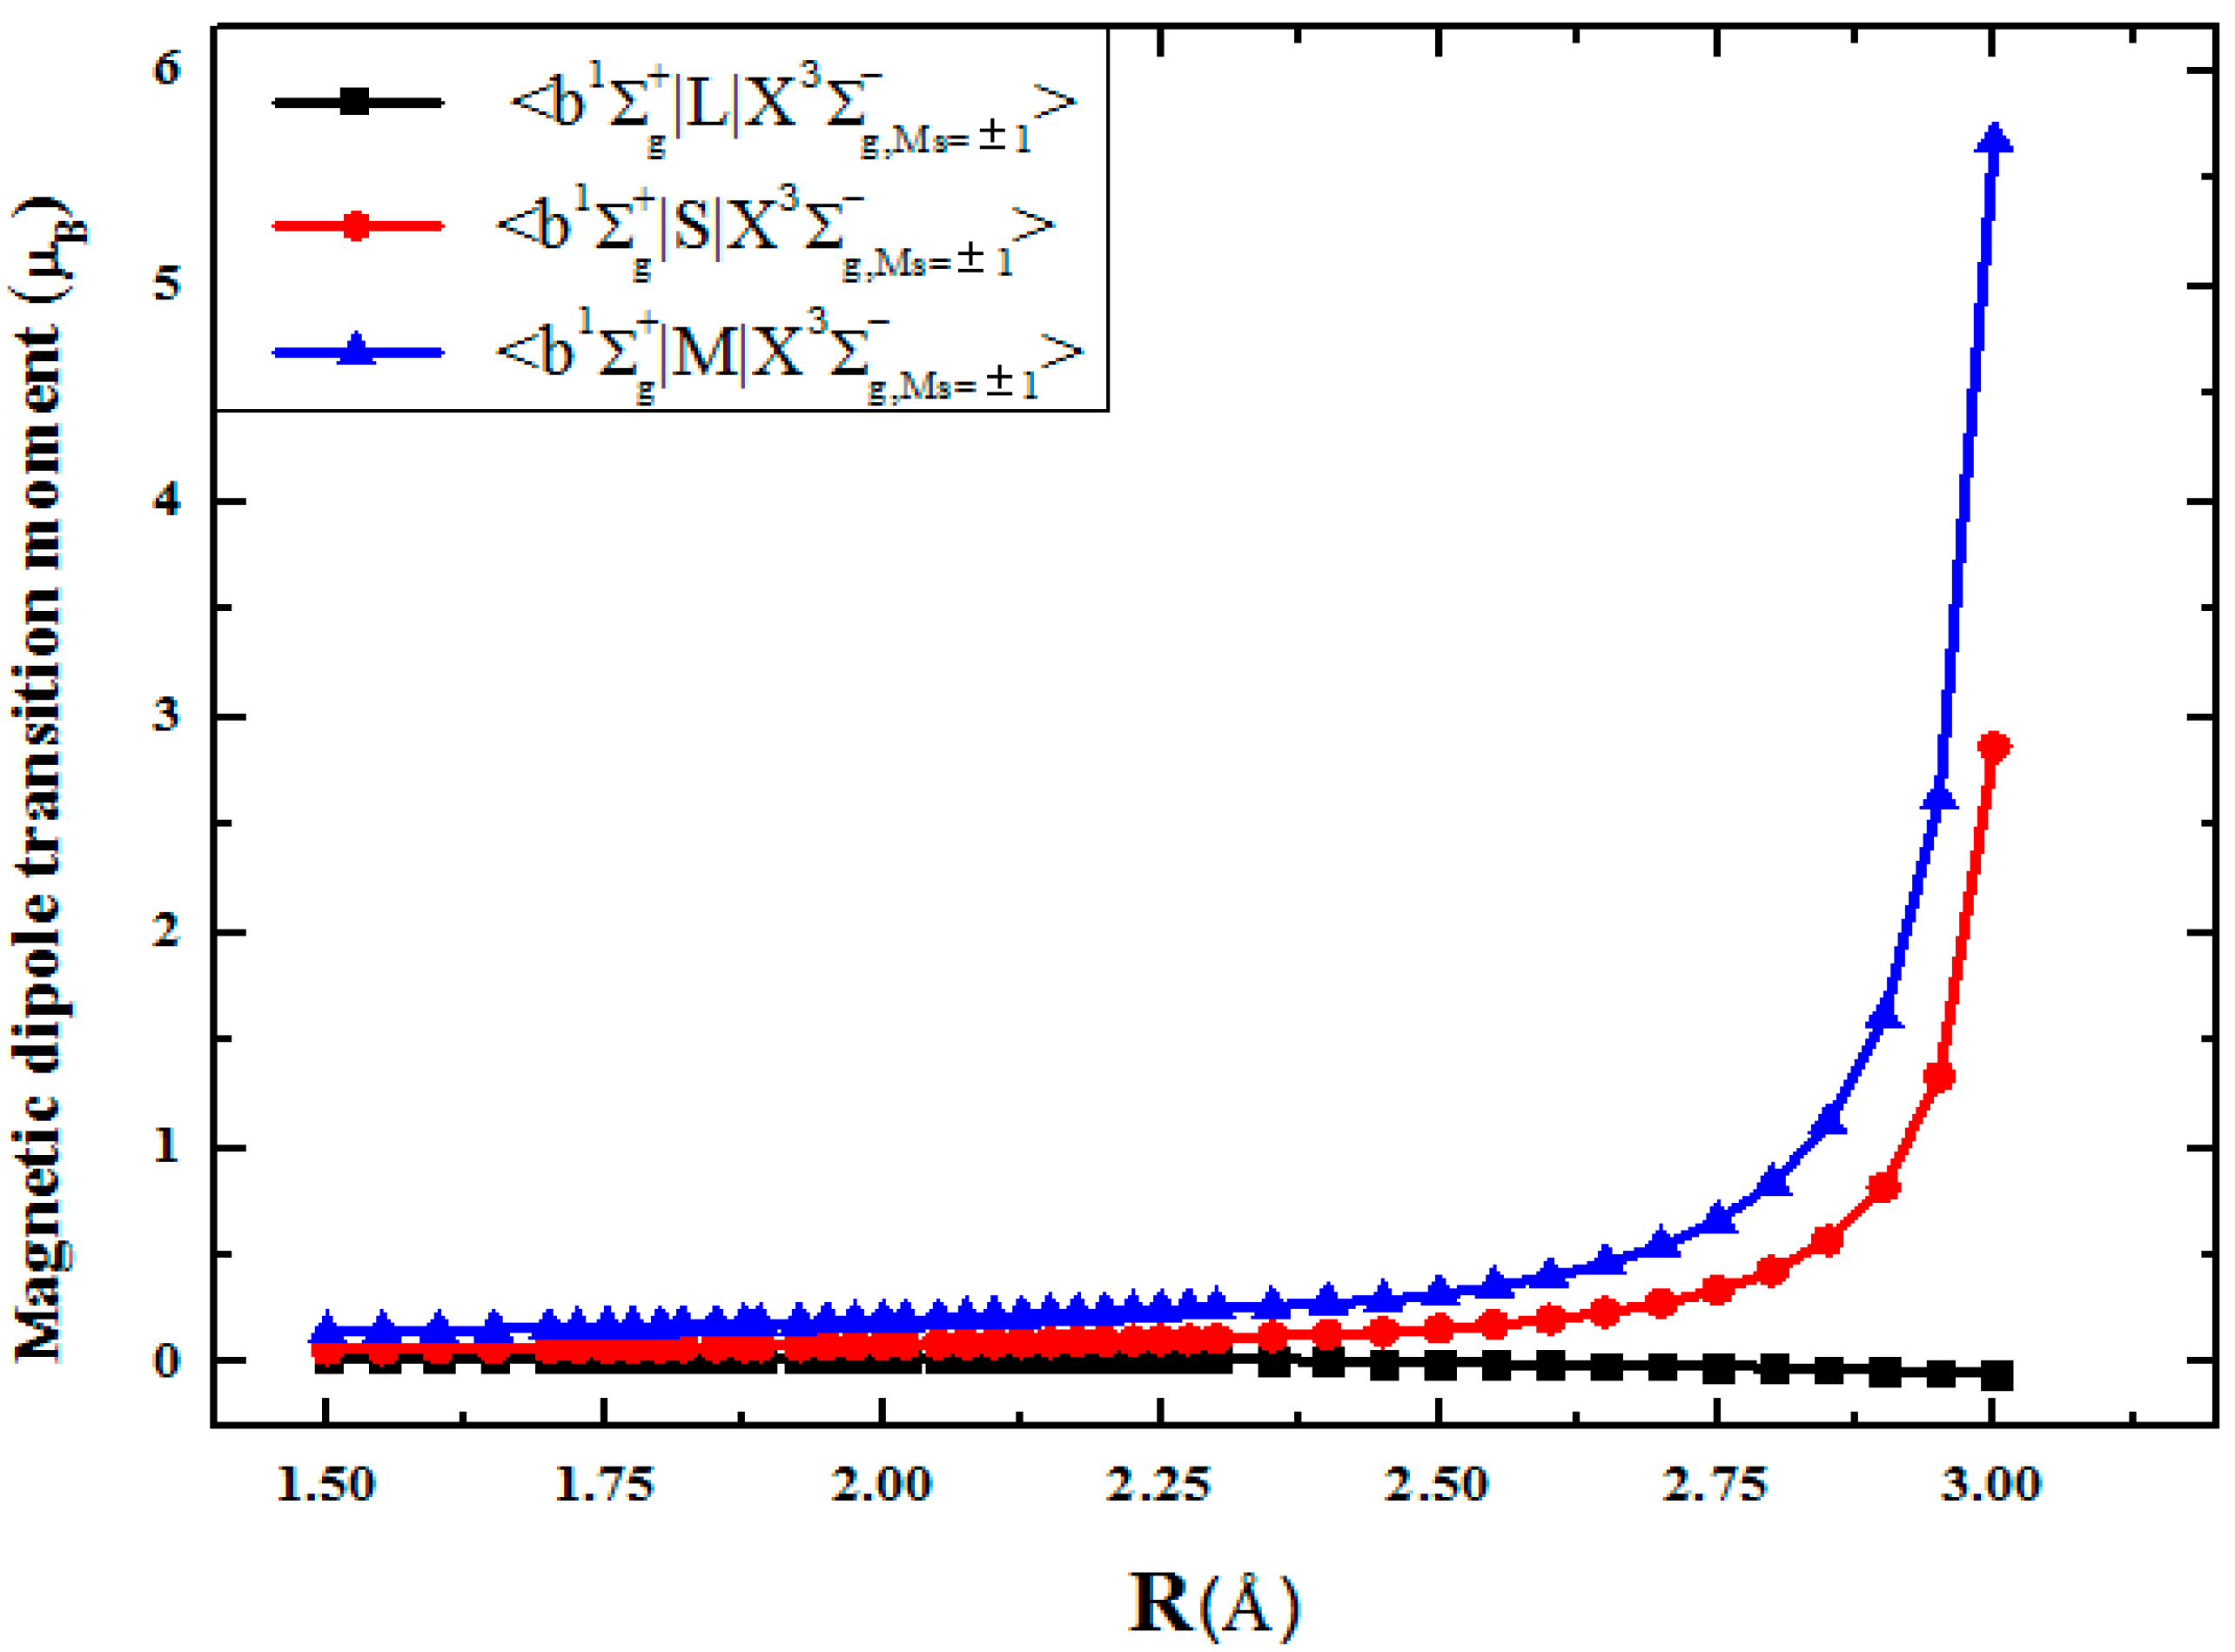
In Table 4, the spin and orbit contributions to the total magnetic dipole transition moments between the and states in the S2 spectrum are given; see also Figure 4 for details. The spin operator contribution to the magnetic −transition comes from the microwave band () and the Cb,X coefficient. The intensity of the magnetic transition between spin sublevels (Ms = ±1−Ms = 0) of the ground triplet state is equal to 2μB. The orbital part of the magnetic transition remains of the order of magnitude less than the spin-current part for R distances from 1.5 Å to 2.2 Å; in fact, it accounts for about one-seventh of the total transition moment value. Note that the spin contribution in Table 4 must be multiplied by the g-factor value of the free electron ge = 2.0023. In addition, the magnetic dipole a1Δg− transition is mainly determined by the contribution of the orbital angular momentum L; it is equal to 0.026369 μB at Re distance.
3.3. Electro-Quadrupole Mechanisms for Transitions between and States in the S2 Spectrum
According to the selection rules for the electro-quadrupole transition probability (ΔΛ = 0, ±1, ±2, ΔS=0, g−g, u−u), the transition numbers {3} and {6} are not as effective as magnetic dipole transitions, being extremely weak in the S2 molecule.
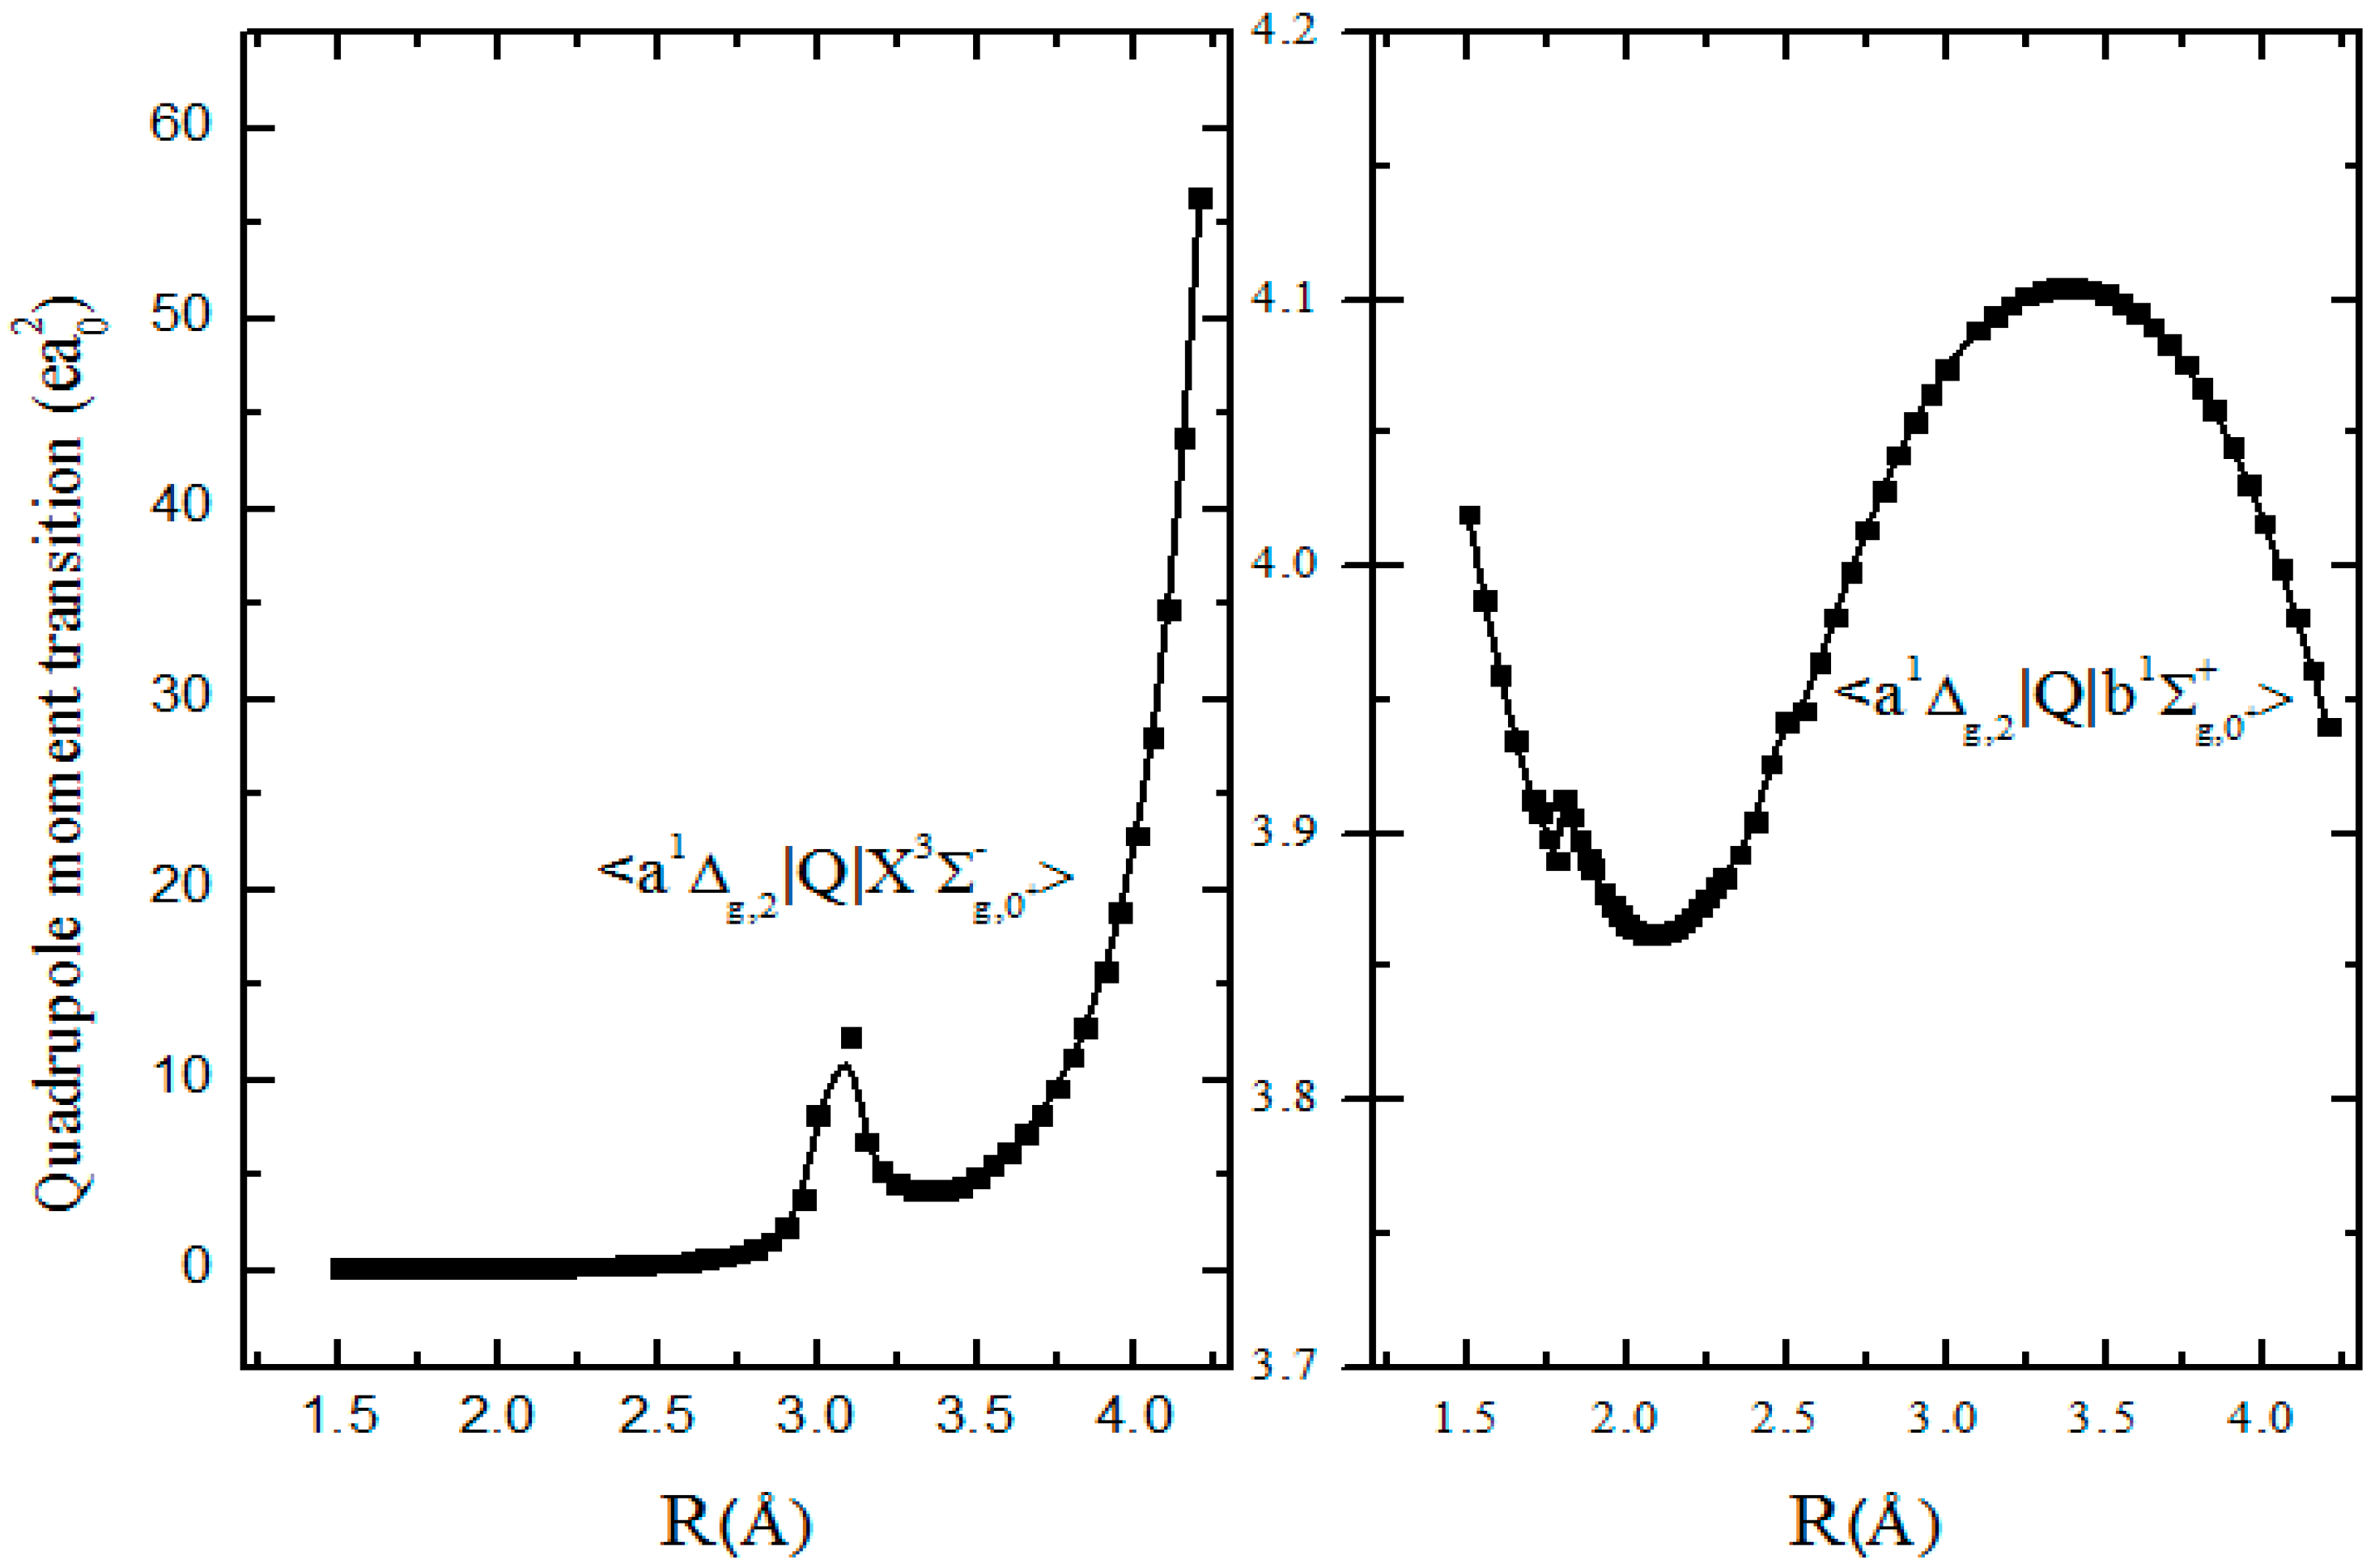
In Figure 5, the quadrupole transition moment of the infrared band (analogous with the Noxon band of O2) is calculated as 3.8873 ea02 at equilibrium internuclear distance Re = 1.889 Å. Moreover, after considering the SOC effect, the wave functions of the singlet state and triplet state are mixed, resulting in the transition quadrupole activity. The corresponding electro-quadrupole transition moment to the Ω = 0 component of the ground state state is equal to = 0.2140 ea02 at the equilibrium distance Re = 1.889 Å.
Comparison with the oxygen near IR analogous b−a and a−X,0 bands indicates that the Noxon band in O2 has comparable intensity with the corresponding S2 quadrupole transition; their rate constants are 0.0014 and 0.0012 s−1, respectively [41,42]. However, the a−X,0 quadrupole transition which depends on SOC, Equation (9), is much more intense in sulfur dimer than in oxygen. Its rate constant in S2 is equal to 10−5 s−1 (Table 5), being impossible to measure in discharge through sulfur vapor. However, an even weaker electric quadrupole contribution to the a1Δg−X3Σg transition rate constant in O2 was identified through its rotational analysis and it was measured this way in order to be equal to (1.02 ± 0.10) × 10−6 s−1 [43]. Such a weak oxygen band was detected in the solar absorption spectra because of a long light absorption path through the whole atmosphere [42,43,44]. The rotational ladder sublevels of the a1Δg and X3Σg states can be treated in terms of the Hund’s (b) case coupling [42,43,44]. The spin sublevels of the ground state in rotating molecules are mixed and more accurate and can be treated in terms of the intermediate Hund’s coupling case [42]. The rotational “e parity” sublevels of the Ω = 0 and Ω = 1 ground X3Σg triplet states are mixed as the spin-rotational terms F1(J) and F3(J); at the same time, the “f parity” rotational sublevel Ω = 1 corresponds to the pure F2(J) rotational term. The rotating molecule wave functions in Equations (2) and (3) depend on rotational quantum number J because of Coriolis coupling BeL terms [42]. Gordon et al. [44] made a comparison with the low line intensity for the observed P, Q, R branches of the quadrupole a−X transitions of O2 corresponding to selection rule ΔJ = ±2, ±1, 0, taking into account eigenfunctions of rotational spin sublevels. Good agreement is obtained assuming that the a−X transitions occur only from the SOC-induced mixing between the b and X0 states, as shown in Equation (2), and through intensity borrowing from the Noxon-type band in the oxygen spectrum [42,43,44,45]. Thus, similar predictions could be relevant for the quadrupole lines in sulfur dimer aȒX absorption (or emission) since their intensity is predicted to be 10 times more efficient with our calculation.
The emission probabilities for b−XMs=±1, a−X Ms=±1, b−a, a−XMs=0 bands of the S2 spectrum are calculated in Table 5. The Einstein coefficient of the (0, 0) vibrational band for the b−XMs=±1 transition is evaluated as 0.403824 s−1 (τ = 2.4763 s), which is obtained by employing the calculated energy of the (0, 0) vibrational band (∆E = 7641 cm−1). The experimental value ∆E0,0 = 7981 cm−1 [39] and theoretical value ∆Evertical = 8970 cm−1 [21] were employed to obtain A0,0 by R. Klotz [21], who deduced that A0,0 is equal to 0.3 s−1 and 0.423 s−1, respectively. Our transition probabilities are closer to the experimental results [21]. In addition, the errors of all these parameters are determined and listed in Table S3. The maximum errors of ΔEb−X and Cb,X are 1.86 cm−1 and 0.000037i, respectively. By using the error propagation formula, the error of the Einstein coefficient (ΔA) is calculated to be = 0.0003218 s−1; thus, the typical relative error of A is about 0.08%.
Moreover, the radiative lifetime of the - transition is 721.3 s, which is significantly larger than the previous theoretical value (350 s) [21]. The main reason is that the energy difference between our result and the theoretical value [21] is about 1354 cm−1. All the above conclusions imply the fact that the emission probability is sensitive to energy differences; thus, it is important to use precise energy for the spectroscopic predictions.
The probabilities of the electro-quadrupole transition between and are determined as A0,0 = 0.001228 s−1 and τ0,0 = 814 s. The previous radiative lifetime has been calculated by Klotz as 960 s with the MRD CI method or 745 s with the full CI method [21]; and the τ0,0 has been estimated to be 780 s with the experimental energy (ΔE = 3586 cm−1) [5,39] in the calculation [21]. In spite of the fact that the Einstein coefficient of the (0, 0) vibrational band of the electric-quadrupole − transition is very small (A = 0.000010 s−l), the comparison with the corresponding oxygen analog [42] allows us to predict all quantitative details of its rovibronic structure. It is known that the quenching of the state in group VI diatomic molecules by foreign gases proceeds mostly by the near-resonant e-to-v energy transfer also involving the spin-allowed quadrupole b → a transition [23,43]. The late mechanism is very important because of intense electric dipole–quadrupole intermolecular interactions [43]. Moreover, the state quenching by intermolecular electronic-to-vibrational (e-to-v) energy transfer depends on the SOC-induced quadrupole a → X,0 transition [43,46,47]; thus, the exact knowledge of quadrupole moments is important.
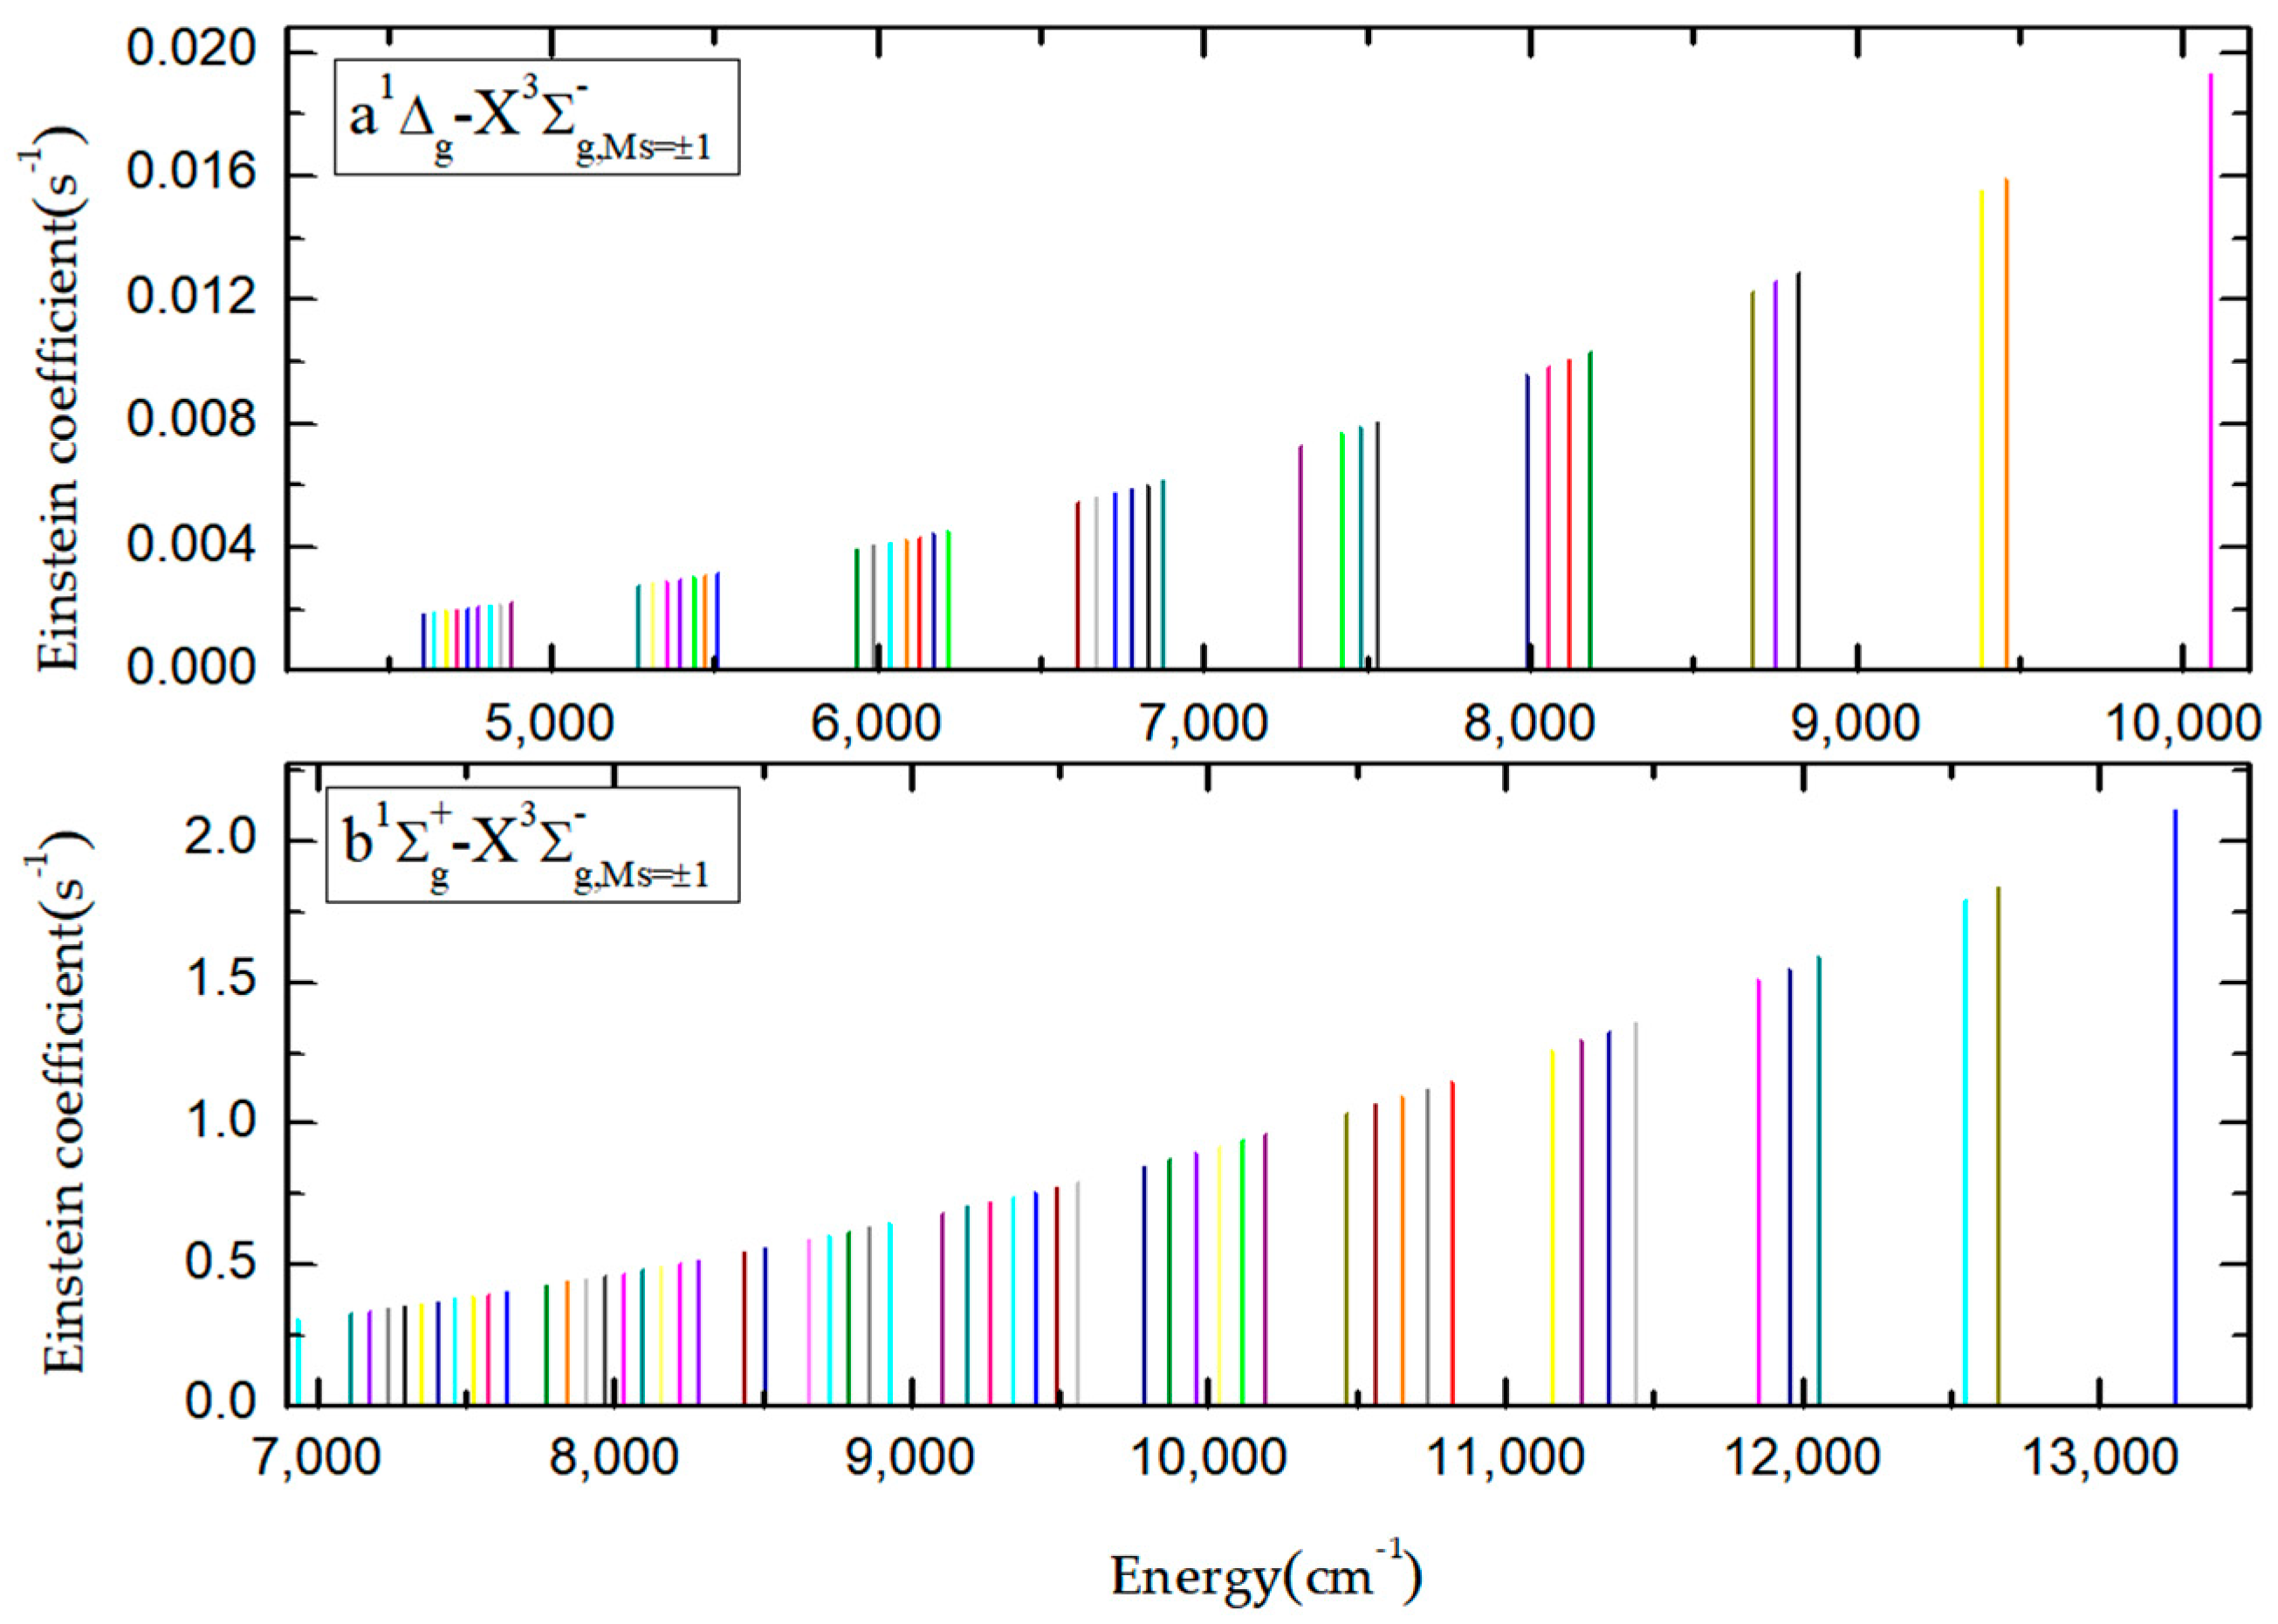
The 0−0, 0−1, and 1−1 bands of the b-XMs=±1 emission system were measured by Fink [22,41], who monitored the 0-0 band at 1.25 µm through a Bomem interferometer in the near-infrared spectral region. the molecular constants for the 0−0, 0−1, and 1−1 bands of the b-XMs=±1 transition are obtained from by Fink [22]. The intensity of the magnetic transition for the 0−0 band of the a-XMs=±1 system is very low, and the Einstein coefficient is equal to about 0.001386 s−1; in fact, it is hard to measure. However, Setzer [23] observed the weak band (0−0 band of the a−XMs=±1 transition) of this chemically unstable molecule S2 near 4400 cm−1 in the early low-resolution emission study. In Figure 6, we give the transition intensity represented by the experimentally observed vibrational b−XMs=±1 and a−XMs=±1 bands. Each vertical line represents a vibration energy level band; in order to see each vibrational level more clearly, we use different colors to represent the corresponding bands of different vibrational levels; the ordinate and abscissa represent its transition intensity and band energy position, respectively.
In order to provide more observable bands for the experiment, we take the intensity of b−XMs=±1 (0, 0) and a−XMs=±1 (0, 0) bands as the zero point of the abscissa, respectively. This will prove that the above bands can be detected by modern optical facilities and spectral resolution presented in Figure 6; the relevant experimentally observed vibrational energy band information—including the vibrational levels, Einstein coefficients, and oscillator strengths—are listed in Tables S4 and S5 of the Supplementary Material. Comparison with previous theoretical studies [20,21] indicates that the increase of the basis set and active space of the MRCI method is important for a detailed understanding of spectral peculiarities in the forbidden bands of the sulfur dimer.
The studied forbidden bands in the S2 spectrum finalize a series of magnetic and quadrupole transition calculations in diatomic molecules [42,47,48]. Despite relatively low intensity and experimental difficulties in their detection, the theoretical studies of the magnetic and quadrupole transitions are important for astrophysical studies and for fundamental knowledge of molecular structure in physical chemistry [48].
4. Conclusions
Transitions from the and a1Δg states to the ground state are forbidden in the framework of electric dipole selection rules for the S2 molecule. The present paper has estimated the intensity of the parity-forbidden singlet-triplet (S−T) transitions of the S2 molecule for the inter-combinations between groups of states a1Δg, and in the near-IR region by employing high-level ab initio MRCI calculations with the SOC and CV correlation. The radiative lifetime of the transition is largely determined by spin angular-momentum term contributions to the magnetic moment, due to the zero-field splitting of the state for S2. The intensity of the transition is dominated by the orbital part in the magnetic dipole transition, and it arises from the a1Δg−3Πg and −1Πg transitions. Comparing with the radiative lifetimes of the electro-quadrupole transition for the band, our result was found to be within a reasonable error of existing calculations. Though the electro-quadrupole transition is almost negligible for the (0,0) band (either in emission or in absorption), comparison with the analogous oxygen near-IR spectrum [44] indicates the detailed prediction for more intense quadrupole branches in rotational structure ratios for the S2 molecule.
The current results show that the experimentally detected 0−0, 0−1, and 1−1 bands of the emission system [22,41] are well reproduced by ab initio theory. There is no doubt that we also fully calculate and interpret the weak 0−0 vibrational band of the transition for chemically unstable S2 molecules experimentally studied by Setzer and Fink [23]. We also successfully provide some other bands for the magnetic IR spectrum of the S2 dimer. A preliminary attempt to calculate the low transition probabilities of the b−XMs=±1, a−XMs=±1, b−a, a−XMs=0 bands with the perturbation theory formulas was satisfactory. Our study of the S2 molecular spectrum in the near-IR region provides more useful information for the exploration of matter in the field of astrophysics. This study provides the systematic calculations of forbidden magnetic and quadrupole transitions in O2, N2, Ge2, and Sn2 homonuclear diatomic molecules and illustrates the increasing role of spin-orbit coupling effects in such fields of physical chemistry.
Supplementary Materials
The following supporting information can be downloaded at: https://www.mdpi.com/article/10.3390/physchem3010009/s1, Table S1: The vertical excitation energies with the state for other states (cm−1) in Rs−s=1.899Å; Table S2: Calculated spin-orbit matrix elements in S2(Rs−s=1.899Å); Table S3: The error analysis for the Einstein coefficient A of the b−XMs=0 transition; Table S4: The theoretically inferred energy, Einstein coefficient and oscillator strength of the experimentally observable b−XMs=±1 band; Table S5: The theoretically inferred energy, Einstein coefficient and oscillator strength of the experimentally observable a−XMs=±1 band.
Author Contributions
Conceptualization: L.X., B.Y. and B.F.M.; methodology: L.X., B.Y. and B.F.M.; formal analysis: L.X., B.Y. and B.F.M.; original draft preparation: L.X. All authors have read and agreed to the published version of the manuscript.
Funding
This work was supported by the National Natural Science Foundation of China (Grant No. 12274178, No. 11874177, and No. 11574114); the Ministry of Education and Science of Ukraine (Grant No. 0121U107533); the Wenner-Gren Foundation (Grant No. GFU2022-0036); the High Performance Computing Center (HPCC) of Jilin University and the high performance computing cluster Tiger@ IAMP.
Data Availability Statement
The data presented in this study are available in article and supplementary material.
Conflicts of Interest
The authors declare no conflict of interest.
References
- Fowler, A.; Vaidya, W.M. The Spectrum of the Flame of Carbon Disulphide. Proc. R. Soc. London. Ser. A Contain. Pap. A Math. Phys. Character 1931, 132, 310–330. [Google Scholar]
- Tanaka, Y.; Ogawa, M. Emission spectrum of S2 in the vacuum ultraviolet region. J. Chem. Phys. 1962, 36, 726–730. [Google Scholar] [CrossRef]
- Maeder, R.; Miescher, E. Absorption band spectrum of S2 in the Schumann region. Nature 1948, 161, 393. [Google Scholar] [CrossRef] [PubMed]
- Bondybey, V.E.; English, J.H. B3Σ-u predissociation and relaxation processes in matrix isolated S2. J. Chem. Phys. 1979, 72, 3113–3122. [Google Scholar] [CrossRef]
- Yuan, D.F.; Trabelsi, T.; Zhang, Y.R.; Francisco, J.S.; Wang, L.S. Probing the Electronic Structure and Bond Dissociation of SO3 and SO3– Using High-Resolution Cryogenic Photoelectron Imaging. J. Am. Chem. Soc. 2022, 144, 13740–13747. [Google Scholar] [CrossRef] [PubMed]
- Reddy, R.R.; Rama, G.K.; Nazeer, A.Y.; Baba, B.D.; Narasimhulu, K.; Siva Sankar Reddy, L. Spectroscopic studies of molecules observed in comets. Indian J. Pure Ap. Phy. 2005, 43, 237–245. [Google Scholar]
- De Almeida, A.A.; Singh, P.D. Photodissociation lifetime of 32S2 molecule in comets. Earth Moon Planets 1986, 36, 117–125. [Google Scholar] [CrossRef]
- Spencer, J.R.; Jessup, K.L.; McGrath, M.A.; Ballester, G.E.; Yelle, R. Discovery of gaseous S2 in Io’s Pele plume. Science 2000, 288, 1208–1210. [Google Scholar] [CrossRef]
- Xue, J.L.; Yuan, X.; Li, R.; Liu, X.S.; Yan, B. Theoretical study on predissociation of B3Σ-u of sulfur dimer. Spectrochim. Acta Part A Mol. Biomol. Spectrosc. 2020, 241, 118679. [Google Scholar] [CrossRef]
- Kiljunen, T.; Eloranta, J.; Kunttu, H.; Khriachtchev, L.; Pettersson, M.; Räsänen, M. Electronic structure and short-range recombination dynamics of S2 in solid argon. J. Chem. Phys. 2000, 112, 7475–7483. [Google Scholar] [CrossRef]
- Frederix, P.W.J.M.; Yang, C.H.; Groenenboom, G.C.; Parker, D.H.; Alnama, K.; Western, C.M. Photodissociation imaging of diatomic sulfur (S2). J. Phys. Chem. A 2009, 113, 14995–15005. [Google Scholar] [CrossRef] [PubMed]
- Yamashita, J.; Fujihara, K.; Takahashi, O.; Kohguchi, H.; Yamasaki, K. Kinetics and dynamics on the formation of S2(X3Σ−g−a1Δg) in the S(1D) + OCS reaction. J. Phys. Chem. A 2014, 118, 9330–9337. [Google Scholar] [CrossRef] [PubMed]
- Green, M.E.; Western, C.M. Upper vibrational states of the B″3Πu state of 32S2. J. Chem. Soc. Faraday Trans. 1997, 93, 365–372. [Google Scholar] [CrossRef]
- Minaev, B.F.; Minaeva, V.A. MCSCF response calculations of the excited states properties of the O2 molecule and a part of its spectrum. Phys. Chem. Chem. Phys. 2001, 3, 720–729. [Google Scholar] [CrossRef]
- Wieland, K. Thermo-optical dissociation of sulphur dioxide. Trans. Faraday Soc. 1934, 30, 260–265. [Google Scholar] [CrossRef]
- Donovan, R.J.; Husain, D.; Jackson, P.T. Transient species in the photolysis of sulphur monochloride, including S2 (a1Δg). Trans. Faraday Soc. 1968, 64, 1798–1805. [Google Scholar] [CrossRef]
- Chiang, S.Y.; Lee, Y.P. Red and near-infrared laser-induced emission of S2 in an Ar matrix. J. Chem. Phys. 1988, 89, 13–19. [Google Scholar] [CrossRef]
- Minaev, B.F. Intensity of singlet-triplet transitions in the oxygen molecule and the selective effect of an external heavy atom. Opt. Spectrosc. 1978, 45, 1202–1207. [Google Scholar]
- Minaev, B.F. Electronic mechanisms of activation of molecular oxygen. Russ. Chem. Rev. 2007, 76, 1059. [Google Scholar] [CrossRef]
- HESS, B.A.; Buenrer, R.J. Ab initio calculation of the Zero-Field splittiongs of the X3Σ-g, B3Πg,1 states of the S2 molecule. Chem. Phys. 1982, 71, 79–85. [Google Scholar] [CrossRef]
- Klotz, R.; Marian, C.M.; Peyerimhoff, S.D. Calculation of spin-forbidden radiative transitions using correlated wavefunctions lifetimes of b1Σ+, a1Δ states in O2, S2 and SO. Chem. Phys. 1984, 89, 223–236. [Google Scholar] [CrossRef]
- Fink, E.H.; Kruse, H.; Ramsay, D.A. The high-resolution emission spectrum of S2 in the near infrared, The b1Σ+g−X3Σ−g system. J. Mol. Spectrosc. 1986, 119, 377–387. [Google Scholar] [CrossRef]
- Setzer, K.D.; Kalb, M.; Fink, E.H. The a1Δg-X3Σ-g magnetic dipole transition of S2. J. Mol. Spectrosc. 2003, 221, 127–130. [Google Scholar] [CrossRef]
- Barnes, I.; Becker, K.H.; Fink, E.H. Near-infrared emissions from the 1Δg and 1Σ+g states of S2. Chem. Phys. Lett. 1979, 67, 314–317. [Google Scholar]
- Fink, E.H.; Kruse, H.; Setzer, K.D. High resolution fourier-transform spectra of the a1Δg−X3Σ−g, b1Σ+g−X3Σ−g and b1Σ+g−a1Δg systems of O2, SO, S2 and isoelectronic molecules in the nir region. Acta Phys. Hung. 1990, 67, 67–72. [Google Scholar] [CrossRef]
- Werner, H.J.; Knowles, P.J.; Knizia, G.; Manby, F.R.; Schütz, M. Molpro: A general-purpose quantum chemistry program package. W. I. Res. Comput. Mol. Sci. 2012, 2, 242–253. [Google Scholar] [CrossRef]
- A’Hearn, M.F.; Feldman, P.D.; Schleicher, D.G. The discovery of S2 in comet IRAS-Araki-Alcock 1983d. Astrophys. J. 1983, 274, L99–L103. [Google Scholar] [CrossRef]
- Epler, J.E.; Verdeyen, J.T. Broad-Band Gain in Optically Pumped S2. IEEE J. Quantum Elect. 1983, 19, 1686–1691. [Google Scholar] [CrossRef]
- Glassgold, A.E. Circumstellar photochemistry. Annu. Rev. Astron. Astr. 1996, 34, 241–277. [Google Scholar] [CrossRef]
- Grim, R.J.A.; Greenberg, J.M. Photoprocessing of H2S in interstellar grain mantles as an explanation for S2 in comets. Astron. Astrophys. 1987, 181, 155–168. [Google Scholar]
- Kim, S.J.; A’Hearn, M.F.; Larson, S.M. Multi-cycle fluorescence, Application to S2 in comet IRAS-Araki-Alcock 1983VII. Icarus 1990, 87, 440–451. [Google Scholar] [CrossRef]
- Lewis, J.S.; Kreimendahl, F.A. Oxidation state of the atmosphere and crust of Venus from pioneer Venus results. Icarus 1980, 42, 330–337. [Google Scholar] [CrossRef]
- Liszt, H.S. Upper limits on the abundance of the sulfur dimer in molecular clouds. Astrophys J. 1978, 219, 454–457. [Google Scholar] [CrossRef]
- Mitchell, G.F. Effects of shocks on the sulfur chemistry of a dense interstellar cloud. Astrophys. J. 1984, 287, 665–670. [Google Scholar] [CrossRef]
- Noll, K.S.; McGrath, M.A.; Trafton, L.M.; Atreya, S.K.; Caldwell, J.J.; Weaver, H.A. HST spectroscopic observations of Jupiter after the collision of comet Shoemaker—Levy 9. Science 1995, 267, 1307–1313. [Google Scholar] [CrossRef] [PubMed]
- Shnitko, I.; Fulara, J.; Garkusha, I.; Nagy, A.; Maier, J.P. Electronic transitions of S2− and S3− in neon matrixes. Chem. Phys. 2008, 346, 8–12. [Google Scholar]
- Huber, K.P.; Herzberg, G. Constants of Diatomic Molecules; Van Nostrand Reinhold Co.: New York, NY, USA, 1979. [Google Scholar]
- Swope, W.C.; Lee, Y.P.; Schaefer, H.F., III. Diatomic sulfur: Low lying bound molecular electronic states of S2. J. Chem. Phys. 1979, 70, 947–953. [Google Scholar] [CrossRef]
- Bielefeld, M.; Elfers, G.; Fink, E.H.; Kruse, H.; Wildt, J.; Winter, R. O2(a1Δg)-sensitized chemiluminescence of a1Δ → X3Σ− and b1Σ+ → X3Σ− transitions of group VI—Group VI and group V–group VII diatomic molecules. J. Photoch. 1984, 25, 419–438. [Google Scholar] [CrossRef]
- Veillard, A. Gaussian basis set for molecular wavefunctions containing second-row atoms. Theo. Chim. Acta 1968, 12, 405–411. [Google Scholar] [CrossRef]
- Fink, E.H.; Setzer, K.D.; Kottsieper, U.; Ramsay, D.A.; Vervloet, M. The a1Δ (a2)—X3Σ-(X21) electronic band system of selenium monoxide. J. Mol. Spectrosc. 1988, 131, 127–132. [Google Scholar] [CrossRef]
- Minaev, B.F.; Murugan, N.A.; Ågren, H. Dioxygen spectra and bio-activation. Int. J Quant. Chem. 2013, 113, 1847–1867. [Google Scholar] [CrossRef]
- Sveshnikova, E.B.; Minaev, B.F. Mechanism of the nonradiative 1Δg−3Σg− transition in molecular oxygen in solution. Opt. Spectrosc. 1983, 54, 320–322. [Google Scholar]
- Gordon, I.E.; Kassi, S.; Campargue, A.; Toon, G.C. First identification of the a1Δg-X3Σ-g electric quadrupole transitions of oxygen in solar and laboratory spectra. J. Quant Spectrosc. Radiat. Transf. 2010, 111, 1174. [Google Scholar] [CrossRef]
- Minaev, B.F. Effect of spin-orbit coupling on the intensity of magnetic dipole transitions in molecular oxygen. Sov. Phys. J. 1978, 21, 1205–1209, Erratum in Izv. Vyssh. Uchebn. Zaved. Fiz. 1978, 9, 115. [Google Scholar] [CrossRef]
- Minaev, B.F. Spin-orbit coupling mechanism of singlet oxygen a1Δ g quenching by solvent vibrations. Chem. Phys. 2017, 483, 84–95. [Google Scholar] [CrossRef]
- Xiao, L.D.; Xue, J.L.; Liu, Y.; Yan, B.; Minaev, B.F. Calculation of the singlet-triplet magnetic and electro-quadrupole transitions intensity for Ge2 molecule. Mol. Phys. 2020, 120, e20745622020. [Google Scholar] [CrossRef]
- Minaev, B.F.; Panchenko, O.O.; Minaeva, V.A.; Agren, H. Triplet state harvesting and search for forbidden transition intensity in the nitrogen molecule. Front. Chem. 2022, 10, 1005684. [Google Scholar] [CrossRef] [PubMed]
Figure 1.
Potential energy curves of the low-lying “gerade” Λ-S states for S2 calculated at the MRCI level.
Figure 1.
Potential energy curves of the low-lying “gerade” Λ-S states for S2 calculated at the MRCI level.

Figure 2.
Numbering of forbidden electronic transitions in the NIR region of S2 emission. (Transitions 1, 2, 4, and 5 represent magnetic dipole transition moments. Transitions 3 and 6 represent electric quadrupole transition moments).
Figure 2.
Numbering of forbidden electronic transitions in the NIR region of S2 emission. (Transitions 1, 2, 4, and 5 represent magnetic dipole transition moments. Transitions 3 and 6 represent electric quadrupole transition moments).

Figure 3.
R dependence of spin-orbit matrix elements of the Ω-Ω states for S2.

Figure 4.
Orbital (L) and spin (S) angular momentum and the total magnetic dipole transition moment contributions to the magnetic transition intensity of S2.
Figure 4.
Orbital (L) and spin (S) angular momentum and the total magnetic dipole transition moment contributions to the magnetic transition intensity of S2.

Figure 5.
Quadrupole matrix elements of the − and − transitions.

Figure 6.
Theoretically inferred experimentally observed vibrational bands.


Table 1.
Spectroscopic constants for the Λ-S states of S2.
| Te/cm−1 | Re/Å | ωe/cm−1 | ωeχe/cm−1 | Be/cm−1 | |
|---|---|---|---|---|---|
| 0 | 1.9027 | 709.6586 | 2.8198 | 0.2913 | |
| 1.889 Expt [37] | 725.65 Expt [37] | ||||
| 1.90 [38] | 760 [38] | ||||
| 1.8960 [9] | 729 [9] | 3.2096 [9] | 0.2933 [9] | ||
| 4459.3688 | 1.9150 | 682.6867 | 3.0585 | 0.2876 | |
| 1.898 Expt [37] | 702.35 Expt [37] | ||||
| 1.907 [38] | 746 [38] | ||||
| 4390 [9] | 1.9058 [9] | 703 [9] | 3.2536 [9] | 0.2903 [9] | |
| 7649.5722 | 1.9249 | 650.8639 | 2.8708 | 0.2843 | |
| 669.7 Expt [37] | |||||
| 1.914 [38] | 732 [38] | ||||
| 7675 [9] | 1.9181 [9] | 674 [9] | 3.3856 [9] | 0.2866 [9] | |
| 35,619.7022 | 2.1081 | 435.4006 | 7.7393 | 0.2373 | |
| 42,170.9966 | 2.1213 | 459.4193 | 6.7306 | 0.2342 |
Table 2.
Calculated spin-orbit matrix elements in S2 (Rs−s= 1.899 Å).
| Basis | Spin-Orbit Matrix Elements with the State for Other States (cm−1) | Spin-Orbit Matrix Elements with the State for Other States (cm−1) | |||
|---|---|---|---|---|---|
| best CBS | 429.85 ± 0.17 | 215.90 ± 0.06 | −217.38 ± 0.01 | −212.76 ± 0.02 | 201.47 ± 0.00 |
| basis D [20,41] | 422.5 | 200.3 | −203.1 | ||
| basis D1 (core2) [20] | 423.0 | 202.7 | −204.0 | ||
| basis E [20] | 410.3 | 200.9 | −200.8 | ||
| basis F [20] | 416.6 | 203.9 | −204.9 | ||
| basis G (core2) [21] | −200.2 | 188.6 | |||
Basis D is the double-zeta set for sulfur given; basis D1: on the basis of basis D, correlating the 2s22p63s23p4 electrons of S atoms to account for the CV effect of the S2. Basis E contains additional s and p bond functions {exponents α(s) = 1.0 and α(p) = 0.6} relative to basis D; basis F adds only an s bond function to basis D. Basis G consists of the double-zeta (12s, 9p) set for sulfur contracted to (s, 4p) with s and p bond functions {exponents α(s) = 1.0 and α(p) = 0.6}.
Table 3.
Calculated values of the L matrix elements (in atomic unit (a.u.)) for the quantities that are necessary for calculation of the magnetic transition probabilities in S2.
Table 3.
Calculated values of the L matrix elements (in atomic unit (a.u.)) for the quantities that are necessary for calculation of the magnetic transition probabilities in S2.
| Rs-s (Å) | |||
| 1.8 | 1.23995 | 1.23995 | 1.19769 |
| 1.85 | 1.25557 | 1.25557 | 1.20622 |
| 1.899 | 1.25986/1.26317 [21] | 1.25986/1.26317 [21] | 1.21257/1.22810 [21] |
| 1.95 | 1.25704 | 1.25704 | 1.21662 |
| 2.0 | 1.25890 | 1.25890 | 1.21828 |
| 2.05 | 1.25894 | 1.25894 | 1.21742 |
| 2.1 | 1.25751 | 1.25751 | 1.21392 |
| Rs-s (Å) | |||
| 1.8 | 1.21115 | 1.21115 | 1.19769 |
| 1.85 | 1.21464 | 1.21464 | 1.20622 |
| 1.899 | 1.21624/1.26317 [21] | 1.21624/1.26317 [21] | 1.21257/1.22810 [21] |
| 1.95 | 1.21697 | 1.21697 | 1.21662 |
| 2.0 | 1.21202 | 1.21202 | 1.21828 |
| 2.05 | 1.20255 | 1.20255 | 1.21742 |
| 2.1 | 1.18724 | 1.18724 | 1.21392 |
Table 4.
Spin (S), orbit (L), and the total magnetic dipole transition moments as functions of the internuclear distance.
Table 4.
Spin (S), orbit (L), and the total magnetic dipole transition moments as functions of the internuclear distance.
| R(Å) | (i a.u.) | (i a.u.) | (iμB) | (i a.u.) | (iμB) |
|---|---|---|---|---|---|
| 1.5 | 0.020765 | 0.060717 | 0.142199 | 0.020114 | 0.020114 |
| 1.7 | 0.024100 | 0.068487 | 0.161075 | 0.023092 | 0.023092 |
| 1.752 | 0.025084 | 0.070752 | 0.166587 | 0.023996 | 0.023996 |
| 1.800 | 0.025882 | 0.073154 | 0.172189 | 0.024779 | 0.024779 |
| 1.82 | 0.026272 | 0.074146 | 0.174564 | 0.025143 | 0.025143 |
| 1.889 | 0.027554 | 0.077828 | 0.183211 | 0.026369 | 0.026369 |
| 1.95 | 0.028579 | 0.080969 | 0.190517 | 0.027407 | 0.027407 |
| 2 | 0.029324 | 0.084301 | 0.197926 | 0.028197 | 0.028197 |
| 2.02 | 0.029593 | 0.085734 | 0.201062 | 0.028492 | 0.028492 |
| 2.1 | 0.030449 | 0.092158 | 0.214766 | 0.029496 | 0.029496 |
| 2.15 | 0.030757 | 0.096839 | 0.224436 | 0.029902 | 0.029902 |
| 2.2 | 0.030805 | 0.102173 | 0.235151 | 0.029974 | 0.029974 |
| 2.4 | 0.012961 | 0.133883 | 0.280727 | 0.020556 | 0.020556 |
| 2.6 | −0.004597 | 0.202326 | 0.400056 | −0.005300 | −0.005300 |
| 2.8 | −0.019259 | 0.426683 | 0.834106 | −0.024475 | −0.024475 |
| 3 | −0.050699 | 2.861899 | 5.673100 | −0.072389 | −0.072389 |
Table 5.
Energy (∆E) of the (0,0) vibrational band, its Einstein coefficient (A), wavelengths (λ), the Franck-Condon factor, and radiative lifetime (τ) of the (0,0) vibrational transition.
Table 5.
Energy (∆E) of the (0,0) vibrational band, its Einstein coefficient (A), wavelengths (λ), the Franck-Condon factor, and radiative lifetime (τ) of the (0,0) vibrational transition.
| Ω-Ω Transition | ∆E/cm−1 | A/s−1 | λ/nm | FCF | τ/s |
|---|---|---|---|---|---|
| − | 7641 | 0.403824 | 1308.94 | 0.9100 | 2.4763 |
| 7961 Expt [24]/7981 Expt [39] | |||||
| 8970 [21] a | 0.423 [21] a /0.3 [21] b | 2.4 [21] a/3.4 [21] b | |||
| − | 4197 | 0.001386 | 2382.95 | 0.9702 | 721.2904 |
| 5551 [21] a | 0.00286 [21] | 350 [21] a | |||
| 4700 Expt [24] | |||||
| − | 3443 | 0.001228 | 2904.68 | 0.9820 | 814.1196 |
| 3419 [21] a/3617 [21] c/3586 [5,39] d | 960 [21] a/745 [21] c/780 [21] d | ||||
| − | 4221 | 0.000010 | 2369.65 | 0.9705 | 1618.42 |
a MRD CI method. ∆E (vertical energy)/τ(radiative lifetime). b This value is obtained by employing the experimental energy difference ΔE = 7981 cm−1 and other parameters. Other parameters are from Ref [21] c Full CI method. ΔE (vertical energy)/τ(radiative lifetime) d This value is obtained by employing the experimental energy difference ΔE = 3586 cm−1 and other parameters. Other parameters are from Ref [21].
Disclaimer/Publisher’s Note: The statements, opinions and data contained in all publications are solely those of the individual author(s) and contributor(s) and not of MDPI and/or the editor(s). MDPI and/or the editor(s) disclaim responsibility for any injury to people or property resulting from any ideas, methods, instructions or products referred to in the content. |
© 2023 by the authors. Licensee MDPI, Basel, Switzerland. This article is an open access article distributed under the terms and conditions of the Creative Commons Attribution (CC BY) license (https://creativecommons.org/licenses/by/4.0/).
Share and Cite
MDPI and ACS Style
Xiao, L.; Yan, B.; Minaev, B.F. Near-Infrared Transitions from the Singlet Excited States to the Ground Triplet State of the S2 Molecule. Physchem 2023, 3, 110-124. https://doi.org/10.3390/physchem3010009
AMA Style
Xiao L, Yan B, Minaev BF. Near-Infrared Transitions from the Singlet Excited States to the Ground Triplet State of the S2 Molecule. Physchem. 2023; 3(1):110-124. https://doi.org/10.3390/physchem3010009
Chicago/Turabian StyleXiao, Lidan, Bing Yan, and Boris F. Minaev. 2023. "Near-Infrared Transitions from the Singlet Excited States to the Ground Triplet State of the S2 Molecule" Physchem 3, no. 1: 110-124. https://doi.org/10.3390/physchem3010009