
Are Microalgae New Players in Nitrous Oxide Emissions from Eutrophic Aquatic Environments?


1
School of Food and Advanced Technology, Massey University, Palmerston North 4410, New Zealand
2
Department of Biochemistry and Molecular Biology, University of Cordoba, 14071 Cordoba, Spain
*
Author to whom correspondence should be addressed.
Phycology 2023, 3(3), 356-367; https://doi.org/10.3390/phycology3030023
Submission received: 7 July 2023
/
Revised: 21 July 2023
/
Accepted: 22 July 2023
/
Published: 25 July 2023
Abstract
:Anthropogenic activities cause the introduction of nitrogen (N) into aquatic environments where these N inputs drive the biological synthesis of nitrous oxide (N2O), a potent and ozone-depleting greenhouse gas. To assess the significance of N2O emissions to climate change, the Intergovernmental Panel on Climate Change (IPCC) estimates indirect N2O emissions from rivers, lakes, and estuaries by multiplying the amounts of N received by these ecosystems with specific emission factors. Interestingly, the IPCC recently increased the N2O emission factor associated with wastewater discharge into “nutrient-impacted (eutrophic) aquatic receiving environments” nearly four times based on experimental evidence of high N2O emissions from N-receiving eutrophic ecosystems. As microalgae can produce N2O, these organisms may contribute to the N2O emissions frequently reported in eutrophic aquatic bodies. If that is the case, estimating N2O emissions solely based on nitrogen inputs to water bodies might lead to inaccurate N2O budgeting as microalgae growth is often limited by phosphorus in these environments. Establishing the significance of microalgal N2O synthesis in eutrophic environments is, therefore, critical and may lead to considerable changes on how to budget and mitigate N2O emissions and eutrophication.
1. Introduction
The natural and/or anthropogenic (e.g., farm runoff) introduction of nitrogen (N) and phosphorus (P) into water bodies can cause the excessive growth of primary producers (i.e., plants) such as microalgae. This phenomenon, known as eutrophication, affects aquatic ecosystems globally [1,2,3] and is now considered a global environmental issue because of its increased occurrence [3]. The overgrowth of microalgae through massive blooms disturbs aquatic ecosystems in many ways. When actively growing, the blooms can harm the ecosystem by producing toxins, preventing light penetration, and modifying the water pH [4,5,6]. When dying, the blooms are decomposed by microbes severely depleting dissolved oxygen to levels that cannot support most life [7,8]. Unfortunately, another potential issue related to eutrophication has potentially been overlooked: the synthesis and emission of the greenhouse gas nitrous oxide (N2O).
N2O is a globally significant ozone-depleting pollutant [9] and greenhouse gas (GHG) with a global-warming potential 273-times higher than CO2 on a 100-year time scale [10]. Global N2O emissions from oceans, inland, and coastal waters were estimated at 4300 kt N-N2O·year−1 from 2007 to 2016, and 14% of these emissions were caused by anthropogenic activities [11]. The Intergovernmental Panel on Climate Change (IPCC) assumes anthropogenic N2O emissions are indirectly caused by the introduction of anthropogenic N inputs into inland and coastal waters: (1) The leaching and runoff of N from agricultural soils; (2) The volatilization of N from land and its redeposition on water surfaces; (3) The discharge of N-rich wastewater into water bodies. A critical assumption behind the current methodology is that N2O synthesis is mostly caused by bacterial nitrification and denitrification and that, consequently, N2O emissions are directly correlated to N inputs. Challenging this view, eutrophic aquatic environments are characterized by the abundance of microalgae whose growth is not necessarily linked (or linearly correlated) to the N inputs received and whose ability to produce N2O has now been clearly demonstrated [12,13,14,15,16,17]. Microalgae species from the Bacillariophyta, Chlorophyta, and Cyanobacteria have indeed been shown to synthesize N2O in the laboratory [13,18] and significant N2O emissions have been reported during microalgae cultivation outdoors [12,19,20].
Based on recent evidences, this article challenges the accuracy of current N2O budgeting methodologies in view of the potential significance of microalgal N2O synthesis and the impact of P pollution on this potentially new source. Importantly, the aim of this article is to raise awareness about the potential global impact of the ability of microalgae to synthesize N2O. Acknowledging and investigating microalgal N2O emissions from eutrophic environments is of paramount importance to establish the role microalgae play in N2O emissions from these aquatic ecosystems and if monitoring and greenhouse gases budgeting methodologies needs to be revised. Noteworthy, the terms hyperoxia, normoxia, hypoxia, and anoxia will be used to describe oversaturated, normal, low, and absent levels of dissolved oxygen in aquatic bodies, respectively. In addition, while microalgae are taxonomically eukaryotic phototrophs, cyanobacteria are often considered as microalgae in the literature and this broader definition will be used in this article for simplicity.
2. N2O Inventory for Aquatic Environments
2.1. Current Methodology
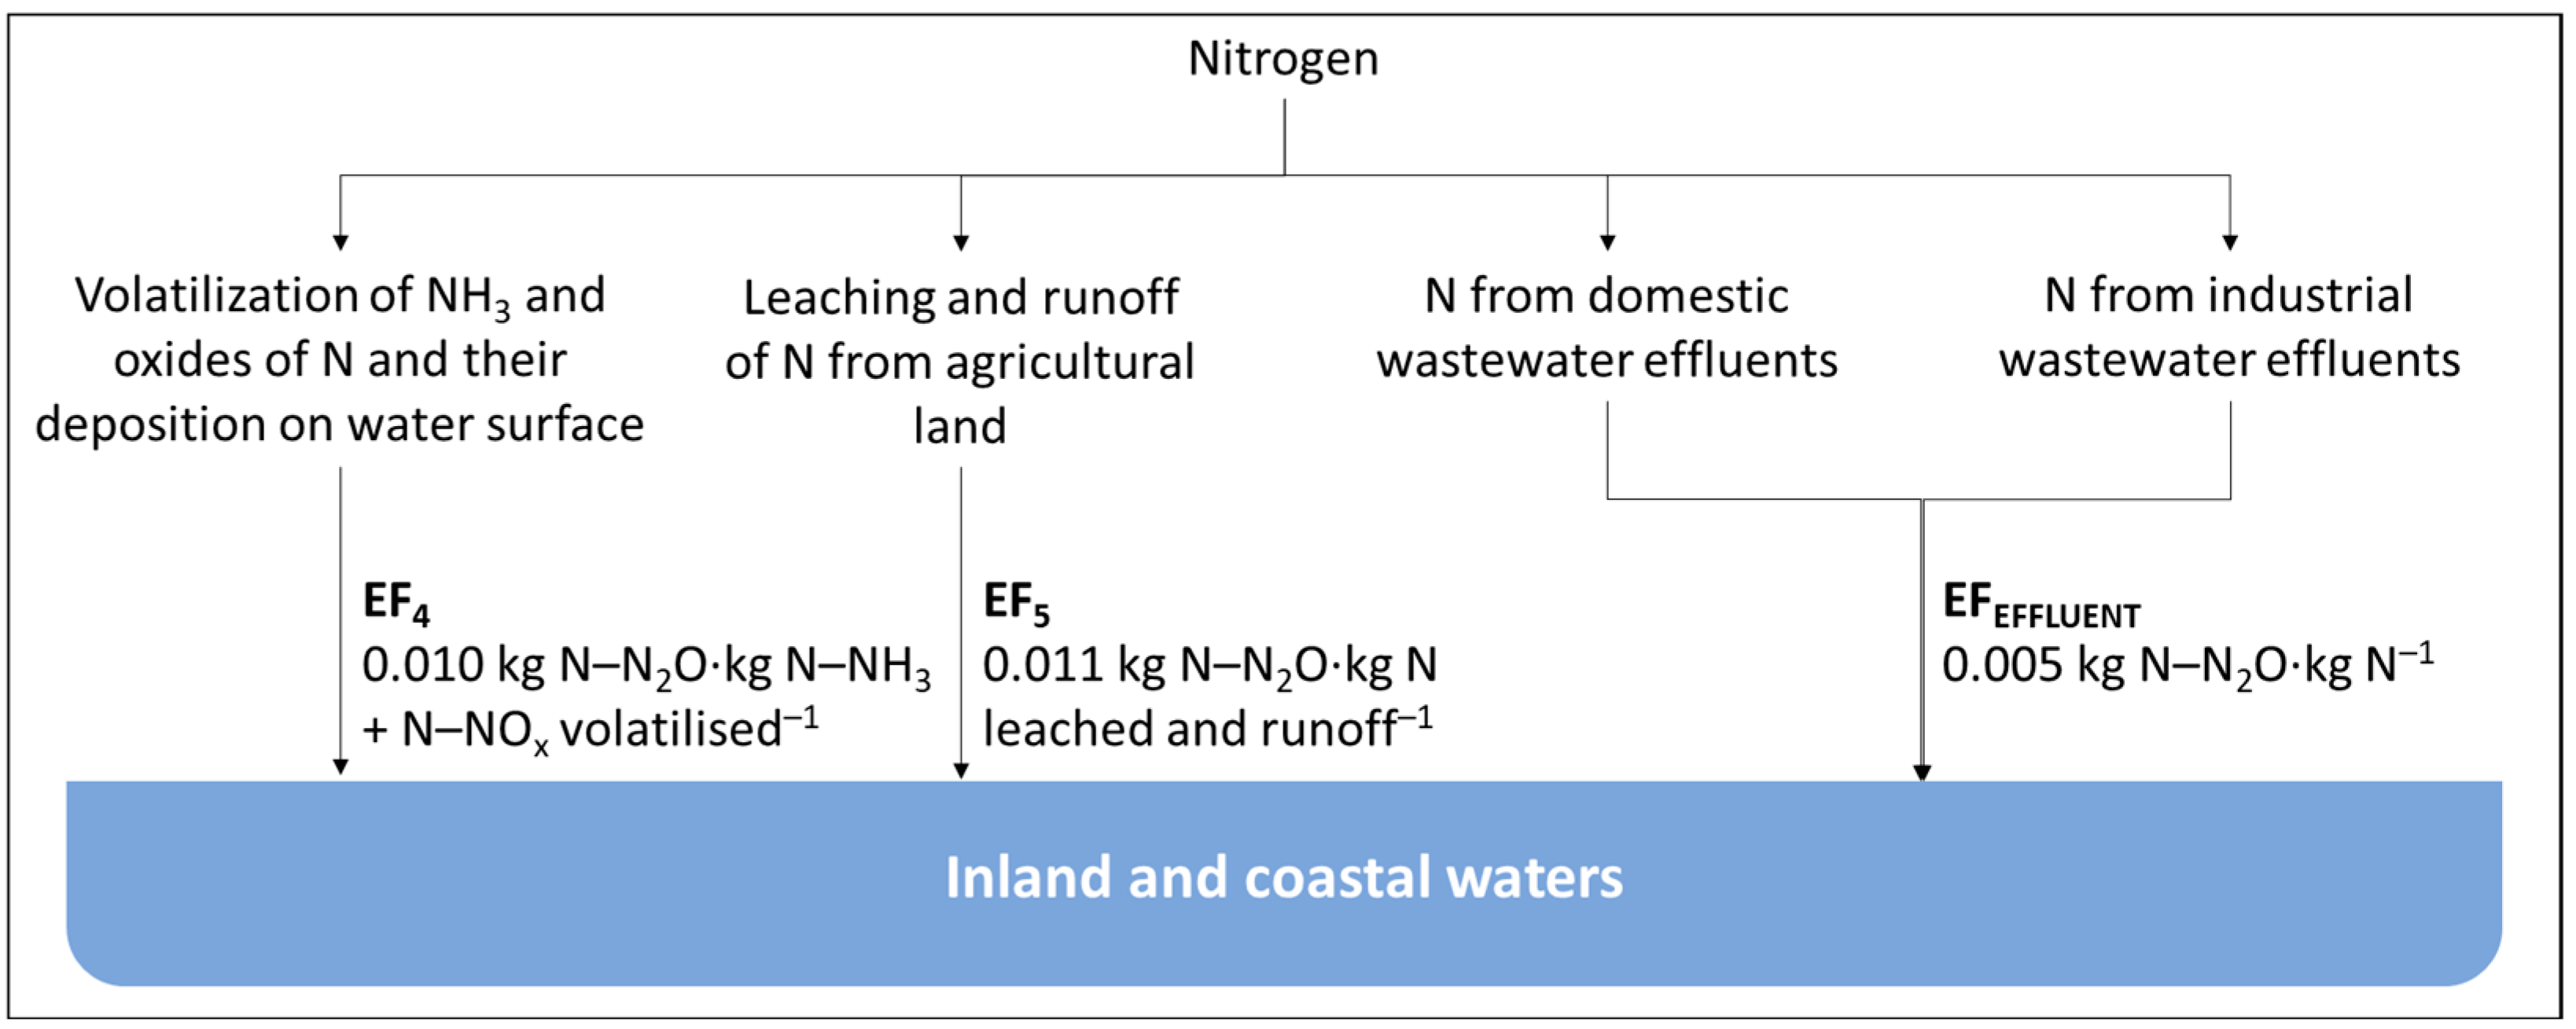
Figure 1 depicts the Tier 1 methodology recommended by the IPCC to estimate anthropogenic N2O emissions from aquatic environments. These indirect N2O emissions are estimated by multiplying the N loads predicted to be received with emission factors specific to emitting activities and/or receiving environments using a three-tiered approach: (1) The Tier 1 method calculates GHG emissions using default emission factors and, when applicable, default partitioning factors to estimate N loads; (2) The Tier 2 method uses country-specific emission factors and partitioning factors; (3) The Tier 3 method uses country-specific models and data [21]. Tier 1 emission factors of 0.01 and 0.011 kg N–N2O·kg N input−1 are currently recommended to estimate indirect N2O emissions from aquatic environments receiving N via atmospheric deposition (EF4) and from agricultural runoff and leaching (EF5), respectively [21]. A Tier 1 emission factor of 0.005 kg N–N2O·kg N−1 is also recommended to estimate indirect N2O emissions from aquatic environments receiving N from domestic and industrial wastewater effluents [22]. These Tier 1 emission factors were calculated based on experimental measurements of N2O emissions and N inputs in various aquatic ecosystems. Indirect aquatic N2O emissions due to N inputs from agricultural soils were, thus, calculated based on data from 106 studies [23]. The emission factor used to compute N2O emissions from soils, lakes, and other waters (EF4) has the same value as the emission factor used to estimate N2O emissions from the direct application of fertilizers because the deposition of N on land and water surfaces is considered to be equivalent to the application of fertilizers [21]. N2O emissions resulting from the discharge of N-laden wastewater effluents into water bodies are estimated using a specific emission factor for effluent discharge (EFEFFLUENT). This factor was calculated based on the average of the ratios of dissolved N–N2O- concentration to N concentration found in the literature. The default Tier 1 EFEFFLUENT value was calculated using data from 62 well-oxygenated environments [22].
2.2. Limitations to the Current Approach
Numerous species of bacteria, archaea, fungi, and microalgae can produce N2O via processes known as denitrification, nitrification, and nitrogen uptake from nitrates and nitrites [24,25,26,27].
Bacterial N2O synthesis can occur during nitrification, denitrification, coupled nitrification–denitrification, nitrifier–denitrification, and anaerobic ammonia oxidation in the benthic zone of different aquatic ecosystems [6,28,29,30,31]. During nitrification, ammonia is oxidized into hydroxylamine (NH2OH) by the enzyme ammonia monooxygenase and NH2OH is further oxidized to nitrite (NO2−) by hydroxylamine oxidoreductase. During this process, N2O can be formed from the spontaneous chemical decomposition of NH2OH or NO2− [28,30,32]. Denitrifying bacteria are responsible for N2O production during partial denitrification under hypoxia or anoxia. Denitrification is a respiratory pathway during which nitrate (NO3−) is first reduced to NO2− by nitrate reductase (NR) and NO2− is then reduced to nitric oxide (NO) by nitrite reductase (NiR). NO is, in turn, reduced to N2O by nitric oxide reductase (NOR) and N2O is finally reduced to nitrogen (N2) by nitrous oxide reductase [33]. During denitrification, N2O production increases with the presence of O2 and at low pH as these conditions inhibit nitrous oxide reductase (N2OR) activity.
Fungal N2O synthesis occurs via denitrification, as described above for bacteria, and co-denitrification catalyzed by the fungal NOR when a nitrogen co-substrate (e.g., NH4+, amino acids, or urea) is available [30,34,35].
Archaeal N2O synthesis occurs during the first step of nitrification and this pathway significantly contributes to N2O emissions from oceans [36,37,38].
Microalgal N2O synthesis occurs via the successive reduction of NO3− into NO2− and NO then converted into N2O via various putative pathways as further detailed in Section 3.2.
As illustrated in Figure 1, the IPCC currently considers that N2O emissions increase linearly with N inputs because it assumes N2O production mainly depends on the N2O yields of bacterial nitrification and denitrification [21,22]. Webb et al. [39], however, argued that indirect N2O emissions from agricultural surface waters were overestimated using this approach due to the impacts of factors such as the hydraulic retention time (HRT) and substrate availability (i.e., N2O emissions do not linearly increase with N input). N2O production and consumption have indeed been shown to be influenced by various parameters in inland and coastal waters. The size and morphology of water bodies, especially water depth, and the HRT of the water impact the biological productivity of rivers [40], lakes [41], estuaries [42], and oceans [43] through interactions between the water, nutrient cycling, and/or microorganisms [41,42,43]). A long HRT means that phytoplankton suspended in water have more time to uptake nutrients before being flushed out [44]. Miao et al. [45] also noticed a significant seasonality and spatial variation of N2O emissions from lake Chaohu, China, and suggested that these emissions were under the control of factors such as the transfer velocity of N2O from water to the atmosphere, water temperature, and dissolved oxygen concentration. For example, high temperatures reduce the solubility of dissolved oxygen and can, therefore, promote denitrification [46].
Another methodological limitation to estimate N2O emissions is that the same emission factor is used for different environments. For example, the value of 0.0026 kg N–N2O·kg N leached and runoff−1 is used for both reservoirs and rivers despite significantly different emissions being documented for reservoirs (0.17–0.44 kg N–N2O·kg N leached and runoff−1) and rivers (0.004–0.005 kg N–N2O·kg N leached and runoff−1, [47]). The observed differences could be explained by the impact of HRT on biological N2O synthesis [47]. Mulholland et al. [48] used nitrogen stable isotope tracing to study the nitrogen removal in 72 streams located in the United States and Puerto Rico and evidenced a reduction in the emission rate using the N load. As a consequence from these experimental observations, nonlinear models for N2O emissions from streams and rivers considering environmental parameters such as size, morphology, and climate have been proposed in the literature [40,49].
The IPCC is constantly improving its methodology based on new data and findings and it is, therefore, critical to challenge its assumptions and provide potential solutions for improvement. The discussion below specifically challenges the assumption that bacterial mechanisms are the only significant sources of N2O in eutrophic environments.
3. Potential Significance of Microalgal N2O Synthesis
3.1. A case for Microalgal N2O Emissions
High N2O emissions have been reported during algal blooms in various ecosystems (Table 1 and Table 2). Interestingly, when focusing on lakes, various authors have attributed these emissions to the decay of microalgae causing bacterial denitrification under hypoxia or anoxia [50,51,52]. However, high N2O emissions recorded under normoxia have been correlated to chlorophyll a concentration, a proxy for microalgae biomass concentration [2,53,54], which suggests bacterial denitrification may not be the mechanism involved in these oxic environments. In addition, results from Teuma [55] showed that the addition of NO2− to microalgae-rich normoxic lake samples incubated with or without antibiotics produced N2O at similar rates during a 24 h period. While this needs to be confirmed in the field, these results also suggest that bacteria are not necessarily the main producers of N2O in lakes and potentially other ecosystems. The ability of microalgae to synthesize N2O combined with their ubiquity in eutrophic ecosystems, therefore, mandate investigating if these microorganisms indeed play a significant role in N2O emissions. Unfortunately, current methodologies for GHG monitoring are not designed to cope with the fickle nature of microalgal N2O emissions because the rate of microalgal N2O synthesis indeed rapidly fluctuates (minutes) with solar irradiance depending on cloud cover [13,19,56]. N2O monitoring from aquatic ecosystems should, therefore, prevent artificial shading of the microalgae and involve frequent sampling. Water depth and flow (i.e., turbulence) should be considered during monitoring as turbulence resuspend particles (e.g., silt, clay, and microorganisms) reducing light penetration in water. Thus, the growth of benthic primary producers is limited to low-depth areas with clear water and low turbulence [44]. In many lakes, estuaries and coastal waters, photosynthetic activity mainly occurs near the surface as the primary producers themselves shade the water column below. The occurrence of algal blooms can also increase in poorly mixed water and during sustained water stratification. When turbulence becomes excessive, phytoplankton growth is reduced or can even stop due to cell damage caused by shear [57] while thermal stratification increases the risk of algal bloom because phytoplankton can be trapped in a nutrient-rich layer near the surface, where light is also available [44].
3.2. N2O Emissions from Microalgae Ecosystems
The ability of microalgae to synthesize and emit N2O is now well established [12,13,14,15,16,17] (Table 1) and N2O emissions from various aquatic environments harboring microalgae have been repeatedly reported in the literature (Table 2). Based on the limited amount of data available, several authors have predicted that global N2O emissions from eutrophic lakes, that only started to be considered in the 2019 IPCC methodology refinement, could represent 52 to 211 Tg CO2-eq·year−1 [2,12,19], which represent 3 to 12% of all direct anthropogenic N2O emissions from agriculture, the largest contributor to anthropogenic N2O emissions [11]. Based on the data presented in Table 2, similar N2O fluxes were reported from lakes, coastal waters, and oceans. There is, therefore, a need to better understand microalgal N2O synthesis and assess its potential significance, particularly when algae blooms are occurring more frequently and globally due to anthropogenic activities [2,42,58,59,60,61].

Table 1.
Algae species and N2O fluxes reported during microalgae cultivation (modified from Plouviez et al. [12]).
Table 1.
Algae species and N2O fluxes reported during microalgae cultivation (modified from Plouviez et al. [12]).
| N2O Emissions from Laboratory culturess and Engineered Systems | ||||
|---|---|---|---|---|
| Alga Division | Algal Species | Ecosystem | N2O Flux | Reference |
| Green microalgae | Chlorella vulgaris | Laboratory assays | 109–1480 nmole·h−1·g DW−1 | [16] |
| Photobioreactor | 563–4134 nmole·h−1·g DW−1 | [16] | ||
| Photobioreactor | 9.60–38,000 nmole·m−2·h−1 | [56] | ||
| Raceway pond | 2–5685 nmole·h−1·g DW−1 | [62] | ||
| C. rubescens | Laboratory assays | 1200–2500 nmole·h−1·g DW−1 | [14] | |
| C. variabilis | Laboratory assays | 300 µmole·L−1·h−1 | [17] | |
| Coelastrum sp. | Laboratory assays | 560–1100 nmole·h−1·g DW−1 | [14] | |
| Chlorococcum vacuolarum | Laboratory assays | 150–290 nmole·h−1·g DW−1 | [14] | |
| Neochloris sp. | Photobioreactor | 50–14,200 nmole·m−2·h−1 | [56] | |
| Scenedesmus dimorphus | Laboratory assays | 6–73 nmole·h−1·g DW−1 | [63] | |
| S. obliquus | Laboratory assays | 0–1000 nmole·h−1·g DW−1 | [14] | |
| Chlamydomonas reinhardtii | Laboratory assays | 7.5–74 nmole·h−1·g DW−1 | [13] | |
| Laboratory assays | 54 µmole·L−1·h−1 | [17] | ||
| Coccomyxa subellipsoidea | Laboratory assays | 225 µmole·L−1·h−1 | [17] | |
| Tetraselmis subcordiformis | Laboratory assays | 188 µmole·L−1·h−1 | [17] | |
| Eustigmatophyceae | Nannochloropsis oculata | Laboratory assays | 0.98 nmole·L−1·h−1 | [64] |
| Diatoms | Skeletonema marinoi | Laboratory assays | 0.039–0.31 nmole·h−1·aggregate−1 | [65] |
| Thalassiosira weissflogii | Laboratory assays | 0.087–0.3 nmole·L−1·h−1 | [66] | |
| Staurosira sp. | Raceway pond | −212.5–316.7 nmole·m−2·h−1 | [67] | |
| Cyanobacteria | Aphanocapsa 6308 | Laboratory assays | 0–1500 nmole·h−1·g DW−1 | [15] |
| Aphanocapsa 6714 | Laboratory assays | 0–5700 nmole·h−1·g DW−1 | [15] | |
| Nostoc sp. | Laboratory assays | 0–1500 nmole·h−1·g DW−1 | [15] | |
| Microcystis aeruginosa | Laboratory assays | 0–198.9 nmole·h−1·g DW−1 | [18] | |
Table 2.
N2O emissions from natural environments reported from studies acknowledging algal involvement in the N2O emissions (modified from Plouviez et al. [12]).
Table 2.
N2O emissions from natural environments reported from studies acknowledging algal involvement in the N2O emissions (modified from Plouviez et al. [12]).
| N2O Emissions from Aquatic Ecosystems | |||
|---|---|---|---|
| Ecosystem | N2O Flux | O2 Conditions 1 | Reference |
| Ocean | 115 nmole·m−2·h−1 | Normoxic | [68] |
| Ocean | 409 nmole·m−2·h−1 | Hypoxic | [69] |
| Coastal wetland | 125–228 nmole·m−2·h−1 | Anoxic and hypoxic | [70] |
| Ocean | 123–132% saturation | Normoxic | [71] |
| Lake (including eutrophic ones) | 300–700 nmole·m−2·h−1 | From anoxic to normoxic | [72] |
| Ocean | 88 nmole·m−2·h−1 | Not specified | [73] |
| Lake (eutrophic) | 357–2450 nmole·m−2·h−1 | Not specified | [74] |
| Lake | 0–10,057 nmole·m−2·h−1 | Oxic | [75] |
| Lake (eutrophic) | 46–230 nmole·m−2·h−1 | From anoxic to hypoxic | [54] |
| Lake | 12.5–2233 nmole·m−2·h−1 | Normoxic and Hyperoxic | [45] |
1 Anoxic conditions occur when dissolved oxygen concentration in freshwater ([O2]) is inferior to 3 µM, hypoxic conditions when 3 µM < [O2] < 200 µM, normoxic conditions when 200 µM < [O2] < 400 µM, and hyperoxic conditions when [O2] > 400 µM [76].
Microalgal N2O synthesis requires NO, which is mainly synthesized from NO2− by the enzyme NR, and the subsequent reduction of NO into N2O [77,78,79]. In the chloroplast, NO reduction into N2O is mediated by flavodiiron proteins (FLVs) using electrons from photosynthesis [17,80]. In the mitochondria, the NO reductase CYP55 has been demonstrated to carry out NO reduction to N2O [13]. In addition to FLVs and CYP55, Chlamydomonas possess four Hybrid Cluster Proteins (HCPs) found in an extensive range of prokaryote and eukaryote organisms [81]. While the physiological functions of HCPs remain uncertain in eukaryotic microalgae, HCPs may be responsible for N2O production under anaerobic conditions in bacteria [82]. The Chlamydomonas genome also contains a gene homologous to the bacterial and fungal genes encoding a copper-containing nitrite reductase [27], which is absent in most eukaryotes [83]. The role of this enzyme has not been described yet, but its presence suggests another potential pathway for NO synthesis from NO2− in the mitochondria. Bellido-Pedraza et al. [27] estimated that nearly one third of the 100 photosynthetic microorganisms described in genomic databases contain at least one of the proteins involved in N2O synthesis in Chlamydomonas (NirK, CYP55, FLVs, and HCP), including the widely distributed and dominant cyanobacterium in freshwater ecosystems Microcystis aeruginosa [18]. There is, therefore, clear evidence for the existence of several broadly distributed N2O synthesis pathways in microalgae. This, in turn, suggests that microalgal N2O emissions should occur in many algae-rich ecosystems and under many conditions.
4. Nitrogen, the Perfect Culprit for N2O Emissions from Eutrophic Environments?
4.1. N2O Emissions under Oxia
Based on “research published between 1978 and 2017 […] indicating that higher N2O emissions occur when wastewater is discharged to nutrient-impacted (eutrophic) or hypoxic aquatic receiving environments”, the IPCC recently increased the EF associated with wastewater discharge into “nutrient-impacted waters” from 0.005 to 0.019 kg N–N2O·kg N−1 [22]. The IPCC, however, postulates that the higher N2O emissions experimentally recorded in eutrophic waters are caused by bacterial N2O synthesis enhanced under hypoxic/anoxic conditions caused by light attenuation (due to microalgae proliferation) and microalgae decay. Consequently, the IPCC does not recommend to increase the emission factor used to compute N2O emissions associated with N runoffs from agriculture, stating that a “combination of reducing conditions and high organic loading […] are unlikely to exist in agricultural runoff systems” [22]. Challenging this approach, microalgae have been reported to produce N2O under normoxia and even hyperoxia, meaning that dissolved oxygen concentration might not be the most relevant parameter to determine if eutrophic environments generate high N2O emissions. As suggested above, further monitoring of N2O emissions from eutrophic ecosystems would, therefore, be critical to inform if the current IPPC assumptions yield accurate N2O emission estimates or if, instead, refinements in accounting methodologies are needed.
4.2. Possible Impact of Phosphorus Inputs on N2O Emissions in Eutrophic Ecosystems
While it is currently unknown how P availability influences N2O emissions in eutrophic aquatic environments, P availability has been reported to influence N2O emissions from soils [84,85,86,87], with higher emissions reported when P is added to P-depleted soils [84,85].
P inputs into aquatic ecosystems can trigger microalgae proliferation, sometimes in combination with N inputs [88,89,90,91,92]. Moreover, P accumulation in the sediments can cause P reintroduction into water, which can trigger an algal bloom in the absence of recent P input [93,94]. Nutrient stoichiometry must also be considered because the N:P ratio can influence microalgal population dynamics [95,96,97] and impact microalgal diversity [98]. These impacts of P, together with the ability of microalgae to produce N2O, may mean that N2O emissions from eutrophic environments may not only be correlated to N inputs. Understanding the impact of both N and P inputs on algal N2O emissions may, therefore, be critical to accurately estimate N2O emissions from eutrophic ecosystems. The potential impact of P could even trigger a paradigm shift on how N2O emissions are mitigated as this may require the limitations of both N and P inputs to water bodies [92].
4.3. Possible Impact of Micronutrients Inputs and Microbial Interactions in Eutrophic Ecosystems
While N and P are generally driving the level and duration of blooms in aquatic ecosystems, micronutrients such as metallic ions (e.g., Fe) may also be critical. Micronutrients are essential for microalgal growth [99] and these nutrients can influence microalgal diversity and/or trigger blooms in natural aquatic environments [100,101,102]. In addition, micronutrients such as copper have been shown to influence the activity of denitrifiers’ nitrous oxide reductase enzymes [103]. As these potential impacts have not been characterized in microalgae, determining how and/if micronutrients influence microalgal N2O emissions, therefore, deserves careful investigation.
Another field of research requiring consideration is the impact of microalgal–microbial interactions on N2O emissions. In natural environments, microbes form complex relationships (symbiotic or nonsymbiotic) with other microorganisms involving nutrient or growth factor exchanges, quorum sensing mediation, and/or episodic parasitism/killing [104,105].
4.4. Are Microalgae New Players in Nitrous Oxide Emissions from Eutrophic Aquatic Environments?
To this date, it is still unclear whether microalgae contribute significantly to the N2O emissions reported from eutrophic aquatic ecosystems, especially for estuaries and coastal ecosystems. However, microalgae have been shown to synthesize N2O in various settings and preliminary assays suggested their involvement in N2O emissions in lake samples [55]. Further field data and/or microcosms are, therefore, needed to confirm these findings in many other aquatic ecosystems. Considering the sensitivity of microalgal N2O synthesis, and the seasonal variability in N2O emissions reported in the field [43,74,106], long-term with wide spatial coverage and high sampling frequency monitoring of various microalgae-rich environments are, therefore, needed to improve the accuracy of N2O emissions from these systems. The use of genomics would also be critical to unravel the occurrence and ecological implications of microalgal N2O synthesis and the potential interplay between microbial N2O biosynthetic pathways in those environments.
5. Conclusions
The IPCC currently estimates N2O emissions from aquatic environments by assuming that bacterial nitrification and denitrification processes leading to N2O synthesis are linearly related to the N inputs received by the aquatic body assessed. Thus, the N2O emissions are calculated as a fraction of the N flux reaching the aquatic body defined as emission factors (EFs). This ‘bacteria-centric’ assumption that N2O emissions only depends on the N input received is, however, challenged by the ability of microalgae to bloom and produce N2O in response to P inputs or combined N and P inputs. Eutrophic aquatic environments are already known to be a higher source of N2O than oligo/mesotrophic environments and the IPCC recently acknowledged this fact by increasing the Tier 3 factor used to compute indirect N2O emissions from wastewater discharge into eutrophic and nutrient-impacted aquatic environments from 0.005 to 0.019 kg N–N2O emitted per kg of N received. These higher emissions from eutrophic environments are only considered at a Tier 3 level for wastewater discharge (e.g., not for indirect N2O emissions from eutrophic aquatic ecosystems receiving N inputs from agricultural N leaching and runoff). In addition, microalgae are still not considered as one of the potential causes of these N2O emissions and, therefore, emissions are still only computed from N inputs. Further monitoring to track the exact source(s) of the N2O emissions in eutrophic aquatic environments, i.e., lakes, rivers, estuaries, and coastal waters, is critical for the following reasons: (1) Past monitoring based on ‘bacteria-centric’ methodologies may have missed the contribution of other organisms such as microalgae; (2) Microbial and particularly ‘microalgal-N2O activity’ could be influenced by P (phosphorus supply) triggering eutrophication, meaning that N2O emissions from affected ecosystems could no longer be based solely on N-loadings (as currently done). A better understanding of the microbial pathways (and interplays) involved during N2O emissions in eutrophic environments could improve how N2O emissions are predicted and mitigated. It could also improve our knowledge and assessment of natural N2O emissions in aquatic environments.
Author Contributions
Writing—original draft preparation, L.T.; writing—review M.P., B.G. and E.S.-L.; editing, L.T. All authors have read and agreed to the published version of the manuscript.
Funding
This study was financially supported by internal funds from Massey University, New Zealand (i.e., Laura Teuma scholarship).
Institutional Review Board Statement
Not applicable.
Informed Consent Statement
Not applicable.
Data Availability Statement
Data presented in this article can be found in the cited literature.
Conflicts of Interest
The authors declare no conflict of interest.
References
- Yang, X.; Wu, X.; Hao, H.; He, Z. Mechanisms and Assessment of Water Eutrophication. J. Zhejiang Univ. Sci. B 2008, 9, 197–209. [Google Scholar] [CrossRef] [PubMed] [Green Version]
- DelSontro, T.; Beaulieu, J.J.; Downing, J.A. Greenhouse Gas Emissions from Lakes and Impoundments: Upscaling in the Face of Global Change. Limnol. Oceanogr. Lett. 2018, 3, 64–75. [Google Scholar] [CrossRef] [PubMed]
- Paerl, H.W.; Otten, T.G.; Kudela, R. Mitigating the Expansion of Harmful Algal Blooms Across the Freshwater-to-Marine Continuum. Environ. Sci. Technol. 2018, 52, 5519–5529. [Google Scholar] [CrossRef] [PubMed]
- Xu, H.; Paerl, H.W.; Qin, B.; Zhu, G.; Gaoa, G. Nitrogen and Phosphorus Inputs Control Phytoplankton Growth in Eutrophic Lake Taihu, China. Limnol. Oceanogr. 2010, 55, 420–432. [Google Scholar] [CrossRef] [Green Version]
- Aubriot, L.; Zabaleta, B.; Bordet, F.; Sienra, D.; Risso, J.; Achkar, M.; Somma, A. Assessing the Origin of a Massive Cyanobacterial Bloom in the Río de La Plata (2019): Towards an Early Warning System. Water Res. 2020, 181, 115944. [Google Scholar] [CrossRef]
- Huang, F.; Pan, L.; He, Z.; Zhang, M.; Zhang, M. Identification, Interactions, Nitrogen Removal Pathways and Performances of Culturable Heterotrophic Nitrification-Aerobic Denitrification Bacteria from Mariculture Water by Using Cell Culture and Metagenomics. Sci. Total Environ. 2020, 732, 139268. [Google Scholar] [CrossRef]
- Rabalais, N.N.; Cal, W.-J.; Carstensen, J.; Conley, D.J.; Fry, B.; Hu, X.; Quinones-Rivera, Z.; Rosenberg, R.; Slomp, C.P.; Turner, R.E.; et al. Eutrophication-Driven Deoxygenation in the Coastal Ocean. Oceanography 2014, 27, 172–183. [Google Scholar] [CrossRef] [Green Version]
- Jenny, J.-P.; Francus, P.; Normandeau, A.; Lapointe, F.; Perga, M.-E.; Ojala, A.; Schimmelmann, A.; Zolitschka, B. Global Spread of Hypoxia in Freshwater Ecosystems during the Last Three Centuries Is Caused by Rising Local Human Pressure. Glob. Chang. Biol. 2016, 22, 1481–1489. [Google Scholar] [CrossRef]
- Ravishankara, A.R.; Daniel, J.S.; Portmann, R.W. Nitrous Oxide (N2O): The Dominant Ozone-Depleting Substance Emitted in the 21st Century. Science 2009, 326, 123–125. [Google Scholar] [CrossRef] [Green Version]
- Masson-Delmotte, V.; Zhai, P.; Pirani, A.; Connors, S.L.; Péan, C.; Berger, S.; Caud, N.; Chen, Y.; Goldfarb, L.; Gomis, M.I.; et al. IPCC, 2021: Summary for Policymakers. In Climate Change 2021: The Physical Science Basis. Contribution of Working Group I to the Sixth Assessment Report of the Intergovernmental Panel on Climate Change; Cambridge University Press: Cambridge, UK; New York, NY, USA, 2021. [Google Scholar]
- Tian, H.; Xu, R.; Canadell, J.G.; Thompson, R.L.; Winiwarter, W.; Suntharalingam, P.; Davidson, E.A.; Ciais, P.; Jackson, R.B.; Janssens-Maenhout, G.; et al. A Comprehensive Quantification of Global Nitrous Oxide Sources and Sinks. Nature 2020, 586, 248–256. [Google Scholar] [CrossRef]
- Plouviez, M.; Shilton, A.; Packer, M.A.; Guieysse, B. Nitrous Oxide Emissions from Microalgae: Potential Pathways and Significance. J. Appl. Phycol. 2019, 31, 1–8. [Google Scholar] [CrossRef]
- Plouviez, M.; Wheeler, D.; Shilton, A.; Packer, M.A.; McLenachan, P.A.; Sanz-Luque, E.; Ocaña-Calahorro, F.; Fernández, E.; Guieysse, B. The Biosynthesis of Nitrous Oxide in the Green Alga Chlamydomonas reinhardtii. Plant J. 2017, 91, 45–56. [Google Scholar] [CrossRef] [Green Version]
- Weathers, P. N2O Evolution by Green Algae. Appl. Environ. Microbiol. 1984, 48, 1251–1253. [Google Scholar] [CrossRef] [Green Version]
- Weathers, P.J.; Niedzielski, J.J. Nitrous Oxide Production by Cyanobacteria. Arch. Microbiol. 1986, 146, 204–206. [Google Scholar] [CrossRef]
- Guieysse, B.; Plouviez, M.; Coilhac, M.; Cazali, L. Nitrous Oxide (N2O) Production in Axenic Chlorella vulgaris Microalgae Cultures: Evidence, Putative Pathways, and Potential Environmental Impacts. Biogeosciences 2013, 10, 6737–6746. [Google Scholar] [CrossRef] [Green Version]
- Burlacot, A.; Richaud, P.; Gosset, A.; Li-Beisson, Y.; Peltier, G. Algal Photosynthesis Converts Nitric Oxide into Nitrous Oxide. Proc. Natl. Acad. Sci. USA 2020, 117, 2704–2709. [Google Scholar] [CrossRef] [Green Version]
- Fabisik, F.; Guieysse, B.; Procter, J.; Plouviez, M. Nitrous Oxide (N2O) Synthesis by the Freshwater Cyanobacterium Microcystis aeruginosa. Biogeosciences 2023, 20, 687–693. [Google Scholar] [CrossRef]
- Plouviez, M.; Guieysse, B. Nitrous Oxide Emissions during Microalgae-Based Wastewater Treatment: Current State of the Art and Implication for Greenhouse Gases Budgeting. Water Sci. Technol. 2020, 82, 1025–1030. [Google Scholar] [CrossRef]
- Zhang, Y.; Wang, J.-H.; Zhang, J.-T.; Chi, Z.-Y.; Kong, F.-T.; Zhang, Q. The Long Overlooked Microalgal Nitrous Oxide Emission: Characteristics, Mechanisms, and Influencing Factors in Microalgae-Based Wastewater Treatment Scenarios. Sci. Total Environ. 2023, 856, 159153. [Google Scholar] [CrossRef]
- Hergoualc’h, K.; Akiyama, H.; Bernoux, M.; Chirinda, N.; del Prado, A.; Kasimir, Å.; MacDonald, J.D.; Ogle, S.M.; Regina, K.; van der Weerden, T.J. 2019 Refinement to the 2006 IPCC Guidelines for National Greenhouse Gas Inventories—Volume 4 Agriculture, Forestry and Other Land Use—Chapter 11: N2O Emissions from Managed Soils, and CO2 Emissions from Lime and Urea Application; Intergovernmental Panel on Climate Change: Geneva, Switzerland, 2019. [Google Scholar]
- Bartram, D.; Short, M.D.; Ebie, Y. 2019 Refinement to the 2006 IPCC Guidelines for National Greenhouse Gas Inventories—Volume 5 Waste—Chapter 6: Wastewater Treatment and Discharge; Intergovernmental Panel on Climate Change: Geneva, Switzerland, 2019. [Google Scholar]
- Tian, L.; Cai, Y.; Akiyama, H. A Review of Indirect N2O Emission Factors from Agricultural Nitrogen Leaching and Runoff to Update of the Default IPCC Values. Environ. Pollut. 2019, 245, 300–306. [Google Scholar] [CrossRef]
- Hahn, J.; Junge, C. Atmospheric Nitrous Oxide: A Critical Review. Z. Naturforsch. 1977, 32, 190–214. [Google Scholar] [CrossRef]
- Hallin, S.; Philippot, L.; Löffler, F.E.; Sanford, R.A.; Jones, C.M. Genomics and Ecology of Novel N2O-Reducing Microorganisms. Trends Microbiol. 2018, 26, 43–55. [Google Scholar] [CrossRef] [PubMed]
- Jung, M.-Y.; Gwak, J.-H.; Rohe, L.; Giesemann, A.; Kim, J.-G.; Well, R.; Madsen, E.L.; Herbold, C.W.; Wagner, M.; Rhee, S.-K. Indications for Enzymatic Denitrification to N2O at Low PH in an Ammonia-Oxidizing Archaeon. ISME J. 2019, 13, 2633–2638. [Google Scholar] [CrossRef] [PubMed] [Green Version]
- Bellido-Pedraza, C.M.; Calatrava, V.; Sanz-Luque, E.; Tejada-Jiménez, M.; Llamas, Á.; Plouviez, M.; Guieysse, B.; Fernández, E.; Galván, A. Chlamydomonas reinhardtii, an Algal Model in the Nitrogen Cycle. Plants 2020, 9, 903. [Google Scholar] [CrossRef]
- Wrage, N.; Velthof, G.L.; van Beusichem, M.L.; Oenema, O. Role of Nitrifier Denitrification in the Production of Nitrous Oxide. Soil Biol. 2001, 33, 1723–1732. [Google Scholar] [CrossRef]
- Piña-Ochoa, E.; Álvarez-Cobelas, M. Denitrification in Aquatic Environments: A Cross-System Analysis. Biogeochemistry 2006, 81, 111–130. [Google Scholar] [CrossRef]
- Hayatsu, M.; Tago, K.; Saito, M. Various Players in the Nitrogen Cycle: Diversity and Functions of the Microorganisms Involved in Nitrification and Denitrification. Soil Sci. Plant Nutr. 2008, 54, 33–45. [Google Scholar] [CrossRef]
- Ward, B.B.; Arp, D.J.; Klotz, M.G. (Eds.) Nitrification; American Society for Microbiology, ASM Press: Washington, DC, USA, 2011; ISBN 978-1-55581-481-6. [Google Scholar]
- Zhu-Barker, X.; Cavazos, A.R.; Ostrom, N.E.; Horwath, W.R.; Glass, J.B. The Importance of Abiotic Reactions for Nitrous Oxide Production. Biogeochemistry 2015, 126, 251–267. [Google Scholar] [CrossRef]
- Ren, Y.; Ngo, H.H.; Guo, W.; Ni, B.-J.; Liu, Y. Linking the Nitrous Oxide Production and Mitigation with the Microbial Community in Wastewater Treatment: A Review. Bioresour. Technol. Rep. 2019, 7, 100191. [Google Scholar] [CrossRef]
- Shoun, H.; Fushinobu, S.; Jiang, L.; Kim, S.-W.; Wakagi, T. Fungal Denitrification and Nitric Oxide Reductase Cytochrome P450nor. Philos. Trans. R. Soc. B Biol. Sci. 2012, 367, 1186–1194. [Google Scholar] [CrossRef] [Green Version]
- Higgins, S.A.; Welsh, A.; Orellana, L.H.; Konstantinidis, K.T.; Chee-Sanford, J.C.; Sanford, R.A.; Schadt, C.W.; Löffler, F.E. Detection and Diversity of Fungal Nitric Oxide Reductase Genes (P450nor) in Agricultural Soils. Appl. Environ. Microbiol. 2016, 82, 2919–2928. [Google Scholar] [CrossRef] [Green Version]
- Santoro, A.E.; Buchwald, C.; McIlvin, M.R.; Casciotti, K.L. Isotopic Signature of N2O Produced by Marine Ammonia-Oxidizing Archaea. Science 2011, 333, 1282–1285. [Google Scholar] [CrossRef]
- Löscher, C.R.; Kock, A.; Könneke, M.; LaRoche, J.; Bange, H.W.; Schmitz, R.A. Production of Oceanic Nitrous Oxide by Ammonia-Oxidizing Archaea. Biogeosciences 2012, 9, 2419–2429. [Google Scholar] [CrossRef] [Green Version]
- Qin, W.; Meinhardt, K.A.; Moffett, J.W.; Devol, A.H.; Virginia Armbrust, E.; Ingalls, A.E.; Stahl, D.A. Influence of Oxygen Availability on the Activities of Ammonia-Oxidizing Archaea: Influence of Oxygen Availability. Environ. Microbiol. Rep. 2017, 9, 250–256. [Google Scholar] [CrossRef]
- Webb, J.R.; Clough, T.J.; Quayle, W.C. A Review of Indirect N2O Emission Factors from Artificial Agricultural Waters. Environ. Res. Lett. 2021, 16, e043005. [Google Scholar] [CrossRef]
- Marzadri, A.; Dee, M.M.; Tonina, D.; Bellin, A.; Tank, J.L. Role of Surface and Subsurface Processes in Scaling N2O Emissions along Riverine Networks. Proc. Natl. Acad. Sci. USA 2017, 114, 4330–4335. [Google Scholar] [CrossRef]
- Wetzel, R.G. Rivers and Lakes—Their distribution, origins and forms. In Limnology; Elsevier: Amsterdam, The Netherlands, 2001; pp. 15–42. ISBN 978-0-12-744760-5. [Google Scholar]
- Pinckney, J.L.; Paerl, H.W.; Tester, P.; Richardson, T.L. The Role of Nutrient Loading and Eutrophication in Estuarine Ecology. Environ. Health Perspect. 2001, 109, 699–706. [Google Scholar]
- Yang, S.; Chang, B.X.; Warner, M.J.; Weber, T.S.; Bourbonnais, A.M.; Santoro, A.E.; Kock, A.; Sonnerup, R.E.; Bullister, J.L.; Wilson, S.T.; et al. Global Reconstruction Reduces the Uncertainty of Oceanic Nitrous Oxide Emissions and Reveals a Vigorous Seasonal Cycle. Proc. Natl. Acad. Sci. USA 2020, 117, 11954–11960. [Google Scholar] [CrossRef]
- Pinay, G.; Gascuel, C.; Ménesguen, A.; Souchon, Y.; Le Moal, M.; Levain, A.; Etrillard, C.; Moata, F.; Pannard, A.; Souchu, P. L’Eutrophisation: Manifestations, Causes, Conséquences et Prédictibilité; Synthèse de l’Expertise scientifique collective CNRS-Ifremer-INRA-Irstea: Paris, France, 2017; ISBN 978-2-7592-2757-0. [Google Scholar]
- Miao, Y.; Huang, J.; Duan, H.; Meng, H.; Wang, Z.; Qi, T.; Wu, Q.L. Spatial and Seasonal Variability of Nitrous Oxide in a Large Freshwater Lake in the Lower Reaches of the Yangtze River, China. Sci. Total Environ. 2020, 721, 137716. [Google Scholar] [CrossRef]
- Venkiteswaran, J.J.; Rosamond, M.S.; Schiff, S.L. Nonlinear Response of Riverine N2O Fluxes to Oxygen and Temperature. Environ. Sci. Technol. 2014, 48, 1566–1573. [Google Scholar] [CrossRef]
- Maavara, T.; Lauerwald, R.; Laruelle, G.G.; Akbarzadeh, Z.; Bouskill, N.J.; Van Cappellen, P.; Regnier, P. Nitrous Oxide Emissions from Inland Waters: Are IPCC Estimates Too High? Glob. Chang. Biol. 2019, 25, 473–488. [Google Scholar] [CrossRef] [PubMed]
- Mulholland, P.J.; Helton, A.M.; Poole, G.C.; Hall, R.O.; Hamilton, S.K.; Peterson, B.J.; Tank, J.L.; Ashkenas, L.R.; Cooper, L.W.; Dahm, C.N.; et al. Stream Denitrification across Biomes and Its Response to Anthropogenic Nitrate Loading. Nature 2008, 452, 202–205. [Google Scholar] [CrossRef] [PubMed]
- Marzadri, A.; Amatulli, G.; Tonina, D.; Bellin, A.; Shen, L.Q.; Allen, G.H.; Raymond, P.A. Global Riverine Nitrous Oxide Emissions: The Role of Small Streams and Large Rivers. Sci. Total Environ. 2021, 776, 145148. [Google Scholar] [CrossRef] [PubMed]
- Liu, D.; Zhong, J.; Zheng, X.; Fan, C.; Yu, J.; Zhong, W. N2O Fluxes and Rates of Nitrification and Denitrification at the Sediment–Water Interface in Taihu Lake, China. Water 2018, 10, 911. [Google Scholar] [CrossRef] [Green Version]
- Wu, S.; Wu, Z.; Liang, Z.; Liu, Y.; Wang, Y. Denitrification and the Controlling Factors in Yunnan Plateau Lakes (China): Exploring the Role of Enhanced Internal Nitrogen Cycling by Algal Blooms. J. Environ. Sci. 2019, 76, 349–358. [Google Scholar] [CrossRef]
- Zhou, Y.; Xu, X.; Song, K.; Yeerken, S.; Deng, M.; Li, L.; Riya, S.; Wang, Q.; Terada, A. Nonlinear Pattern and Algal Dual-Impact in N2O Emission with Increasing Trophic Levels in Shallow Lakes. Water Res. 2021, 203, e117489. [Google Scholar] [CrossRef]
- Harrison, J.; Matson, P. Patterns and Controls of Nitrous Oxide Emissions from Waters Draining a Subtropical Agricultural Valley. Glob. Biogeochem. Cycles 2003, 17, 1080. [Google Scholar] [CrossRef]
- Xiao, Q.; Xu, X.; Zhang, M.; Duan, H.; Hu, Z.; Wang, W.; Xiao, W.; Lee, X. Coregulation of Nitrous Oxide Emissions by Nitrogen and Temperature in China’s Third Largest Freshwater Lake (Lake Taihu). Limnol. Oceanogr. 2019, 64, 1070–1086. [Google Scholar] [CrossRef]
- Teuma, L. N2O Emissions from Eutrophic Lakes: Sources and Significance; Massey University: Palmerston North, New Zealand, 2022. [Google Scholar]
- Plouviez, M.; Shilton, A.; Packer, M.A.; Guieysse, B. N2O Emissions during Microalgae Outdoor Cultivation in 50 L Column Photobioreactors. Algal Res. 2017, 26, 348–353. [Google Scholar] [CrossRef]
- Paerl, H.W.; Fulton, R.S.; Moisander, P.H.; Dyble, J. Harmful Freshwater Algal Blooms, With an Emphasis on Cyanobacteria. Sci. World J. 2001, 1, 76–113. [Google Scholar] [CrossRef] [Green Version]
- Hale, S.S.; Cicchetti, G.; Deacutis, C.F. Eutrophication and Hypoxia Diminish Ecosystem Functions of Benthic Communities in a New England Estuary. Front. Mar. Sci. 2016, 3, 249. [Google Scholar] [CrossRef] [Green Version]
- Mosley, L.M.; Priestley, S.; Brookes, J.; Dittmann, S.; Farkaš, J.; Farrell, M.; Ferguson, A.J.; Gibbs, M.; Hipsey, M.; Huang, J.; et al. Extreme Eutrophication and Salinisation in the Coorong Estuarine-Lagoon Ecosystem of Australia’s Largest River Basin (Murray-Darling). Mar. Pollut. Bull. 2023, 188, 114648. [Google Scholar] [CrossRef]
- Malone, T.C.; Newton, A. The Globalization of Cultural Eutrophication in the Coastal Ocean: Causes and Consequences. Front. Mar. Sci. 2020, 7, 670. [Google Scholar] [CrossRef]
- Ulloa, M.J.; Álvarez-Torres, P.; Horak-Romo, K.P.; Ortega-Izaguirre, R. Harmful Algal Blooms and Eutrophication along the Mexican Coast of the Gulf of Mexico Large Marine Ecosystem. Environ. Dev. 2017, 22, 120–128. [Google Scholar] [CrossRef]
- Alcántara, C.; Muñoz, R.; Norvill, Z.; Plouviez, M.; Guieysse, B. Nitrous Oxide Emissions from High Rate Algal Ponds Treating Domestic Wastewater. Bioresour. Technol. 2015, 177, 110–117. [Google Scholar] [CrossRef]
- Bauer, S.K.; Grotz, L.S.; Connelly, E.B.; Colosi, L.M. Reevaluation of the Global Warming Impacts of Algae-Derived Biofuels to Account for Possible Contributions of Nitrous Oxide. Bioresour. Technol. 2016, 218, 196–201. [Google Scholar] [CrossRef]
- McLeod, A.R.; Brand, T.; Campbell, C.N.; Davidson, K.; Hatton, A.D. Ultraviolet Radiation Drives Emission of Climate-Relevant Gases from Marine Phytoplankton. J. Geophys. Res. Biogeosci. 2021, 126, e2021JG006345. [Google Scholar] [CrossRef]
- Stief, P.; Kamp, A.; Thamdrup, B.; Glud, R.N. Anaerobic Nitrogen Turnover by Sinking Diatom Aggregates at Varying Ambient Oxygen Levels. Front. Microbiol. 2016, 7, 98. [Google Scholar] [CrossRef] [Green Version]
- Kamp, A.; Stief, P.; Knappe, J.; de Beer, D. Response of the Ubiquitous Pelagic Diatom Thalassiosira weissflogii to Darkness and Anoxia. PLoS ONE 2013, 8, e82605. [Google Scholar] [CrossRef]
- Ferrón, S.; Ho, D.T.; Johnson, Z.I.; Huntley, M.E. Air–Water Fluxes of N2O and CH4 during Microalgae (Staurosira sp.) Cultivation in an Open Raceway Pond. Environ. Sci. Technol. 2012, 46, 10842–10848. [Google Scholar] [CrossRef]
- Cohen, Y.; Gordon, L.I. Nitrous Oxide in the Oxygen Minimum of the Eastern Tropical North Pacific: Evidence for Its Consumption during Denitrification and Possible Mechanisms for Its Production. Deep Sea Res. 1978, 25, 509–524. [Google Scholar] [CrossRef]
- Pierotti, D.; Rasmussen, R.A. Nitrous Oxide Measurements in the Eastern Tropical Pacific Ocean. Tellus 1980, 32, 56–72. [Google Scholar] [CrossRef] [Green Version]
- Smith, C.J.; DeLaune, R.D.; Patrick, W.H. Nitrous Oxide Emission from Gulf Coast Wetlands. Geochim. Cosmochim. Acta 1983, 47, 1805–1814. [Google Scholar] [CrossRef]
- Oudot, C.; Andrie, C.; Montel, Y. Nitrous Oxide Production in the Tropical Atlantic Ocean. Deep-Sea Res. 1990, 37, 183–202. [Google Scholar] [CrossRef]
- Mengis, M.; Gächter, R.; Wehrli, B. Sources and Sinks of Nitrous Oxide (N2O) in Deep Lakes. Biogeochemistry 1997, 38, 281–301. [Google Scholar] [CrossRef]
- Morell, J.M.; Capella, J.; Mercado, A.; Bauzá, J.; Corredor, J.E. Nitrous Oxide Fluxes in Caribbean and Tropical Atlantic Waters: Evidence for near Surface Production. Mar. Chem. 2001, 74, 131–143. [Google Scholar] [CrossRef]
- Wang, H.; Wang, W.; Yin, C.; Wang, Y.; Lu, J. Littoral Zones as the “Hotspots” of Nitrous Oxide (N2O) Emission in a Hyper-Eutrophic Lake in China. Atmos. Environ. 2006, 40, 5522–5527. [Google Scholar] [CrossRef]
- McCrackin, M.L.; Elser, J.J. Greenhouse Gas Dynamics in Lakes Receiving Atmospheric Nitrogen Deposition. Glob. Biogeochem. Cycles 2011, 25, GB4005. [Google Scholar] [CrossRef] [Green Version]
- Diaz, R.J. Anoxia, Hypoxia, And Dead Zones. In Encyclopedia of Estuaries; Diaz, R.J., Ed.; Encyclopedia of Earth Sciences Series; Springer: Dordrecht, The Netherlands, 2016; pp. 19–26. ISBN 978-94-017-8800-7. [Google Scholar]
- Sakihama, Y.; Nakamura, S.; Yamasaki, H. Nitric Oxide Production Mediated by Nitrate Reductase in the Green Alga Chlamydomonas reinhardtii: An Alternative NO Production Pathway in Photosynthetic Organisms. Plant Cell Physiol. 2002, 43, 290–297. [Google Scholar] [CrossRef]
- Sanz-Luque, E.; Chamizo-Ampudia, A.; Llamas, A.; Galvan, A.; Fernandez, E. Understanding Nitrate Assimilation and Its Regulation in Microalgae. Front. Plant Sci. 2015, 6, 899. [Google Scholar] [CrossRef] [Green Version]
- Kumar, A.; Castellano, I.; Patti, F.P.; Palumbo, A.; Buia, M.C. Nitric Oxide in Marine Photosynthetic Organisms. Nitric Oxide 2015, 47, 34–39. [Google Scholar] [CrossRef]
- Chaux, F.; Burlacot, A.; Mekhalfi, M.; Auroy, P.; Blangy, S.; Richaud, P.; Peltier, G. Flavodiiron Proteins Promote Fast and Transient O2 Photoreduction in Chlamydomonas. Plant Physiol. 2017, 174, 1825–1836. [Google Scholar] [CrossRef] [Green Version]
- Almeida, C.C.; Romão, C.V.; Lindley, P.F.; Teixeira, M.; Saraiva, L.M. The Role of the Hybrid Cluster Protein in Oxidative Stress Defense. J. Biol. Chem. 2006, 281, 32445–32450. [Google Scholar] [CrossRef] [Green Version]
- Wang, J.; Vine, C.E.; Balasiny, B.K.; Rizk, J.; Bradley, C.L.; Tinajero-Trejo, M.; Poole, R.K.; Bergaust, L.L.; Bakken, L.R.; Cole, J.A. The Roles of the Hybrid Cluster Protein, Hcp and Its Reductase, Hcr, in High Affinity Nitric Oxide Reduction That Protects Anaerobic Cultures of Escherichia coli against Nitrosative Stress: NO Reduction by the E. coli Hybrid Cluster Protein. Mol. Microbiol. 2016, 100, 877–892. [Google Scholar] [CrossRef] [Green Version]
- Kim, S.-W.; Fushinobu, S.; Zhou, S.; Wakagi, T.; Shoun, H. Eukaryotic NirK Genes Encoding Copper-Containing Nitrite Reductase: Originating from the Protomitochondrion? Appl. Environ. Microbiol. 2009, 75, 2652–2658. [Google Scholar] [CrossRef] [Green Version]
- Mori, T.; Ohta, S.; Ishizuka, S.; Konda, R.; Wicaksono, A.; Heriyanto, J.; Hardjono, A. Effects of Phosphorus Addition on N2O and NO Emissions from Soils of an Acacia mangium Plantation. Soil Sci. Plant Nutr. 2010, 56, 782–788. [Google Scholar] [CrossRef] [Green Version]
- Mehnaz, K.R.; Dijkstra, F.A. Denitrification and Associated N2O Emissions Are Limited by Phosphorus Availability in a Grassland Soil. Geoderma 2016, 284, 34–41. [Google Scholar] [CrossRef]
- Shen, Y.; Zhu, B. Effects of Nitrogen and Phosphorus Enrichment on Soil N2O Emission from Natural Ecosystems: A Global Meta-Analysis. Environ. Pollut. 2022, 301, 118993. [Google Scholar] [CrossRef]
- Gebremichael, A.W.; Wall, D.P.; O’Neill, R.M.; Krol, D.J.; Brennan, F.; Lanigan, G.; Richards, K.G. Effect of Contrasting Phosphorus Levels on Nitrous Oxide and Carbon Dioxide Emissions from Temperate Grassland Soils. Sci. Rep. 2022, 12, 2602. [Google Scholar] [CrossRef]
- Kalff, J. Phosphorus Limitation in Some Tropical African Lakes. Hydrobiologia 1983, 100, 101–112. [Google Scholar] [CrossRef]
- Nalewajko, C.; Murphy, T.P. Effects of Temperature, and Availability of Nitrogen and Phosphorus on the Abundance of Anabaena and Microcystis in Lake Biwa, Japan: An Experimental Approach. Limnology 2001, 2, 45–48. [Google Scholar] [CrossRef]
- Elser, J.J.; Bracken, M.E.S.; Cleland, E.E.; Gruner, D.S.; Harpole, W.S.; Hillebrand, H.; Ngai, J.T.; Seabloom, E.W.; Shurin, J.B.; Smith, J.E. Global Analysis of Nitrogen and Phosphorus Limitation of Primary Producers in Freshwater, Marine and Terrestrial Ecosystems. Ecol. Lett. 2007, 10, 1135–1142. [Google Scholar] [CrossRef] [PubMed] [Green Version]
- Abell, J.M.; Özkundakci, D.; Hamilton, D.P. Nitrogen and Phosphorus Limitation of Phytoplankton Growth in New Zealand Lakes: Implications for Eutrophication Control. Ecosystems 2010, 13, 966–977. [Google Scholar] [CrossRef] [Green Version]
- Paerl, H.W.; Scott, J.T.; McCarthy, M.J.; Newell, S.E.; Gardner, W.S.; Havens, K.E.; Hoffman, D.K.; Wilhelm, S.W.; Wurtsbaugh, W.A. It Takes Two to Tango: When and Where Dual Nutrient (N&P) Reductions Are Needed to Protect Lakes and Downstream Ecosystems. Environ. Sci. Technol. 2016, 50, 10805–10813. [Google Scholar] [CrossRef] [PubMed] [Green Version]
- Smolders, A.J.P.; Lamers, L.P.M.; Lucassen, E.C.H.E.T.; Van Der Velde, G.; Roelofs, J.G.M. Internal Eutrophication: How It Works and What to Do about It—A Review. Chem. Ecol. 2006, 22, 93–111. [Google Scholar] [CrossRef]
- Paerl, H.W.; Havens, K.E.; Xu, H.; Zhu, G.; McCarthy, M.J.; Newell, S.E.; Scott, J.T.; Hall, N.S.; Otten, T.G.; Qin, B. Mitigating Eutrophication and Toxic Cyanobacterial Blooms in Large Lakes: The Evolution of a Dual Nutrient (N and P) Reduction Paradigm. Hydrobiologia 2020, 847, 4359–4375. [Google Scholar] [CrossRef]
- Glibert, P.M. Eutrophication, Harmful Algae and Biodiversity—Challenging Paradigms in a World of Complex Nutrient Changes. Mar. Pollut. Bull. 2017, 124, 591–606. [Google Scholar] [CrossRef]
- Andersen, I.M.; Williamson, T.J.; González, M.J.; Vanni, M.J. Nitrate, Ammonium, and Phosphorus Drive Seasonal Nutrient Limitation of Chlorophytes, Cyanobacteria, and Diatoms in a Hyper-eutrophic Reservoir. Limnol. Oceanogr. 2020, 65, 962–978. [Google Scholar] [CrossRef]
- Brookfield, A.E.; Hansen, A.T.; Sullivan, P.L.; Czuba, J.A.; Kirk, M.F.; Li, L.; Newcomer, M.E.; Wilkinson, G. Predicting Algal Blooms: Are We Overlooking Groundwater? Sci. Total Environ. 2021, 769, 144442. [Google Scholar] [CrossRef]
- Glibert, P.M.; Maranger, R.; Sobota, D.J.; Bouwman, L. The Haber Bosch–Harmful Algal Bloom (HB–HAB) Link. Environ. Res. Lett. 2014, 9, 105001. [Google Scholar] [CrossRef] [Green Version]
- Esteves, S.M.; Jadoul, A.; Iacono, F.; Schloesser, M.; Bosman, B.; Carnol, M.; Druet, T.; Cardol, P.; Hanikenne, M. Natural Variation of Nutrient Homeostasis among Laboratory and Field Strains of Chlamydomonas reinhardtii. J. Exp. Bot. 2023, 1, erad194. [Google Scholar] [CrossRef]
- Zhang, X.; Li, B.; Xu, H.; Wells, M.; Tefsen, B.; Qin, B. Effect of Micronutrients on Algae in Different Regions of Taihu, a Large, Spatially Diverse, Hypereutrophic Lake. Water Res. 2019, 151, 500–514. [Google Scholar] [CrossRef]
- Hassler, C.S.; Sinoir, M.; Clementson, L.A.; Butler, E.C.V. Exploring the Link between Micronutrients and Phytoplankton in the Southern Ocean during the 2007 Austral Summer. Front. Microbiol. 2012, 3, 202. [Google Scholar] [CrossRef] [Green Version]
- Ito, A.; Ye, Y.; Baldo, C.; Shi, Z. Ocean Fertilization by Pyrogenic Aerosol Iron. Npj Clim. Atmos. Sci. 2021, 4, 30. [Google Scholar] [CrossRef]
- Black, A.; Hsu, P.L.; Hamonts, K.E.; Clough, T.J.; Condron, L.M. Influence of Copper on Expression of NirS, NorB and NosZ and the Transcription and Activity of NIR, NOR and N2 or in the Denitrifying Soil Bacteria Pseudomonas stutzeri. Microb. Biotechnol. 2016, 9, 381–388. [Google Scholar] [CrossRef] [Green Version]
- Cirri, E.; Pohnert, G. Algae−bacteria Interactions That Balance the Planktonic Microbiome. New Phytol. 2019, 223, 100–106. [Google Scholar] [CrossRef] [Green Version]
- Calatrava, V.; Tejada-Jimenez, M.; Sanz-Luque, E.; Fernandez, E.; Galvan, A.; Llamas, A. Chlamydomonas reinhardtii, a Reference Organism to Study Algal–Microbial Interactions: Why Can’t They Be Friends? Plants 2023, 12, 788. [Google Scholar] [CrossRef]
- Arévalo-Martínez, D.L.; Kock, A.; Löscher, C.R.; Schmitz, R.A.; Bange, H.W. Massive Nitrous Oxide Emissions from the Tropical South Pacific Ocean. Nat. Geosci. 2015, 8, 530–533. [Google Scholar] [CrossRef]
Figure 1.
Current emission factors used for the different N fluxes causing indirect anthropogenic N2O emissions from aquatic environments.
Figure 1.
Current emission factors used for the different N fluxes causing indirect anthropogenic N2O emissions from aquatic environments.

Disclaimer/Publisher’s Note: The statements, opinions and data contained in all publications are solely those of the individual author(s) and contributor(s) and not of MDPI and/or the editor(s). MDPI and/or the editor(s) disclaim responsibility for any injury to people or property resulting from any ideas, methods, instructions or products referred to in the content. |
© 2023 by the authors. Licensee MDPI, Basel, Switzerland. This article is an open access article distributed under the terms and conditions of the Creative Commons Attribution (CC BY) license (https://creativecommons.org/licenses/by/4.0/).
Share and Cite
MDPI and ACS Style
Teuma, L.; Sanz-Luque, E.; Guieysse, B.; Plouviez, M. Are Microalgae New Players in Nitrous Oxide Emissions from Eutrophic Aquatic Environments? Phycology 2023, 3, 356-367. https://doi.org/10.3390/phycology3030023
AMA Style
Teuma L, Sanz-Luque E, Guieysse B, Plouviez M. Are Microalgae New Players in Nitrous Oxide Emissions from Eutrophic Aquatic Environments? Phycology. 2023; 3(3):356-367. https://doi.org/10.3390/phycology3030023
Chicago/Turabian StyleTeuma, Laura, Emanuel Sanz-Luque, Benoit Guieysse, and Maxence Plouviez. 2023. "Are Microalgae New Players in Nitrous Oxide Emissions from Eutrophic Aquatic Environments?" Phycology 3, no. 3: 356-367. https://doi.org/10.3390/phycology3030023