Article

Characterization of Aggregating Agents towards Sensitive Optical Detection of Tryptophan Using Lab-on-a-Chip

1
Department of Inorganic and Physical Chemistry, Indian Institute of Science, Bangalore 560012, India
2
Biophotonics@Tyndall, Irish Photonic Integration Centre, Tyndall National Institute, University College Cork, T12R5CP Cork, Ireland
3
Dr. Reddy’s Laboratories Ltd., Hyderabad 500090, India
4
Defence Bioengineering and Electromedical Laboratory (DEBEL), Defence Research and Development Organisation (DRDO), Bangalore 560093, India
5
Sri Venkateswara College, University of Delhi, New Delhi 110021, India
6
Department of Instrumentation and Applied Physics, Indian Institute of Science, Bangalore 560012, India
7
Indian Institute of Science Education and Research, Bhopal 462066, India
*
Authors to whom correspondence should be addressed.
These authors contributed equally to this work.
Photonics 2022, 9(9), 648; https://doi.org/10.3390/photonics9090648
Submission received: 30 July 2022 / Revised: 3 September 2022 / Accepted: 5 September 2022 / Published: 9 September 2022
(This article belongs to the Special Issue Optical Trapping: Techniques and Applications)

Abstract

:
The analysis of body fluids is desirable to minimize the invasiveness of diagnostic tests and non-destructive forensic investigations. In this study, surface-enhanced Raman spectroscopy (SERS) is employed for sensitive and reproducible detection of biomolecule focusing on ‘hot spots’ generation and automated flow system. Here, we have demonstrated how the plasmon frequency of nanoparticles can be tuned using different aggregating agents for optimal SERS signals. We have compared the effect of different aggregating agents on silver colloids and the resulting enhancement in Raman signals for Tryptophan which is an important amino acid present as an integral component of various body fluids including blood, saliva, tears, and cerebrospinal fluid. The automated segmented flow system, Lab-on-a-chip (LOC), is employed to trap the analyte in droplets while obtaining reproducible SERS spectra of Tryptophan at μM concentration. Further for a thorough interpretation of enhanced vibrational modes of Tryptophan, a theoretical approach has been applied. By combining both experimental and computational approaches we have identified the most preferable site of Tryptophan for interaction with metal nanoparticles and accurately assigned the enhanced Raman bands. The present study demonstrates that the union of SERS and microfluidics has the potential for spectral fingerprinting of biomolecules present in body fluids with high sensitivity.

1. Introduction

The characterization and identification of various bio-components of body fluids are crucial for early diagnosis as well as for forensic investigations [1,2,3,4,5]. The composition of biomolecules is important to know the identity of the fluid and distinguish it from others which is an important aspect of forensic screening [1,5]. On the other hand, changes in quantities and/or conformation of the biomolecules present in the biologic fluids are related to the health of the subjects. The body fluids such as blood, urine, saliva, tears, and cerebrospinal fluid contain thousands of biomolecules coming as by-products from the diseased part of the organism which can be utilized as biomarkers [6,7,8]. Currently used tests target one particular chemical component at a time and require isolation of these molecules before detection which is usually cumbersome and time-consuming. Also, these conventional methods require a large number of samples and individuals with specialized skills [1,5]. Non-invasive detection of disease and identification of body fluids at the crime scene ideally need multidimensional tools, which can target many biomarkers in a single measurement. Raman spectroscopy can be a powerful tool for differentiating various kinds of chemical moieties owing to their specific structure which gives distinct Raman signals [9,10,11,12]. However, it has limited applicability as it is an inherently weak phenomenon. Surface-enhanced Raman spectroscopic (SERS) technique has the potential to serve as such a tool due to its high sensitivity, specificity, multiplexing capability, and most importantly its universal applicability toward the analysis of all body fluids [13,14,15].
SERS involves the use of nanoparticles that simultaneously reduces the fluorescence background and enhance the weak Raman signals [5,16]. The enhanced Raman signals were first observed for pyridine which was adsorbed on a roughened silver electrode by Fleishchmann et al. (1974). It was attributed to the increase in the number of molecules adsorbed on the roughened surface due to an increase in the surface area [17,18,19]. The effect came to be known as surface-enhanced Raman scattering, subsequently. The enhancement observed with SERS is characterized by two main mechanisms: (i) a long-range electromagnetic effect, and (ii) a short-range chemical (charge-transfer) effect [20,21,22,23]. Since the observation of this phenomenon (1974), SERS has been widely used for the enhancement of the Raman signals from various analytes including drugs, proteins, various biomolecules, pollutants, and explosives [24,25,26,27]. However, the consistent reproducibility of SERS spectra under similar experimental conditions is a key concern.
SERS spectroscopic measurements in flow cells like Lab-on-a-chip (LOC) have opened new ways of improving reproducibility. These systems keep the time delay between the addition of the activation agent and the measurement constant, additionally, the mixing and stirring conditions will be the same for different experimental measurements as compared to conventional SERS [28,29,30]. Integration of SERS with LOC technology allows an automatic and sensitive detection from minimal sample volumes at the microscale specified by the dimensions of flow channels in the chip system. Further, LOC systems reduce measurement time, which minimizes wastage and background reduction as the volume of the medium under investigation is small. The high degree of mixing of Ag or Au colloids and the analyte solution is achieved by introducing various shapes or microstructures in the LOC systems since the flow is characterized as a laminar flow. These microstructures can be either in the form of pillar array or zigzag-shaped; furthermore, high mixing efficiency can be achieved by introducing loops into a LOC device [31]. A segmented flow system using a hydrophobic separation and carrier fluid (e.g., mineral oil) not only enhances the mixing in loop systems but also prevents the adhesion of analyte and nanoparticle aggregates to the microchannel walls promoting the reuse of the LOC device [29]. In this case, the analyte and colloid solutions flow in droplet form and the flow control is performed using a syringe pump. Flow can be adjusted to acquire one spectrum from a droplet [28,29,32]. This segmented flow allows the analyte to be trapped in droplet form and optical measurements can be done on each drop separately. Integration of LOC devices to the SERS measurements is applied in various areas of bioanalytics ranging from quantification and monitoring of drugs, pollutants, proteins, nucleic acids to the investigation of microorganisms [5,30,33,34,35]. Further, infectious samples can also be handled with less risk [5,35,36].
Generally, colloidal metal nanoparticles are employed for SERS study in flow systems. However, in some cases, LOC channels are coated with metal nanostructures but are not favored as they are hard to clean after interaction with analytes which limits the reuse of microfluidic devices [37]. Furthermore, colloidal metal nanoparticles are easy to synthesize, cost-effective, and enable additional chemical manipulation. The use of activating agents (e.g., KCl, NaNO3, Na2SO4) in the solution phase facilitates charge transfer between the nanoparticle and the adsorbate and manipulates the orientation of the analyte on the metal surface due to electrostatic interactions. Additionally, these activating agents facilitate the aggregation process which helps to increase the number of ‘hot spots’ with less effort and hence improve the Raman signals [16,29,38]. In the present study we have (i) examined the influence of different activating agents (KCl, NaNO3, Na2SO4) and pH of the solution on the aggregation of nanoparticles using electronic absorption spectroscopy, (ii) identified suitable activating agents and pH to trap Tryptophan within the ‘hot spots’ for sensitive optical detection, (iii) applied a theoretical approach to understand the interaction of Tryptophan with nanoparticles and selective modes enhancement, and lastly (iv) demonstrated the utilization of a LOC system to produce reproducible SERS signals.

2. Materials and Methods

Chemicals: AgNO3, KCl, HCl, NaNO3, HNO3, Na2SO4, H2SO4, pyridine, and Tryptophan (Trp) were purchased from Sisco Research Laboratories (SRL) Pvt. Ltd. The solutions were prepared using Milli-Q water (Bio cell Laboratories, Inc., Quantum® EX, Rancho Dominguez, CA, USA).
Preparation of Colloids: Silver colloids were synthesized by the reduction of silver nitrate solution using (a) trisodium citrate solution [39] and (b) sodium borohydride solution [40]. Briefly, 45 mg of AgNO3 was dissolved in 250 mL of water, and 5 mL of 1% trisodium citrate solution (aqueous) was added to boiling silver nitrate solution and left to boil for 1 h. Such synthesis methods give rise to a typical concentration of ~1011 particles/mL [41]. The resulting colloids (named Ag1) were filtered and stored in a cool and dark place for SERS studies. In the second protocol, 50 mL of AgNO3 (10−3 M) aqueous solution was added dropwise to 150 mL of vigorously stirred ice-cold NaBH4 (10−3 M) solution. The resulting colloidal solution (named Ag2) was stirred for 1 h at 4 °C and stored in a cool and dark place for further studies. The concentration of Ag2 colloids was ~1013 particles/mL [42].
Sample Preparation for Aggregation studies: Aqueous solutions (0.1 M) of electrolytes (KCl, NaNO3, Na2SO4, HNO3, HCl, H2SO4, and NaOH) were prepared using Milli-Q water. The absorption spectra for the mixture of Ag1 colloids (200 µL) and activating agents (200 µL; KCl/NaNO3/Na2SO4) were recorded by diluting the mixture with 400 µL of Milli-Q water. The absorption spectra for the diluted mixture of 200 µL of Ag1 colloids and 195 µL of activating agents (KCl or NaNO3 or Na2SO4) were also recorded by varying pH using respective acids or NaOH (5 µL; HNO3/HCl/H2SO4/NaOH) as shown in Figure 1A. Likewise, the absorption spectra for the mixture of Ag2 colloids (400 µL) and activating agents (400 µL; KCl/NaNO3/Na2SO4) were recorded. The absorption spectra for the mixture of 400 µL of Ag2 colloids and 395 µL of activating agents (KCl or NaNO3 or Na2SO4) were also recorded by varying pH using respective acids or NaOH (5 µL; HNO3/HCl/H2SO4/NaOH) as shown in Figure 1B. The aggregation effect induced by different electrolytes (activating agents) on the silver colloids was monitored using electronic absorption spectroscopy. The absorption spectra were recorded from the diluted solution of Ag1 (600 µL of water + 200 µL of Ag1) and Ag2 (400 µL of water + 400 µL of Ag2) colloids without aggregating agents for comparison. The pH measurements of colloids under various aggregating conditions were made using pH meter calibrated with 4 and 7 buffer solutions under room temperature.
Absorption Spectroscopy: Electronic absorption spectra (300–800 nm) for Ag colloids and mixture of colloids and activating agent were recorded using a Perkin-Elmer lambda750 UV-visible-NIR Spectrophotometer using 1 mm thick disposable cuvettes (Gerresheimer Wertheim GmbH, Wertheim, Germany).
Raman Spectroscopy: Raman spectra were recorded using commercial Renishaw InVia Raman Microscope in back-scattering. The instrument was calibrated to 520.5 cm−1 (assigned to Silicon as a reference) before acquiring the Raman spectra from the samples. The samples were excited with 514 nm air-cooled Ar ion laser (Power on the sample = 15 mW). The spectra were collected with a 50× long working distance (NA = 0.5) objective lens. The scattered radiations were resolved using a diffraction grating of 2400 grooves/mm and detected using a thermoelectrically cooled charge-coupled device (1024 × 256 pixels). Spectra were recorded with a spectral resolution of 2 cm−1. The instrument is controlled by Renishaw WiRE 3.2 software running under Grams/32 Spectral Note base Software (Galactic Industries, Salem, NH, USA), which plays a role in optimizing experimental parameters and controlling the microscopic stage movement. All the spectra were pre-processed for cosmic ray removal using WiRE 3.2 software and Origin 8.5 (Origin Lab Corporation, Northampton, MA, USA) software. For SERS studies, 10 μL of Tryptophan (10−2/10−3/10−4 M) solution was added to 20 μL of silver colloids and 10 μL of acidic KCl solution was added as an activating agent to this mixture. The Raman spectra were recorded instantaneously on Aluminum slides for all samples including pure silver colloids. Further dilution of 10−4 M Tryptophan solution up to 5 × 10⁻⁵ M was performed using silver colloid solution itself. The spectra were also recorded for Tryptophan solutions which were activated with 10 μL of acidic/basic KCl solution immediately before reading.
Computational Method: The structure optimization for Tryptophan was performed using Density functional theory (DFT) by employing 6-311++G (d,p) basis set and Becke’s three parameters (local, nonlocal, and Hartree−Fock) hybrid exchange functionals with Lee−Yang−Parr correlational functional (B3LYP) as it is known to be suitable for both the ground and lower triplet state optimization [24,25,43,44,45]. Stability for the obtained optimized structure was confirmed by observing positive values for all the vibrations of minimum energy L-Tryptophan structure (Appendix A Figure A1) obtained using Gaussian 09package. Ignorance of anharmonicity in DFT level causes deviation in calculated vibrational frequencies when compared to experimental wavenumbers. Therefore, for better visualization and comparable results dual scaling factor for the higher wavenumber region (above 1800 cm−1) and lower wavenumber region (below 1800 cm−1) is used. In the present case, since we are dealing with the lower wavenumber region—all the calculated frequencies were scaled down by the factor 0.9927. Gauss View and Gar2ped software were utilized for graphical representation of the structure and the calculation of potential energy distributions, respectively. Further, precise vibrational frequency assignments were made using the Gauss view. All the calculations for SERS were made using the LANL2DZ basis set. Potential Energy Distribution (PED) calculations along with internal coordinates using localized symmetry and normal-mode analysis were performed [24] and compared with the experimental data. Results are presented in Appendix A Table A1.

3. Results

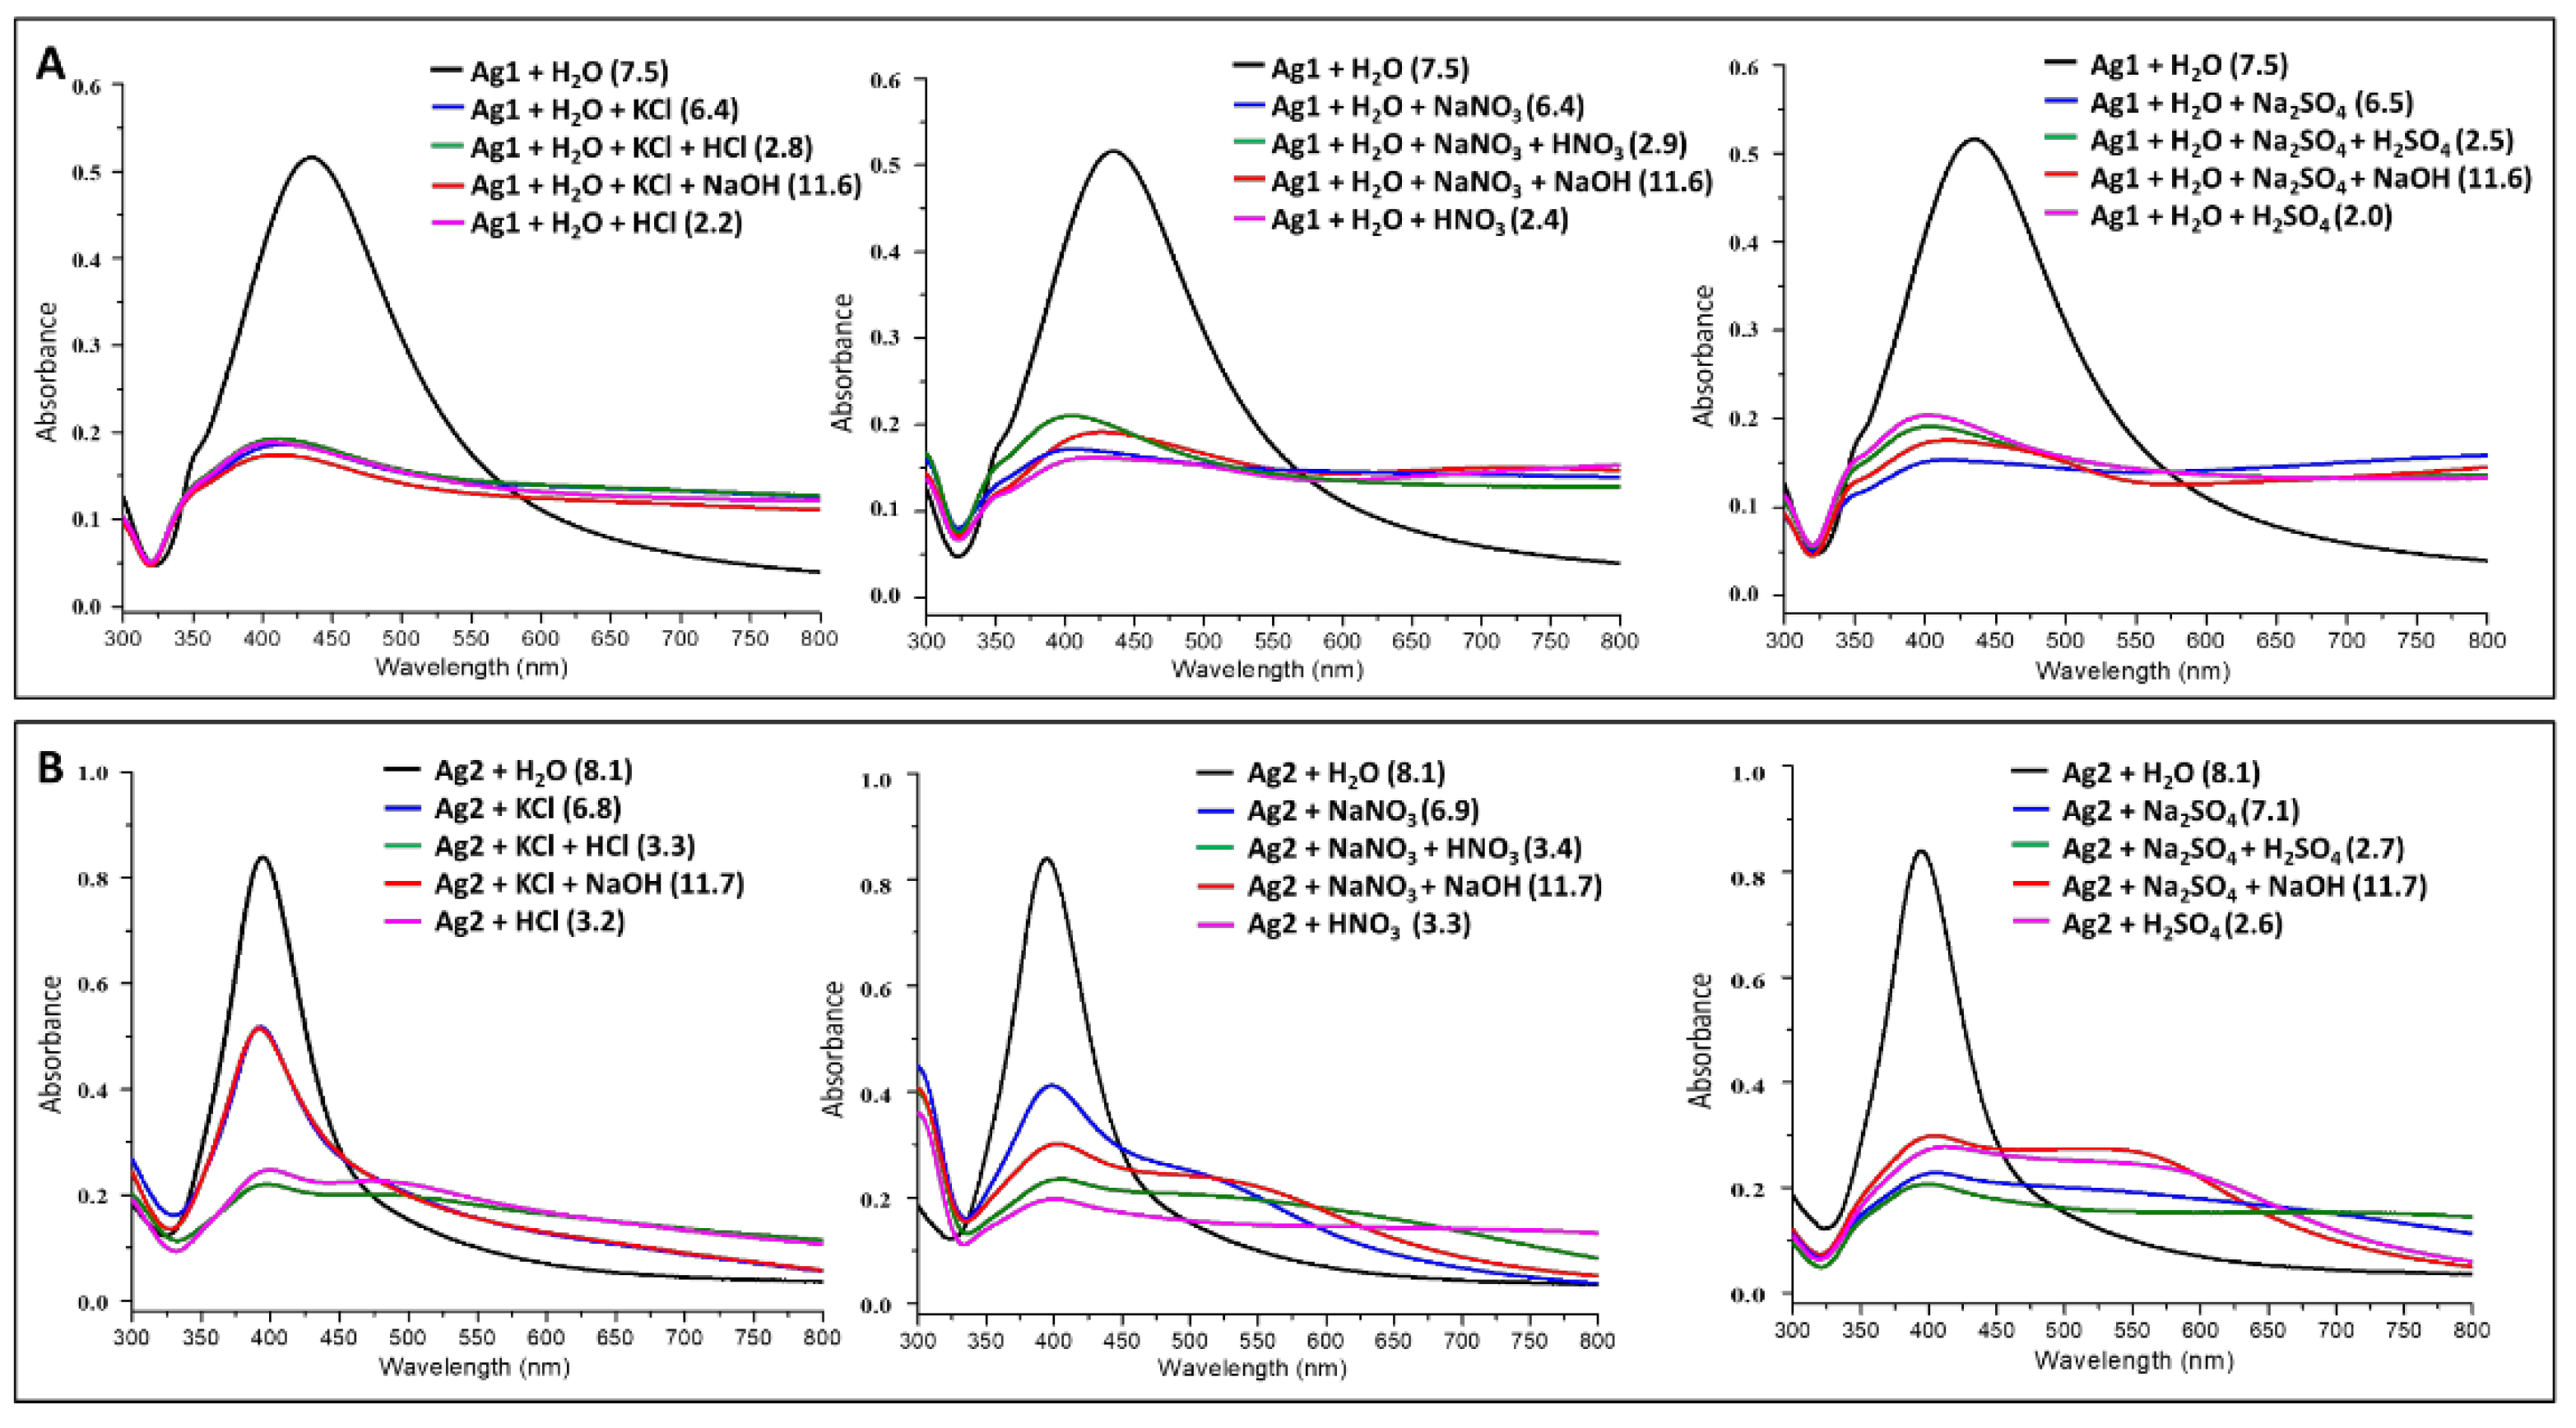
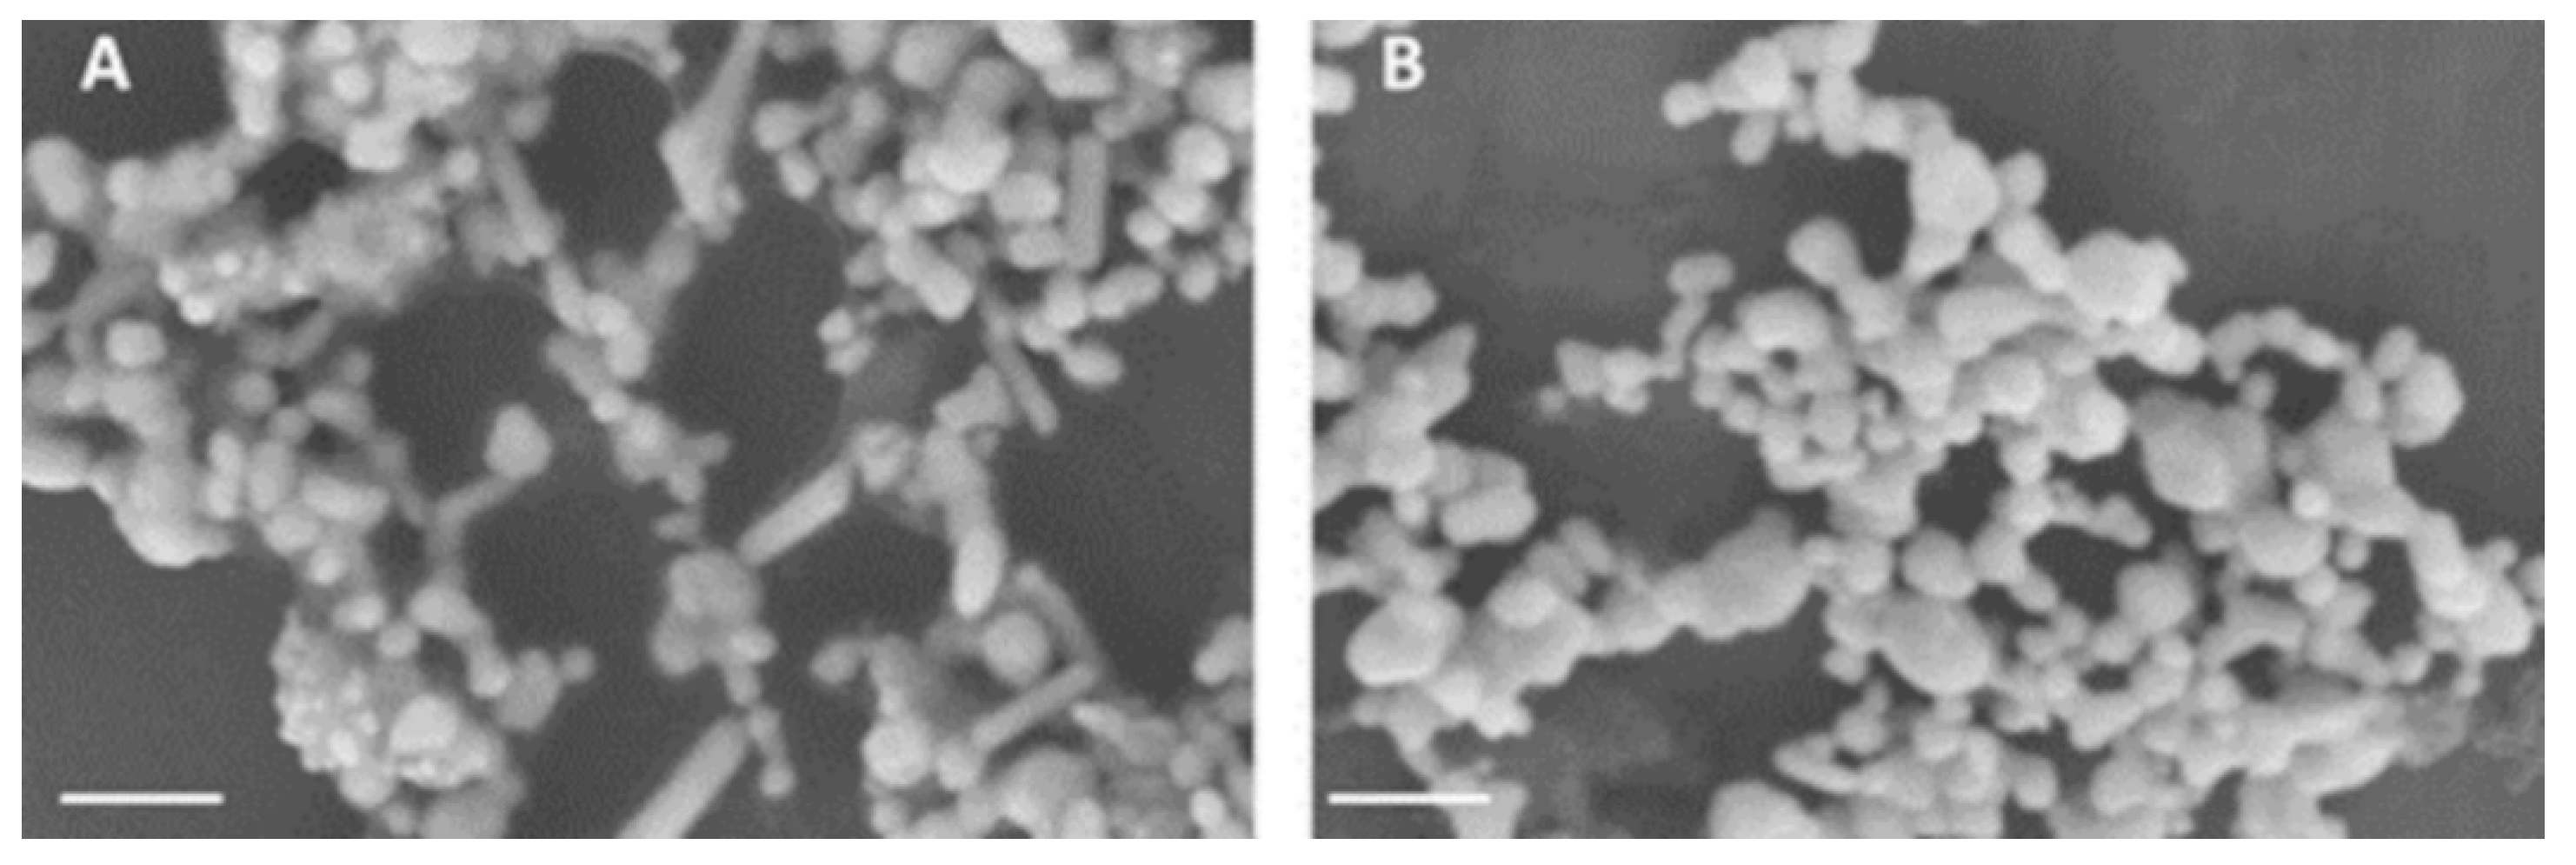
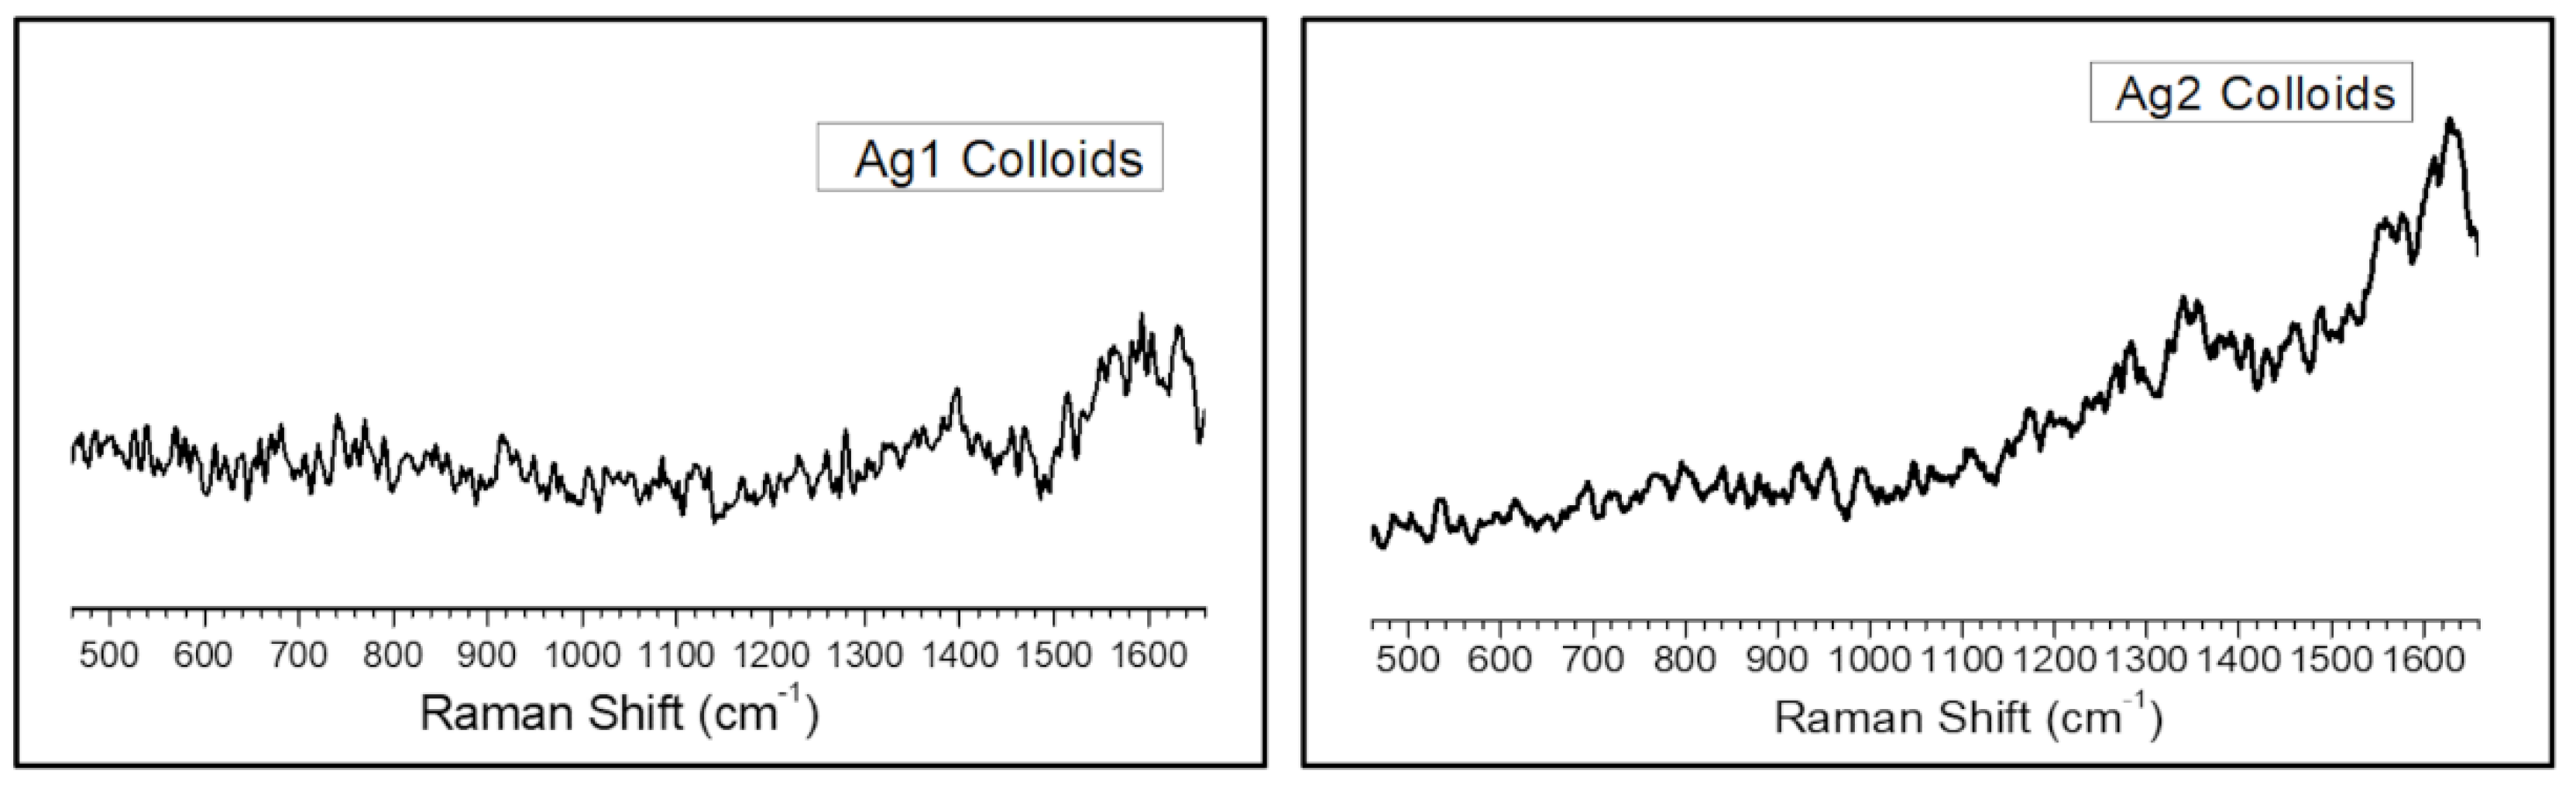
3.1. Characterization of Nanoparticles

The aggregation effect induced by different electrolytes (activating agents) on the silver colloids was monitored using electronic absorption spectroscopy. The absorption spectra were recorded from the diluted solution of Ag1 and Ag2 colloids from the 300 to 800 nm range (Figure 1). The plasmon absorption maxima for Ag1 and Ag2 colloids were located at 433 nm and 395 nm, respectively (Figure 1). In SERS, there is a need for oscillation of valence electrons on the nanoparticle surface (plasmon frequency) to be in resonance with incident radiation. However, it is not always possible to control the size of nanoparticles for various frequencies. To overcome this, various aggregating agents can be used to shift/tune the plasmon frequency of the synthesized nanoparticles. In the present study, we compared the effect of various aggregating agents for tuning the plasmon frequency of nanoparticles to the desired wavelength regions. The absorption maxima for both the colloids, Ag1 and Ag2, shifted towards a higher wavelength with the addition of activating agents. This redshift can be attributed to the aggregation of the nanoparticles [46,47,48,49,50]. The shape and size distribution of citrate-reduced nanoparticles (Ag1) is rather heterogenous as it consists of a small percentage of rod-like nanoparticles along with a broad range of irregular spherical particles which are negatively charged [51]. Similar changes in the absorption spectra of Ag1 nanoparticles were observed on varying pH. It indicates that the repulsive forces between the particles were reduced via neutralization of negative charges by various cations (K+/Na+/H+) and the process is mostly independent of the nature of counter anions of the electrolytes. Such a behavior can be attributed to the presence of large particle size and inherent irregularities in Ag1 which makes it difficult to visualize the small differences in the aggregation process induced by varying pH. Further, the high variability in size impacts the aggregation efficiency where smaller particles in Ag1 colloids (~405 nm) aggregate slowly in comparison with bigger particles (≥435 nm) leaving relatively high particle density at ~405 nm. On the contrary, NaBH4 reduced nanoparticles are relatively uniform with narrower full-width half maxima of the plasmon peak and smaller particle size [51]. Thus, it was easy to visualize changes in spectra upon the addition of different activating agents (Figure 1B).
Generally, there are two main regimes of aggregation: (i) where the aggregation rate is controlled by the diffusion of the nanoparticles and, (ii) where the aggregation rate is controlled by the contact between the nanoparticles. The former happens when the low electric charge density on the nanoparticles leads to less repulsive forces between them and hence the aggregation process is faster, giving rise to globular structures. In the latter case due to high repulsive forces, aggregation is slow and produces linear chains. The use of appropriate concentrations of activating agents facilitates the formation of aggregates with the web-like structure which is a mixture of linear and globular structures [46,47,49]. We also observed web-like structures for both Ag1 and Ag2 colloids upon aggregation (Appendix A Figure A2). These web-like structures are more favorable for amplification of Raman signals and therefore we utilized these aggregated colloids as SERS substrates for optical detection of trapped Tryptophan as discussed in the subsequent sections.

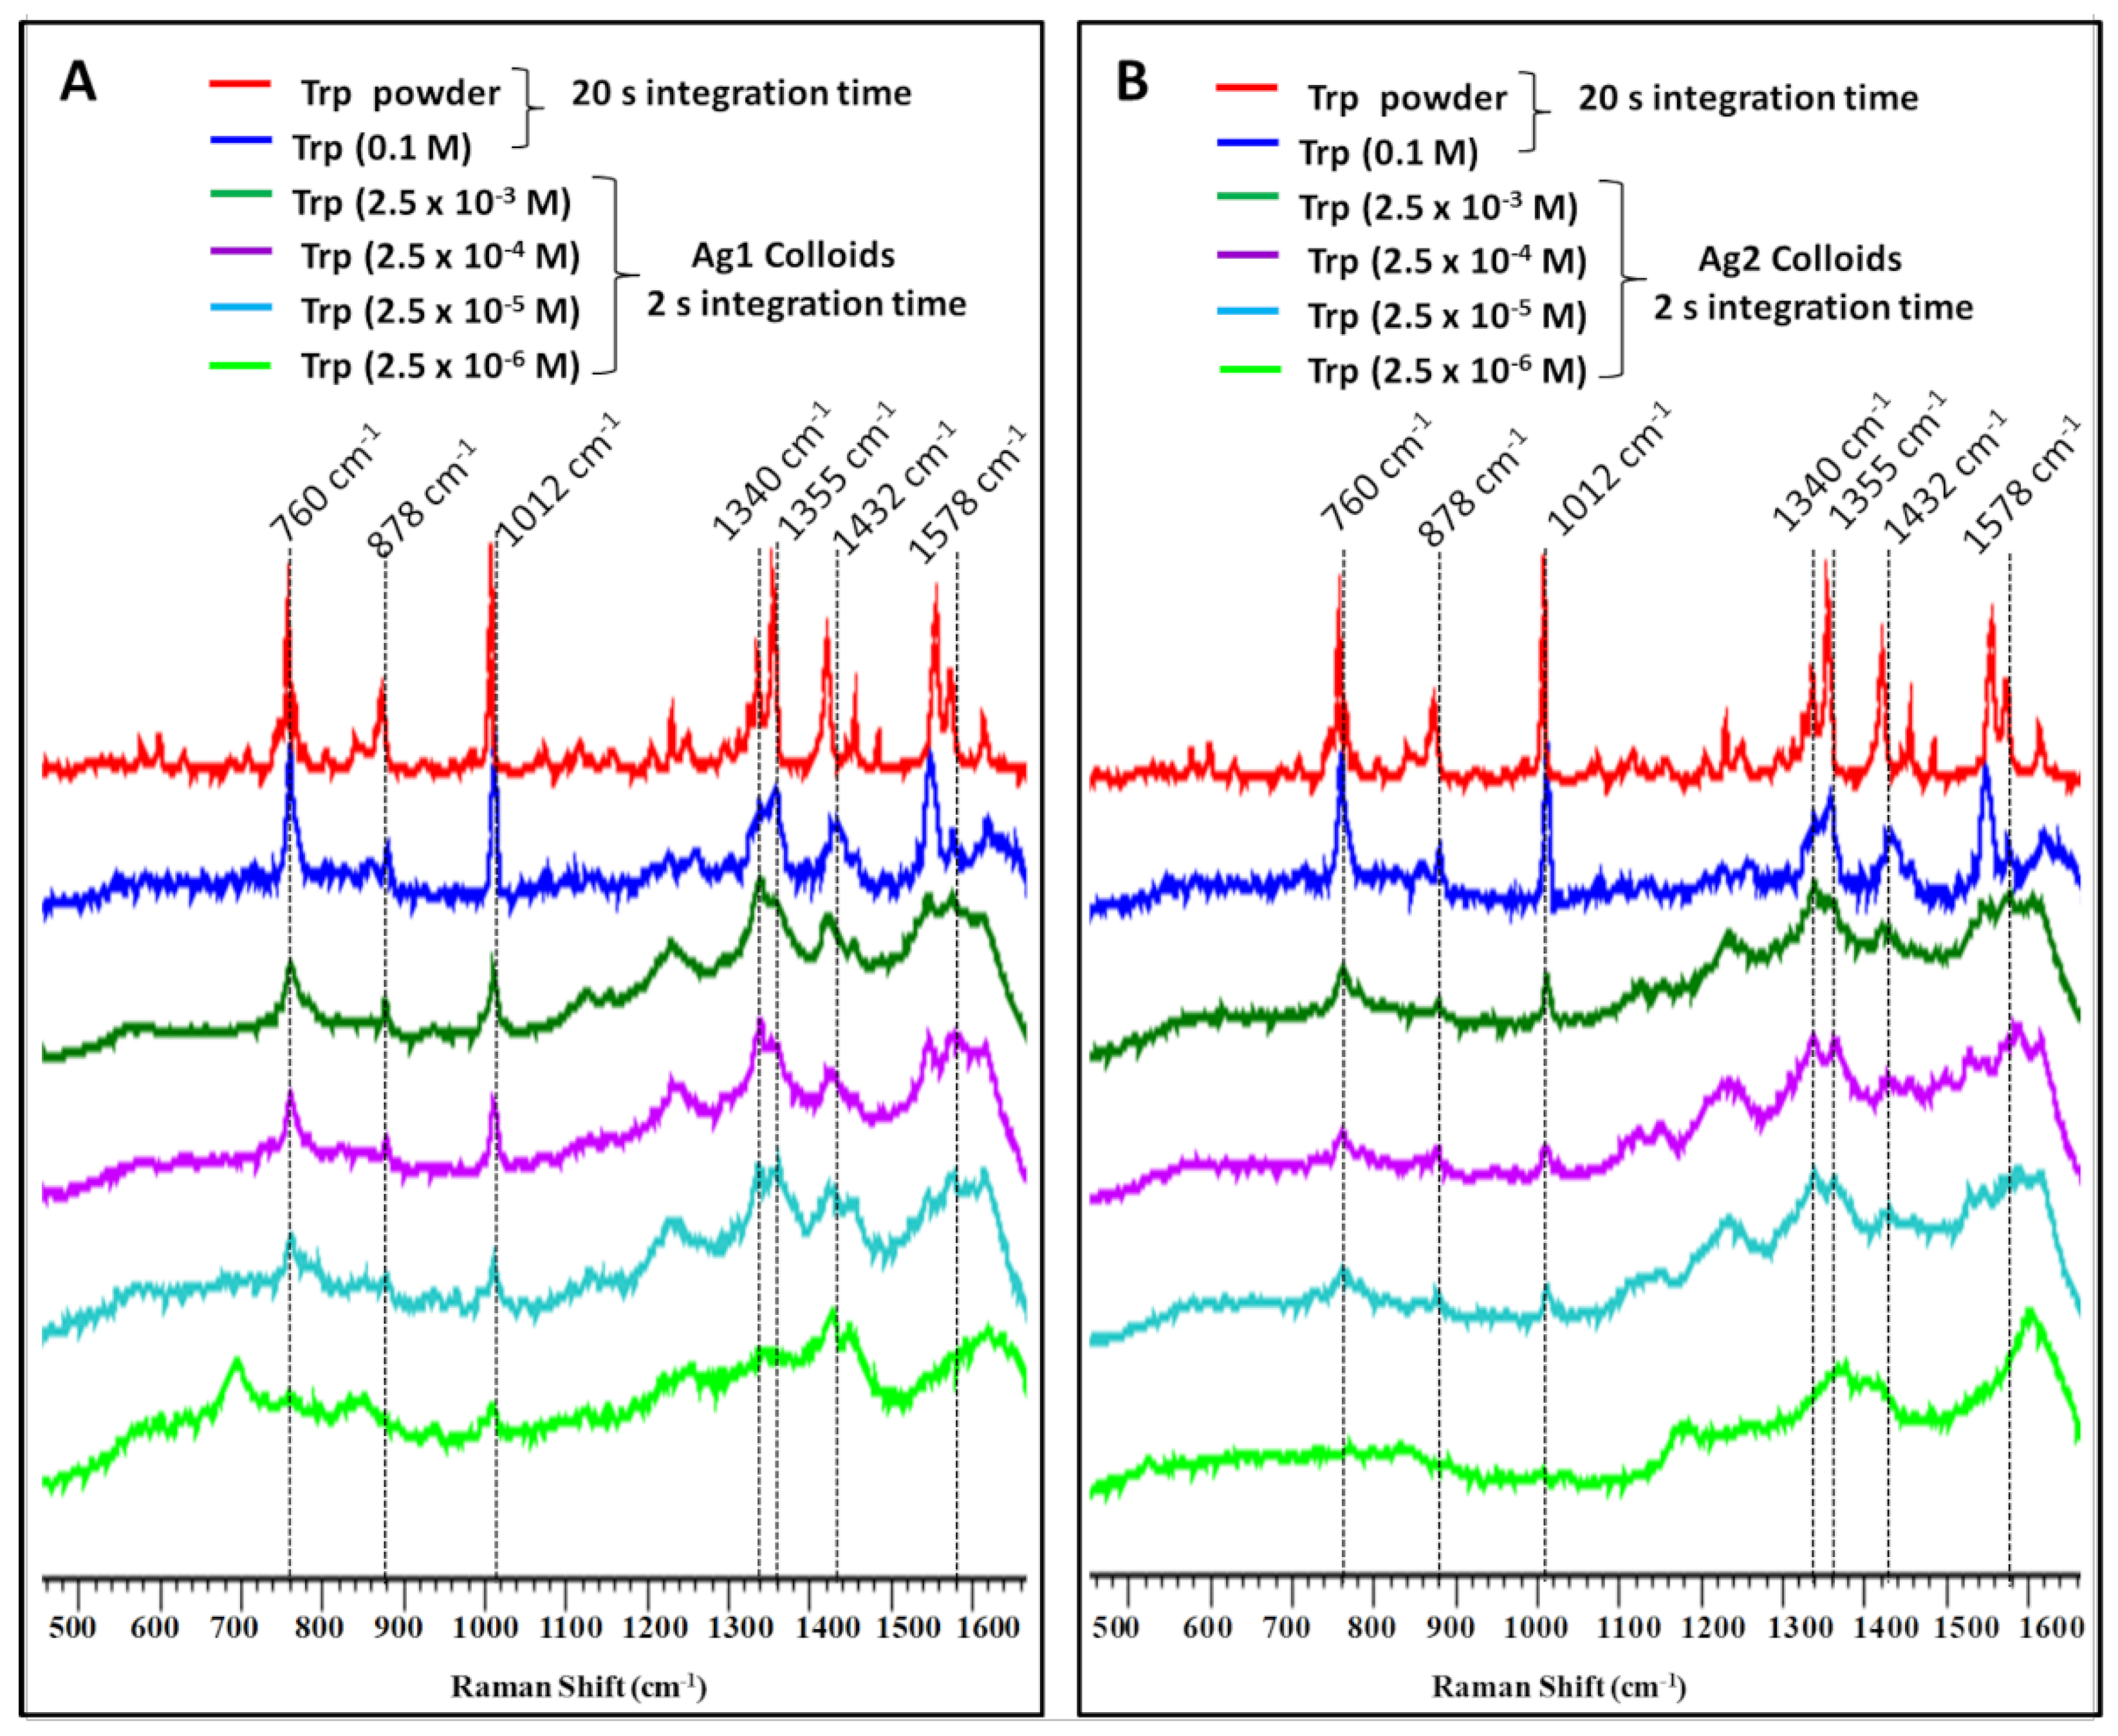
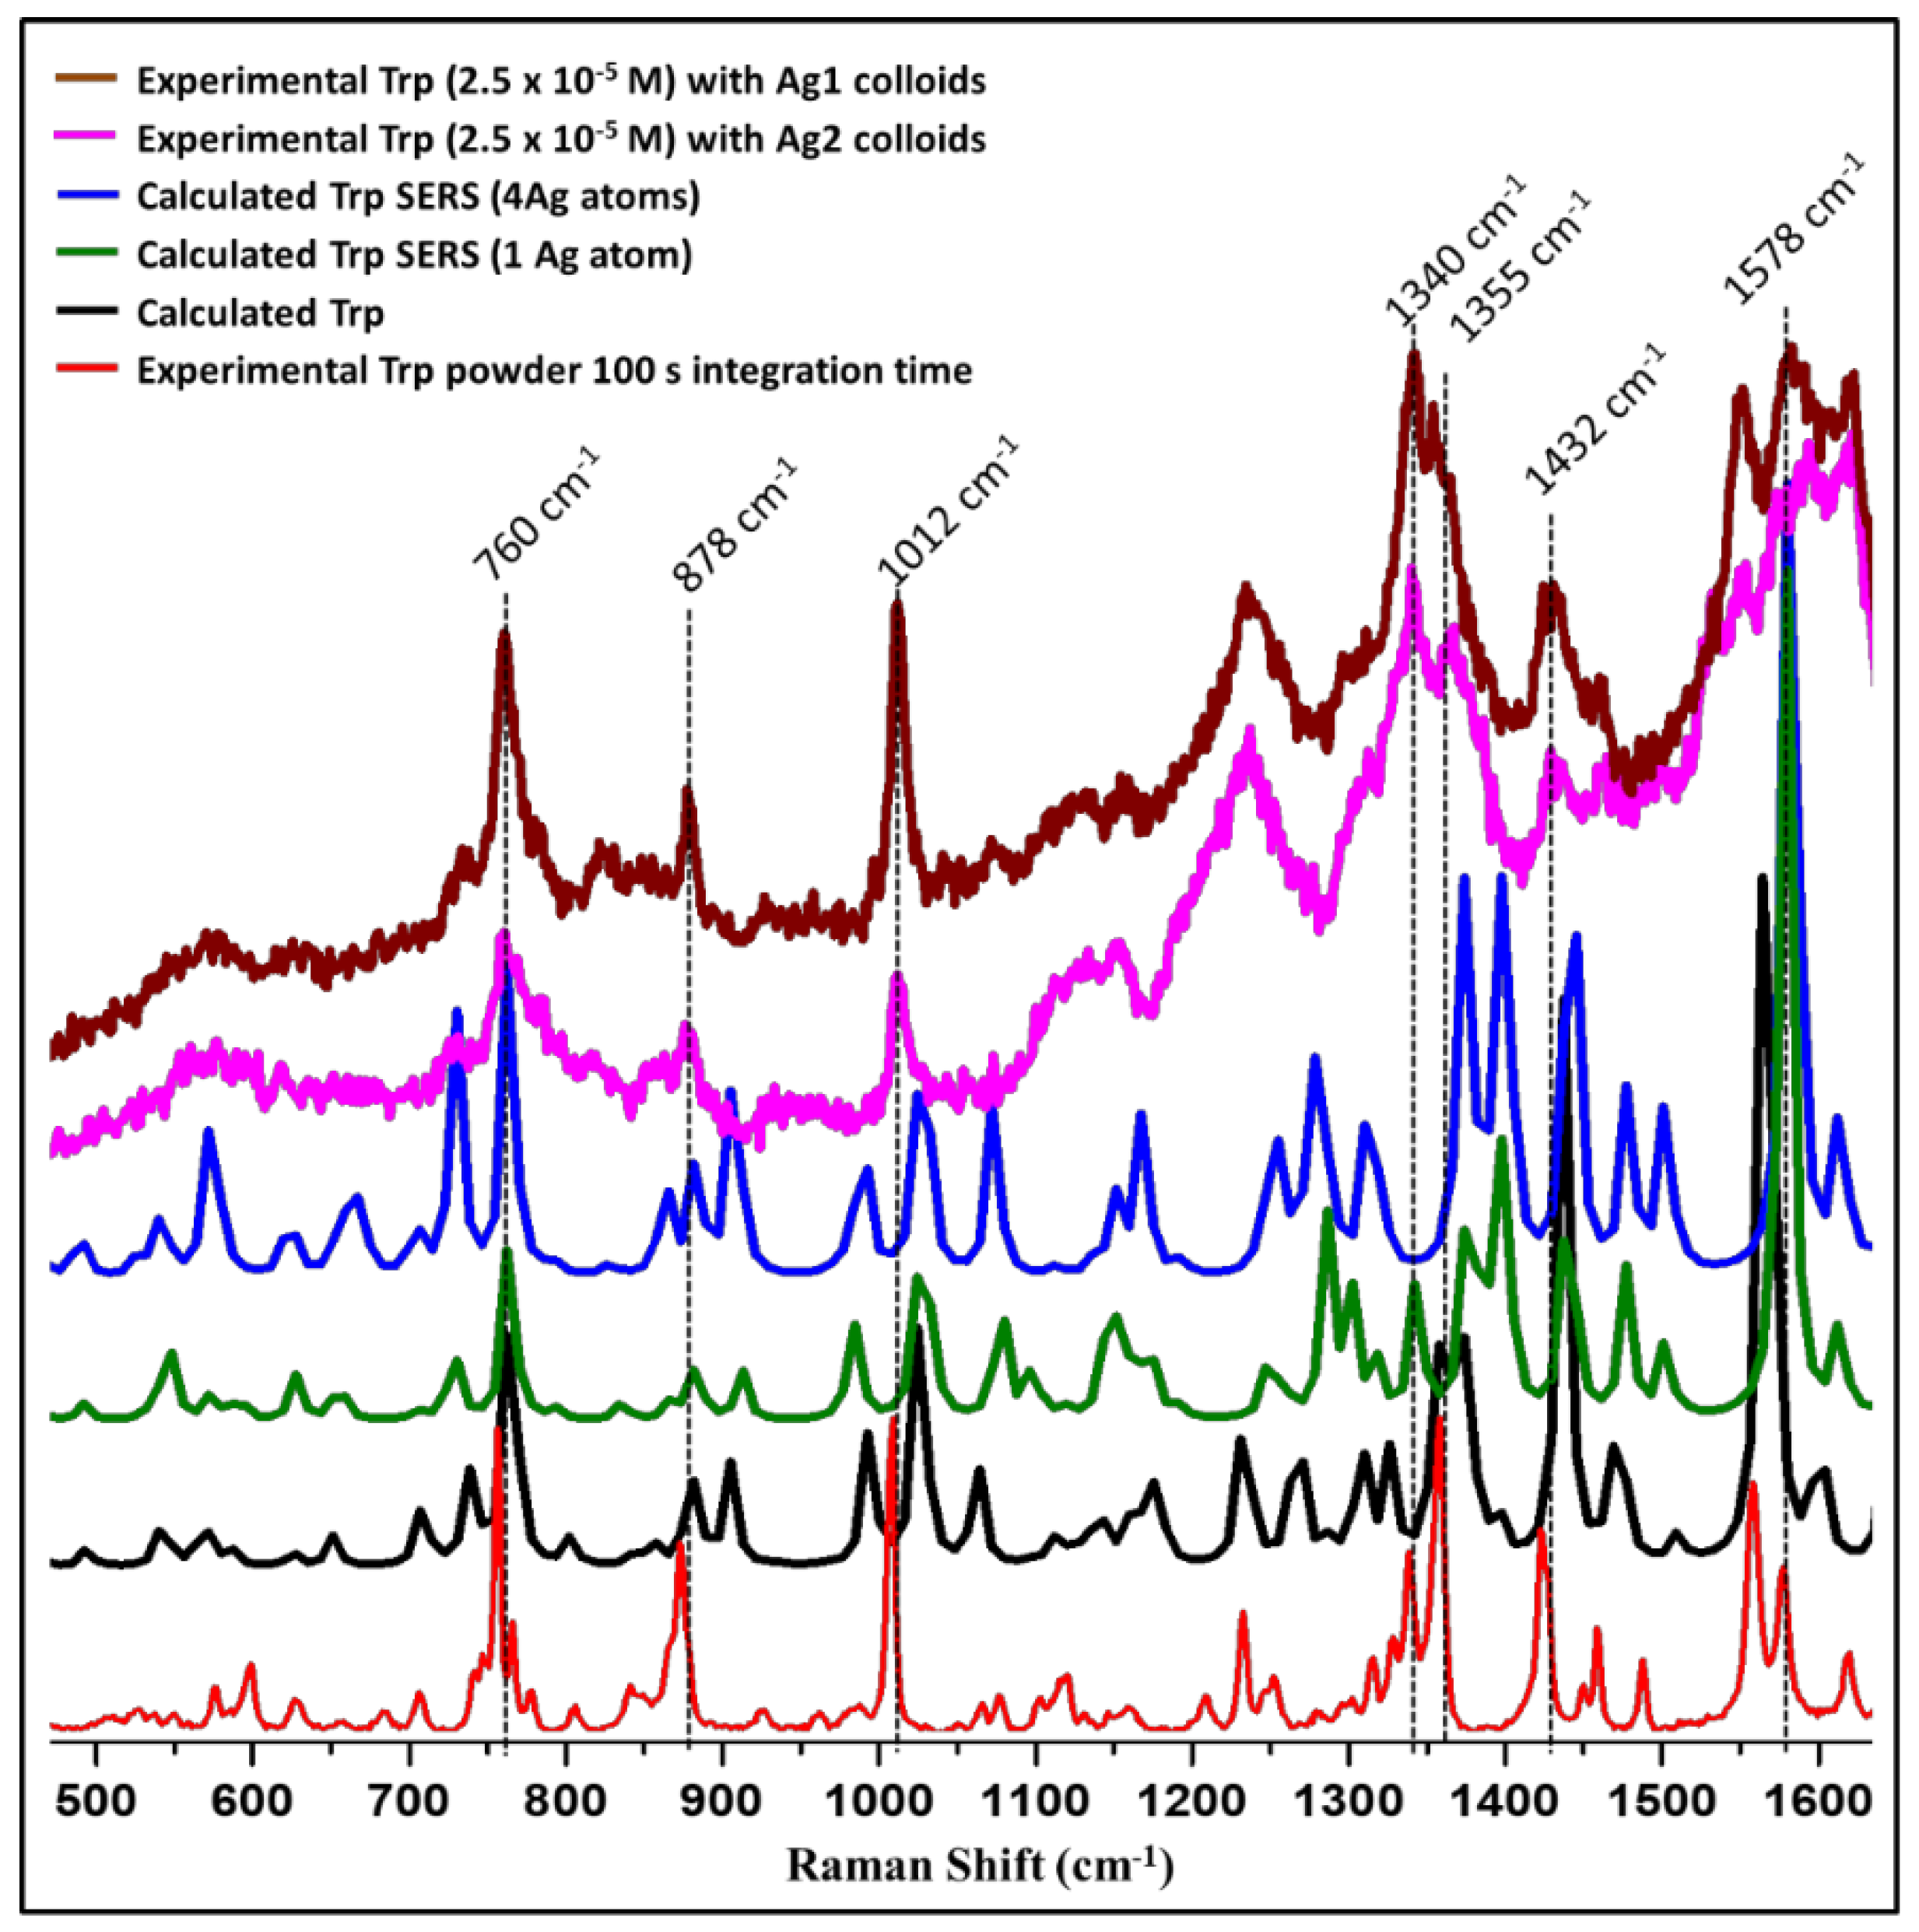
3.2. SERS Study of L-Tryptophan

Tryptophan is an essential amino acid and serves as a precursor for various important biomolecules such as serotonin, tryptamine, niacin, and melatonin. Tryptophan regulates neuronal behavior and has been used to treat insomnia or depression. Changes in serum Tryptophan levels are correlated with many disease conditions [52,53]. In this study, surface-enhanced Raman spectra of Tryptophan were recorded in the concentration range of 10−3 to 10−6 M, and two different colloids, Ag1 and Ag2 were employed as SERS substrates. Raman spectra for silver colloids, Ag1 and Ag2, are shown in (Appendix A Figure A3). Upon the addition of activating agents to the mixture of Ag nanoparticles and analyte, the Ag colloidal particles tend to aggregate, and the analyte gets trapped within the cluster thus leading to a hot spot resulting in better enhancement of Raman signals. The proposed enhancement mechanism for Raman signals using Ag colloids and activating agents is pictorially depicted in Figure 2. We employed 0.1 M KCl, NaNO3, and Na2SO4 solutions for aggregation and observed similar behavior, however, KCl was preferred over other electrolytes as there are no interfering signals from the associated anion (Cl) whereas NO3 and SO42− anions contain covalent bonds with characteristic Raman signals. The spectra were also recorded for Tryptophan solutions which were activated with 10 μL of acidic/basic KCl solution immediately before reading. Interestingly, we observed a significant improvement in the signal-to-noise ratio of the spectra on the addition of acid (HCl) to the solution in comparison to the base. Electronic absorption spectra of colloids under both acidic and basic conditions were very similar (Figure 1), however, improved enhancement was observed under acidic conditions (Figure 3). This selective enhancement under acidic conditions could be attributed to changes in the electrostatic status of Tryptophan under acidic conditions. The pH values below the isoelectronic point (pI = 5.89) of Tryptophan result in positively charged Tryptophan enhancing its interaction with negatively charged nanoparticles [54]. The pH of silver colloids on adding acidified KCl was fairly lower than the pI of Tryptophan. This increases the interaction of Tryptophan with nanoparticles and in turn, boosts the chances of trapping Tryptophan within the aggregates leading to improved SERS signals [54].
Concentration-dependent SERS spectra of L-tryptophan using both Ag1 and Ag2 colloids were compared with solid and pure solution (0.1 M) spectra of Tryptophan as shown in Figure 3A,B, respectively. In the case of Ag1, Raman bands can be clearly seen in 2.5 μM concentration of Tryptophan, however, Ag2 colloids could detect Tryptophan only up to 25 μM. Citrate-reduced Ag1 colloids have high efficiency of aggregation upon the addition of activating agent (Figure 1A). Thus, the enhancement for Tryptophan bands is higher in Ag1 compared to Ag2. Further, for a deeper understanding of enhanced Raman signal and associated molecular interactions, a computational approach has been applied which is explained in the following section.

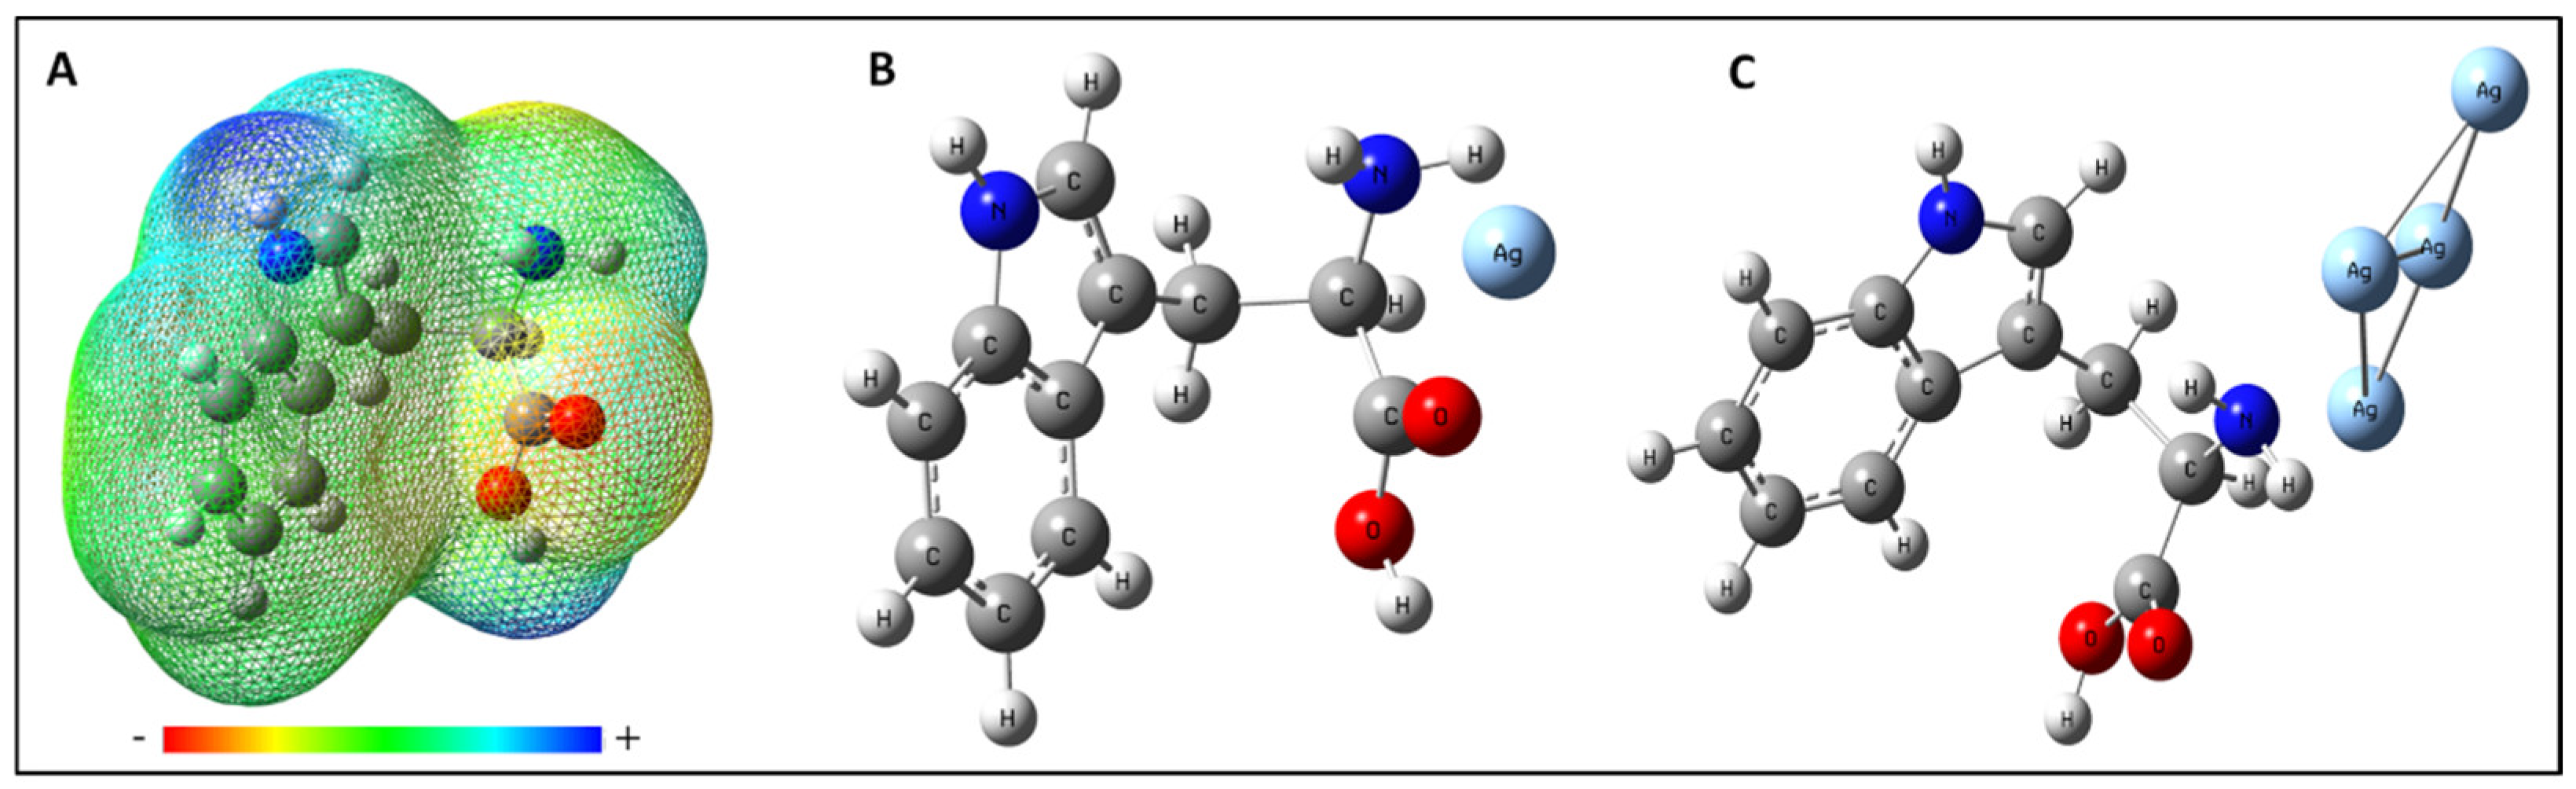
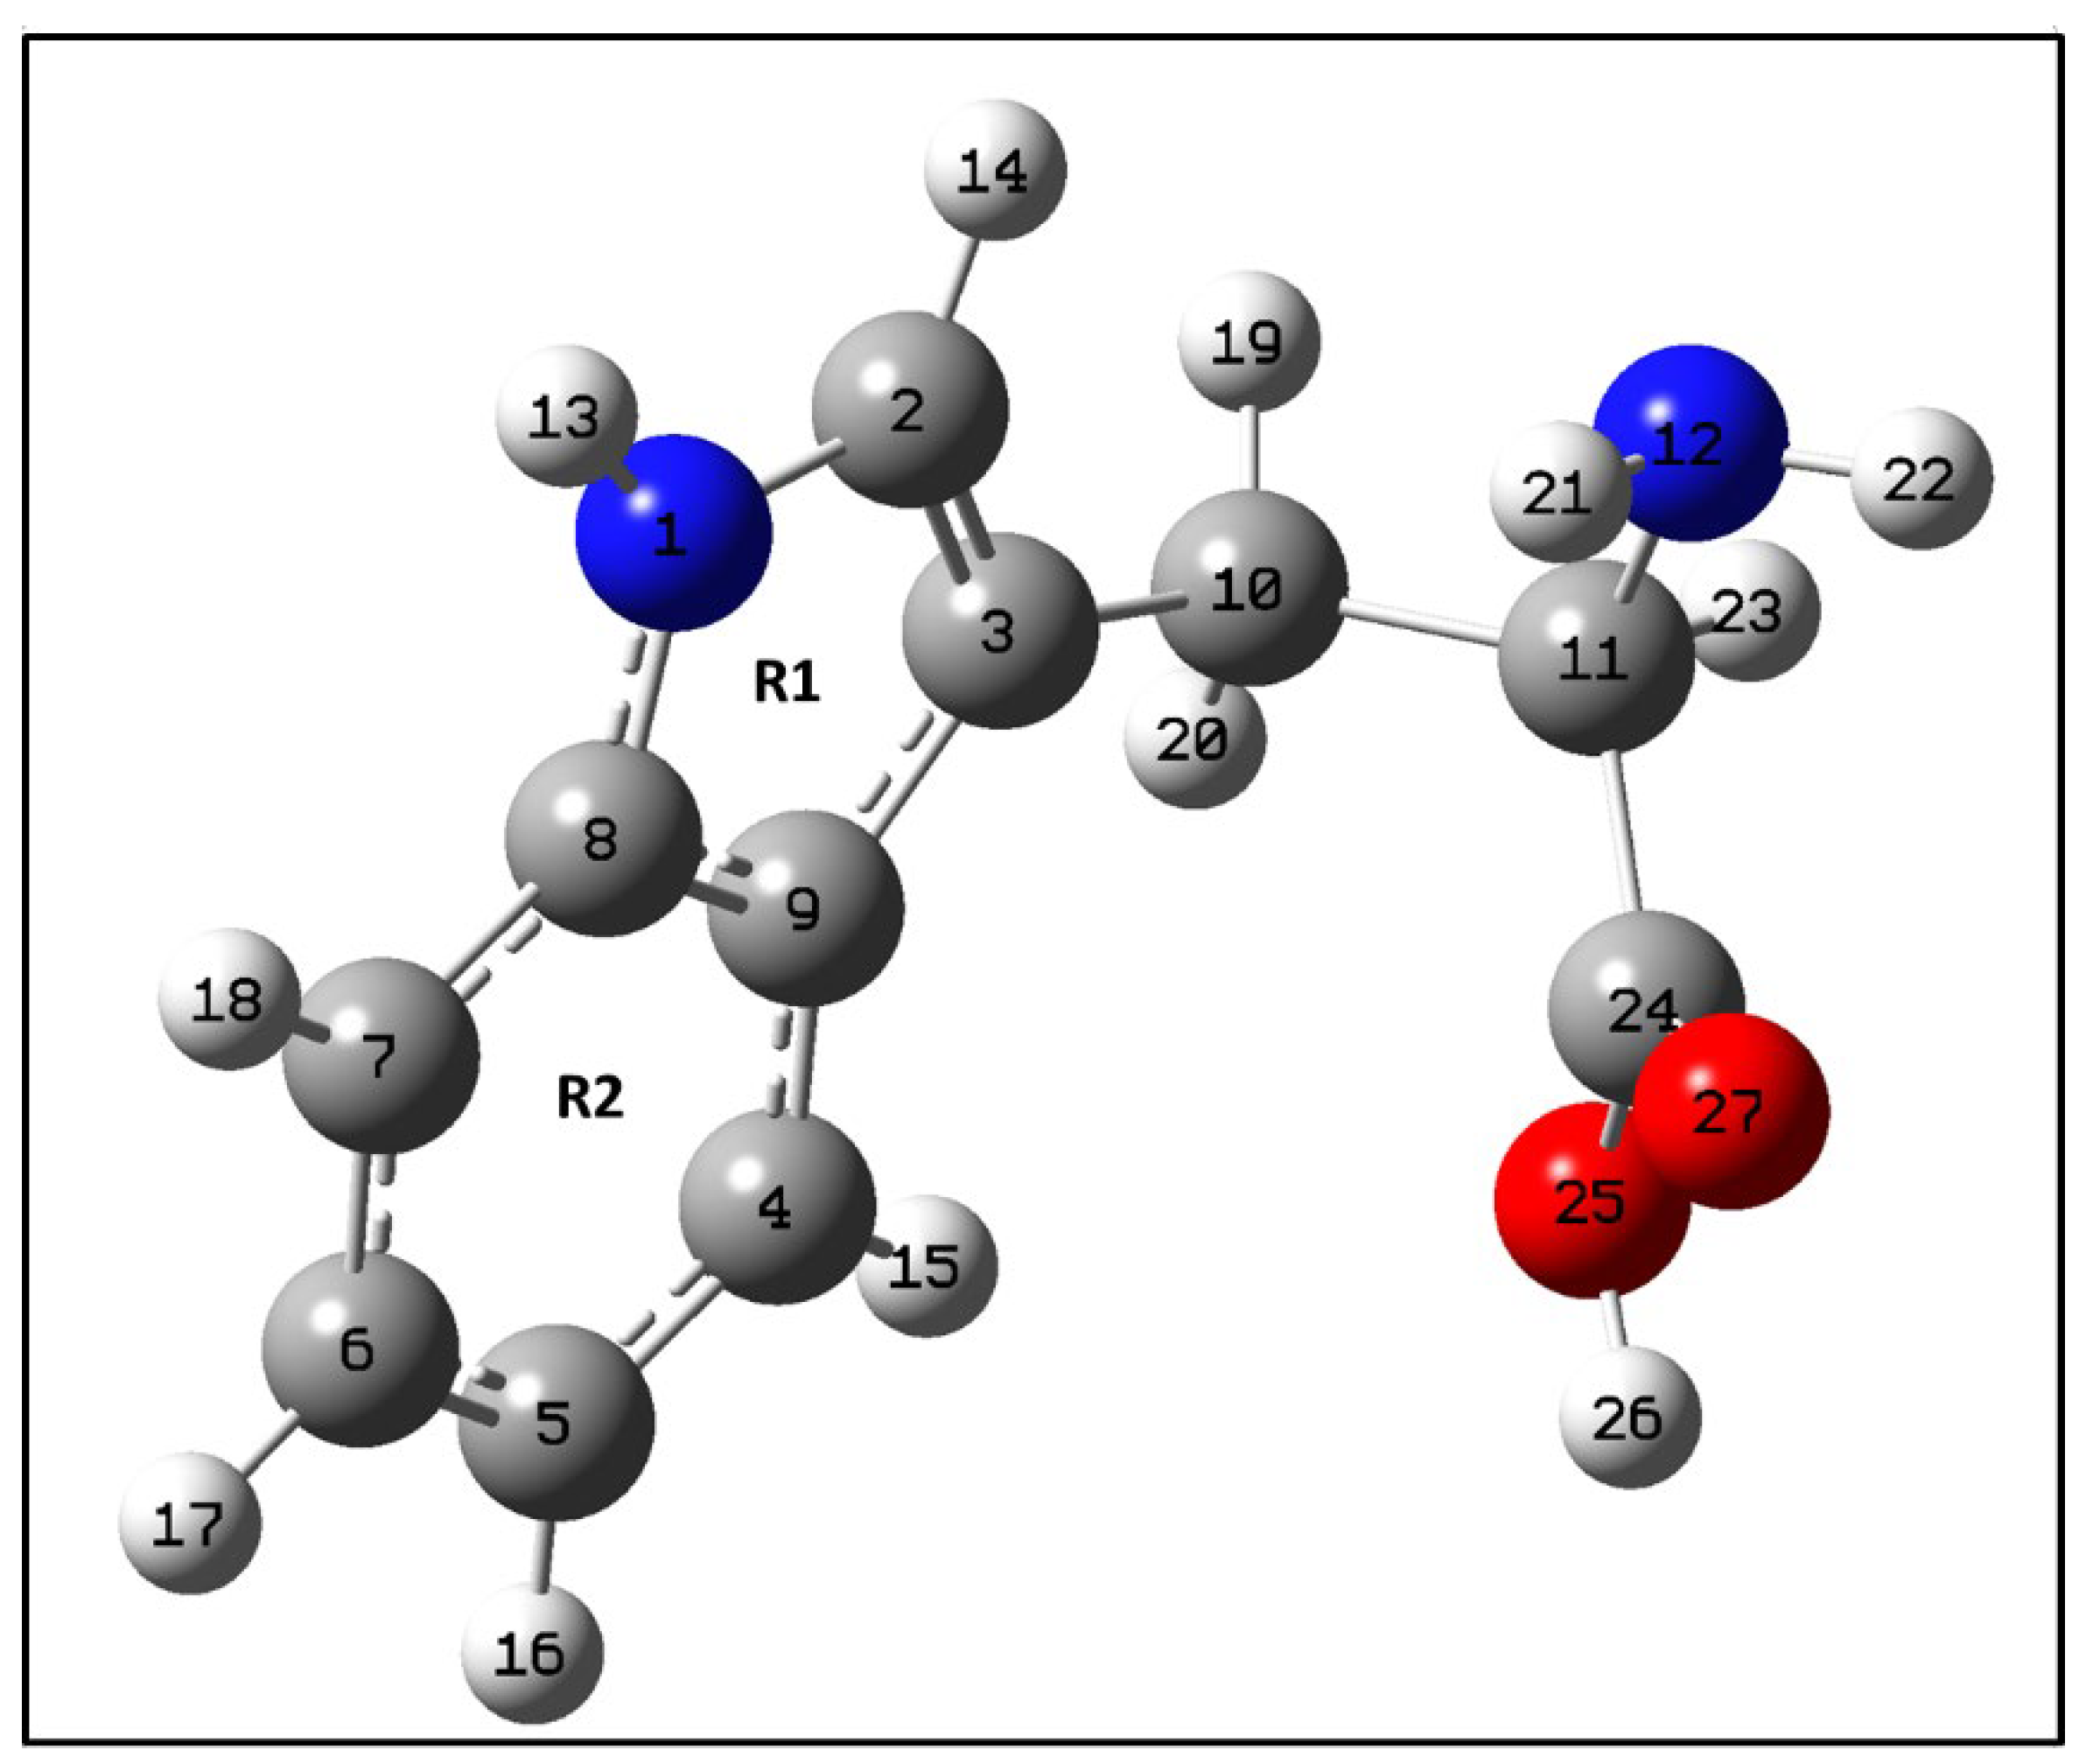
3.3. Computational Analysis

To obtain the most probable adsorption geometry of Tryptophan on the silver surface, the molecular electrostatic surface potential (ESP) was mapped. The molecular ESP at a point r in the space around a molecule is (in atomic units) given by the equation below [55].
V ( r ) = A Z A | R A r | ρ ( r ) d r | r r |
ZA = charge on nucleus A which is located at R A
ρ ( r ) = electronic density function for the molecule.
The effect of the nuclei has been represented by the first term given in the above equation whereas the second term represents the effect of electrons. Both the terms have opposite signs and show opposite effects. V(r) gives the resultant potential at each point r indicating the net electrostatic effect produced by the total charge distribution (electrons + nuclei) of the molecule at point r. The attraction of the positive charge by the concentrated electron density in the molecule is known as the negative ESP and is represented with the shades of red color in the ESP plot while the repulsion of positive charge by atomic nuclei in the molecule where low electron density exists is known as positive electrostatic potential and is shown in the shades of blue color in ESP plot. The different values of the electrostatic potential at the surface are represented by different colors; the color varies from red to blue representing the regions of most negative electrostatic potential to the most positive electrostatic potential, respectively, and the green represents regions of zero potential. The electrostatic potential map shows that the negative charge is concentrated towards the carboxylic group and the positive charge is concentrated towards the pyrrole ring of the Tryptophan (Figure 4A). This ESP provides information about the interacting sites of Tryptophan towards silver substrate according to the charge on the silver substrate. By obtaining the site information through the ESP plot, the calculation has been performed in all possible orientations to find the most favorable interaction site of Tryptophan with Ag-atom and Ag-cluster. The best-optimized geometry of the Tryptophan and Ag system (Ag-atom or Ag-cluster) which complement the experimental results well is shown in Figure 4B,C.
The comparison of solid Tryptophan Raman experimental spectrum with calculated Tryptophan spectrum is shown in Figure 5. The solid Tryptophan spectrum (experimental) matched quite well with the computed spectrum. Further, computed SERS spectra with one Ag-atom and Ag-cluster were compared with the experimental spectra of 2.5 × 10⁻⁵ M Tryptophan for both Ag1 and Ag2 colloids (Figure 5). We have chosen this particular concentration (2.5 × 10⁻⁵ M) of Tryptophan for better visualization of the enhanced bands. Some of the Tryptophan bands were greatly enhanced with both Ag1 and Ag2 colloids which correspond to the preferential geometry of the Tryptophan-Ag system under present experimental conditions. These enhanced bands are marked in Figure 5. With the help of theoretical calculations, the band assignments were made and are tabulated in Appendix A Table A1. The bands at 760 cm−1, 878 cm−1, and 1012 cm−1 showed prominent enhancement which corresponds to 763 cm−1, 881 cm−1, and 1024 cm−1 in the calculated SERS spectrum. The band at 760 cm−1 is assigned as the puckering and deformation mode of the benzene ring, the indole ring deformation, stretching, and NH2 out of plane vibration are observed at 878 cm−1 and the band at 1012 cm−1 is assigned to the benzene ring stretching and deformation [25,56,57,58]. As discussed earlier, vibrational modes with their z-component of polarizability tensor perpendicular to the metal surface are enhanced more suggesting that the indole ring of the Tryptophan molecule reclines with the z-component of the polarizability tensor perpendicular to the metal surface in the present experimental conditions [23]. This is also supported by the theoretical calculations.
We also observed enhancement in the region above 1200 cm−1 as discussed below, however, it is quite intricate to confirm as this region (1200–1700 cm−1) also has a contribution from colloids. Peak present at 1578 cm−1 in Ag1 and 1580 cm−1 in Ag2 which is mostly benzene ring vibration and deformation are showing prominent enhancement which is observed at 1580 cm−1 in computed SERS spectra (Figure 5). Raman band present at 1432 cm−1 in experimental SERS for both the colloids has been assigned to pyrrole ring stretching and deformation. This band is observed at 1437 cm−1 and 1444 cm−1 for computed SERS spectra with silver-cluster and with silver-atom, respectively. Benzene ring stretch and CCH deformation which is observed at 1355 cm−1 for Ag1 and at 1365 cm−1 for Ag2 are enhanced and observed at 1373 cm−1 in the calculated spectrum. Similarly, mixed-mode having a contribution from CH2 wag, NH2 rock, and CHO deformation present at 1340 cm−1 in both experimental and calculated spectra is enhanced [25,56,57,58].

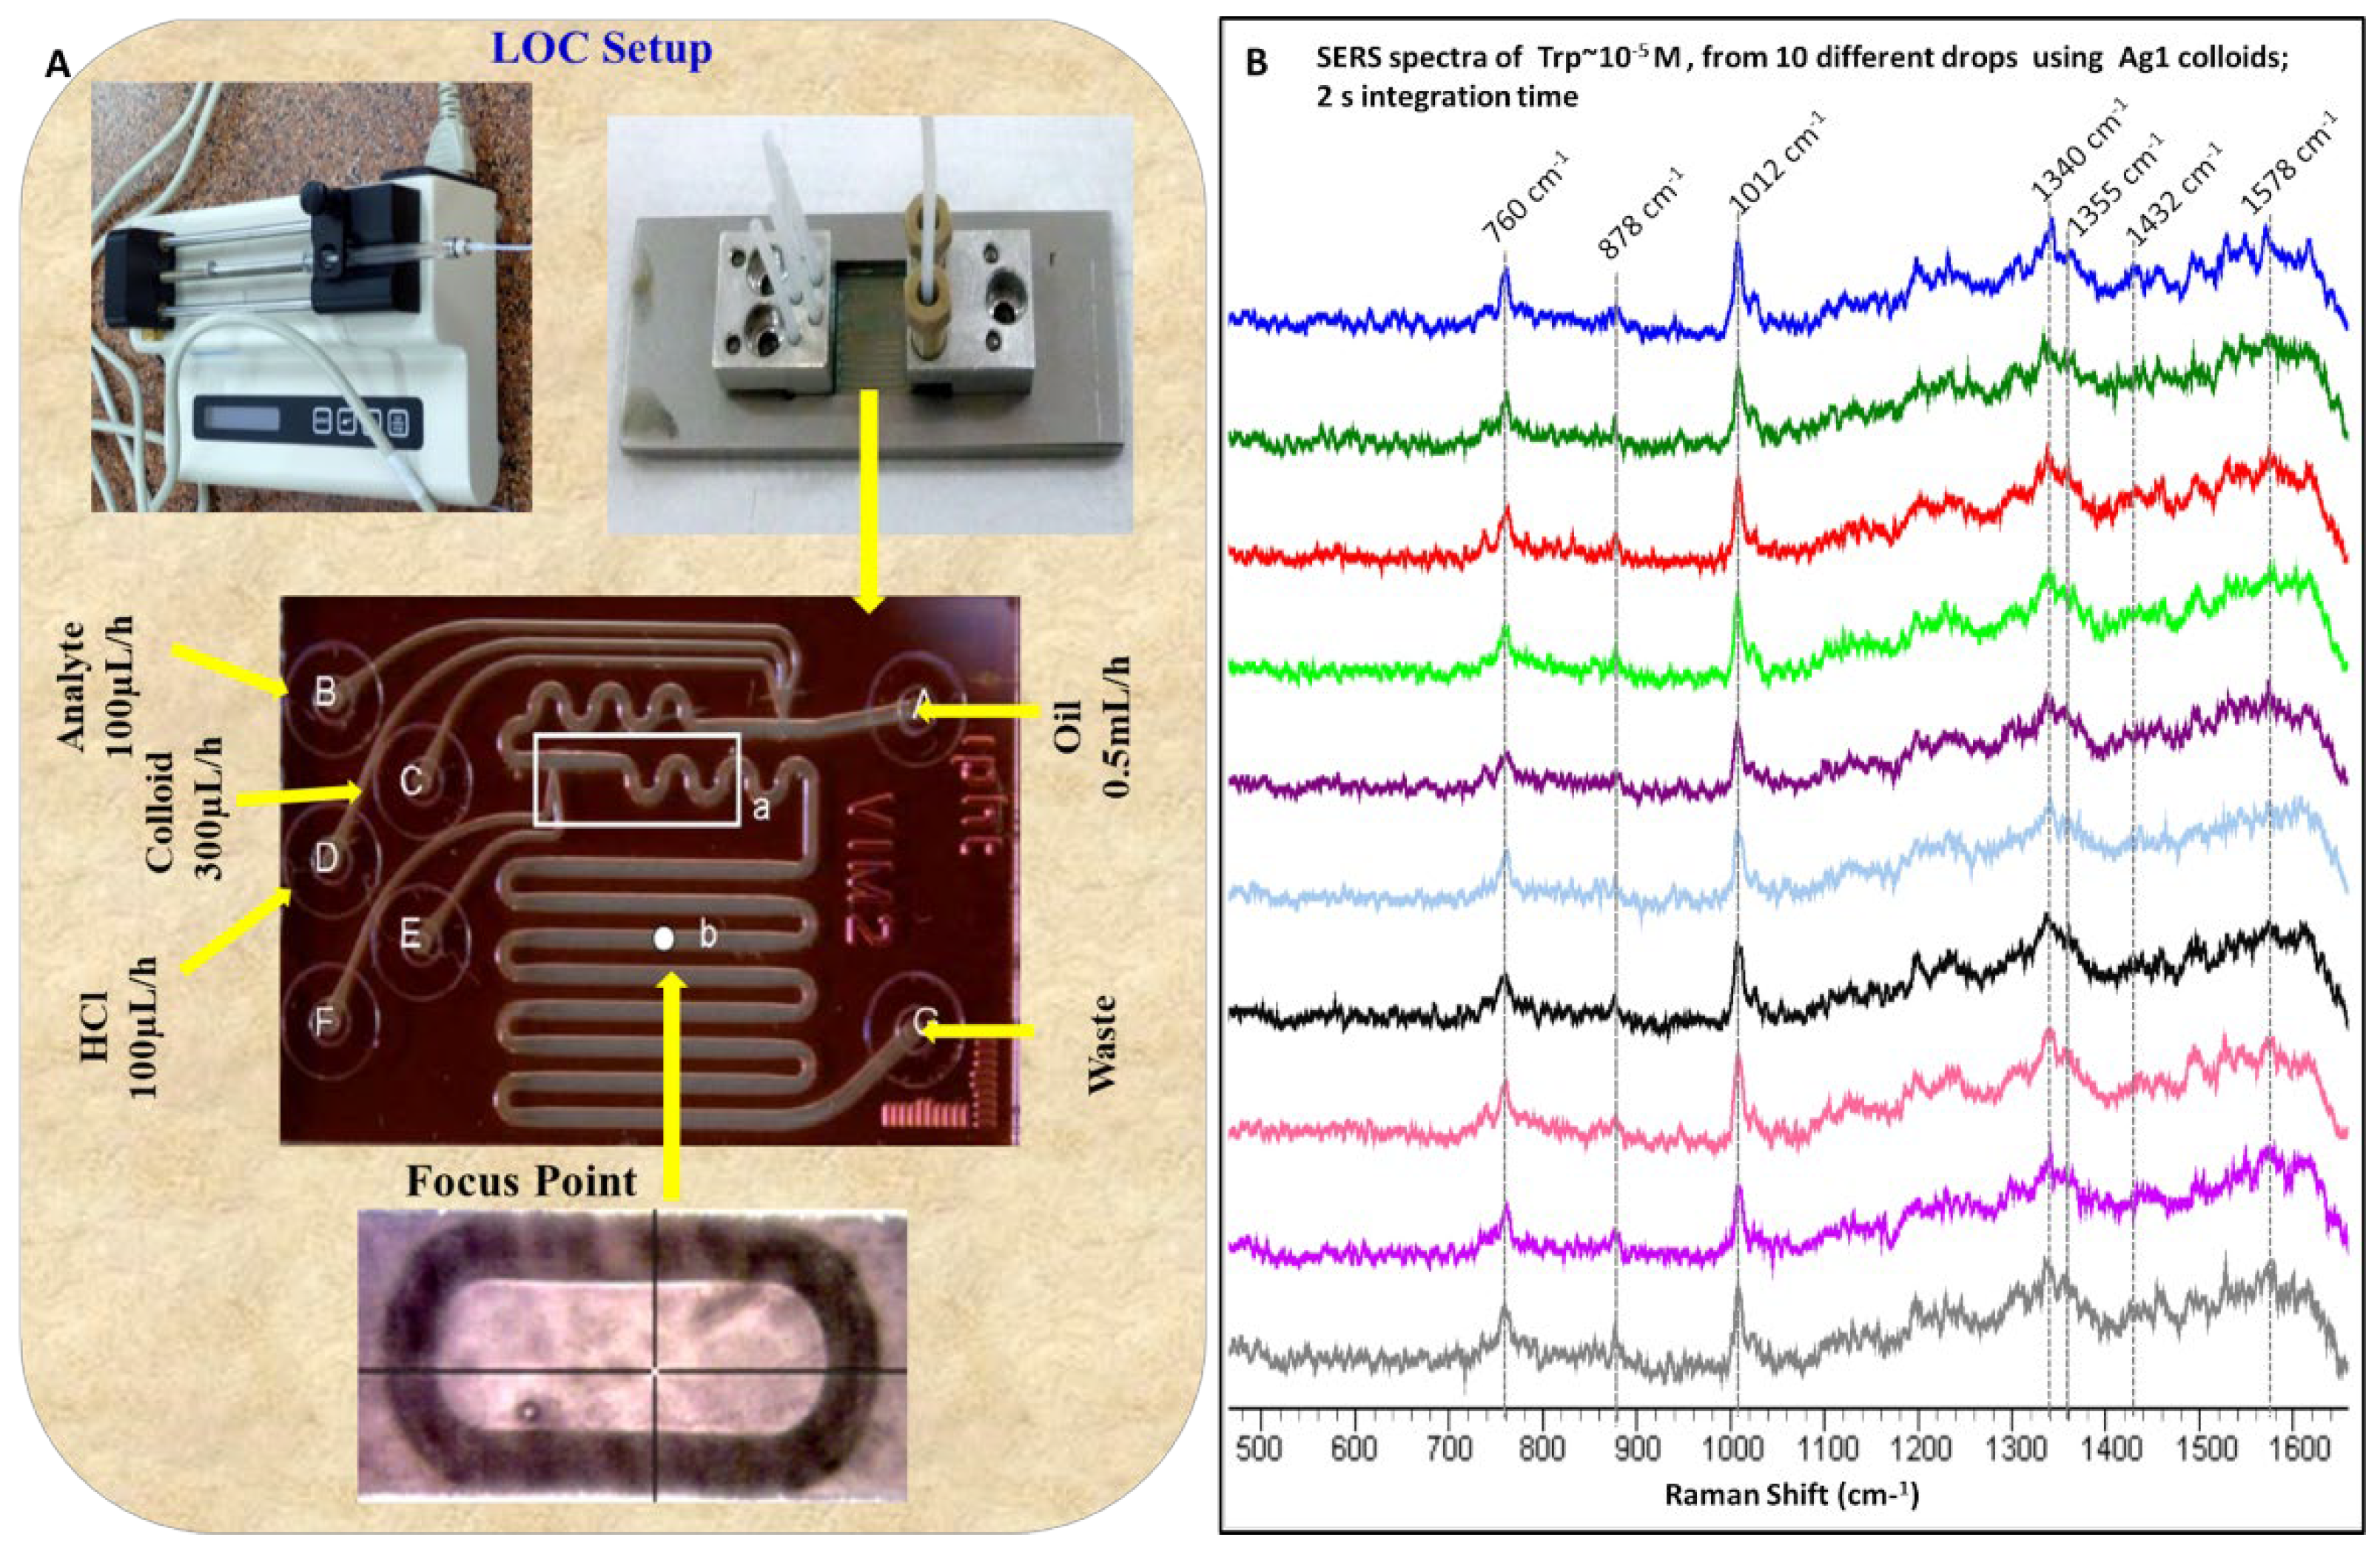
3.4. SERS Study Using Lab-on-a-Chip

To utilize the effectiveness of SERS for Tryptophan sensing at low concentration in an automated mode, LOC studies were performed. The schematic of the LOC setup used for the SERS studies is shown in Figure 6A. In this case, HCl solution was used for the activation of silver colloids. The effective concentration of Tryptophan is determined according to the flow rates used. The colloids (Ag1) solution was introduced at the flow rate of 300 μL/h while HCl and Tryptophan (10−4 M) were introduced at 100 μL/h to the LOC. However, mineral oil was introduced at the rate of 0.5 mL/h and was used to create segmented flow for better mixing [29]. Mineral oil also prevented direct contact between the aqueous phase and the microchannel walls. This segmented flow generated using mineral oil also allows trapping of the analyte in droplet form for sensitive optical detection. The spectra were recorded at indicated focus point on the LOC (Figure 6A) and were acquired for two seconds. The spectra from ten different drops of Tryptophan are shown in (Figure 6B). The similarities in the spectra from 10 different drops validate the reproducibility in the automated flow system. Enhancement from SERS substrate in colloidal form varies with the interaction (orientation) of the analyte with the substrate, these interactions are highly influenced by the sample handling including the time delays between adding different components and mixing speed. Here we have demonstrated sensitive and reproducible detection of one of the important amino acids present in body fluids using an automated LOC system. However, this method can be applied for the detection of other biomolecules and/or multiple biomolecules in a single measurement. The present work discusses the non-specific detection of Tryptophan. To identify the Tryptophan in biological samples such as serum specific peaks assigned can be utilized. However, these colloidal metal particles can be labeled for the identification of specific molecules such as amino acids, antigens, drugs, and DNA fragments which are important to medicine and forensic investigations. The spectra from heterogeneous biofluids such as serum, consisting of multiple biomolecules, will be complex. Therefore, to obtain meaningful information and deeper insight preprocessing is required. This helps in eliminating the effects of unwanted signals such as cosmic rays, fluorescence, Mie scattering, and other noise enhancing the subtle concentration differences between the samples. Various background corrections such as polynomial fitting, first and second order differentiation, and noise filtering such as Savitzky Golay (SG filter), Locally Weighted Scatterplot Smoothing (LOWESS) methods have been used for this purpose [59]. Normalization is a critical part of preprocessing to remove disparity in intensity levels by making sure that the intensity of a given Raman band of the same material is as similar as possible across the spectra recorded under the same experimental parameters but over a period of time. Numerous normalization techniques such as peak/area normalization, vector normalization, and Standard Normal Variate transformation are known to Raman spectral analysis [59].

4. Conclusions

In this study, we have shown SERS of Tryptophan using two different approaches. Standard SERS is useful as the plasmon frequency of the nanoparticles can be optimized using suitable activating agents for sensitive optical detection of a particular analyte. By combining both computation and experimental data, we have successfully identified the most preferable Tryptophan orientation for molecular interaction with the metal surface. The computational analysis also assisted in the assignment of the Raman bands. LOC setup offers a convenient automated method for obtaining reproducible spectra with a minimal sample. This non-destructive approach applies to all the analytes present in body fluids and has great potential in point-of-care diagnostics and forensic science. Although flow systems offer greater SERS reproducibility, it is noteworthy that the flow system needs to be optimized according to a particular analytical application.

Author Contributions

R.G. designed, performed the experiments, analyzed the data, wrote, and reviewed the manuscript. D.C. designed, developed computational model, performed the experiments, wrote, and reviewed the manuscript. S.S. (Sanchita Sil) designed, performed the experiments, edited, and reviewed the manuscript. N.K. analyzed and interpreted the data, wrote and reviewed the manuscript, S.S. (Saumya Singh) validated the data and reviewed the manuscript and S.U. supervised the work. All authors have read and agreed to the published version of the manuscript.

Funding

This work is financially supported by Department of Biotechnology (Grant No. BT/01/CEIB/09/IV/05), Government of India.

Data Availability Statement

Not applicable.

Acknowledgments

We thank the Indian Institute of Science (IISc) Bangalore, Council of Scientific and Industrial Research (CSIR) and the Department of Science and Technology (DST) for financial assistance. S.U. acknowledges the J.C. Bose fellowship from DST. We express our special thanks to Anne Marz and Juergen Popp (Germany) for their help and for providing chip (LOC) for SERS experiments.

Conflicts of Interest

The authors declare no conflict of interest.

Appendix A

Table A1. Vibrational assignments for experimental and calculated wavenumber of L-tryptophan.
Calculated SERS
Freq.
Exp. SERS Freq. (Liquid)Exp. Freq.
(Solid)
Calculated Freq.PED%
Tryp-
1Ag
Tryp-
4 Ag
(Ag1)(Ag2) Scaled
Freq.
Unscaled
Freq.
1612161216211621162016451657ν[R2(CC)](46) + δ(R2)(20) + ν(N1C8)(6) + δ(NH2)(4)
1580158015841591157616011613ν[R2](55)+ R2(δCCH)(17)+ ν(R1)(6)
15521552155815671578ν(R1)(44) + δ(N1C2H14)(13)-ν(C3C10)(9) + ν[R2](9) + δ(R1)(6)
1477147714591459145914681479R2(δCCH)(33) + ν[R2](22) + δ(CH2)(20) + ν(R1)(4)
1444143714321432142414371448ν(R1)(31) + R1[δ(CN1H13)(27)] + δ(CC6H17)(12) + ν[R2](12)
1373137313551365135813561366ν[R2](66) + R2[δ(CCH)(11)] + ω(CH2)(5)
-134213421342133913261336ω(CH2)(20) + ρ(NH2)(16) + δ(CHO)(10) + ν(C11C24)(6) + ρ(CC = O)(6) + ν(CO)(6) + ν(C10C11)(5) + δ(C10N12C11)(4)
-130213061306130213081318R1[ν(CC)(35) + δ(NCH)(16)] + R2[δ(CCH)(15)] + ν(C3C10)(5) + ω(CH2)(5) + R2[ν(CC)(10)] + δ(R1)(4)
1255124612351235123312331242(δ + ρ)(C11H)(23) + φ(CH2)(13) + ν(C11N12)(10) + ω(CH2)(9)+ ν(C10 C11)(7)-R1
1166117511541154116111781186φ(CH2)(15) + R2[δ(CCH)(20)] + ρ(N12H2)(10) + ν(C11N12)(9) + δ(C11H)(5) + ν(C10C11)(5) + δ(C24N12C11)(4)+ν(C4C5)(4)
1024102510101010100810261034R2[ν(CC)(75)]+R2[δ(CCH)(18)]
881881878878873880886δ(R2)(35)+[R1(δ+ν)](26)+δ(R2)(8)+oop(NH2)(5)+ρ(CH2)(4)+ν(C11N12)(4)
826833823 841843849R2[oop(CH)](59)+ι(R1)(7)+puck(R2)(6)+oop(N1H13)(5)
795793784784805803809oop(N1H13)(59) + ι(R1)(17) + ν(C11C24)(5)
763763760760756765770δ(R2)(18) + puck(R2)(12) + δ(R1)(11) + R2[ν(22)] + R1[ν(9)] + ι(R1)(5) + ν+δ(R1)(4)
730730736-741738744R2[oop(CH)(29) + ν(C11C24)(13) + oop(C = O)(10) ν(C10C11)(8) + ρ(CC = O)(7) + ν(CO)(5) + puck(R2)(4) + δ(COH)(7)
--723723721709714ν(C3C10)(15) + δ(R2)(14) + δ(R1)(13) + oop(C = O)(10) + δ (C3C11C10) (7) + puck(R2)(5) + ι(CO)(4)
627627-618627625630ρ(CC = O)(18) + ι(CO)(18) + ιasym(R1)(16) + δ(C24N12C11)(9) + ι(R1)(9) + oop(C3C10)(8) + puck (R2)(4)
571571576576576569573δ(R1)(24) + δ(R2)(23) + ν(R2)(7) + ι(CO)(7) + ι(R2)(5) + ι(R1)(5) + ν(C3C10)(4) + puck(R2)(4)
468468461 466466469δ(R2)(31) + δ(CC3C10)(26) + ρ(CH2)(7) + δ(R1)(5) + ν(R1)(5)
Note: All frequencies are in cm−1. ν: stretch, ι: torsion, oop: out of plane motion, δ: deformation, φ:twisting, ω: wagging, puck: puckering. Refer to Figure A2 for numbering.
Figure A1. Optimized structure of tryptophan calculated at the B3LYP/6-311++G (d,p) level of theory. As defined in Figure 4, red represents Oxygen, blue is Nitrogen, grey is Carbon and white- Hydrogen atom.
Photonics 09 00648 g0a1
Figure A2. Scanning Electron microscopy (SEM) images were recorded at 5 kV (Scale bar, 200 nm) using Zeiss instrument. (A) SEM image aggregated citrate reduced nanoparticles (Ag1 + KCl + HCl) and (B) SEM image of aggregated sodium borohydride reduced nanoparticles (Ag2 + KCl + HCl).
Photonics 09 00648 g0a2
Figure A3. Raman spectra of (left) sodium citrate (Ag1) and (right) sodium borohydride (Ag2) reduced silver nanoparticles.
Photonics 09 00648 g0a3

References

  1. Good, D.M.; Thongboonkerd, V.; Novak, J.; Bascands, J.-L.; Schanstra, J.P.; Coon, J.J.; Dominiczak, A.; Mischak, H. Body Fluid Proteomics for Biomarker Discovery: Lessons from the Past Hold the Key to Success in the Future. J. Proteome Res. 2007, 6, 4549–4555. [Google Scholar] [CrossRef] [PubMed]
  2. Gautam, R.; Peoples, D.; Jansen, K.; O’Connor, M.; Thomas, G.; Vanga, S.; Pence, I.J.; Mahadevan-Jansen, A. Feature Selection and Rapid Characterization of Bloodstains on Different Substrates. Appl. Spectrosc. 2020, 74, 1238–1251. [Google Scholar] [CrossRef]
  3. Muro, C.K.; Doty, K.C.; de Souza Fernandes, L.; Lednev, I.K. Forensic body fluid identification and differentiation by Raman spectroscopy. Forensic Chem. 2016, 1, 31–38. [Google Scholar] [CrossRef]
  4. Gentile, F.; Das, G.; Coluccio, M.L.; Mecarini, F.; Accardo, A.; Tirinato, L.; Tallerico, R.; Cojoc, G.; Liberale, C.; Candeloro, P.; et al. Ultra low concentrated molecular detection using super hydrophobic surface based biophotonic devices. Microelectron. Eng. 2010, 87, 798–801. [Google Scholar] [CrossRef]
  5. März, A.; Rösch, P.; Henkel, T.; Malsch, D.; Popp, J. Lab-on-a-Chip Surface-Enhanced Raman Spectroscopy. In Optical Nano- and Microsystems for Bioanalytics; Fritzsche, W., Popp, J., Eds.; Springer: Berlin/Heidelberg, Germany, 2012; pp. 229–245. [Google Scholar]
  6. Bunaciu, A.A.; Fleschin, Ş.; Hoang, V.D.; Aboul-Enein, H.Y. Vibrational Spectroscopy in Body Fluids Analysis. Crit. Rev. Anal. Chem. 2016, 47, 67–75. [Google Scholar] [CrossRef]
  7. Hu, S.; Loo, J.A.; Wong, D.T. Human body fluid proteome analysis. Proteomics 2006, 6, 6326–6353. [Google Scholar] [CrossRef]
  8. Kuhar, N.; Sil, S.; Umapathy, S. Potential of Raman spectroscopic techniques to study proteins. Spectrochim. Acta Part A Mol. Biomol. Spectrosc. 2021, 258, 119712. [Google Scholar] [CrossRef] [PubMed]
  9. Gautam, R.; Samuel, A.; Sil, S.; Chaturvedi, D.; Dutta, A.; Ariese, F.; Umapathy, S. Raman and mid-infrared spectroscopic imaging: Applications and advancements. Curr. Sci. 2015, 108, 341–356. [Google Scholar]
  10. Kuhar, N.; Sil, S.; Verma, T.; Umapathy, S. Challenges in application of Raman spectroscopy to biology and materials. RSC Adv. 2018, 8, 25888–25908. [Google Scholar] [CrossRef]
  11. Gautam, R.; Oh, J.Y.; Patel, R.P.; Dluhy, R.A. Non-invasive analysis of stored red blood cells using diffuse resonance Raman spectroscopy. Analyst 2018, 143, 5950–5958. [Google Scholar] [CrossRef]
  12. Sil, S.; Gautam, R.; Umapathy, S. Chapter 6—Applications of Raman and Infrared Microscopy to Materials and Biology. In Molecular and Laser Spectroscopy; A2; Gupta, V.P., Ed.; Elsevier: Amsterdam, The Netherlands, 2018; pp. 117–146. [Google Scholar]
  13. Muehlethaler, C.; Leona, M.; Lombardi, J.R. Review of Surface Enhanced Raman Scattering Applications in Forensic Science. Anal. Chem. 2016, 88, 152–169. [Google Scholar] [CrossRef] [PubMed]
  14. Yan, B.; Li, B.; Wen, Z.; Luo, X.; Xue, L.; Li, L. Label-free blood serum detection by using surface-enhanced Raman spectroscopy and support vector machine for the preoperative diagnosis of parotid gland tumors. BMC Cancer 2015, 15, 650. [Google Scholar] [CrossRef] [PubMed]
  15. Reyes-Goddard, J.M.; Barr, H.; Stone, N. Photodiagnosis using Raman and surface enhanced Raman scattering of bodily fluids. Photodiagnosis Photodyn. Ther. 2005, 2, 223–233. [Google Scholar] [CrossRef]
  16. Schlücker, S. SERS Microscopy: Nanoparticle Probes and Biomedical Applications. In Surface Enhanced Raman Spectroscopy; Wiley: Weinheim, Germany, 2010; pp. 263–283. [Google Scholar]
  17. Fleischmann, M.; Hendra, P.J.; McQuillan, A.J. Raman spectra of pyridine adsorbed at a silver electrode. Chem. Phys. Lett. 1974, 26, 163–166. [Google Scholar] [CrossRef]
  18. Jeanmaire, D.L.; Van Duyne, R.P. Surface raman spectroelectrochemistry: Part I. Heterocyclic, aromatic, and aliphatic amines adsorbed on the anodized silver electrode. J. Electroanal. Chem. Interfacial Electrochem. 1977, 84, 1–20. [Google Scholar] [CrossRef]
  19. Albrecht, M.G.; Creighton, J.A. Anomalously intense Raman spectra of pyridine at a silver electrode. J. Am. Chem. Soc. 1977, 99, 5215–5217. [Google Scholar] [CrossRef]
  20. Stiles, P.L.; Dieringer, J.A.; Shah, N.C.; Van Duyne, R.P. Surface-enhanced Raman spectroscopy. Annu. Rev. Anal. Chem. 2008, 1, 601–626. [Google Scholar] [CrossRef]
  21. Moskovits, M. Surface-enhanced spectroscopy. Rev. Mod. Phys. 1985, 57, 783–826. [Google Scholar] [CrossRef]
  22. Ruperez, A.; Laserna, J. Surface-enhanced Raman spectroscopy. In Modern Technique in Raman Spectroscopy; Laserna, J.J., Ed.; Wiley & Sons: Chichester, UK, 1996; pp. 227–264. [Google Scholar]
  23. Arenas, J.F.; López-Tocón, I.; Castro, J.L.; Centeno, S.P.; López-Ramírez, M.R.; Otero, J.C. Resonant charge transfer on the nanoscale: Studying doublet states of adsorbates by surface-enhanced Raman scattering. J. Raman Spectrosc. 2005, 36, 515–521. [Google Scholar] [CrossRef]
  24. Sil, S.; Chaturvedi, D.; Krishnappa, K.B.; Kumar, S.; Asthana, S.N.; Umapathy, S. Density Functional Theoretical Modeling, Electrostatic Surface Potential and Surface Enhanced Raman Spectroscopic Studies on Biosynthesized Silver Nanoparticles: Observation of 400 pM Sensitivity to Explosives. J. Phys. Chem. A 2014, 118, 2904–2914. [Google Scholar] [CrossRef]
  25. Kandakkathara, A.; Utkin, I.; Fedosejevs, R. Surface-Enhanced Raman Scattering (SERS) Detection of Low Concentrations of Tryptophan Amino Acid in Silver Colloid. Appl. Spectrosc. 2011, 65, 507–513. [Google Scholar] [CrossRef] [PubMed]
  26. Perumal, J.; Wang, Y.; Attia, A.B.E.; Dinish, U.S.; Olivo, M. Towards a point-of-care SERS sensor for biomedical and agri-food analysis applications: A review of recent advancements. Nanoscale 2021, 13, 553–580. [Google Scholar] [CrossRef] [PubMed]
  27. Langer, J.; Jimenez de Aberasturi, D.; Aizpurua, J.; Alvarez-Puebla, R.A.; Auguié, B.; Baumberg, J.J.; Bazan, G.C.; Bell, S.E.J.; Boisen, A.; Brolo, A.G.; et al. Present and Future of Surface-Enhanced Raman Scattering. ACS Nano 2020, 14, 28–117. [Google Scholar] [CrossRef] [PubMed]
  28. März, A.; Ackermann, K.R.; Malsch, D.; Bocklitz, T.; Henkel, T.; Popp, J. Towards a quantitative SERS approach–online monitoring of analytes in a microfluidic system with isotope-edited internal standards. J. Biophotonics 2009, 2, 232–242. [Google Scholar] [CrossRef] [PubMed]
  29. Strehle, K.R.; Cialla, D.; Rösch, P.; Henkel, T.; Köhler, M.; Popp, J. A Reproducible Surface-Enhanced Raman Spectroscopy Approach. Online SERS Measurements in a Segmented Microfluidic System. Anal. Chem. 2007, 79, 1542–1547. [Google Scholar] [CrossRef]
  30. Jeon, J.; Choi, N.; Chen, H.; Moon, J.-I.; Chen, L.; Choo, J. SERS-based droplet microfluidics for high-throughput gradient analysis. Lab A Chip 2019, 19, 674–681. [Google Scholar] [CrossRef]
  31. Andreou, C.; Hoonejani, M.R.; Barmi, M.R.; Moskovits, M.; Meinhart, C.D. Rapid Detection of Drugs of Abuse in Saliva Using Surface Enhanced Raman Spectroscopy and Microfluidics. ACS Nano 2013, 7, 7157–7164. [Google Scholar] [CrossRef]
  32. Wang, G.; Lim, C.; Chen, L.; Chon, H.; Choo, J.; Hong, J.; deMello, A.J. Surface-enhanced Raman scattering in nanoliter droplets: Towards high-sensitivity detection of mercury (II) ions. Anal. Bioanal. Chem. 2009, 394, 1827–1832. [Google Scholar] [CrossRef]
  33. Dimov, I.K.; Basabe-Desmonts, L.; Garcia-Cordero, J.L.; Ross, B.M.; Ricco, A.J.; Lee, L.P. Stand-alone self-powered integrated microfluidic blood analysis system (SIMBAS). Lab A Chip 2011, 11, 845–850. [Google Scholar] [CrossRef]
  34. Henkel, T.; März, A.; Popp, J. SERS and Microfluidics. In Surface Enhanced Raman Spectroscopy; Wiley: Weinheim, Germany, 2010; pp. 173–190. [Google Scholar]
  35. Mark, D.; Haeberle, S.; Roth, G.; von Stetten, F.; Zengerle, R. Microfluidic lab-on-a-chip platforms: Requirements, characteristics and applications. Chem. Soc. Rev. 2010, 39, 1153–1182. [Google Scholar] [CrossRef]
  36. Nasseri, B.; Soleimani, N.; Rabiee, N.; Kalbasi, A.; Karimi, M.; Hamblin, M.R. Point-of-care microfluidic devices for pathogen detection. Biosens. Bioelectron. 2018, 117, 112–128. [Google Scholar] [CrossRef] [PubMed]
  37. Lai, C.-H.; Chen, L.; Chen, G.; Xu, Y.; Wang, C.-Y. Microchannel-Based Surface-Enhanced Raman Spectroscopy for Integrated Microfluidic Analysis. Appl. Spectrosc. 2014, 68, 124–127. [Google Scholar] [CrossRef] [PubMed]
  38. Szaniawska, A.; Kudelski, A. Applications of Surface-Enhanced Raman Scattering in Biochemical and Medical Analysis. Front. Chem. 2021, 9, 664134. [Google Scholar] [CrossRef]
  39. Lee, P.C.; Meisel, D. Adsorption and surface-enhanced Raman of dyes on silver and gold sols. J. Phys. Chem. 1982, 86, 3391–3395. [Google Scholar] [CrossRef]
  40. Podstawka, E.; Ozaki, Y.; Proniewicz, L.M. Adsorption of S–S Containing Proteins on a Colloidal Silver Surface Studied by Surface-Enhanced Raman Spectroscopy. Appl. Spectrosc. 2004, 58, 1147–1156. [Google Scholar] [CrossRef]
  41. Kahraman, M.; Tokman, N.; Çulha, M. Silver Nanoparticle Thin Films with Nanocavities for Surface-Enhanced Raman Scattering. ChemPhysChem 2008, 9, 902–910. [Google Scholar] [CrossRef]
  42. Agnihotri, S.; Mukherji, S.; Mukherji, S. Size-controlled silver nanoparticles synthesized over the range 5–100 nm using the same protocol and their antibacterial efficacy. RSC Adv. 2014, 4, 3974–3983. [Google Scholar] [CrossRef]
  43. Becke, A.D. A new mixing of Hartree–Fock and local density-functional theories. J. Chem. Phys. 1993, 98, 1372–1377. [Google Scholar] [CrossRef]
  44. Lee, C.; Yang, W.; Parr, R.G. Development of the Colle-Salvetti correlation-energy formula into a functional of the electron density. Phys. Rev. B 1988, 37, 785–789. [Google Scholar] [CrossRef]
  45. Parr, R.G. Density Functional Theory of Atoms and Molecules. In Horizons of Quantum Chemistry, Proceedings of the Third International Congress of Quantum Chemistry, Kyoto, Japan, 29 October–3 November 1979; Fukui, K., Pullman, B., Eds.; Springer: Dordrecht, The Netherlands, 1980; pp. 5–15. [Google Scholar]
  46. García-Ramos, J.V.; Sánchez-Cortés, S. Metal colloids employed in the SERS of biomolecules: Activation when exciting in the visible and near-infrared regions. J. Mol. Struct. 1997, 405, 13–28. [Google Scholar] [CrossRef]
  47. Kämmer, E.; Dörfer, T.; Csáki, A.; Schumacher, W.; Da Costa Filho, P.A.; Tarcea, N.; Fritzsche, W.; Rösch, P.; Schmitt, M.; Popp, J. Evaluation of Colloids and Activation Agents for Determination of Melamine Using UV-SERS. J. Phys. Chem. C 2012, 116, 6083–6091. [Google Scholar] [CrossRef] [PubMed]
  48. Sánchez-Cortés, S.; García-Ramos, J.V.; Morcillo, G. Morphological Study of Metal Colloids Employed as Substrate in the SERS Spectroscopy. J. Colloid Interface Sci. 1994, 167, 428–436. [Google Scholar] [CrossRef]
  49. Han, X.X.; Huang, G.G.; Zhao, B.; Ozaki, Y. Label-Free Highly Sensitive Detection of Proteins in Aqueous Solutions Using Surface-Enhanced Raman Scattering. Anal. Chem. 2009, 81, 3329–3333. [Google Scholar] [CrossRef] [PubMed]
  50. Alvarez-Puebla, R.A.; Arceo, E.; Goulet, P.J.; Garrido, J.J.; Aroca, R.F. Role of nanoparticle surface charge in surface-enhanced Raman scattering. J. Phys. Chem. B 2005, 109, 3787–3792. [Google Scholar] [CrossRef] [PubMed]
  51. Mikac, L.; Ivanda, M.; Gotić, M.; Mihelj, T.; Horvat, L. Synthesis and characterization of silver colloidal nanoparticles with different coatings for SERS application. J. Nanoparticle Res. 2014, 16, 2748. [Google Scholar] [CrossRef]
  52. Osawa, Y.; Kanamori, H.; Seki, E.; Hoshi, M.; Ohtaki, H.; Yasuda, Y.; Ito, H.; Suetsugu, A.; Nagaki, M.; Moriwaki, H.; et al. l-Tryptophan-mediated Enhancement of Susceptibility to Nonalcoholic Fatty Liver Disease Is Dependent on the Mammalian Target of Rapamycin. J. Biol. Chem. 2011, 286, 34800–34808. [Google Scholar] [CrossRef]
  53. Badawy, A.A.-B.; Morgan, C.J.; Llewelyn, M.B.; Albuquerque, S.R.J.; Farmer, A. Heterogeneity of serum tryptophan concentration and availability to the brain in patients with the chronic fatigue syndrome. J. Psychopharmacol. 2005, 19, 385–391. [Google Scholar] [CrossRef] [PubMed]
  54. Tu, Q.; Eisen, J.; Chang, C. Surface-enhanced Raman spectroscopy study of indolic molecules adsorbed on gold colloids. J. Biomed. Opt. 2010, 15, 020512. [Google Scholar] [CrossRef]
  55. Politzer, P.; Truhlar, D.G. Chemical Application of Atomic and Molecular Electrostatic Potentials; Springer: Boston, MA, USA, 1981. [Google Scholar]
  56. Fan, M.; Lu, D.; You, R.; Chen, C.; Lu, Y.; Wu, Y.; Shen, H.; Feng, S. Highly sensitive detection of tryptophan (Trp) in serum based on diazo-reaction coupling with Surface-Enhanced Raman Scattering and colorimetric assay. Anal. Chim. Acta 2020, 1119, 52–59. [Google Scholar] [CrossRef]
  57. Madzharova, F.; Heiner, Z.; Kneipp, J. Surface Enhanced Hyper-Raman Scattering of the Amino Acids Tryptophan, Histidine, Phenylalanine, and Tyrosine. J. Phys. Chem. C 2017, 121, 1235–1242. [Google Scholar] [CrossRef]
  58. Lee, D.; Hussain, S.; Yeo, J.; Pang, Y. Adsorption of dipeptide L-alanyl-L-tryptophan on gold colloidal nanoparticles studied by surface-enhanced Raman spectroscopy. Spectrochim. Acta Part A Mol. Biomol. Spectrosc. 2021, 247, 119064. [Google Scholar] [CrossRef] [PubMed]
  59. Gautam, R.; Vanga, S.; Ariese, F.; Umapathy, S. Review of multidimensional data processing approaches for Raman and infrared spectroscopy. EPJ Tech. Instrum. 2015, 2, 8. [Google Scholar] [CrossRef] [Green Version]
Figure 1. Electronic absorption spectra for pure and activated (using different activating agents as mentioned) (A) sodium citrate reduced silver nanoparticles (Ag1)—top panel and (B) sodium borohydride reduced silver nanoparticles (Ag2)—bottom panel. The pH values of different solutions are mentioned on the label of each graph.
Photonics 09 00648 g001
Figure 2. Illustration of the SERS mechanism using Ag colloids and activating agents.
Photonics 09 00648 g002
Figure 3. Surface-enhanced Raman spectra of Tryptophan at indicated concentrations using (A) sodium citrate (Ag1) and (B) sodium borohydride (Ag2) reduced silver nanoparticles activated with acidic KCl solution and compared with the spectrum of pure Trp powder and 0.1 M aqueous solution.
Photonics 09 00648 g003
Figure 4. (A) Molecular electrostatic potential mapped on the isodensity surface for L-tryptophan calculated at the B3LYP/6-311++G (d,p) level of theory. Optimized structure for (B) Tryptophan with one silver-atom and (C) Tryptophan with a cluster of silver-atoms.
Photonics 09 00648 g004
Figure 5. The comparison of theoretical and experimentally observed spectra for L-tryptophan.
Photonics 09 00648 g005
Figure 6. (A) schematic of the lab-on-a-chip (LOC) setup. (B) SERS spectra for Tryptophan using Ag1 colloids obtained with LOC system from ten different drops.
Photonics 09 00648 g006
Publisher’s Note: MDPI stays neutral with regard to jurisdictional claims in published maps and institutional affiliations.

