Partial Amplification of Octave-Spanning Supercontinuum in the Spectral Region of 1.5–2.2 μm

 , ,
, ,
Abstract
:1. Introduction
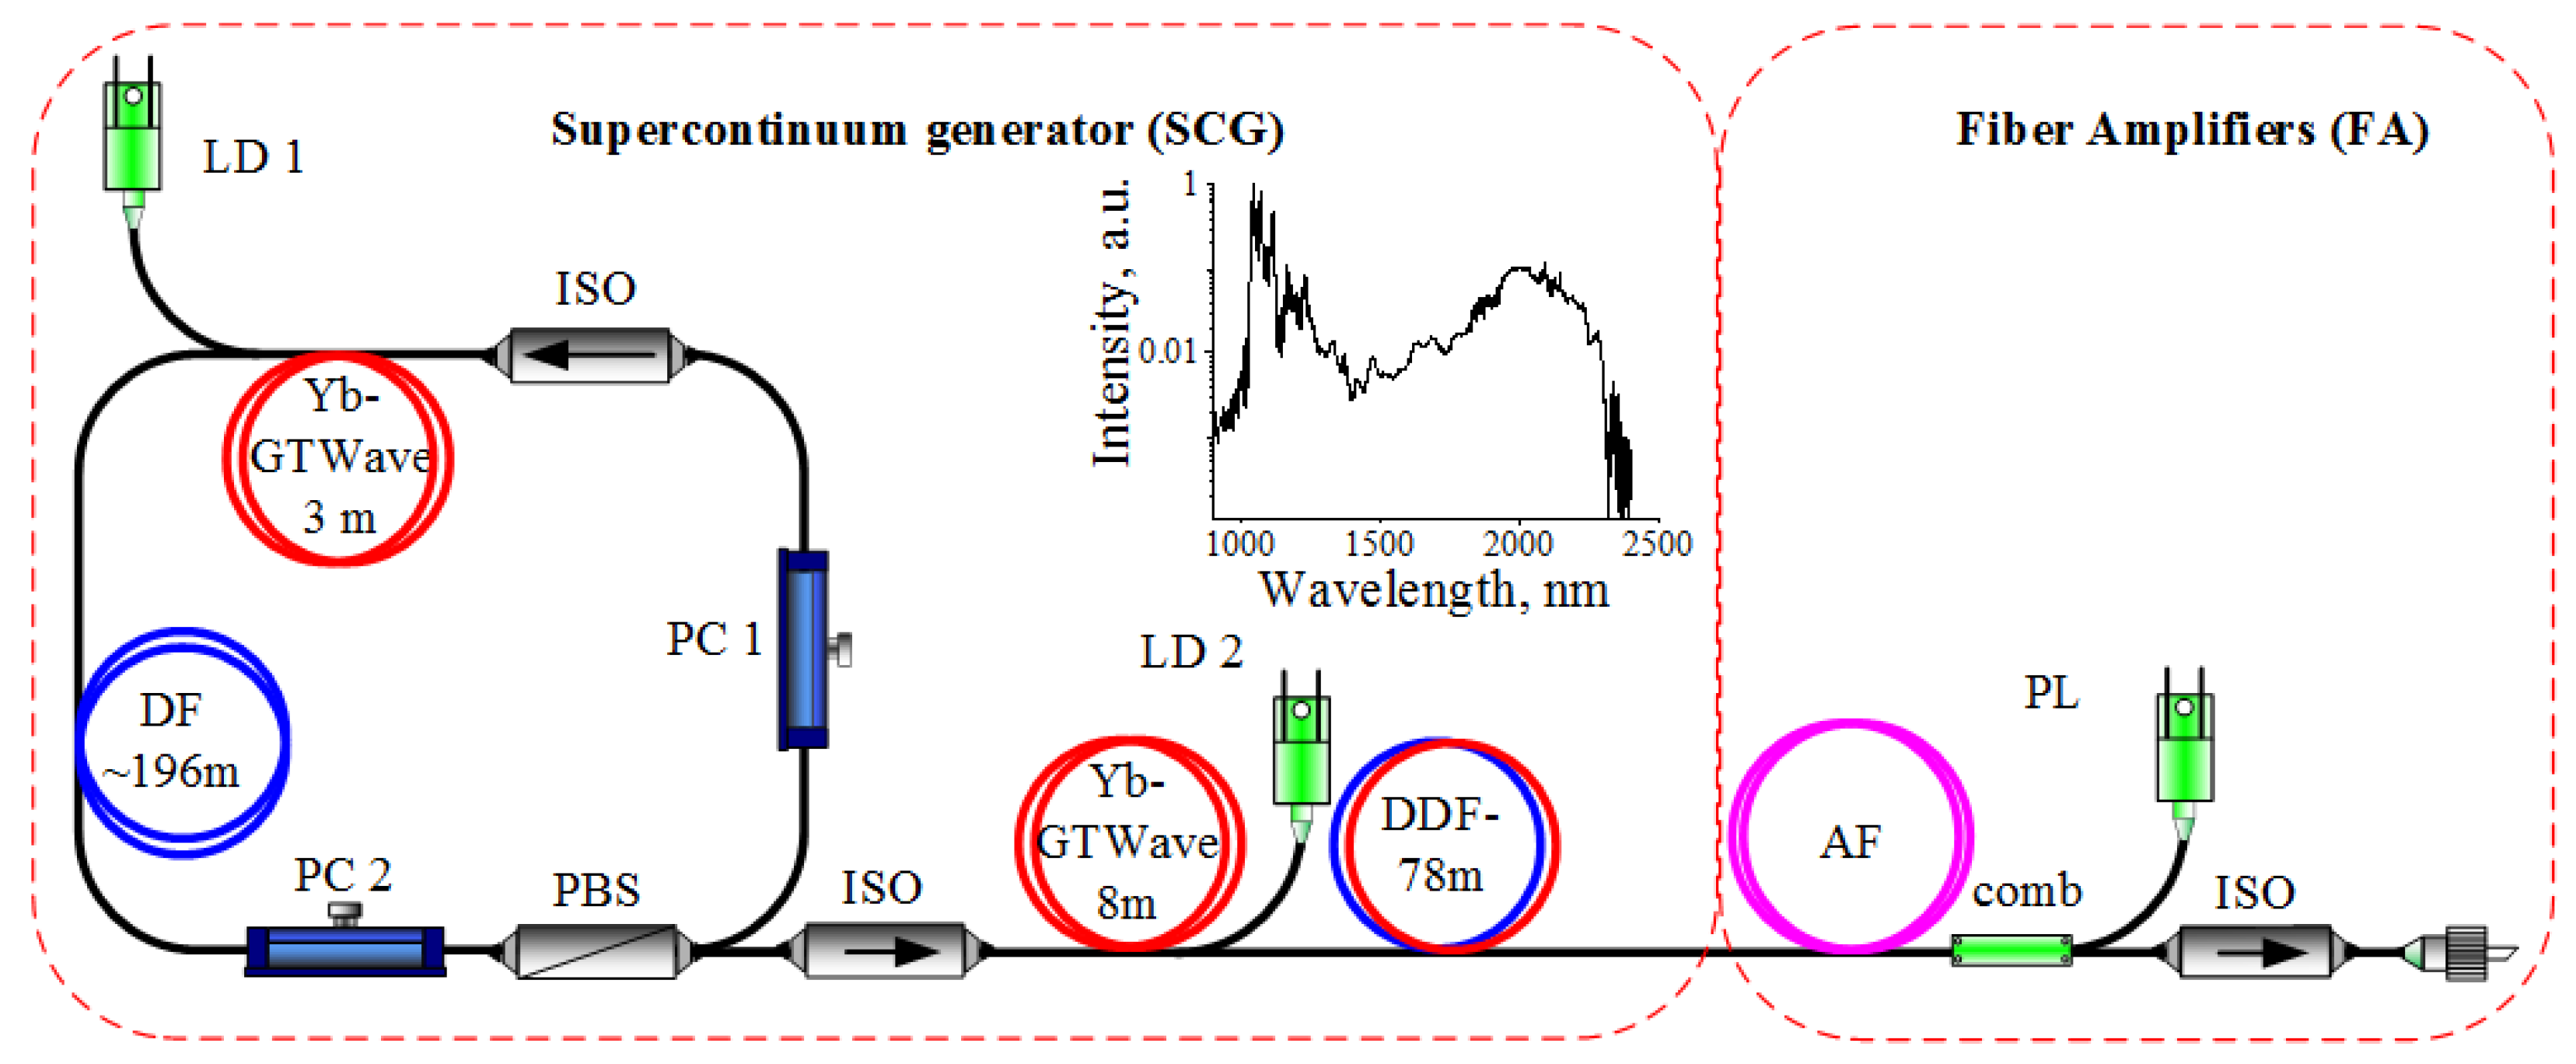
2. Materials and Methods
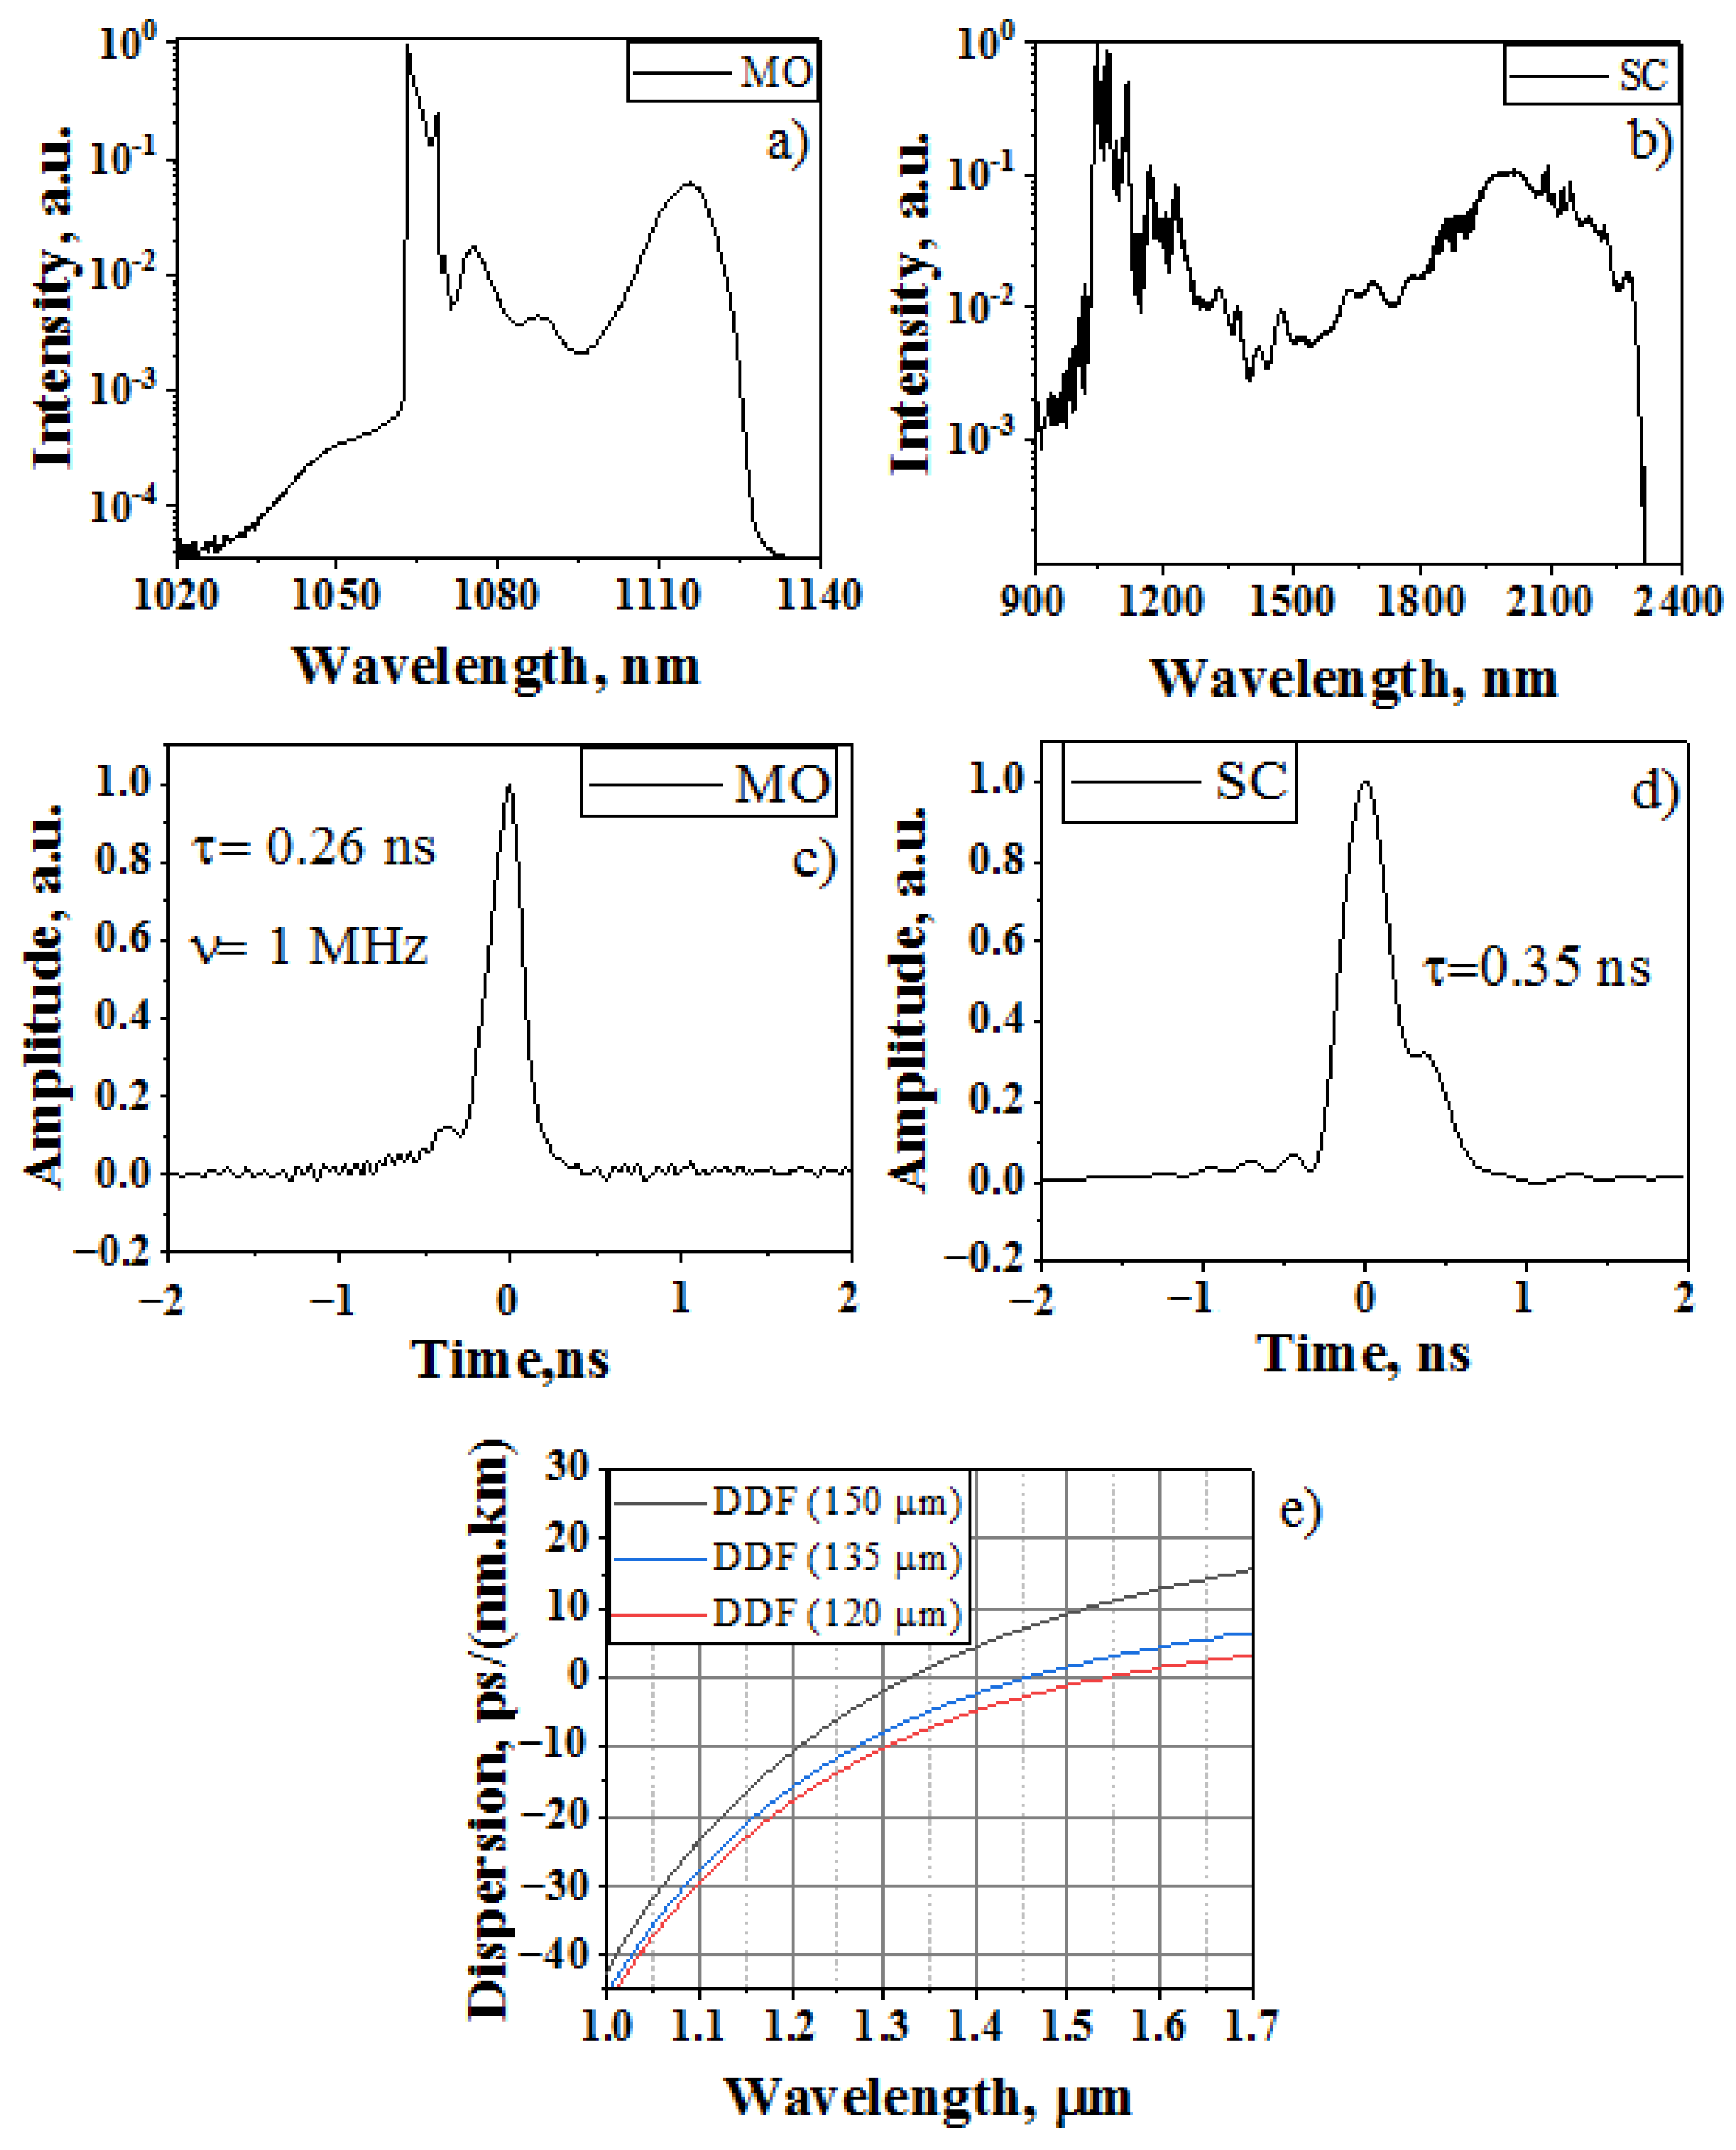
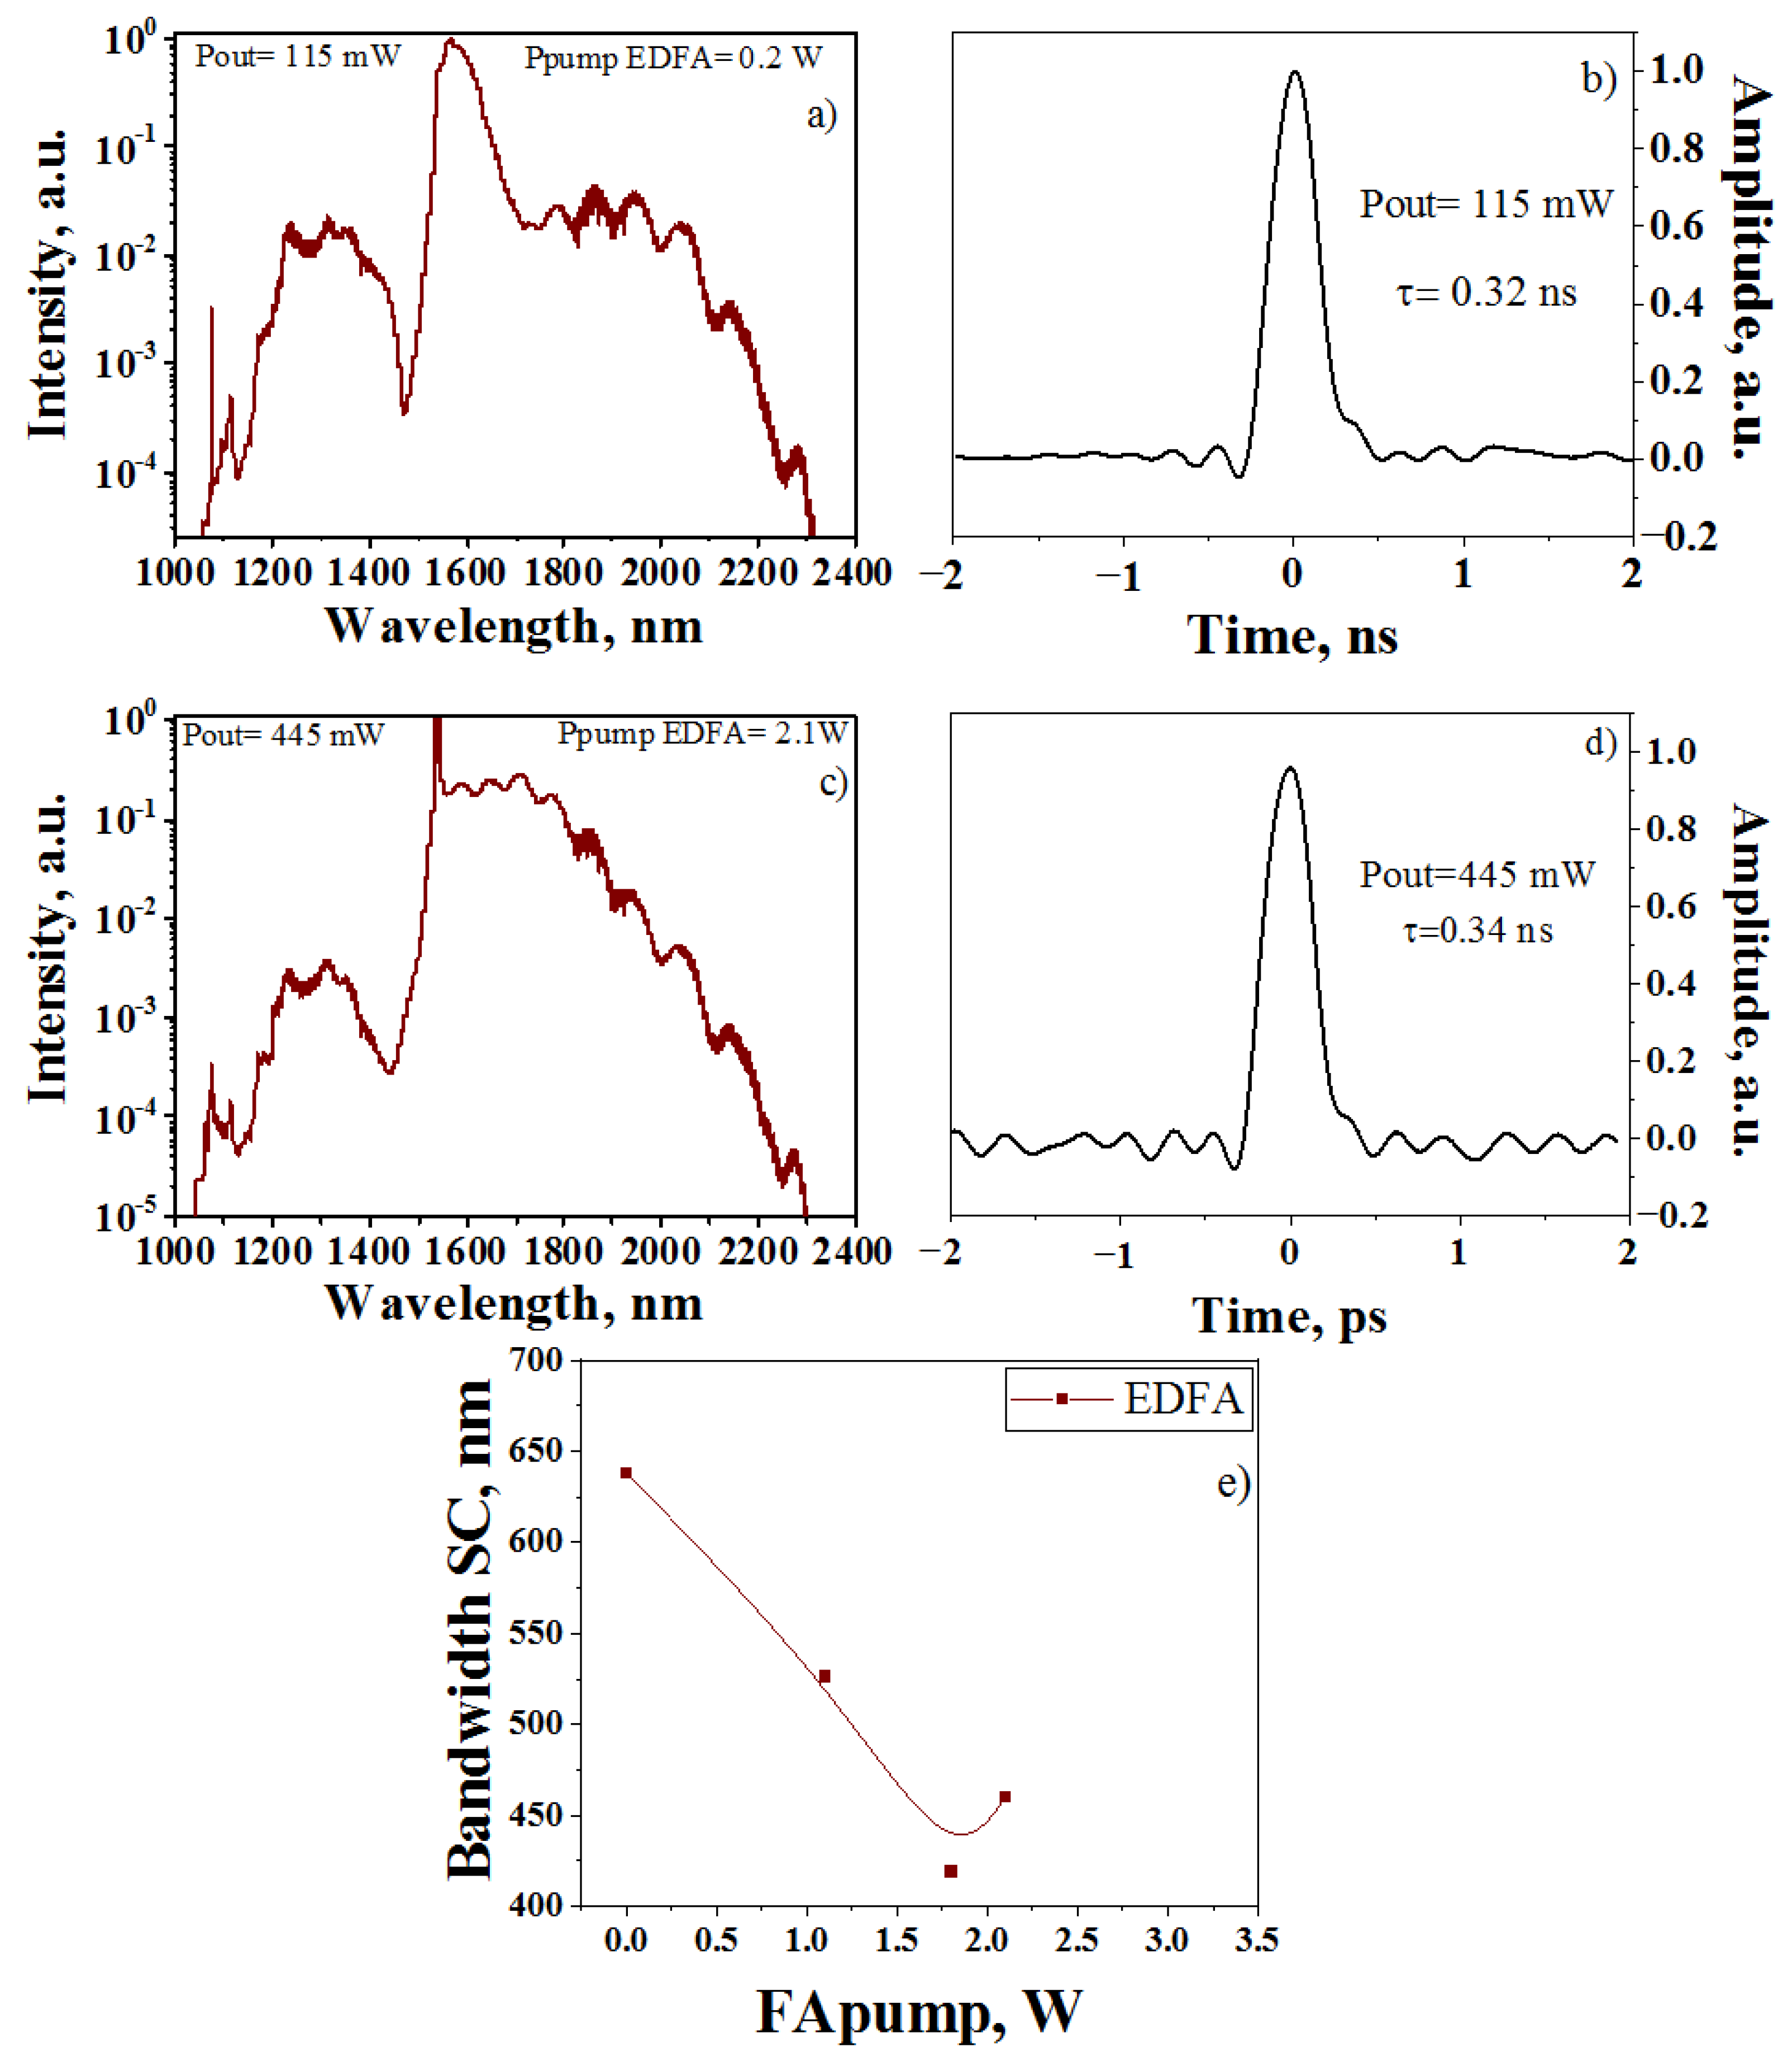
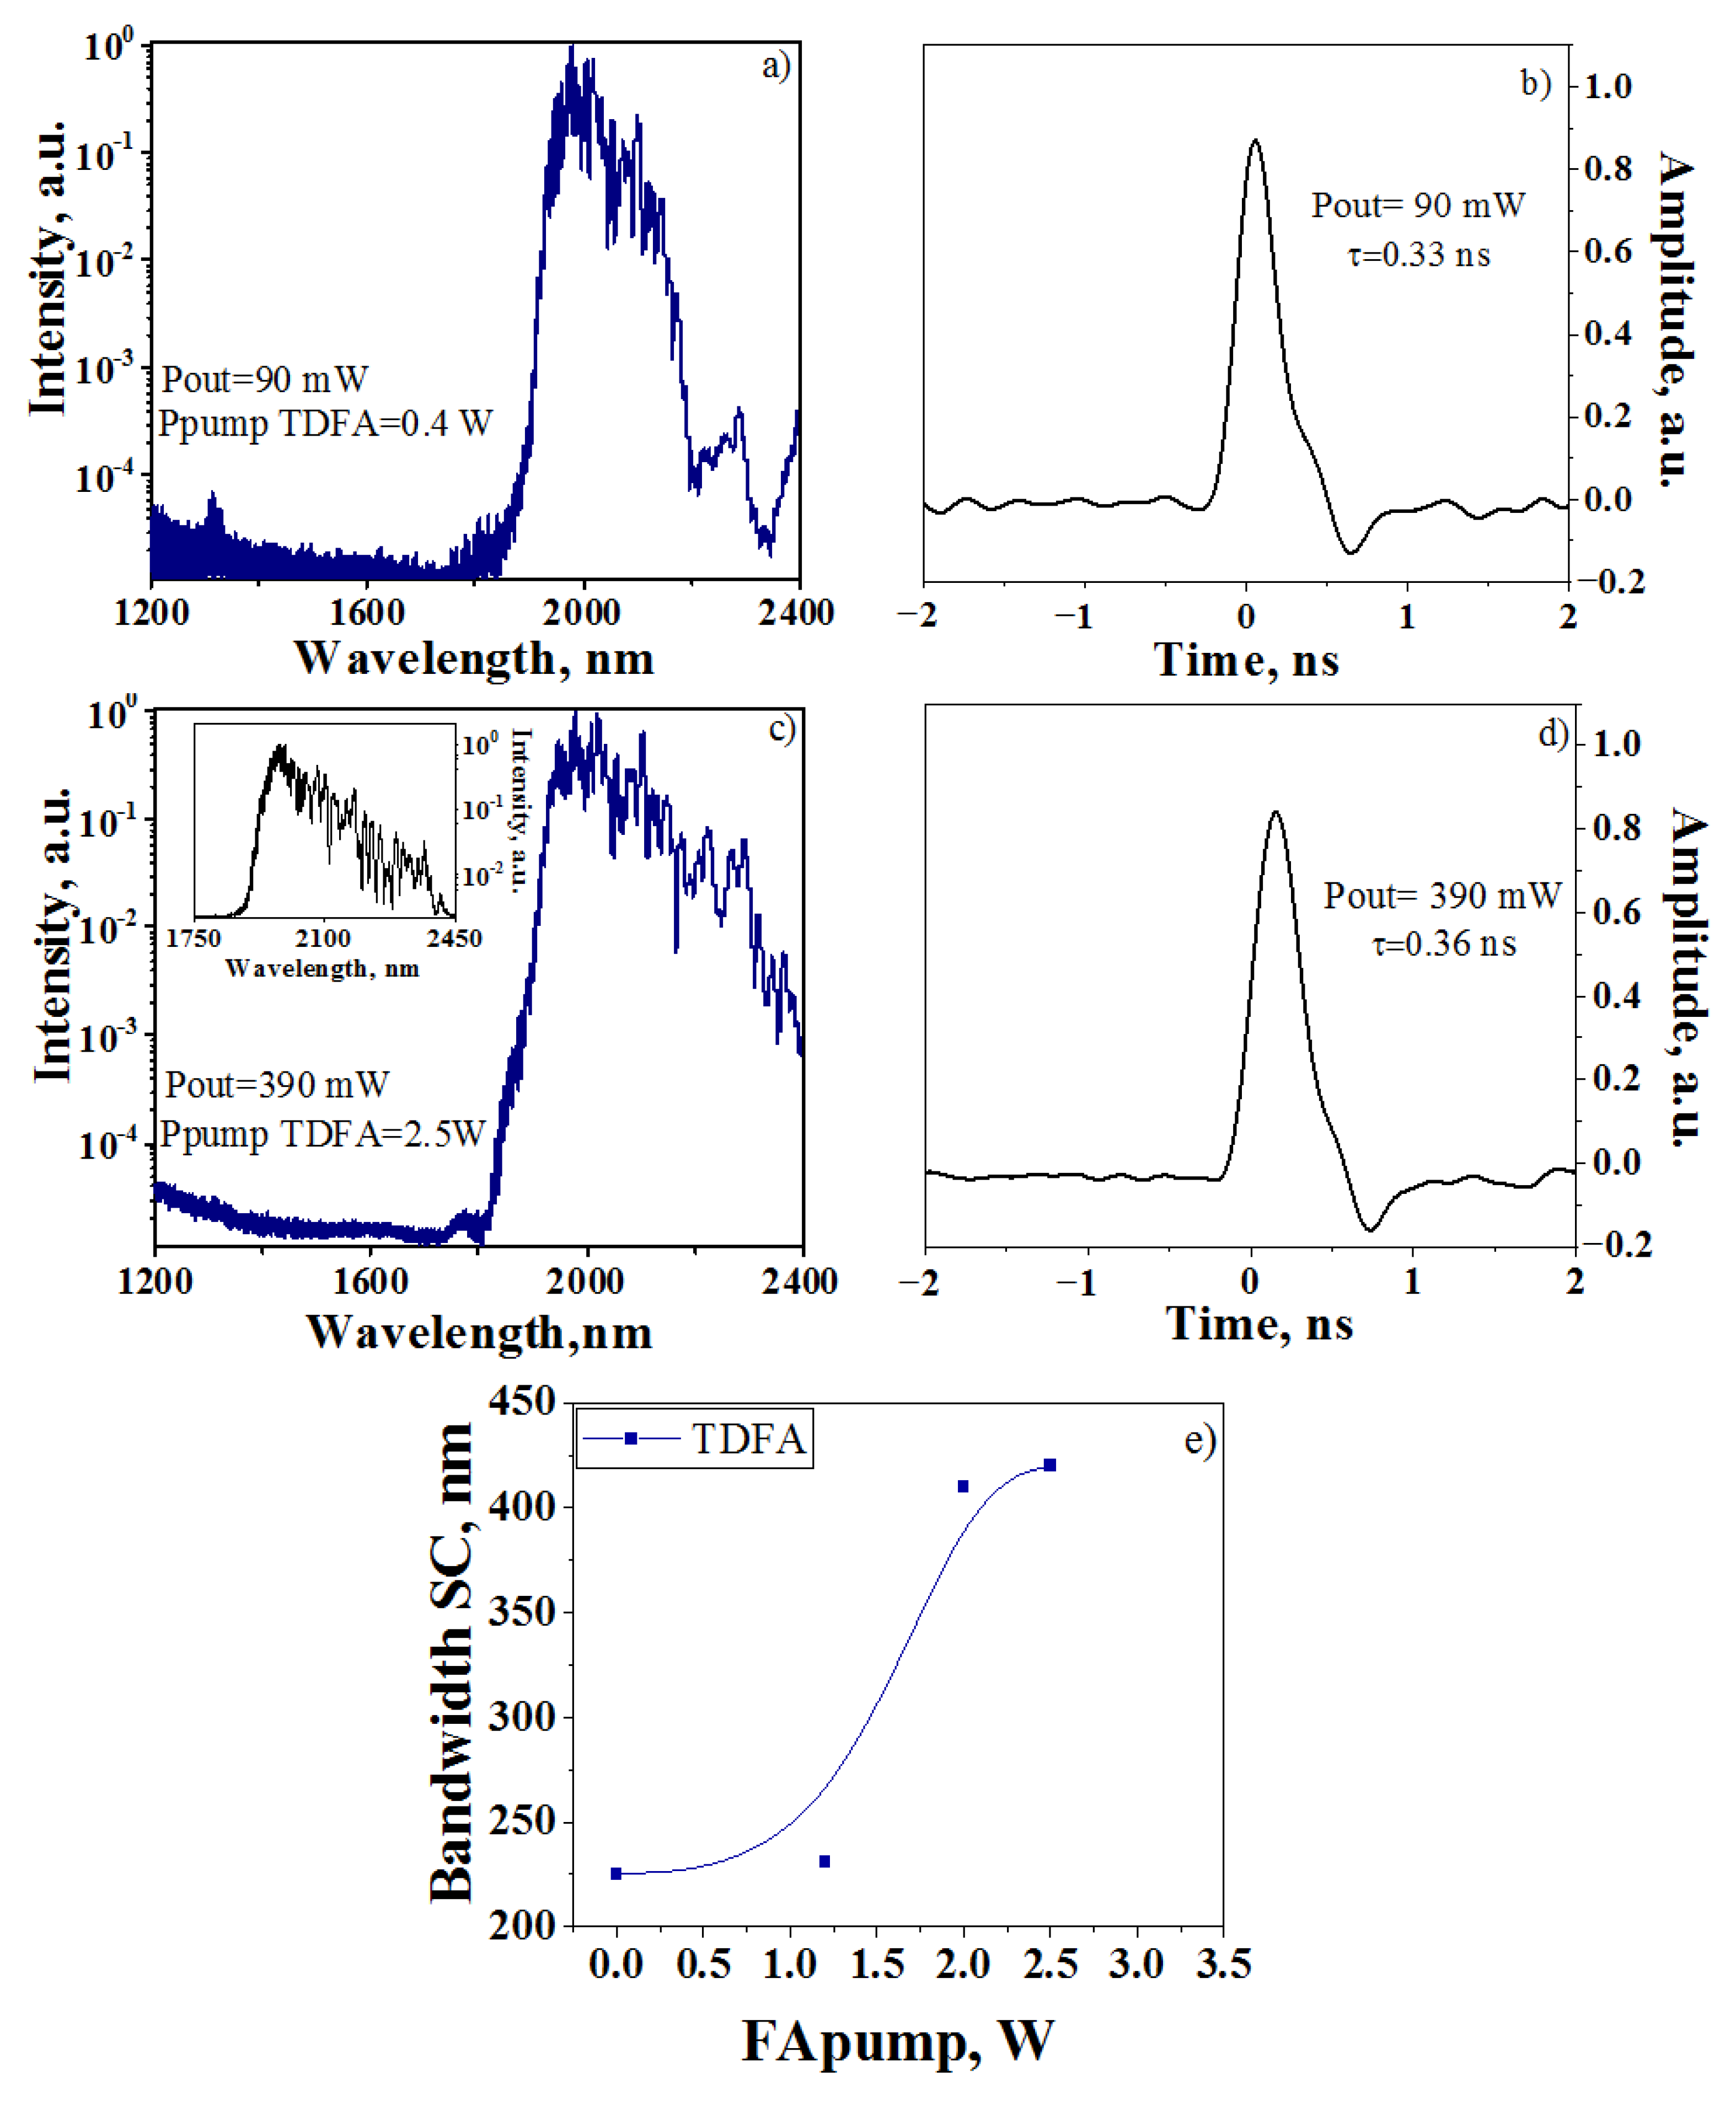
3. Results
4. Conclusions
Author Contributions
Funding
Institutional Review Board Statement
Informed Consent Statement
Data Availability Statement
Conflicts of Interest
References
- Takara, H.; Ohara, T.; Mori, K.; Sato, K.; Yamada, E.; Inoue, Y.; Shibata, T.; Abe, M.; Morioka, T.; Sato, K.-I. More than 1000 Channel Optical Frequency Chain Generation from Single Supercontinuum Source with 12.5 GHz Channel Spacing. Electron. Lett. 2000, 36, 2089. [Google Scholar] [CrossRef]
- Dupont, S.; Petersen, C.; Thøgersen, J.; Agger, C.; Bang, O.; Keiding, S.R. IR Microscopy Utilizing Intense Supercontinuum Light Source. Opt. Express 2012, 20, 4887. [Google Scholar] [CrossRef] [PubMed] [Green Version]
- Seddon, A.B. Mid-Infrared (IR)—A Hot Topic: The Potential for Using Mid-IR Light for Non-Invasive Early Detection of Skin Cancerin Vivo. Phys. Status Solidi B 2013, 250, 1020–1027. [Google Scholar] [CrossRef]
- Crotti, C.; Deloison, F.; Alahyane, F.; Aptel, F.; Kowalczuk, L.; Legeais, J.-M.; Peyrot, D.A.; Savoldelli, M.; Plamann, K. Wavelength Optimization in Femtosecond Laser Corneal Surgery. Investig. Ophthalmol. Vis. Sci. 2013, 54, 3340. [Google Scholar] [CrossRef]
- Delahaye, T.; Maxwell, S.E.; Reed, Z.D.; Lin, H.; Hodges, J.T.; Sung, K.; Devi, V.M.; Warneke, T.; Spietz, P.; Tran, H. Precise Methane Absorption Measurements in the 1.64 Μm Spectral Region for the MERLIN Mission. J. Geophys. Res. Atmos. 2016, 121, 7360–7370. [Google Scholar] [CrossRef]
- Bartlome, R.; Sigrist, M.W. Laser-Based Human Breath Analysis: D/H Isotope Ratio Increase Following Heavy Water Intake. Opt. Lett. 2009, 34, 866. [Google Scholar] [CrossRef] [PubMed]
- Filatova, S.A.; Kamynin, V.A.; Ryabova, A.V.; Loshchenov, V.B.; Zelenkov, P.V.; Zolotovskii, I.O.; Tsvetkov, V.B.; Kurkov, A.S. Impact of Holmium Fibre Laser Radiation (λ = 2.1 Μm) on the Spinal Cord Dura Mater and Adipose Tissue. Quantum Electron. 2015, 45, 781–784. [Google Scholar] [CrossRef]
- Kopyeva, M.S.; Filatova, S.A.; Kamynin, V.A.; Chekhlova, T.K.; Tsvetkov, V.B. Comparison of Continuous Wave and Ultrashort Pulsed Holmium-doped Fiber Lasers Exposure on Ex-vivo Tissue. In Proceedings of the 2021 Conference on Lasers and ElectroOptics Europe & European Quantum Electronics Conference (CLEO/Europe-EQEC), Munich, Germany, 20–24 June 2021; IEEE: New York, NY, USA, 2021; p. 1. [Google Scholar] [CrossRef]
- He, J.; Song, R.; Tao, Y.; Hou, J. Supercontinuum Generation Directly from a Random Fiber Laser Based on Photonic Crystal Fiber. Opt. Express 2020, 28, 27308. [Google Scholar] [CrossRef]
- Eslami, Z.; Ryczkowski, P.; Salmela, L.; Genty, G. Low-Noise Octave-Spanning Mid-Infrared Supercontinuum Generation in a Multimode Chalcogenide Fiber. Opt. Lett. 2020, 45, 3103. [Google Scholar] [CrossRef]
- Abrardi, L.; Martín-López, S.; Carrasco-Sanz, A.; Corredera, P.; Hernanz, M.; González-Herráez, M. Optimized all-fiber supercontinuum source at1.3 μm generated in a stepwise dispersion-decreasing-fiber arrangement. J. Lightw. Technol. 2007, 25, 2098–2102. [Google Scholar] [CrossRef]
- Kamynin, V.A.; Kurkov, A.S.; Mashinsky, V.M. Supercontinuum Generation up to 2.7 Μm in the Germanate-Glass-Core and Silica-Glass-Cladding Fiber. Laser Phys. Lett. 2012, 9, 219–222. [Google Scholar] [CrossRef]
- Kamynin, V.A.; Bednyakova, A.E.; Fedoruk, M.P.; Volkov, I.A.; Nishchev, K.N.; Kurkov, A.S. Supercontinuum Generation beyond 2 µm in GeO2Fiber: Comparison of Nano- and Femtosecond Pumping. Laser Phys. Lett. 2015, 12, 065101. [Google Scholar] [CrossRef]
- Ciret, C.; Gorza, S.-P.; Husko, C.; Roelkens, G.; Kuyken, B.; Leo, F. Physical Origin of Higher-Order Soliton Fission in Nanophotonic Semiconductor Waveguides. Sci. Rep. 2018, 8, 17177. [Google Scholar] [CrossRef]
- Dolg, M.; Stoll, H. Handbook on the physics and chemistry of rare earths. Z. Fur Krist. Cryst. Mater. 1995, 22, 976–977. [Google Scholar]
- Lei, C.; Song, R.; Chen, Z.; Pu, D.; Hou, J. Supercontinuum Generation in an Ytterbium-Doped Fiber Amplifier with Cascaded Double-Clad Passive Fiber Tapers. IEEE Photonics J. 2017, 9, 1–10. [Google Scholar] [CrossRef]
- Kida, Y.; Imasaka, T. Optical Parametric Amplification of a Supercontinuum in a Gas. Appl. Phys. B 2013, 116, 673–680. [Google Scholar] [CrossRef]
- Lin, K.-H.; Lin, J.-H. Amplification of Supercontinuum by Semiconductor and Er-Doped Fiber Optical Amplifiers. Laser Phys. Lett. 2008, 5, 449–453. [Google Scholar] [CrossRef]
- Malinowski, M.; Tremblay, J.-E.; Gonzalez, G.F.C.; Rao, A.; Khan, S.; Hsu, P.-K.; Yadav, A.; Richardson, K.A.; Delfyett, P.; Wu, M.C.; et al. Amplified Octave-Spanning Supercontinuum from Chalcogenide Waveguides for Second-Harmonic Generation. In Proceedings of the 2017 IEEE Photonics Conference (IPC), Orlando, FL, USA, 1–5 October 2017; IEEE: New York, NY, USA, 2017. [Google Scholar] [CrossRef]
- Zhluktova, I.V.; Filatova, S.A.; Trikshev, A.I.; Kamynin, V.A.; Tsvetkov, V.B. All-Fiber 1125 Nm Spectrally Selected Subnanosecond Source. Appl. Opt. 2020, 59, 9081. [Google Scholar] [CrossRef]
- Bogatyrev, V.A.; Bubnov, M.M.; Dianov, E.M.; Kurkov, A.S.; Mamyshev, P.V.; Prokhorov, A.M.; Rumyantsev, S.D.; Semenov, V.A.; Semenov, S.L.; Sysoliatin, A.A.; et al. A Single-Mode Fiber with Chromatic Dispersion Varying along the Length. J. Lightwave Technol. 1991, 9, 561–566. [Google Scholar] [CrossRef] [Green Version]
- Mostofi, A.; Hatami-Hanza, H.; Chu, P.L. Optimum Dispersion Profile for Compression of Fundamental Solitons in Dispersion Decreasing Fibers. IEEE J. Quantum Electron. 1997, 33, 620–628. [Google Scholar] [CrossRef]
- Kharenko, D.S.; Efremov, V.D.; Evmenova, E.A.; Babin, S.A. Generation of Raman Dissipative Solitons near 13 Microns in a Phosphosilicate-Fiber Cavity. Opt. Express 2018, 26, 15084. [Google Scholar] [CrossRef] [PubMed]
- Chernikov, S.V.; Richardson, D.J.; Dianov, E.M.; Payne, D.N. Picosecond Soliton Pulse Compressor Based on Dispersion Decreasing Fibre. Electron. Lett. 1992, 28, 1842. [Google Scholar] [CrossRef] [Green Version]
- Gordon, J.P. Theory of the Soliton Self-Frequency Shift. Opt. Lett. 1986, 11, 662. [Google Scholar] [CrossRef] [PubMed]
- Gauthier, J.-C.; Fortin, V.; Carrée, J.-Y.; Poulain, S.; Poulain, M.; Vallée, R.; Bernier, M. Mid-IR Supercontinuum from 24 to 54 Μm in a Low-Loss Fluoroindate Fiber. Opt. Lett. 2016, 41, 1756. [Google Scholar] [CrossRef]
- Li, B.; Chen, S. Experimental Research of Supercontinuum Generation in a 1030nm Fiber Amplifier. In Proceedings of the 24th National Laser Conference & Fifteenth National Conference on Laser Technology and Optoelectronics, Shanghai, China, 2 December 2020. [Google Scholar] [CrossRef]
- Ryabochkina, P.A.; Chabushkin, A.N.; Kosolapov, A.F.; Kurkov, A.S. Absorption and Luminescence Characteristics of 5I7↔5I8 Transitions of the Holmium Ion in Ho3+-Doped Aluminosilicate Preforms and Fibres. Quantum Electron. 2015, 45, 102–104. [Google Scholar] [CrossRef]
- Krupa, K.; Louot, C.; Couderc, V.; Fabert, M.; Guenard, R.; Shalaby, B.M.; Tonello, A.; Pagnoux, D.; Leproux, P.; Bendahmane, A.; et al. Spatiotemporal Characterization of Supercontinuum Extending from the Visible to the Mid-Infrared in a Multimode Graded-Index Optical Fiber. Opt. Lett. 2016, 41, 5785. [Google Scholar] [CrossRef] [PubMed] [Green Version]
- Teğin, U.; Ortaç, B. Cascaded Raman Scattering Based High Power Octave-Spanning Supercontinuum Generation in Graded-Index Multimode Fibers. Sci. Rep. 2018, 8, 12470. [Google Scholar] [CrossRef]
- Wang, H.; Han, H.; Shao, X.; Zhang, Z.; Zhu, J.; Wei, Z. All-Fiber Supercontinuum Source Operating at 1 Μm with Combination of Different PCFs. Appl. Phys. B 2022, 128, 25. [Google Scholar] [CrossRef]
- Qi, X.; Chen, S.; Li, Z.; Liu, T.; Ou, Y.; Wang, N.; Hou, J. High-Power Visible-Enhanced All-Fiber Supercontinuum Generation in a Seven-Core Photonic Crystal Fiber Pumped at 1016 Nm. Opt. Lett. 2018, 43, 1019. [Google Scholar] [CrossRef] [PubMed]
- Aghayari, E.; JamshidiGhaleh, K. High-Power Supercontinuum Generation by Noise-like Pulse Amplification in Yb-Doped Fiber Amplifier Operating in a Nonlinear Regime. Appl. Opt. 2019, 58, 4020. [Google Scholar] [CrossRef] [PubMed]


| Pump, W | Active Fiber Length | Pout, mW | Δλ (−20 dB), nm | Brightest Spectral Range (−10 dB), nm | τ, ns | |
|---|---|---|---|---|---|---|
| Initial SC | - | - | 340 | 1260 | 1040–1166, 1957–2150 | 0.35 |
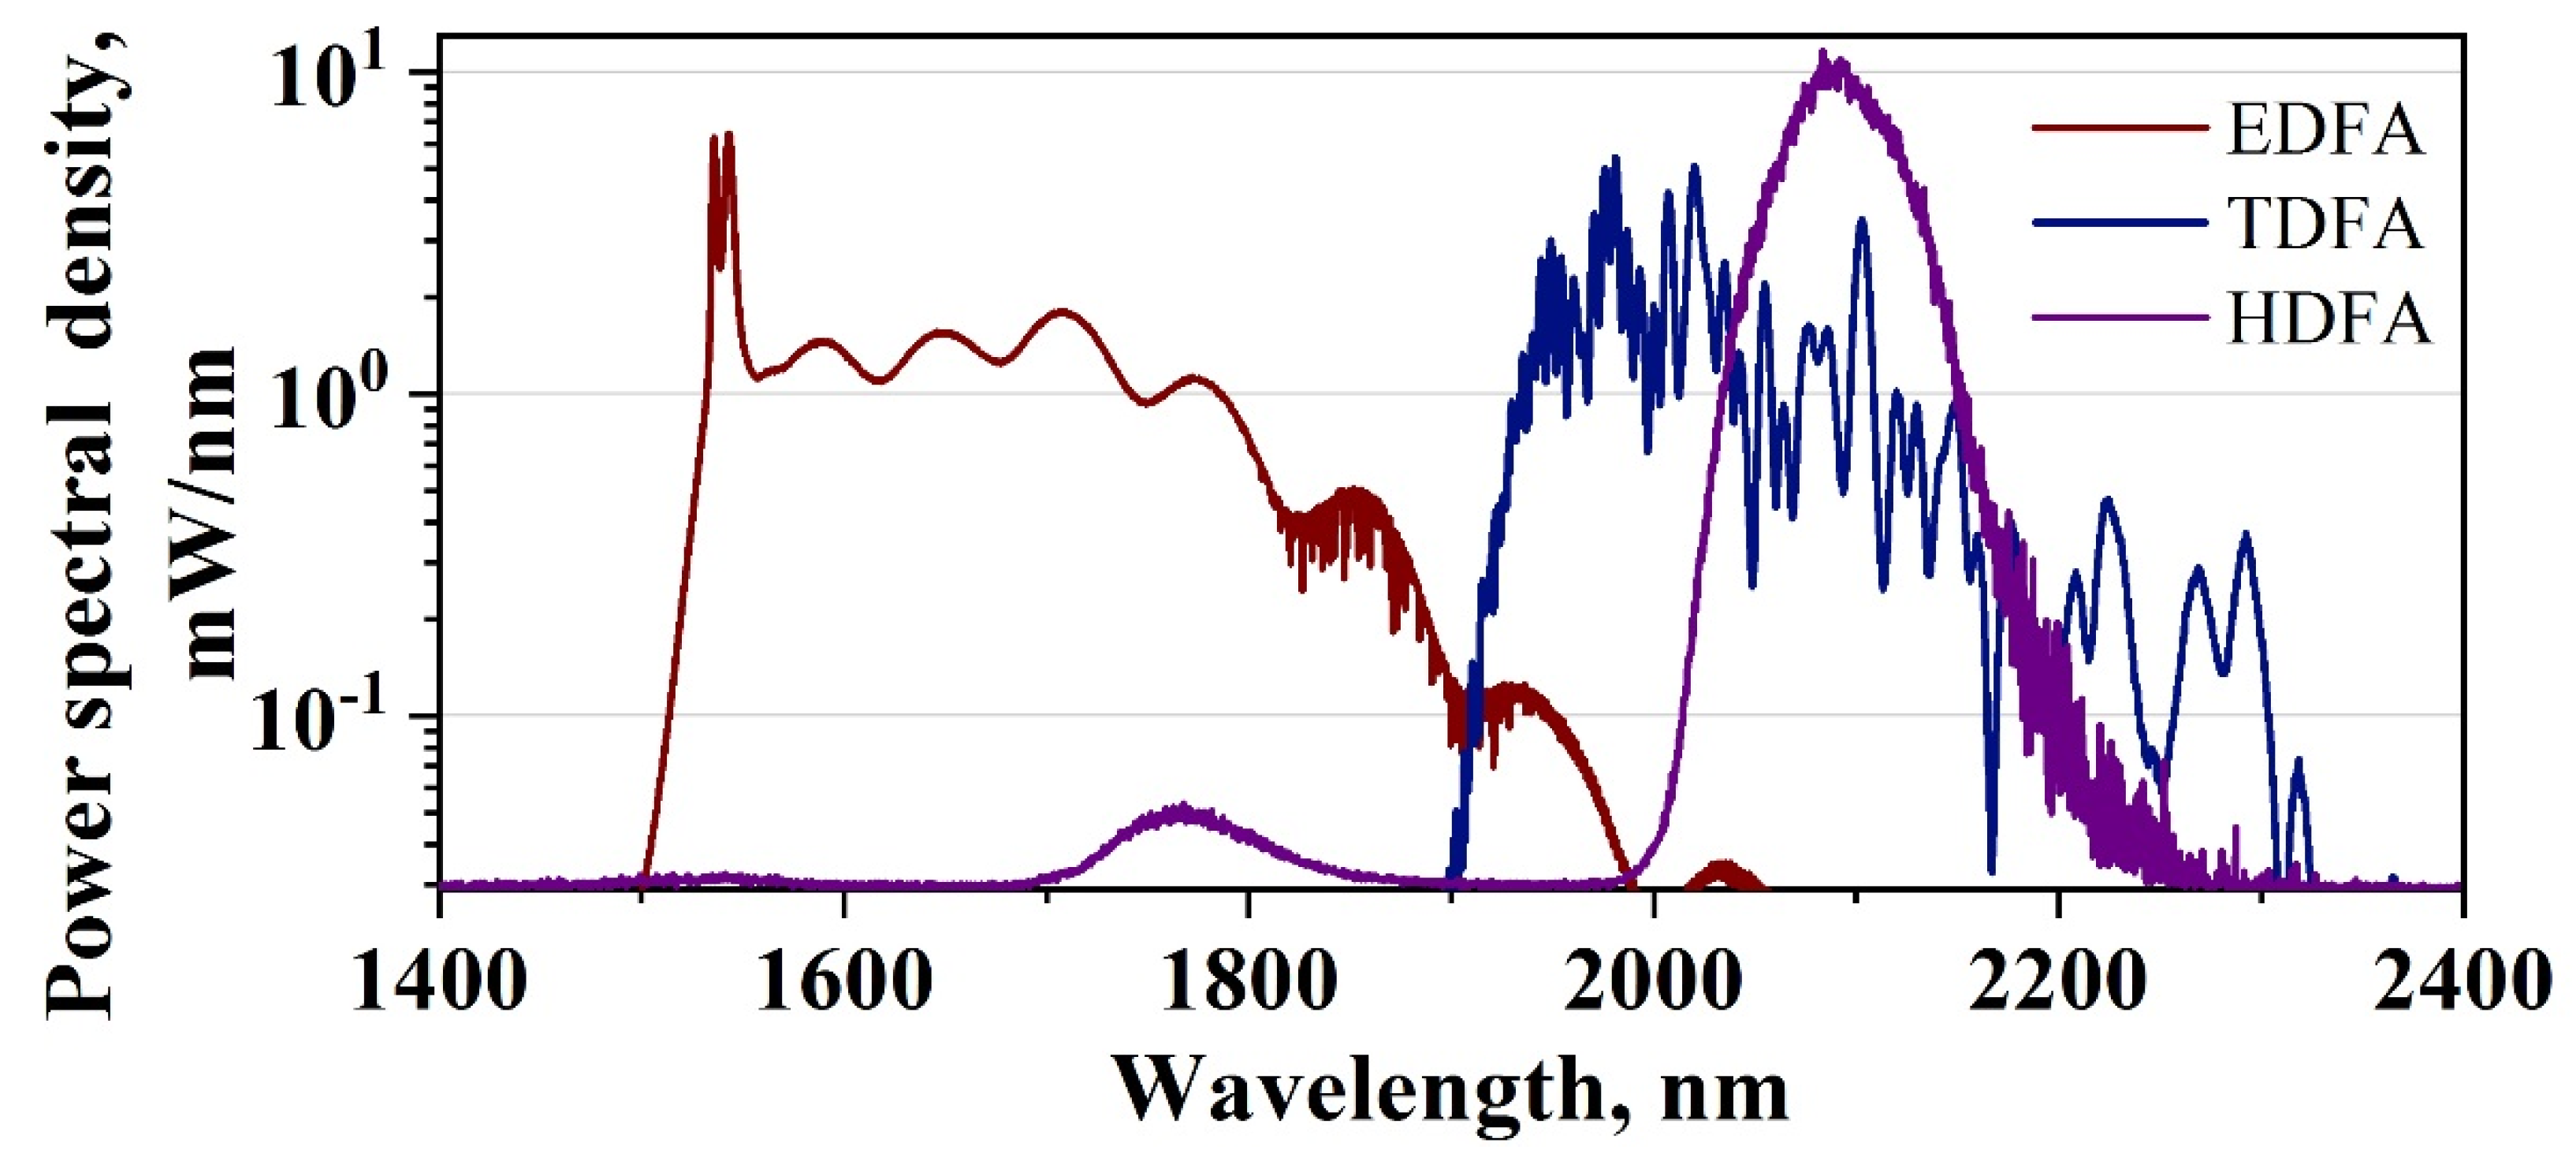
| EDFA | 2.1 | 4 | 445 | 460 | 1530–1800 | 0.34 |
| TDFA | 2.5 | 3.8 | 390 | 420 | 1930–2150 | 0.36 |
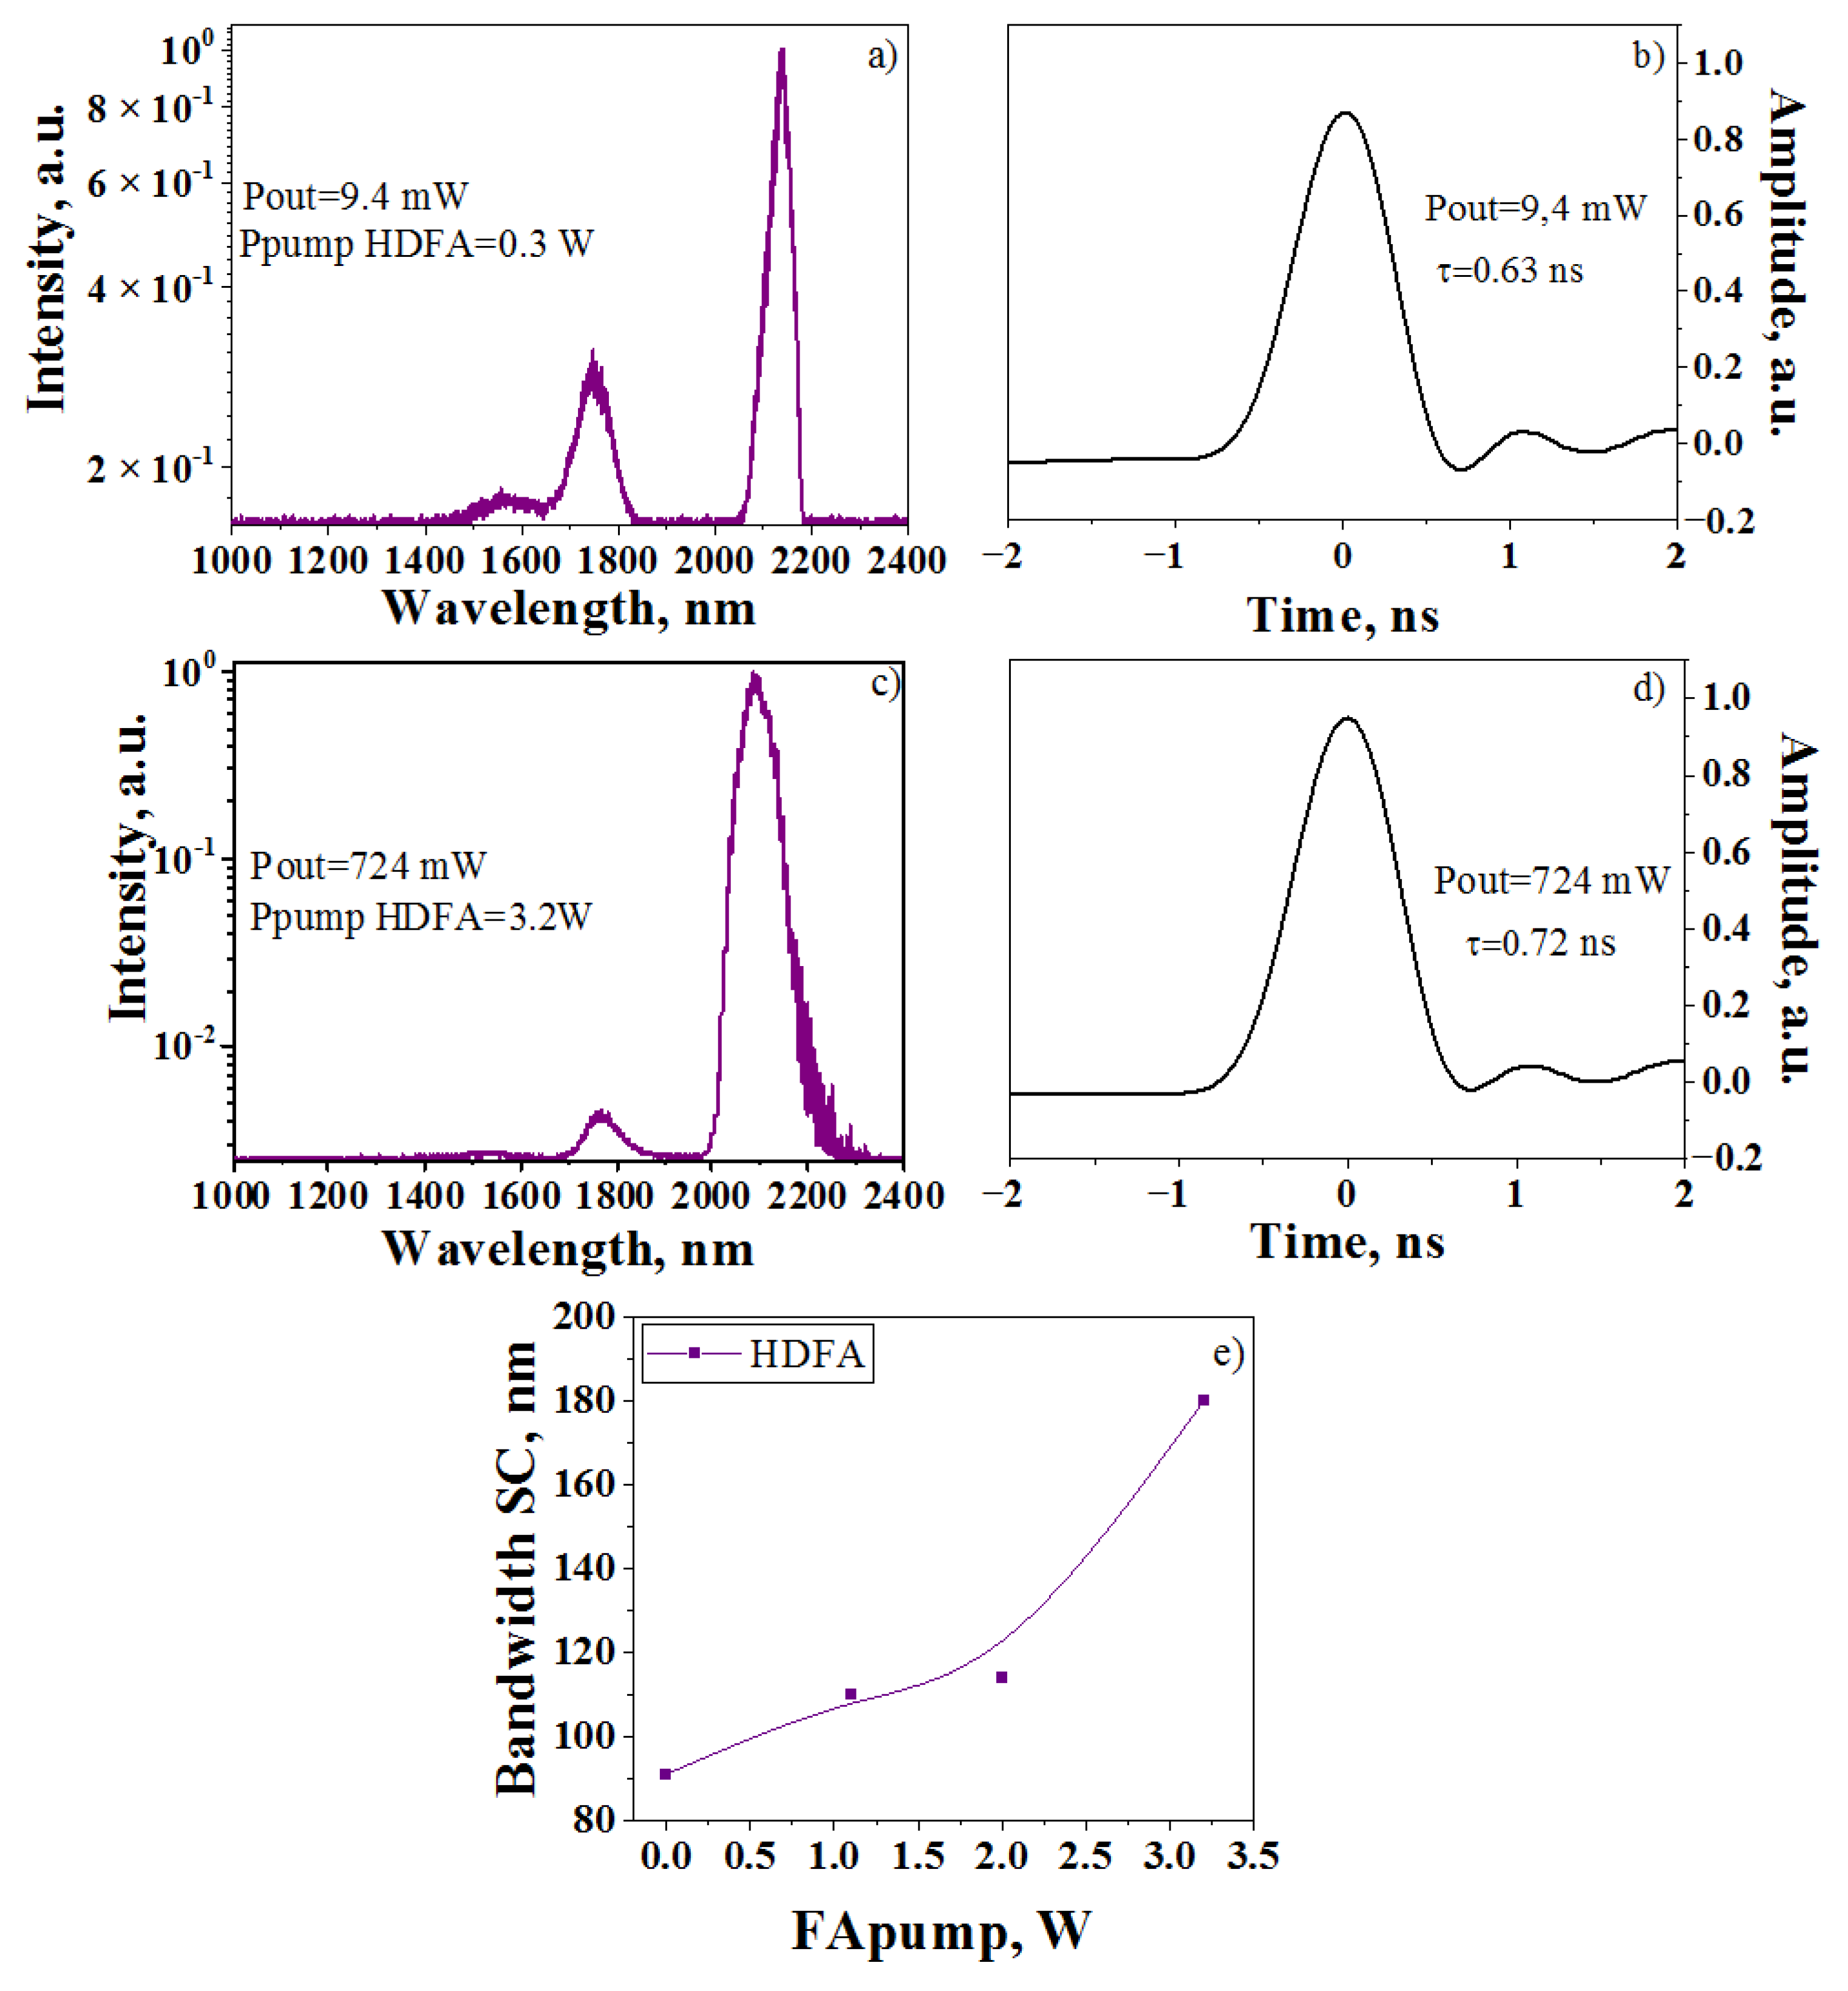
| HDFA | 3.2 | 3 | 724 | 180 | 2040–2150 | 0.72 |
| Octave SC | |||||
|---|---|---|---|---|---|
| Ref. | Pump/Wavelength | Medium | Input Peak Power | Spectral Range (nm) | All-Fiber System |
| [29] | Nd:YAG microchip laser/1064 nm | graded-index MMFs | up to 35 kW | 500–2500 | no |
| [30] | Yb-doped fiber laser/1040 nm | graded-index MMFs | ~30 kW | 700–1700 | no |
| [31] | 1030 nm | PCF | 300–400 W | 800–1240 | yes (highly coherent) |
| [32] | 1016 nm | PCF | 8.8 kW | 350–2400 | yes (used MFA) |
| Our system | Yb-doped fiber laser/1064 nm | DDF | about 1–2 kW | 900–2320 | yes (without MFA) |
| Amplification | |||||
| [33] | Yb-doped fiber laser/1077 nm | DC Yb-doped fiber | about 6.5 kW | 1037–2167 | Yes |
| [18] | SC (460–1550) | Er-doped fiber | - | 1500–1600 | - |
| [19] | SC (900–2400) | Tm-doped fiber | - | 1750–2200 | Yes |
| Our system | SC (900–2320) | Er-doped fiber | about 1.3 kW | 1520–1800 | Yes |
| Tm-doped fiber | 1930–2150 | ||||
| Ho-doped fiber | 2040–2150 | ||||
Publisher’s Note: MDPI stays neutral with regard to jurisdictional claims in published maps and institutional affiliations. |
© 2022 by the authors. Licensee MDPI, Basel, Switzerland. This article is an open access article distributed under the terms and conditions of the Creative Commons Attribution (CC BY) license (https://creativecommons.org/licenses/by/4.0/).
Share and Cite
Zhluktova, I.V.; Zverev, A.D.; Filatova, S.A.; Kamynin, V.A.; Sysoliatin, A.A.; Tsvetkov, V.B. Partial Amplification of Octave-Spanning Supercontinuum in the Spectral Region of 1.5–2.2 μm. Photonics 2022, 9, 397. https://doi.org/10.3390/photonics9060397
Zhluktova IV, Zverev AD, Filatova SA, Kamynin VA, Sysoliatin AA, Tsvetkov VB. Partial Amplification of Octave-Spanning Supercontinuum in the Spectral Region of 1.5–2.2 μm. Photonics. 2022; 9(6):397. https://doi.org/10.3390/photonics9060397
Chicago/Turabian StyleZhluktova, Irina V., Andrei D. Zverev, Serafima A. Filatova, Vladimir A. Kamynin, Alexej A. Sysoliatin, and Vladimir B. Tsvetkov. 2022. "Partial Amplification of Octave-Spanning Supercontinuum in the Spectral Region of 1.5–2.2 μm" Photonics 9, no. 6: 397. https://doi.org/10.3390/photonics9060397