
Projection of Target Drug Particle Size in Oral Formulations Using the Refined Developability Classification System (rDCS)

Abstract
:
1. Introduction
- (i)
- The calculation of the dose-to-solubility (D/S) ratio utilizes a standard dose range (5, 50, and 500 mg) instead of a fixed dose, since in preclinical development the human therapeutic dose has typically not yet been defined.
- (ii)
- The solubility in fasted state human intestinal fluid (FaHIF) is estimated through a correlation between in vitro solubilities in in-house biopredictive media.
- (iii)
- The effective human permeability (Peff) is estimated by establishing a correlation between in-house permeability data and reported permeabilities in human volunteers.
2. Theoretical Section
2.1. Dissolution/Transit Balance: Target Particle Size Estimations Based on the Dissolution Number and Solubility
2.2. Dissolution/Transit Balance: Target Particle Size Estimates Based on the Dissolution Number and Intrinsic Dissolution Rate
2.3. Dissolution/Permeation Balance: Target Particle Size Estimates Based on kdiss/kperm and Solubility
2.4. Dissolution/Permeation Balance: Target Particle Size Estimates Based on kdiss/kperm and Intrinsic Dissolution Rate
2.5. Dissolution/Permeation Balance: Target Particle Size Estimates Based on Powder Surface Area and Intrinsic Dissolution Rate
2.6. Summary of Target Particle Size Equations
3. Materials and Methods
3.1. Chemicals
3.2. Physicochemical Characterization
3.2.1. Dissociation Constant (pKa)
3.2.2. n-Octanol/Water Distribution Coefficient (logDpH7.4)
3.3. rDCS Standard Investigations: Solubility Studies
3.4. rDCS Standard Investigations: Caco-2 Permeability Studies
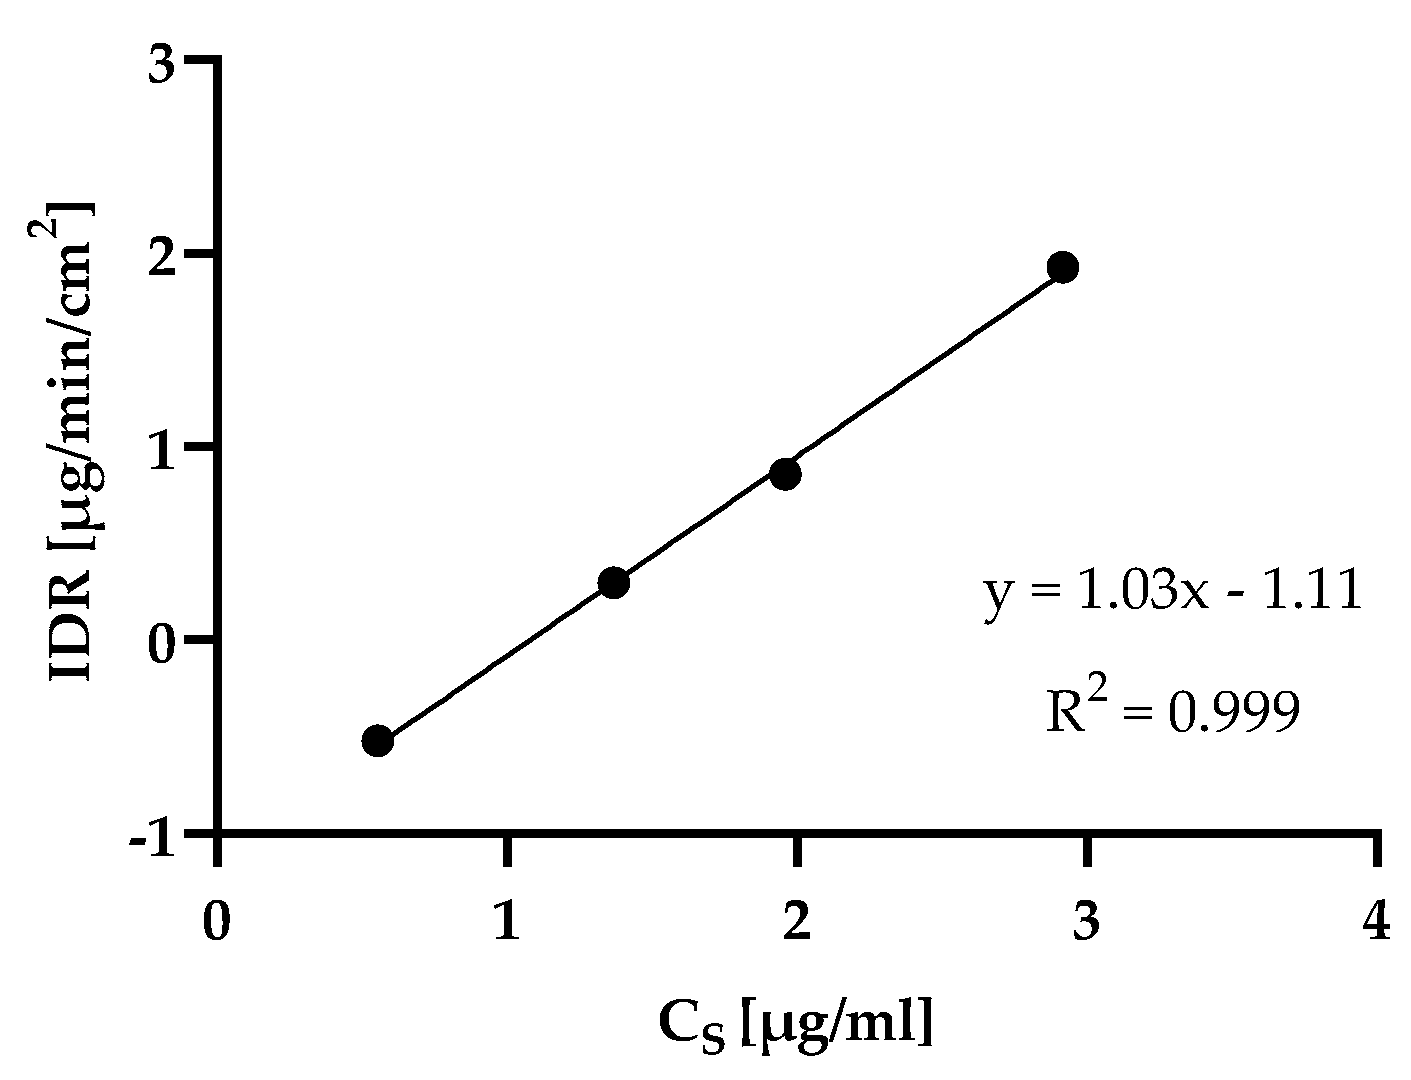
3.5. rDCS Customized Investigations: Intrinsic Dissolution Rate
3.5.1. Disk Dissolution Studies
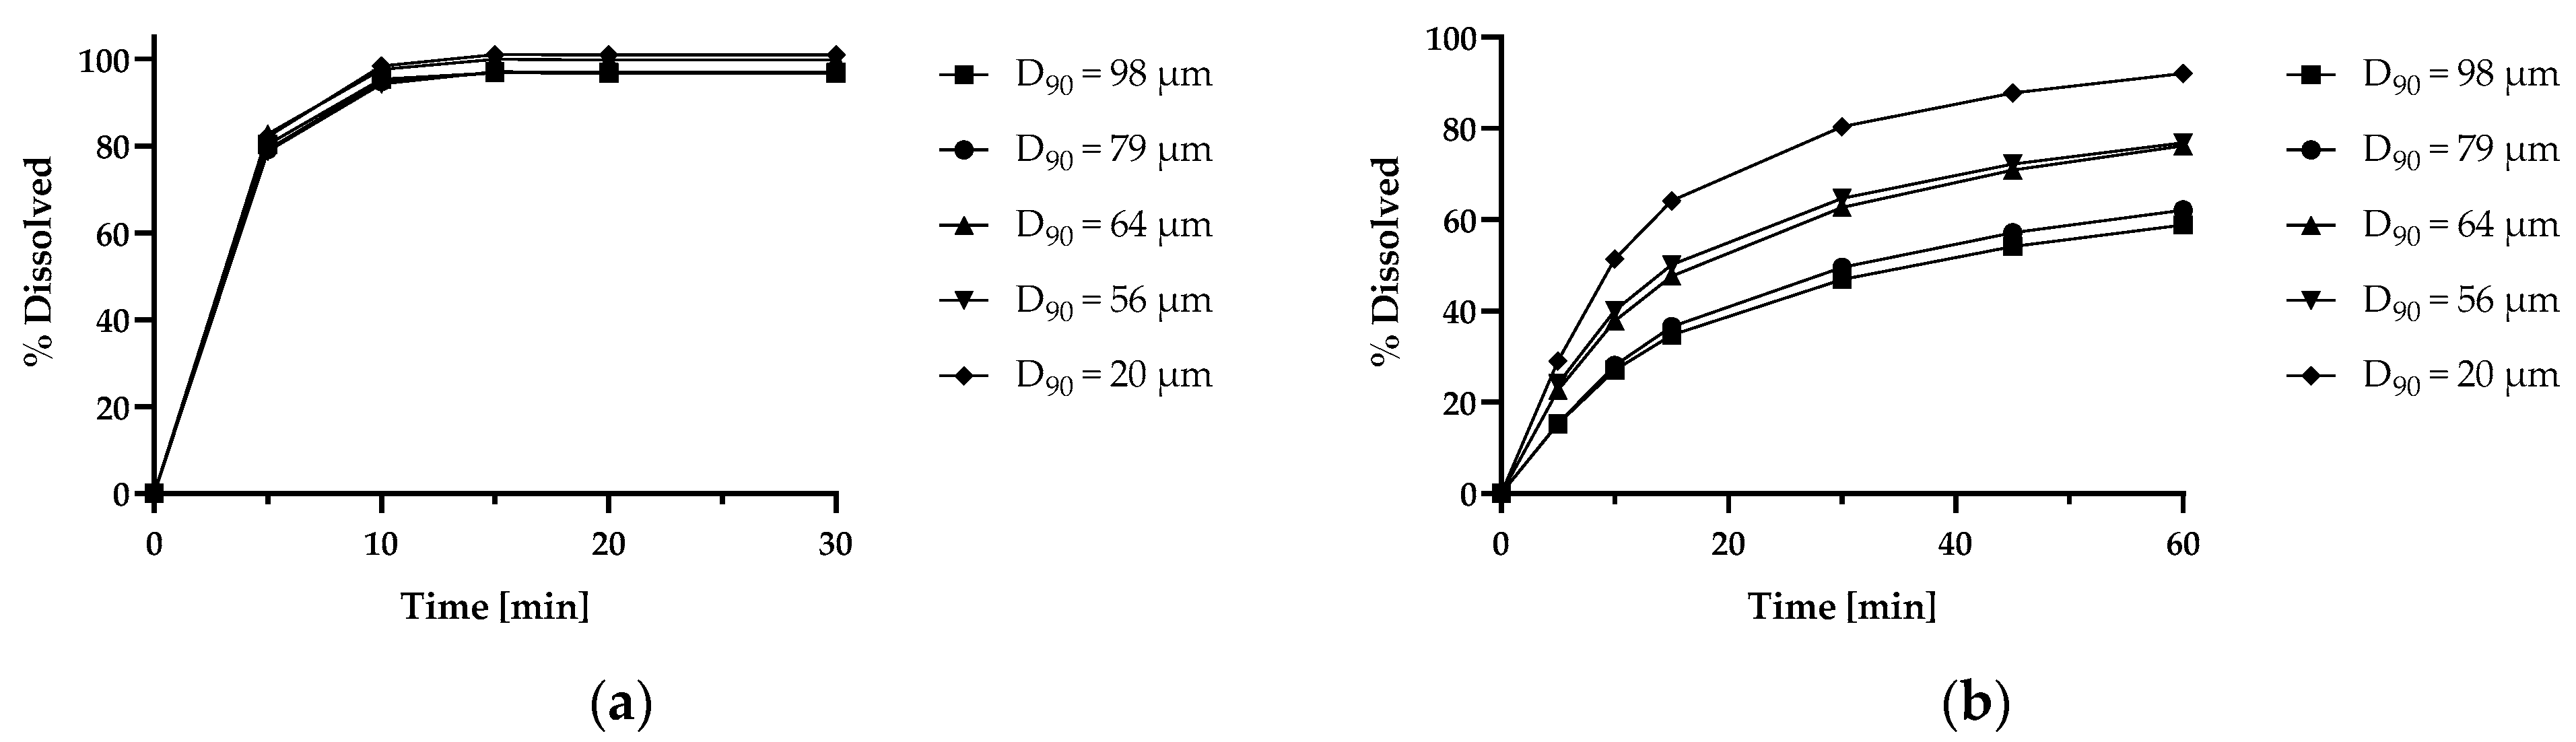
3.5.2. Powder Dissolution Studies
3.6. rDCS Calculations
3.6.1. rDCS Classification Based on Standard Investigations
3.6.2. rDCS Customized Investigations: Dissolution Rate Analysis
4. Results
4.1. Physicochemical Characterization
4.1.1. Dissociation Constant (pKa)
4.1.2. n-Octanol/Water Distribution Coefficient (logDpH7.4)
4.2. rDCS Standard Investigations: Solubility Studies
4.3. rDCS Standard Investigations: Caco-2 Permeability Studies
4.4. rDCS Customized Investigations: Intrinsic Dissolution Rate
4.5. rDCS Calculations
4.5.1. rDCS Standard Investigations
4.5.2. rDCS Customized Investigations: Dissolution Rate Analysis
5. Discussion
5.1. Complementarity of the Dissolution/Transit Balance and Dissolution/Permeation Balance Approach
5.2. Use of Solubility and Intrinsic Dissolution Rate as Input for Target Particle Size Calculations
5.3. Selection of the Relevant Aqueous Boundary Layer Assumption
5.4. Case Studies
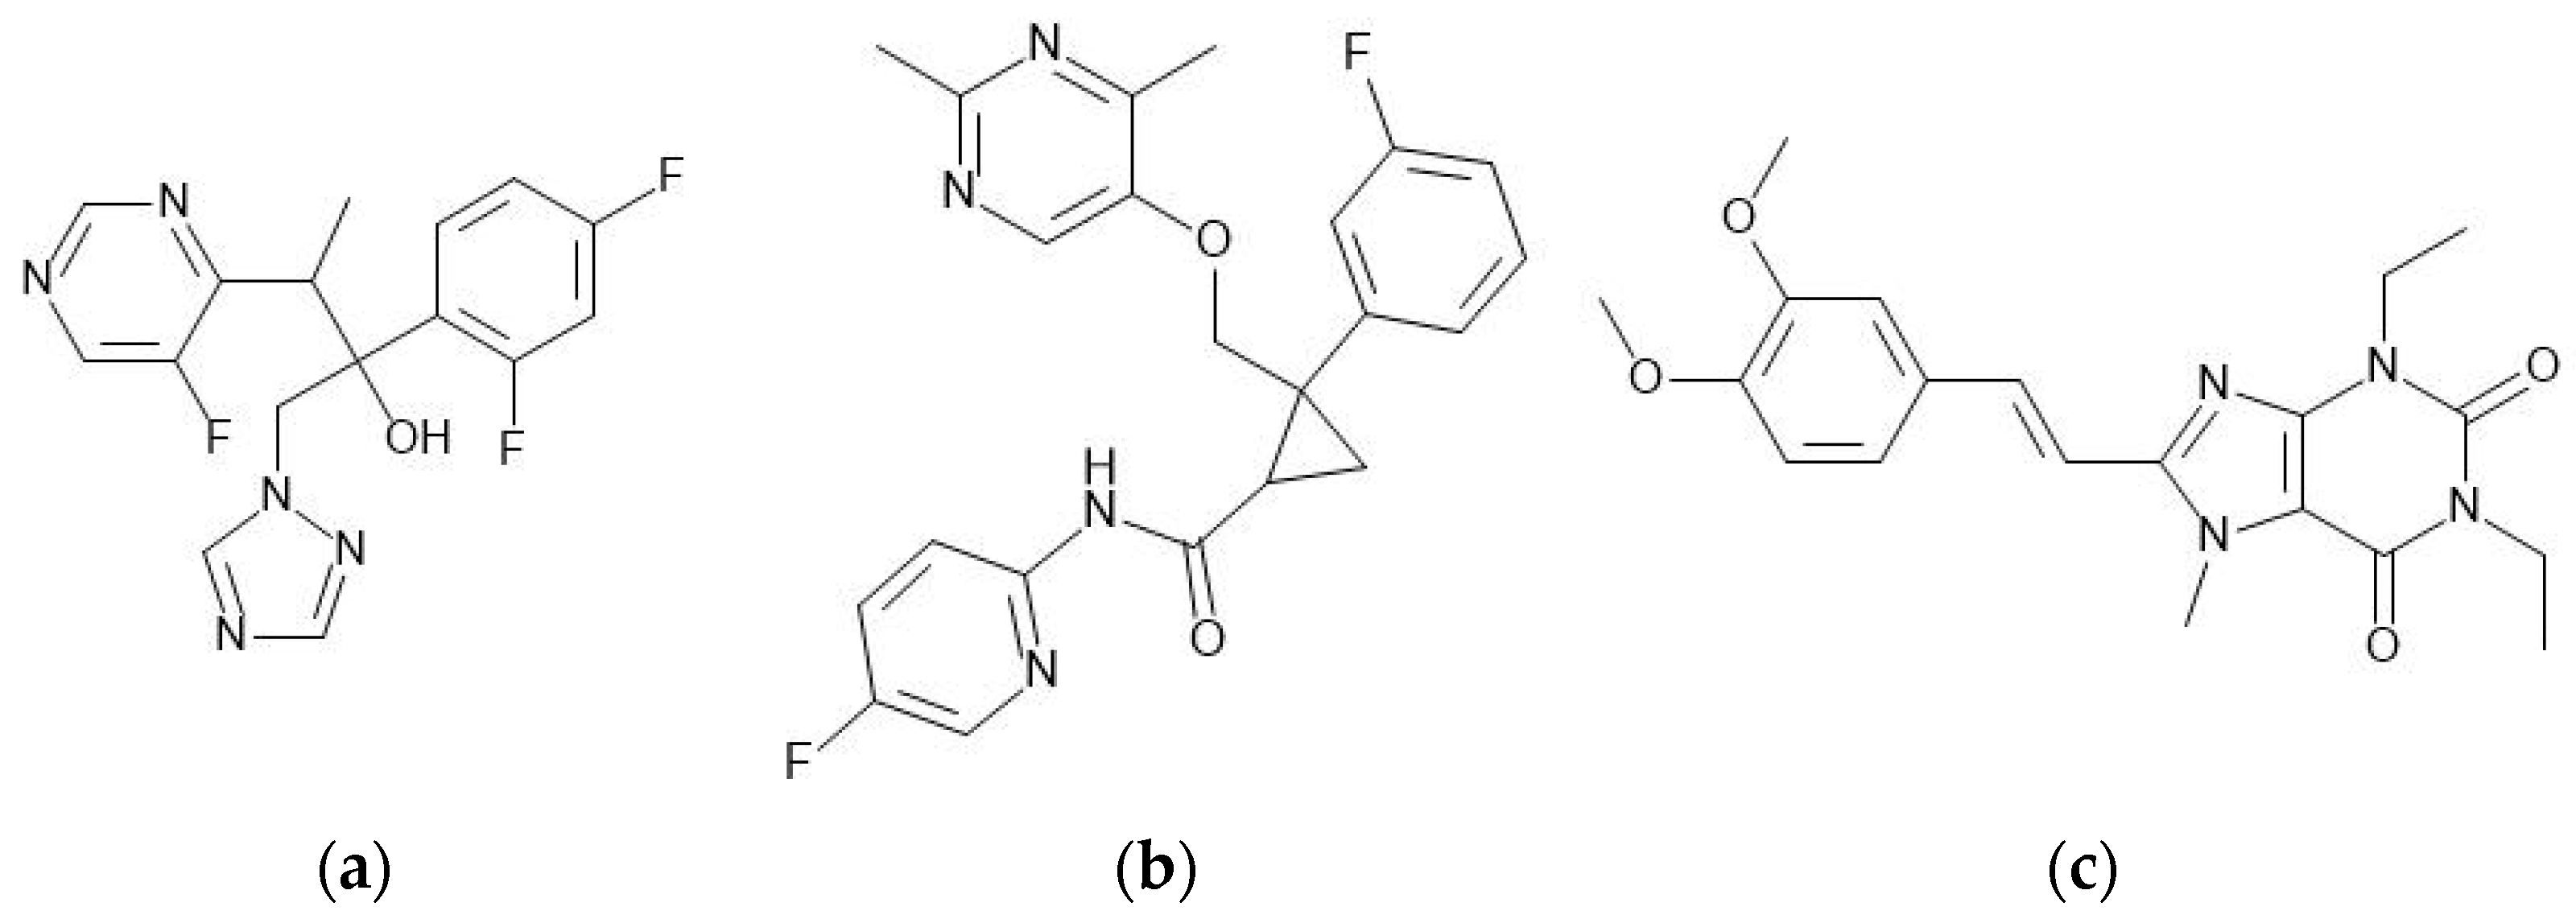
5.4.1. Voriconazole
5.4.2. Lemborexant
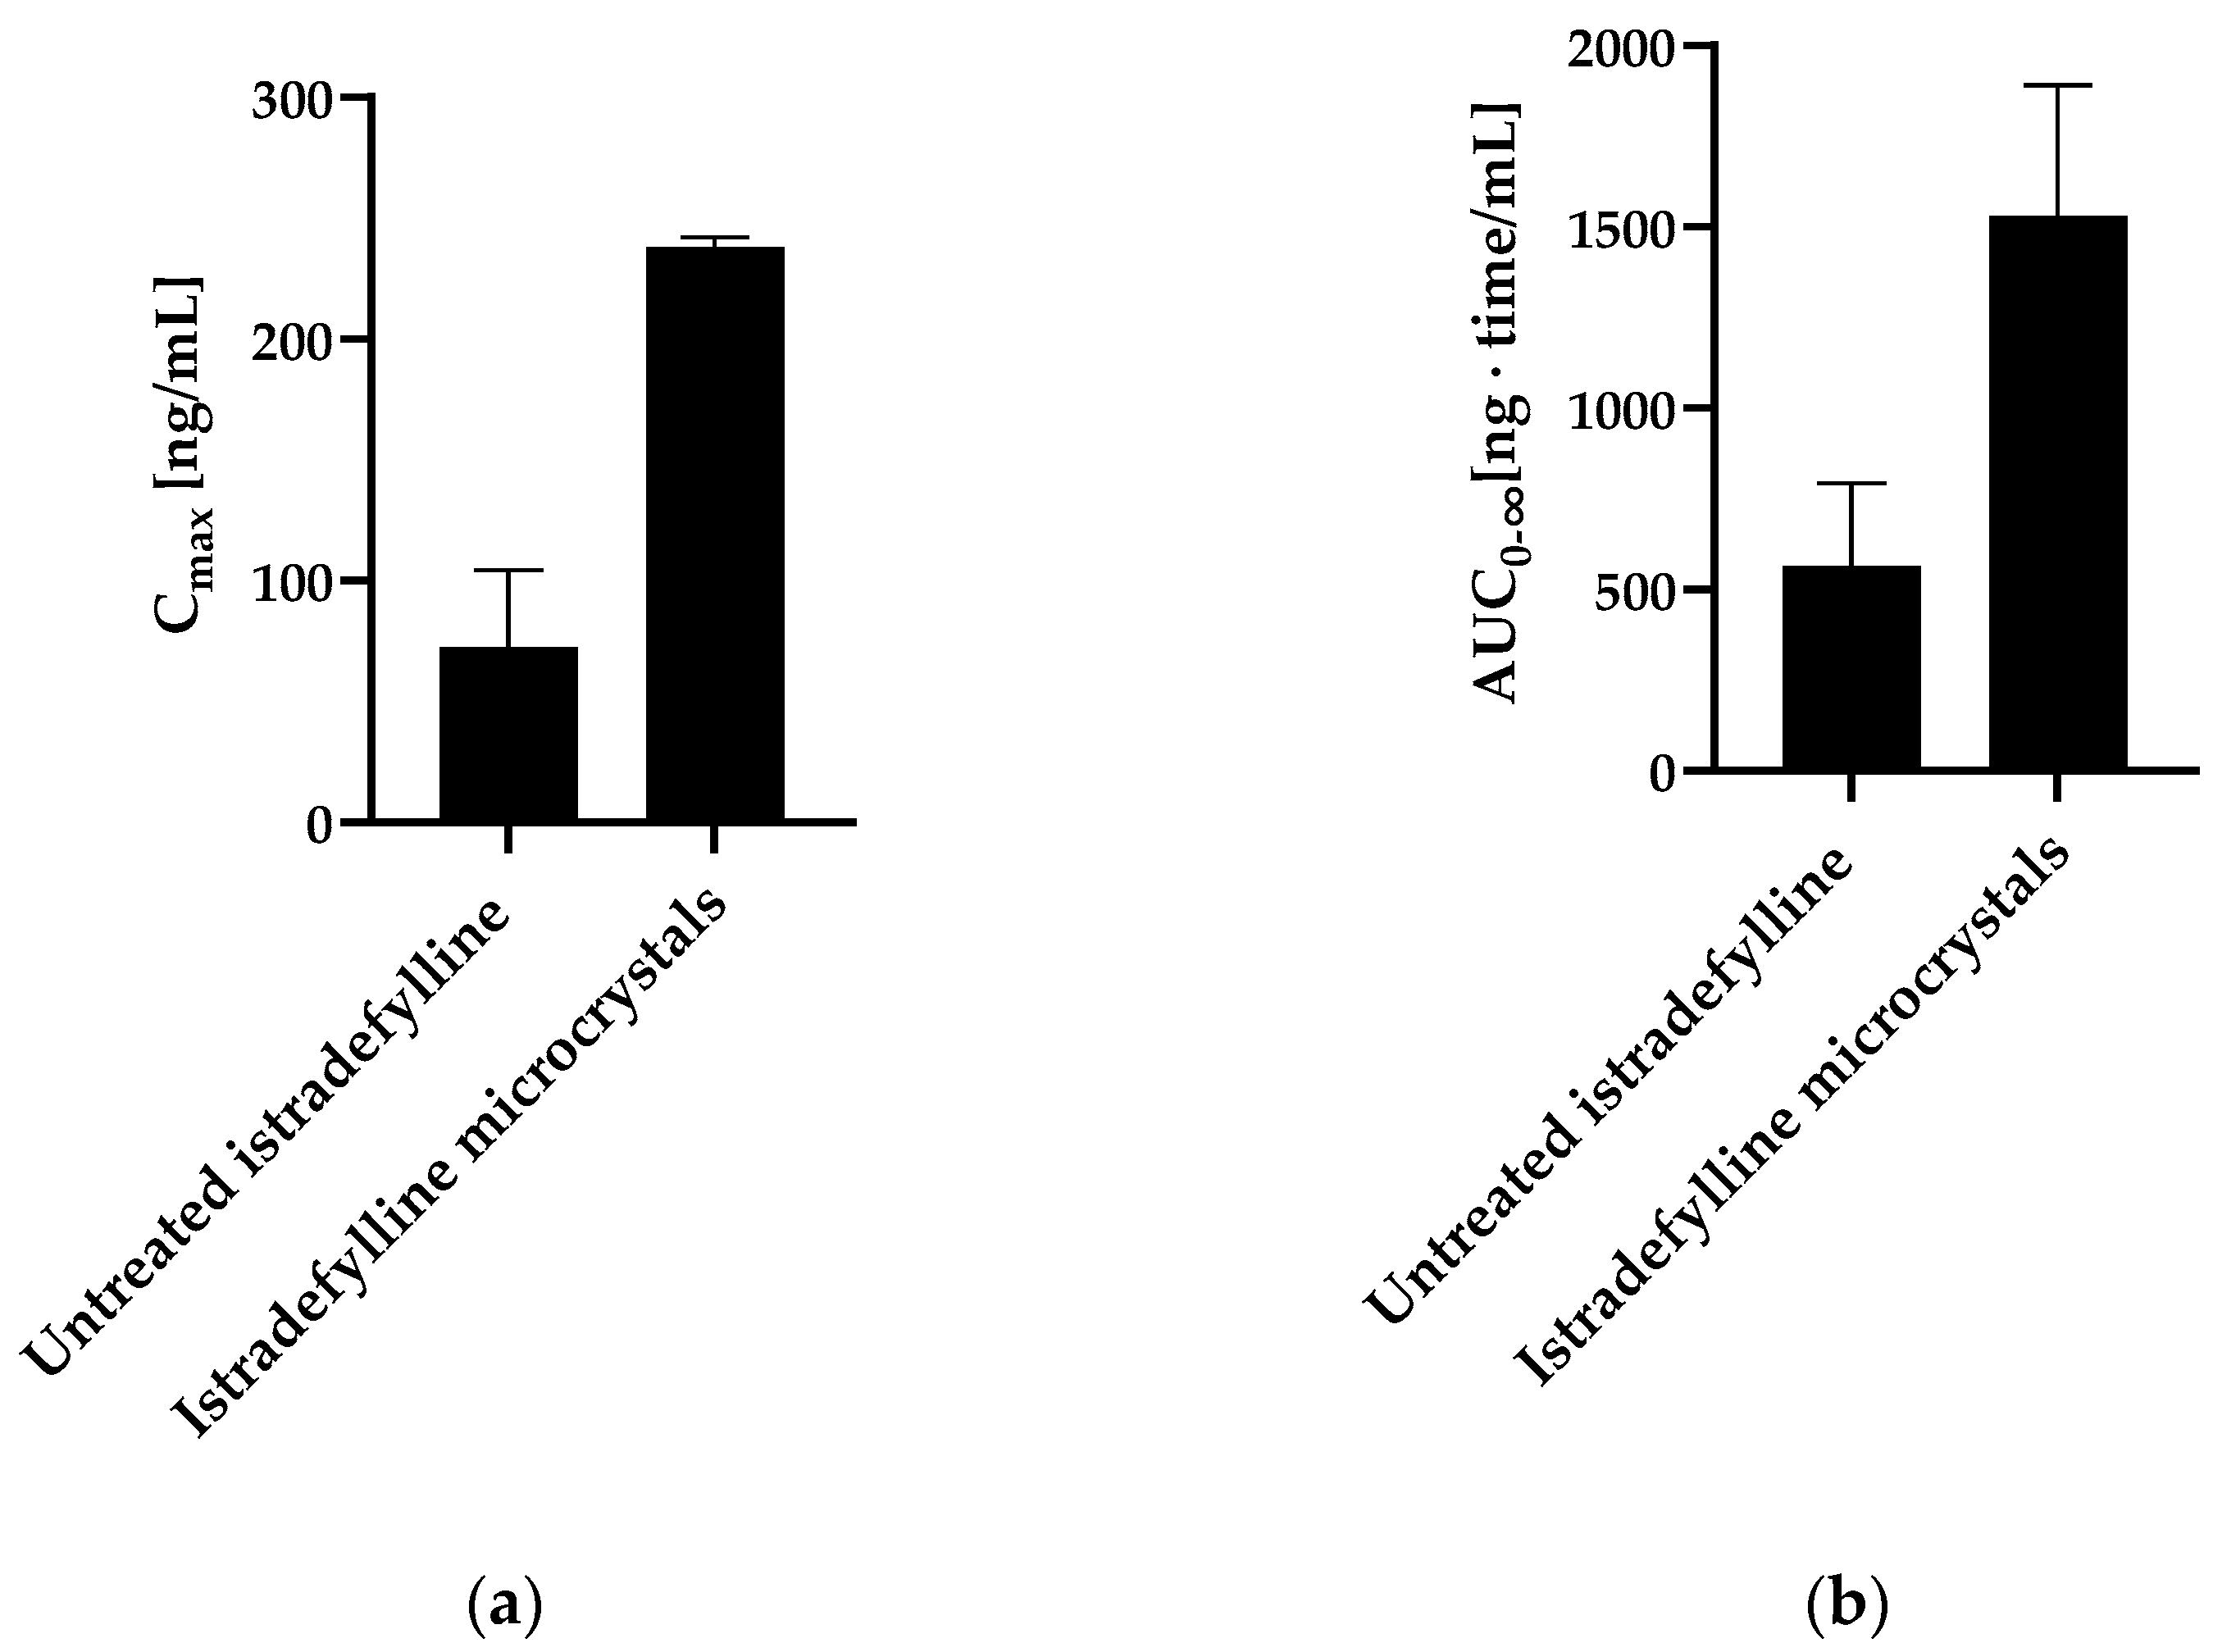
5.4.3. Istradefylline
6. Conclusions
Supplementary Materials
Author Contributions
Funding
Data Availability Statement
Acknowledgments
Conflicts of Interest
References
- Amidon, G.L.; Lennernäs, H.; Shah, V.P.; Crison, J.R. A theoretical basis for a biopharmaceutic drug classification: The correlation of in vitro drug product dissolution and in vivo bioavailability. Pharm. Res. 1995, 12, 413–420. [Google Scholar] [CrossRef] [PubMed] [Green Version]
- Sugano, K.; Terada, K. Rate- and Extent-Limiting Factors of Oral Drug Absorption: Theory and Applications. J. Pharm. Sci. 2015, 104, 2777–2788. [Google Scholar] [CrossRef] [PubMed]
- Sugano, K. Biopharmaceutics Modelling and Simulations: Theory, Practice, Methods, and Applications, 1st ed.; John Wiley & Sons, Inc.: Hoboken, NJ, USA, 2012; pp. 1–325. [Google Scholar]
- Noyes, A.A.; Whitney, W.R. The rate of solution of solid substances in their own solutions. J. Am. Chem. Soc. 1897, 19, 930–934. [Google Scholar] [CrossRef] [Green Version]
- Nernst, W. Theorie der Reaktionsgeschwindigkeit in heterogenen Systemen. Z. Phys. Chem. 1904, 47, 52–55. [Google Scholar] [CrossRef]
- Brunner, E. Reaktionsgeschwindigkeit in heterogenen Systemen. Z. Phys. Chem. 1904, 43, 56–102. [Google Scholar] [CrossRef]
- Dokoumetzidis, A.; Macheras, P. A century of dissolution research: From Noyes and Whitney to the Biopharmaceutics Classification System. Int. J. Pharm. 2006, 321, 1–11. [Google Scholar] [CrossRef] [Green Version]
- ICH Harmonised Tripartite Guideline. Specifications: Test Procedures and Acceptance Criteria for New Drug Substances and New Drug Products: Chemical Substances. Q6A. 1999. Available online: https://www.ich.org/page/quality-guidelines (accessed on 1 July 2023).
- Butler, J.M.; Dressman, J.B. The developability classification system: Application of biopharmaceutics concepts to formulation development. J. Pharm. Sci. 2010, 99, 4940–4954. [Google Scholar] [CrossRef]
- Rosenberger, J.; Butler, J.; Dressman, J. A Refined Developability Classification System. J. Pharm. Sci. 2018, 107, 2020–2032. [Google Scholar] [CrossRef]
- Rosenberger, J.; Butler, J.; Muenster, U.; Dressman, J. Application of a Refined Developability Classification System. J. Pharm. Sci. 2019, 108, 1090–1100. [Google Scholar] [CrossRef] [PubMed]
- Oh, D.M.; Curl, R.L.; Amidon, G.L. Estimating the Fraction Dose Absorbed from Suspensions of Poorly Soluble Compounds in Humans: A Mathematical Model. Pharm. Res. 1993, 10, 264–270. [Google Scholar] [CrossRef] [Green Version]
- Sjögren, E.; Abrahamsson, B.; Augustijns, P.; Becker, D.; Bolger, M.B.; Brewster, M.; Brouwers, J.; Flanagan, T.; Harwood, M.; Heinen, C.; et al. In vivo methods for drug absorption—Comparative physiologies, model selection, correlations with in vitro methods (IVIVC), and applications for formulation/API/excipient characterization including food effects. Eur. J. Pharm. Sci. 2014, 57, 99–151. [Google Scholar] [CrossRef]
- James, W.B.; Hume, R. Action of metoclopramide on gastric emptying and small bowel transit time. Gut 1968, 9, 203–205. [Google Scholar] [CrossRef] [Green Version]
- ICH Harmonised Guideline. Biopharmaceutics Classification System-Based Biowaivers. M9. 2019. Available online: https://www.ich.org/page/multidisciplinary-guidelines (accessed on 1 July 2023).
- Dressman, J.B.; Fleisher, D. Mixing-tank model for predicting dissolution rate control or oral absorption. J. Pharm. Sci. 1986, 75, 109–116. [Google Scholar] [CrossRef]
- Higuchi, W.I.; Hiestand, E.N. Dissolution rates of finely divided drug powders I. Effect of a distribution of particle sizes in a diffusion-controlled process. J. Pharm. Sci. 1963, 52, 67–71. [Google Scholar] [CrossRef]
- Hintz, R.J.; Johnson, K.C. The effect of particle size distribution on dissolution rate and oral absorption. Int. J. Pharm. 1989, 51, 9–17. [Google Scholar] [CrossRef]
- Okazaki, A.; Mano, T.; Sugano, K. Theoretical dissolution model of poly-disperse drug particles in biorelevant media. J. Pharm. Sci. 2008, 97, 1843–1852. [Google Scholar] [CrossRef]
- Arav, Y.; Bercovier, M.; Parnas, H. Selecting the particle size distribution for drugs with low water solubility—Mathematical model. Drug. Dev. Ind. Pharm. 2012, 38, 940–951. [Google Scholar] [CrossRef] [PubMed]
- Harriott, P. Mass transfer to particles: Part I. Suspended in agitated tanks. AIChE J. 1962, 8, 93–101. [Google Scholar] [CrossRef]
- Tsinman, K.; Avdeef, A.; Tsinman, O.; Voloboy, D. Powder Dissolution Method for Estimating Rotating Disk Intrinsic Dissolution Rates of Low Solubility Drugs. Pharm. Res. 2009, 26, 2093–2100. [Google Scholar] [CrossRef] [PubMed]
- Levich, V.G. Physicochemical Hydrodynamics, 2nd ed.; Prentice Hall, Inc.: Englewood Cliffs, NJ, USA, 1962; pp. 39–72. [Google Scholar]
- Xu, H.; Wang, Y.; Wang, H.; Zheng, Z.; Meng, Z.; Xue, M.; Xu, Z. Investigation of Photostability of Istradefylline Aqueous Solution. ChemistrySelect 2020, 5, 2337–2341. [Google Scholar] [CrossRef]
- Hubatsch, I.; Ragnarsson, E.G.; Artursson, P. Determination of drug permeability and prediction of drug absorption in Caco-2 monolayers. Nat. Protoc. 2007, 2, 2111–2119. [Google Scholar] [CrossRef]
- Sun, D.; Lennernäs, H.; Welage, L.S.; Barnett, J.L.; Landowski, C.P.; Foster, D.; Fleisher, D.; Lee, K.; Amidon, G.L. Comparison of Human Duodenum and Caco-2 Gene Expression Profiles for 12,000 Gene Sequences Tags and Correlation with Permeability of 26 Drugs. Pharm. Res. 2002, 19, 1400–1416. [Google Scholar] [CrossRef]
- Avdeef, A.; Tsinman, O. Miniaturized Rotating Disk Intrinsic Dissolution Rate Measurement: Effects of Buffer Capacity in Comparisons to Traditional Wood’s Apparatus. Pharm. Res. 2008, 25, 2613–2627. [Google Scholar] [CrossRef]
- Andersson, S.B.E.; Alvebratt, C.; Bevernage, J.; Bonneau, D.; da Costa Mathews, C.; Dattani, R.; Edueng, K.; He, Y.; Holm, R.; Madsen, C.; et al. Interlaboratory Validation of Small-Scale Solubility and Dissolution Measurements of Poorly Water-Soluble Drugs. J. Pharm. Sci. 2016, 105, 2864–2872. [Google Scholar] [CrossRef] [Green Version]
- Pfizer Inc. Highlights of Prescribing Information, VFEND® (Voriconazole) Tablets, for Oral Use; Pfizer Inc.: New York, NY, USA, 2022; Available online: https://www.pfizermedicalinformation.com/en-us/vfend (accessed on 1 July 2023).
- Eisai Inc. Highlights of Prescribing Information, DAYVIGO® (Lemborexant) Tablets, for Oral Use; Eisai Inc.: Nutley, NJ, USA, 2022; Available online: https://www.dayvigo.com/ (accessed on 1 July 2023).
- Kyowa Kirin Inc. Highlights of Prescribing information, NOURIANZ® (Istradefylline) Tablets, for Oral Use; Kyowa Kirin Inc.: Bedminster, NJ, USA, 2020; Available online: https://www.nourianzhcp.com/ (accessed on 1 July 2023).
- Damle, B.; Varma, M.V.; Wood, N. Pharmacokinetics of Voriconazole Administered Concomitantly with Fluconazole and Population-Based Simulation for Sequential Use. Antimicrob. Agents Chemother. 2011, 55, 5172–5177. [Google Scholar] [CrossRef] [PubMed] [Green Version]
- Ueno, T.; Miyajima, Y.; Landry, I.; Lalovic, B.; Schuck, E. Physiologically-based pharmacokinetic modeling to predict drug interactions of lemborexant with CYP3A inhibitors. CPT Pharmacomet. Syst. Pharmacol. 2021, 10, 455–466. [Google Scholar] [CrossRef] [PubMed]
- Food and Drug Administration. Product Quality Review(s), Nourianz® (Istradefylline) Tablets. Application Number: 022075Orig1s000; U.S. Food and Drug Administration: Silver Spring, MD, USA, 2019. Available online: https://www.accessdata.fda.gov/drugsatfda_docs/nda/2019/022075Orig1s000TOC.cfm (accessed on 1 July 2023).
- Sundaram, V.; Uppala, V.B.R.U.; Akundi, S.P.; Muvva, V.; Chitta, V.; Donthula, A.; Kharkar, M.R.; Devarakonda, S.N.; Peddireddy, S.R. Process for Preparing. Voriconazole. Patent WO 2006/065726 A2, 22 June 2006. [Google Scholar]
- Chen, M.; Zhang, Y.; Huang, C.; Zhang, X. Crystalline form of orexin receptor antagonist, processes for preparation thereof and use thereof. U.S. Patent 2020/0190060 A1, 18 June 2020. [Google Scholar]
- Bao, J.Y.; Huang, H.; Yu, D.J.; Wei, W.; Jiang, Y.W.; Zhang, X.Q. Polymorphs of. Istradefylline. Patent CN 104744464A, 1 July 2015. [Google Scholar]
- Wang, Y.; Xu, Y.; Zheng, Z.; Xue, M.; Meng, Z.; Xu, Z.; Li, J.; Lin, Q. Studies on the Crystal Forms of Istradefylline: Structure, Solubility, and Dissolution Profile. Crystals 2022, 12, 917. [Google Scholar] [CrossRef]
- Food and Drug Administration. Product Quality Review(s). Lemborexant Tablets. Application Number: 212028Orig1s000; U.S. Food and Drug Administration: Silver Spring, MD, USA, 2019; Available online: https://www.accessdata.fda.gov/drugsatfda_docs/nda/2019/212028Orig1s000TOC.cfm (accessed on 1 July 2023).
- European Medicines Agency. Voriconazole Accord: EPAR—Public assessment report.; European Medicines Agency: London, UK, 2013; Available online: https://www.ema.europa.eu/en/medicines/human/EPAR/voriconazole-accord (accessed on 1 July 2023).
- Food and Drug Administration. In Vitro Metabolism and Transporter Mediated Drug-Drug Interaction Studies Guidance for Industry; U.S. Food and Drug Administration: Silver Spring, MD, USA, 2017. Available online: https://www.fda.gov/media/108130/download (accessed on 1 July 2023).
- O’Grady, J.; Murphy, C.L.; Barry, L.; Shanahan, F.; Buckley, M. Defining gastrointestinal transit time using video capsule endoscopy: A study of healthy subjects. Endosc. Int. Open 2020, 8, E396–E400. [Google Scholar] [CrossRef] [PubMed] [Green Version]
- Mooney, K.G.; Mintun, M.A.; Himmelstein, K.J.; Stella, V.J. Dissolution kinetics of carboxylic acids I: Effect of pH under unbuffered conditions. J. Pharm. Sci. 1981, 70, 13–22. [Google Scholar] [CrossRef]
- Mooney, K.G.; Mintun, M.A.; Himmelstein, K.J.; Stella, V.J. Dissolution kinetics of carboxylic acids II: Effect of buffers. J. Pharm. Sci. 1981, 70, 22–32. [Google Scholar] [CrossRef]
- McNamara, D.P.; Amidon, G.L. Dissolution of acidic and basic compounds from the rotating disk: Influence of convective diffusion and reaction. J. Pharm. Sci. 1986, 75, 858–868. [Google Scholar] [CrossRef]
- Teleki, A.; Nylander, O.; Bergström, C.A.S. Intrinsic Dissolution Rate Profiling of Poorly Water-Soluble Compounds in Biorelevant Dissolution Media. Pharmaceutics 2020, 12, 493. [Google Scholar] [CrossRef]
- Jinno, J.; Oh, D.M.; Crison, J.R.; Amidon, G.L. Dissolution of Ionizable Water-Insoluble Drugs: The Combined Effect of pH and Surfactant. J. Pharm. Sci. 2000, 89, 268–274. [Google Scholar] [CrossRef]
- Sami, F.; Philip, B.; Pathak, K. Effect of Auxiliary Substances on Complexation Efficiency and Intrinsic Dissolution Rate of Gemfibrozil–β-CD Complexes. AAPS PharmSciTech 2010, 11, 27–35. [Google Scholar] [CrossRef] [Green Version]
- Shekunov, B.; Montgomery, E.R. Theoretical Analysis of Drug Dissolution: I. Solubility and Intrinsic Dissolution Rate. J. Pharm. Sci. 2016, 105, 2685–2697. [Google Scholar] [CrossRef] [PubMed] [Green Version]
- Avdeef, A.; Voloboy, D.; Foreman, A. 5.17—Dissolution and solubility. In Comprehensive Medicinal Chemistry II, 2nd ed.; Taylor, J.B., Triggle, D.J., Eds.; Elsevier: Oxford, UK, 2007; Volume 5, pp. 399–423. [Google Scholar]
- Hohmann, N.; Kocheise, F.; Carls, A.; Burhenne, J.; Weiss, J.; Haefeli, W.E.; Mikus, G. Dose-Dependent Bioavailability and CYP3A Inhibition Contribute to Non-Linear Pharmacokinetics of Voriconazole. Clin. Pharm. 2016, 55, 1535–1545. [Google Scholar] [CrossRef] [PubMed]
- Food and Drug Administration. Clinical Pharmacology and Biopharmaceutics Review(s). Voriconazole Tablet (50, 200 mg) and Voriconazole for I.V. Injection (200 mg per Vial). Application Number: 21-464, 21-466; U.S. Food and Drug Administration: Silver Spring, MD, USA, 2003. Available online: https://www.accessdata.fda.gov/drugsatfda_docs/nda/2003/021464s000_021466s000_VfendTOC.cfm (accessed on 1 July 2023).
- European Medicines Agency. Vfend European Public Assessment Report. EPAR—Scientific Discussion—Extension; European Medicines Agency: London, UK, 2006; Available online: https://www.ema.europa.eu/en/medicines/human/EPAR/vfend (accessed on 1 July 2023).
- Therapeutic Goods Administration. Australian Public Assessment Report for Voriconazole. Proprietary Product Name: Vorcon; Therapeutic Goods Administration: Canberra, Australia, 2017. Available online: https://www.tga.gov.au/resources/auspar/auspar-voriconazole-0 (accessed on 1 July 2023).
- Pharmaceuticals and Medical Devices Agency. Report on the Deliberation Results (Dayvigo Tablets 2.5 mg, 5 mg, 10 mg); Pharmaceuticals and Medical Devices Agency: Tokyo, Japan, 2019; Available online: https://www.pmda.go.jp/english/review-services/reviews/approved-information/drugs/0001.html#select4 (accessed on 1 July 2023).
- Landry, I.; Nakai, K.; Ferry, J.; Aluri, J.; Hall, N.; Lalovic, B.; Moline, M.L. Pharmacokinetics, Pharmacodynamics, and Safety of the Dual Orexin Receptor Antagonist Lemborexant: Findings from Single-Dose and Multiple-Ascending-Dose Phase 1 Studies in Healthy Adults. Clin. Pharmacol. Drug Dev. 2021, 10, 153–165. [Google Scholar] [CrossRef]
- Ueno, T.; Ishida, T.; Aluri, J.; Suzuki, M.; Beuckmann, C.T.; Kameyama, T.; Asakura, S.; Kusano, K. Disposition and Metabolism of [14C]Lemborexant in Healthy Human Subjects and Characterization of Its Circulating Metabolites. Drug Metab. Dispos. 2021, 49, 31–38. [Google Scholar] [CrossRef] [PubMed]
- Food and Drug Administration. Multi-Discipline Review. DAYVIGO (Lemborexant). Application Number: 212028Orig1s000; U.S. Food and Drug Administration: Silver Spring, MD, USA, 2019; Available online: https://www.accessdata.fda.gov/drugsatfda_docs/nda/2019/212028Orig1s000TOC.cfm (accessed on 1 July 2023).
- Abe, T.; Ayata, Y.; Suzuki, N.; Akimoto, Y.; Shikata, F.; Zaima, Y.; Yoshida, N. Drug Substance of Lemborexant and Medicinal Composition Comprising Same. European Patent Application No. EP 4 059 504 A1, 21 September 2022. [Google Scholar]
- Pharmaceuticals and Medical Devices Agency. New Drugs Approved in FY 2012; Pharmaceuticals and Medical Devices Agency: Tokyo, Japan, 2012; Available online: https://www.pmda.go.jp/english/review-services/reviews/approved-information/drugs/0002.html?print (accessed on 1 July 2023).
- Food and Drug Administration. Orange Book: Approved Drug Products with Therapeutic Equivalence Evaluations, 43rd ed.; U.S. Department of Health and Human Services, U.S. Food and Drug Administration: Silver Spring, MD, USA, 2023; p. 252. Available online: https://www.fda.gov/drugs/drug-approvals-and-databases/approved-drug-products-therapeutic-equivalence-evaluations-orange-book (accessed on 1 July 2023).
- Food and Drug Administration. Clinical Pharmacology Review(s), Nourianz® (Istradefylline) Tablets. Application Number: 022075Orig1s000; U.S. Food and Drug Administration: Silver Spring, MD, USA, 2019; Available online: https://www.accessdata.fda.gov/drugsatfda_docs/nda/2019/022075Orig1s000TOC.cfm (accessed on 1 July 2023).
- Pharmaceuticals and Medical Devices Agency. Report on the Deliberation Results (Nouriast Tablets 20 mg); Pharmaceuticals and Medical Devices Agency: Tokyo, Japan, 2013; Available online: https://www.pmda.go.jp/english/review-services/reviews/approved-information/drugs/0001.html#select14 (accessed on 1 July 2023).
- Kuroda, K.; Aoki, N.; Ochiai, T.; Uchida, A.; Ishikawa, Y.; Kigoshi, M.; Asanome, K. Microcrystal. U.S. Patent 7,541,363 B2, 2 June 2009. [Google Scholar]
- Biorelevant.com. Biorelevant Media Prep Tool 2022. Available online: https://biorelevant.com/?filters=product_type--biorelevant%20media#media_prep_tool_tab (accessed on 25 May 2022).
- Holder, C.F.; Schaak, R.E. Tutorial on Powder X-ray Diffraction for Characterizing Nanoscale Materials. ACS Nano 2019, 13, 7359–7365. [Google Scholar] [CrossRef] [Green Version]


| Assumption | Mathematical Formulation | |
|---|---|---|
| 1 | Total powder surface area of a monodispersed spherical particle population 1 [16] | |
| 2 | Dissolution under sink conditions | i.e., |
| 3 | Aqueous boundary layer (ABL) thickness equals initial particle radius for particles with r0 < 30 µm [17] | |
| ABL thickness equals constant value for particles with r0 ≥ 30 µm [3,18,19,20] | e.g., | |
| Approach | Based on | rtarget Equation | ||||
|---|---|---|---|---|---|---|
| hparticle = r0 | hparticle ≠ r0 | |||||
| 2.1 | Dissolution/ Transit balance | Dn and CS | Equation (7) 1: | Equation (8) 2: | ||
| 2.2 | Dn and IDR | Equation (14) 2: | Equation (15) 2: | |||
| 2.3 | Dissolution/ Permeation balance | kdiss/kperm and CS | Equation (20) 2: | Equation (21) 2: | ||
| 2.4 | kdiss/kperm and IDR | Equation (22) 2: | Equation (23) 2: | |||
| 2.5 | Apowder and IDR | - | Equation (26) 2: | |||
| Method for pKa Determination | Voriconazole | Lemborexant | Istradefylline |
|---|---|---|---|
| Fast UV (Section 3.2.1) | - 1 | 2.18 ± 0.05 2 | - 1 |
| Literature pKa | 1.76 3 [32] | <3.50 [33] | 0.78 3 [31,34] |
| Method for logDpH7.4/logP Determination | Voriconazole | Lemborexant | Istradefylline |
|---|---|---|---|
| Shake-flask logDpH7.4 | 1.66 ± 0.03 | 3.04 ± 0.05 | 2.96 ± 0.03 |
| Literature logP 2 | 1.80 [32] | 3.70 [33] | 3.5–3.6 [34] |
| API | CS 1 FaSSIF V1 [µg/mL] | IDR a FaSSIF V1 [µg/min/cm2] | Cryst. Form | SLAD | rDCS Classification | |||
|---|---|---|---|---|---|---|---|---|
| 5 mg | 50 mg | 500 mg | Usual dose | |||||
| Voriconazole | 827 ± 6 | 84.8 ± 1.4 2 | B 4 | 1810 | I | I | IIa | I200mg |
| Lemborexant | 23.3 ± 0.1 | 1.99 ± 0.09 2 | CS2 4 | 49.6 | I | IIa/b | IIb | I10mg |
| Istradefylline | 3.59 ± 0.05 | 0.302 ± 0.010 3 | I 5 | 8.50 | IIa | IIb | IIb | IIb20mg |
| Permeability Measure | Voriconazole | Lemborexant | Istradefylline | |
|---|---|---|---|---|
| Papp(A⟹B) | [×10−6 cm/s] | 27.3 ± 1.7 | 26.7 ± 1.2 | 30.2 ± 1.2 |
| Papp(A⟹B) + inhibitor | [×10−6 cm/s] | 24.0 ± 1.0 | 24.2 ± 0.7 | 31.2 ± 1.1 |
| Papp(B⟹A) | [×10−6 cm/s] | 43.5 ± 0.9 | 41.8 ± 1.2 | 28.3 ± 16.0 |
| Papp(B⟹A) + inhibitor | [×10−6 cm/s] | 40.4 ± 1.1 | 39.0 ± 0.4 | 43.7 ± 18.5 |
| Estimated human Peff | [×10−4 cm/s] | 4.30 | 4.20 | 4.66 |
| Voriconazole | Lemborexant | Istradefylline | ||
|---|---|---|---|---|
| kdiss | [min−1] | 7.56 × 10⁻³ | 1.80 × 10⁻⁴ | 2.73 × 10⁻⁵ |
| kperm | [min−1] | 2.19 × 10⁻² | 2.14 × 10⁻² | 2.38 × 10⁻² |
| Approach | Based on | rtarget [µm] | ||||||||
|---|---|---|---|---|---|---|---|---|---|---|
| Voriconazole (200 mg) | Lemborexant (10 mg) | Istradefylline (20 mg) | ||||||||
| hparticle = r0 | hparticle = 30 µm | hparticle = hdisk 1 | hparticle = r0 | hparticle = 30 µm | hparticle = hdisk 1 | hparticle = r0 | hparticle = 30 µm | hparticle = hdisk 1 | ||
| Dissolution/ transit balance | Dn and CS | 124 | 516 | 364 | 20.1 | 13.5 | 9.94 | 8.23 | 2.26 | 1.67 |
| Dn and IDR | 123 | 502 | 354 | 18.9 | 11.9 | 8.81 | 7.69 | 1.97 | 1.46 | |
| Dissolution/ permeation balance | kdiss/kperm and CS | 59.5 | 118 | 83.3 | 9.73 | 3.16 | 2.33 | 12.6 | 5.32 | 3.92 |
| kdiss/kperm and IDR | 58.7 | 115 | 81.0 | 9.16 | 2.80 | 2.06 | 11.8 | 4.64 | 3.43 | |
| Apowder and IDR | - | 81.0 | - | 2.06 | - | 3.43 | ||||
Disclaimer/Publisher’s Note: The statements, opinions and data contained in all publications are solely those of the individual author(s) and contributor(s) and not of MDPI and/or the editor(s). MDPI and/or the editor(s) disclaim responsibility for any injury to people or property resulting from any ideas, methods, instructions or products referred to in the content. |
© 2023 by the authors. Licensee MDPI, Basel, Switzerland. This article is an open access article distributed under the terms and conditions of the Creative Commons Attribution (CC BY) license (https://creativecommons.org/licenses/by/4.0/).
Share and Cite
Beran, K.; Hermans, E.; Holm, R.; Sepassi, K.; Dressman, J. Projection of Target Drug Particle Size in Oral Formulations Using the Refined Developability Classification System (rDCS). Pharmaceutics 2023, 15, 1909. https://doi.org/10.3390/pharmaceutics15071909
Beran K, Hermans E, Holm R, Sepassi K, Dressman J. Projection of Target Drug Particle Size in Oral Formulations Using the Refined Developability Classification System (rDCS). Pharmaceutics. 2023; 15(7):1909. https://doi.org/10.3390/pharmaceutics15071909
Chicago/Turabian StyleBeran, Kristian, Eline Hermans, René Holm, Kia Sepassi, and Jennifer Dressman. 2023. "Projection of Target Drug Particle Size in Oral Formulations Using the Refined Developability Classification System (rDCS)" Pharmaceutics 15, no. 7: 1909. https://doi.org/10.3390/pharmaceutics15071909