
Relevance of CYP2D6 Gene Variants in Population Genetic Differentiation
 , ,
, ,  , ,
, ,
Abstract
:1. Introduction
2. Materials and Methods
3. Results
4. Discussion
5. Conclusions
Supplementary Materials
Author Contributions
Funding
Institutional Review Board Statement
Data Availability Statement
Conflicts of Interest
References
- Larrey, D.; Distlerath, L.M.; Dannan, G.A.; Wilkinson, G.R.; Guengerich, F.P. Purification and characterization of the rat liver microsomal cytochrome P-450 involved in the 4-hydroxylation of debrisoquine, a prototype for genetic variation in oxidative drug metabolism. Biochemistry 1984, 23, 2787–2795. [Google Scholar] [CrossRef] [PubMed]
- Eichelbaum, M.; Baur, M.; Dengler, H.; Osikowska-Evers, B.; Tieves, G.; Zekorn, C.; Rittner, C. Chromosomal assignment of human cytochrome P-450 (debrisoquine/sparteine type) to chromosome 22. Br. J. Clin. Pharmacol. 1987, 23, 455–458. [Google Scholar] [CrossRef] [PubMed] [Green Version]
- Kimura, S.; Umeno, M.; Skoda, R.C.; A Meyer, U.; Gonzalez, F.J. The human debrisoquine 4-hydroxylase (CYP2D) locus: Sequence and identification of the polymorphic CYP2D6 gene, a related gene, and a pseudogene. Am. J. Hum. Genet. 1989, 45, 889–904. [Google Scholar] [PubMed]
- Daly, A.K.; Brockmoller, J.; Broly, F.; Eichelbaum, M.; E Evans, W.; Gonzalez, F.J.; Huang, J.D.; Idle, J.R.; Ingelman-Sundberg, M.; Ishizaki, T.; et al. Nomenclature for human CYP2D6 alleles. Pharmacogenetics 1996, 6, 193–201. [Google Scholar] [CrossRef] [PubMed]
- Gresham, D.; Morar, B.; Underhill, P.A.; Passarino, G.; Lin, A.A.; Wise, C.; Angelicheva, D.; Calafell, F.; Oefner, P.J.; Shen, P.; et al. Origins and Divergence of the Roma (Gypsies). Am. J. Hum. Genet. 2001, 69, 1314–1331. [Google Scholar] [CrossRef] [PubMed] [Green Version]
- Taylor, C.; Crosby, I.; Yip, V.; Maguire, P.; Pirmohamed, M.; Turner, R.M. A Review of the Important Role of CYP2D6 in Pharmacogenomics. Genes 2020, 11, 1295. [Google Scholar] [CrossRef] [PubMed]
- Caudle, K.E.; Sangkuhl, K.; Whirl-Carrillo, M.; Swen, J.J.; Haidar, C.E.; Klein, T.E.; Gammal, R.S.; Relling, M.V.; Scott, S.A.; Hertz, D.L.; et al. Standardizing CYP 2D6 Genotype to Phenotype Translation: Consensus Recommendations from the Clinical Pharmacogenetics Implementation Consortium and Dutch Pharmacogenetics Working Group. Clin. Transl. Sci. 2020, 13, 116–124. [Google Scholar] [CrossRef] [Green Version]
- The Human Cythchrome P450 (CYP) Allele Nomenclature Database. Available online: http://cypalleles.ki.se/ (accessed on 15 April 2022).
- PHARMGKB. Stanford University. Website. Available online: https://www.pharmgkb.org (accessed on 13 December 2021).
- Hicks, J.K.; Swen, J.J.; Gaedigk, A. Challenges in CYP2D6 Phenotype Assignment from Genotype Data: A Critical Assessment and Call for Standardization. Curr. Drug Metab. 2014, 15, 218–232. [Google Scholar] [CrossRef]
- Zanger, U.M.; Schwab, M. Cytochrome P450 enzymes in drug metabolism: Regulation of gene expression, enzyme activities, and impact of genetic variation. Pharmacol. Ther. 2013, 138, 103–141. [Google Scholar] [CrossRef]
- Williams, I.S.; Gatchie, L.; Bharate, S.B.; Chaudhuri, B. Biotransformation, Using Recombinant CYP450-Expressing Baker’s Yeast Cells, Identifies a Novel CYP2D6.10A122V Variant Which Is a Superior Metabolizer of Codeine to Morphine Than the Wild-Type Enzyme. ACS Omega 2018, 3, 8903–8912. [Google Scholar] [CrossRef] [PubMed]
- Ingelman-Sundberg, M.; Sim, S.C.; Gomez, A.; Rodriguez-Antona, C. Influence of cytochrome P450 polymor-phisms on drug therapies: Pharmacogenetic, pharmacoepigenetic and clinical aspects. Pharmacol. Ther. 2007, 116, 496–526. [Google Scholar] [CrossRef] [PubMed]
- Zanger, U.M.; Turpeinen, M.; Klein, K.; Schwab, M. Functional pharmacogenetics/genomics of human cyto-chromes P450 involved in drug biotransformation. Anal. Bioanal. Chem. 2008, 392, 1093–1108. [Google Scholar] [CrossRef] [PubMed]
- Fleeman, N.; Dundar, Y.; Dickson, R.; Jorgensen, A.; Pushpakom, S.; McLeod, C.; Pirmohamed, M.; Walley, T. Cytochrome P450 testing for prescribing antipsychotics in adults with schizophrenia: Systematic review and meta-analyses. Pharm. J. 2010, 11, 1–14. [Google Scholar] [CrossRef] [PubMed] [Green Version]
- Stingl, J.C.; Brockmöller, J.; Viviani, R. Genetic variability of drug-metabolizing enzymes: The dual impact on psychiatric therapy and regulation of brain function. Mol. Psychiatry 2012, 18, 273–287. [Google Scholar] [CrossRef] [PubMed]
- Gaedigk, A. Complexities of CYP2D6 gene analysis and interpretation. Int. Rev. Psychiatry 2013, 25, 534–553. [Google Scholar] [CrossRef] [PubMed]
- Hicks, J.K.; Bishop, J.R.; Sangkuhl, K.; Müller, D.J.; Ji, Y.; Leckband, S.G.; Leeder, J.S.; Graham, R.L.; Chiulli, D.L.; Llerena, A.; et al. Clinical Pharmacogenetics Implementation Consortium (CPIC) Guideline for CYP2D6 and CYP2C19 Genotypes and Dosing of Selective Serotonin Reuptake Inhibitors. Clin. Pharmacol. Ther. 2015, 98, 127–134. [Google Scholar] [CrossRef] [Green Version]
- Beoris, M.; Wilson, J.A.; Garces, J.A.; Lukowiak, A.A. CYP2D6 copy number distribution in the US population. Pharm. Genom. 2016, 26, 96–99. [Google Scholar] [CrossRef] [Green Version]
- Christensen, P.M.; Gotzsche, P.C.; Brosen, K. The sparteine/debrisoquine (CYP2D6) oxidation polymorphism and the risk of Parkinson’s disease: A meta-analysis. Pharmacogenetics 1998, 8, 473–479. [Google Scholar] [CrossRef]
- Lu, Y.; Peng, Q.; Zeng, Z.; Wang, J.; Deng, Y.; Xie, L.; Mo, C.; Zeng, J.; Qin, X.; Li, S. CYP2D6 phenotypes and Parkinson’s disease risk: A meta-analysis. J. Neurol. Sci. 2014, 336, 161–168. [Google Scholar] [CrossRef]
- Mishra, A.K.; Singh, M.P. Cytochrome P450 2D6 and Parkinson’s Disease: Polymorphism, Metabolic Role, Risk and Protection. Neurochem. Res. 2017, 42, 3353–3361. [Google Scholar] [CrossRef]
- Patsopoulos, N.; Ntzani, E.E.; Zintzaras, E.; Ioannidis, J.P. CYP2D6 polymorphisms and the risk of tardive dyskinesia in schizophrenia: A meta-analysis. Pharm. Genom. 2005, 15, 151–158. [Google Scholar] [CrossRef] [PubMed]
- Scordo, M.G.; Dahl, M.-L.; Spina, E.; Cordici, F.; Arena, M.G. No association between CYP2D6 polymorphism and Alzheimer’s disease in an Italian population. Pharmacol. Res. 2006, 53, 162–165. [Google Scholar] [CrossRef] [PubMed]
- Ma, S.L.; Tang, N.L.S.; Wat, K.H.Y.; Tang, J.H.Y.; Lau, K.H.; Law, C.B.; Chiu, J.; Tam, C.C.W.; Poon, T.K.; Lin, K.L.; et al. Effect of CYP2D6 and CYP3A4 Genotypes on the Efficacy of Cholinesterase Inhibitors in Southern Chinese Patients With Alzheimer’s Disease. Am. J. Alzheimer’s Dis. Other Dement. 2019, 34, 302–307. [Google Scholar] [CrossRef] [PubMed]
- Agundez, J.A. Cytochrome P450 Gene Polymorphism and Cancer. Curr. Drug Metab. 2004, 5, 211–224. [Google Scholar] [CrossRef]
- Rodriguez-Antona, C.; Gomez, A.; Karlgren, M.; Sim, S.C.; Ingelman-Sundberg, M. Molecular genetics and epigenetics of the cytochrome P450 gene family and its relevance for cancer risk and treatment. Qual. Life Res. 2009, 127, 1–17. [Google Scholar] [CrossRef]
- Ingelman-Sundberg, M. Genetic polymorphisms of cytochrome P450 2D6 (CYP2D6): Clinical consequences, evolutionary aspects and functional diversity. Pharm. J. 2004, 5, 6–13. [Google Scholar] [CrossRef]
- Aklillu, E.; Herrlin, K.; Gustafsson, L.L.; Bertilsson, L.; Ingelman-Sundberg, M. Evidence for environmental influence on CYP2D6-catalysed debrisoquine hydroxylation as demonstrated by phenotyping and genotyping of Ethiopians living in Ethiopia or in Sweden. Pharmacogenetics 2002, 12, 375–383. [Google Scholar] [CrossRef]
- Podgorná, E.; Diallo, I.; Vangenot, C.; Sanchez-Mazas, A.; Sabbagh, A.; Černý, V.; Poloni, E.S. Variation in NAT2 acetylation phenotypes is associated with differences in food-producing subsistence modes and ecoregions in Africa. BMC Evol. Biol. 2015, 15, 263. [Google Scholar] [CrossRef] [Green Version]
- Fuselli, S.; de Filippo, C.; Mona, S.; Sistonen, J.; Fariselli, P.; Destro-Bisol, G.; Barbujani, G.; Bertorelle, G.; Sajantila, A. Evolution of detoxifying systems: The role of environment and population history in shaping genetic diversity at human CYP2D6 locus. Pharm. Genom. 2010, 20, 485–499. [Google Scholar] [CrossRef]
- Thomas, J.H. Rapid Birth–Death Evolution Specific to Xenobiotic Cytochrome P450 Genes in Vertebrates. PLoS Genet. 2007, 3, e67. [Google Scholar] [CrossRef]
- Delser, P.M.; Fuselli, S. Human loci involved in drug biotransformation: Worldwide genetic variation, population structure, and pharmacogenetic implications. Qual. Life Res. 2013, 132, 563–577. [Google Scholar] [CrossRef]
- Fuselli, S. Beyond drugs: The evolution of genes involved in human response to medications. Proc. R. Soc. B Boil. Sci. 2019, 286, 20191716. [Google Scholar] [CrossRef] [PubMed] [Green Version]
- Cunningham, F.; E Allen, J.; Allen, J.; Alvarez-Jarreta, J.; Amode, M.R.; Armean, I.M.; Austine-Orimoloye, O.; Azov, A.G.; Barnes, I.; Bennett, R.; et al. Ensembl. Nucleic Acids Res. 2022, 50, D988–D995. [Google Scholar] [CrossRef]
- The 1000 Genomes Project Consortium. A global reference for human genetic variation. Nature 2015, 526, 68–74. [Google Scholar] [CrossRef] [PubMed] [Green Version]
- Danecek, P.; Auton, A.; Abecasis, G.; Albers, C.A.; Banks, E.; DePristo, M.A.; Handsaker, R.E.; Lunter, G.; Marth, G.T.; Sherry, S.T.; et al. The variant call format and VCFtools. Bioinformatics 2011, 27, 2156–2158. [Google Scholar] [CrossRef] [PubMed]
- Barrett, J.C.; Fry, B.; Maller, J.; Daly, M.J. Haploview: Analysis and visualization of LD and haplotype maps. Bioinformatics 2005, 21, 263–265. [Google Scholar] [CrossRef] [Green Version]
- Gabriel, S.B.; Schaffner, S.F.; Nguyen, H.; Moore, J.M.; Roy, J.; Blumenstiel, B.; Higgins, J.; DeFelice, M.; Lochner, A.; Faggart, M.; et al. The Structure of Haplotype Blocks in the Human Genome. Science 2002, 296, 2225–2229. [Google Scholar] [CrossRef] [Green Version]
- Stephens, M.; Donnelly, P. A Comparison of Bayesian Methods for Haplotype Reconstruction from Population Genotype Data. Am. J. Hum. Genet. 2003, 73, 1162–1169. [Google Scholar] [CrossRef] [Green Version]
- Stephens, M.; Smith, N.J.; Donnelly, P. A New Statistical Method for Haplotype Reconstruction from Population Data. Am. J. Hum. Genet. 2001, 68, 978–989. [Google Scholar] [CrossRef] [Green Version]
- Excoffier, L.; Lischer, H.E.L. Arlequin suite ver 3.5: A new series of programs to perform population genetics analyses under Linux and Windows. Mol. Ecol. Resour. 2010, 10, 564–567. [Google Scholar] [CrossRef]
- van der Weide, J.; Steijns, L.S.W. Cytochrome P450 Enzyme System: Genetic Polymorphisms and Impact on Clinical Pharmacology. Ann. Clin. Biochem. Int. J. Lab. Med. 1999, 36, 722–729. [Google Scholar] [CrossRef] [PubMed] [Green Version]
- Rodrigues, J.C.G.; Fernandes, M.R.; Ribeiro-Dos-Santos, A.M.; de Araújo, G.S.; de Souza, S.J.; Guerreiro, J.F.; Ribeiro-Dos-Santos, Â.; de Assumpção, P.P.; dos Santos, N.P.C.; Santos, S. Pharmacogenomic Profile of Amazonian Amerindians. J. Pers. Med. 2022, 12, 952. [Google Scholar] [CrossRef] [PubMed]
- Idda, M.L.; Zoledziewska, M.; Urru, S.A.M.; McInnes, G.; Bilotta, A.; Nuvoli, V.; Lodde, V.; Orrù, S.; Schlessinger, D.; Cucca, F.; et al. Genetic Variation among Pharmacogenes in the Sardinian Population. Int. J. Mol. Sci. 2022, 23, 10058. [Google Scholar] [CrossRef] [PubMed]
- Wang, W.Y.; Twesigomwe, D.; Nofziger, C.; Turner, A.J.; Helmecke, L.-S.; Broeckel, U.; Derezinski, A.D.; Hazelhurst, S.; Gaedigk, A. Characterization of Novel CYP2D6 Alleles across Sub-Saharan African Populations. J. Pers. Med. 2022, 12, 1575. [Google Scholar] [CrossRef] [PubMed]
- Jay, F.; Sjödin, P.; Jakobsson, M.; Blum, M.G. Anisotropic Isolation by Distance: The Main Orientations of Human Genetic Differentiation. Mol. Biol. Evol. 2013, 30, 513–525. [Google Scholar] [CrossRef] [PubMed] [Green Version]
- Bamshad, M.; Wooding, S.P. Signatures of natural selection in the human genome. Nat. Rev. Genet. 2003, 4, 99–110. [Google Scholar] [CrossRef] [PubMed]
- Runcharoen, C.; Fukunaga, K.; Sensorn, I.; Iemwimangsa, N.; Klumsathian, S.; Tong, H.; Vo, N.S.; Le, L.; Hlaing, T.M.; Thant, M.; et al. Prevalence of pharmacogenomic variants in 100 pharmacogenes among Southeast Asian populations under the collaboration of the Southeast Asian Pharmacogenomics Research Network (SEAPharm). Hum. Genome Var. 2021, 8, 1–6. [Google Scholar] [CrossRef]
- Zhang, C.; Jiang, X.; Chen, W.; Li, Q.; Yun, F.; Yang, X.; Dai, R.; Cheng, Y. Population genetic difference of pharmacogenomic VIP gene variants in the Lisu population from Yunnan Province. Medicine 2018, 97, e13674. [Google Scholar] [CrossRef]
- Li, D.; Peng, L.; Xing, S.; He, C.; Jin, T. Genetic analysis of pharmacogenomic VIP variants in the Wa population from Yunnan Province of China. BMC Genom. Data 2021, 22, 1–20. [Google Scholar] [CrossRef]
- Lee, J.Y.; Vinayagamoorthy, N.; Han, K.; Kwok, S.K.; Ju, J.H.; Park, K.S.; Jung, S.-H.; Park, S.-W.; Chung, Y.-J. Association of Polymorphisms of Cytochrome P450 2D6 With Blood Hydroxychloroquine Levels in Patients with Systemic Lupus Erythematosus. Arthritis Rheumatol. 2016, 68, 184–190. [Google Scholar] [CrossRef]
- López-García, M.A.; Feria-Romero, I.A.; Serrano, H.; Rayo-Mares, D.; Fagiolino, P.; Vázquez, M.; Escamilla-Núñez, C.; Grijalva, I.; Escalante-Santiago, D.; Orozco-Suarez, S. Influence of genetic variants of CYP2D6, CYP2C9, CYP2C19 and CYP3A4 on antiepileptic drug metabolism in pediatric patients with refractory epilepsy. Pharmacol. Rep. 2017, 69, 504–511. [Google Scholar] [CrossRef] [PubMed]
- Lymperopoulos, A.; McCrink, K.A.; Brill, A. Impact of CYP2D6 Genetic Variation on the Response of the Cardiovascular Patient to Carvedilol and Metoprolol. Curr. Drug Metab. 2015, 17, 30–36. [Google Scholar] [CrossRef] [PubMed]
- Masimirembwa, C.; Persson, I.; Bertilsson, L.; Hasler, J.; Ingelman-Sundberg, M. A novel mutant variant of the CYP2D6 gene (CYP2D617) common in a black African population: Association with diminished debrisoquine hydroxylase activity. Br. J. Clin. Pharmacol. 1996, 42, 713–719. [Google Scholar] [CrossRef] [Green Version]
- Muyambo, S.; Ndadza, A.; Soko, N.D.; Kruger, B.; Kadzirange, G.; Chimusa, E.; Masimirembwa, C.M.; Ntsekhe, M.; Nhachi, C.F.; Dandara, C. Warfarin Pharmacogenomics for Precision Medicine in Real-Life Clinical Practice in Southern Africa: Harnessing 73 Variants in 29 Pharmacogenes. OMICS: A J. Integr. Biol. 2022, 26, 35–50. [Google Scholar] [CrossRef] [PubMed]
- Prohaska, A.; Racimo, F.; Schork, A.J.; Sikora, M.; Stern, A.J.; Ilardo, M.; Allentoft, M.E.; Folkersen, L.; Buil, A.; Moreno-Mayar, J.V.; et al. Human Disease Variation in the Light of Population Genomics. Cell 2019, 177, 115–131. [Google Scholar] [CrossRef] [PubMed] [Green Version]
- Sanchez-Mazas, A.; Poloni, E.S.; Genetic Diversity in Africa. Encyclopedia of Life Sciences 2008. Available online: https://www.els.net/ (accessed on 15 April 2022).
- Li, J.; Zhang, L.; Zhou, H.; Stoneking, M.; Tang, K. Global patterns of genetic diversity and signals of natural selection for human ADME genes. Hum. Mol. Genet. 2011, 20, 528–540. [Google Scholar] [CrossRef] [PubMed] [Green Version]
- Marković, A.S.; Petranović, M.Z.; Škobalj, M.; Poloni, E.S.; Oberški, L.P.; Škarić-Jurić, T.; Salihović, M.P. From dietary adaptation in the past to drug metabolism of today: An example of NAT genes in the Croatian Roma. Am. J. Biol. Anthr. 2022, 178, 140–153. [Google Scholar] [CrossRef]
- Marković, A.S.; Petranović, M.Z.; Tomas, Z.; Puljko, B.; Šetinc, M.; Škarić-Jurić, T.; Salihović, M.P. Untangling SNP Variations within CYP2D6 Gene in Croatian Roma. J. Pers. Med. 2022, 12, 374. [Google Scholar] [CrossRef]
- Petranovic, M.Z.; Tomas, Z.; Skaric-Juric, T.; Narancic, N.S.; Janicijevic, B.; Markovic, A.S.; Salihovic, M.P. The variability of multi-drug resistance ABCB1 gene in the Roma population from Croatia. Mol. Exp. Biol. Med. 2019, 2, 10–18. [Google Scholar] [CrossRef]
- Dlouhá, L.; Adámková, V.; Šedová, L.; Olišarová, V.; Hubáček, J.A.; Tóthová, V. Five genetic polymorphisms of cytochrome P450 enzymes in the Czech non-Roma and Czech Roma population samples. Drug Metab. Pers. Ther. 2020, 35, 20200103. [Google Scholar] [CrossRef]
- Weber, A.; Szalai, R.; Sipeky, C.; Magyari, L.; Melegh, M.; Jaromi, L.; Matyas, P.; Duga, B.; Kovesdi, E.; Hadzsiev, K.; et al. Increased prevalence of functional minor allele variants of drug metabolizing CYP2B6 and CYP2D6 genes in Roma population samples. Pharmacol. Rep. 2015, 67, 460–464. [Google Scholar] [CrossRef] [PubMed]
- Moyà, G.; Dorado, P.; Ferreiro, V.; Naranjo, M.E.G.; Peñas-Lledó, E.M.; Llerena, A. High frequency of CYP2D6 ultrarapid metabolizer genotypes in an Ashkenazi Jewish population from Argentina. Pharm. J. 2016, 17, 378–381. [Google Scholar] [CrossRef]
- Wen, Y.F.; Gaedigk, A.; Boone, E.C.; Wang, W.Y.; Straka, R.J. The Identification of Novel CYP2D6 Variants in US Hmong: Results from Genome Sequencing and Clinical Genotyping. Front. Pharmacol. 2022, 13, 867331. [Google Scholar] [CrossRef] [PubMed]
- Li, J.; Lou, H.; Yang, X.; Lu, D.; Li, S.; Jin, L.; Pan, X.; Yang, W.; Song, M.; Mamatyusupu, D.; et al. Genetic architectures of ADME genes in five Eurasian admixed populations and implications for drug safety and efficacy. J. Med Genet. 2014, 51, 614–622. [Google Scholar] [CrossRef] [PubMed]
- Sistonen, J.; Sajantila, A.; Lao, O.; Corander, J.; Barbujani, G.; Fuselli, S. CYP2D6 worldwide genetic variation shows high frequency of altered activity variants and no continental structure. Pharm. Genom. 2007, 17, 93–101. [Google Scholar] [CrossRef]
- Wennerholm, A.; Dandara, C.; Sayi, J.; Svensson, J.; Abdi, Y.A.; Ingelman-Sundberg, M.; Bertilsson, L.; Hasler, J.; Gustafsson, L.L. The African-specific CYP2D6*17 allele encodes an enzyme with changed substrate specificity. Clin. Pharmacol. Ther. 2002, 71, 77–88. [Google Scholar] [CrossRef]
- Bogni, A.; Monshouwer, M.; Moscone, A.; Hidestrand, M.; Ingelman-Sundberg, M.; Hartung, T.; Coecke, S. Substrate specific metabolism by polymorphic cytochrome P450 2D6 alleles. Toxicol. Vitr. 2005, 19, 621–629. [Google Scholar] [CrossRef]
- Shen, H.; He, M.M.; Liu, H.; Wrighton, S.A.; Wang, L.; Guo, B.; Li, C. Comparative Metabolic Capabilities and Inhibitory Profiles of CYP2D6.1, CYP2D6.10, and CYP2D6. Drug Metab. Dispos. 2007, 35, 1292–1300. [Google Scholar] [CrossRef]
- Wang, B.; Yang, L.-P.; Zhang, X.-Z.; Huang, S.-Q.; Bartlam, M.; Zhou, S.-F. New insights into the structural characteristics and functional relevance of the human cytochrome P450 2D6 enzyme. Drug Metab. Rev. 2009, 41, 573–643. [Google Scholar] [CrossRef]


| Sample Size | No. of Haplotypes | No. of Polymorphic Sites | Haplotype Diversity | Nucleotide Diversity | ||
|---|---|---|---|---|---|---|
| African Ancestry | ESN | 198 | 36 | 50 | 0.935 | 0.113 |
| GWD | 226 | 37 | 49 | 0.918 | 0.114 | |
| MSL | 170 | 32 | 46 | 0.933 | 0.113 | |
| YRI | 216 | 31 | 48 | 0.926 | 0.109 | |
| LWK | 198 | 35 | 48 | 0.936 | 0.113 | |
| ACB | 192 | 36 | 48 | 0.933 | 0.115 | |
| ASW | 122 | 36 | 55 | 0.908 | 0.109 | |
| American Ancestry | CLM | 188 | 26 | 44 | 0.813 | 0.106 |
| MXL | 128 | 23 | 36 | 0.764 | 0.092 | |
| PEL | 170 | 16 | 34 | 0.602 | 0.086 | |
| PUR | 208 | 32 | 56 | 0.875 | 0.113 | |
| European Ancestry | CEU | 198 | 21 | 38 | 0.847 | 0.112 |
| FIN | 198 | 19 | 36 | 0.778 | 0.102 | |
| GBR | 182 | 17 | 35 | 0.834 | 0.112 | |
| IBS | 214 | 27 | 47 | 0.851 | 0.110 | |
| TSI | 214 | 22 | 41 | 0.845 | 0.113 | |
| South Asian Ancestry | BEB | 172 | 22 | 34 | 0.809 | 0.099 |
| GIH | 206 | 22 | 36 | 0.787 | 0.106 | |
| ITU | 204 | 21 | 34 | 0.794 | 0.105 | |
| PJL | 192 | 18 | 37 | 0.713 | 0.094 | |
| STU | 204 | 28 | 38 | 0.784 | 0.102 | |
| East Asian Ancestry | CDX | 186 | 18 | 26 | 0.620 | 0.069 |
| CHB | 206 | 19 | 30 | 0.637 | 0.075 | |
| CHS | 210 | 20 | 27 | 0.643 | 0.071 | |
| JPT | 208 | 11 | 23 | 0.717 | 0.074 | |
| KHV | 198 | 22 | 30 | 0.607 | 0.066 |
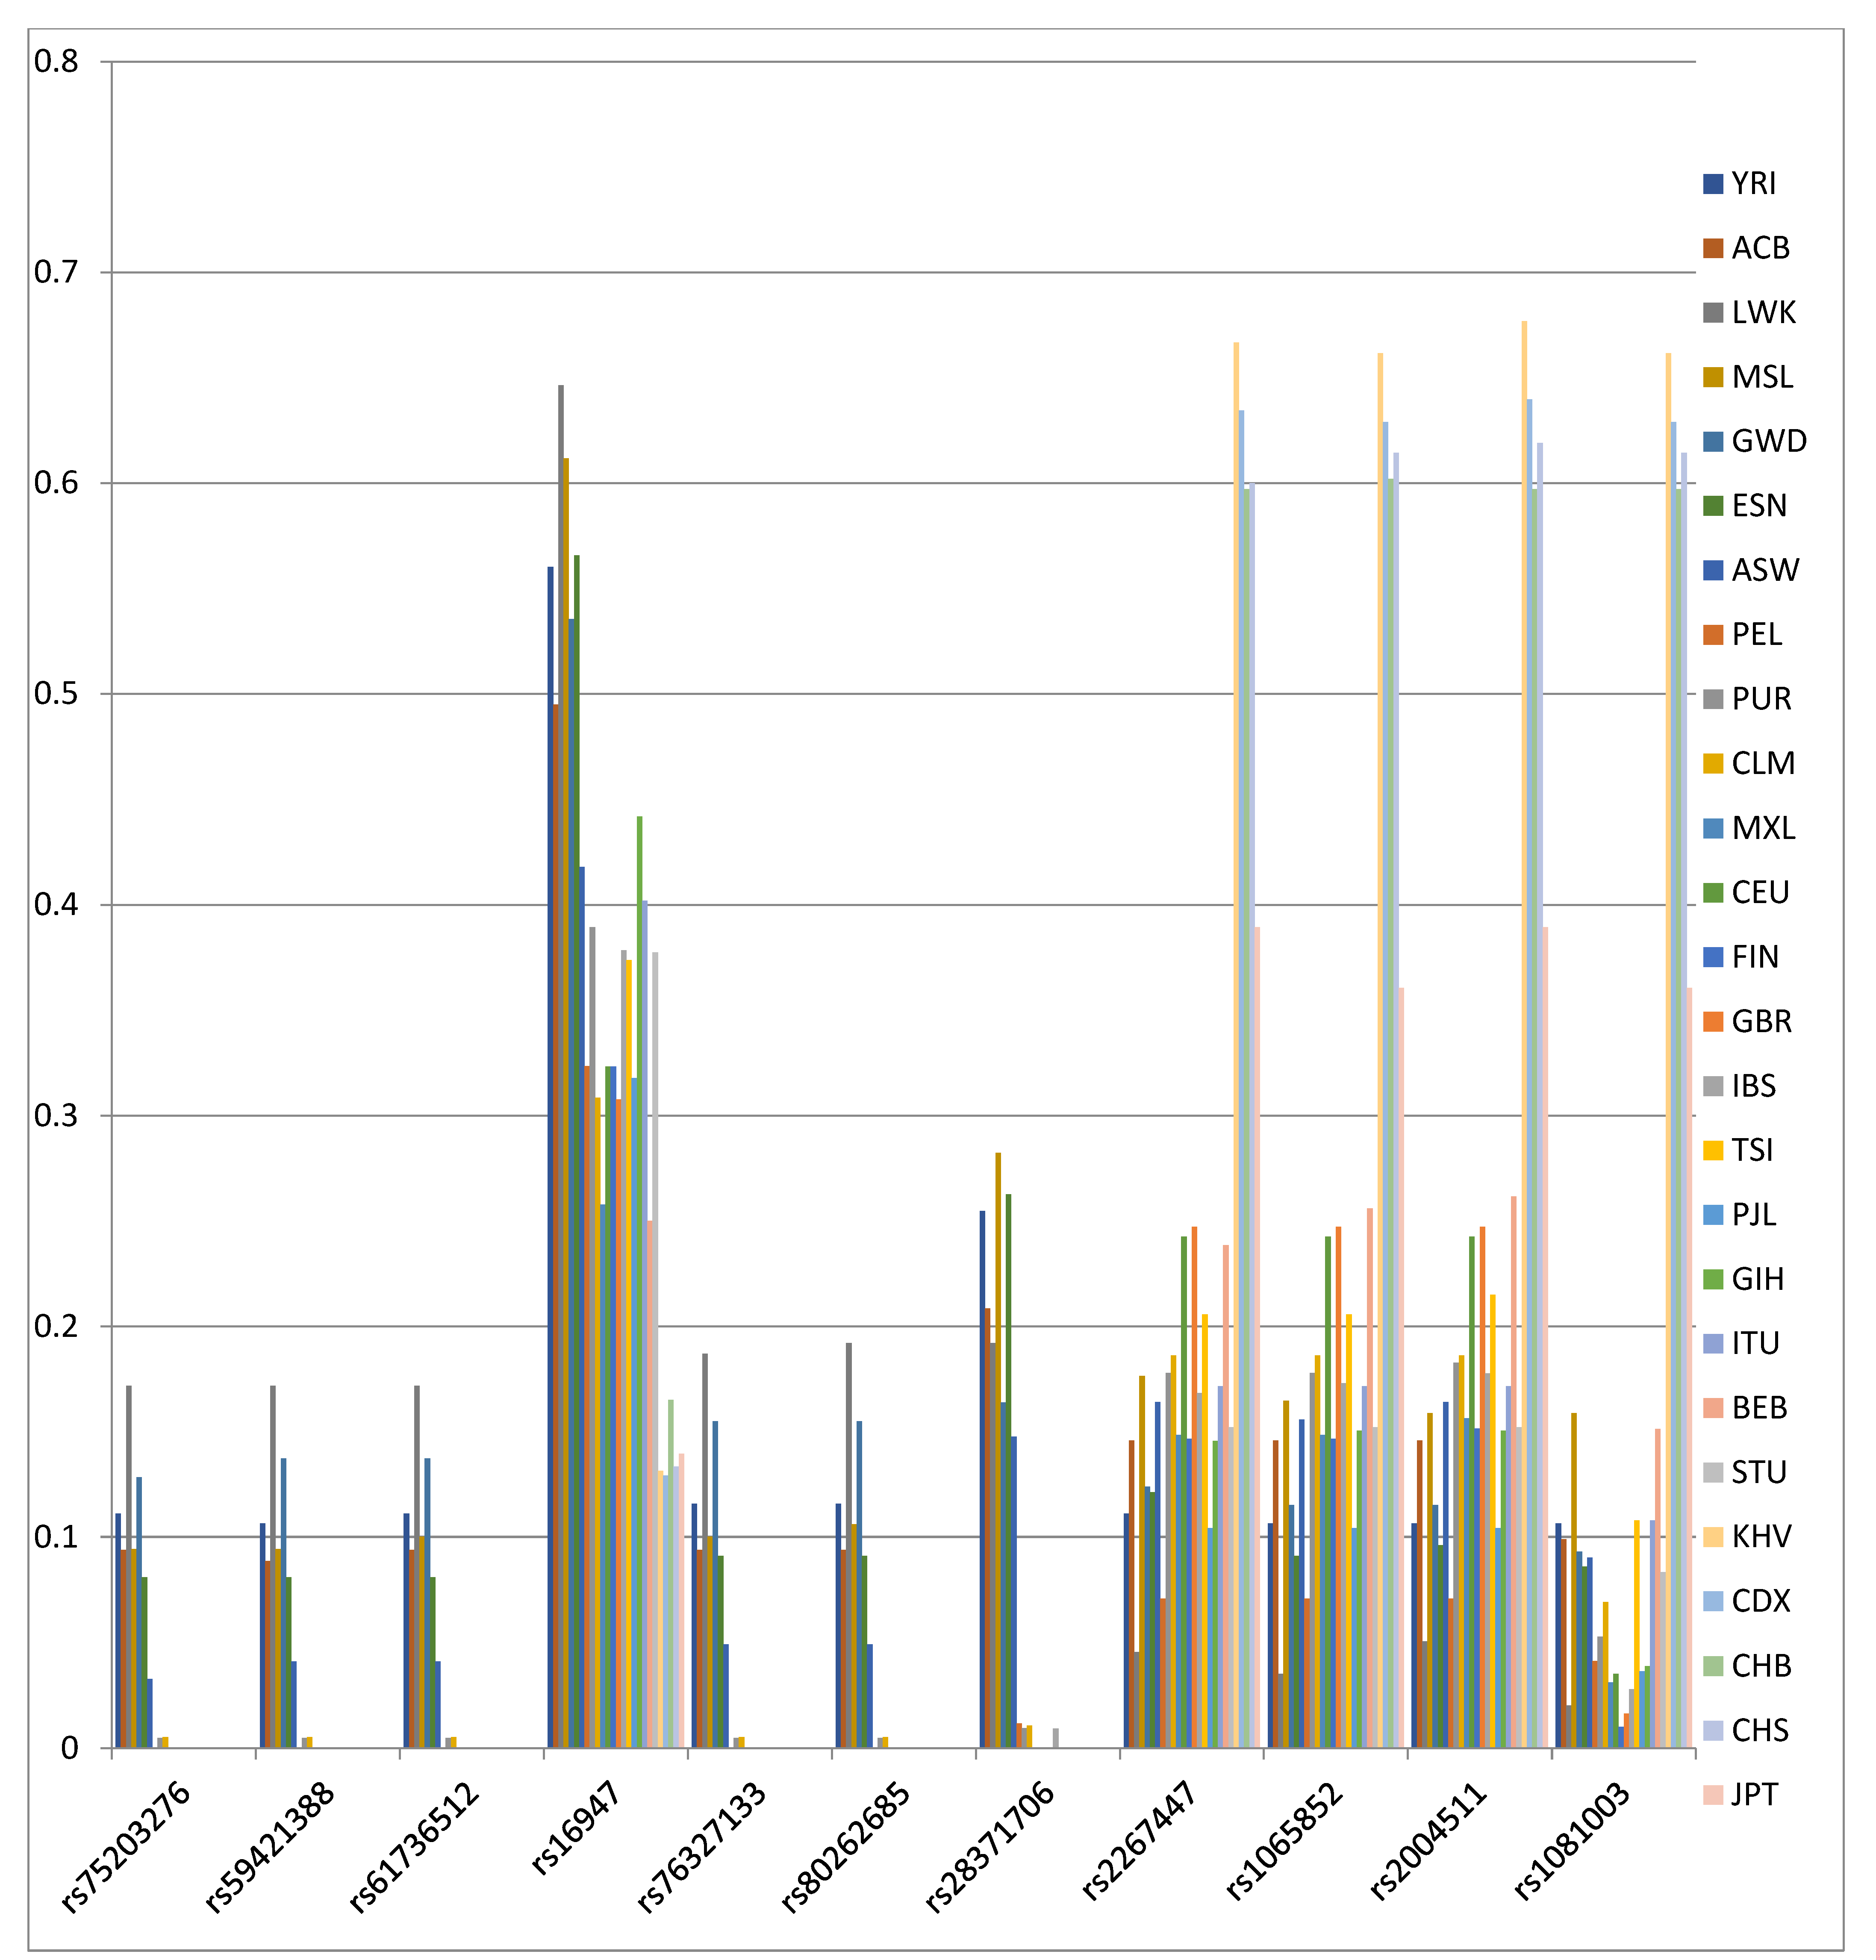
| SNP | Position | FST | p | FCT | p |
|---|---|---|---|---|---|
| rs1081003 | 42129754 | 0.366 | <0.00001 | 0.343 | 0.00001 |
| rs2004511 | 42127209 | 0.211 | <0.00001 | 0.193 | 0.00001 |
| rs1065852 | 42130692 | 0.209 | <0.00001 | 0.188 | <0.00001 |
| rs2267447 | 42128694 | 0.204 | <0.00001 | 0.187 | <0.00001 |
| rs28371706 | 42129770 | 0.197 | <0.00001 | 0.163 | 0.0001 |
| rs80262685 | 42128576 | 0.117 | <0.00001 | 0.096 | 0.00015 |
| rs76327133 | 42128668 | 0.115 | <0.00001 | 0.094 | 0.00025 |
| rs16947 | 42127941 | 0.111 | <0.00001 | 0.099 | <0.00001 |
| rs61736512 | 42129132 | 0.105 | <0.00001 | 0.085 | 0.00026 |
| rs59421388 | 42127608 | 0.104 | <0.00001 | 0.084 | 0.0002 |
| rs75203276 | 42128499 | 0.103 | <0.00001 | 0.081 | 0.00014 |
Publisher’s Note: MDPI stays neutral with regard to jurisdictional claims in published maps and institutional affiliations. |
© 2022 by the authors. Licensee MDPI, Basel, Switzerland. This article is an open access article distributed under the terms and conditions of the Creative Commons Attribution (CC BY) license (https://creativecommons.org/licenses/by/4.0/).
Share and Cite
Stojanović Marković, A.; Zajc Petranović, M.; Škarić-Jurić, T.; Celinšćak, Ž.; Šetinc, M.; Tomas, Ž.; Peričić Salihović, M. Relevance of CYP2D6 Gene Variants in Population Genetic Differentiation. Pharmaceutics 2022, 14, 2481. https://doi.org/10.3390/pharmaceutics14112481
Stojanović Marković A, Zajc Petranović M, Škarić-Jurić T, Celinšćak Ž, Šetinc M, Tomas Ž, Peričić Salihović M. Relevance of CYP2D6 Gene Variants in Population Genetic Differentiation. Pharmaceutics. 2022; 14(11):2481. https://doi.org/10.3390/pharmaceutics14112481
Chicago/Turabian StyleStojanović Marković, Anita, Matea Zajc Petranović, Tatjana Škarić-Jurić, Željka Celinšćak, Maja Šetinc, Željka Tomas, and Marijana Peričić Salihović. 2022. "Relevance of CYP2D6 Gene Variants in Population Genetic Differentiation" Pharmaceutics 14, no. 11: 2481. https://doi.org/10.3390/pharmaceutics14112481