Article

Exploring Proteus mirabilis Methionine tRNA Synthetase Active Site: Homology Model Construction, Molecular Dynamics, Pharmacophore and Docking Validation

1
Department of Medicinal Chemistry, Faculty of Pharmacy, Zagazig University, Zagazig 44519, Egypt
2
School of Pharmacy & Pharmaceutical Sciences, Cardiff University, King Edward VII Avenue, Cardiff CF10 3NB, UK
*
Author to whom correspondence should be addressed.
Pharmaceuticals 2023, 16(9), 1263; https://doi.org/10.3390/ph16091263
Submission received: 24 July 2023 / Revised: 23 August 2023 / Accepted: 1 September 2023 / Published: 6 September 2023

Abstract

:
Currently, the treatment of Proteus mirabilis infections is considered to be complicated as the organism has become resistant to numerous antibiotic classes. Therefore, new inhibitors should be developed, targeting bacterial molecular functions. Methionine tRNA synthetase (MetRS), a member of the aminoacyl-tRNA synthetase family, is essential for protein biosynthesis offering a promising target for novel antibiotics discovery. In the context of computer-aided drug design (CADD), the current research presents the construction and analysis of a comparative homology model for P. mirabilis MetRS, enabling development of novel inhibitors with greater selectivity. Molecular Operating Environment (MOE) software was used to build a homology model for P. mirabilis MetRS using Escherichia coli MetRS as a template. The model was evaluated, and the active site of the target protein predicted from its sequence using conservation analysis. Molecular dynamic simulations were performed to evaluate the stability of the modeled protein structure. In order to evaluate the predicted active site interactions, methionine (the natural substrate of MetRS) and several inhibitors of bacterial MetRS were docked into the constructed model using MOE. After validation of the model, pharmacophore-based virtual screening for a systemically prepared dataset of compounds was performed to prove the feasibility of the proposed model, identifying possible parent compounds for further development of MetRS inhibitors against P. mirabilis.

1. Introduction

Proteus mirabilis (P. mirabilis) urinary tract infections can be either symptomatic infections causing cystitis or pyelonephritis, or asymptomatic infections leading to bacteriuria. P. mirabilis infections are common among elderly people and patients with type II diabetes [1,2]. Moreover, P. mirabilis infections can cause urolithiasis. Catheterized patients infected with P. mirabilis are highly susceptible to the development of urolithiasis, a complication in which bladder and kidney stones obstruct the catheter and urinary tract, making treatment more difficult. Moreover, urosepsis could be developed, which is the major cause of death due to P. mirabilis infections. In recent studies, P. mirabilis was isolated from 5 to 20% of patients with a bloodstream infection and was found to be the leading cause of death in 50% of geriatric, hospitalized patients [3,4], as it can progress to potentially life-threatening urosepsis. In addition to urinary tract infections, P. mirabilis bacteria is a leading cause of respiratory tract, eye, nose, ear, burn and wound infections; and has been associated with neonatal meningoencephalitis and osteomyelitis [5,6].
Treatment of P. mirabilis infection relies on double-strength trimethoprim-sulfamethoxazole (SXT) (Figure 1) if the local SXT resistance rate is not more than 10–20% [7,8]. Recently, a wide resistance spectrum ranging from 16 to 83% of P. mirabilis against SXT has developed [7,8,9], and, in such cases, an alternative antibiotic therapy is recommended including fluoroquinolones, nitrofurantoin, or fosfomycin in cases of uncomplicated cystitis. However, all of these antibiotics have shown some reported resistance (Figure 1) [7,8,10].
In addition to the SXT resistance, P. mirabilis has developed resistance to several antibiotic classes including β-lactams, fluoroquinolones, nitrofurantoin, fosfomycin, aminoglycosides, tetracyclines, and sulfonamides [9,10,11]. P. mirabilis is also highly resistant to antimicrobial peptides such as polymyxin B, protegrin, LL-37, and defensin [12,13]. Aminoacyl-tRNA synthetase (AaRS) provides a potential wealth of targets in the development of drugs against P. mirabilis infections. The aminoacyl tRNA synthetases (AaRSs) are a group of enzymes that play an important role in protein biosynthesis. AaRSs catalyze the aminoacylation reaction of the tRNA molecule in the protein synthesis process, through two main steps. In the first step, the amino acid is activated through reaction with an ATP molecule, forming aminoacyl adenylate. In the second step, the aminoacyl adenylate reacts with its cognate tRNA molecule through esterification, and the aminoacyl tRNA is now ready for the next steps in the protein synthesis pathway. AaRSs are able to bind to and recognize all of the reactants in this aminoacylation reaction: the amino acid, ATP, and the cognate tRNA [14]. When any of these stages is inhibited, accumulation of uncharged tRNA molecules takes place, which bind to ribosomes, causing an interruption in the polypeptide chain elongation [15]. There are more than 20 types of AaRS enzymes that are classified into two classes according to the structural features of their active site. The active site of Class I AaRS enzymes contain a catalytic Rossman fold with two conserved motifs, HIGH and KMSKS, whereas the active site of class II enzymes has an antiparallel β-sheet structure with three consensus motifs, I, II, and III in the catalytic center [14,15,16].
Methionyl tRNA synthetase (MetRS) is considered a class I AaRS enzyme expressing structural features of a class I aminoacyl-tRNA synthetase. Aside from the Rossmann fold and the signature sequences “HIGH” and “KMSKS” motifs, MetRS also contains connective peptide (CP) and a zinc finger along with the stem contact (SC) fold domain and C-terminal alpha-helix bundle domain [17,18].
Virtual screening (VS) is an effective low-cost CADD tool in drug discovery when compared with traditional high-throughput screening (HTS). Ligand-based and structure-based design are the two approaches for VS [19]. Molecular docking using crystal structures of target proteins from the protein data bank (PDB) is the most used method for structure-based drug design [19,20]. However, targets with unknown 3D crystal structure may require the use of a homology modeling strategy and pharmacophore modeling techniques. Structure-based or ligand-based pharmacophore could be used to obtain a 3D pharmacophore model [21]. As there is no crystal structure available for P. mirabilis MetRS, comparative structure modeling was used to construct a homology model for the P. mirabilis MetRS enzyme. The P. mirabilis MetRS homology model and its subsequent evaluation along with pharmacophore-based virtual screening is described.

2. Results and Discussion

2.1. Homology Model and Validation

Initial screening for possible templates for P. mirabilis MetRS amino acid sequence against the PDB-resolved structures was achieved using a BLAST analysis [22], obtained from the ExPASy proteomics server [23]. Three structures were identified and considered as possible templates (Table 1). For a structure to be considered a template, it should be a wild type, rather than engineered or mutant, have more than 25% of identity with the P. mirabilis MetRS amino acid sequence, and have the same function. The first three native hits were bacterial MetRS enzymes of Escherichia coli [24], that was the best template owing to the high sequence identity (80%), followed by Acenitobacter baumannii (59%), and Pyrococcus abyss (33%).
To obtain more information regarding the best potential template, a phylogenetic tree was constructed using the phylogeny server [25] in order to determine the relative distances between various templates and the target sequence (Figure 2). The different evolutionary branching between the prokaryotic and eukaryotic MetRS enzymes is obviously demonstrated in the constructed phylogenetic tree. The closest homologies to P. mirabilis in this group of species was the Gram-negative bacteria E. coli (P00959) followed by Pseudomonas aeruginosa (Q9HYC7). A lower homology was observed with the Gram-positive Enterococcus faecalis and Streptococcus pyogenes, with a clear difference observed for the non-bacterial organisms. A percent identity matrix (Supplementary Figure S1) provided further validation.

2.2. Multiple Sequence and Structural Alignments

Clustal Omega 1.2.4 [26] was used to align the possible template sequences: E. coli (P00959), A. baumannii (A0A0D5YKJ7), P. abyssi (Q9V011), and A. aeolicus (O67298) MetRSs with the amino acid sequence of P. mirabilis MetRS (Figure 3). The input set of query and template sequences have an evolutionary relationship as they are Gram-negative bacteria. No gap was observed in alignment between the P. mirabilis and E. coli MetRS sequence and there were very few gaps in the sequence alignment of P. mirabilis, P. abyssi and A. baumannii MetRS. This result is consistent with the distinction between the two groups that is explained by the constructed phylogenetic tree. HIGH and KMSKS motifs are recognized in the proposed sequences of the possible templates and the query enzyme, indicated by the boxed amino acid residues in Figure 3.
The secondary structure prediction for P. mirabilis MetRS using PSIPRED [27] revealed the high helix content predicted throughout the sequence. The C-terminus had a higher degree of strands and coils as expected compared with the rest of the protein sequence. The region of the HIGH motif (Table 2) is a sequence of about ten residues and present in most homologous enzymes at the sequence positions just before the 22nd residue in the N terminus of these enzymes. This area of the query sequence was predicted by PSIPRED to fold in coils and helices (Supplementary Figures S2 and S3).
The KMSKS motif contains the ATP binding site and has been found in the P. mirabilis sequence aligned to the E. coli sequence (Table 2). The E. coli 3D structure contains coils and strands from position 333 to 337 which agrees with the PSIPRED predictions for the query sequence. The Rossmann fold domain of E. coli, formed by two polypeptide sequences (residues 6–115 and 252–326), is connected by the connective polypeptide domain (residues 119–251).

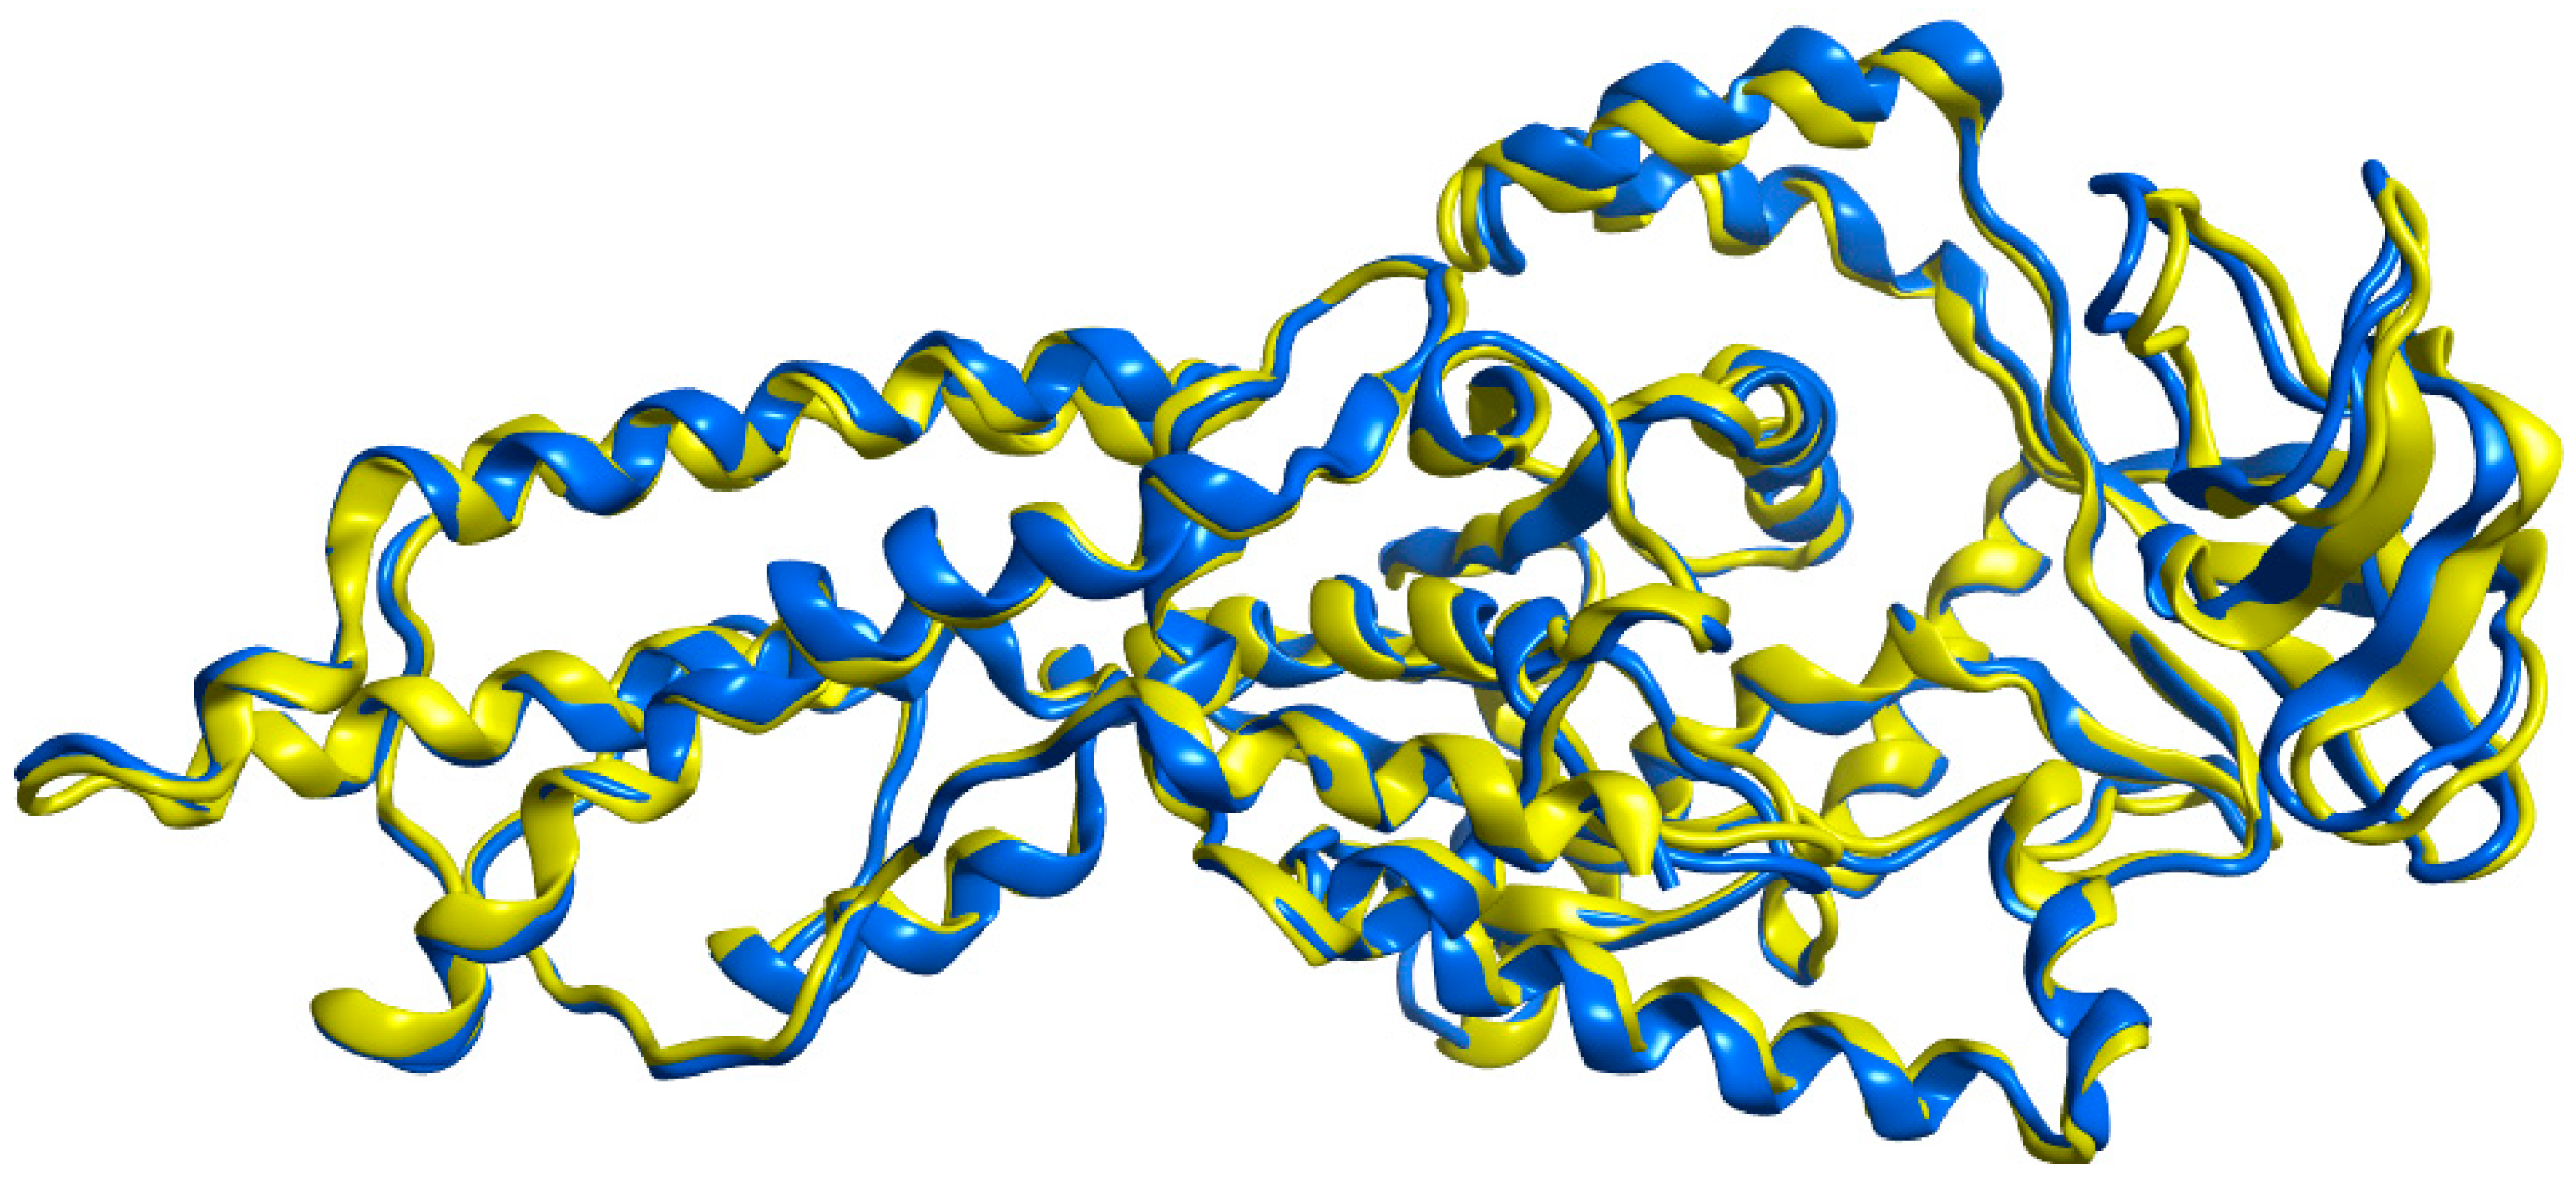
2.3. 3D Homology Model

The lowest energy 3D homology model was constructed using E. coli MetRS (1F4L) crystal structure through the Molecular Operating Environment (MOE) software [28], as explained in the experimental section. The homology model was subject to a 200 ns molecular dynamic (MD) simulation using the Desmond programme of Maestro (Schrödinger) [29,30]. The P. mirabilis MetRS homology model was equilibrated with a small change in Root Mean Square Deviation (RMSD) from 1.72 Å at 0 ns to 2.65 Å at 200 ns (Figure 4). Root Mean Square Fluctuation (RMSF) showed areas of higher fluctuation (the loop regions and N- and C-terminals) and areas of less fluctuation related to the secondary structural elements (SSE) such as α-helices and β-sheets (Figure 4), consistent with the 48.44% SSE (% helix 35.79, % strand 12.65) in P. mirabilis MetRS.
Superimposition of the P. mirabilis MetRS model with the main template, E. coli MetRS (1F4L), using MOE showed a low RMSD of 0.877 Å over 544 amino acid residues indicating a high degree of similarity (Figure 5).

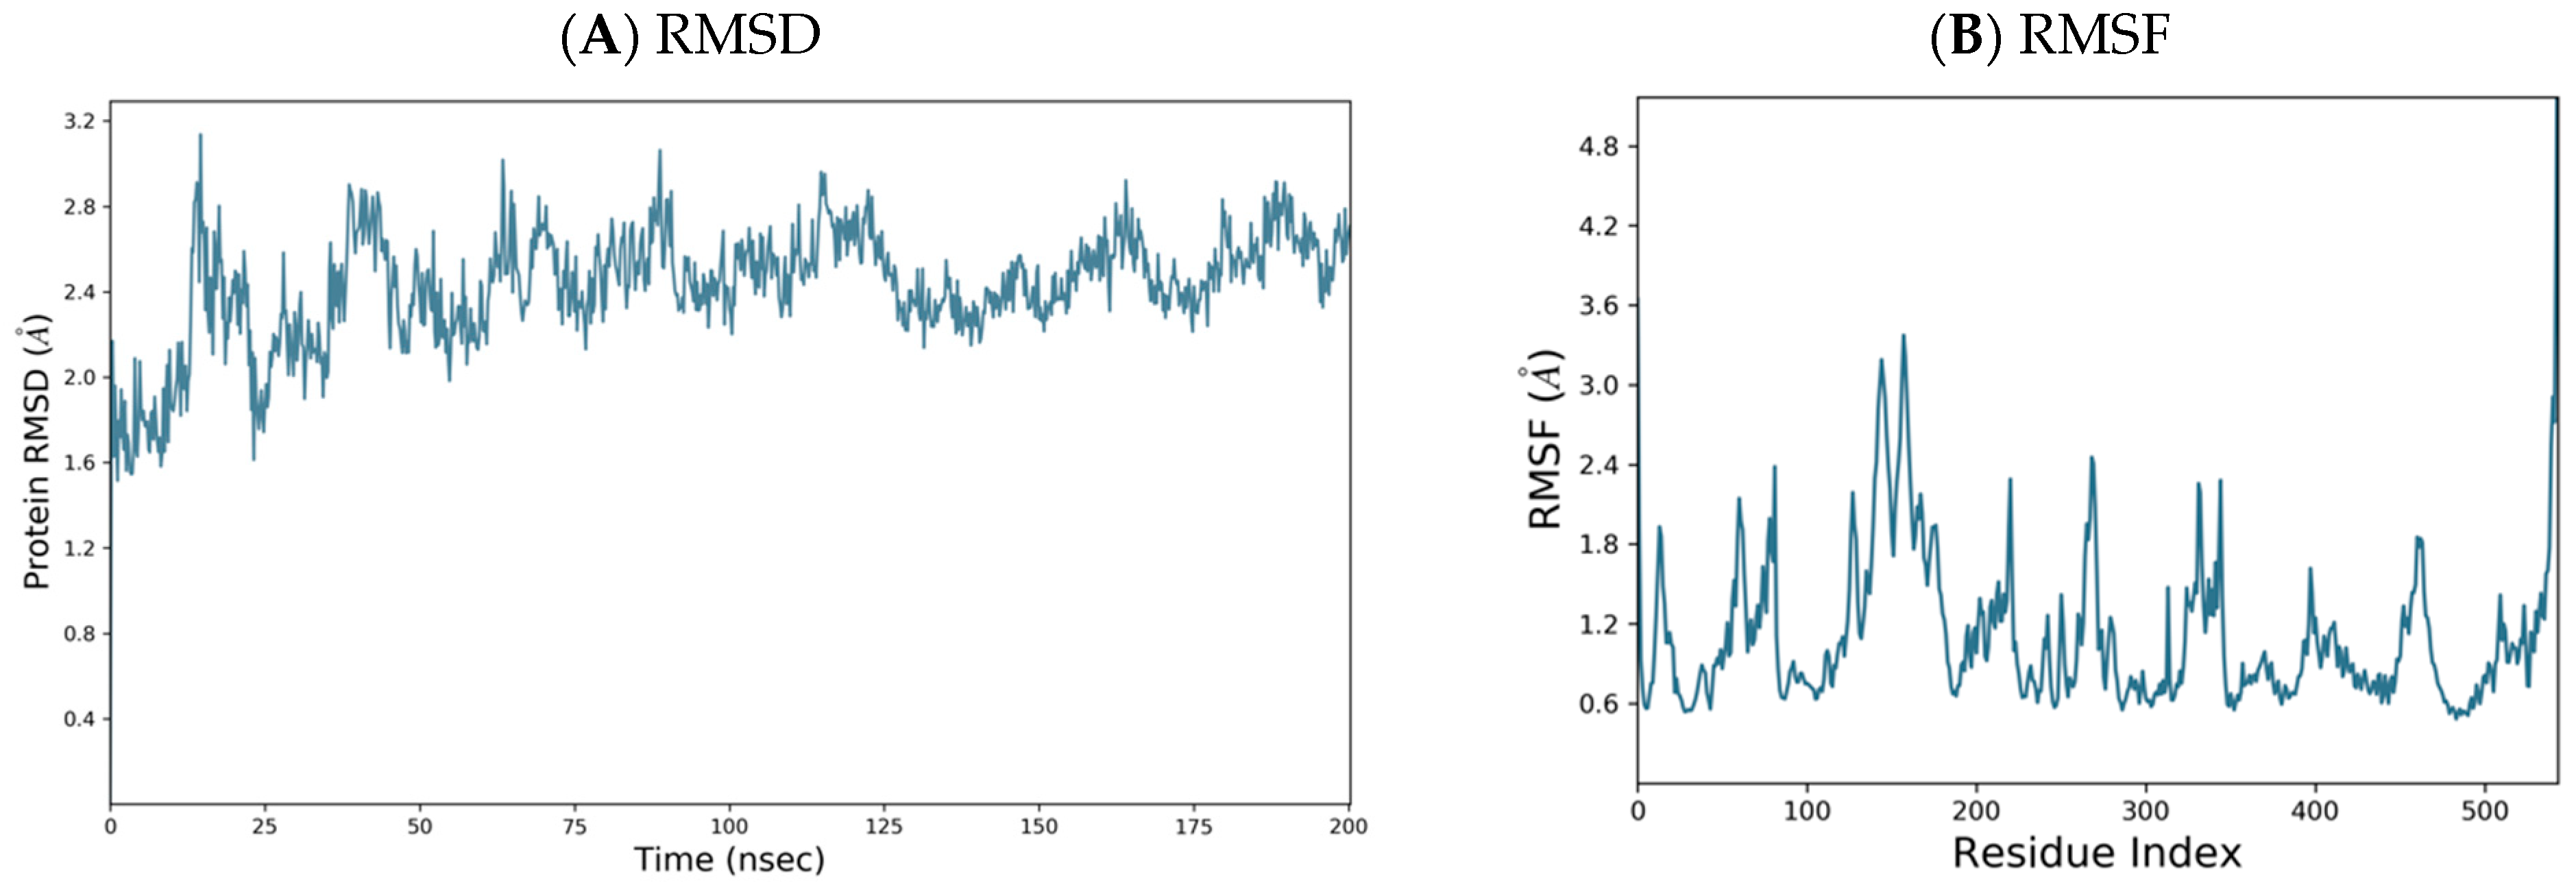
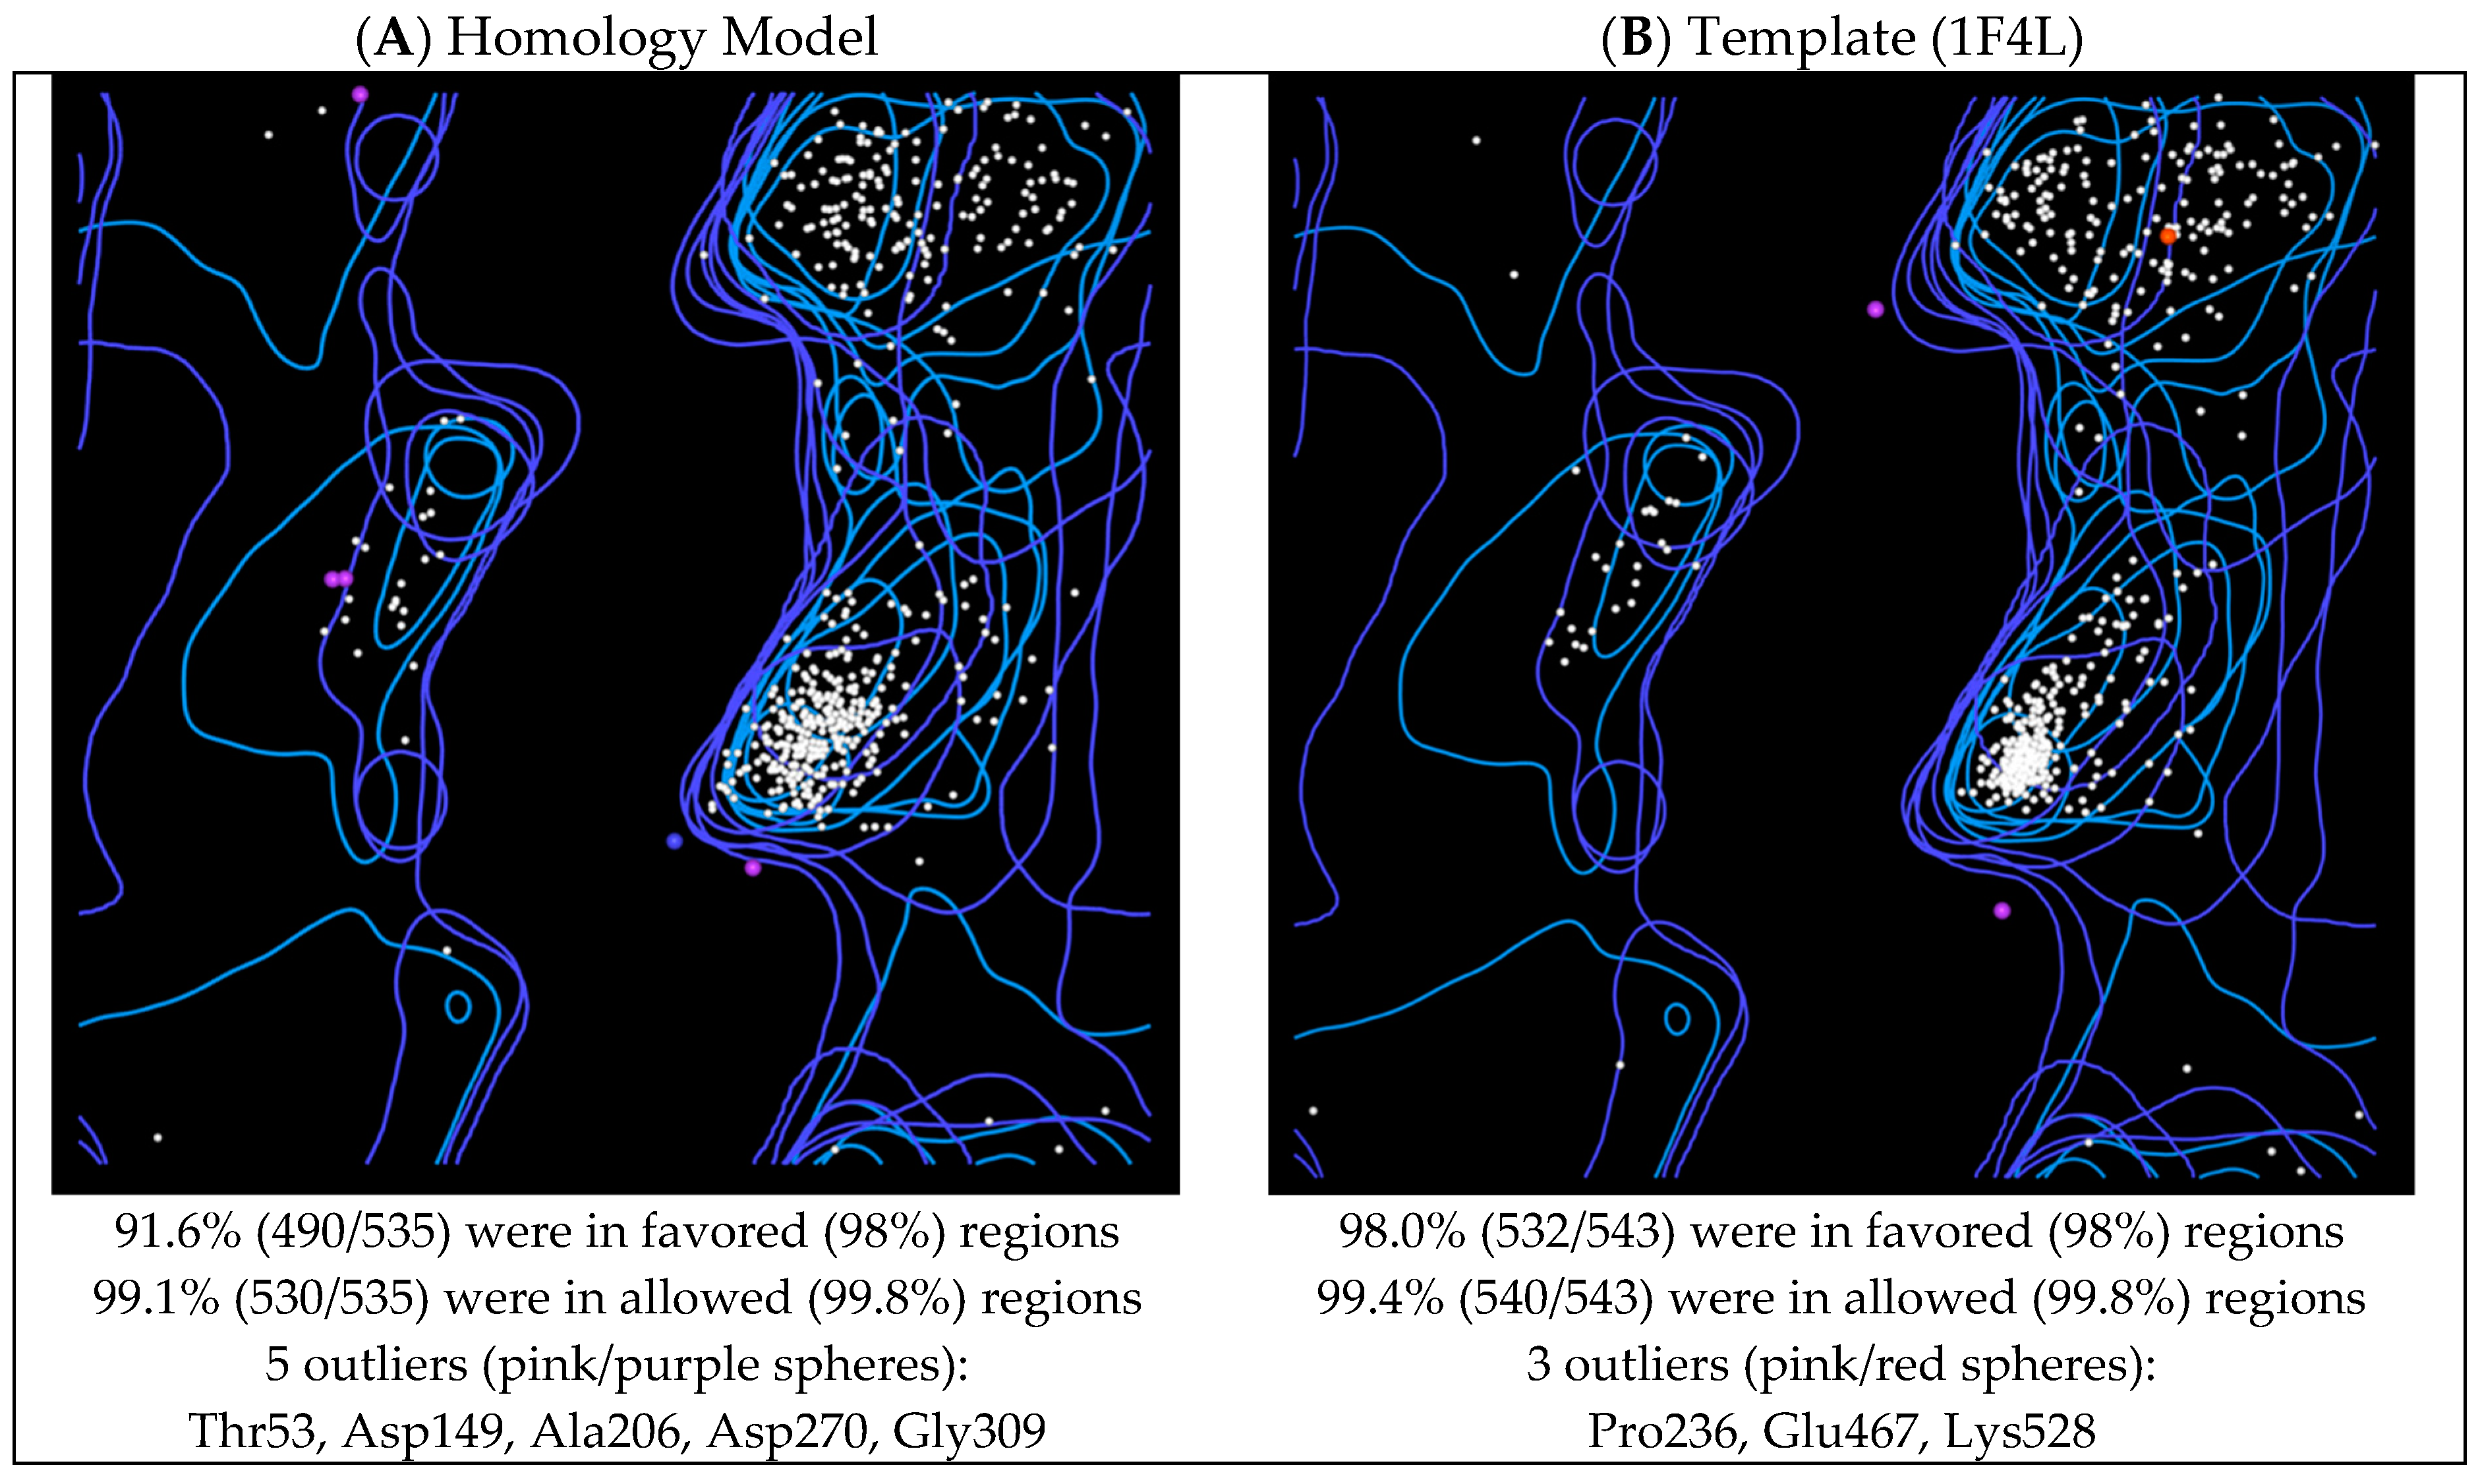
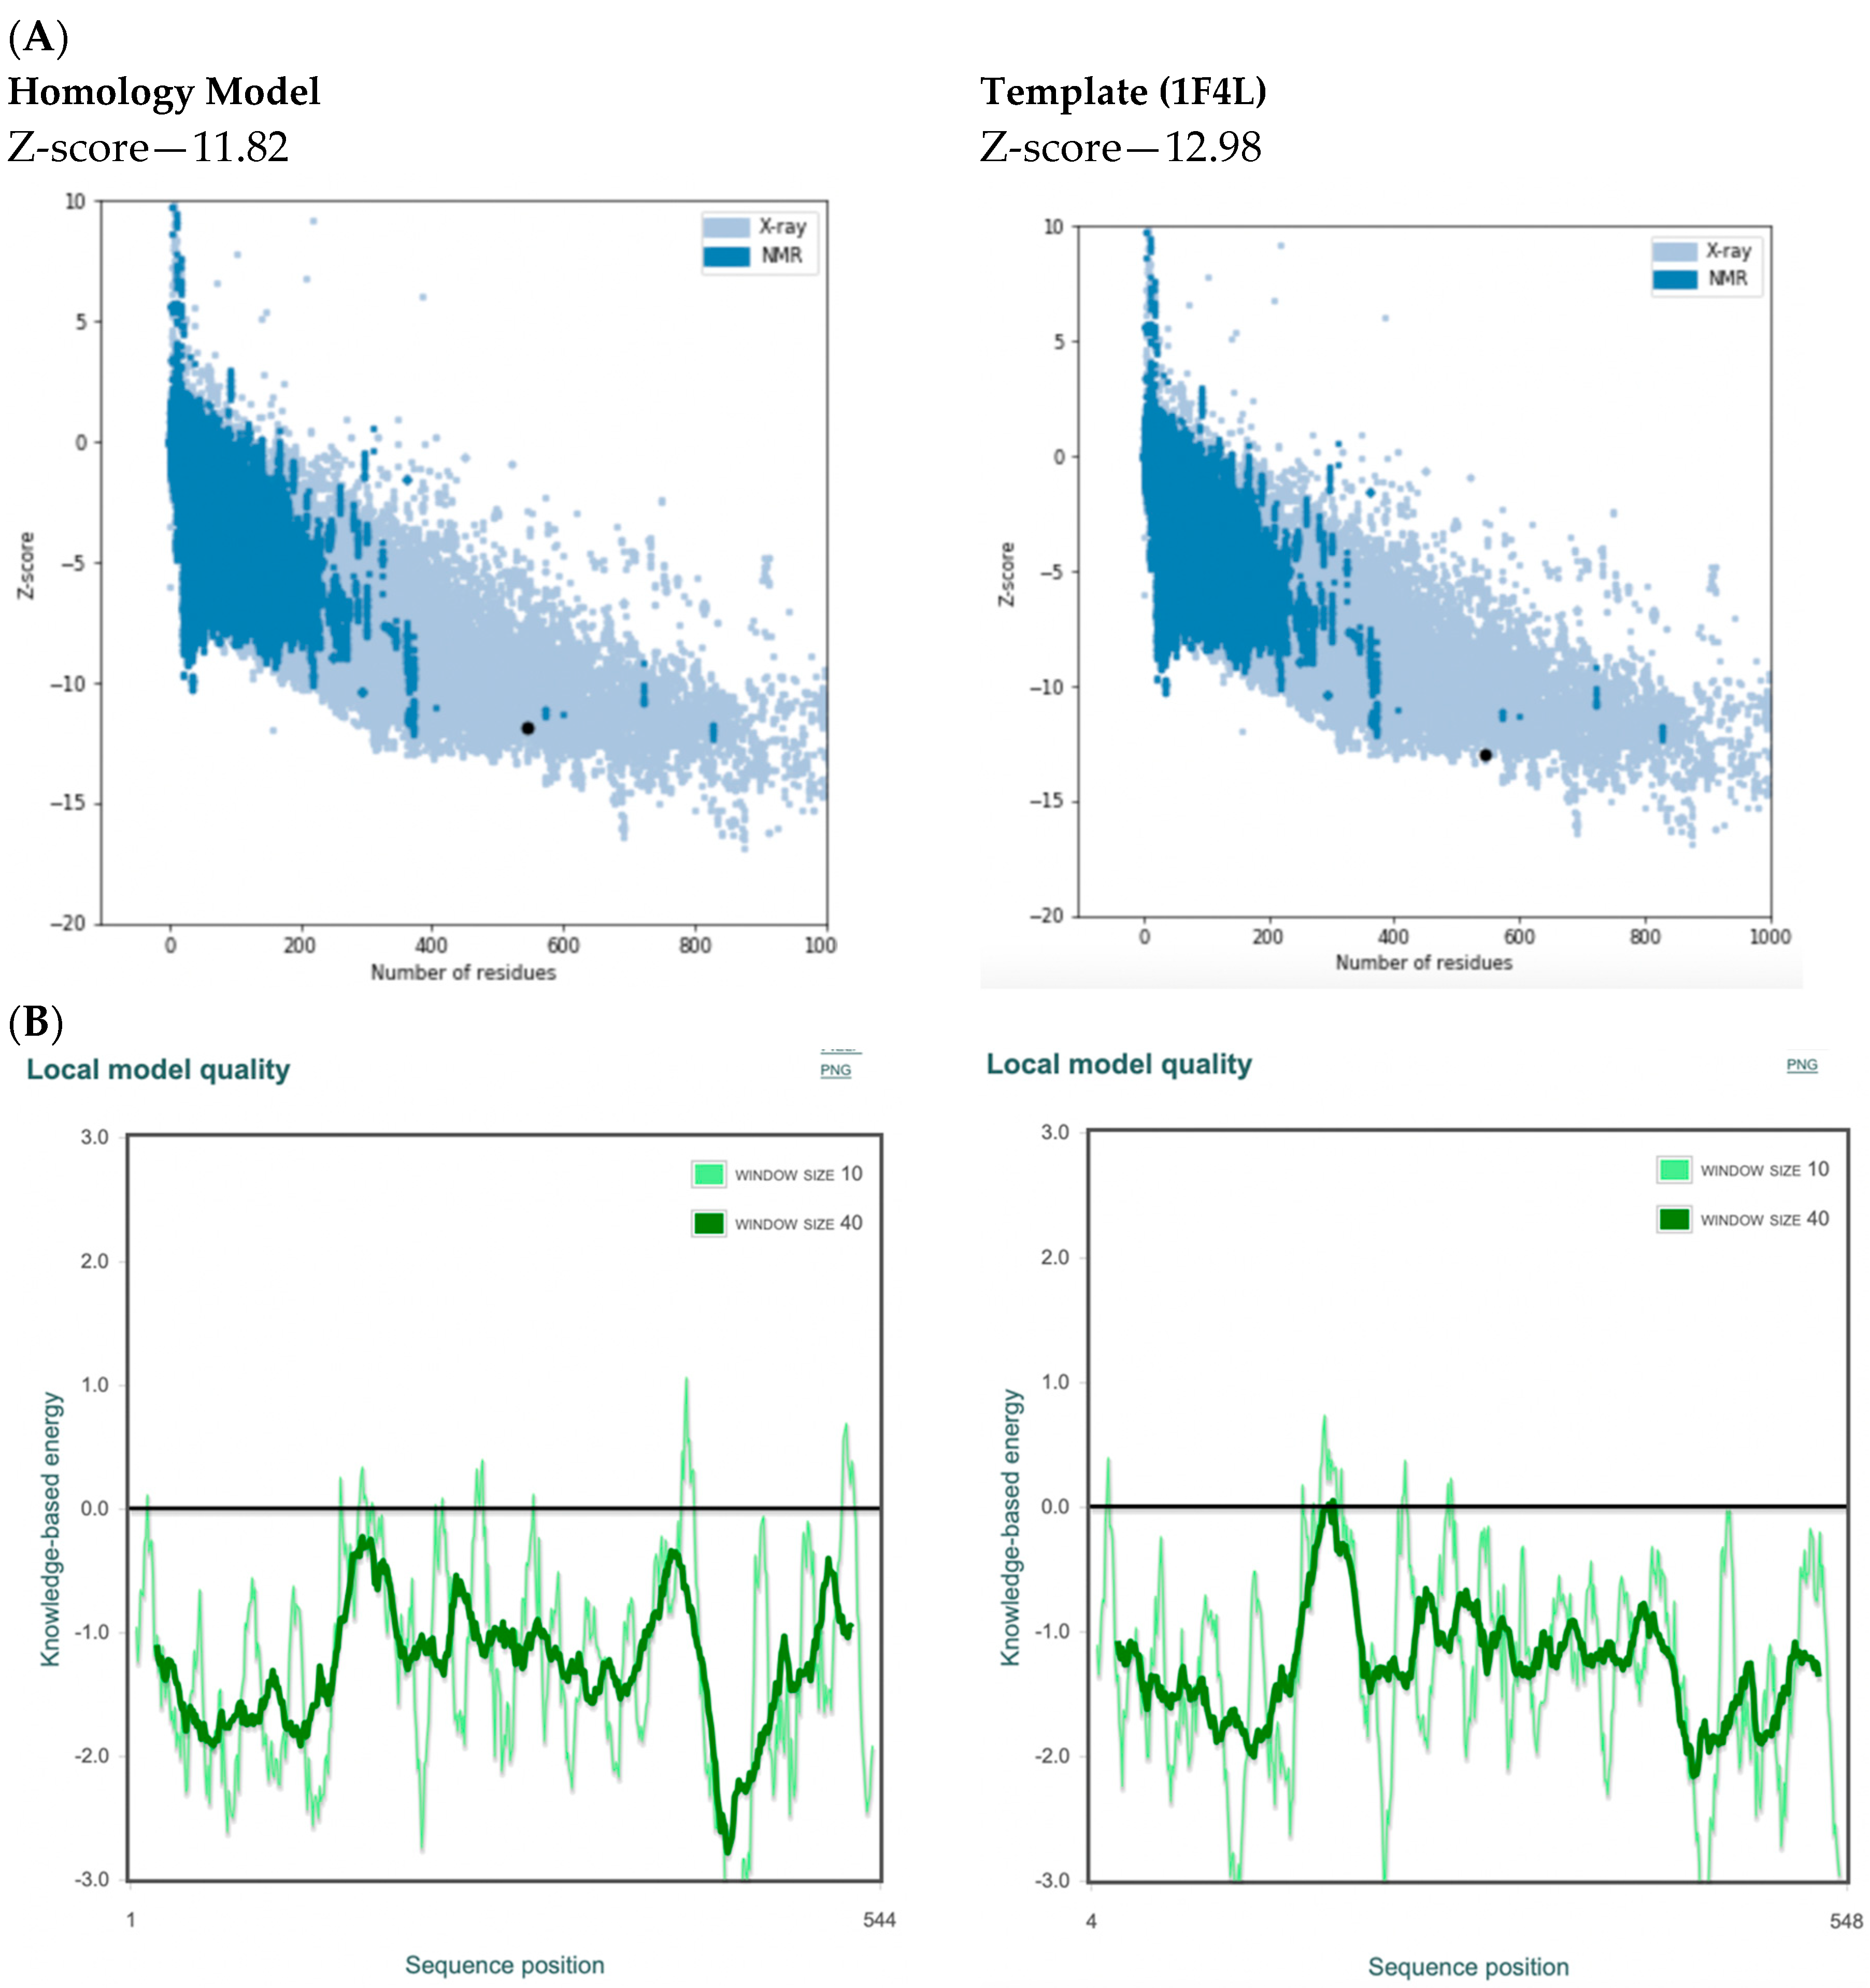
2.4. Model Evaluation/Validation

Ramachandran analysis using MolProbity [31] of the P. mirabilis MetRS homology model and the E. coli MetRS template (pdb 1F4L [32]) indicated that 99.1% (530/535) of amino acid residues of the homology model were in the allowed regions compared with 99.4% (540/543) in the template with five and three amino acids identified as outliers, respectively (Figure 6; Supplementary Figures S4 and S5).
The homology model performed well compared with the template 1F4L in the ProSA (protein structure analysis) evaluation [33] with a z-score of −11.82 compared with the template which had a z-score of −12.98 (Figure 7A). The local model quality plot of the homology morel shows no positive values, which would correspond with problematic or erroneous parts of the input structure, suggesting a good quality model (Figure 7B).

2.5. Active Site Validation and Docking

The predicted active site was validated by the Clustal O (1.2.4) multiple sequence alignment [26] and the alignment service from MOE [28] and by the docking of suitable ligands into the putative P. mirabilis MetRS model.
Moreover, the binding pocket of the modelled protein structure was predicted by the Computed Atlas of Surface Topography of Proteins (CASTP) server [34]. Figure 8 shows the putative pocket of the homology model. The calculated Richards’ solvent accessible surface area and volume were estimated as 1833.297 Å2/3252.450 Å3, for the binding site.
The ligands include methionine, the natural substrate of the MetRS and, as E. coli MetRS is the closest homologue to P. mirabilis MetRS, the E. coli MetRS inhibitors trifluoromethionine (MF3), difluoromethionine (2FM), (1-amino-3-methylsulfanylpropyl)-phosphonic acid (MPH), methionine phosphinate (MPJ), 5′-O-[N-(L-methionyl)-sulfamoyl] (MSP), and methioninyl adenylate (MOD) were also used for the docking validation and analysis.
Protein–ligand complexes were generated from docking of these seven ligands (Table 3), in the P. mirabilis MetRS homology model, with the active site defined as selected amino acids (Ala12, Leu13, Pro14, Tyr15, Gly23, His24, Glu27, Asp52, Trp253, Ala256, Pro257, Tyr260, His300, His322, Tyr324, and Val325) identified as the methionyl-AMP pocket by alignment of the co-crystallized structure of E. coli MetRS with methionyl adenylate (pdb 1PG0) [32].
The protein–ligand complexes were then subject to 200 ns MD simulations using the Desmond programme of Maestro (Schrödinger) [29,30].
The smaller methionine and methionine derivatives (MPH, MPJ, 2FM, and MF3) showed fluctuation and changes in ligand RMSD (Supplementary Figure S6), possibly owing to the greater conformational flexibility of these small ligands. The most stable protein–ligand complex of the larger ligands, MSP and methionyl adenylate, was with the methionyl adenylate ligand while greater fluctuation and change in ligand RMSD was observed for MSP (Supplementary Figure S6).
In the methionyl adenylate protein–ligand complex, the methionine moiety sits in a pocket lined by Ala12, Leu13, Pro14, Tyr15, Asp52, Ala256, Pro257, Tyr260, Phe299, and His300, with binding observed between the thiol group and the backbone of Leu13 and direct and water-mediated H-bonding observed between the amine group with Asp52 and Pro14. A salt-bridge forms between Lys334 and the phosphate moiety, which also binds through water molecules and intramolecularly with the ligand amine group. The 2′- and 3′-hydroxy groups of the ribose ring form H-bonding interactions with Glu27, while the adenine forms H-bonding interactions through one N in the pyrimidine ring and the exocyclic amine with Val325 and face-edge π-π interaction with His21 (Figure 9).
The MSP ligand showed a good overlap with methionyl adenylate in the methionine and phosphate regions (Figure 10); however, the ribose ring showed a significant change in conformation, which reflects the change in RMSD observed over the MD simulation (Table 3; Supplementary Figure S6), and loss of binding between Glu27 and the ribose hydroxy groups (Figure 10).
The methionine–P. mirabilis MetRS ligand complex showed comparable placement and binding of methionine as observed for the methionyl moiety of methionyl adenylate (Figure 4), and this was also observed for MPJ, 2FM, MF3, and for MPH; however, MPH was observed in the same binding site only at 50 ns while at 100, 150, and 200 ns MPH was displaced outside the active site (Figure 11 and Figure S7) with the amine group of the ligand binding with Asp295 rather than Asp52 observed for methionine and the other methionine derivatives (Supplementary Figure S8). This MD study provides support for the validity of the AMP/methionine active sites. The model of P. mirabilis–MetAMP protein–ligand complex is available in ModelArchive at https://modelarchive.org/doi/10.5452/ma-h0jz3.

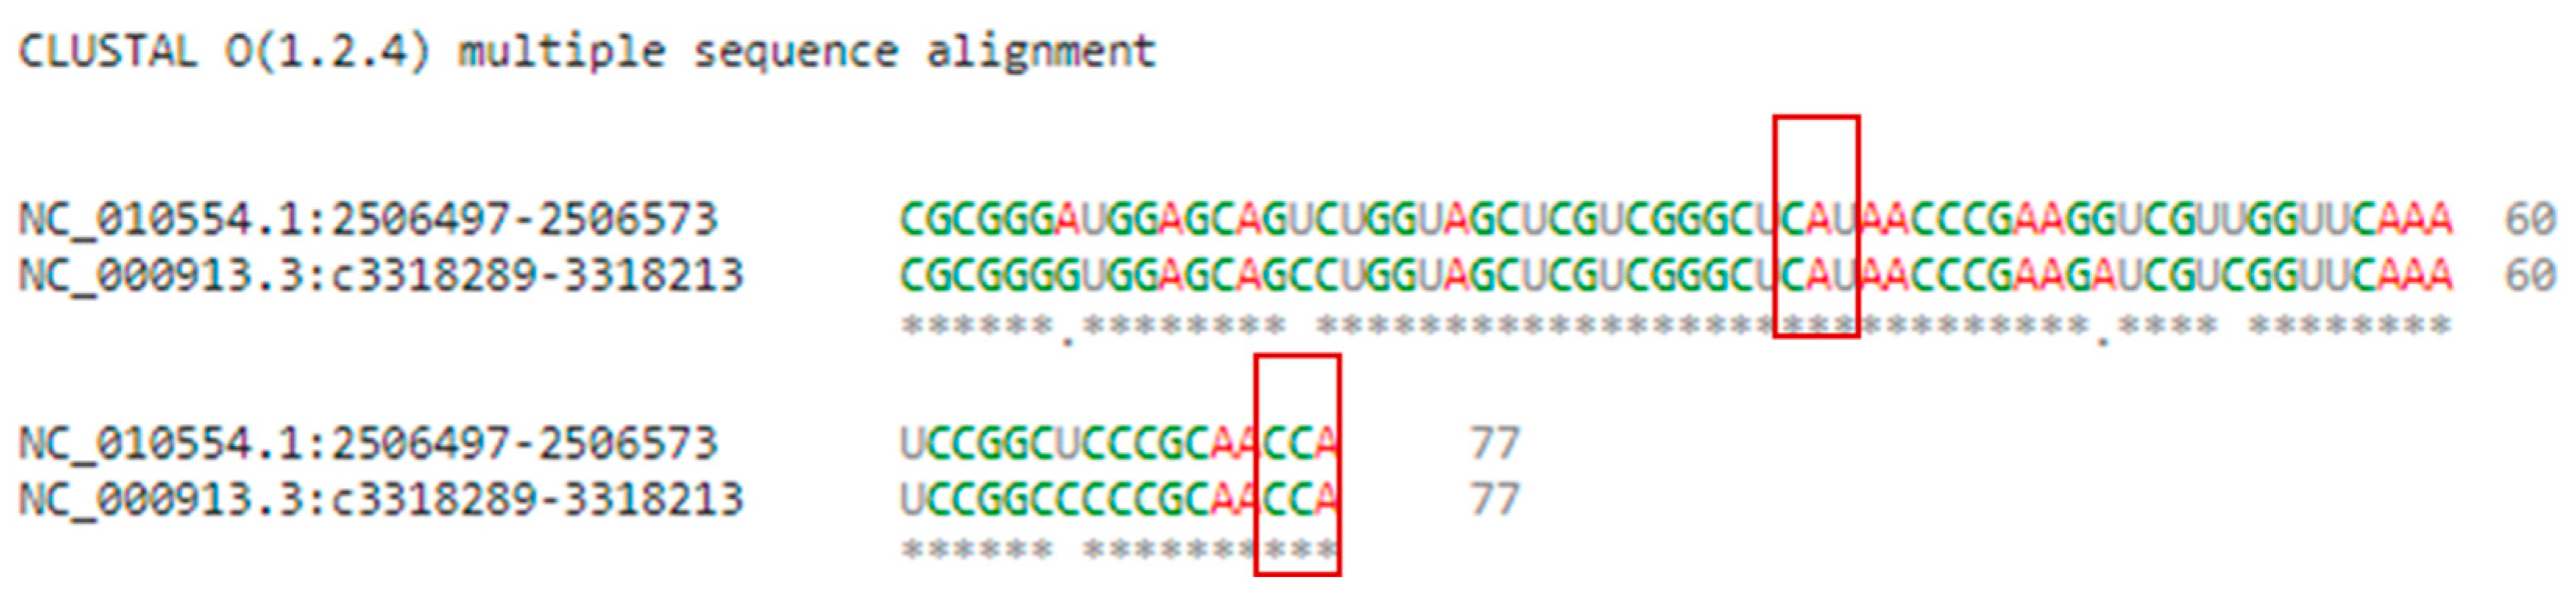
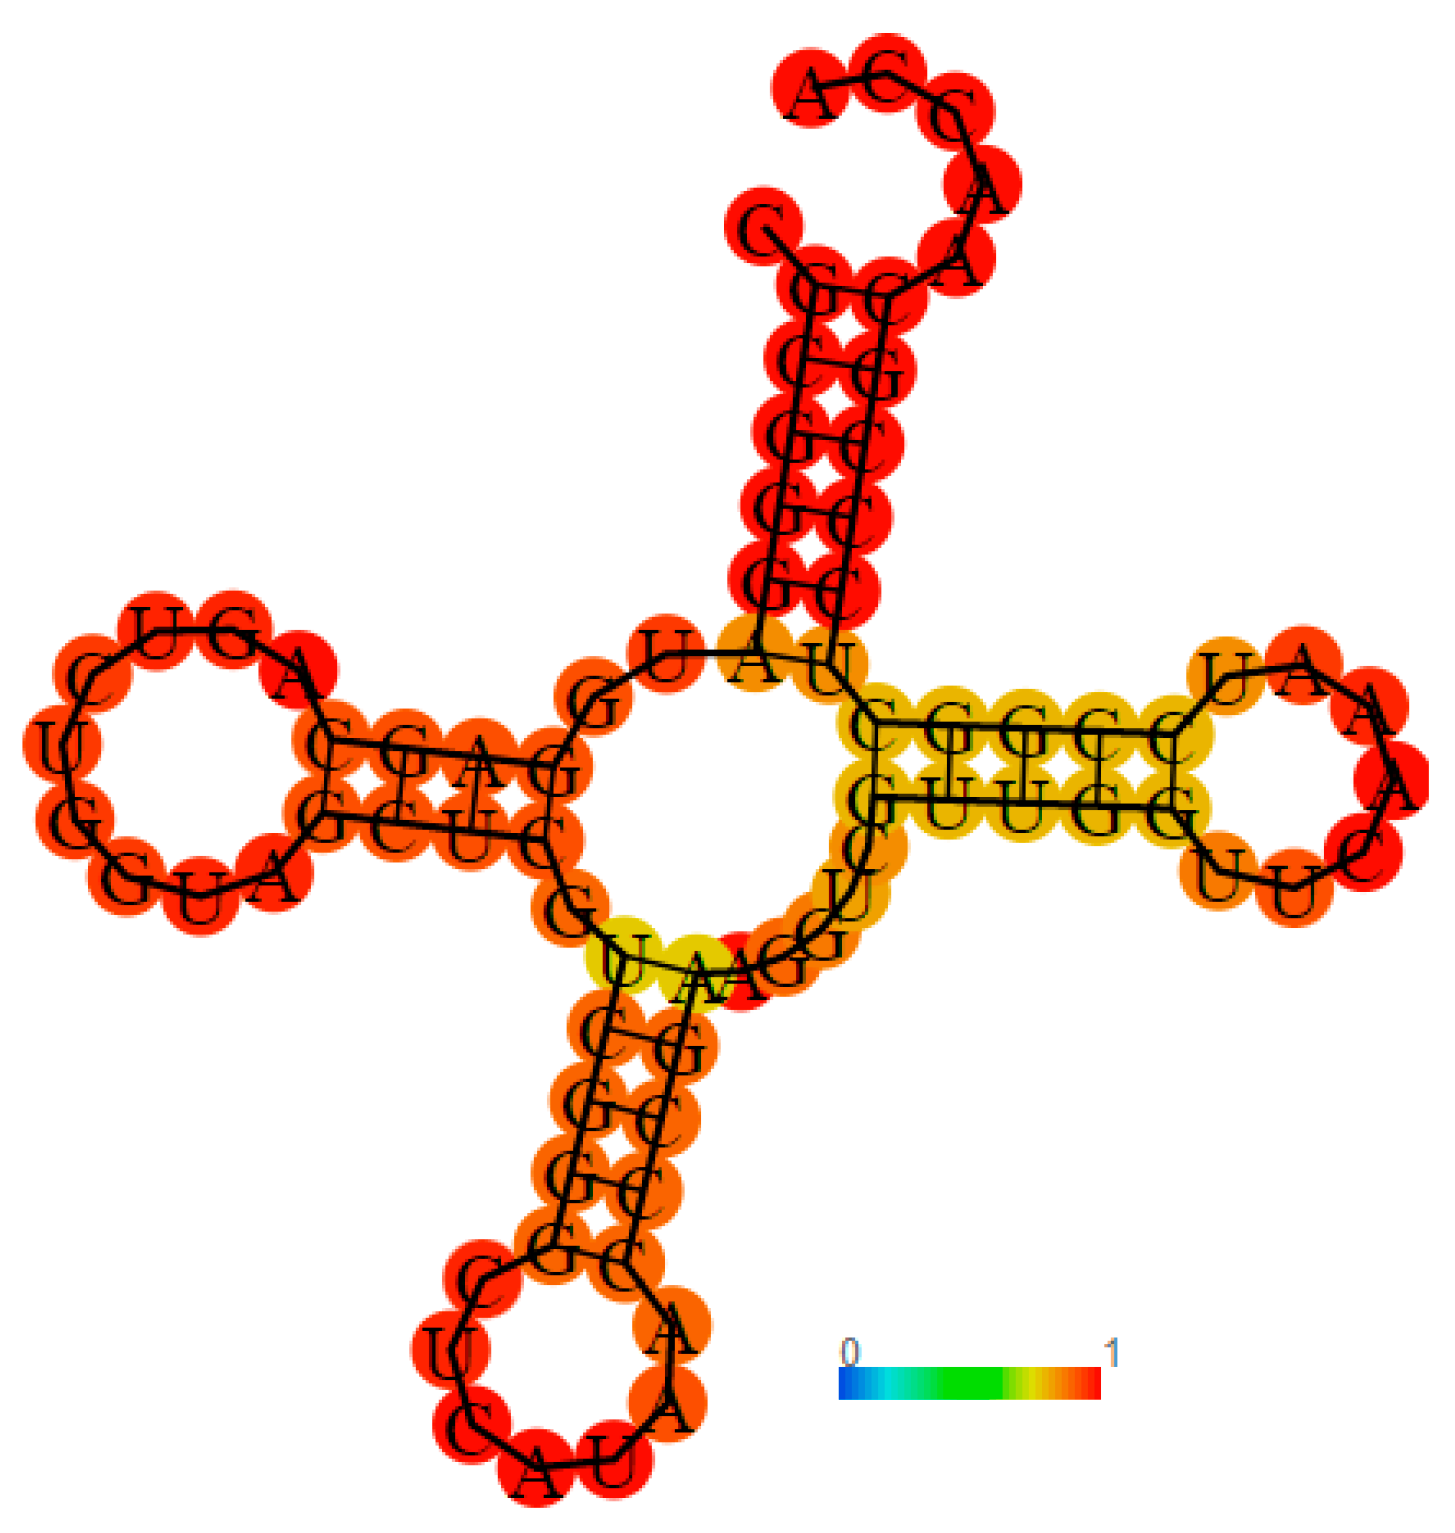
2.6. Recognition and Binding of P. mirabilis MetRS with Cognate tRNAmet

In each living cell, the synthesis of protein usually starts with methionine, which is supplied to the ribosome as methionyl-tRNAMet produced by MetRS. As a result, there are two types of the tRNAMet (the initiator tRNAfMet and the elongator tRNAmMet) and the MetRS acylates both, even though they have extremely diverse nucleotide sequences. Extensive biochemical studies [35] have shown cytosine at the anticodon position (C34) to primarily control the identity of tRNAMet for L-methionine and the other two anticodon bases (A35 and U36) are the second most important identity factors [36].
Despite the simple architecture of MetRS, the crystal structure of tRNAMet binding with E. coli MetRS has remained unresolved. The crystal structure of Aquifex aeolicus MetRS complexed with tRNAMet has been reported [37] with Asn353, Arg357, and Trp422 of Aquifex aeolicus MetRS observed to be directly involved in the base specific recognition of the tRNAMet anticodon. These three amino acids are strictly conserved in the MetRSs from eubacteria, archaea, and eukaryotes [37].
Proposed interactions of the CAU anticodon in tRNAMet with P. mrabilis MetRS residues are based on the Clustal alignment of the query enzyme with E. coli and A. aeolicus (Figure 3) where boxed amino acids residues, present at the C-terminus, are responsible for recognition and interaction with tRNAMet anticodon bases (Table 4).
The P. mirabilis tRNAMet sequence, available from the National Centre for Biotechnology Information consists of 77 bases, comparable with E. coli. Moreover, the CAU anticodon positions are also the same (Figure 12).
Using the RNA fold server [38], the tRNAMet secondary structure of P. mirabilis was predicted (Figure 13).
Asn390, Arg394, and Trp460 of P. mirabilis MetRS are involved in binding the anticodon part of Met-tRNA. The corresponding amino acid residues in the MetRSs of A. aeolicus and E. coli play the same role. These outcomes are predictable from the literature and sequence alignments.

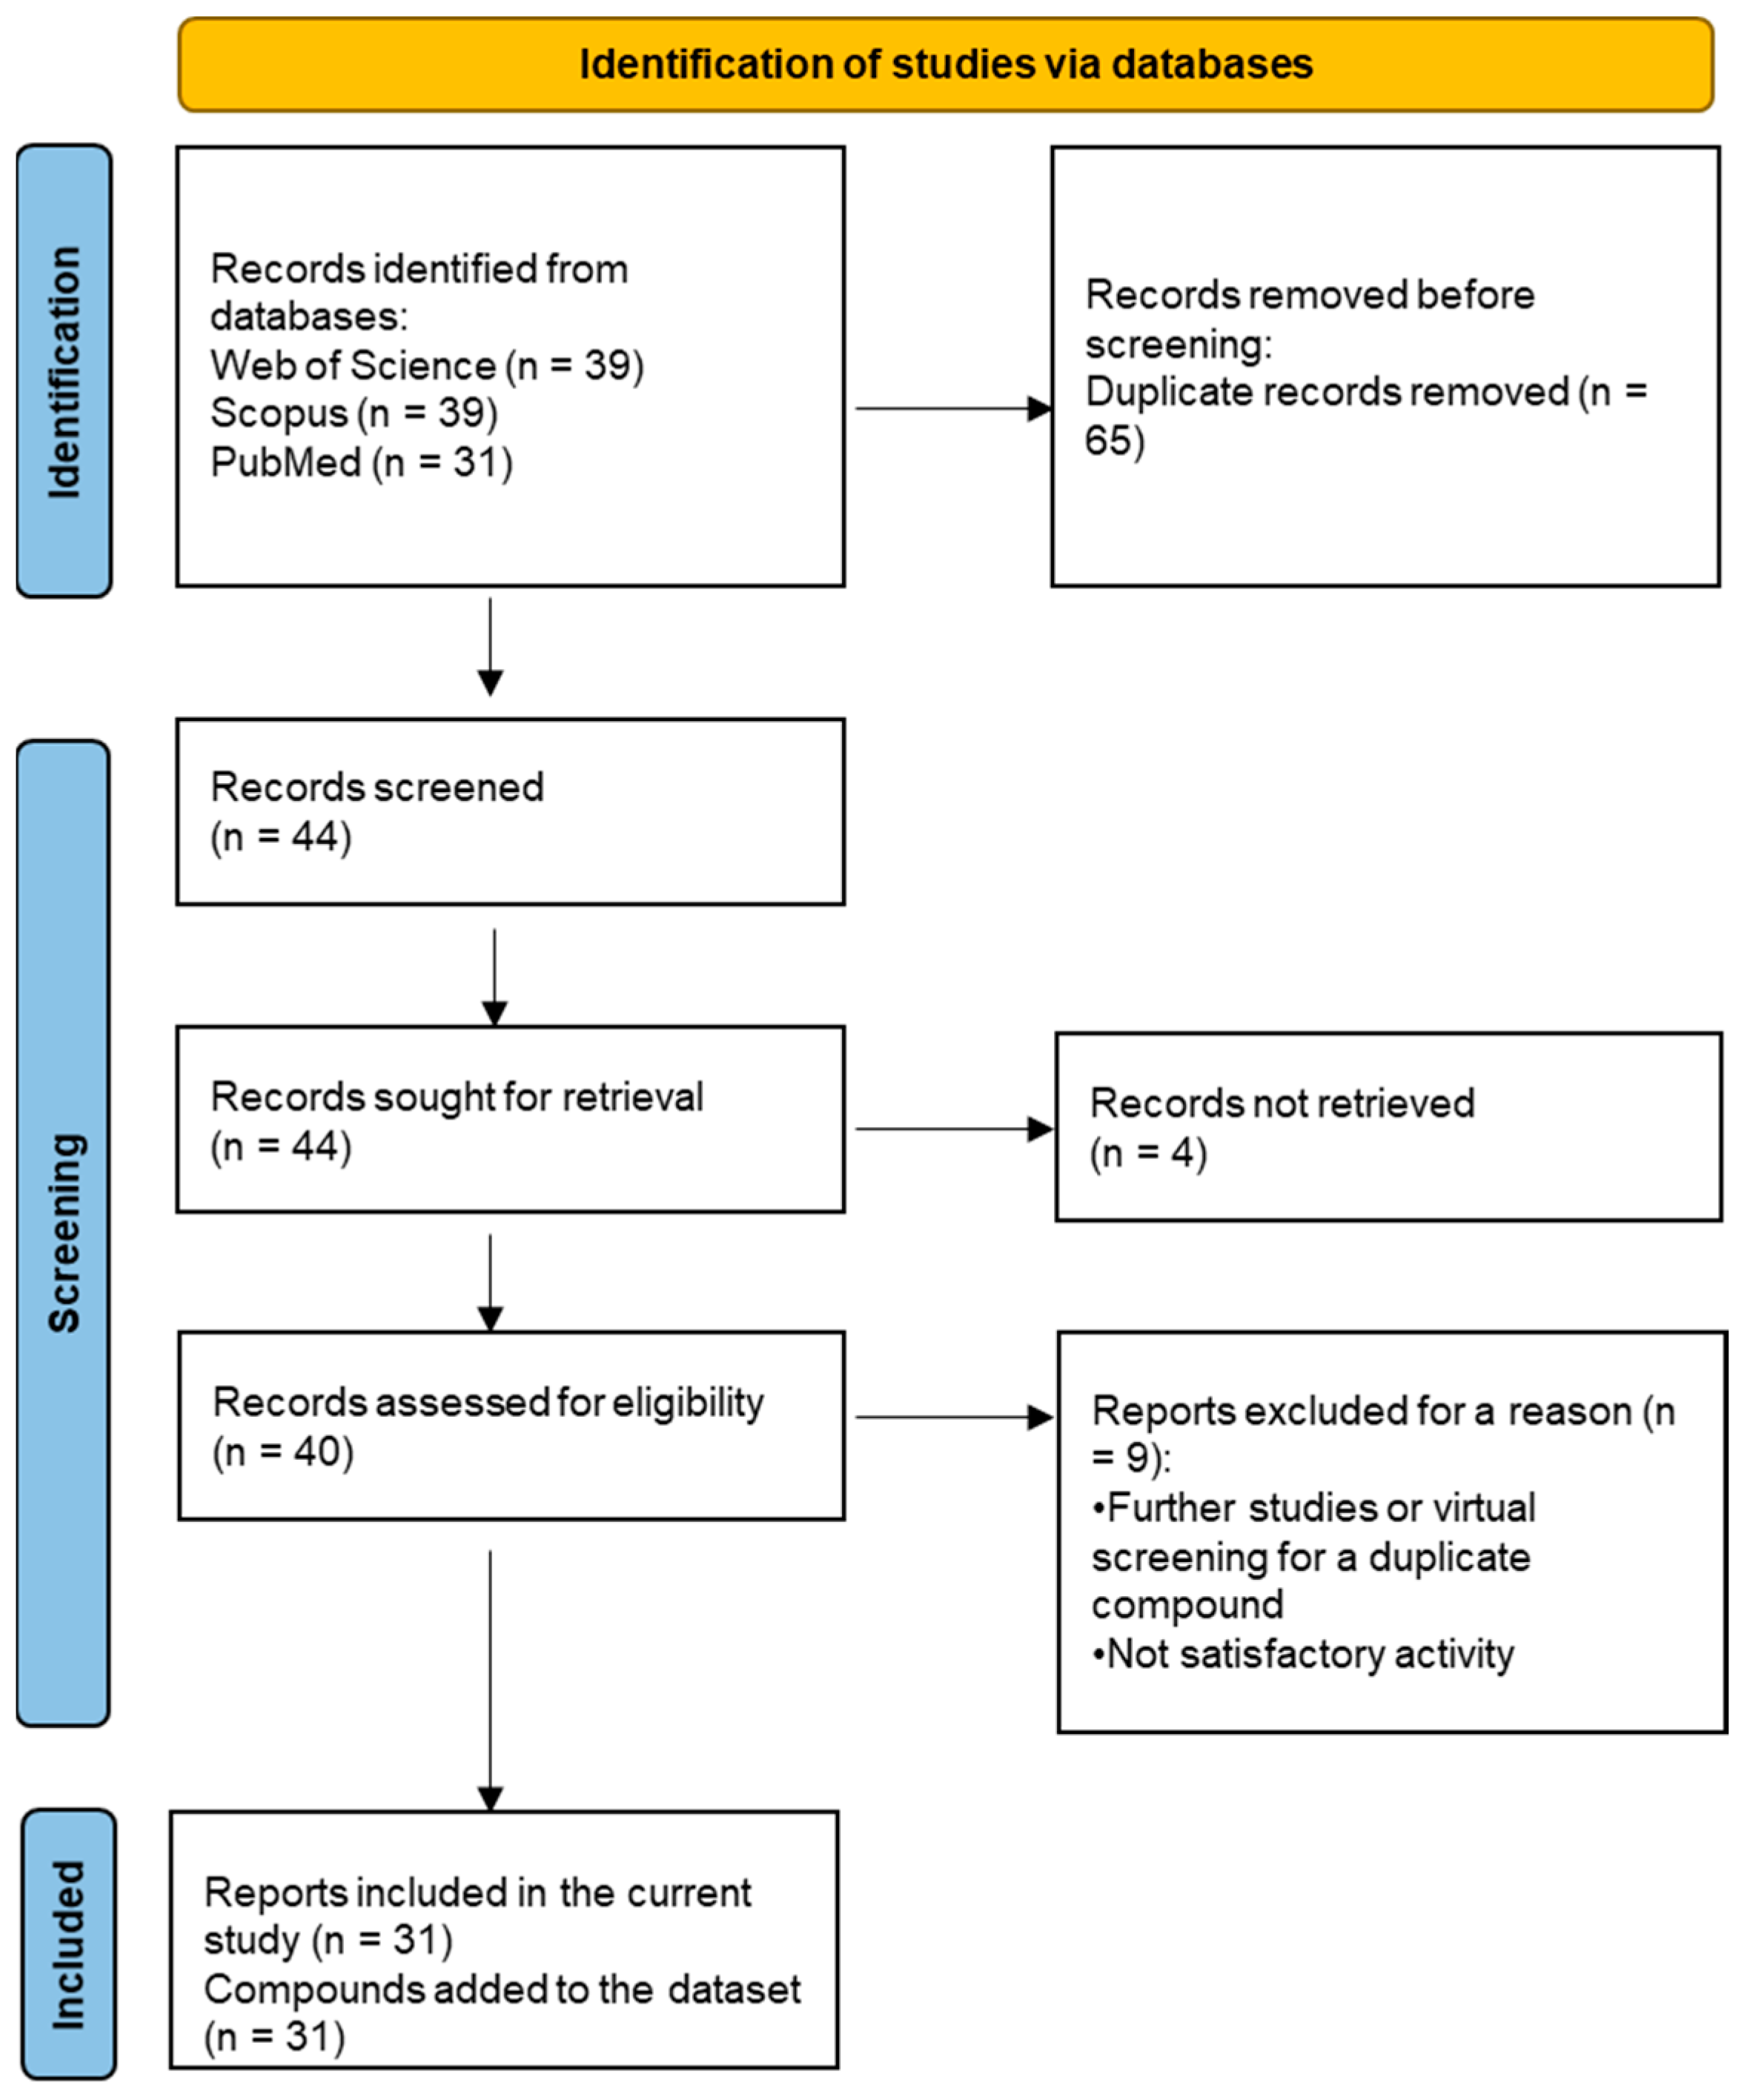
2.7. Systematic Dataset Preparation

A systematic database search was used to select active compounds against MetRS in a variety of organisms to prepare a dataset of compounds for P. mirabilis MetRS screening. The selection process followed the PRISMA flowchart [39], as summarized in Figure 14.
The database search resulted in a total of 109 publications. Elimination of duplicates resulted in 44 publications with MetRS inhibitory activity against different organisms. These publications were retrieved and studied to ensure elimination of duplicate and nonactive compounds. The selection process of one or two of the most active compounds in each relevant publication resulted in a dataset of thirty-one compounds summarized in Table 5.

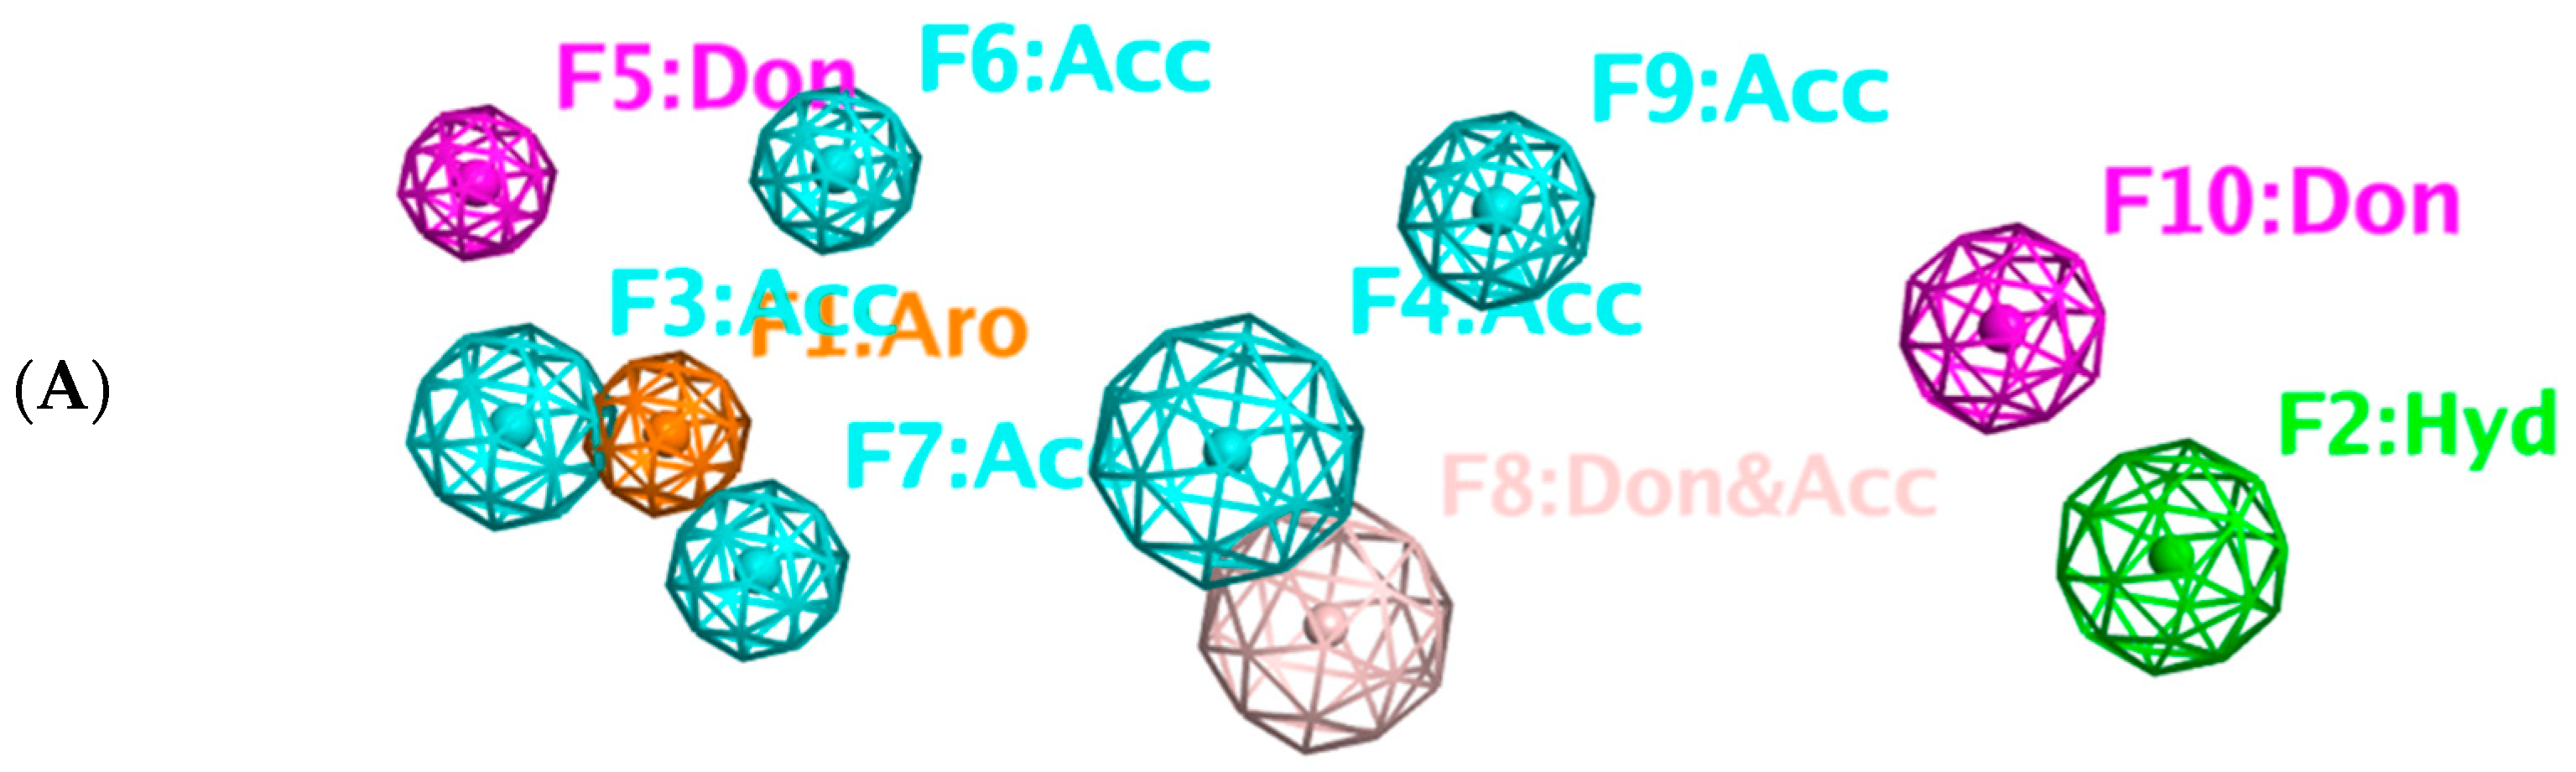
2.8. Pharmacophore-Based Virtual Screening

Three compounds of the prepared library are inhibitors for E. coli MetRS [54,55,56,63,64]. These compounds along with the natural substrate were used to prepare a 3D pharmacophore model within MOE [28]. A ten-feature model was generated (Figure 15A) and used to screen the created library. Initial screening with minimum three features resulted in 29 of the 31 compounds passing the pharmacophoric filter. Further analysis with minimum four features matched, and a visual inspection of the binding resulted in the choice of one compound as the most promising inhibitor (Figure 15B) [67]. This compound was able to match most of the features represented by having an aromatic center (F1), hydrophobic centroid (F2), several hydrogen bond donor and acceptor features (F3, F5, F6 and F7), and very close to the donor feature (F10). All these features made the compound able to fit perfectly in the pocket-forming interactions with some of the key amino acid residues (Val325, Lys334, and Leu13) to anchor the ligand.
Overall, the constructed model of P. mirabilis MetRS (Supplementary Figure S9) shows the characteristic domains of an AaRS class I enzyme. The model contained 544 amino acid residues from the 675 residues of the sequence, owing to the disabling of the C-terminus in the crystal structure of the main template. The secondary structure of these amino acid residues involved 24 α-helices and 21 β-sheets (Supplementary Figure S3). The architecture of the active site and the key amino acid residues Val325, Glu27, Lys334, Leu13, and Asp52 necessitate the presence of key pharmacophoric features as indicated in the aromatic center (F1), hydrophobic centroid (F2), and several possibilities for hydrogen bonding in the distance between them. Compounds that are able to fit and fill the space between F1 and F2 with hydrogen bond donors and acceptors in the proper orientation could have the possibility of inhibiting the enzymatic activity.

3. Materials and Methods

3.1. Homology Search

The P. mirabilis MetRS amino acid sequence was obtained from the ExPASy proteomics server at the Swiss Bioinformatics Institute [23]. The sequence of the enzyme has the Uniprot identifier B4ESY6 (SYM_PROMH) and is formed of 675 residues [71]. A homology search was performed using SIB BLAST service [22,72] accessible through the ExPASy server, which was used to align the P. mirabilis MetRS amino acid sequence against the sequences of the 3D-resolved structures in the protein data bank [73] to identify the best homologous proteins. The alignment parameters and the thresholds, which were used for screening expected homologues, were used with their default values and BLOSUM62 comparison matrix. The detailed parameters were described as the following: BLOSUM62 comparison matrix is utilized for protein with amino acids more than 85. E-expectation value threshold (E-value) is 10. The phylogeny server [25] was used to construct a phylogenetic tree for the target protein along with the possible predicted homologous proteins and other selected MetRS enzymes from diverse organisms.

3.2. Multiple Sequence and Structure Alignment

The query enzyme sequence was aligned with the protein sequences of the most related MetRS templates: Escherichia coli (pdb: 1F4L), Acenitobacter baumannii (pdb: 5URB), and Pyrococcus abyssi (pdb: 1RQG), using Clustal Omega 1.2.4 [26]. The local alignment of these sequences is useful to detect the conserved residues and the structural motifs: HIGH region, KMSKS motifs together with the zinc metal and the ATP binding sites. The revealed results are vital to understand not only the expected structural similarities but also the functional similarities between these enzymes. The secondary structure of P. mirabilis MetRS and the closest template (1F4L) were determined using PSIPRED v4.0 [27].

3.3. 3D Model Building

The molecular experiments were accomplished using Molecular Operating Environment (MOE) 2019.0102 molecular modeling software [28]. Homology models were constructed using MOE-Homology using AMBER99 forcefield [74], which uses a dictionary to set the partial charges of atoms in amino acids. The final homology model was constructed using the E. coli MetRS (1F4L) crystal structure. Ten intermediate models were generated, and the final model was taken as the Cartesian average of all the constructed intermediate models. All minimizations were performed until RMSD gradient of 0.05 kcal mol−1Å−1 with the specified forcefield and partial charges automatically calculated.

3.4. Model Validation

Stereochemical quality of the polypeptide backbone and side chains was assessed using the MolProbity server [31] via assessing both residue-by-residue geometry and overall structural geometry. The ProSA server [33] was used to check defaults in the three-dimensional structure of the protein based on statistical analysis. Validation data from the template (1F4L) were used as the baseline to evaluate the model.

3.5. Molecular Dynamics and Docking Studies

Methionine, as the natural substrate, was built as a ligand through MOE-Builder [28]. Structures of ligands were acquired from the relevant complex E. coli crystal structures (PDB codes: 1PFW (MF3), 1PFV (2FM), 1P7P (MPH), 1PFU (MPJ), 1PFY (MSP), and 1PG0 (MOD) and then each ligand’s energy was minimized, and a ligand database was generated.
Docking and molecular dynamics simulations were performed as previously described [75,76]. Docking studies, using the constructed model, were performed to generate protein–ligand complexes, using MOE [28] until a RMSD gradient of 0.01 kcal mol−1 Å−1 with the MMFF94 forcefield (ligands) and partial charges were automatically calculated. The active site was defined using the site finder in MOE. Additionally, the Computed Atlas for Surface Topography of Proteins (CASTP) server was utilized for prediction of the active pockets of the protein, using a 1.4 Å probe and at default settings [34]. Docking was performed using the Alpha Triangle placement to determine the poses, refinement of the results was performed using the MMFF94 forcefield, and rescoring of the refined results was completed using the London ΔG scoring function.
MD simulations were run on the protein–ligand complexes using the Desmond programme of Schrödinger [29,30]. Overlapping water molecules were deleted, and the systems were neutralized with Na+ ions and salt concentration of 0.15 M. Force-field parameters for the complexes were assigned using the OPLS_2005 forcefield, that is, a 200 ns molecular dynamic run in the NPT ensemble (T 1⁄4 300 K) at a constant pressure of 1 bar. Energy and trajectory atomic coordinate data were recorded at each 1.2 ns. The model of P. mirabilis–MetAMP protein–ligand complex is available in ModelArchive at https://modelarchive.org/doi/10.5452/ma-h0jz3.
Prime/MMGBAS, available in Schrödinger Prime suite, was used to calculate the binding free energy of the ligands with P. mirabilis MetRS model.
ΔG (bind) = E_complex (minimized) − (E_ligand (minimized) + E_receptor (minimized))
The mean ΔG (bind) values were calculated from each 10 frames of the final 100 ns of the 200 ns MD simulation (frames 500–1000), and the average generated ΔG was from each energy minimized frame using the equation shown above.

3.6. Systemic Dataset Preparation

The three databases, Web of Science, Scopus, and PubMed, were searched through the advanced search tool. Methionyl tRNA synthetase or MetRS, and inhibitors or derivatives were used as determinant keywords. To be eligible, the article had to be an original research article, available in the English language. The selected article must contain biological evaluation data against MetRS. The most active compound(s) was selected to be added to the database.

3.7. Pharmacophore Query

The system was prepared using the default settings for MOE [28], specifically the Amber10:EHT forcefield, solvation R-filed, and Receptor strength 5000. The docking poses for the ligands were loaded and superimposed with common features selected from the consensus to form the pharmacophore features (Figure 15A). Relevant features were selected. The search allowed for a partial match with a minimum of three or four features with best match determined from the rscore value (the sum of the individual feature (F1–F10) rscores) and visual inspection of fit and binding in the active site.

4. Conclusions

In silico development of a P. mirabilis MetRS homology model has been explored using E. coli MetRS as a template. The constructed model topology and domains were compatible with the characteristics of Class I AaRS enzymes. Docking and molecular dynamics simulations of the selected ligands provide the validity of the AMP/methionine active site. In the methionyl adenylate protein–ligand complex, the methionine moiety sits in a pocket lined by Ala12, Leu13, Pro14, Tyr15, Asp52, Ala256, Pro257, Tyr260, Phe299, and His300, with binding observed between the thiol group and backbone of Leu13 and direct and water mediated H-bonding observed between the amine group with Asp52 and Pro14. A salt-bridge forms between Lys334 and the phosphate moiety, which also binds through water molecules and intramolecularly with the ligand amine group. Asn390, Arg394, and Trp460, at the C-terminal, recognize and interact with tRNAMet anticodon bases. Exploring the complete putative model with its active binding site and the key binding amino acid residues served as a crucial step in the development of novel antibiotics with greater selectivity using rational drug design. The prepared model was used to apply a virtual screening approach on a systematically prepared library of compounds and demonstrated applicability in finding promising compounds to be used as lead compounds for P. mirabilis MetRS inhibitors. The architecture of the active site and the main key amino acid residues Val325, Glu27, Lys334, Leu13, and Asp52 necessitated the presence of key pharmacophoric features as indicated in the aromatic center (F1), hydrophobic centroid (F2), and hydrogen bonding in the distance between these centers. The confirmation of the findings through laboratory experiments will be considered in a further study.

Supplementary Materials

The following supporting information can be downloaded at: https://www.mdpi.com/article/10.3390/ph16091263/s1, Figure S1: percent identity matrix created by Clustal alignment with P. mirabilis MetRS highlighted; Figure S2: amino acid sequence of P. mirabilis MetRS presenting α-helices in pink color, β-sheets in yellow color, loops in grey color; Figure S3: predicted query P. mirabilis MetRS sequence secondary structure; Figure S4. Ramachandran plots—P. mirabilis MetRS homology model (MolProbability); Figure S5. Ramachandran plots—E. coli MetRS template (1F4L) (MolProbability); Figure S6. RMSD plots of protein–ligand complexes over 200 ns MD simulation; Figure S7. 2D ligand interactions of the final frame of the protein–ligand complexes after 200 ns MD simulation; Figure S8. (A) change in position of MPH over 200 ns MD simulation: 50 ns (light pink), 100 ns (green), 150 ns (orange) and 200 ns (turquoise). (B) 2D ligand interactions of the P. mirabilis MetRS-MPH complex at 50, 100, 150 and 200 ns MD simulation; Figure S9: final P. mirabilis MetRS homology model with the characteristic domains in ribbon representation: Rossmann fold: red; connective peptide (CP): green; KMSKS domain: yellow; anticodon domain: purple.

Author Contributions

Conceptualization, S.S.E., A.G.E., N.A.N. and C.S.; methodology, S.S.E., A.G.E., N.A.N. and C.S.; software, S.S.E., A.G.E., N.A.N. and C.S.; validation, S.S.E., A.G.E., N.A.N. and C.S.; data curation, S.S.E., A.G.E., N.A.N. and C.S.; writing—original draft preparation, S.S.E., A.G.E., N.A.N. and C.S.; writing—review and editing, S.S.E., A.G.E., N.A.N. and C.S.; visualization, S.S.E., A.G.E., N.A.N. and C.S. All authors have read and agreed to the published version of the manuscript.

Funding

This research received no external funding.

Institutional Review Board Statement

Not applicable.

Informed Consent Statement

Not applicable.

Data Availability Statement

Data are contained within this article and in the Supplementary Materials.

Acknowledgments

The authors would like to acknowledge the Faculty of Pharmacy, Zagazig University, Egypt for the provision of the computational resources necessary to conduct this work. Molecular dynamics simulations were undertaken using the supercomputing facilities at Cardiff University operated by Advanced Research Computing at Cardiff (ARCCA) on behalf of the Cardiff Supercomputing Facility and the HPC Wales and Supercomputing Wales (SCW) projects. We acknowledge support of the latter, which is part-funded by the European Regional Development Fund (ERDF) via the Welsh Government.

Conflicts of Interest

The authors declare no conflict of interest.

References

  1. Matthews, S.J.; Lancaster, J.W. Urinary Tract Infections in the Elderly Population. Am. J. Geriatr. Pharmacother. 2011, 9, 286–309. [Google Scholar] [CrossRef]
  2. Papazafiropoulou, A.; Daniil, I.; Sotiropoulos, A.; Balampani, E.; Kokolaki, A.; Bousboulas, S.; Konstantopoulou, S.; Skliros, E.; Petropoulou, D.; Pappas, S. Prevalence of Asymptomatic Bacteriuria in Type 2 Diabetic Subjects with and without Microalbuminuria. BMC Res. Notes 2010, 3, 169. [Google Scholar] [CrossRef]
  3. Adams-Sapper, S.; Sergeevna-Selezneva, J.; Tartof, S.; Raphael, E.; An Diep, B.; Perdreau-Remington, F.; Riley, L.W. Globally Dispersed Mobile Drug-Resistance Genes in Gram-Negative Bacterial Isolates from Patients with Bloodstream Infections in a US Urban General Hospital. J. Med. Microbiol 2012, 61, 968–974. [Google Scholar] [CrossRef]
  4. Lubart, E.; Segal, R.; Haimov, E.; Dan, M.; Baumoehl, Y.; Leibovitz, A. Bacteremia in a Multilevel Geriatric Hospital. J. Am. Med. Dir. Assoc. 2011, 12, 204–207. [Google Scholar] [CrossRef]
  5. O’Hara, C.M.; Brenner, F.W.; Miller, J.M. Classification, Identification, and Clinical Significance of Proteus, Providencia, and Morganella. Clin. Microbiol. Rev. 2000, 13, 534–546. [Google Scholar] [CrossRef]
  6. Jacobsen, S.M.; Stickler, D.J.; Mobley, H.L.T.; Shirtliff, M.E. Complicated Catheter-Associated Urinary Tract Infections Due to Escherichia coli and Proteus mirabilis. Clin. Microbiol. Rev. 2008, 21, 26–59. [Google Scholar] [CrossRef]
  7. Karlowsky, J.A.; Lagacé-Wiens, P.R.S.; Simner, P.J.; DeCorby, M.R.; Adam, H.J.; Walkty, A.; Hoban, D.J.; Zhanel, G.G. Antimicrobial Resistance in Urinary Tract Pathogens in Canada from 2007 to 2009: CANWARD Surveillance Study. Antimicrob. Agents Chemother. 2011, 55, 3169–3175. [Google Scholar] [CrossRef]
  8. Gupta, K.; Hooton, T.M.; Naber, K.G.; Wullt, B.; Colgan, R.; Miller, L.G.; Moran, G.J.; Nicolle, L.E.; Raz, R.; Schaeffer, A.J.; et al. International Clinical Practice Guidelines for the Treatment of Acute Uncomplicated Cystitis and Pyelonephritis in Women: A 2010 Update by the Infectious Diseases Society of America and the European Society for Microbiology and Infectious Diseases. Clin. Infect. Dis. 2011, 52, e103–e120. [Google Scholar] [CrossRef]
  9. Ma, K.L.; Wang, C.X. Analysis of the Spectrum and Antibiotic Resistance of Uropathogens in Vitro: Results Based on a Retrospective Study from a Tertiary Hospital. Am. J. Infect. Control. 2013, 41, 601–606. [Google Scholar] [CrossRef]
  10. Schito, G.C.; Naber, K.G.; Botto, H.; Palou, J.; Mazzei, T.; Gualco, L.; Marchese, A. The ARESC Study: An International Survey on the Antimicrobial Resistance of Pathogens Involved in Uncomplicated Urinary Tract Infections. Int. J. Antimicrob. Agents 2009, 34, 407–413. [Google Scholar] [CrossRef]
  11. Adamus-Bialek, W.; Zajac, E.; Parniewski, P.; Kaca, W. Comparison of Antibiotic Resistance Patterns in Collections of Escherichia coli and Proteus mirabilis Uropathogenic Strains. Mol. Biol. Rep. 2013, 40, 3429–3435. [Google Scholar] [CrossRef]
  12. McCoy, A.J.; Liu, H.; Falla, T.J.; Gunn, J.S. Identification of Proteus mirabilis Mutants with Increased Sensitivity to Antimicrobial Peptides. Antimicrob. Agents Chemother. 2001, 45, 2030–2037. [Google Scholar] [CrossRef] [PubMed]
  13. Belas, R.; Manos, J.; Suvanasuthi, R. Proteus mirabilis ZapA Metalloprotease Degrades a Broad Spectrum of Substrates, Including Antimicrobial Peptides. Infect. Immun. 2004, 72, 5159–5167. [Google Scholar] [CrossRef] [PubMed]
  14. Eriani, G.; Delarue, M.; Poch, O.; Gangloff, J.; Moras, D. Partition of TRNA Synthetases into Two Classes Based on Mutually Exclusive Sets of Sequence Motifs. Nature 1990, 347, 203–206. [Google Scholar] [CrossRef]
  15. Cassels, R.; Oliva, B.; Knowles, D. Occurrence of the Regulatory Nucleotides PpGpp and PppGpp Following Induction of the Stringent Response in Staphylococci. J. Bacteriol. 1995, 177, 5161–5165. [Google Scholar] [CrossRef] [PubMed]
  16. Cusack, S.; Härtlein, M.; Leberman, R. Sequence, Structural and Evolutionary Relationships between Class 2 Aminoacyl-TRNA Synthetases. Nucleic Acids Res. 1991, 19, 3489–3498. [Google Scholar] [CrossRef]
  17. Deniziak, M.A.; Barciszewski, J. Methionyl-TRNA Synthetase. Acta Biochim. Pol. 2001, 48, 337–350. [Google Scholar] [CrossRef]
  18. Sugiura, I.; Nureki, O.; Ugaji-Yoshikawa, Y.; Kuwabara, S.; Shimada, A.; Tateno, M.; Lorber, B.; Giegé, R.; Moras, D.; Yokoyama, S.; et al. The 2.0 Å Crystal Structure of Thermus Thermophilus Methionyl-tRNA Synthetase Reveals Two RNA-Binding Modules. Structure 2000, 8, 197–208. [Google Scholar] [CrossRef]
  19. Meng, X.-Y.; Zhang, H.-X.; Mezei, M.; Cui, M. Molecular Docking: A Powerful Approach for Structure-Based Drug Discovery. Curr. Comput. Aided-Drug Des. 2012, 7, 146–157. [Google Scholar] [CrossRef]
  20. Berman, H.M.; Westbrook, J.; Feng, Z.; Gilliland, G.; Bhat, T.N.; Weissig, H.; Shindyalov, I.N.; Bourne, P.E. The Protein Data Bank. Nucleic Acids Res. 2000, 28, 235–242. [Google Scholar] [CrossRef]
  21. Seidel, T.; Ibis, G.; Bendix, F.; Wolber, G. Strategies for 3D Pharmacophore-Based Virtual Screening. Drug Discov. Today Technol. 2010, 7, e221–e228. [Google Scholar] [CrossRef]
  22. Altschul, S. Gapped BLAST and PSI-BLAST: A New Generation of Protein Database Search Programs. Nucleic Acids Res. 1997, 25, 3389–3402. [Google Scholar] [CrossRef] [PubMed]
  23. Gasteiger, E. ExPASy: The Proteomics Server for in-Depth Protein Knowledge and Analysis. Nucleic Acids Res. 2003, 31, 3784–3788. [Google Scholar] [CrossRef] [PubMed]
  24. Serre, L.; Verdon, G.; Choinowski, T.; Hervouet, N.; Risler, J.L.; Zelwer, C. How Methionyl-tRNA Synthetase Creates Its Amino Acid Recognition Pocket upon L-Methionine Binding. J. Mol. Biol. 2001, 306, 863–876. [Google Scholar] [CrossRef] [PubMed]
  25. Li, W.; Cowley, A.; Uludag, M.; Gur, T.; McWilliam, H.; Squizzato, S.; Park, Y.M.; Buso, N.; Lopez, R. The EMBL-EBI Bioinformatics Web and Programmatic Tools Framework. Nucleic Acids Res. 2015, 43, W580–W584. [Google Scholar] [CrossRef] [PubMed]
  26. Sievers, F.; Wilm, A.; Dineen, D.; Gibson, T.J.; Karplus, K.; Li, W.; Lopez, R.; McWilliam, H.; Remmert, M.; Söding, J.; et al. Fast, Scalable Generation of High-quality Protein Multiple Sequence Alignments Using Clustal Omega. Mol. Syst. Biol. 2011, 7, 539. [Google Scholar] [CrossRef]
  27. Jones, D.T. Protein Secondary Structure Prediction Based on Position-Specific Scoring Matrices. J. Mol. Biol. 1999, 292, 195–202. [Google Scholar] [CrossRef]
  28. Molecular Operating Environment (MOE 2019.0102); Chemical Computing Group Inc.: Montreal, QC, Canada, 2019; Available online: http://www.Chemcomp.Com (accessed on 2 January 2019).
  29. Desmond Schrödinger Release 2020-1. Available online: https://www.schrodinger.com/products/desmond (accessed on 1 March 2023).
  30. Bowers, K.J.; Sacerdoti, F.D.; Salmon, J.K.; Shan, Y.; Shaw, D.E.; Chow, E.; Xu, H.; Dror, R.O.; Eastwood, M.P.; Gregersen, B.A.; et al. Molecular Dynamics—Scalable Algorithms for Molecular Dynamics Simulations on Commodity Clusters. In Proceedings of the 2006 ACM/IEEE Conference on Supercomputing-SC ’06, Tampa, FL, USA, 11–17 November 2006; ACM Press: New York, NY, USA, 2006; p. 84. [Google Scholar]
  31. Williams, C.J.; Headd, J.J.; Moriarty, N.W.; Prisant, M.G.; Videau, L.L.; Deis, L.N.; Verma, V.; Keedy, D.A.; Hintze, B.J.; Chen, V.B.; et al. MolProbity: More and Better Reference Data for Improved All-Atom Structure Validation. Protein Sci. 2018, 27, 293–315. [Google Scholar] [CrossRef]
  32. Crepin, T.; Schmitt, E.; Mechulam, Y.; Sampson, P.B.; Vaughan, M.D.; Honek, J.F.; Blanquet, S. Use of Analogues of Methionine and Methionyl Adenylate to Sample Conformational Changes during Catalysis in Escherichia coli Methionyl-tRNA Synthetase. J. Mol. Biol. 2003, 332, 59–72. [Google Scholar] [CrossRef]
  33. Wiederstein, M.; Sippl, M.J. ProSA-Web: Interactive Web Service for the Recognition of Errors in Three-Dimensional Structures of Proteins. Nucleic Acids Res. 2007, 35, W407–W410. [Google Scholar] [CrossRef]
  34. Tian, W.; Chen, C.; Lei, X.; Zhao, J.; Liang, J. CASTp 3.0: Computed Atlas of Surface Topography of Proteins. Nucleic Acids Res. 2018, 46, W363–W367. [Google Scholar] [CrossRef] [PubMed]
  35. Arnez, J.G.; Moras, D. Structural and Functional Considerations of the Aminoacylation Reaction. Trends Biochem. Sci. 1997, 22, 211–216. [Google Scholar] [CrossRef] [PubMed]
  36. Ghosh, G.; Pelka, H.; Schulman, L.H. Identification of the TRNA Anticodon Recognition Site of Escherichia coli Methionyl-tRNA Synthetase. Biochemistry 1990, 29, 2220–2225. [Google Scholar] [CrossRef] [PubMed]
  37. Nakanishi, K.; Ogiso, Y.; Nakama, T.; Fukai, S.; Nureki, O. Structural Basis for Anticodon Recognition by Methionyl-TRNA Synthetase. Nat. Struct. Mol. Biol. 2005, 12, 931–932. [Google Scholar] [CrossRef] [PubMed]
  38. Zuker, M.; Stiegler, P. Optimal Computer Folding of Large RNA Sequences Using Thermodynamics and Auxiliary Information. Nucleic Acids Res. 1981, 9, 133–148. [Google Scholar] [CrossRef]
  39. Page, M.J.; McKenzie, J.E.; Bossuyt, P.M.; Boutron, I.; Hoffmann, T.C.; Mulrow, C.D.; Shamseer, L.; Tetzlaff, J.M.; Akl, E.A.; Brennan, S.E.; et al. The PRISMA 2020 Statement: An Updated Guideline for Reporting Systematic Reviews. Int. J. Surg. 2021, 88, 105906. [Google Scholar] [CrossRef]
  40. Zhang, Z.; Barros-Álvarez, X.; Gillespie, J.R.; Ranade, R.M.; Huang, W.; Shibata, S.; Molasky, N.M.R.; Faghih, O.; Mushtaq, A.; Choy, R.K.M.; et al. Structure-Guided Discovery of Selective Methionyl-tRNA Synthetase Inhibitors with Potent Activity against: Trypanosoma brucei. RSC Med. Chem. 2020, 11, 885–895. [Google Scholar] [CrossRef]
  41. Michaels, S.A.; Shih, H.-W.; Zhang, B.; Navaluna, E.D.; Zhang, Z.; Ranade, R.M.; Gillespie, J.R.; Merritt, E.A.; Fan, E.; Buckner, F.S.; et al. Methionyl-tRNA Synthetase Inhibitor Has Potent In Vivo Activity in a Novel Giardia lamblia Luciferase Murine Infection Model. J. Antimicrob. Chemother. 2020, 75, 1218–1227. [Google Scholar] [CrossRef]
  42. Faghih, O.; Zhang, Z.; Ranade, R.M.; Gillespie, J.R.; Creason, S.A.; Huang, W.; Shibata, S.; Barros-Álvarez, X.; Verlinde, C.L.M.J.; Hol, W.G.J.; et al. Development of Methionyl-tRNA Synthetase Inhibitors as Antibiotics for Gram-Positive Bacterial Infections. Antimicrob. Agents Chemother. 2017, 61, 10–1128. [Google Scholar] [CrossRef]
  43. Buckner, F.S.; Ranade, R.M.; Gillespie, J.R.; Shibata, S.; Hulverson, M.A.; Zhang, Z.; Huang, W.; Choi, R.; Verlinde, C.L.M.J.; Hol, W.G.J.; et al. Optimization of Methionyl tRNA-Synthetase Inhibitors for Treatment of Cryptosporidium Infection. Antimicrob. Agents Chemother. 2019, 63, 10–1128. [Google Scholar] [CrossRef]
  44. Nayak, S.U.; Griffiss, J.M.; Blumer, J.; O’Riordan, M.A.; Gray, W.; McKenzie, R.; Jurao, R.A.; An, A.T.; Le, M.; Bell, S.J.; et al. Safety, Tolerability, Systemic Exposure, and Metabolism of CRS3123, a Methionyl-tRNA Synthetase Inhibitor Developed for Treatment of Clostridium difficile, in a Phase 1 Study. Antimicrob. Agents Chemother. 2017, 61, 10–1128. [Google Scholar] [CrossRef] [PubMed]
  45. Koh, C.Y.; Kim, J.E.; Wetzel, A.B.; de van der Schueren, W.J.; Shibata, S.; Ranade, R.M.; Liu, J.; Zhang, Z.; Gillespie, J.R.; Buckner, F.S.; et al. Structures of Trypanosoma brucei Methionyl-tRNA Synthetase with Urea-Based Inhibitors Provide Guidance for Drug Design against Sleeping Sickness. PLoS Negl. Trop. Dis. 2014, 8, e2775. [Google Scholar] [CrossRef] [PubMed]
  46. Shibata, S.; Gillespie, J.R.; Ranade, R.M.; Koh, C.Y.; Kim, J.E.; Laydbak, J.U.; Zucker, F.H.; Hol, W.G.J.; Verlinde, C.L.M.J.; Buckner, F.S.; et al. Urea-Based Inhibitors of Trypanosoma brucei Methionyl-tRNA Synthetase: Selectivity and in Vivo Characterization. J. Med. Chem. 2012, 55, 6342–6351. [Google Scholar] [CrossRef]
  47. Ranade, R.M.; Gillespie, J.R.; Shibata, S.; Verlinde, C.L.M.J.; Fan, E.; Hol, W.G.J.; Buckner, F.S. Induced Resistance to Methionyl-tRNA Synthetase Inhibitors in Trypanosoma bruceibrucei is Due to Overexpression of the Target. Antimicrob. Agents Chemother. 2013, 57, 3021–3028. [Google Scholar] [CrossRef] [PubMed]
  48. Shibata, S.; Gillespie, J.R.; Kelley, A.M.; Napuli, A.J.; Zhang, Z.; Kovzun, K.V.; Pefley, R.M.; Lam, J.; Zucker, F.H.; van Voorhis, W.C.; et al. Selective Inhibitors of Methionyl-tRNA Synthetase Have Potent Activity against Trypanosoma brucei Infection in Mice. Antimicrob. Agents Chemother. 2011, 55, 1982–1989. [Google Scholar] [CrossRef] [PubMed]
  49. Liu, C.; He, G.; Jiang, Q.L.; Han, B.; Peng, C. Novel Hybrid Virtual Screening Protocol Based on Molecular Docking and Structure-Based Pharmacophore for Discovery of Methionyl-tRNA Synthetase Inhibitors as Antibacterial Agents. Int. J. Mol. Sci. 2013, 14, 14225–14239. [Google Scholar] [CrossRef] [PubMed]
  50. Koh, C.Y.; Kim, J.E.; Shibata, S.; Ranade, R.M.; Yu, M.; Liu, J.; Gillespie, J.R.; Buckner, F.S.; Verlinde, C.L.M.J.; Fan, E.; et al. Distinct States of Methionyl-tRNA Synthetase Indicate Inhibitor Binding by Conformational Selection. Structure 2012, 20, 1681–1691. [Google Scholar] [CrossRef]
  51. Farhanullah; Kang, T.; Yoon, E.-J.; Choi, E.-C.; Kim, S.; Lee, J. 2-[2-Substituted-3-(3,4-Dichlorobenzylamino)Propylamino]-1H-Quinolin-4-Ones as Staphylococcus aureus Methionyl-tRNA Synthetase Inhibitors. Eur. J. Med. Chem. 2009, 44, 239–250. [Google Scholar] [CrossRef]
  52. Finn, J.; Stidham, M.; Hilgers, M.; Kedar, G.C. Identification of Novel Inhibitors of Methionyl-tRNA Synthetase (MetRS) by Virtual Screening. Bioorg. Med. Chem. Lett. 2008, 18, 3932–3937. [Google Scholar] [CrossRef]
  53. Farhanullah; Kim, S.Y.; Yoon, E.-J.; Choi, E.-C.; Kim, S.; Kang, T.; Samrin, F.; Puri, S.; Lee, J. Design and Synthesis of Quinolinones as Methionyl-tRNA Synthetase Inhibitors. Bioorg. Med. Chem. 2006, 14, 7154–7159. [Google Scholar] [CrossRef]
  54. Vaughan, M.; Sampson, P.; Daub, E.; Honek, J. Investigation of Bioisosteric Effects on the Interaction of Substrates/ Inhibitors with the Methionyl-tRNA Synthetase from Escherichia coli. Med. Chem. 2005, 1, 227–237. [Google Scholar] [CrossRef] [PubMed]
  55. Kim, S.E.; Kim, S.Y.; Kim, S.; Kang, T.; Lee, J. Deoxyribosyl Analogues of Methionyl and Isoleucyl Sulfamate Adenylates as Inhibitors of Methionyl-tRNA and Isoleucyl-tRNA Synthetases. Bioorg Med. Chem. Lett. 2005, 15, 3389–3393. [Google Scholar] [CrossRef]
  56. Lee, J.; Kim, S.E.; Lee, J.Y.; Kim, S.Y.; Kang, S.U.; Seo, S.H.; Chun, M.W.; Kang, T.; Choi, S.Y.; Kim, H.O. N-Alkoxysulfamide, N-Hydroxysulfamide, and Sulfamate Analogues of Methionyl and Isoleucyl Adenylates as Inhibitors of Methionyl-tRNA and Isoleucyl-tRNA Synthetases. Bioorg. Med. Chem. Lett. 2003, 13, 1087–1092. [Google Scholar] [CrossRef] [PubMed]
  57. Ochsner, U.A.; Young, C.L.; Stone, K.C.; Dean, F.B.; Janjic, N.; Critchley, I.A. Mode of Action and Biochemical Characterization of REP8839, a Novel Inhibitor of Methionyl-tRNA Synthetase. Antimicrob. Agents Chemother. 2005, 49, 4253–4262. [Google Scholar] [CrossRef] [PubMed]
  58. Tandon, M.; Coffen, D.L.; Gallant, P.; Keith, D.; Ashwell, M.A. Potent and Selective Inhibitors of Bacterial Methionyl tRNA Synthetase Derived from an Oxazolone–Dipeptide Scaffold. Bioorg. Med. Chem. Lett. 2004, 14, 1909–1911. [Google Scholar] [CrossRef] [PubMed]
  59. Jarvest, R.L.; Armstrong, S.A.; Berge, J.M.; Brown, P.; Elder, J.S.; Brown, M.J.; Copley, R.C.B.; Forrest, A.K.; Hamprecht, D.W.; O’Hanlon, P.J.; et al. Definition of the Heterocyclic Pharmacophore of Bacterial Methionyl tRNA Synthetase Inhibitors: Potent Antibacterially Active Non-Quinolone Analogues. Bioorg. Med. Chem. Lett. 2004, 14, 3937–3941. [Google Scholar] [CrossRef]
  60. Kim, S.Y.; Lee, J. 3-D-QSAR Study and Molecular Docking of Methionyl-tRNA Synthetase Inhibitors. Bioorg. Med. Chem. 2003, 11, 5325–5331. [Google Scholar] [CrossRef]
  61. Jarvest, R.L.; Berge, J.M.; Brown, M.J.; Brown, P.; Elder, J.S.; Forrest, A.K.; Houge-Frydrych, C.S.V.; O’Hanlon, P.J.; McNair, D.J.; Rittenhouse, S.; et al. Optimisation of Aryl Substitution Leading to Potent Methionyl tRNA Synthetase Inhibitors with Excellent Gram-Positive Antibacterial Activity. Bioorg. Med. Chem. Lett. 2003, 13, 665–668. [Google Scholar] [CrossRef]
  62. Jarvest, R.L.; Berge, J.M.; Brown, P.; Houge-Frydrych, C.S.V.; O’Hanlon, P.J.; McNair, D.J.; Pope, A.J.; Rittenhouse, S. Conformational Restriction of Methionyl tRNA Synthetase Inhibitors Leading to Analogues with Potent Inhibition and Excellent Gram-Positive Antibacterial Activity. Bioorg. Med. Chem. Lett. 2003, 13, 1265–1268. [Google Scholar] [CrossRef]
  63. Lee, J.; Kang, S.U.; Kim, S.Y.; Kim, S.E.; Jo, Y.J.; Kim, S. Vanilloid and Isovanilloid Analogues as Inhibitors of Methionyl-tRNA and Isoleucyl-tRNA Synthetases. Bioorg. Med. Chem. Lett. 2001, 11, 965–968. [Google Scholar] [CrossRef]
  64. Lee, J.; Kang, S.U.; Kim, S.Y.; Kim, S.E.; Kang, M.K.; Jo, Y.J.; Kim, S. Ester and Hydroxamate Analogues of Methionyl and Isoleucyl Adenylates as Inhibitors of Methionyl-tRNA and Isoleucyl-tRNA Synthetases. Bioorg. Med. Chem. Lett. 2001, 11, 961–964. [Google Scholar] [CrossRef] [PubMed]
  65. Lee, J.; Kang, S.U.; Kang, M.K.; Chun, M.W.; Jo, Y.J.; Kkwak, J.H.; Kim, S. Methionyl Adenylate Analogues as Inhibitors of Methionyl-tRNA Synthetase. Bioorg. Med. Chem. Lett. 1999, 9, 1365–1370. [Google Scholar] [CrossRef] [PubMed]
  66. Huang, W.; Zhang, Z.; Ranade, R.M.; Gillespie, J.R.; Barros-Álvarez, X.; Creason, S.A.; Shibata, S.; Verlinde, C.L.M.J.; Hol, W.G.J.; Buckner, F.S.; et al. Optimization of a Binding Fragment Targeting the “Enlarged Methionine Pocket” Leads to Potent Trypanosoma brucei Methionyl-tRNA Synthetase Inhibitors. Bioorg. Med. Chem. Lett. 2017, 27, 2702–2707. [Google Scholar] [CrossRef]
  67. Eissa, A.G.; Blaxland, J.A.; Williams, R.O.; Metwally, K.A.; El-Adl, S.M.; Lashine, E.-S.M.E.-S.M.; Baillie, L.W.J.; Simons, C. Targeting Methionyl tRNA Synthetase: Design, Synthesis and Antibacterial Activity against Clostridium difficile of Novel 3-Biaryl-N-Benzylpropan-1-Amine Derivatives. J. Enzym. Inhib. Med. Chem. 2016, 31, 1694–1697. [Google Scholar] [CrossRef]
  68. Huang, W.; Zhang, Z.; Barros-Álvarez, X.; Koh, C.Y.; Ranade, R.M.; Gillespie, J.R.; Creason, S.A.; Shibata, S.; Verlinde, C.L.M.J.; Hol, W.G.J.; et al. Structure-Guided Design of Novel Trypanosoma brucei Methionyl-tRNA Synthetase Inhibitors. Eur. J. Med. Chem. 2016, 124, 1081–1092. [Google Scholar] [CrossRef] [PubMed]
  69. Zhang, Z.; Koh, C.Y.; Ranade, R.M.; Shibata, S.; Gillespie, J.R.; Hulverson, M.A.; Huang, W.; Nguyen, J.; Pendem, N.; Gelb, M.H.; et al. 5-Fluoroimidazo [4,5-b]Pyridine Is a Privileged Fragment That Conveys Bioavailability to Potent Trypanosomal Methionyl-tRNA Synthetase Inhibitors. ACS Infect. Dis. 2016, 2, 399–404. [Google Scholar] [CrossRef]
  70. Ranade, R.M.; Zhang, Z.; Gillespie, J.R.; Shibata, S.; Verlinde, C.L.M.J.; Hol, W.G.J.; Fan, E.; Buckner, F.S. Inhibitors of Methionyl-tRNA Synthetase Have Potent Activity against Giardia Intestinalis Trophozoites. Antimicrob. Agents Chemother. 2015, 59, 7128–7131. [Google Scholar] [CrossRef]
  71. Pearson, M.M.; Sebaihia, M.; Churcher, C.; Quail, M.A.; Seshasayee, A.S.; Luscombe, N.M.; Abdellah, Z.; Arrosmith, C.; Atkin, B.; Chillingworth, T.; et al. Complete Genome Sequence of Uropathogenic Proteus mirabilis, a Master of Both Adherence and Motility. J. Bacteriol. 2008, 190, 4027–4037. [Google Scholar] [CrossRef]
  72. Schaffer, A.A. Improving the Accuracy of PSI-BLAST Protein Database Searches with Composition-Based Statistics and Other Refinements. Nucleic. Acids Res. 2001, 29, 2994–3005. [Google Scholar] [CrossRef]
  73. RCSB Protein Data Bank (PDB). Available online: http://www.rcsb.org (accessed on 1 March 2023).
  74. Weiner, S.J.; Kollman, P.A.; Nguyen, D.T.; Case, D.A. An All Atom Force Field for Simulations of Proteins and Nucleic Acids. J. Comput. Chem. 1986, 7, 230–252. [Google Scholar] [CrossRef]
  75. Kishk, S.M.; Kishk, R.M.; Yassen, A.S.A.; Nafie, M.S.; Nemr, N.A.; ElMasry, G.; Al-Rejaie, S.; Simons, C. Molecular Insights into Human Transmembrane Protease Serine-2 (TMPS2) Inhibitors against SARS-CoV2: Homology Modelling, Molecular Dynamics, and Docking Studies. Molecules 2020, 25, 5007. [Google Scholar] [CrossRef] [PubMed]
  76. Noureldin, N.A.; Richards, J.; Kothayer, H.; Baraka, M.M.; Eladl, S.M.; Wootton, M.; Simons, C. Phenylalanyl tRNA Synthetase (PheRS) Substrate Mimics: Design, Synthesis, Molecular Dynamics and Antimicrobial Evaluation. RSC Adv. 2022, 12, 2511–2524. [Google Scholar] [CrossRef] [PubMed]
Figure 1. Currently used antibiotics for the treatment of P. mirabilis, all of which have some reported resistance.
Pharmaceuticals 16 01263 g001
Figure 2. The phylogenetic tree of Proteus mirabilus MetRS (B4ESY6) in relation to other MetRS enzymes from: Saccharomyces cerevisiae (yeast) (A6ZUS2); human (P56192); mouse (Q68FL6); zebra mbuna (A0A3P9BIE1); African clawed frog (Q6PF21); Mycobacterium tuberculosis (P9WFU5); Thermus thermophilus (P23395); Pseudomonas aeruginosa (Q9HYC7); Enterococcus faecalis (Q837B3); Streptococcus pyogenes (Q9A178); Escherichia coli (P00959); Acinetobacter baumannii (A0A0D5YKJ7); Pyrococcus abyssi (Q9V011), Staphylococcus aureus (P67578).
Pharmaceuticals 16 01263 g002
Figure 3. Sequence alignment of MetRS enzymes of Aquifex aeolicus, Pyrococcus abyssi, Acinetobacter baumannii, Proteus mirabilus and Escherichia coli using Clustal O in which “*” means that the residues are identical, “:” means that conserved substitutions have been observed, “.” means that semi-conserved substitutions are observed. The residues are colored according to their chemical properties where red, small hydrophobic (AVFPMILWY); blue, acidic (DE); purple, basic (RHK); green, hydroxyl + amine + basic (STYHCNGQ).
Pharmaceuticals 16 01263 g003aPharmaceuticals 16 01263 g003b
Figure 4. (A) RMSD and (B) RMSF plots for P. mirabilis MetRS over 200 ns molecular dynamics simulation.
Pharmaceuticals 16 01263 g004
Figure 5. Superimposition of E. coli MetRS (1F4L) in yellow color with P. mirabilis MetRS model in blue color.
Pharmaceuticals 16 01263 g005
Figure 6. Ramachandran plots of (A) P. mirabilis MetRS homology model and (B) E. coli MetRS template (1F4L).
Pharmaceuticals 16 01263 g006
Figure 7. ProSA output showing: (A) overall model quality (z-score) of the P. mirabilis MetRS homology model and template E. coli MetRS (pdb 1F4L) in a plot that contains the z-scores of all experimentally determined protein chains in current PDB from different sources (X-ray, NMR) as distinguished by different colors and (B) local model quality plot.
Pharmaceuticals 16 01263 g007
Figure 8. Cartoon representation of the binding site topology of the homology model. Putative pocket; red color, was calculated via the CASTP server of proteins.
Pharmaceuticals 16 01263 g008
Figure 9. (A) 3D and (B) 2D images of P. mirabilis MetRS—methionyl adenylate (green) protein–ligand complex after MD simulation illustrating binding site and binding interactions.
Pharmaceuticals 16 01263 g009
Figure 10. (A) Positioning of MSP (cyan) relative to methionyl adenylate (green) in P. mirabilis MetRS. (B) Two dimensional image of P. mirabilis MetRS—MSP protein–ligand complex after MD simulation illustrating binding interactions.
Pharmaceuticals 16 01263 g010
Figure 11. Positioning of methionine (orange), MPH (light blue), MPJ (light purple), 2FM (turquoise), and MF3 (brown) within the methionine binding site compared with adenylate methionine (white), which sits in the ATP and methionyl amino acid pockets.
Pharmaceuticals 16 01263 g011
Figure 12. Genomic alignment of tRNAmet for P. mirabilis and E. coli, respectively, where boxed nucleotides are the conserved CAU anticodon and CCA end. “*” indicates identical nucleotide.
Pharmaceuticals 16 01263 g012
Figure 13. Cloverleaf representation of predicted secondary structure of the P. mirabilis tRNAMet.
Pharmaceuticals 16 01263 g013
Figure 14. PRISMA 2020 flow diagram for compound selection process through database searches.
Pharmaceuticals 16 01263 g014
Figure 15. Pharmacophore-based virtual screening: (A) 3D pharmacophore with ten features; (B) the most promising compound fitting with the pharmacophoric features in the active site of the model.
Pharmaceuticals 16 01263 g015aPharmaceuticals 16 01263 g015b
Table 1. The first three hits in the P. mirabilis MetRS BLAST results.
OrganismPDB CodeBLAST a ScoreSequence Identity bSequence Identity %Positive %Chain LengthE-Value
E. coli1F4L964443/55180915510.0
A. baumannii5URB697319/54459775670.0
P. abyss1RQG380243/72733517222 × 10−120
a The score of BLAST for an alignment is calculated by summing the scores for each aligned position and the scores for gaps. b (Number of identical residues)/(length of sequence fragment identified by PSI-BLAST).
Table 2. Key amino acid residues of the main template (1F4L).
PDBHIGH Region MotifKMSKS MotifZinc Binding ResiduesATP Binding
1F4L15–25333–337145, 148, 158 and 161336
Table 3. Ligand structures and protein–ligand (P/L) RMSD at 0 and 200 ns.
LigandStructureP/L RMSD (Å)
0 ns
P/L RMSD (Å)
200 ns
MethioninePharmaceuticals 16 01263 i0012.14/1.503.74/6.80
MPHPharmaceuticals 16 01263 i0021.46/1.184.00/6.67
MPJPharmaceuticals 16 01263 i0032.44/1.972.84/6.49
2FMPharmaceuticals 16 01263 i0041.59/1.792.57/5.29
MF3Pharmaceuticals 16 01263 i0051.36/2.724.08/3.17
MSPPharmaceuticals 16 01263 i0061.15/2.522.65/7.56
Methionyl adenylatePharmaceuticals 16 01263 i0071.92/3.632.59/4.36
Table 4. Amino acids responsible for in the base specific recognition of the tRNAMet anticodon.
A. aeolicusE. coliP. mirabilis
Asn356Asn391Asn390
Arg360Arg395Arg394
Trp430Trp461Trp460
Table 5. The dataset of compounds and their original target organism as reported.
CompoundTarget OrganismRef.
Pharmaceuticals 16 01263 i008Trypanosoma brucei[40]
Pharmaceuticals 16 01263 i009Giardia lamblia[41,42]
Pharmaceuticals 16 01263 i010Cryptosporidium[43]
Pharmaceuticals 16 01263 i011Clostridium difficile[44]
Pharmaceuticals 16 01263 i012Trypanosoma brucei[45,46]
Pharmaceuticals 16 01263 i013Trypanosoma brucei[47,48]
Pharmaceuticals 16 01263 i014MRSA/Staphylococcus aureus[49]
Pharmaceuticals 16 01263 i015Pseudomonas aeruginosa[49]
Pharmaceuticals 16 01263 i016Trypanosoma brucei[50]
Pharmaceuticals 16 01263 i017Staphylococcus aureus[51]
Pharmaceuticals 16 01263 i018Staphylococcus aureus[51]
Pharmaceuticals 16 01263 i019Staphylococcus aureus[52]
Pharmaceuticals 16 01263 i020Staphylococcus aureus[53]
Pharmaceuticals 16 01263 i021Escherichia coli[54,55,56]
Pharmaceuticals 16 01263 i022Staphylococcus aureus[57]
Pharmaceuticals 16 01263 i023Staphylococcus aureus[58]
Pharmaceuticals 16 01263 i024Staphylococcus aureus[59]
Pharmaceuticals 16 01263 i025Staphylococcus aureus[60]
Pharmaceuticals 16 01263 i026Staphylococcus aureus[60]
Pharmaceuticals 16 01263 i027Staphylococcus aureus[61]
Pharmaceuticals 16 01263 i028Staphylococcus aureus[61]
Pharmaceuticals 16 01263 i029Staphylococcus aureus[61]
Pharmaceuticals 16 01263 i030Staphylococcus aureus[62]
Pharmaceuticals 16 01263 i031Escherichia coli[63]
Pharmaceuticals 16 01263 i032Escherichia coli[64]
Pharmaceuticals 16 01263 i033Escherichia coli[65]
Pharmaceuticals 16 01263 i034Trypanosoma brucei[66]
Pharmaceuticals 16 01263 i035Clostridium difficile[67]
Pharmaceuticals 16 01263 i036Trypanosoma brucei[68]
Pharmaceuticals 16 01263 i037Trypanosoma brucei[69]
Pharmaceuticals 16 01263 i038Trypanosoma brucei[70]
Disclaimer/Publisher’s Note: The statements, opinions and data contained in all publications are solely those of the individual author(s) and contributor(s) and not of MDPI and/or the editor(s). MDPI and/or the editor(s) disclaim responsibility for any injury to people or property resulting from any ideas, methods, instructions or products referred to in the content.

